Pay vs Performance Disclosure
Dec. 31, 2025
USD ($)
$ / shares
Dec. 31, 2024
USD ($)
$ / shares
Dec. 31, 2023
USD ($)
$ / shares
Dec. 31, 2022
USD ($)
$ / shares
Dec. 31, 2021
USD ($)
$ / shares
| Value of initial fixed $100 investment based on: | ||||||||||||||||||||||||||
Year1 | Summary Compensation Table Total for PEO2 | Compensation Actually Paid to PEO3 | Average Summary Compensation Table Total for Non-PEO NEOs4, 7 | Average Compensation Actually Paid to Non-PEO NEOs3 | Total Shareholder Return5 | Peer Group Total Shareholder Return5 | Net Income ($ millions) | Company Selected Measure (CSM) –Adjusted Non-GAAP EPS6 | ||||||||||||||||||
| 2025 | $36,698,337 | $75,185,008 | $10,925,377 | $20,352,904 | $670.56 | $154.11 | $20,640 | $27.06 | ||||||||||||||||||
| 2024 | $29,242,926 | $80,583,515 | $6,090,259 | ($929,092) | $478.17 | $123.43 | $10,590 | $16.11 | ||||||||||||||||||
| 2023 | $26,565,732 | $120,865,280 | $7,836,611 | $27,249,897 | $358.72 | $118.45 | $5,240 | $9.14 | ||||||||||||||||||
| 2022 | $21,398,135 | $64,088,705 | $5,769,810 | $13,893,269 | $222.94 | $124.87 | $6,245 | $8.55 | ||||||||||||||||||
| 2021 | $21,509,985 | $75,705,116 | $4,730,690 | $4,563,545 | $166.08 | $116.73 | $5,582 | $8.00 | ||||||||||||||||||
•2025: Mr. Montarce; Dr. Skovronsky; Ms. Hakim; and Mr. Van Naarden
•2024: Mr. Montarce; Dr. Skovronsky; Ms. Hakim; Mr. Van Naarden; Mr. Brooks (interim CFO, July 15-Sept 8); and Ms. Ashkenazi (CFO, departed July 30)
•2023: Ms. Ashkenazi; Dr. Skovronsky; Ms. Hakim; and Mr. Van Naarden
•2022: Ms. Ashkenazi; Dr. Skovronsky; Ms. Hakim; and Mr. Jonsson
•2021: Ms. Ashkenazi (appointed CFO Feb 9); Dr. Skovronsky; Mr. Van Naarden; Mr. Rau; and Mr. Smiley (CFO, resigned Feb 9)
In 2025, the company revised the peer group for calculating TSR results. The peer group is comprised of the same companies from our executive compensation peer group (detailed in the Benchmarking Compensation section) as well as Novo Nordisk. Peer TSR amounts in this column reflect the revised peer group for all fiscal years presented. For comparison, under the prior peer group composition, peer group TSR for 2025 would have been $157.61 (compared to $154.11 for the revised peer group).
| Year | SCT Total Compensation for PEO | SCT Change in Pension Value | Pension Service Cost | SCT Stock Value | Change in Value: Stock Granted in Current Year | Change in Value: Unvested Stock | Final Value: Vested Stock | Compensation Actually Paid to PEO | ||||||||||||||||||
| a | b | c | d | e | f | g | a-b+c-d+e+f+g | |||||||||||||||||||
| 2025 | $36,698,337 | $4,451,636 | $616,007 | $23,325,000 | $10,854,848 | $(20,935,949) | $75,728,401 | $75,185,008 | ||||||||||||||||||
| 2024 | $29,242,926 | $1,746,483 | $523,751 | $19,749,324 | $(32,793,300) | $(16,377,494) | $121,483,439 | $80,583,515 | ||||||||||||||||||
| 2023 | $26,565,732 | $1,439,822 | $491,959 | $18,840,250 | $20,443,264 | $36,659,046 | $56,985,351 | $120,865,280 | ||||||||||||||||||
| 2022 | $21,398,135 | $0 | $623,346 | $16,981,250 | $10,443,998 | $(2,718,134) | $51,322,610 | $64,088,705 | ||||||||||||||||||
| 2021 | $21,509,985 | $2,442,235 | $680,872 | $14,966,000 | $3,627,520 | $17,758,456 | $49,536,518 | $75,705,116 | ||||||||||||||||||
| Year | Average SCT Total Compensation for Non-PEO NEOs | Average SCT Change in Pension Value | Average Pension Service Cost | Average SCT Stock Value | Average Change in Value: Stock Granted in Current Year | Average Change in Value: Unvested Stock | Average Final Value: Vested Stock | Average Compensation Actually Paid to Non-PEO NEOs | ||||||||||||||||||
| a | b | c | d | e | f | g | a-b+c-d+e+f+g | |||||||||||||||||||
| 2025 | $10,925,377 | $430,369 | $182,496 | $6,875,000 | $5,405,638 | $(3,353,746) | $14,498,508 | $20,352,904 | ||||||||||||||||||
| 2024 | $6,090,259 | $215,381 | $159,259 | $3,378,006 | $(6,930,869) | $(7,775,892) | $11,121,538 | $(929,092) | ||||||||||||||||||
| 2023 | $7,836,611 | $455,154 | $159,626 | $4,387,275 | $5,693,252 | $9,514,261 | $8,888,576 | $27,249,897 | ||||||||||||||||||
| 2022 | $5,769,810 | $93,171 | $185,293 | $3,553,000 | $2,494,818 | $1,188,603 | $7,900,916 | $13,893,269 | ||||||||||||||||||
| 2021 | $4,730,690 | $159,911 | $135,445 | $3,115,360 | $1,276,786 | $861,413 | $834,482 | $4,563,545 | ||||||||||||||||||
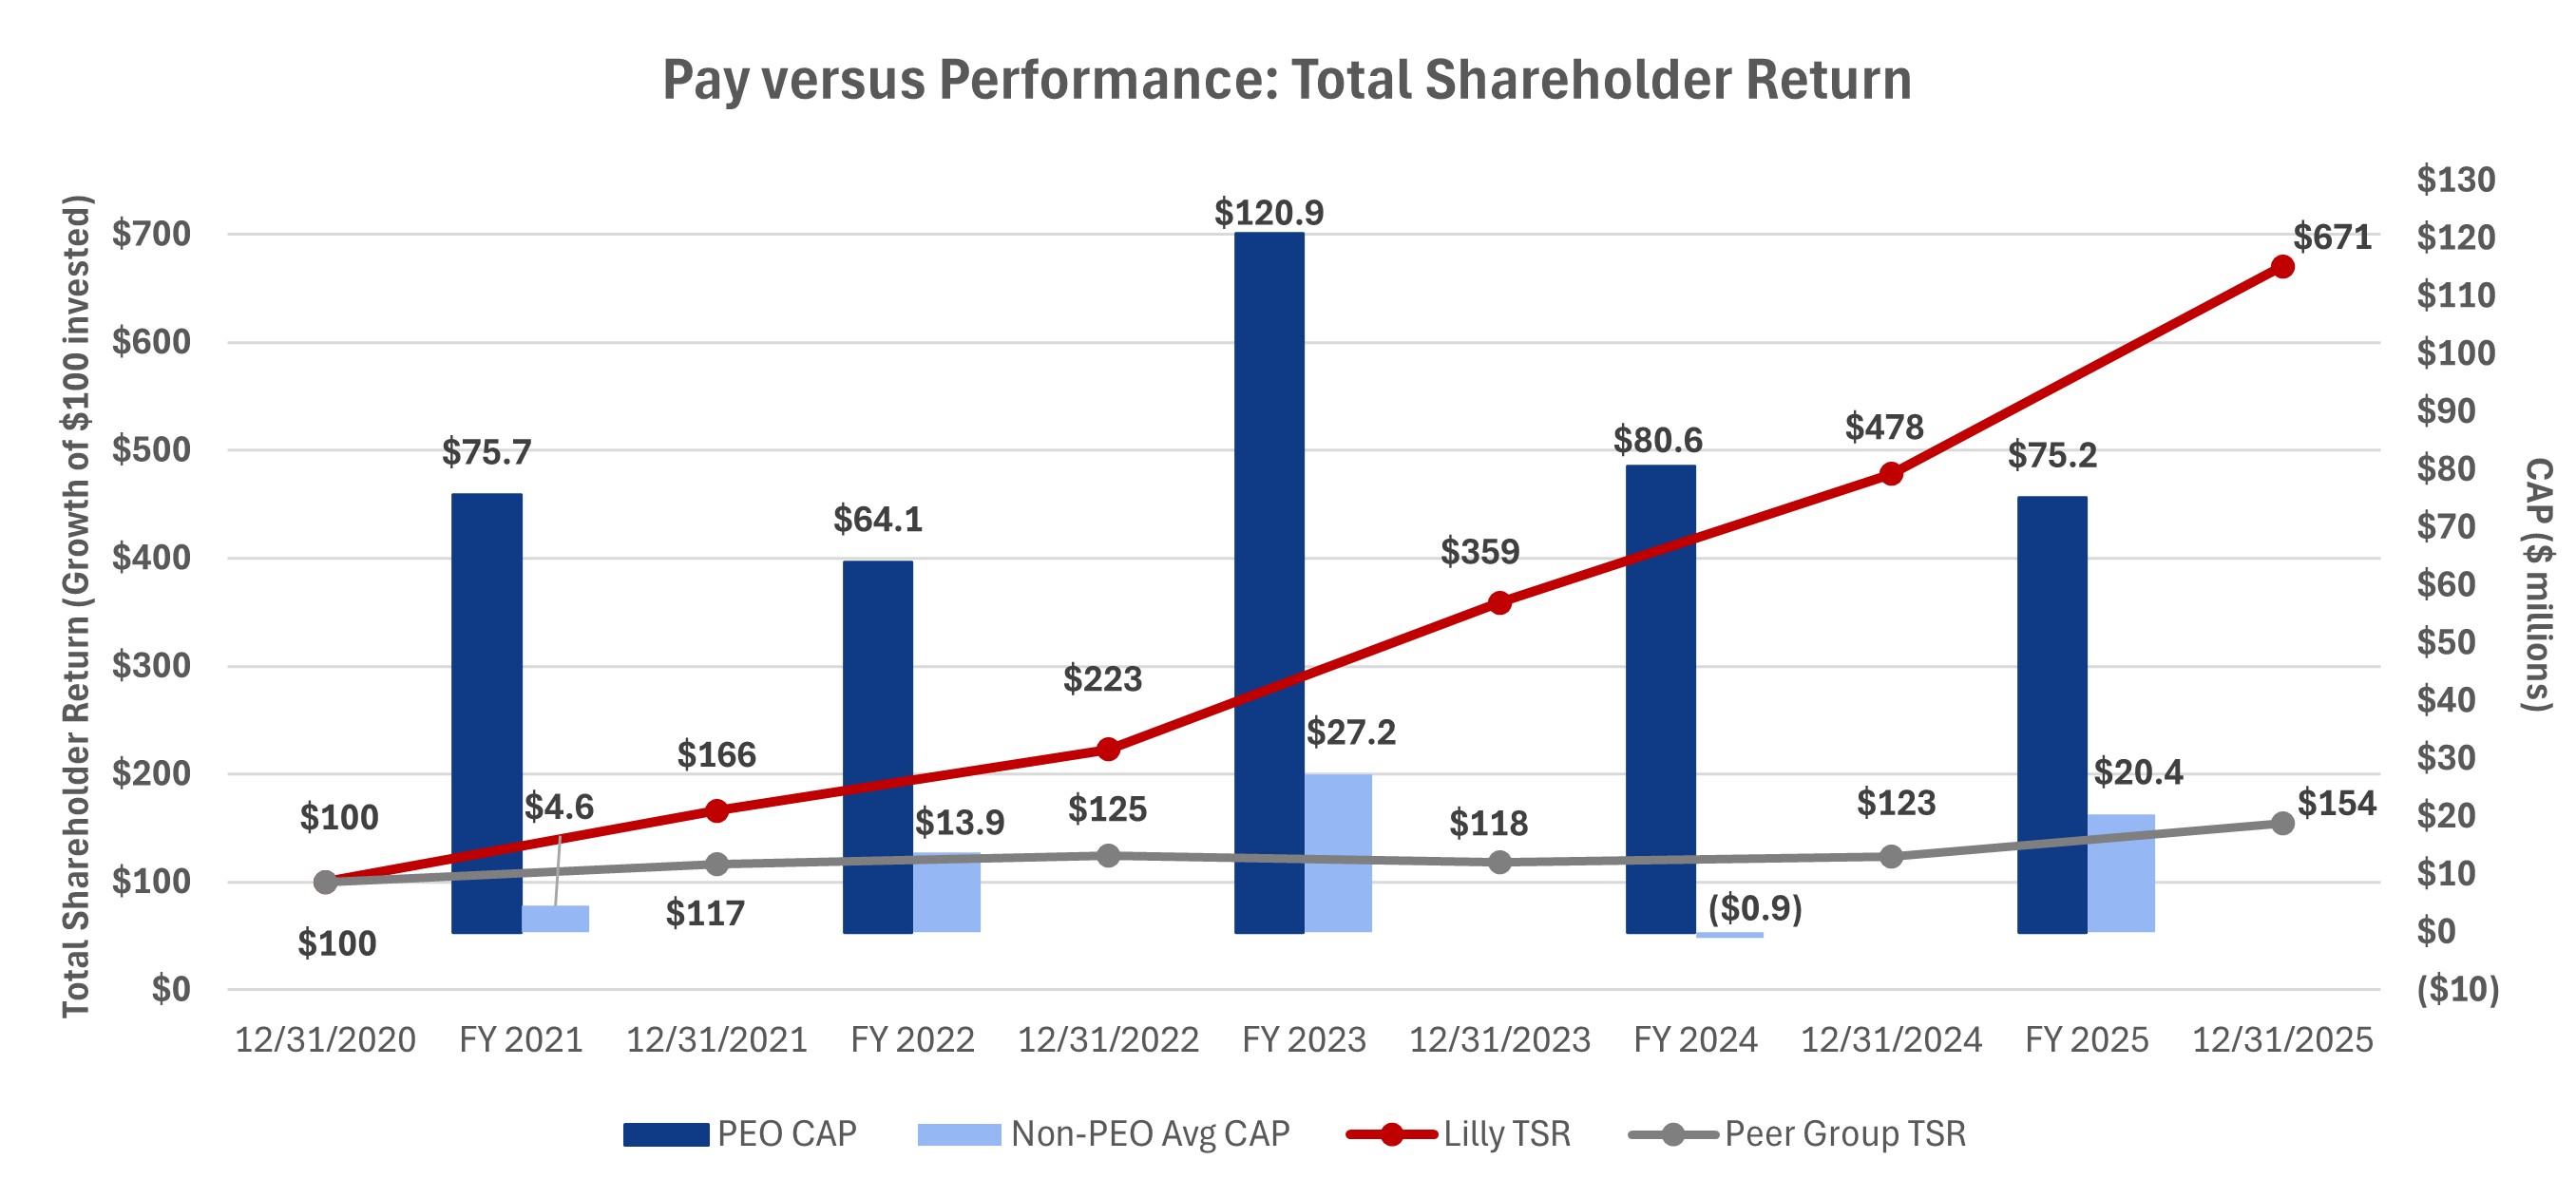
Over the past five years, the company’s total shareholder return (TSR) has exceeded the peer group’s TSR. The chosen peer group is comprised of the same companies from our executive compensation peer group detailed in the Benchmarking Compensation section, as well as Novo Nordisk. Lilly’s relative TSR outperformance was substantially attributable to strong developments in our product pipeline and launches of new products and indications. As reflected in the chart below, this outperformance contributed to the PEO and non-PEOs’ compensation over the five-year period.
Lilly does not utilize GAAP or non-GAAP net income as a metric in any of its incentive programs. Generally, CAP is not heavily correlated with GAAP net income because GAAP net income includes certain items that the Committee believes are not reflective of underlying business performance. By excluding the impact of (i) amortization of intangible assets primarily associated with costs of marketed products acquired or licensed from third parties, (ii) net losses or gains on investments in equity securities, and (iii) other specified items that are not reflective of underlying business performance, the Committee believes non-GAAP net income better represents the company’s operating performance. For comparison purposes, the graph below reflects both GAAP net income and non-GAAP net income against PEO and average non-PEO NEO CAP.
The GAAP and non-GAAP net income results include significantly higher acquired IPR&D charges. While immediately expensed for accounting purposes, the company views investments in acquired IPR&D as important contributions to its product pipeline, which is a key driver of future company performance. For additional information on financial results, see Appendix A.
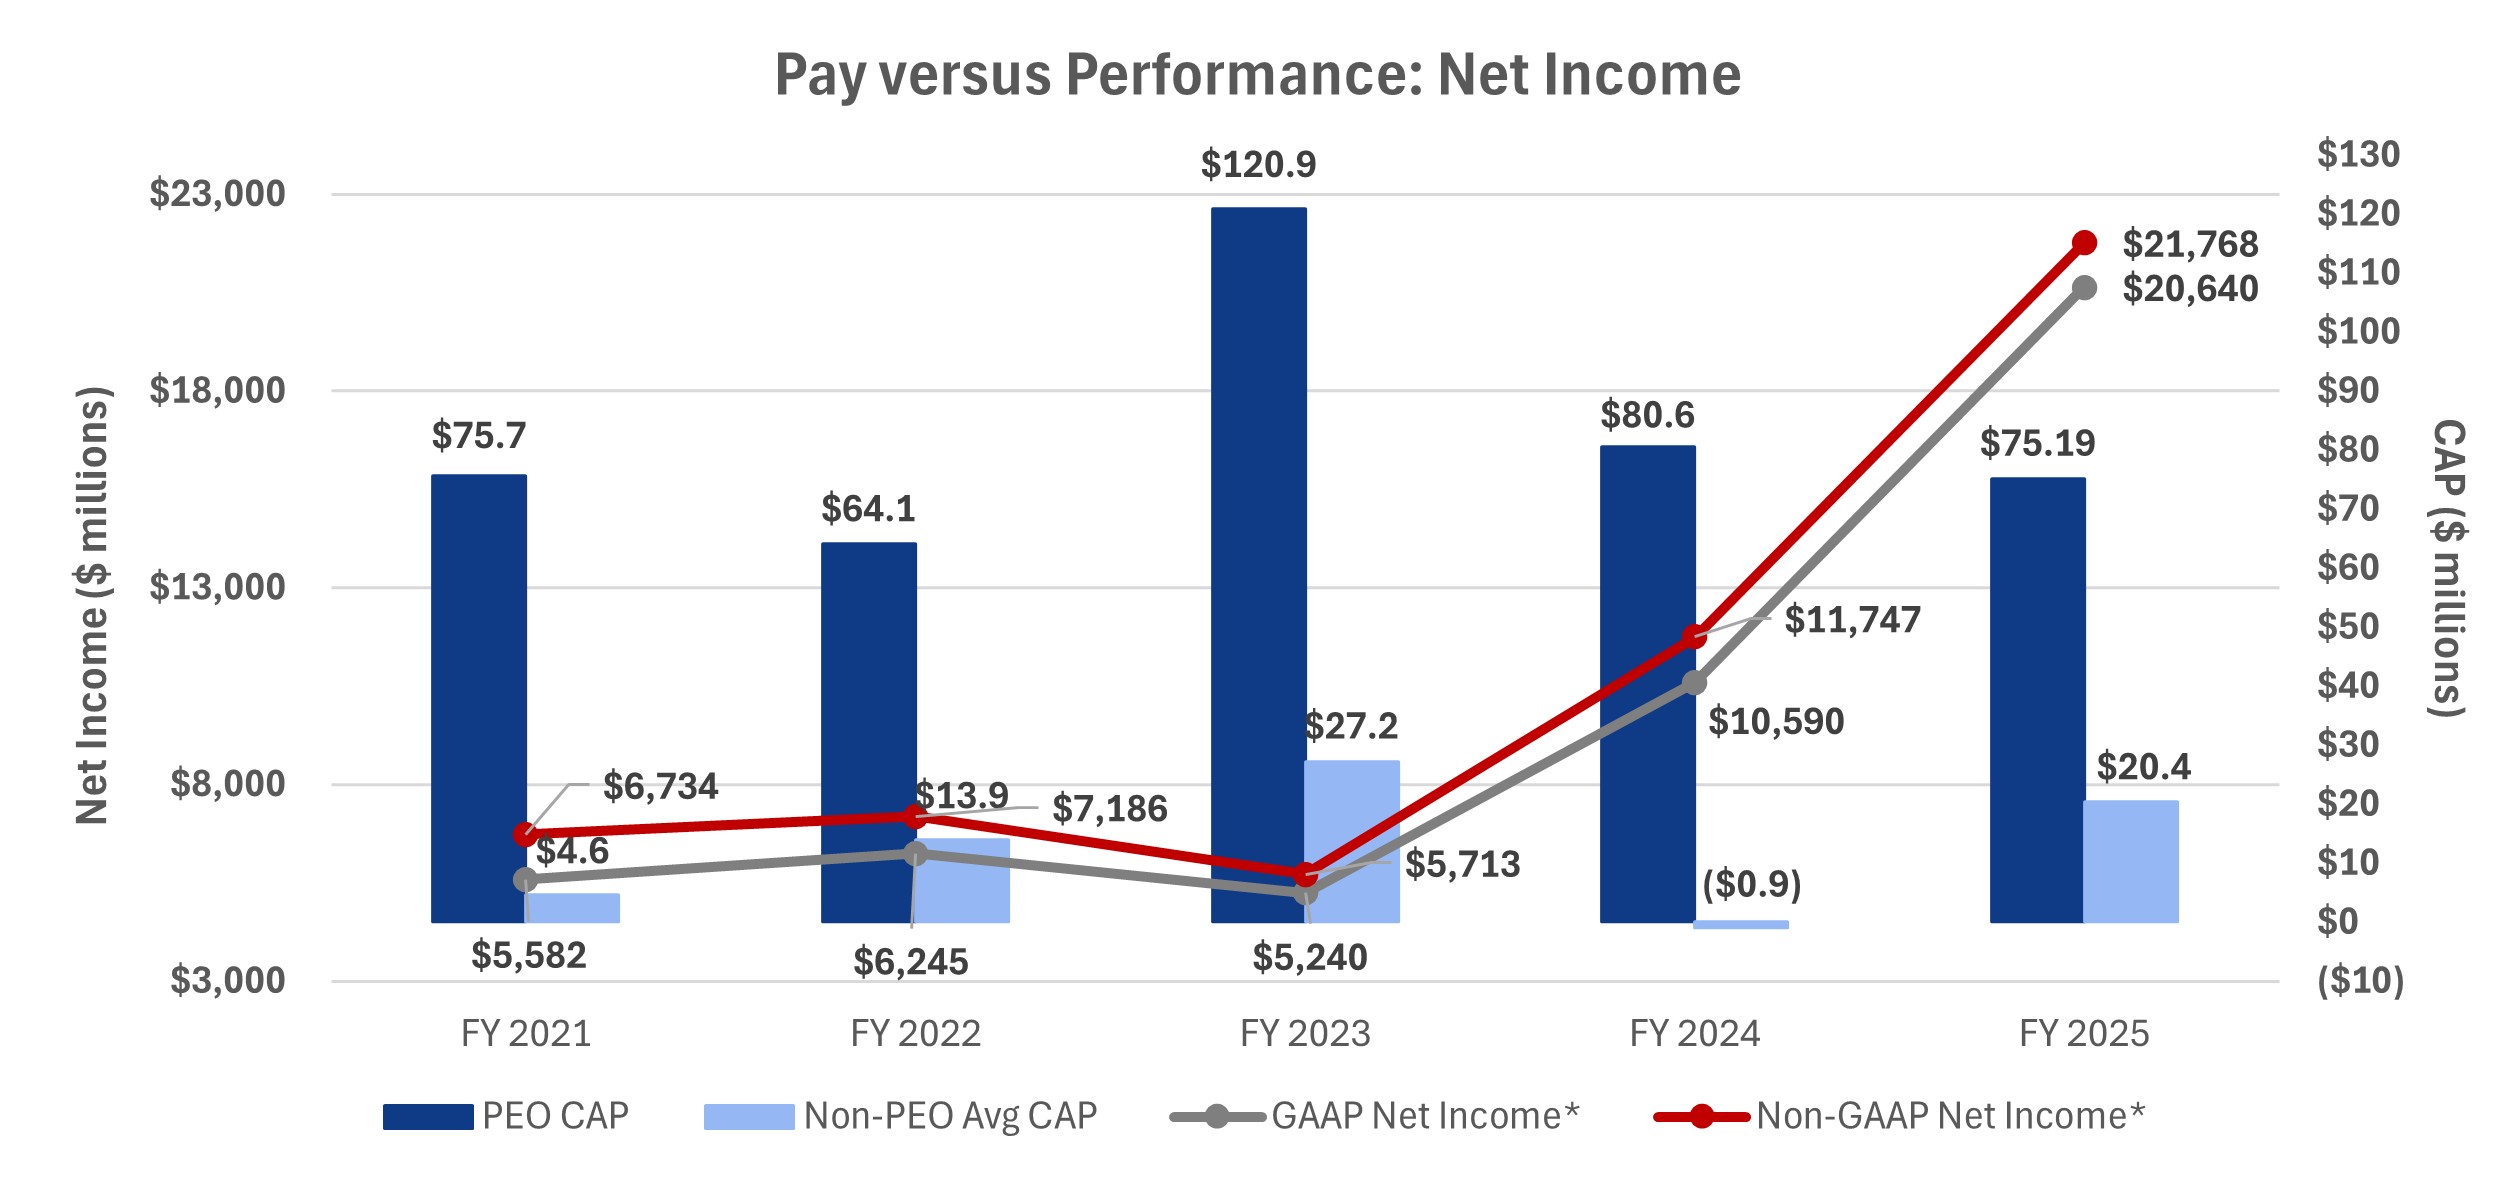
* GAAP net income and non-GAAP net income are discrete outcomes. GAAP net income and non-GAAP net income figures shown in the graphic above both include acquired IPR&D charges, net of taxes, as follows: $785.5 million in 2021, $813.2 million in 2022, $3.70 billion in 2023, $3.18 billion in 2024, and $2.91 billion in 2025.
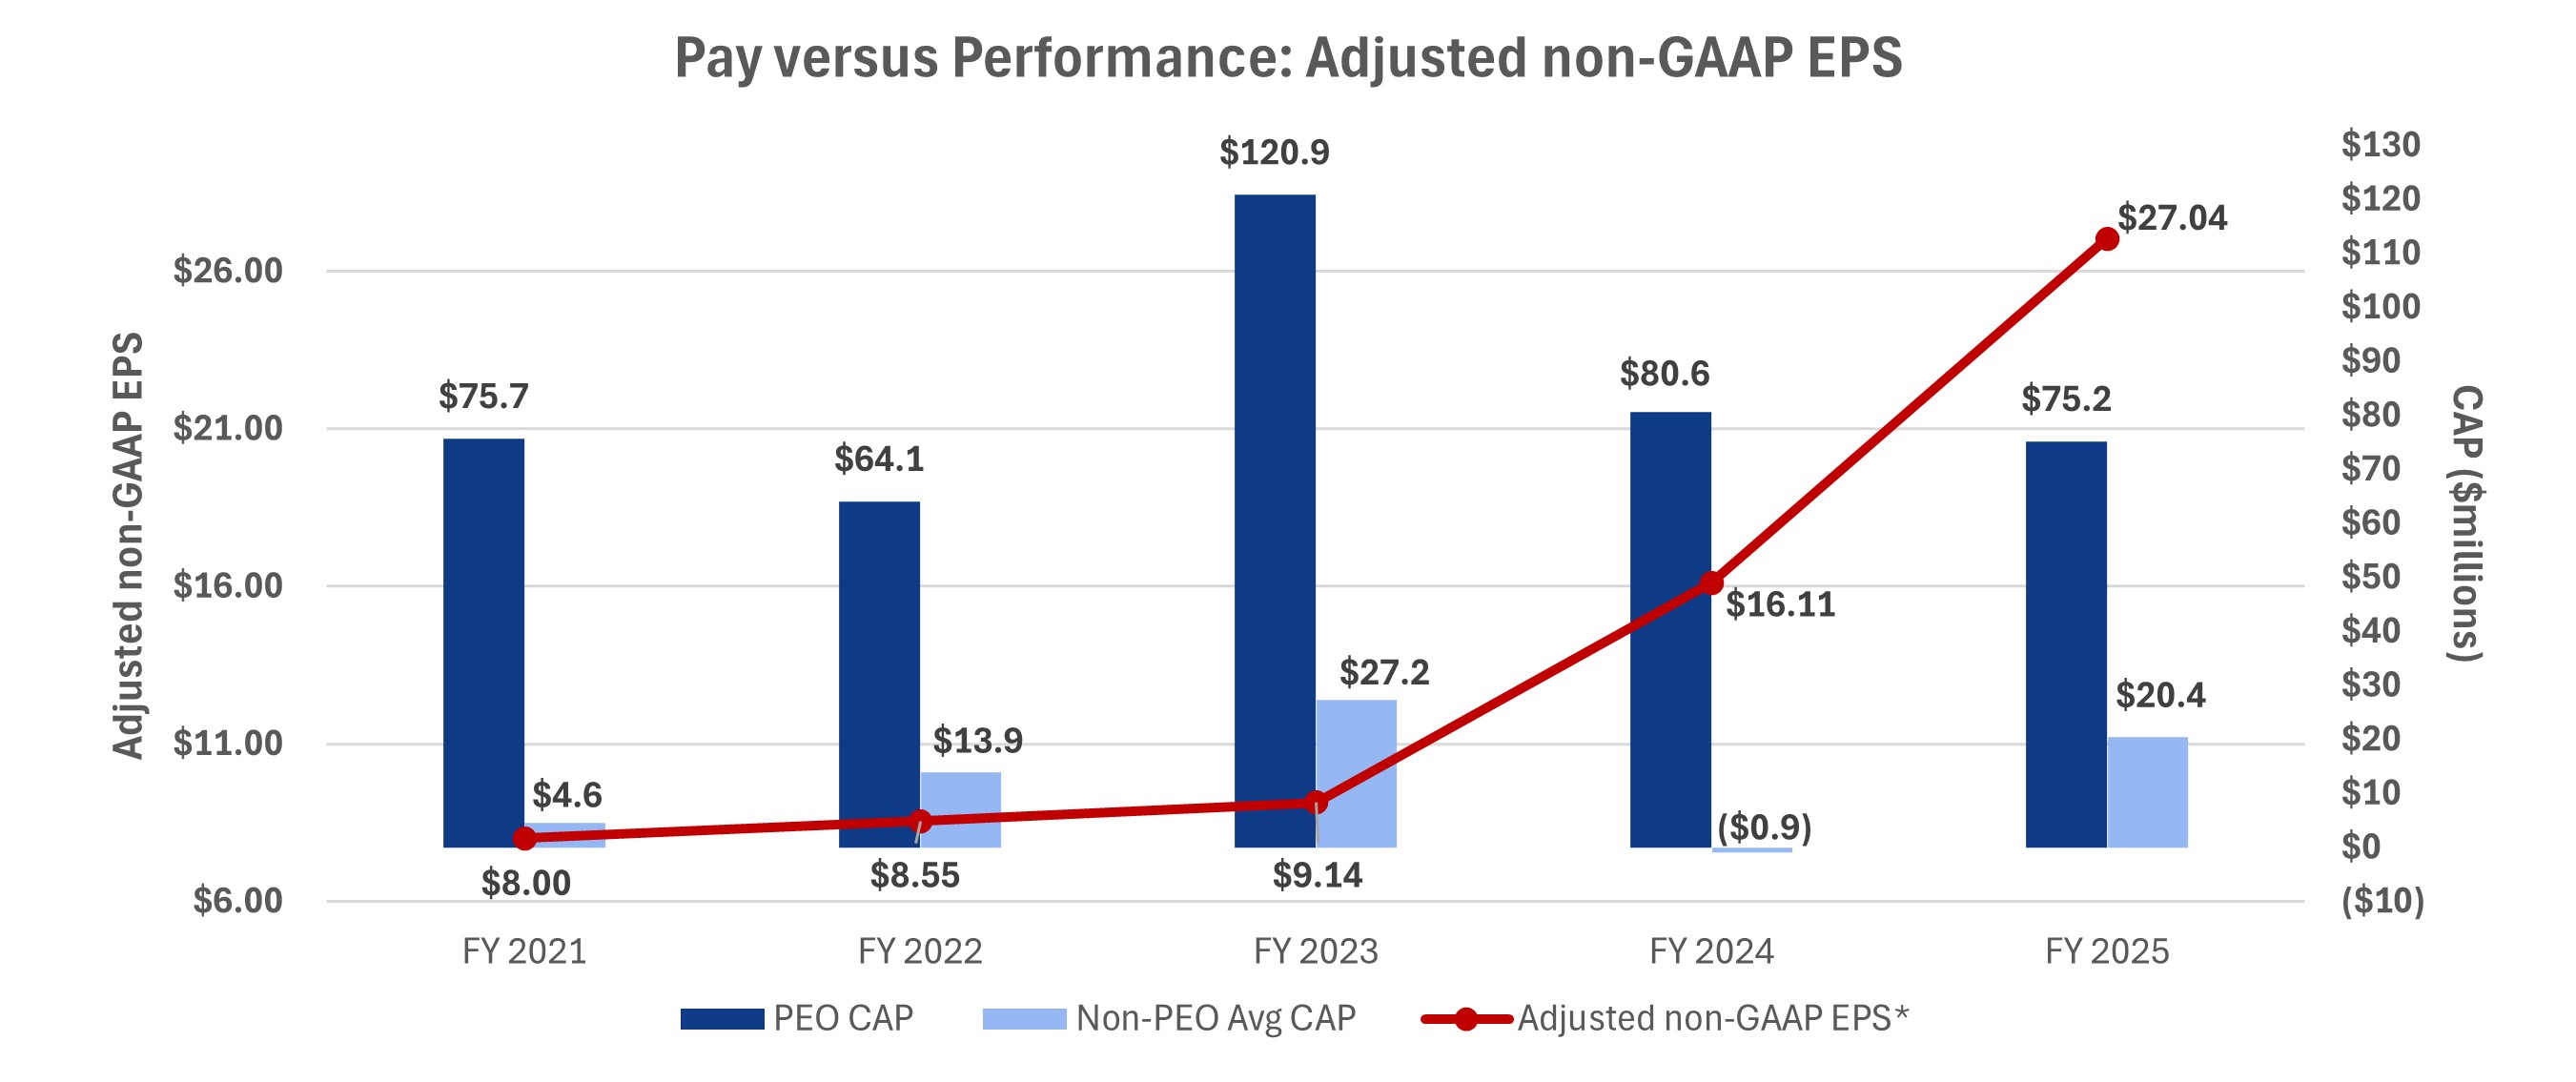
Lilly has chosen adjusted non-GAAP EPS as its most important company selected measure (CSM). Lilly leverages annual non-GAAP EPS derived from the board-approved business plan to set targets for the bonus. Significant sustained profitability growth contributes to higher total CAP as seen in the graphic below. For additional information on non-GAAP financial metrics, see Appendix A.
Most Important Performance Measures | ||
Adjusted non-GAAP EPS1 | ||
Total Shareholder Return | ||
Revenue | ||
The Committee believes in pay for performance and has structured Lilly compensation programs to reward leaders when the company delivers strong results. Lilly has achieved strong cumulative TSR, EPS and revenue growth over the immediately preceding five-year period. As a result, shareholders have been rewarded with significant total stock returns, and leadership has been rewarded with above-target payouts from their incentive compensation programs.
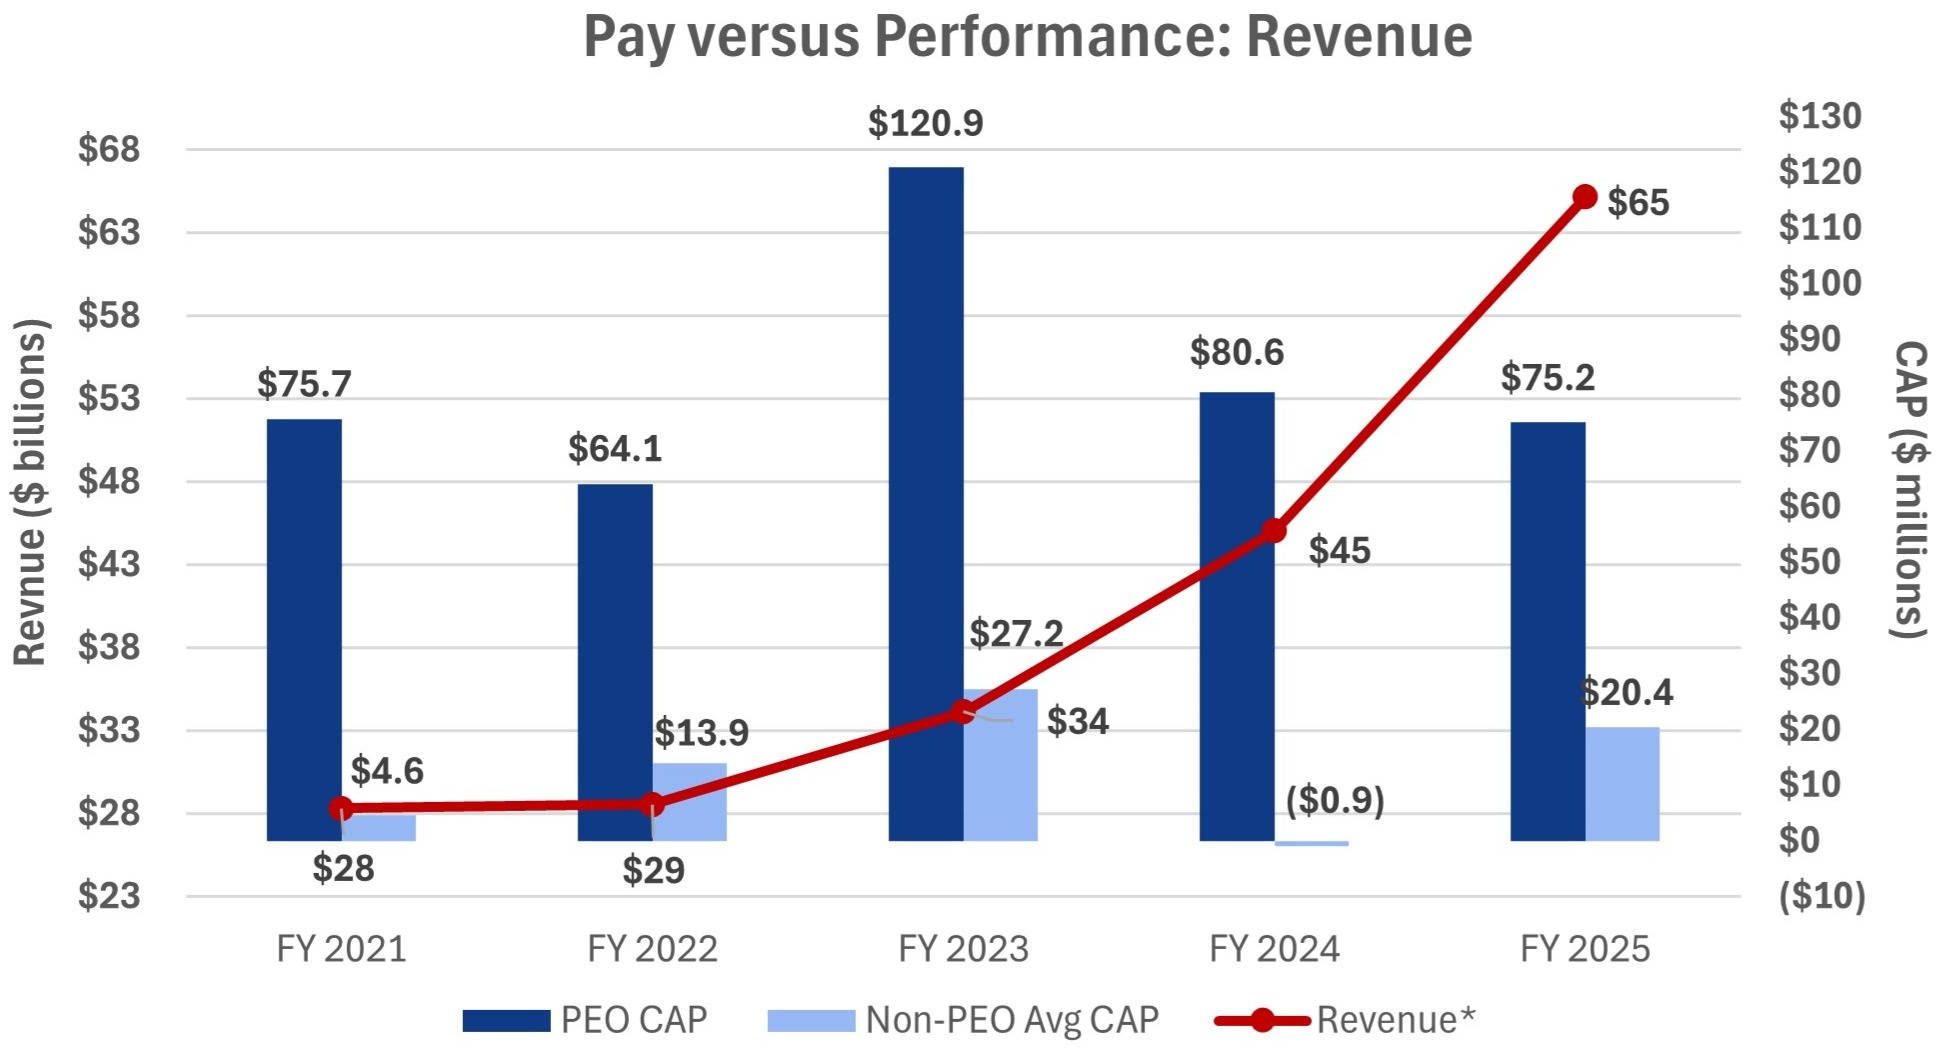
Lilly strives to make breakthrough medicines available to patients around the globe. Given a growing portfolio of new medicines, we motivate our entire workforce to reach as many patients as possible. The combination of a strong product portfolio and effective patient delivery yields higher sales volume and, generally, higher revenue. As such, revenue is one of our most important measures to ensure we are continuously growing the number of patients we serve. Generally, our revenue over the preceding five-year period aligns with the growth in PEO and average non-PEO CAP.