Pay vs Performance Disclosure
Dec. 31, 2025
Aug. 18, 2025
Dec. 31, 2025
USD ($)
Dec. 31, 2024
USD ($)
Dec. 31, 2023
USD ($)
Dec. 31, 2022
USD ($)
Dec. 31, 2021
USD ($)
Summary Compensation Table Total(2) | Compensation Actually Paid(3) | Average Summary Compensation Table Total Non-PEO Named Executive(2) Officers ($) | Average Compensation Actually Paid to Non-PEOs Named Executive Officers(4) ($) | Value Of Initial Fixed $100 Investment Based on: | Net Income ($ In Millions) | Adjusted EBITDA as a Percentage of Net Sales(6) | ||||||||||||||||||||||||||
Year(1) | for PEO – David Reeder ($) | for PEO – Bertrand Loy ($) | to PEO – David Reeder ($) | to PEO – Bertrand Loy ($) | Total Shareholder Return ($) | Peer Group Total Shareholder Return(5) ($) | ||||||||||||||||||||||||||
(a) | (b) | (c) | (d) | (e) | (f) | (g) | (h) | (i) | (j) | (k) | ||||||||||||||||||||||
2025 | 11,507,888 | 14,324,681 | 11,353,804 | 5,912,183 | 2,726,268 | 1,307,121 | 89.31 | 268.23 | 235.6 | 27.7 | % | |||||||||||||||||||||
2024 | 17,368,723 | 5,755,074 | 3,013,740 | 1,329,320 | 201.58 | 287.31 | 292.8 | 28.7 | % | |||||||||||||||||||||||
2023 | 13,405,690 | 32,727,950 | 2,925,224 | 4,304,294 | 243.04 | 238.72 | 180.7 | 26.7 | % | |||||||||||||||||||||||
2022 | 12,071,147 | (14,955,812) | 4,032,331 | (1,180,462) | 132.44 | 142.94 | 208.9 | 29.7 | % | |||||||||||||||||||||||
2021 | 10,498,881 | 28,998,082 | 2,531,346 | 6,304,090 | 278.79 | 219.50 | 409.1 | 30.4 | % | |||||||||||||||||||||||
2025: Mr. Loy served as our PEO through August 18, 2025. Mr. Reeder served as PEO as of August 18, 2025; Ms. LaGorga, Ms. Rice, Mr. Colella and Mr. Woodland served as our non-PEO NEOs.
2024: Mr. Loy served as our PEO; Ms. LaGorga, Ms. Rice, Mr. Woodland and Mr. Colella served as our non-PEO NEOs.
2023: Mr. Loy served as our PEO; Ms. LaGorga, Mr. Woodland, Ms. Rice, Mr. Colella, Mr. Graves and Mr. Tison served as our non-PEO NEOs.
2022: Mr. Loy served as our PEO; Mr. Graves, Mr. Edlund, Ms. Rice, Mr. Colella and Mr. Woodland served as our non-PEO NEOs.
2021: Mr. Loy served as our PEO; Mr. Graves, Mr. Edlund, Ms. Rice and Mr. Haris served as our non-PEO NEOs.
The amounts in the following table represent each of the amounts deducted and added to the equity award values for the PEO for the applicable year for purposes of computing the “compensation actually paid” amounts appearing in columns (d) and (e) of the Pay Versus Performance table:
Year | Name | Summary Compensation Table Total for PEO ($) | Value of Summary Compensation Table Stock Awards and Option Awards ($) | Year-end Fair Value of Equity Awards Granted During Applicable Year that Remain Unvested as of Year-End ($) | Change In Fair Value as of Year-end of Any Prior Year Awards That Remain Unvested as of Year-End ($) | Change In Fair Value as of the Vesting Date of Any Prior Year Awards that Vested Applicable Year ($) | Compensation Actually Paid ($) | ||||||||||||||||
2025 | Reeder | 11,507,888 | (10,561,875) | 10,451,281 | — | (43,490) | 11,353,804 | ||||||||||||||||
Loy | 14,324,681 | (12,396,297) | 9,907,951 | (6,266,671) | 342,519 | 5,912,183 | |||||||||||||||||
2024 | Loy | 17,368,723 | (14,896,910) | 8,352,366 | (7,041,893) | 1,972,788 | 5,755,074 | ||||||||||||||||
2023 | Loy | 13,405,690 | (11,132,369) | 18,504,501 | 8,861,419 | 3,088,709 | 32,727,950 | ||||||||||||||||
2022 | Loy | 12,071,147 | (9,472,554) | 3,338,027 | (19,164,110) | (1,728,323) | (14,955,812) | ||||||||||||||||
2021 | Loy | 10,498,881 | (7,513,579) | 12,131,903 | 12,448,578 | 1,432,299 | 28,998,082 | ||||||||||||||||
The amounts in the following table represent each of the amounts deducted and added to the equity award values for the non-PEO NEOs for the applicable year for purposes of computing the “compensation actually paid” amounts appearing in column (g) of the Pay Versus Performance table:
Year | Average Summary Compensation Table Total for Non-PEO Named Executive Officers ($) | Average Value of Summary Compensation Table Stock Awards and Option Awards ($) | Average Year-End Fair Value of Equity Awards Granted During Applicable Year that Remain Unvested as of Year-End ($) | Average Change in Fair Value as of Year-End of Any Prior Year Awards that Remain Unvested as of Year-End ($) | Average Change in Fair Value as of the Vesting Date of Any Prior Year Awards that Vested During Applicable Year ($) | Average Compensation Actually Paid to Non-PEO Named Executive Officers ($) | ||||||||||||||
2025 | 2,726,268 | (1,861,949) | 1,488,192 | (959,241) | (86,149) | 1,307,121 | ||||||||||||||
2024 | 3,013,740 | (2,077,222) | 1,164,597 | (924,955) | 153,160 | 1,329,320 | ||||||||||||||
2023 | 2,925,224 | (2,073,091) | 2,621,341 | 737,908 | 92,912 | 4,304,294 | ||||||||||||||
2022 | 4,032,331 | (3,178,153) | 901,518 | (2,611,814) | (324,344) | (1,180,462) | ||||||||||||||
2021 | 2,531,346 | (1,428,038) | 2,305,895 | 2,487,675 | 407,212 | 6,304,090 | ||||||||||||||
COMPENSATION ACTUALLY PAID VS. TSR (COMPANY TSR & PEER GROUP TSR)
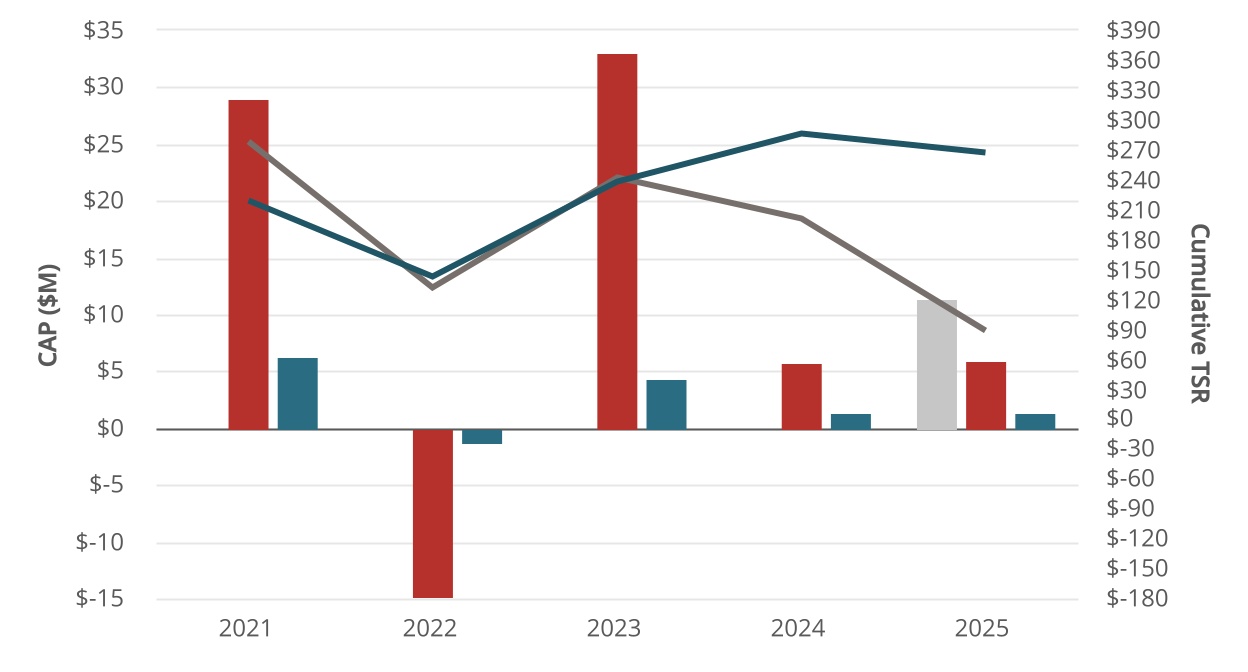
n | PEO CAP - David Reeder | n | PEO CAP - Betrand Loy | n | NEO Avg CAP | ||||||||||||
 | Entegris Cumulative TSR |  | Peer Group Cumulative TSR | ||||||||||||||
COMPENSATION ACTUALLY PAID VS. NET INCOME
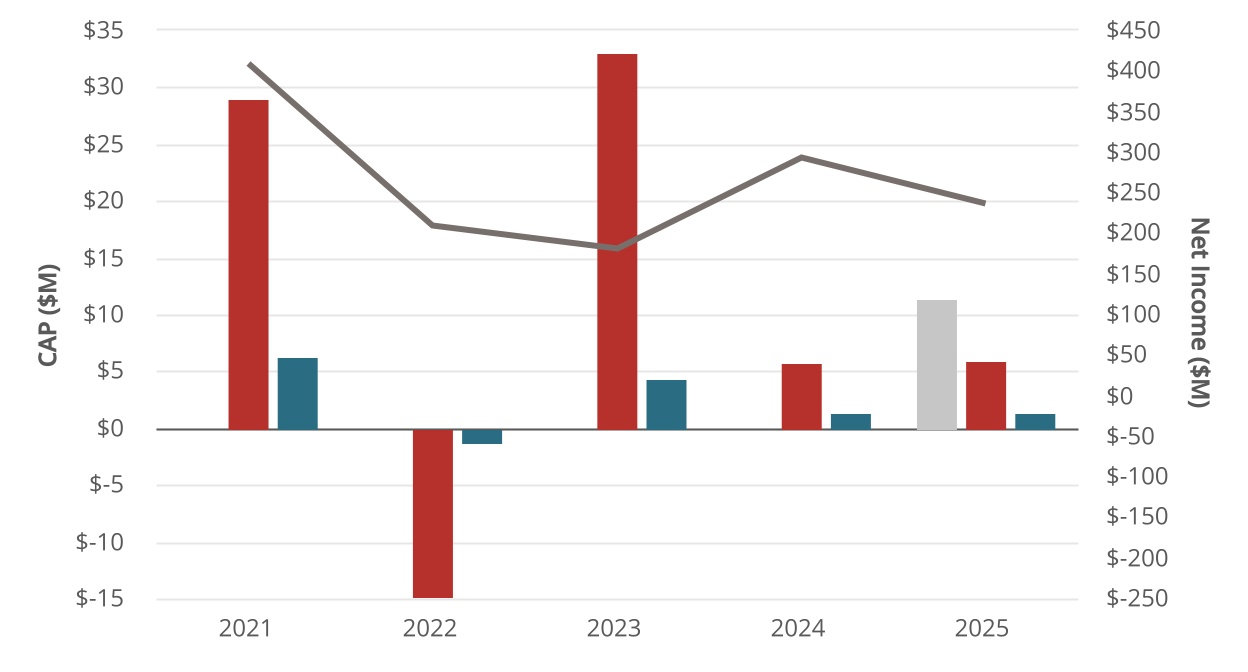
n | PEO CAP - David Reeder | n | PEO CAP - Betrand Loy | n | NEO Avg CAP | | Net Income | ||||||||||||||||
COMPENSATION ACTUALLY PAID VS. ADJUSTED EBITDA AS A PERCENTAGE OF NET SALES
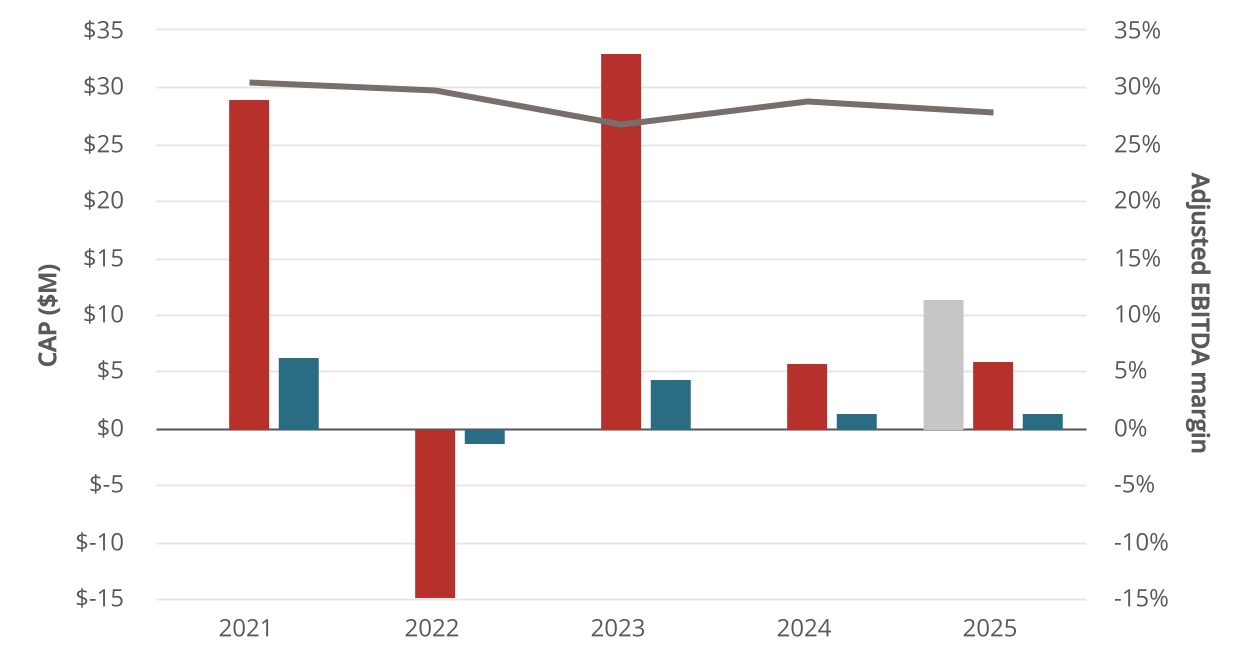
n | PEO CAP - David Reeder | n | PEO CAP - Betrand Loy | ||||||||
n | NEO Avg CAP | | Adjusted EBITDA Margin | ||||||||
Entegris and Philadelphia Semiconductor Index TSR
The following graphic compares the cumulative total shareholder return (“TSR”) on our common stock from December 31, 2020 through December 31, 2025 with the cumulative total return of the Philadelphia Semiconductor Index, assuming $100 was invested at the close of trading December 31, 2020 in our common stock and the Philadelphia Semiconductor Index and that all dividends are reinvested.
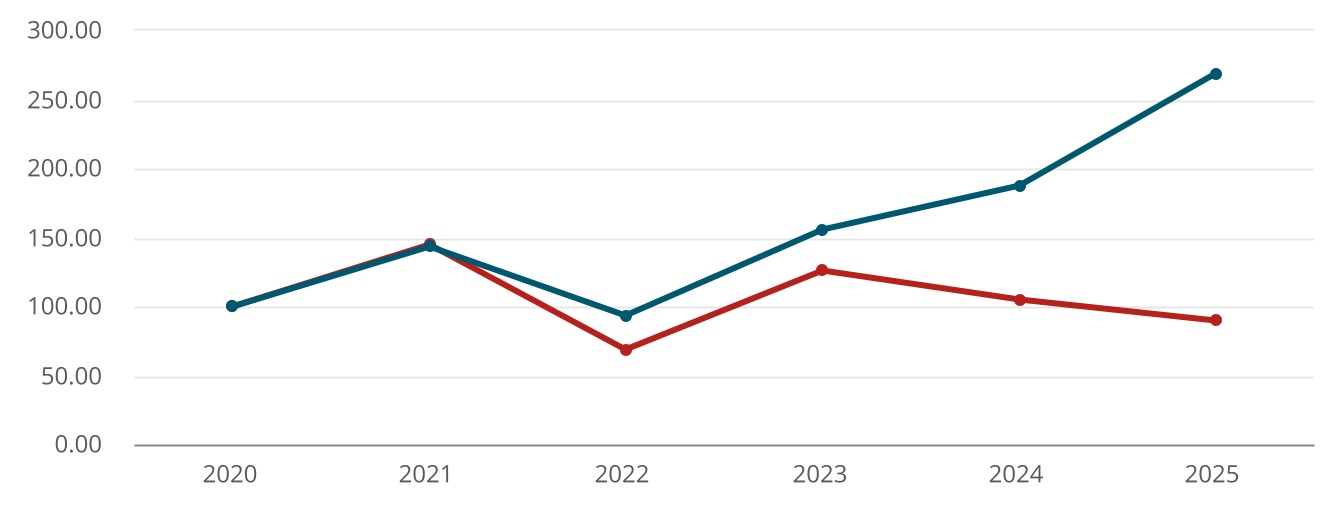
 | Entegris, Inc. |  | Philadelphia Semiconductor Index | ||||||||