Shareholder Report
Dec. 31, 2025
USD ($)
Holding
What were the Fund costs for the last year?
(Based on a hypothetical $10,000 investment)
| Costs of a $10,000 investment |
Costs paid as a percentage of a $10,000 investment |
|||||||
| Six Circles International Unconstrained Equity Fund |
$9 | 0.08% | ||||||
How did the Fund perform? What affected the Fund’s performance?
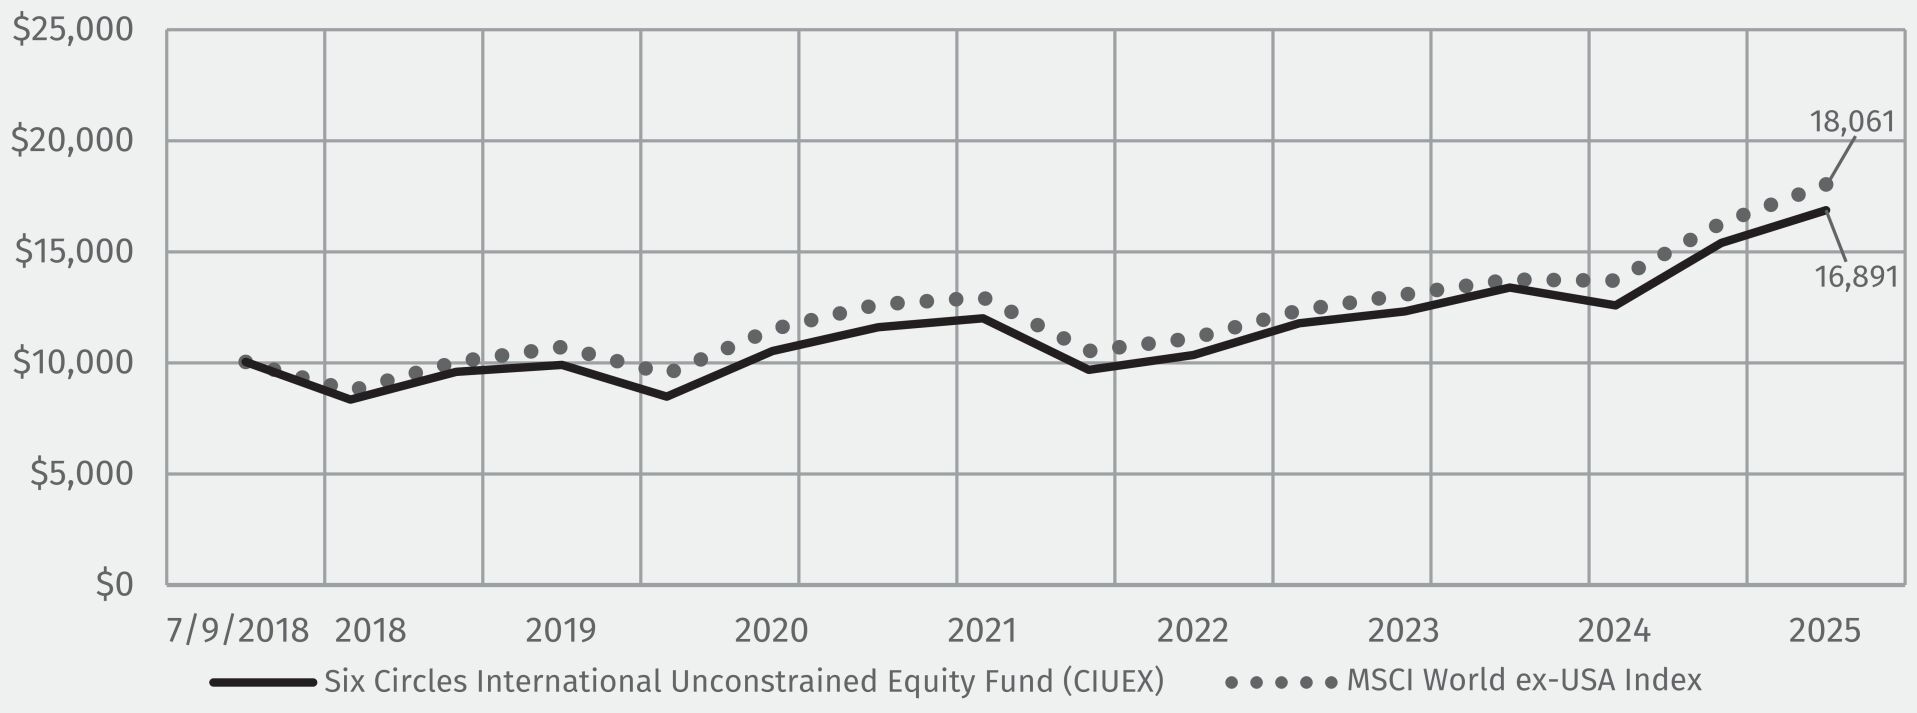
For the year ended December 31, 2025, the Fund returned 34.19%, whereas the MSCI World ex-USA Index (the “Index”) returned 31.85%.
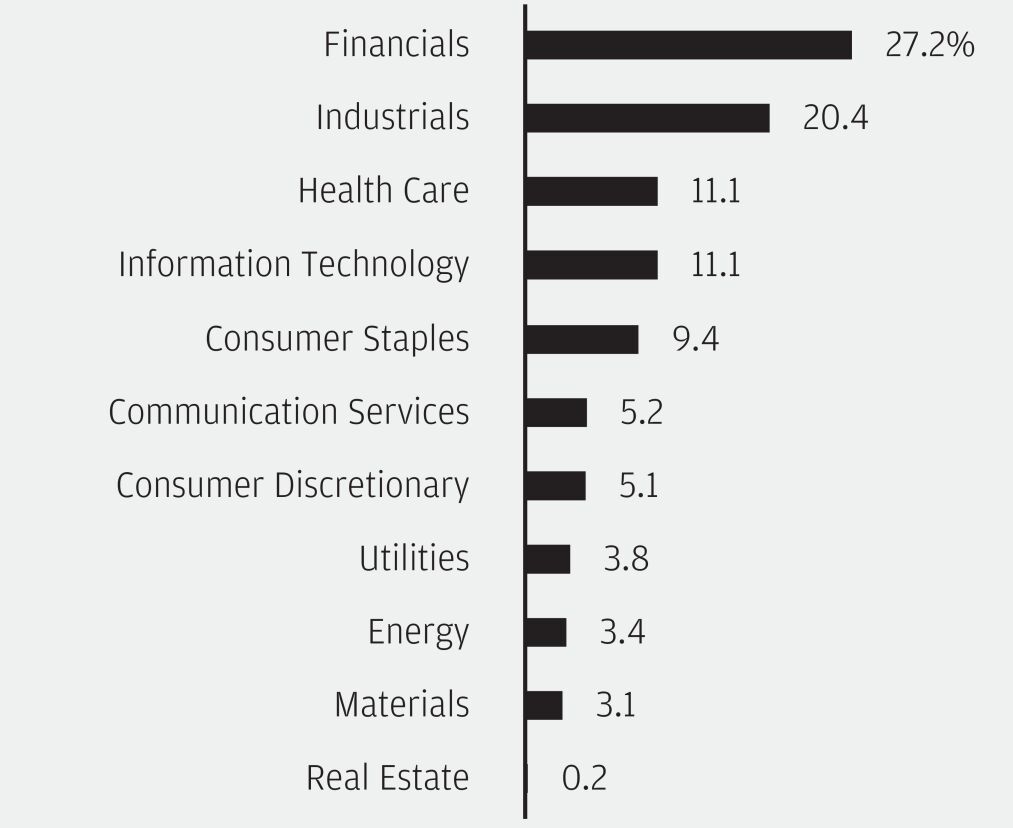
| - | The Fund’s allocation to Financials and Industrials were the leading contributors to the Fund’s absolute performance. |
| ○ | The Advisor believes that select companies within the Financials sector have strong fundamentals and can continue to perform well, if the expansion continues and recession is avoided. |
| - | Real Estate and Communication Services contributed the least to the Fund’s absolute performance. |
| - | The Fund employed equity futures in order to maintain market exposures during the reporting period. The use of equity futures contributed to the Fund’s absolute performance during the reporting period. |
Fund Performance
Average annual total returns:
| 1 Year | 5 Year | Since Inception (7/9/2018) |
||||||||||
| Six Circles International Unconstrained Equity Fund |
34.19% | 9.98% | 7.26% | |||||||||
| MSCI World ex-USA Index |
31.85% | 9.46% | 8.22% | |||||||||
Key Fund Statistics
| Fund’s net assets (in thousands) | $ | 19,570,070 | ||
| Total number of portfolio holdings | 762 | |||
| Total advisory fees paid (in thousands) | $ | 43,581 | ||
| Portfolio turnover rate as of the end of the reporting period | 48.43% | |||
Graphical Representation of Holdings
The tables below show the investment make up of the Fund, representing a percentage of total net assets of the Fund.
| Sector Allocation1 | Top Ten Holdings2 |
| ||||||||
 |
SAP SE |
3.2 | % | |||||||
| ASML Holding NV |
2.7 | |||||||||
| Taiwan Semiconductor Manufacturing Co. Ltd. |
2.5 | |||||||||
| Nestle SA |
2.5 | |||||||||
| Deutsche Telekom AG |
2.4 | |||||||||
| Rolls-Royce Holdings plc |
2.3 | |||||||||
| Siemens Energy AG |
2.1 | |||||||||
| Roche Holding AG |
2.0 | |||||||||
| HSBC Holdings plc |
1.9 | |||||||||
| British American Tobacco plc |
1.9 | |||||||||
| Total % of Portfolio |
23.5 | % | ||||||||
1 Presented percentages may not sum to 100% due to rounding to the nearest percent.
2 Holdings are subject to change. The holdings listed should not be considered recommendations to purchase or sell a particular security. Each individual security is calculated as a percentage of the aggregate market value of the securities held in the Fund and may include the use of derivative positions.
| Sector Allocation1 | Top Ten Holdings2 |
| ||||||||
| |
SAP SE |
3.2 | % | |||||||
| ASML Holding NV |
2.7 | |||||||||
| Taiwan Semiconductor Manufacturing Co. Ltd. |
2.5 | |||||||||
| Nestle SA |
2.5 | |||||||||
| Deutsche Telekom AG |
2.4 | |||||||||
| Rolls-Royce Holdings plc |
2.3 | |||||||||
| Siemens Energy AG |
2.1 | |||||||||
| Roche Holding AG |
2.0 | |||||||||
| HSBC Holdings plc |
1.9 | |||||||||
| British American Tobacco plc |
1.9 | |||||||||
| Total % of Portfolio |
23.5 | % | ||||||||
2 Holdings are subject to change. The holdings listed should not be considered recommendations to purchase or sell a particular security. Each individual security is calculated as a percentage of the aggregate market value of the securities held in the Fund and may include the use of derivative positions.
What were the Fund costs for the last year?
(Based on a hypothetical $10,000 investment)
| Costs of a $10,000 investment |
Costs paid as a percentage of a $10,000 investment |
|||||||
| Six Circles Tax Aware Ultra Short Duration Fund |
$15 | 0.15% | ||||||
How did the Fund perform? What affected the Fund’s performance?
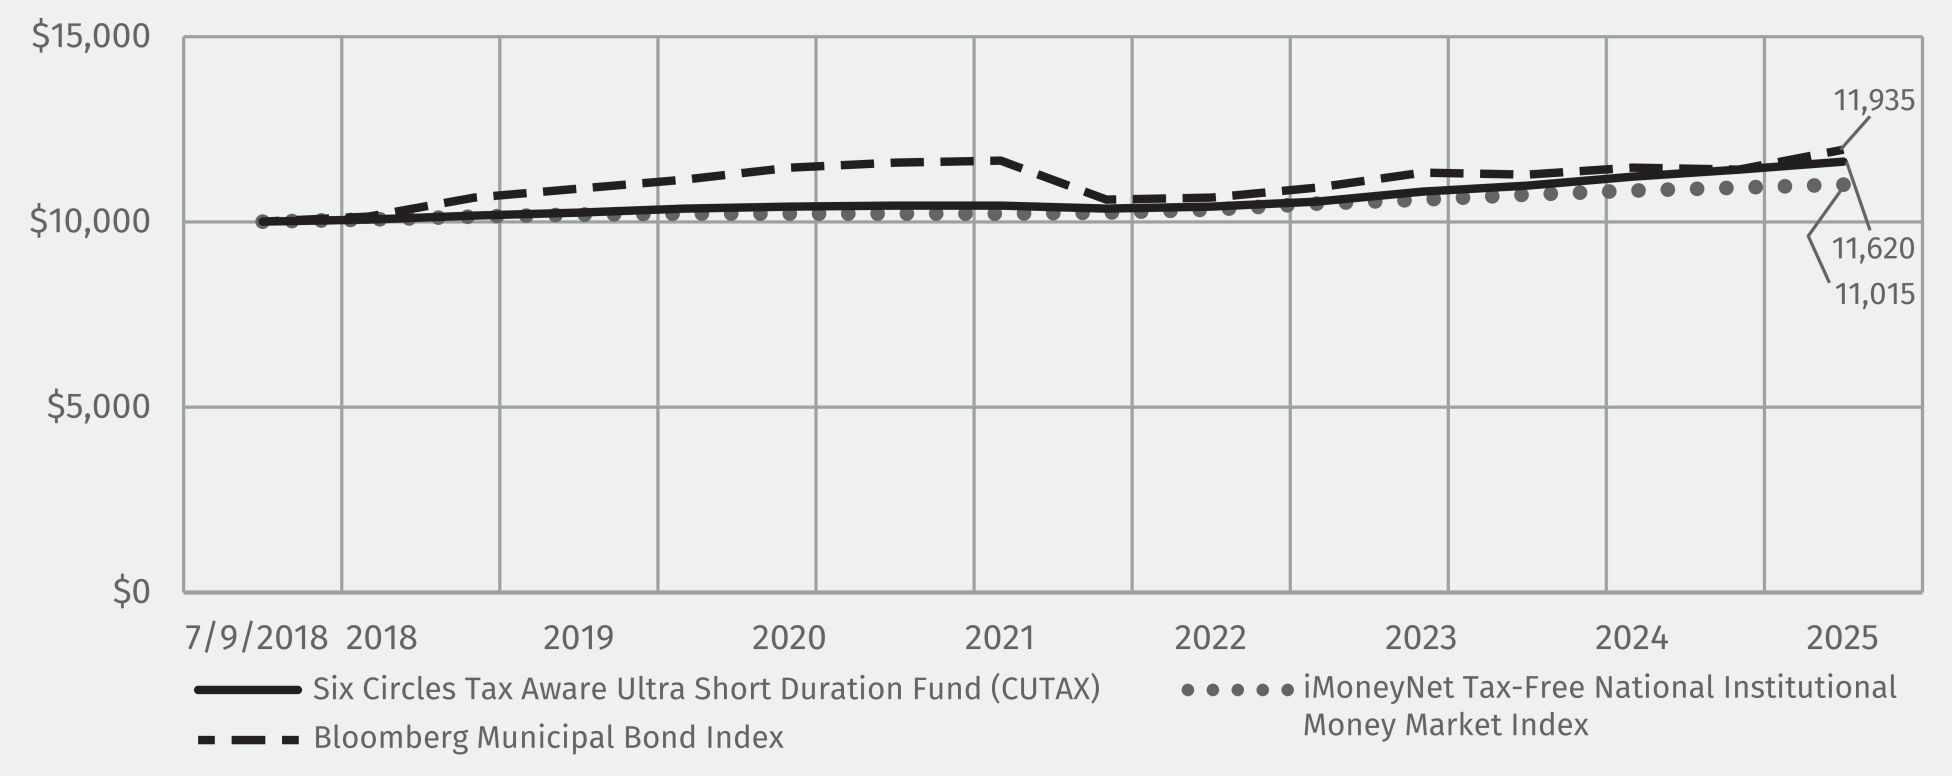
For the year ended December 31, 2025, the Fund returned 3.69%, while the iMoneyNet Tax-Free National Institutional Money Market Index (the “Index”) returned 1.69%.
| - | The Fund’s allocation to Investment Grade Credit, Government and Securitized (ABS and MBS) within the Core Bonds allocation were the leading contributors to the Fund’s absolute performance. |
| ○ | The Advisor utilizes this allocation to provide higher quality, short duration exposure which benefited the Fund throughout the year. |
| - | Derivatives were the leading detractor from the Fund’s absolute performance. |
| ○ | The Fund employed fixed income futures contracts in order to maintain market exposures during the reporting period. |
Fund Performance
Average annual total returns:
| 1 Year | 5 Year | Since Inception (7/9/2018) |
||||||||||
| Six Circles Tax Aware Ultra Short Duration Fund |
3.69% | 2.20% | 2.03% | |||||||||
| iMoneyNet Tax-Free National Institutional Money Market Index |
1.69% | 1.49% | 1.30% | |||||||||
| Bloomberg Municipal Bond Index |
4.25% | 0.80% | 2.39% | |||||||||
Key Fund Statistics
| Fund’s net assets (in thousands) | $ | 1,025,747 | ||
| Total number of portfolio holdings | 459 | |||
| Total advisory fees paid (in thousands) | $ | 2,345 | ||
| Portfolio turnover rate as of the end of the reporting period | 45.80% | |||
Graphical Representation of Holdings
The tables below show the investment make up of the Fund, representing a percentage of total net assets of the Fund.
| Asset Type1 |
|
Top Ten Holdings2 |
| |||||||||||||||
| Municipal Bonds |
68.1 | % | Orlando Utilities Commission, Series 1, Rev., VRDO, 2.45%, 01/07/2026 |
2.5 | % | |||||||||||||
| Corporate Bonds |
13.6 | Colorado Health Facilities Authority, Series D, Rev., VRDO, 2.45%, 01/02/2026 |
2.3 | |||||||||||||||
| Asset-Backed Securities |
6.1 | City of Rochester MN, Series A, Rev., VRDO, 2.35%, 01/07/2026 |
2.3 | |||||||||||||||
| Collateralized Mortgage Obligations |
6.0 | New York City Transitional Finance Authority Future Tax Secured Revenue, Rev., 5.00%, 11/01/2027 |
2.1 | |||||||||||||||
| Short-Term Investments |
4.0 | Connecticut State Health & Educational Facilities Authority, Yale University, Series A, Rev., VRDO, 1.90%, 01/02/2026 |
2.1 | |||||||||||||||
| Foreign Government Securities |
0.5 | Chelan County Public Utility District No. 1, Series B, Rev., VRDO, 2.25%, 01/07/2026 |
2.0 | |||||||||||||||
| Mortgage-Backed Security |
0.5 | Health & Educational Facilities Authority of the State of Missouri, Series F, Rev., VRDO, 2.50%, 01/02/2026 |
1.6 | |||||||||||||||
| U.S. Government Agency Security |
0.3 | Louisiana State Citizens Property Insurance Corp., Series A, Rev., 5.00%, 06/01/2026 |
1.6 | |||||||||||||||
| Commercial Mortgage-Backed Securities |
0.2 | Triborough Bridge & Tunnel Authority, Subordinated Bond, Series A, Rev., BAN, 5.00%, 02/01/2028 |
1.5 | |||||||||||||||
| Certificates of Deposit |
0.1 | State of Connecticut, Series D, GO, 5.00%, 08/15/2028 |
1.5 | |||||||||||||||
| U.S. Treasury Obligations |
0.1 | Total % of Portfolio |
19.5 | % | ||||||||||||||
1 Presented percentages may not sum to 100% due to rounding to the nearest percent.
2 Holdings are subject to change. The holdings listed should not be considered recommendations to purchase or sell a particular security. Each individual security is calculated as a percentage of the aggregate market value of the securities held in the Fund and may include the use of derivative positions.
| Asset Type1 |
|
Top Ten Holdings2 |
| |||||||||||||||
| Municipal Bonds |
68.1 | % | Orlando Utilities Commission, Series 1, Rev., VRDO, 2.45%, 01/07/2026 |
2.5 | % | |||||||||||||
| Corporate Bonds |
13.6 | Colorado Health Facilities Authority, Series D, Rev., VRDO, 2.45%, 01/02/2026 |
2.3 | |||||||||||||||
| Asset-Backed Securities |
6.1 | City of Rochester MN, Series A, Rev., VRDO, 2.35%, 01/07/2026 |
2.3 | |||||||||||||||
| Collateralized Mortgage Obligations |
6.0 | New York City Transitional Finance Authority Future Tax Secured Revenue, Rev., 5.00%, 11/01/2027 |
2.1 | |||||||||||||||
| Short-Term Investments |
4.0 | Connecticut State Health & Educational Facilities Authority, Yale University, Series A, Rev., VRDO, 1.90%, 01/02/2026 |
2.1 | |||||||||||||||
| Foreign Government Securities |
0.5 | Chelan County Public Utility District No. 1, Series B, Rev., VRDO, 2.25%, 01/07/2026 |
2.0 | |||||||||||||||
| Mortgage-Backed Security |
0.5 | Health & Educational Facilities Authority of the State of Missouri, Series F, Rev., VRDO, 2.50%, 01/02/2026 |
1.6 | |||||||||||||||
| U.S. Government Agency Security |
0.3 | Louisiana State Citizens Property Insurance Corp., Series A, Rev., 5.00%, 06/01/2026 |
1.6 | |||||||||||||||
| Commercial Mortgage-Backed Securities |
0.2 | Triborough Bridge & Tunnel Authority, Subordinated Bond, Series A, Rev., BAN, 5.00%, 02/01/2028 |
1.5 | |||||||||||||||
| Certificates of Deposit |
0.1 | State of Connecticut, Series D, GO, 5.00%, 08/15/2028 |
1.5 | |||||||||||||||
| U.S. Treasury Obligations |
0.1 | Total % of Portfolio |
19.5 | % | ||||||||||||||
2 Holdings are subject to change. The holdings listed should not be considered recommendations to purchase or sell a particular security. Each individual security is calculated as a percentage of the aggregate market value of the securities held in the Fund and may include the use of derivative positions.
What were the Fund costs for the last year?
(Based on a hypothetical $10,000 investment)
| Costs of a $10,000 investment |
Costs paid as a percentage of a $10,000 investment |
|||||||
| Six Circles U.S. Unconstrained Equity Fund |
$5 | 0.05% | ||||||
How did the Fund perform? What affected the Fund’s performance?
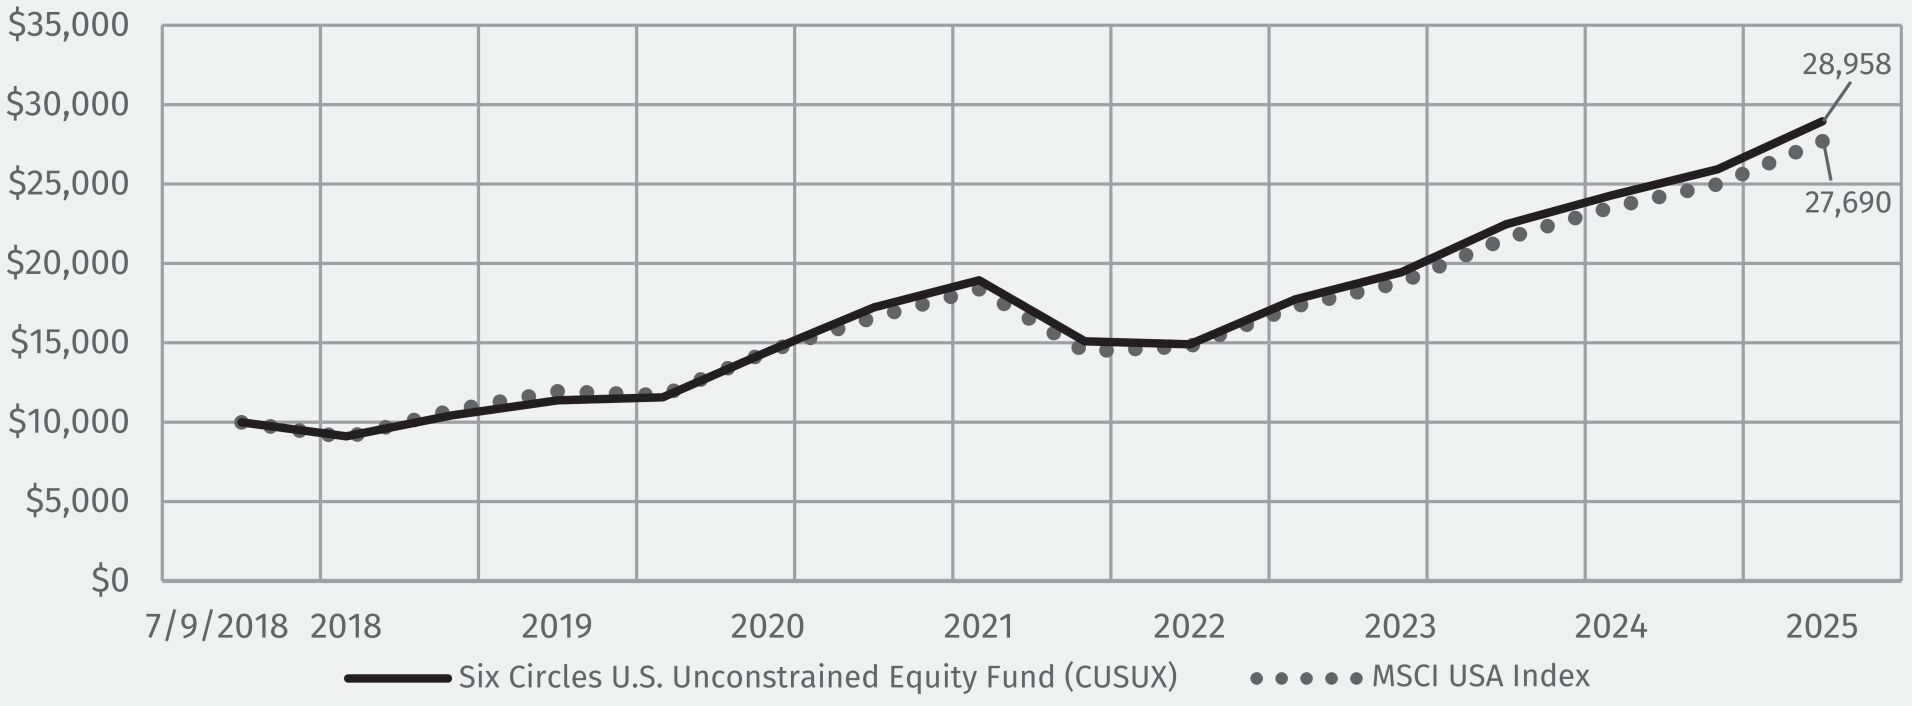
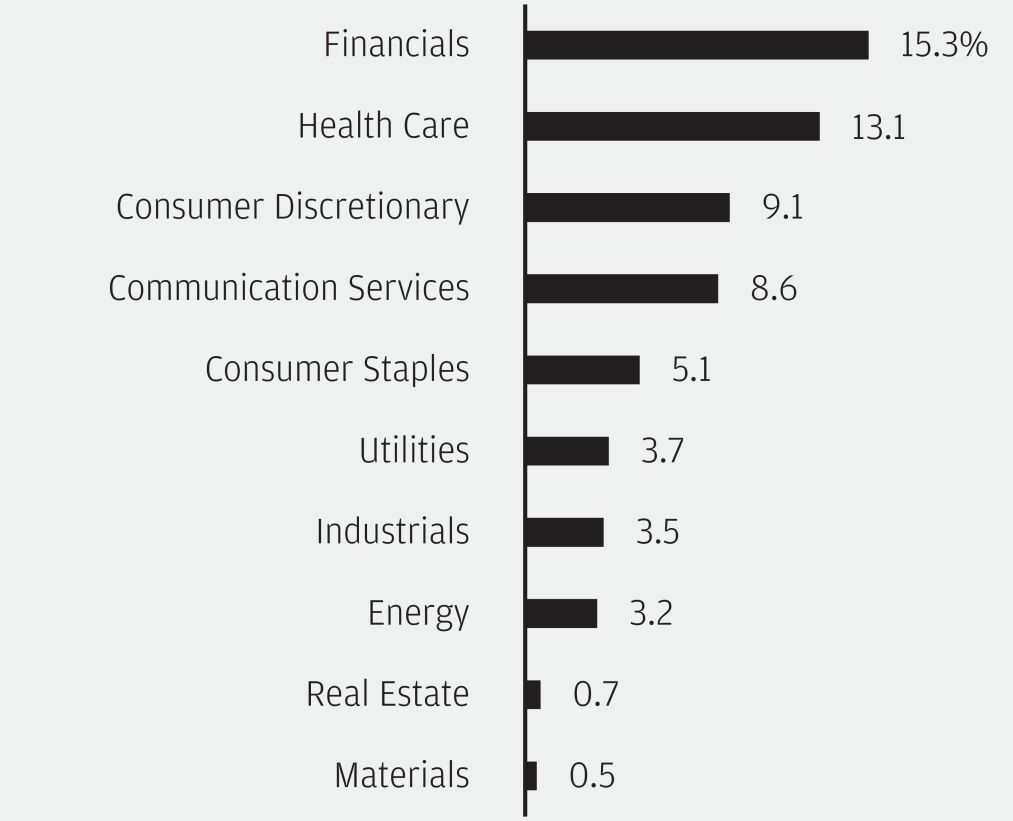
For the year ended December 31, 2025, the Fund returned 19.36%, while the MSCI USA Index (the “Index”) returned 17.75%.
| - | The Fund’s allocation to Information Technology and Financials were the leading contributors to the Fund’s absolute performance. |
| ○ | The Advisor believes that select companies within the Financials sector have strong fundamentals and can continue to perform well, if the expansion continues and recession is avoided. |
| - | In terms of sector exposures, Utilities detracted and Materials contributed the least to the Fund’s absolute performance. |
| - | The Fund employed equity futures in order to maintain market exposures during the reporting period. The use of equity futures contributed to the Fund’s absolute performance during the reporting period. |
Fund Performance
Average annual total returns:
| 1 Year | 5 Year | Since Inception (7/9/2018) |
||||||||||
| Six Circles U.S. Unconstrained Equity Fund |
19.36% | 14.85% | 15.28% | |||||||||
| MSCI USA Index |
17.75% | 13.87% | 14.59% | |||||||||
Key Fund Statistics
| Fund’s net assets (in thousands) | $ | 32,232,232 | ||
| Total number of portfolio holdings | 616 | |||
| Total advisory fees paid (in thousands) | $ | 70,220 | ||
| Portfolio turnover rate as of the end of the reporting period | 61.09% | |||
Graphical Representation of Holdings
The tables below show the investment make up of the Fund, representing a percentage of total net assets of the Fund.
| Sector Allocation1 | Top Ten Holdings2 |
| ||||||||
 |
NVIDIA Corp. |
8.2 | % | |||||||
| Microsoft Corp. |
7.6 | |||||||||
| Apple, Inc. |
5.6 | |||||||||
| Amazon.com, Inc. |
3.7 | |||||||||
| Alphabet, Inc., Class A |
3.0 | |||||||||
| Walmart, Inc. |
3.0 | |||||||||
| Wells Fargo & Co. |
2.8 | |||||||||
| Broadcom, Inc. |
2.5 | |||||||||
| Alphabet, Inc., Class C |
2.5 | |||||||||
| Meta Platforms, Inc., Class A |
2.4 | |||||||||
| Total % of Portfolio |
41.3 | % | ||||||||
1 Presented percentages may not sum to 100% due to rounding to the nearest percent.
2 Holdings are subject to change. The holdings listed should not be considered recommendations to purchase or sell a particular security. Each individual security is calculated as a percentage of the aggregate market value of the securities held in the Fund and may include the use of derivative positions.
| Sector Allocation1 | Top Ten Holdings2 |
| ||||||||
| |
NVIDIA Corp. |
8.2 | % | |||||||
| Microsoft Corp. |
7.6 | |||||||||
| Apple, Inc. |
5.6 | |||||||||
| Amazon.com, Inc. |
3.7 | |||||||||
| Alphabet, Inc., Class A |
3.0 | |||||||||
| Walmart, Inc. |
3.0 | |||||||||
| Wells Fargo & Co. |
2.8 | |||||||||
| Broadcom, Inc. |
2.5 | |||||||||
| Alphabet, Inc., Class C |
2.5 | |||||||||
| Meta Platforms, Inc., Class A |
2.4 | |||||||||
| Total % of Portfolio |
41.3 | % | ||||||||
2 Holdings are subject to change. The holdings listed should not be considered recommendations to purchase or sell a particular security. Each individual security is calculated as a percentage of the aggregate market value of the securities held in the Fund and may include the use of derivative positions.
What were the Fund costs for the last year?
(Based on a hypothetical $10,000 investment)
| Costs of a $10,000 investment |
Costs paid as a percentage of a $10,000 investment |
|||||||
| Six Circles Ultra Short Duration Fund |
$19 | 0.19% | ||||||
How did the Fund perform? What affected the Fund’s performance?
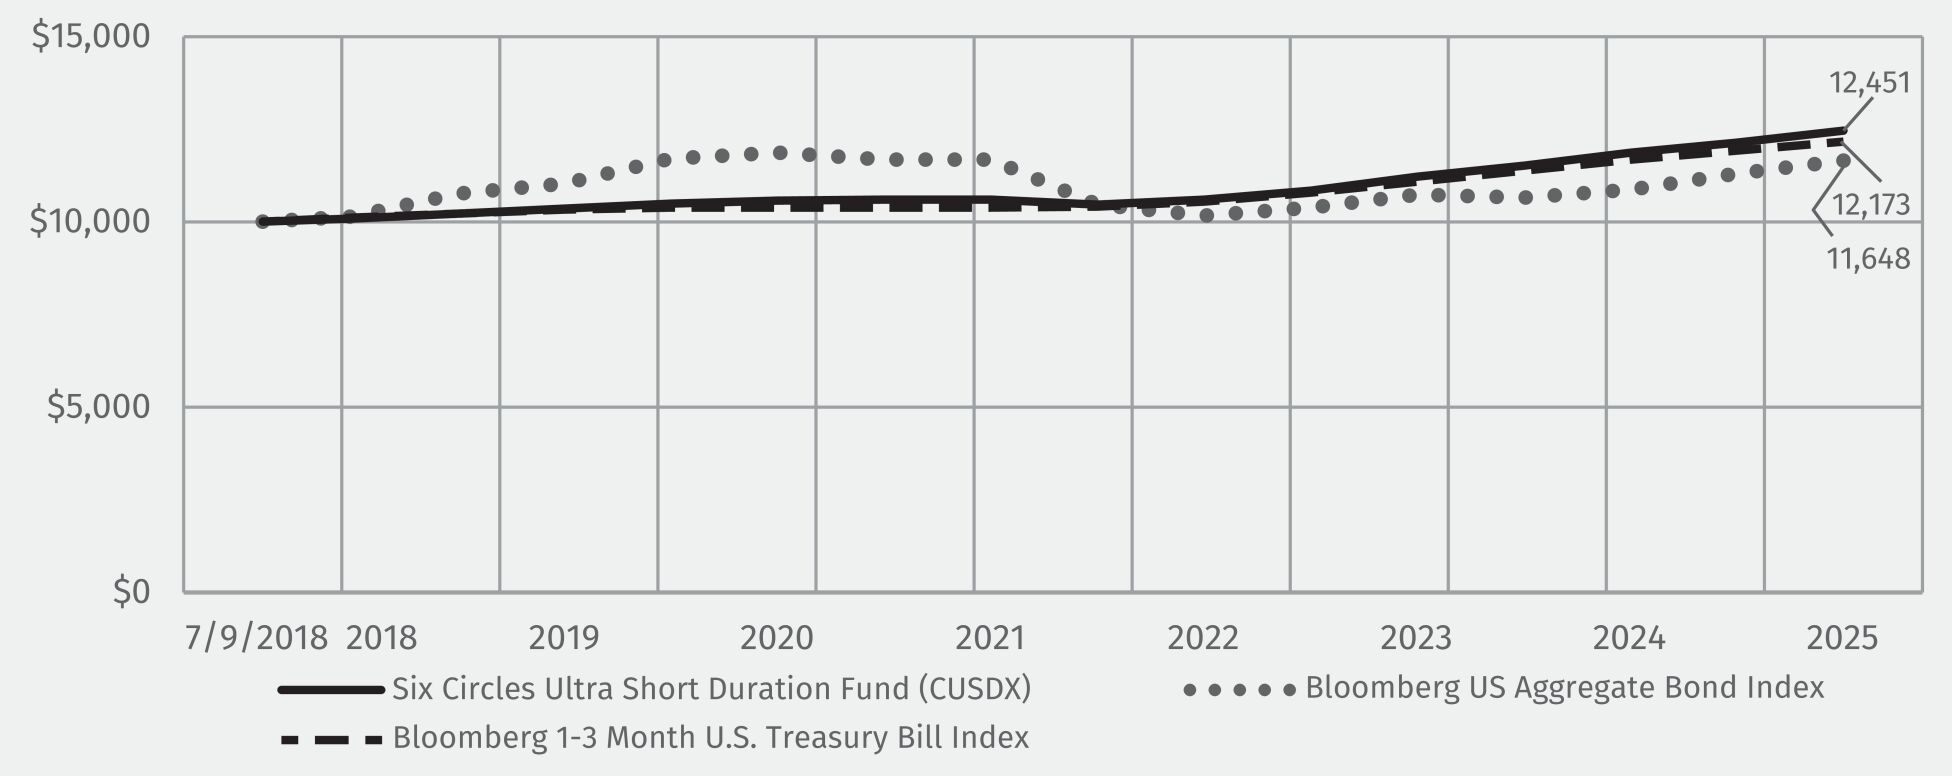
For the year ended December 31, 2025, the Fund returned 4.82%, while the Bloomberg 1-3 Month U.S. Treasury Bill Index (the “Index”) returned 4.29%.
| - | Investment Grade Credit and Securitized within the Core Bonds allocation were the leading contributors to the Fund’s absolute performance. |
| ○ | The Advisor utilizes these allocations to provide higher quality, short duration exposure which benefited the Fund throughout the year |
| - | The Fund’s allocation to derivatives was a leading detractor to the Fund’s absolute performance |
Fund Performance
Average annual total returns:
| 1 Year | 5 Year | Since Inception (7/9/2018) |
||||||||||
| Six Circles Ultra Short Duration Fund |
4.82% | 3.33% | 2.97% | |||||||||
| Bloomberg US Aggregate Bond Index |
7.30% | -0.36% | 2.06% | |||||||||
| Bloomberg 1-3 Month U.S. Treasury Bill Index |
4.29% | 3.24% | 2.66% | |||||||||
Key Fund Statistics
| Fund’s net assets (in thousands) | $ | 809,958 | ||
| Total number of portfolio holdings | 626 | |||
| Total advisory fees paid (in thousands) | $ | 1,825 | ||
| Portfolio turnover rate as of the end of the reporting period | 59.33% | |||
Graphical Representation of Holdings
The tables below show the investment make up of the Fund, representing a percentage of total net assets of the Fund.
| Asset Type1 |
|
Top Ten Holdings2 |
| |||||||||||||||
| Corporate Bonds |
51.2 | % | U.S. Treasury Bills, 3.98%, 03/19/2026 |
2.0 | % | |||||||||||||
| Short-Term Investments |
22.8 | Canadian Treasury Bill, (Canada), Zero Coupon, 01/28/2026 |
1.9 | |||||||||||||||
| Asset-Backed Securities |
13.1 | Canadian Treasury Bill, (Canada), Zero Coupon, 02/11/2026 |
1.3 | |||||||||||||||
| Collateralized Mortgage Obligations |
7.0 | U.S. Treasury Notes, 1.63%, 02/15/2026 |
1.2 | |||||||||||||||
| Commercial Mortgage-Backed Securities |
2.2 | U.S. Treasury Bills, 3.81%, 05/14/2026 |
1.2 | |||||||||||||||
| U.S. Treasury Obligations |
1.4 | HCA, Inc., 3.13%, 03/15/2027 |
1.0 | |||||||||||||||
| U.S. Government Agency Securities |
0.8 | Sabine Pass Liquefaction LLC, 5.00%, 03/15/2027 |
1.0 | |||||||||||||||
| Mortgage-Backed Security |
0.6 | Citigroup, Inc., (United States SOFR + 1.14%), 4.64%, 05/07/2028 |
0.9 | |||||||||||||||
| Foreign Government Security |
0.2 | Goldman Sachs Group, Inc. (The), (United States SOFR + 1.32%), 4.94%, 04/23/2028 |
0.9 | |||||||||||||||
| Certificates of Deposit |
0.1 | RCRPBOFAS, 3.90%, 01/02/2026 |
0.8 | |||||||||||||||
| Total % of Portfolio |
12.2 | % | ||||||||||||||||
1 Presented percentages may not sum to 100% due to rounding to the nearest percent.
2 Holdings are subject to change. The holdings listed should not be considered recommendations to purchase or sell a particular security. Each individual security is calculated as a percentage of the aggregate market value of the securities held in the Fund and may include the use of derivative positions.
| Asset Type1 |
|
Top Ten Holdings2 |
| |||||||||||||||
| Corporate Bonds |
51.2 | % | U.S. Treasury Bills, 3.98%, 03/19/2026 |
2.0 | % | |||||||||||||
| Short-Term Investments |
22.8 | Canadian Treasury Bill, (Canada), Zero Coupon, 01/28/2026 |
1.9 | |||||||||||||||
| Asset-Backed Securities |
13.1 | Canadian Treasury Bill, (Canada), Zero Coupon, 02/11/2026 |
1.3 | |||||||||||||||
| Collateralized Mortgage Obligations |
7.0 | U.S. Treasury Notes, 1.63%, 02/15/2026 |
1.2 | |||||||||||||||
| Commercial Mortgage-Backed Securities |
2.2 | U.S. Treasury Bills, 3.81%, 05/14/2026 |
1.2 | |||||||||||||||
| U.S. Treasury Obligations |
1.4 | HCA, Inc., 3.13%, 03/15/2027 |
1.0 | |||||||||||||||
| U.S. Government Agency Securities |
0.8 | Sabine Pass Liquefaction LLC, 5.00%, 03/15/2027 |
1.0 | |||||||||||||||
| Mortgage-Backed Security |
0.6 | Citigroup, Inc., (United States SOFR + 1.14%), 4.64%, 05/07/2028 |
0.9 | |||||||||||||||
| Foreign Government Security |
0.2 | Goldman Sachs Group, Inc. (The), (United States SOFR + 1.32%), 4.94%, 04/23/2028 |
0.9 | |||||||||||||||
| Certificates of Deposit |
0.1 | RCRPBOFAS, 3.90%, 01/02/2026 |
0.8 | |||||||||||||||
| Total % of Portfolio |
12.2 | % | ||||||||||||||||
2 Holdings are subject to change. The holdings listed should not be considered recommendations to purchase or sell a particular security. Each individual security is calculated as a percentage of the aggregate market value of the securities held in the Fund and may include the use of derivative positions.
What were the Fund costs for the last year?
(Based on a hypothetical $10,000 investment)
| Costs of a $10,000 investment |
Costs paid as a percentage of a $10,000 investment |
|||||||
| Six Circles Managed Equity Portfolio U.S. Unconstrained Fund |
$7 | 0.06% | ||||||
How did the Fund perform? What affected the Fund’s performance?
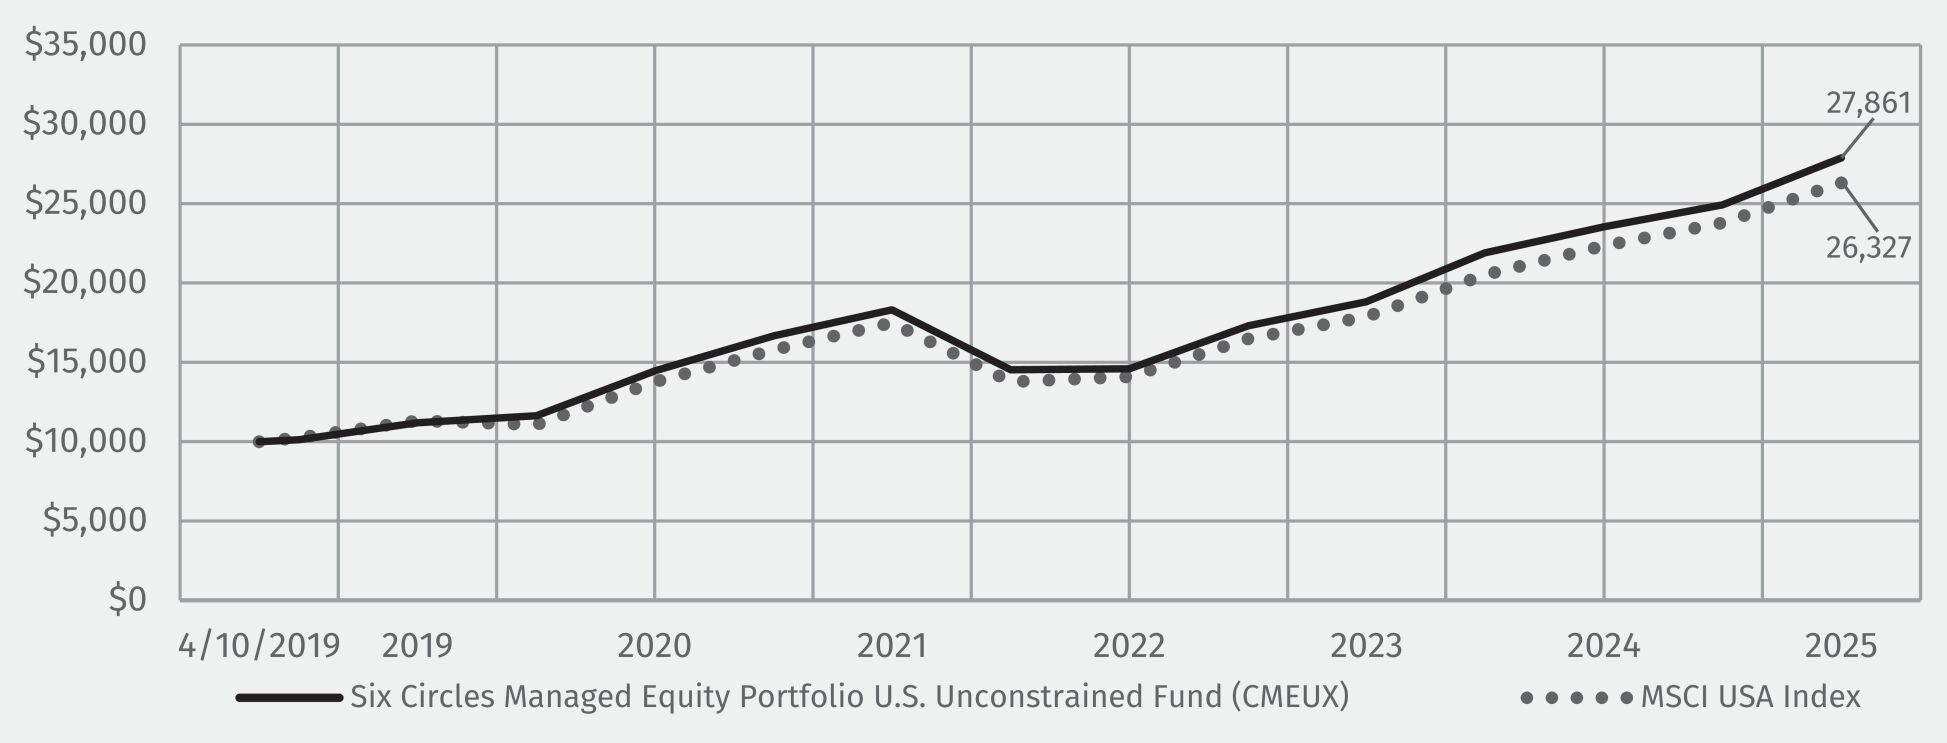
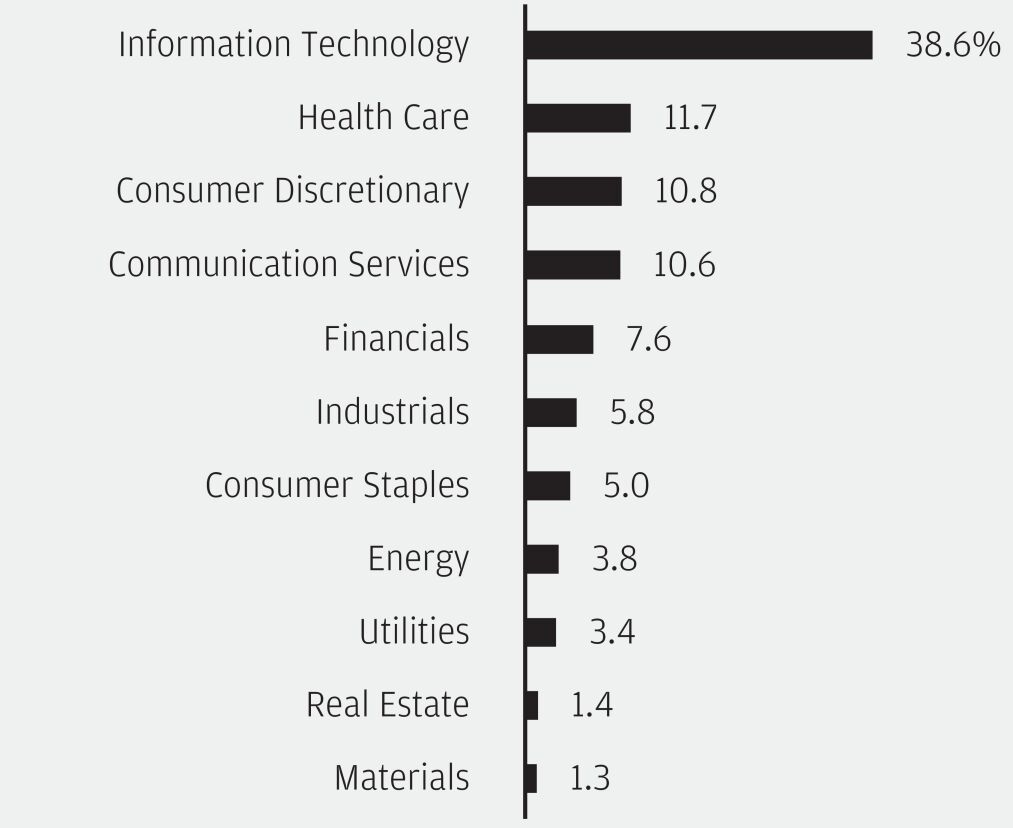
For the year ended December 31, 2025, the Fund returned 18.38%, while the MSCI USA Index (the “Index”) returned 17.75%.
| - | The Fund’s allocation to Information Technology and Communication Services were the leading contributors to the Fund’s absolute performance. |
| ○ | Select large cap technology-related companies in Software, Semiconductor, and Broadline Retail industries retain strong balance sheets and long-term earnings growth potential. The Advisor believes these companies are well-positioned to take advantage of opportunities in artificial intelligence. |
| - | Real Estate and Materials contributed the least to the Fund’s absolute performance. |
| - | The Fund employed equity futures in order to maintain market exposures during the reporting period. The use of equity futures contributed to the Fund’s absolute performance during the reporting period. |
Fund Performance
Average annual total returns:
| 1 Year | 5 Year | Since Inception (4/10/2019) |
||||||||||
| Six Circles Managed Equity Portfolio U.S. Unconstrained Fund |
18.38% | 14.04% | 16.46% | |||||||||
| MSCI USA Index |
17.75% | 13.87% | 15.48% | |||||||||
Key Fund Statistics
| Fund’s net assets (in thousands) | $ | 27,458,772 | ||
| Total number of portfolio holdings | 698 | |||
| Total advisory fees paid (in thousands) | $ | 57,059 | ||
| Portfolio turnover rate as of the end of the reporting period | 24.86% | |||
Graphical Representation of Holdings
The tables below show the investment make up of the Fund, representing a percentage of total net assets of the Fund.
| Sector Allocation1 | Top Ten Holdings2 |
| ||||||||
 |
NVIDIA Corp. |
8.6 | % | |||||||
| Microsoft Corp. |
7.5 | |||||||||
| Apple, Inc. |
6.7 | |||||||||
| Amazon.com, Inc. |
4.0 | |||||||||
| Alphabet, Inc., Class A |
3.3 | |||||||||
| Broadcom, Inc. |
2.8 | |||||||||
| Alphabet, Inc., Class C |
2.8 | |||||||||
| Meta Platforms, Inc., Class A |
2.6 | |||||||||
| Walmart, Inc. |
2.1 | |||||||||
| Eli Lilly & Co. |
1.9 | |||||||||
| Total % of Portfolio |
42.3 | % | ||||||||
1 Presented percentages may not sum to 100% due to rounding to the nearest percent.
2 Holdings are subject to change. The holdings listed should not be considered recommendations to purchase or sell a particular security. Each individual security is calculated as a percentage of the aggregate market value of the securities held in the Fund and may include the use of derivative positions.
| Sector Allocation1 | Top Ten Holdings2 |
| ||||||||
|
|
NVIDIA Corp. |
8.6 | % | |||||||
| Microsoft Corp. |
7.5 | |||||||||
| Apple, Inc. |
6.7 | |||||||||
| Amazon.com, Inc. |
4.0 | |||||||||
| Alphabet, Inc., Class A |
3.3 | |||||||||
| Broadcom, Inc. |
2.8 | |||||||||
| Alphabet, Inc., Class C |
2.8 | |||||||||
| Meta Platforms, Inc., Class A |
2.6 | |||||||||
| Walmart, Inc. |
2.1 | |||||||||
| Eli Lilly & Co. |
1.9 | |||||||||
| Total % of Portfolio |
42.3 | % | ||||||||
2 Holdings are subject to change. The holdings listed should not be considered recommendations to purchase or sell a particular security. Each individual security is calculated as a percentage of the aggregate market value of the securities held in the Fund and may include the use of derivative positions.
What were the Fund costs for the last year?
(Based on a hypothetical $10,000 investment)
| Costs of a $10,000 investment |
Costs paid as a percentage of a $10,000 investment |
|||||||
| Six Circles Managed Equity Portfolio International Unconstrained Fund |
$12 | 0.10% | ||||||
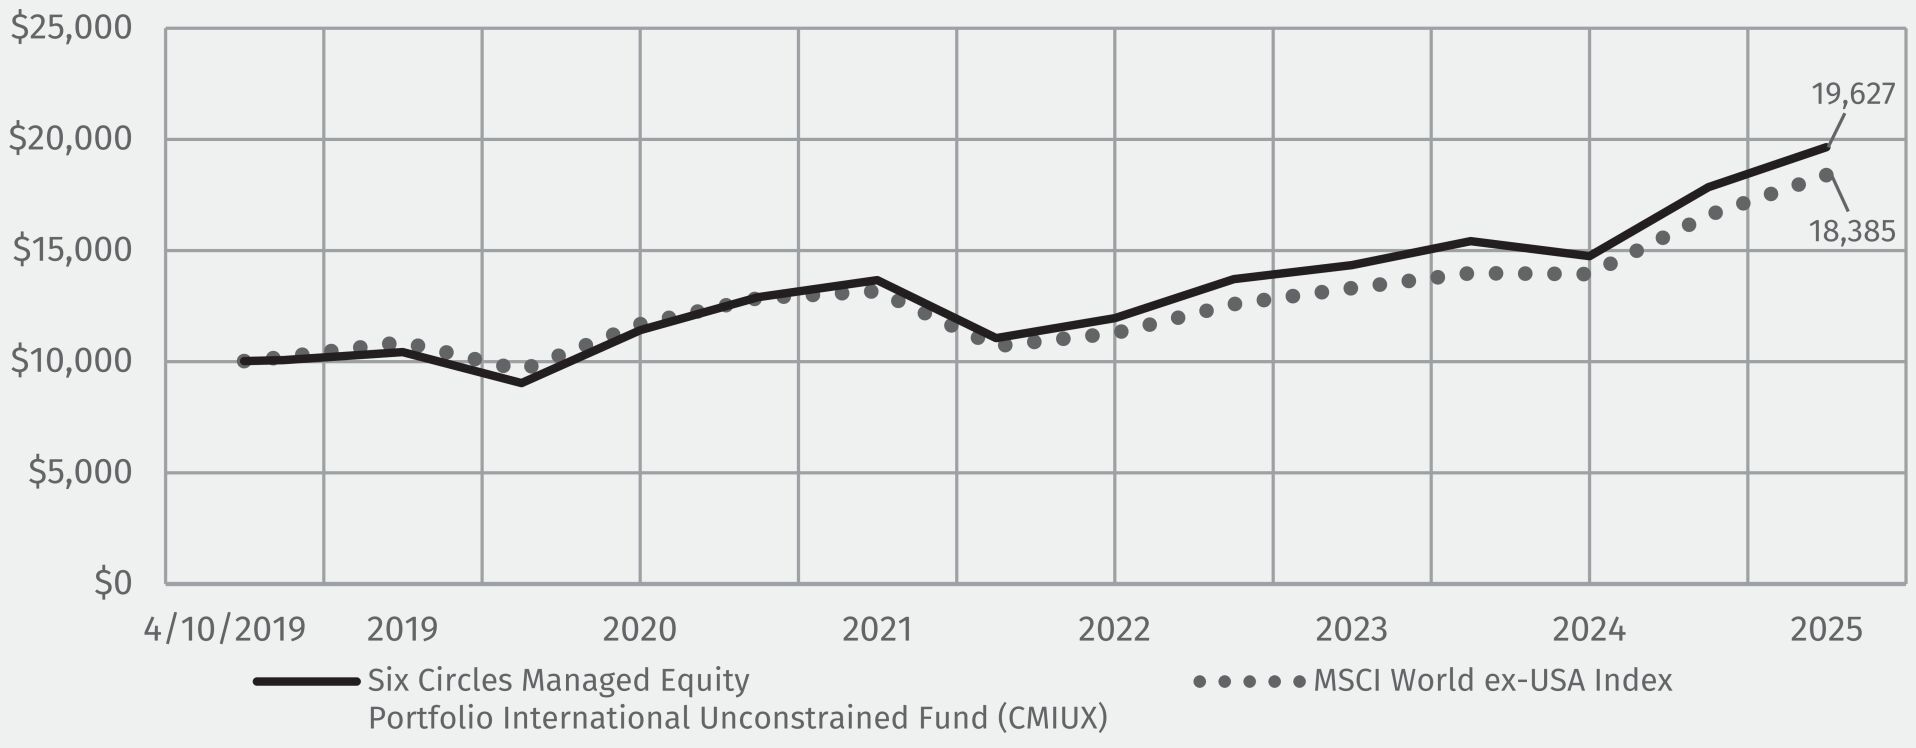
How did the Fund perform? What affected the Fund’s performance?
For the year ended December 31, 2025, the Fund returned 33.34%, while the MSCI World ex-USA Index (the “Index”) returned 31.85%.
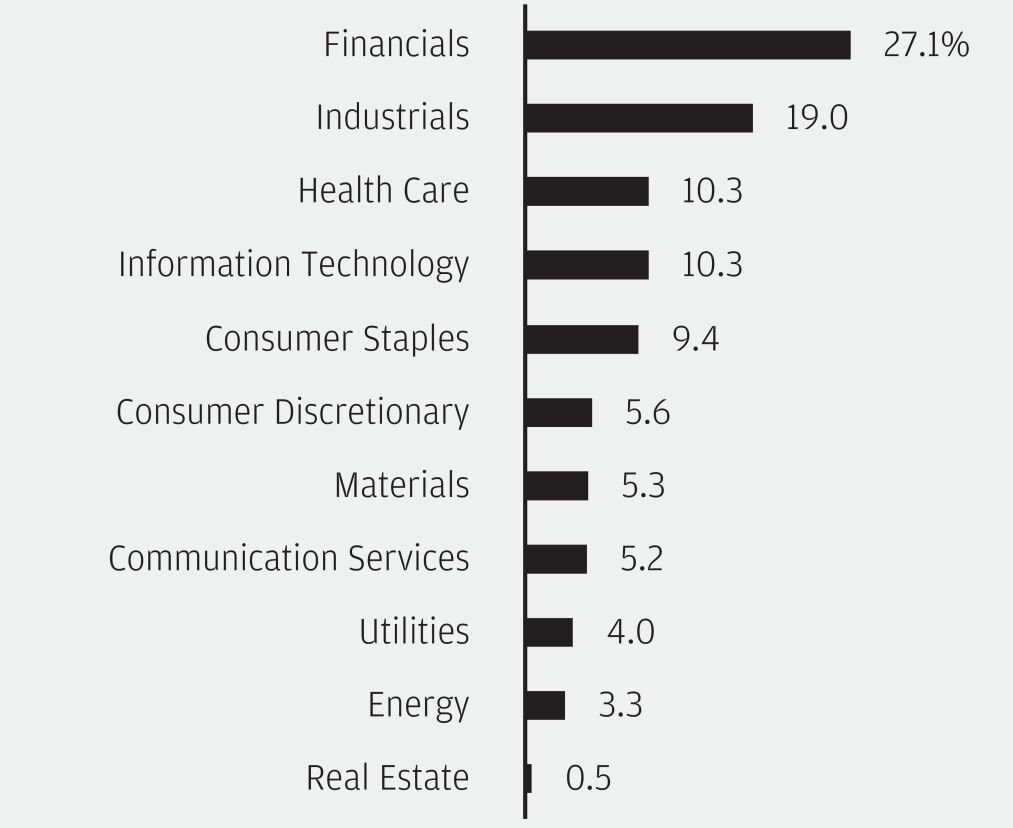
| - | The Fund’s allocation to Financials and Industrials were the leading contributors to the Fund’s absolute performance. |
| ○ | The Advisor believes that select companies within the Financials sector have strong fundamentals and can continue to perform well, if the expansion continues and recession is avoided. |
| - | Real Estate and Health Care were the lowest contributing sectors to the Fund’s absolute performance. |
| ○ | The Advisor believes that Health Care sector exposure trades at a valuation discount relative to the broad market and has defensive-like portfolio benefits, potentially offsetting some of the more growth-oriented exposures in the Fund. |
| - | The Fund employed equity futures in order to maintain market exposures during the reporting period. The use of equity futures contributed to the Fund’s absolute performance during the reporting period. |
Fund Performance
Average annual total returns:
| 1 Year | 5 Year | Since Inception (4/10/2019) |
||||||||||
| Six Circles Managed Equity Portfolio International Unconstrained Fund |
33.34% | 11.47% | 10.55% | |||||||||
| MSCI World ex-USA Index |
31.85% | 9.46% | 9.48% | |||||||||
Key Fund Statistics
| Fund’s net assets (in thousands) | $ | 12,188,462 | ||
| Total number of portfolio holdings | 2,060 | |||
| Total advisory fees paid (in thousands) | $ | 23,093 | ||
| Portfolio turnover rate as of the end of the reporting period | 40.24% | |||
Graphical Representation of Holdings
The tables below show the investment make up of the Fund, representing a percentage of total net assets of the Fund.
| Sector Allocation1 | Top Ten Holdings2 |
| ||||||||
 |
SAP SE |
2.6 | % | |||||||
| ASML Holding NV |
2.5 | |||||||||
| British American Tobacco plc |
2.2 | |||||||||
| Nestle SA (Registered) |
2.0 | |||||||||
| Rolls-Royce Holdings plc |
2.0 | |||||||||
| Deutsche Telekom AG |
1.9 | |||||||||
| Taiwan Semiconductor Manufacturing Co. Ltd. |
1.8 | |||||||||
| Siemens Energy AG |
1.8 | |||||||||
| Roche Holding AG |
1.7 | |||||||||
| HSBC Holdings plc |
1.7 | |||||||||
| Total % of Portfolio |
20.2 | % | ||||||||
1 Presented percentages may not sum to 100% due to rounding to the nearest percent.
2 Holdings are subject to change. The holdings listed should not be considered recommendations to purchase or sell a particular security. Each individual security is calculated as a percentage of the aggregate market value of the securities held in the Fund and may include the use of derivative positions.
| Sector Allocation1 | Top Ten Holdings2 |
| ||||||||
| |
SAP SE |
2.6 | % | |||||||
| ASML Holding NV |
2.5 | |||||||||
| British American Tobacco plc |
2.2 | |||||||||
| Nestle SA (Registered) |
2.0 | |||||||||
| Rolls-Royce Holdings plc |
2.0 | |||||||||
| Deutsche Telekom AG |
1.9 | |||||||||
| Taiwan Semiconductor Manufacturing Co. Ltd. |
1.8 | |||||||||
| Siemens Energy AG |
1.8 | |||||||||
| Roche Holding AG |
1.7 | |||||||||
| HSBC Holdings plc |
1.7 | |||||||||
| Total % of Portfolio |
20.2 | % | ||||||||
2 Holdings are subject to change. The holdings listed should not be considered recommendations to purchase or sell a particular security. Each individual security is calculated as a percentage of the aggregate market value of the securities held in the Fund and may include the use of derivative positions.
What were the Fund costs for the last year?
(Based on a hypothetical $10,000 investment)
| Costs of a $10,000 investment |
Costs paid as a percentage of a $10,000 investment |
|||||||
| Six Circles Global Bond Fund |
$13 | 0.13% | ||||||
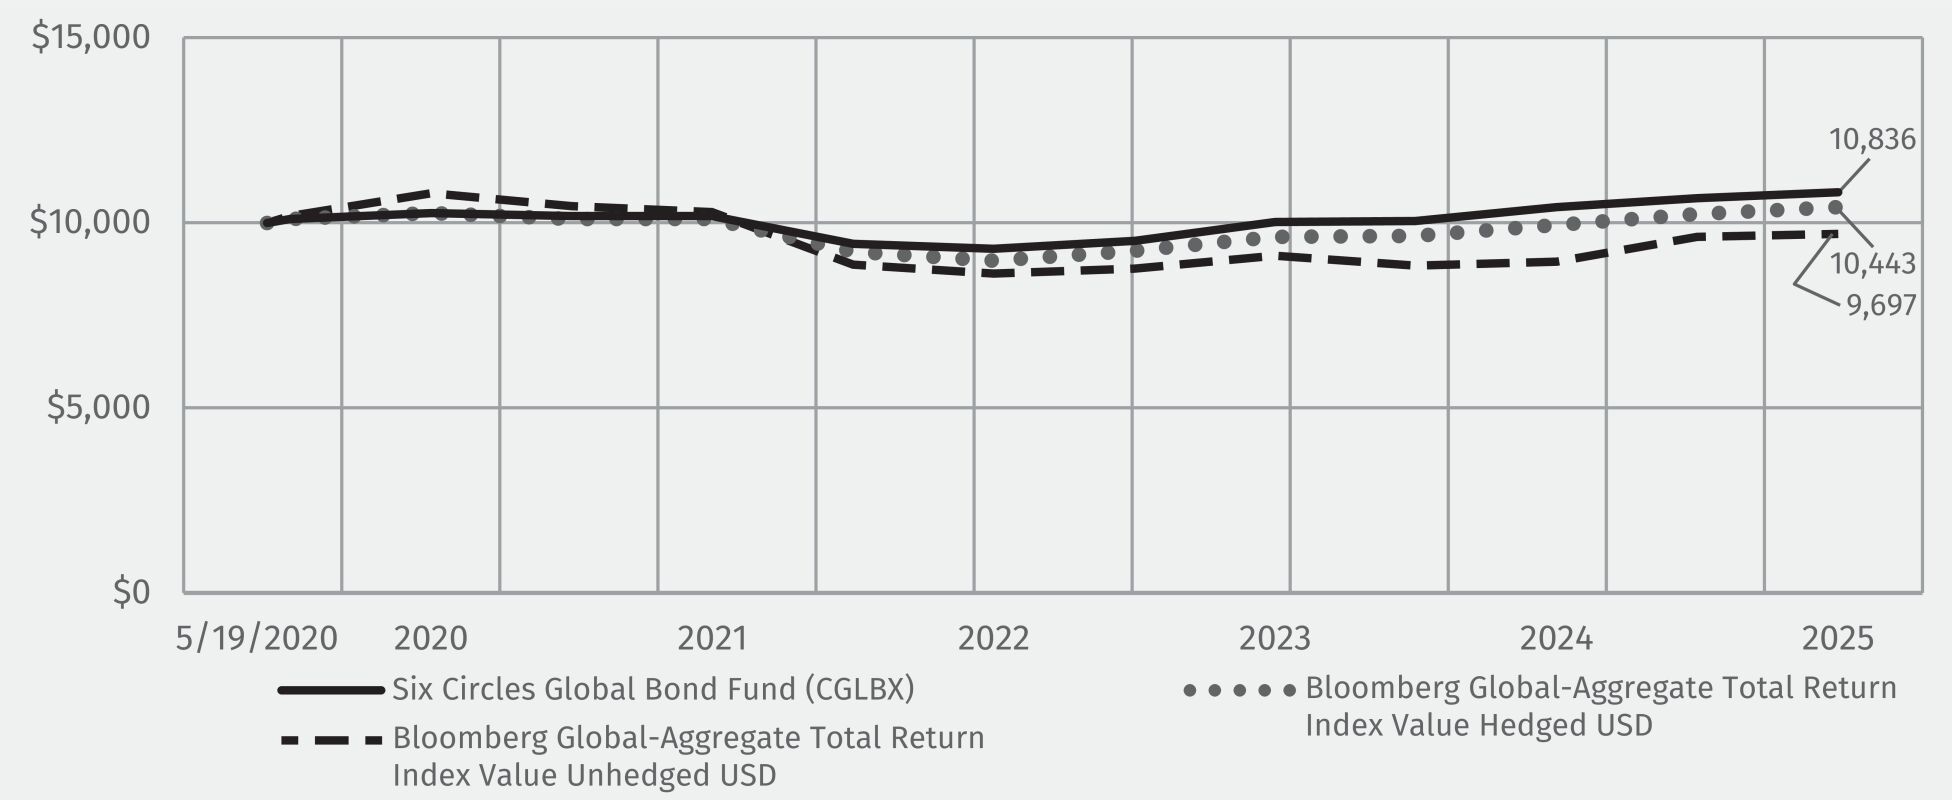
How did the Fund perform? What affected the Fund’s performance?
For the year ended December 31, 2025, the Fund returned 3.88%, whereas the Bloomberg Global-Aggregate Index - Hedged USD (the “Index”) returned 4.86%.
| - | Government and Investment Grade Credit within the Core Bonds allocation were the leading contributors to the Fund’s absolute performance. |
| ○ | The Advisor utilizes this allocation to provide attractive yields and carry benefits for the Fund. |
| - | The Fund’s allocation to derivatives was a leading detractor from the Fund’s absolute performance. |
Fund Performance
Average annual total returns:
| 1 Year | 5 Year | Since Inception (5/19/2020) |
||||||||||
| Six Circles Global Bond Fund |
3.88% | 1.08% | 1.44% | |||||||||
| Bloomberg Global-Aggregate Total Return Index Value Hedged USD |
4.86% | 0.34% | 0.77% | |||||||||
| Bloomberg Global-Aggregate Total Return Index Value Unhedged USD |
8.17% | -2.15% | -0.55% | |||||||||
Key Fund Statistics
| Fund’s net assets (in thousands) | $ | 16,344,135 | ||
| Total number of portfolio holdings | 7,152 | |||
| Total advisory fees paid (in thousands) | $ | 36,655 | ||
| Portfolio turnover rate as of the end of the reporting period | 158.83% | |||
Graphical Representation of Holdings
The tables below show the investment make up of the Fund, representing a percentage of total net assets of the Fund.
| Asset Type1 |
|
Top Ten Holdings2 |
|
|||||||||||||||
| Foreign Government Securities |
59.9 | % | FNMA or FHLMC, Single Family, 30 years, TBA, 6.00%, 03/01/2056 |
0.9 | % | |||||||||||||
| Mortgage-Backed Securities |
14.1 | U.S. Treasury Notes, 4.63%, 02/15/2035 |
0.8 | |||||||||||||||
| Corporate Bonds |
13.6 | U.S. Treasury Notes, 4.25%, 05/15/2035 |
0.8 | |||||||||||||||
| U.S. Treasury Obligations |
13.5 | U.S. Treasury Notes, 4.38%, 05/15/2034 |
0.8 | |||||||||||||||
| Short-Term Investments |
1.8 | U.S. Treasury Notes, 4.25%, 11/15/2034 |
0.8 | |||||||||||||||
| Collateralized Mortgage Obligations |
1.9 | China Government Bond, (China), 1.91%, 07/15/2029 |
0.8 | |||||||||||||||
| Asset-Backed Securities |
0.4 | U.S. Treasury Notes, 4.25%, 08/15/2035 |
0.8 | |||||||||||||||
| Commercial Mortgage-Backed Securities |
0.3 | U.S. Treasury Notes, 4.00%, 02/15/2034 |
0.7 | |||||||||||||||
| Municipal Bonds |
0.1 | U.S. Treasury Notes, 3.88%, 08/15/2034 |
0.7 | |||||||||||||||
| U.S. Government Agency Securities |
0.1 | U.S. Treasury Notes, 4.50%, 11/15/2033 |
0.7 | |||||||||||||||
| Total % of Portfolio |
7.8 | % | ||||||||||||||||
1 Presented percentages may not sum to 100% due to rounding to the nearest percent.
2 Holdings are subject to change. The holdings listed should not be considered recommendations to purchase or sell a particular security. Each individual security is calculated as a percentage of the aggregate market value of the securities held in the Fund and may include the use of derivative positions.
| Asset Type1 |
|
Top Ten Holdings2 |
|
|||||||||||||||
| Foreign Government Securities |
59.9 | % | FNMA or FHLMC, Single Family, 30 years, TBA, 6.00%, 03/01/2056 |
0.9 | % | |||||||||||||
| Mortgage-Backed Securities |
14.1 | U.S. Treasury Notes, 4.63%, 02/15/2035 |
0.8 | |||||||||||||||
| Corporate Bonds |
13.6 | U.S. Treasury Notes, 4.25%, 05/15/2035 |
0.8 | |||||||||||||||
| U.S. Treasury Obligations |
13.5 | U.S. Treasury Notes, 4.38%, 05/15/2034 |
0.8 | |||||||||||||||
| Short-Term Investments |
1.8 | U.S. Treasury Notes, 4.25%, 11/15/2034 |
0.8 | |||||||||||||||
| Collateralized Mortgage Obligations |
1.9 | China Government Bond, (China), 1.91%, 07/15/2029 |
0.8 | |||||||||||||||
| Asset-Backed Securities |
0.4 | U.S. Treasury Notes, 4.25%, 08/15/2035 |
0.8 | |||||||||||||||
| Commercial Mortgage-Backed Securities |
0.3 | U.S. Treasury Notes, 4.00%, 02/15/2034 |
0.7 | |||||||||||||||
| Municipal Bonds |
0.1 | U.S. Treasury Notes, 3.88%, 08/15/2034 |
0.7 | |||||||||||||||
| U.S. Government Agency Securities |
0.1 | U.S. Treasury Notes, 4.50%, 11/15/2033 |
0.7 | |||||||||||||||
| Total % of Portfolio |
7.8 | % | ||||||||||||||||
2 Holdings are subject to change. The holdings listed should not be considered recommendations to purchase or sell a particular security. Each individual security is calculated as a percentage of the aggregate market value of the securities held in the Fund and may include the use of derivative positions.
What were the Fund costs for the last year?
(Based on a hypothetical $10,000 investment)
| Costs of a $10,000 investment |
Costs paid as a percentage of a $10,000 investment |
|||||||
| Six Circles Tax Aware Bond Fund |
$13 | 0.13% | ||||||
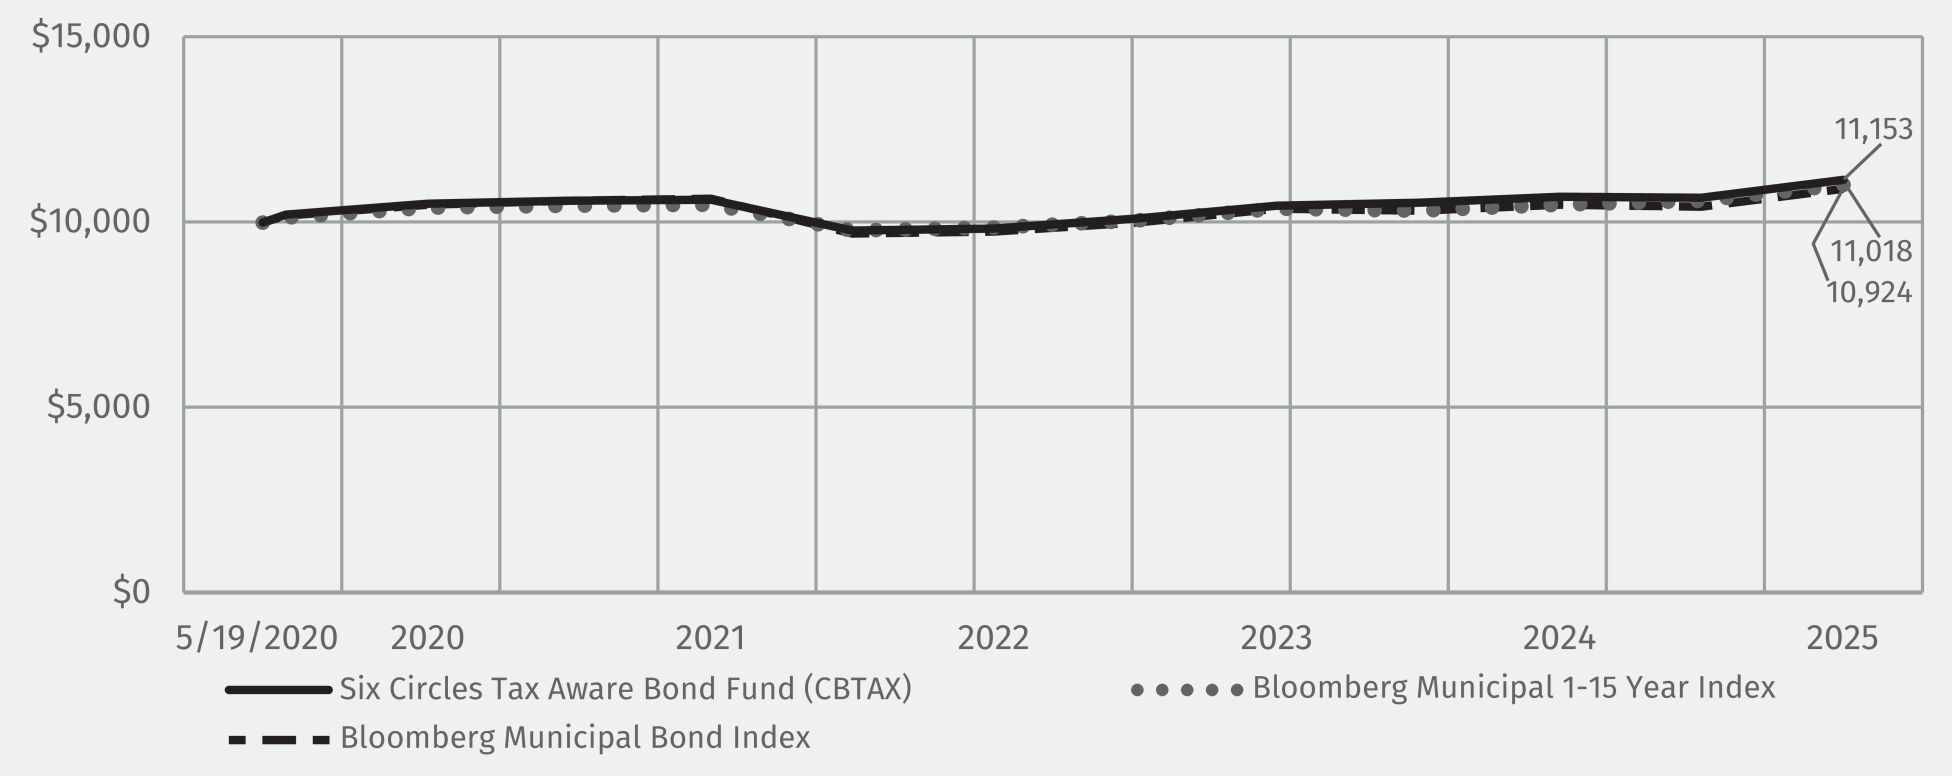
How did the Fund perform? What affected the Fund’s performance?
For the year ended December 31, 2025, the Fund returned 4.13%, while the Bloomberg 1-15 Year Municipal Bond Index (the “Index”) returned 5.18%.
| - | The Fund’s allocation to Municipal bonds within the Core Bonds allocation and High Yield Municipal Bonds allocation were the leading contributors to the Fund’s absolute performance. |
| - | Longer dated Municipal bonds within Core Bonds contributed the least to absolute fund performance as the long end of the Municipal curve underperformed in 2025. |
Fund Performance
Average annual total returns:
| 1 Year | 5 Year | Since Inception (5/19/2020) |
||||||||||
| Six Circles Tax Aware Bond Fund |
4.13% | 1.21% | 1.96% | |||||||||
| Bloomberg Municipal 1-15 Year Index |
5.18% | 1.16% | 1.74% | |||||||||
| Bloomberg Municipal Bond Index |
4.25% | 0.80% | 1.59% | |||||||||
Key Fund Statistics
| Fund’s net assets (in thousands) | $ | 14,386,304 | ||
| Total number of portfolio holdings | 4,444 | |||
| Total advisory fees paid (in thousands) | $ | 31,897 | ||
| Portfolio turnover rate as of the end of the reporting period | 17.57% | |||
Graphical Representation of Holdings
The tables below show the investment make up of the Fund, representing a percentage of total net assets of the Fund.
| Asset Type1 |
Top Ten Holdings2 |
|
||||||||||||||||
| Municipal Bonds |
|
98.1 |
% |
Black Belt Energy Gas District, Series B, Rev., 5.00%, 10/01/2035 |
|
0.4 |
% |
|||||||||||
| Short-Term Investments |
|
0.9 |
|
Southeast Energy Authority, A Cooperative District, Series F, Rev., 5.25%, 11/01/2055 |
|
0.3 |
|
|||||||||||
| Other |
|
0.9 |
|
Texas Transportation Finance Corp., Subordinated Bond SH 288 System, Rev., 5.25%, 10/01/2050 |
|
0.3 |
|
|||||||||||
| Commonwealth Financing Authority, Tobacco Master Settlement Payment, Rev., 4.00%, 06/01/2039 |
|
0.3 |
|
|||||||||||||||
| California Community Choice Financing Authority, Sustainable Bonds Clean Energy, Rev., 5.00%, 01/01/2056 |
0.2 | |||||||||||||||||
| Central Plains Energy Project, Series A1, Rev., 5.00%, 08/01/2055 |
0.2 | |||||||||||||||||
| Colorado Health Facilities Authority, Rev., 5.00%, 05/15/2054 |
0.2 | |||||||||||||||||
| Main Street Natural Gas, Inc.., Series D, Rev., 5.00%, 04/01/2054 |
0.2 | |||||||||||||||||
| New York Liberty Development Corp., World Trade Center Project, Series 1, Rev., 5.00%, 11/15/2044 |
0.2 | |||||||||||||||||
| Southern California Public Power Authority, Rev., 5.00%, 04/01/2055 |
0.2 | |||||||||||||||||
| Total % of Portfolio |
2.5 | % | ||||||||||||||||
1 Presented percentages may not sum to 100% due to rounding to the nearest percent.
2 Holdings are subject to change. The holdings listed should not be considered recommendations to purchase or sell a particular security. Each individual security is calculated as a percentage of the aggregate market value of the securities held in the Fund and may include the use of derivative positions.
| Asset Type1 |
Top Ten Holdings2 |
|
||||||||||||||||
| Municipal Bonds |
|
98.1 |
% |
Black Belt Energy Gas District, Series B, Rev., 5.00%, 10/01/2035 |
|
0.4 |
% |
|||||||||||
| Short-Term Investments |
|
0.9 |
|
Southeast Energy Authority, A Cooperative District, Series F, Rev., 5.25%, 11/01/2055 |
|
0.3 |
|
|||||||||||
| Other |
|
0.9 |
|
Texas Transportation Finance Corp., Subordinated Bond SH 288 System, Rev., 5.25%, 10/01/2050 |
|
0.3 |
|
|||||||||||
| Commonwealth Financing Authority, Tobacco Master Settlement Payment, Rev., 4.00%, 06/01/2039 |
|
0.3 |
|
|||||||||||||||
| California Community Choice Financing Authority, Sustainable Bonds Clean Energy, Rev., 5.00%, 01/01/2056 |
0.2 | |||||||||||||||||
| Central Plains Energy Project, Series A1, Rev., 5.00%, 08/01/2055 |
0.2 | |||||||||||||||||
| Colorado Health Facilities Authority, Rev., 5.00%, 05/15/2054 |
0.2 | |||||||||||||||||
| Main Street Natural Gas, Inc.., Series D, Rev., 5.00%, 04/01/2054 |
0.2 | |||||||||||||||||
| New York Liberty Development Corp., World Trade Center Project, Series 1, Rev., 5.00%, 11/15/2044 |
0.2 | |||||||||||||||||
| Southern California Public Power Authority, Rev., 5.00%, 04/01/2055 |
0.2 | |||||||||||||||||
| Total % of Portfolio |
2.5 | % | ||||||||||||||||
2 Holdings are subject to change. The holdings listed should not be considered recommendations to purchase or sell a particular security. Each individual security is calculated as a percentage of the aggregate market value of the securities held in the Fund and may include the use of derivative positions.
What were the Fund costs for the last year?
(Based on a hypothetical $10,000 investment)
| Costs of a $10,000 investment |
Costs paid as a percentage of a $10,000 investment |
|||||||
| Six Circles Credit Opportunities Fund |
$26 | 0.25% | ||||||
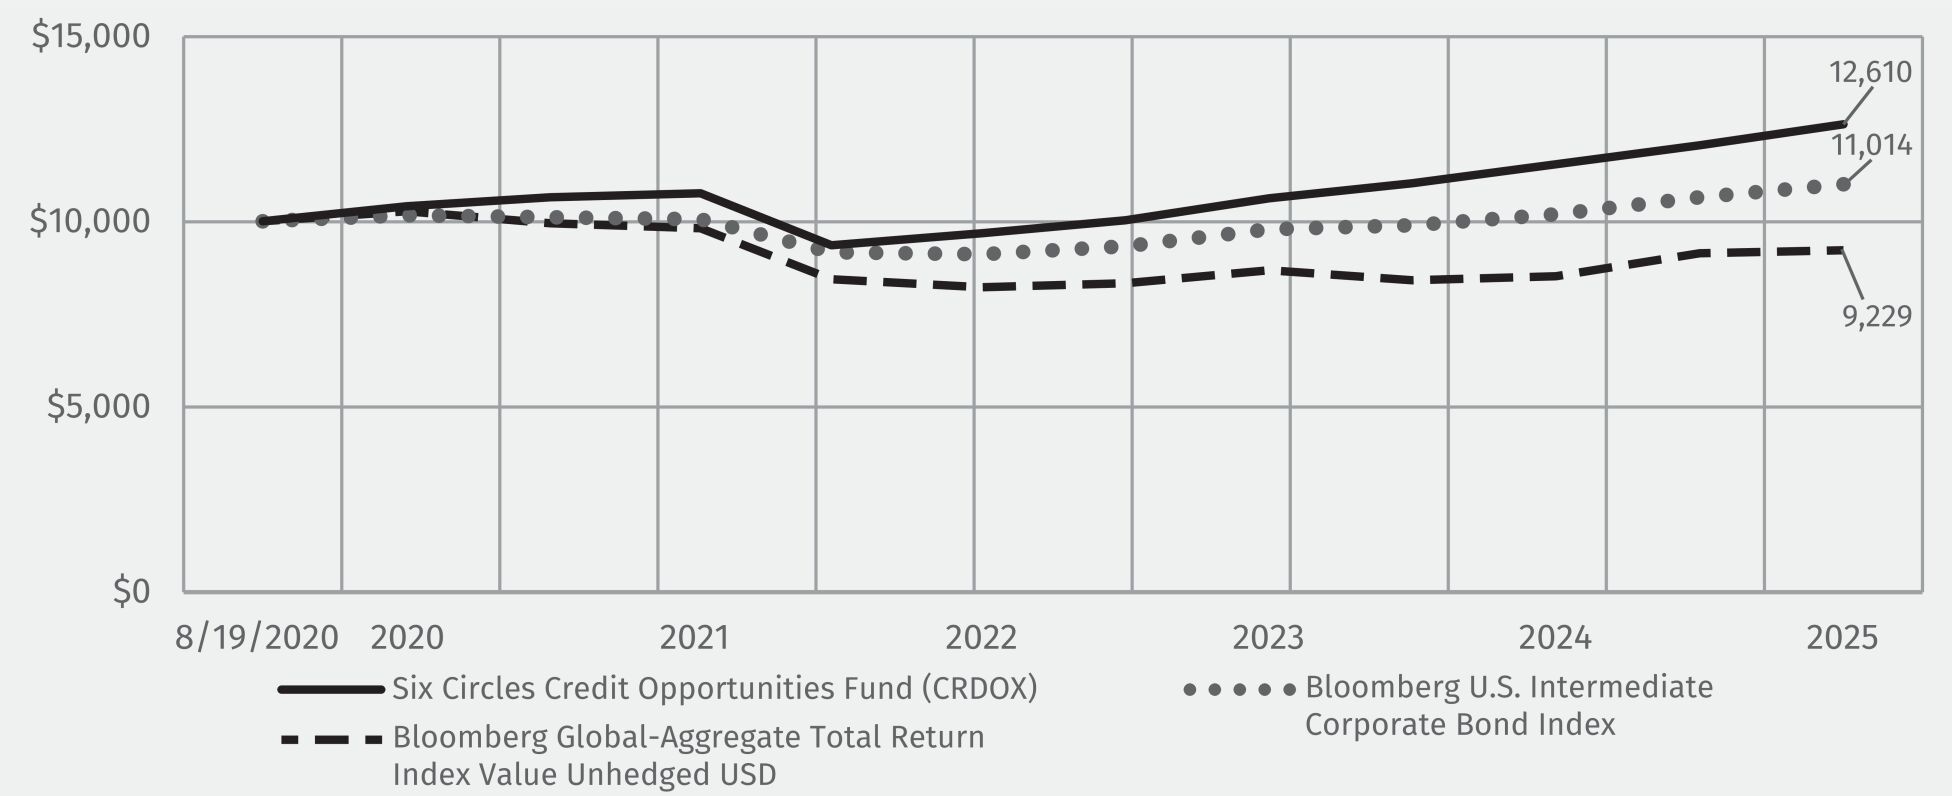
How did the Fund perform? What affected the Fund’s performance?
For the year ended December 31, 2025, the Fund returned 9.33%, while the Bloomberg U.S. Intermediate Corporate Bond Index (the “Index”) returned 7.95%.
| - | The Fund’s allocation to Emerging Markets within the Extended Credit allocation and Investment Grade Credit within the Core Bonds allocation were the leading contributors to the Fund’s absolute performance. |
| ○ | The Advisor believes that stepping into lower rated U.S. dollar denominated Emerging Market Debt Fixed Income instruments allows the portfolio to pick up additional yield. |
| - | Futures within derivatives was a leading detractor from the Fund’s absolute performance. |
| ○ | The Fund employed fixed income futures contracts in order to maintain market exposures during the reporting period. |
Fund Performance
Average annual total returns:
| 1 Year | 5 Year | Since Inception (8/19/2020) |
||||||||||
| Six Circles Credit Opportunities Fund |
9.33% | 3.91% | 4.42% | |||||||||
| Bloomberg U.S. Intermediate Corporate Bond Index |
7.95% | 1.60% | 1.82% | |||||||||
| Bloomberg Global-Aggregate Total Return Index Value Unhedged USD |
8.17% | -2.15% | -1.48% | |||||||||
Key Fund Statistics
| Fund’s net assets (in thousands) | $ | 5,064,809 | ||
| Total number of portfolio holdings | 3,835 | |||
| Total advisory fees paid (in thousands) | $ | 59,264 | ||
| Portfolio turnover rate as of the end of the reporting period | 69.13% | |||
Graphical Representation of Holdings
The tables below show the investment make up of the Fund, representing a percentage of total net assets of the Fund.
| Asset Type1 |
|
Top Ten Holdings2 |
|
|||||||||||||||
| Corporate Bonds |
|
69.2 |
% |
Argentine Republic Government International Bond, (Argentina), SUB, 3.50%, 07/09/2041 |
|
0.6 |
% |
|||||||||||
| Foreign Government Securities |
|
16.4 |
|
Beignet Investor LLC, 6.58%, 05/30/2049 |
|
0.6 |
|
|||||||||||
| Loan Assignments |
|
3.7 |
|
Gaci First Investment Co., (Cayman Islands), Reg. S, 5.25%, 10/13/2032 |
|
0.4 |
|
|||||||||||
| Asset-Backed Securities |
|
2.3 |
|
Egypt Government International Bond, (Egypt), Reg. S, 6.38%, 04/11/2031 |
|
0.4 |
|
|||||||||||
| Short-Term Investments |
|
2.6 |
|
Oman Government International Bond, (Oman), Reg. S, 6.25%, 01/25/2031 |
|
0.3 |
|
|||||||||||
| U.S. Treasury Obligations |
|
1.0 |
|
U.S. Treasury Notes, 3.63%, 08/31/2027 |
|
0.3 |
|
|||||||||||
| Commercial Mortgage-Backed Securities |
|
0.8 |
|
Petroleos Mexicanos, (Mexico), 6.35%, 02/12/2048 |
|
0.3 |
|
|||||||||||
| Common Stocks |
|
0.4 |
|
Nigeria Government International Bond, (Nigeria), Reg. S, 7.38%, 09/28/2033 |
|
0.3 |
|
|||||||||||
| Collateralized Mortgage Obligations |
|
0.2 |
|
Grifols SA, (Spain), Reg. S, 3.88%, 10/15/2028 |
|
0.3 |
|
|||||||||||
| Preferred Stocks |
|
0.2 |
|
Bellis Acquisition Co. plc , (United Kingdom), Reg. S, 8.13%, 05/14/2030 |
|
0.3 |
|
|||||||||||
| Convertible Bonds |
|
0.1 |
|
Total % of Portfolio |
|
3.8 |
% |
|||||||||||
| Mortgage-Backed Securities |
|
0.1 |
|
|||||||||||||||
| Warrant |
|
0.0 |
|
|||||||||||||||
1 Presented percentages may not sum to 100% due to rounding to the nearest percent.
2 Holdings are subject to change. The holdings listed should not be considered recommendations to purchase or sell a particular security. Each individual security is calculated as a percentage of the aggregate market value of the securities held in the Fund and may include the use of derivative positions.
| Asset Type1 |
|
Top Ten Holdings2 |
|
|||||||||||||||
| Corporate Bonds |
|
69.2 |
% |
Argentine Republic Government International Bond, (Argentina), SUB, 3.50%, 07/09/2041 |
|
0.6 |
% |
|||||||||||
| Foreign Government Securities |
|
16.4 |
|
Beignet Investor LLC, 6.58%, 05/30/2049 |
|
0.6 |
|
|||||||||||
| Loan Assignments |
|
3.7 |
|
Gaci First Investment Co., (Cayman Islands), Reg. S, 5.25%, 10/13/2032 |
|
0.4 |
|
|||||||||||
| Asset-Backed Securities |
|
2.3 |
|
Egypt Government International Bond, (Egypt), Reg. S, 6.38%, 04/11/2031 |
|
0.4 |
|
|||||||||||
| Short-Term Investments |
|
2.6 |
|
Oman Government International Bond, (Oman), Reg. S, 6.25%, 01/25/2031 |
|
0.3 |
|
|||||||||||
| U.S. Treasury Obligations |
|
1.0 |
|
U.S. Treasury Notes, 3.63%, 08/31/2027 |
|
0.3 |
|
|||||||||||
| Commercial Mortgage-Backed Securities |
|
0.8 |
|
Petroleos Mexicanos, (Mexico), 6.35%, 02/12/2048 |
|
0.3 |
|
|||||||||||
| Common Stocks |
|
0.4 |
|
Nigeria Government International Bond, (Nigeria), Reg. S, 7.38%, 09/28/2033 |
|
0.3 |
|
|||||||||||
| Collateralized Mortgage Obligations |
|
0.2 |
|
Grifols SA, (Spain), Reg. S, 3.88%, 10/15/2028 |
|
0.3 |
|
|||||||||||
| Preferred Stocks |
|
0.2 |
|
Bellis Acquisition Co. plc , (United Kingdom), Reg. S, 8.13%, 05/14/2030 |
|
0.3 |
|
|||||||||||
| Convertible Bonds |
|
0.1 |
|
Total % of Portfolio |
|
3.8 |
% |
|||||||||||
| Mortgage-Backed Securities |
|
0.1 |
|
|||||||||||||||
| Warrant |
|
0.0 |
|
|||||||||||||||
2 Holdings are subject to change. The holdings listed should not be considered recommendations to purchase or sell a particular security. Each individual security is calculated as a percentage of the aggregate market value of the securities held in the Fund and may include the use of derivative positions.
Material Fund Changes
During the period, the Six Circles Credit Opportunities Fund appointed Muzinich & Co., Inc. (“Muzinich”), Mellon Investments Corporation (“Mellon”) and Insight North America LLC (“Insight”) as additional sub-advisers to the Fund. Muzinich and Insight have been allocated assets within the Fund and hold a 10% and 5% allocation respectively as of December 31, 2025. Mellon has not been allocated assets.
The appointment did not result is any change to the Fund’s investment objective or strategy.
During the period, the Six Circles Credit Opportunities Fund appointed Muzinich & Co., Inc. (“Muzinich”), Mellon Investments Corporation (“Mellon”) and Insight North America LLC (“Insight”) as additional sub-advisers to the Fund. Muzinich and Insight have been allocated assets within the Fund and hold a 10% and 5% allocation respectively as of December 31, 2025. Mellon has not been allocated assets.
What were the Fund costs for the last year?
(Based on a hypothetical $10,000 investment)
| Costs of a $10,000 investment |
Costs paid as a percentage of a $10,000 investment |
|||||||
| Six Circles Multi-Strategy Fund |
$95 | 0.92% | ||||||
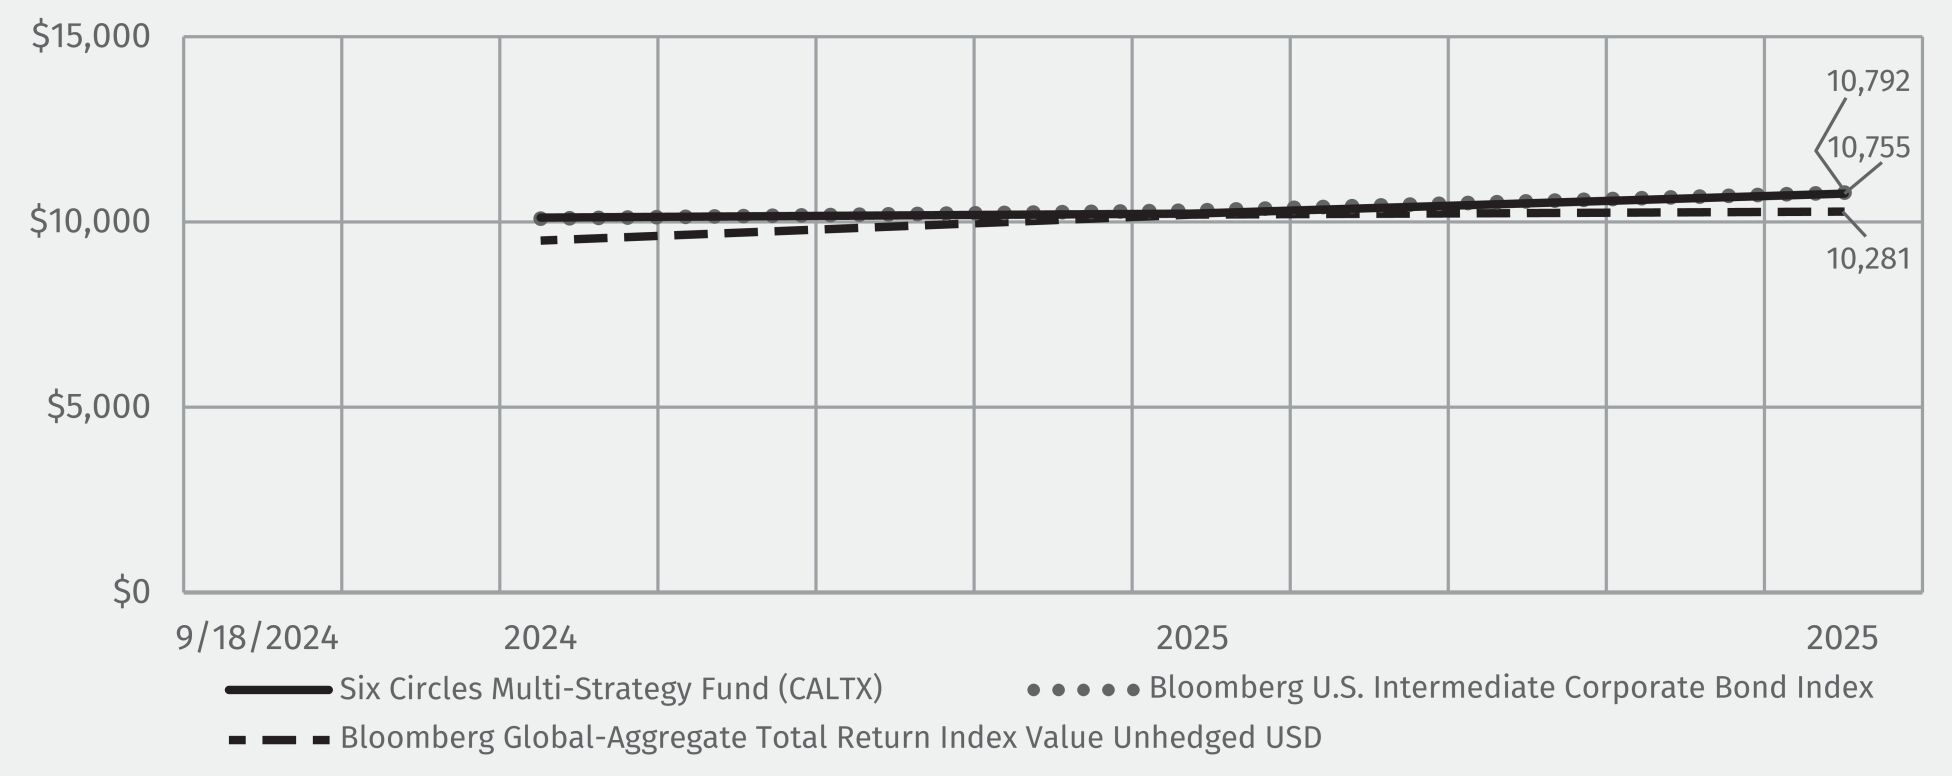
How did the Fund perform? What affected the Fund’s performance?
For the year ended December 31, 2025, the Fund returned 6.38%, whereas the HFRX Global Hedge Fund Index (the “Index”) returned 7.14%.
| - | The Fund’s underlying Sub-Advisors all contributed positively to performance, with allocations to Mortgage-Backed Securities-related strategies contributing the most to Fund absolute performance. |
| ○ | The Advisor believed mortgages provided attractive carry opportunities to the Fund and would benefit from the expected tightening of MBS spreads. The Fund also captured incremental value from the strategy’s active management of duration. |
| - | The Fund’s allocations to Equity Market Neutral strategies helped drive performance, as one Sub-Advisor, added to the Fund in May 2025, achieved high double-digit returns for the year. |
| ○ | The Advisor believed the strategy would help diversify Fund allocations through non-directional long/short exposures, through the use of swaps and index futures, and benefit from an environment of greater equity dispersion. The Sub-Advisor implementing the strategy demonstrated robust risk management in response to market volatility that further contributed to the Fund’s performance. |
Fund Performance
Average annual total returns:
| 1 Year | Since Inception (9/18/2024) |
|||||||
| Six Circles Multi-Strategy Fund |
6.38% | 5.83% | ||||||
| HFRX Global Hedge Fund Index |
7.14% | 6.11% | ||||||
| Bloomberg Global-Aggregate Total Return Index Value Unhedged USD |
8.17% | -1.48% | ||||||
Key Fund Statistics
| Fund’s net assets (in thousands) | $ | 1,583,978 | ||
| Total number of portfolio holdings | 11,659 | |||
| Total advisory fees paid (in thousands) | $ | 13,893 | ||
| Portfolio turnover rate as of the end of the reporting period | 652.39% | |||
Graphical Representation of Holdings
The tables below show the investment make up of the Fund, representing a percentage of total net assets of the Fund.
| Asset Type1 |
|
Top Ten Holdings2 |
|
|||||||||||||||
| Short-Term Investments |
|
39.1 |
% |
U.S. Treasury Bills, 3.60%, 01/29/2026 |
|
12.9 |
% |
|||||||||||
| Mortgage-Backed Securities |
|
35.4 |
|
FNMA or FHLMC, Single Family, 30 years, TBA, 5.50%, 02/01/2056 |
|
4.7 |
|
|||||||||||
| Collateralized Mortgage Obligations |
|
20.1 |
|
FNMA or FHLMC, Single Family, 30 years, TBA, 6.00%, 03/01/2056 |
|
3.6 |
|
|||||||||||
| Loan Assignments |
|
17.4 |
|
FNMA or FHLMC, Single Family, 30 years, TBA, 6.50%, 02/01/2056 |
|
2.6 |
|
|||||||||||
| Asset-backed Securities |
|
8.1 |
|
FNMA or FHLMC, Single Family, 30 years, TBA, 7.00%, 01/01/2056 |
|
2.1 |
|
|||||||||||
| Corporate Bonds |
|
2.2 |
|
U.S. Treasury Bills, 3.71%, 03/19/2026 |
|
1.8 |
|
|||||||||||
| Commercial Mortgage-Backed Securities |
|
1.4 |
|
U.S. Treasury Bills, 3.77%, 03/05/2026 |
|
1.7 |
|
|||||||||||
| Convertible Bond |
|
0.1 |
|
FNMA or FHLMC, Single Family, 30 years, TBA, 6.00%, 02/01/2056 |
|
1.6 |
|
|||||||||||
| Preferred Stock |
|
0.0 |
|
GNMA, Single Family, 30 years, TBA, 4.50%, 02/01/2056 |
|
1.3 |
|
|||||||||||
| U.S. Treasury Obligations |
|
0.0 |
|
GNMA, Single Family, 30 years, TBA, 4.00%, 02/01/2056 |
|
1.2 |
|
|||||||||||
| Total % of Portfolio |
33.5 | % | ||||||||||||||||
1 Presented percentages may not sum to 100% due to rounding to the nearest percent.
2 Holdings are subject to change. The holdings listed should not be considered recommendations to purchase or sell a particular security. Each individual security is calculated as a percentage of the aggregate market value of the securities held in the Fund and may include the use of derivative positions.
| Asset Type1 |
|
Top Ten Holdings2 |
|
|||||||||||||||
| Short-Term Investments |
|
39.1 |
% |
U.S. Treasury Bills, 3.60%, 01/29/2026 |
|
12.9 |
% |
|||||||||||
| Mortgage-Backed Securities |
|
35.4 |
|
FNMA or FHLMC, Single Family, 30 years, TBA, 5.50%, 02/01/2056 |
|
4.7 |
|
|||||||||||
| Collateralized Mortgage Obligations |
|
20.1 |
|
FNMA or FHLMC, Single Family, 30 years, TBA, 6.00%, 03/01/2056 |
|
3.6 |
|
|||||||||||
| Loan Assignments |
|
17.4 |
|
FNMA or FHLMC, Single Family, 30 years, TBA, 6.50%, 02/01/2056 |
|
2.6 |
|
|||||||||||
| Asset-backed Securities |
|
8.1 |
|
FNMA or FHLMC, Single Family, 30 years, TBA, 7.00%, 01/01/2056 |
|
2.1 |
|
|||||||||||
| Corporate Bonds |
|
2.2 |
|
U.S. Treasury Bills, 3.71%, 03/19/2026 |
|
1.8 |
|
|||||||||||
| Commercial Mortgage-Backed Securities |
|
1.4 |
|
U.S. Treasury Bills, 3.77%, 03/05/2026 |
|
1.7 |
|
|||||||||||
| Convertible Bond |
|
0.1 |
|
FNMA or FHLMC, Single Family, 30 years, TBA, 6.00%, 02/01/2056 |
|
1.6 |
|
|||||||||||
| Preferred Stock |
|
0.0 |
|
GNMA, Single Family, 30 years, TBA, 4.50%, 02/01/2056 |
|
1.3 |
|
|||||||||||
| U.S. Treasury Obligations |
|
0.0 |
|
GNMA, Single Family, 30 years, TBA, 4.00%, 02/01/2056 |
|
1.2 |
|
|||||||||||
| Total % of Portfolio |
33.5 | % | ||||||||||||||||
2 Holdings are subject to change. The holdings listed should not be considered recommendations to purchase or sell a particular security. Each individual security is calculated as a percentage of the aggregate market value of the securities held in the Fund and may include the use of derivative positions.
Material Fund Changes
During the period, the Six Circles Multi-Strategy Fund appointed BlackRock Investment Management, LLC (“BlackRock”) and Capital Fund Management S.A. (“CFM”) as additional sub-advisers to the Fund. BlackRock and CFM have been allocated assets within the Fund and hold a 12% and 8% allocation respectively as of December 31, 2025. The appointment of the two new sub-advisers and their targeted investment exposure resulted in an increase in the Fund’s Total Expense Ratio of approximately 21 basis points. The Fund’s Total Expense Ratio as of December 31, 2025 was 92 basis points.
The fund changes outlined above did not result is any change to the Fund’s investment objective or strategy.
During the period, the Six Circles Multi-Strategy Fund appointed BlackRock Investment Management, LLC (“BlackRock”) and Capital Fund Management S.A. (“CFM”) as additional sub-advisers to the Fund. BlackRock and CFM have been allocated assets within the Fund and hold a 12% and 8% allocation respectively as of December 31, 2025. The appointment of the two new sub-advisers and their targeted investment exposure resulted in an increase in the Fund’s Total Expense Ratio of approximately 21 basis points. The Fund’s Total Expense Ratio as of December 31, 2025 was 92 basis points.