Shareholder Report
Dec. 31, 2025
USD ($)
$ / shares
WHAT WERE THE FUND COSTS FOR THE PAST YEAR? (based on a hypothetical $10,000 investment)
|
Fund Name
|
Costs of a $10,000 investment
|
Costs paid as a percentage of a $10,000 investment
|
|
Roundhill Ball Metaverse ETF
|
$67
|
0.58%
|
HOW DID THE FUND PERFORM LAST YEAR AND WHAT AFFECTED ITS PERFORMANCE?
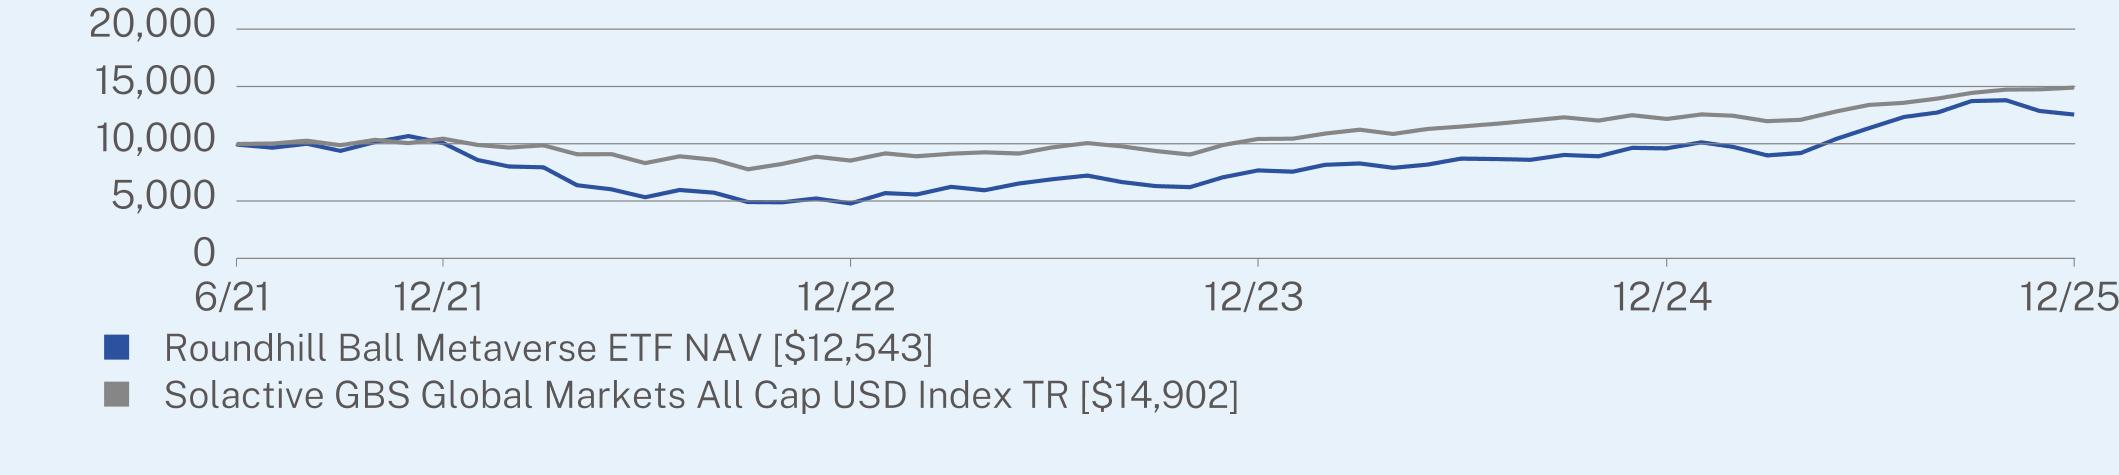
The Fund had positive performance during the fiscal year. The NAV for the Fund increased by 30.69%. The Solactive GBS Global Markets All Cap USD Index TR returned 22.52% over the same period.
The Fund’s performance reflected developments within the Metaverse thematic, including continued investments in immersive augmented reality/virtual reality (AR/VR) experiences, increased enterprise use cases, and artificial intelligence-driven virtual content creation. The Fund’s relative performance was primarily attributable to its industry concentration, which outperformed the broader benchmark during the period.
ANNUAL AVERAGE TOTAL RETURN (%)
|
|
1 Year
|
Since Inception
(06/29/2021) |
|
Roundhill Ball Metaverse ETF NAV
|
30.69
|
5.16
|
|
Solactive GBS Global Markets All Cap USD Index TR
|
22.52
|
9.25
|
Visit https://www.roundhillinvestments.com/etf/metv/ for more recent performance information.
KEY FUND STATISTICS (as of December 31, 2025)
|
Net Assets
|
$277,166,659
|
|
Number of Holdings
|
42
|
|
Net Advisory Fee
|
$1,754,991
|
|
Portfolio Turnover
|
55%
|
|
30-Day SEC Yield
|
-0.12%
|
WHAT DID THE FUND INVEST IN? (as of December 31, 2025)
|
Top 10 Issuers
|
(%)
|
|
ROBLOX Corp.
|
7.4%
|
|
3iQ Ether Staking ETF
|
6.8%
|
|
3iQ Solana Staking ETF
|
6.7%
|
|
Apple, Inc.
|
6.1%
|
|
Alphabet, Inc.
|
4.4%
|
|
NVIDIA Corp.
|
4.4%
|
|
Microsoft Corp.
|
3.5%
|
|
Meta Platforms, Inc.
|
3.5%
|
|
Mount Vernon Liquid Assets Portfolio, LLC
|
3.4%
|
|
Unity Software, Inc.
|
3.3%
|
|
Top Sectors
|
(%)
|
|
Technology
|
50.6%
|
|
Communications
|
26.4%
|
|
Consumer, Cyclical
|
3.1%
|
|
Financial
|
3.1%
|
|
Consumer, Non-cyclical
|
0.9%
|
|
Cash & Other
|
15.9%
|
|
Industry
|
(%)
|
|
Software
|
25.3%
|
|
Internet
|
24.1%
|
|
Semiconductors
|
19.2%
|
|
Computers
|
6.1%
|
|
Diversified Financial Services
|
3.1%
|
|
Media
|
2.3%
|
|
Household Electronics
|
1.5%
|
|
Toys/Games/Hobbies
|
1.1%
|
|
Commercial Services
|
0.9%
|
|
Cash & Other
|
16.4%
|
Changes to the Fund’s Principal Investment Strategy:
Pursuant to the Fund’s principal investment strategy, the Fund will invest in cryptocurrencies to the extent of the Fund’s index, the Ball Metaverse Index, including tokens related to the Solana Network and XRP.
Changes to Fund’s Principal Risks:
Effective upon market close on September 19, 2025, the Fund’s description of its principal risks were revised to reflect the removal of “Cryptocurrency Risk” and “Cryptocurrency ETF Risk” and replaced with descriptions of “Solana Risk” and “XRP Risk”. Please refer to the Fund’s Prospectus for a full description of the principal risks.
WHAT WERE THE FUND COSTS FOR THE PAST YEAR? (based on a hypothetical $10,000 investment)
|
Fund Name
|
Costs of a $10,000 investment
|
Costs paid as a percentage of a $10,000 investment
|
|
Roundhill Cannabis ETF
|
-$1
|
-0.01%
|
HOW DID THE FUND PERFORM LAST YEAR AND WHAT AFFECTED ITS PERFORMANCE?
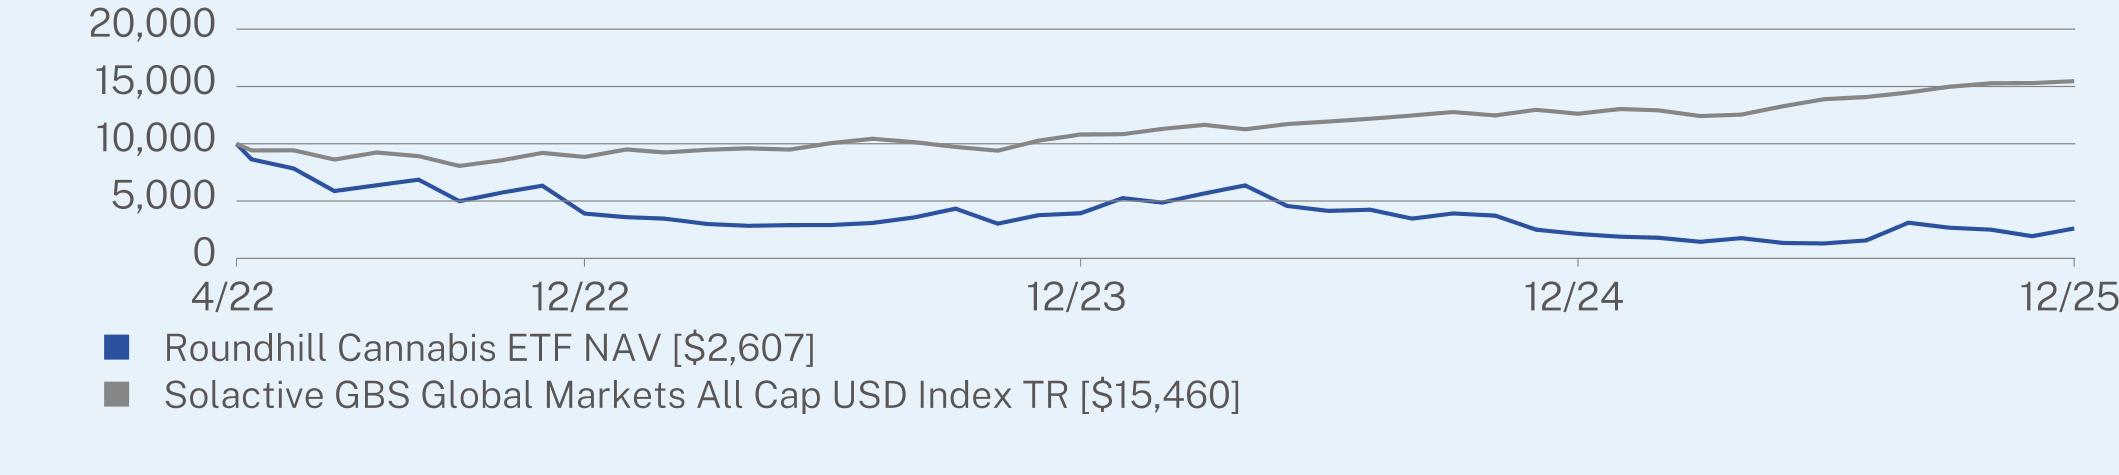
The Fund had positive performance during the fiscal year. The NAV for the Fund increased by 22.64%. The Solactive GBS Global Markets All Cap USD Index TR returned by 22.52% over the same period.
The Fund obtained exposure through derivatives - use of total return swaps referencing underlying equities. The swaps were used to efficiently gain exposure to the underlying asset and did not involve leverage.The Fund’s performance reflected developments within the Cannabis thematic, including policy reform. The Fund’s relative performance was primarily attributable to its industry concentration, which was inline with the performance with the broader benchmark during the period.
ANNUAL AVERAGE TOTAL RETURN (%)
|
|
1 Year
|
Since Inception
(04/19/2022) |
|
Roundhill Cannabis ETF NAV
|
22.64
|
-30.46
|
|
Solactive GBS Global Markets All Cap USD Index TR
|
22.52
|
12.49
|
Visit https://www.roundhillinvestments.com/etf/weed/ for more recent performance information.
KEY FUND STATISTICS (as of December 31, 2025)
|
Net Assets
|
$9,485,358
|
|
Number of Holdings
|
11
|
|
Net Advisory Fee
|
$0
|
|
Portfolio Turnover
|
23%
|
|
30-Day SEC Yield
|
1.67%
|
WHAT DID THE FUND INVEST IN? (as of December 31, 2025)
|
Top 10 Issuers
|
(%)
|
|
Curaleaf Holdings, Inc.
|
21.3%
|
|
First American Government Obligations Fund
|
1.9%
|
|
Green Thumb Industries, Inc.
|
0.0%
|
|
Trulieve Cannabis Corp.
|
0.0%
|
|
Verano Holdings Corp.
|
0.0%
|
|
Cresco Labs, Inc.
|
0.0%
|
|
United States Treasury Bill*
|
52.6%
|
|
Top Sectors
|
(%)
|
|
Consumer, Non-cyclical
|
21.3%
|
|
Cash & Other
|
78.7%
|
|
Industry
|
(%)
|
|
Pharmaceuticals
|
21.3%
|
|
Cash & Other
|
78.7%
|
WHAT WERE THE FUND COSTS FOR THE PAST YEAR? (based on a hypothetical $10,000 investment)
|
Fund Name
|
Costs of a $10,000 investment
|
Costs paid as a percentage of a $10,000 investment
|
|
Roundhill Magnificent Seven ETF
|
$32
|
0.29%
|
HOW DID THE FUND PERFORM LAST YEAR AND WHAT AFFECTED ITS PERFORMANCE?
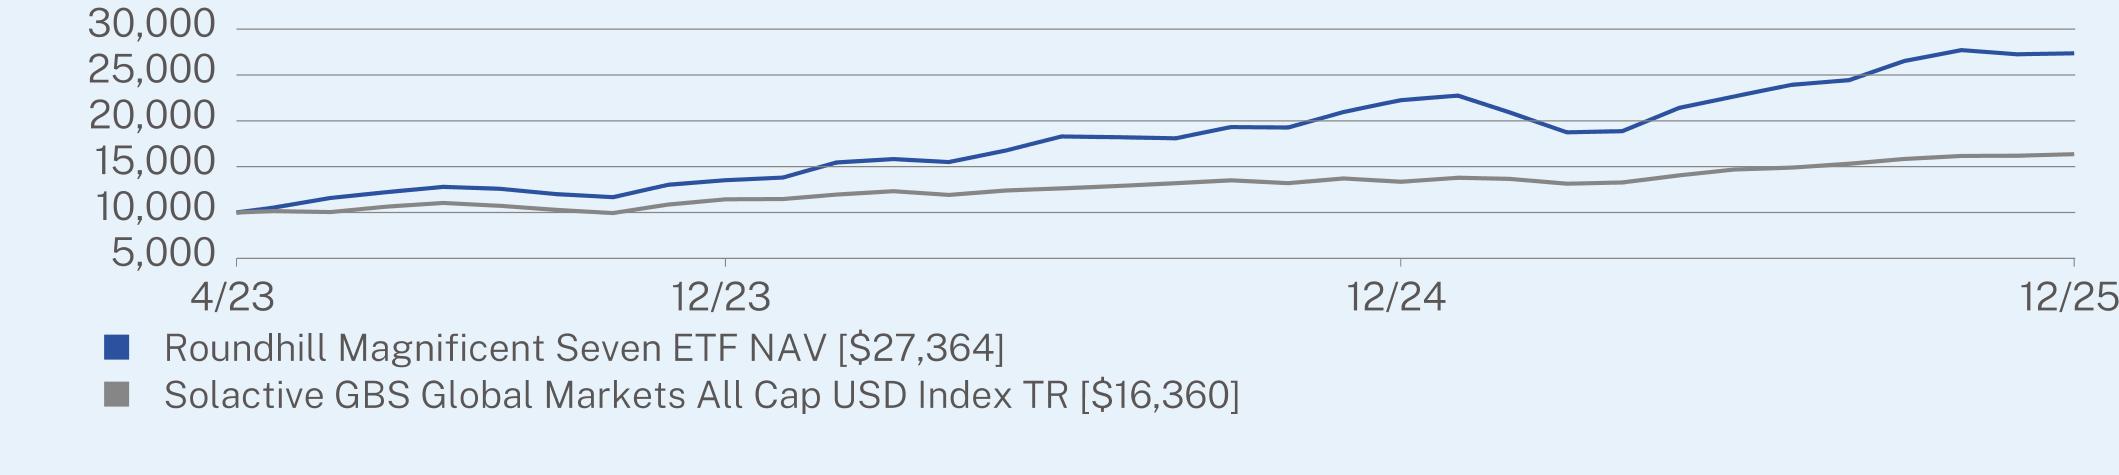
The Fund had positive performance during the fiscal year. The NAV for the Fund increased by 22.96%. The Solactive GBS Global Markets All Cap USD Index TR returned by 22.52% over the same period.
The Fund obtained exposure through derivatives - use of total return swaps referencing underlying equities. The swaps were used to efficiently gain exposure to the underlying asset and did not involve leverage. The Fund’s performance reflected developments in the adoption of Artificial Intelligence (AI), including accelerating cloud and semiconductor demand. The Fund’s relative performance was primarily attributable to its industry concentration, which was inline with the performance with the broader benchmark during the period.
ANNUAL AVERAGE TOTAL RETURN (%)
|
|
1 Year
|
Since Inception
(04/10/2023) |
|
Roundhill Magnificent Seven ETF NAV
|
22.96
|
44.67
|
|
Solactive GBS Global Markets All Cap USD Index TR
|
22.52
|
19.79
|
Visit https://www.roundhillinvestments.com/etf/mags/ for more recent performance information.
KEY FUND STATISTICS (as of December 31, 2025)
|
Net Assets
|
$3,966,415,131
|
|
Number of Holdings
|
30
|
|
Net Advisory Fee
|
$7,501,117
|
|
Portfolio Turnover
|
27%
|
|
30-Day SEC Yield
|
1.82%
|
WHAT DID THE FUND INVEST IN? (as of December 31, 2025)
|
Top 10 Issuers
|
(%)
|
|
Amazon.com, Inc.
|
14.3%
|
|
Alphabet, Inc.
|
14.3%
|
|
Meta Platforms, Inc.
|
14.2%
|
|
Apple, Inc.
|
14.2%
|
|
Microsoft Corp.
|
14.2%
|
|
Tesla, Inc.
|
14.2%
|
|
NVIDIA Corp.
|
14.2%
|
|
First American Government Obligations Fund
|
4.2%
|
|
United States Treasury Bill*
|
51.3%
|
|
Top Sectors
|
(%)
|
|
Technology
|
15.8%
|
|
Communications
|
14.4%
|
|
Consumer, Cyclical
|
5.1%
|
|
Cash & Other
|
64.7%
|
|
Industry
|
(%)
|
|
Internet
|
14.4%
|
|
Software
|
5.7%
|
|
Semiconductors
|
5.1%
|
|
Auto Manufacturers
|
5.1%
|
|
Computers
|
5.0%
|
|
Cash & Other
|
64.7%
|
WHAT WERE THE FUND COSTS FOR THE PAST YEAR? (based on a hypothetical $10,000 investment)
|
Fund Name
|
Costs of a $10,000 investment
|
Costs paid as a percentage of a $10,000 investment
|
|
Roundhill Sports Betting & iGaming ETF
|
$81
|
0.75%
|
HOW DID THE FUND PERFORM LAST YEAR AND WHAT AFFECTED ITS PERFORMANCE?
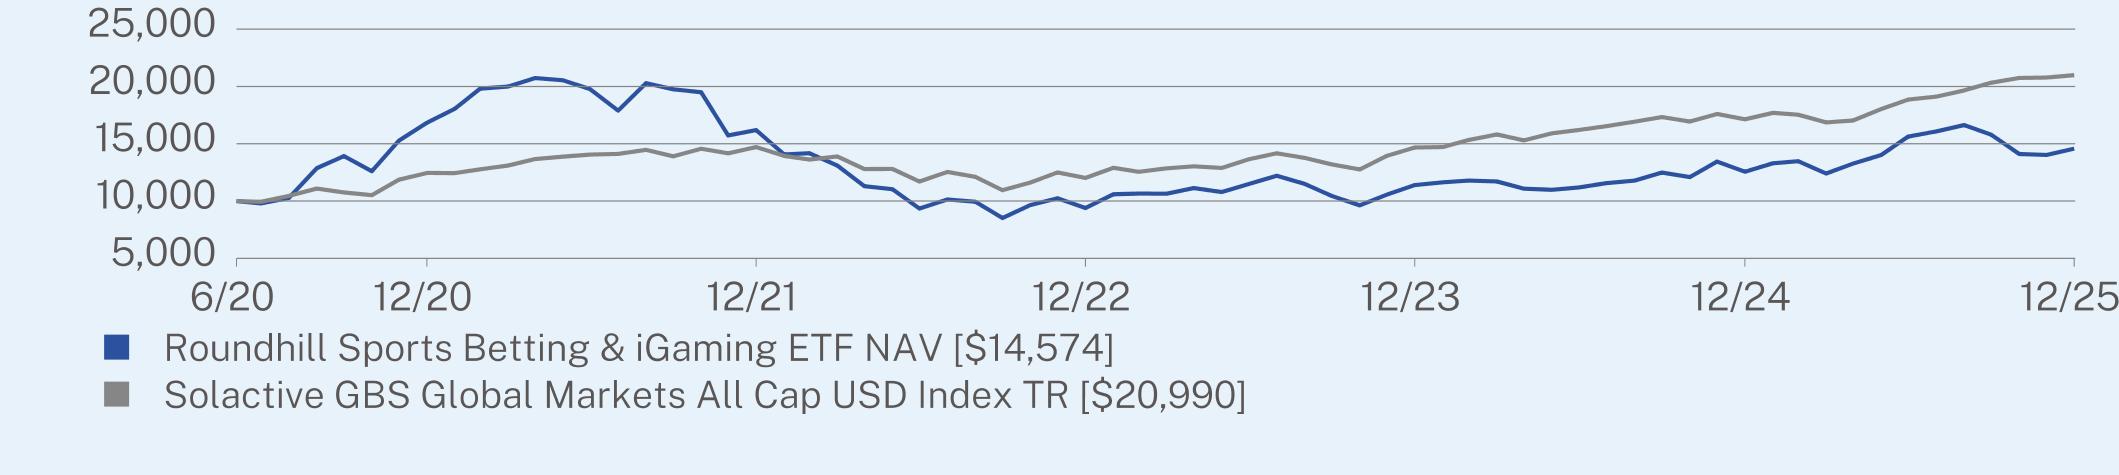
The Fund had positive performance during the fiscal year. The NAV for the Fund increased by 16.02%. The Solactive GBS Global Markets All Cap USO Index TR returned 22.52% over the same period.
The Fund’s performance reflected developments within Sports Betting & iGaming, including continued rapid growth of market share, new betting formats and bet types, as well as mobile and digital innovation. The Fund’s relative performance was primarily attributable to its industry concentration, which underperformed the broader benchmark during the period.
ANNUAL AVERAGE TOTAL RETURN (%)
|
|
1 Year
|
5 Year
|
Since Inception
(06/03/2020) |
|
Roundhill Sports Betting & iGaming ETF NAV
|
16.02
|
-2.84
|
6.99
|
|
Solactive GBS Global Markets All Cap USD Index TR
|
22.52
|
11.01
|
14.22
|
Visit https://www.roundhillinvestments.com/etf/betz/ for more recent performance information.
KEY FUND STATISTICS (as of December 31, 2025)
|
Net Assets
|
$63,364,775
|
|
Number of Holdings
|
29
|
|
Net Advisory Fee
|
$558,208
|
|
Portfolio Turnover
|
26%
|
|
30-Day SEC Yield
|
0.97%
|
WHAT DID THE FUND INVEST IN? (as of December 31, 2025)
|
Top 10 Issuers
|
(%)
|
|
Mount Vernon Liquid Assets Portfolio, LLC
|
21.0%
|
|
Flutter Entertainment PLC
|
9.7%
|
|
DraftKings, Inc.
|
6.7%
|
|
Evolution AB
|
6.1%
|
|
Entain PLC
|
5.5%
|
|
Churchill Downs, Inc.
|
5.4%
|
|
Lottomatica Group SpA
|
5.3%
|
|
FDJ UNITED
|
5.0%
|
|
Betsson AB
|
5.0%
|
|
Super Group SGHC Ltd.
|
5.0%
|
|
Top Ten Countries
|
(%)
|
|
United States
|
55.0%
|
|
Australia
|
15.7%
|
|
Sweden
|
11.1%
|
|
United Kingdom
|
7.3%
|
|
Greece
|
5.6%
|
|
Italy
|
5.3%
|
|
France
|
5.1%
|
|
Guernsey
|
5.0%
|
|
Switzerland
|
3.8%
|
|
Cash & Other
|
-13.9%
|
|
Top Sectors
|
(%)
|
|
Consumer, Cyclical
|
96.2%
|
|
Technology
|
1.8%
|
|
Communications
|
1.6%
|
|
Cash & Other
|
0.4%
|
WHAT WERE THE FUND COSTS FOR THE PAST YEAR? (based on a hypothetical $10,000 investment)
|
Fund Name
|
Costs of a $10,000 investment
|
Costs paid as a percentage of a $10,000 investment
|
|
Roundhill Video Games ETF
|
$56
|
0.50%
|
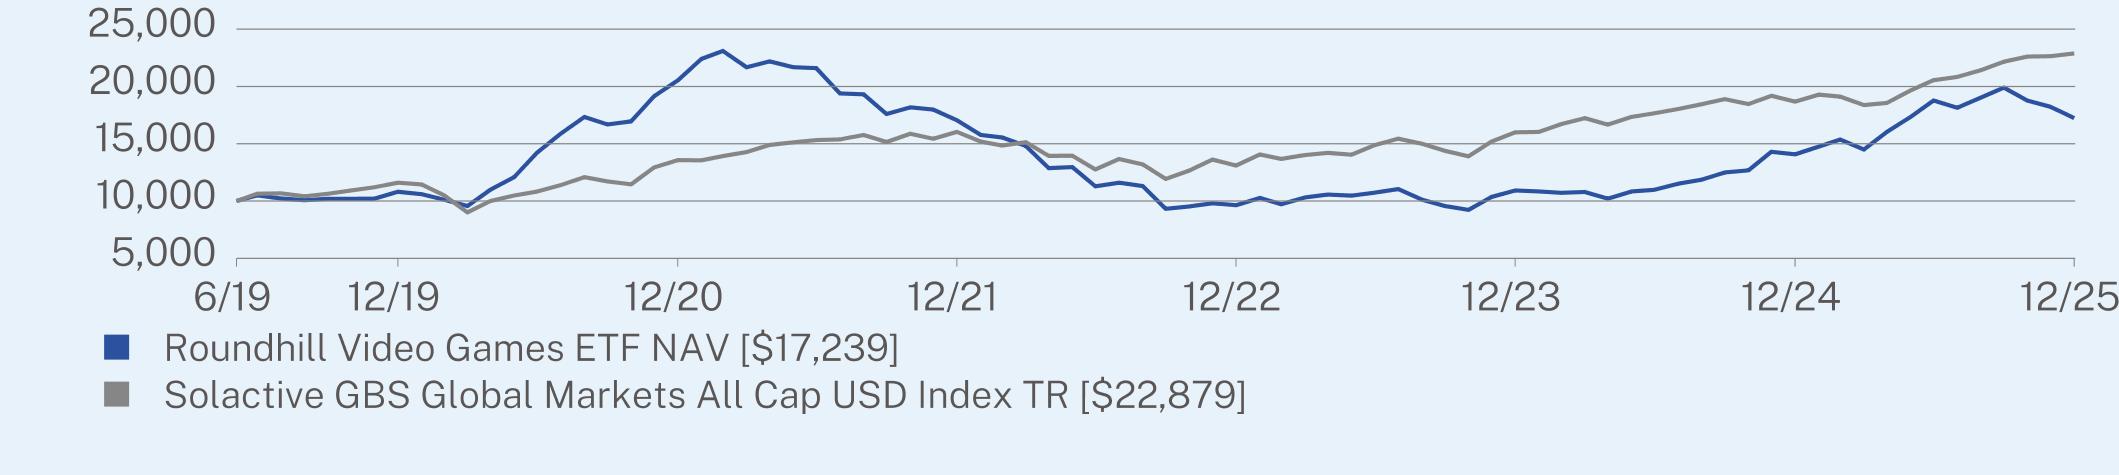
HOW DID THE FUND PERFORM LAST YEAR AND WHAT AFFECTED ITS PERFORMANCE?
The Fund had positive performance during the fiscal year. The NAV for the Fund increased by 22.47%. The Solactive GBS Global Markets All Cap USD Index TR returned by 22.52% over the same period.
The Fund’s performance reflected developments within the Video Games thematic, including accelerating adoption of generative Artificial Intelligence (AI) in game development and strong console hardware momentum. The Fund’s relative performance was primarily attributable to its industry concentration, which was inline with the performance with the broader benchmark during the period.
ANNUAL AVERAGE TOTAL RETURN (%)
|
|
1 Year
|
5 Year
|
Since Inception
(06/03/2019) |
|
Roundhill Video Games ETF NAV
|
22.47
|
-3.43
|
8.63
|
|
Solactive GBS Global Markets All Cap USD Index TR
|
22.52
|
11.01
|
13.41
|
Visit https://www.roundhillinvestments.com/etf/nerd/ for more recent performance information.
KEY FUND STATISTICS (as of December 31, 2025)
|
Net Assets
|
$19,406,859
|
|
Number of Holdings
|
41
|
|
Net Advisory Fee
|
$114,966
|
|
Portfolio Turnover
|
64%
|
|
30-Day SEC Yield
|
0.70%
|
WHAT DID THE FUND INVEST IN? (as of December 31, 2025)
|
Top 10 Issuers
|
(%)
|
|
NetEase, Inc.
|
10.8%
|
|
Nintendo Co. Ltd.
|
10.8%
|
|
ROBLOX Corp.
|
8.3%
|
|
Electronic Arts, Inc.
|
7.7%
|
|
Take-Two Interactive Software, Inc.
|
7.4%
|
|
Nexon Co. Ltd.
|
4.5%
|
|
Konami Group Corp.
|
4.3%
|
|
Unity Software, Inc.
|
4.3%
|
|
Bandai Namco Holdings, Inc.
|
4.0%
|
|
Capcom Co. Ltd.
|
3.4%
|
|
Top Ten Countries
|
(%)
|
|
Japan
|
35.1%
|
|
United States
|
27.7%
|
|
China
|
16.9%
|
|
South Korea
|
9.5%
|
|
Sweden
|
3.4%
|
|
Poland
|
2.3%
|
|
Taiwan
|
2.3%
|
|
Israel
|
0.9%
|
|
France
|
0.7%
|
|
Cash & Other
|
1.2%
|
|
Top Sectors
|
(%)
|
|
Technology
|
82.6%
|
|
Consumer, Cyclical
|
14.7%
|
|
Communications
|
2.6%
|
|
Cash & Other
|
0.1%
|
Changes to the Fund’s Principal Investment Strategy:
Effective September 30, 2025, the Fund converted from a passively-managed index fund that seeks to track the performance, before fees and expenses, of the Nasdaq CTA Global Video Games Software Index™ into an actively managed fund that seeks total return by investing in the equity securities of Video Game Companies.
Changes to Fund’s Principal Risks:
Effective September 30, 2025, the Fund’s description of its principal risks were revised to reflect the removal of Concentration Risk (and the Entertainment Industry Risk sub-risk), Index Provider Risk, Passive Investment Risk and Tracking Error Risk discussions and replaced with descriptions of Industry Exposure Risk and Management Risk. Please refer to the Fund’s Prospectus for a full description of the principal risks.
Changes to the Fund’s Primary Listing Exchange:
Effective September 30, 2025, the Fund transferred its primary listing to the Cboe BZX Exchange, Inc. and is no longer listed on the NASDAQ Stock Market, LLC.
| [1] |
|
||
| [2] |
|