Shareholder Report
Dec. 31, 2025
USD ($)
$ / shares
WHAT WERE THE FUND COSTS FOR THE PAST YEAR? (based on a hypothetical $10,000 investment)
|
Fund Name
|
Costs of a $10,000 investment
|
Costs paid as a percentage of a $10,000 investment*
|
|
Horizon Kinetics Blockchain Development ETF
|
$90
|
0.85%
|
HOW DID THE FUND PERFORM LAST YEAR AND WHAT AFFECTED ITS PERFORMANCE?
Exchanges, or more broadly, positions with exposure to trading platforms, drove positive performance for the Fund. This segment has remained the focus of BCDF, as digital assets have been legitimized by regulators in ways that allow capital market participants more avenues for continued development and execution. Many exchanges took a step forward this year to position themselves for markets in the process of adapting to the growing digital asset markets. Trading activity across many traditional asset classes was elevated, as many exchanges announced another record year. Traditional asset classes remain the core operational driver of business results for most exchanges, though continued execution within core business lines is welcomed as exchanges continue to integrate digital assets.
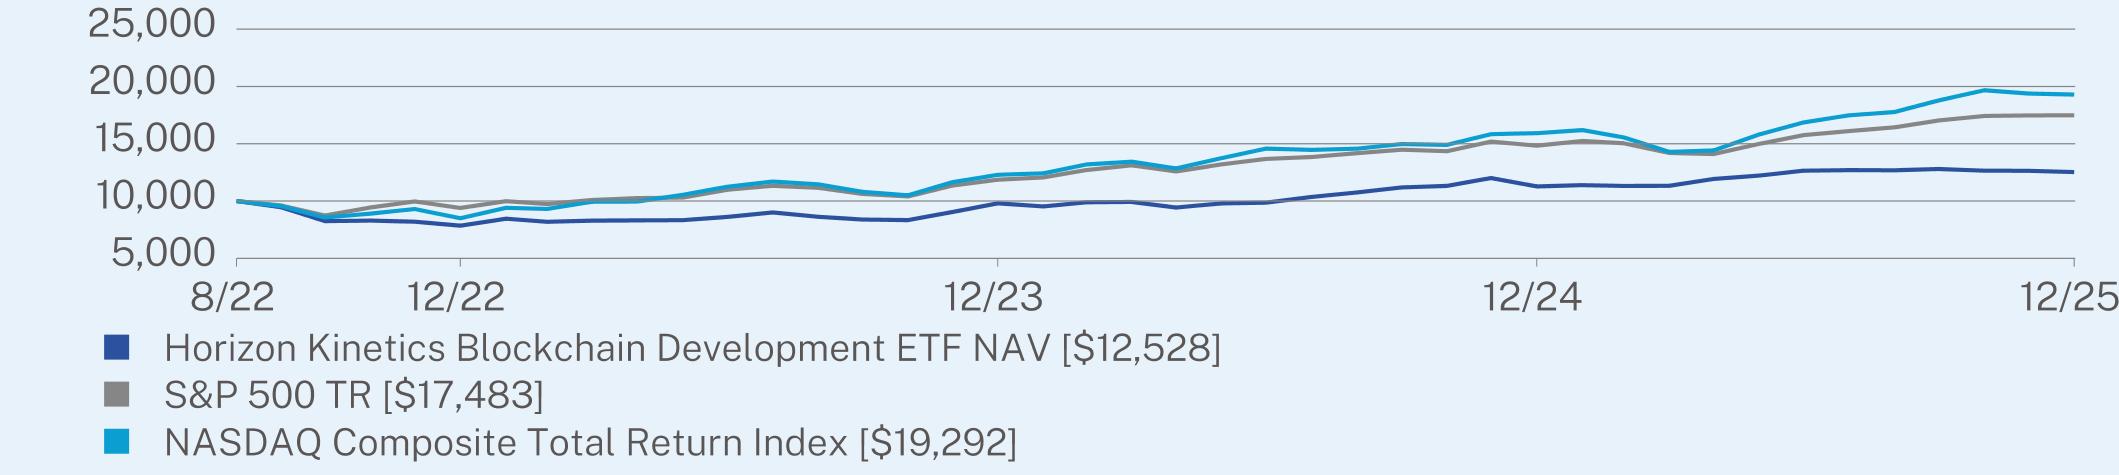
ANNUAL AVERAGE TOTAL RETURN (%)
|
|
1 Year
|
Since Inception
(08/01/2022) |
|
Horizon Kinetics Blockchain Development ETF NAV
|
11.11
|
6.82
|
|
S&P 500 TR
|
17.88
|
17.76
|
|
NASDAQ Composite Total Return Index
|
21.14
|
21.21
|
Visit https://horizonkinetics.com/products/etf/bcdf/ for more recent performance information.
KEY FUND STATISTICS (as of December 31, 2025)
|
Net Assets
|
$18,764,281
|
|
Number of Holdings
|
35
|
|
Net Advisory Fee
|
$144,080
|
|
Portfolio Turnover
|
7%
|
WHAT DID THE FUND INVEST IN? (as of December 31, 2025)
|
Security Type
|
(%)
|
|
Common Stocks
|
93.7%
|
|
Exchange Traded Funds
|
1.0%
|
|
Cash & Other
|
5.3%
|
|
Top 10 Issuers
|
(%)
|
|
Urbana Corp.
|
8.0%
|
|
Cboe Global Markets, Inc.
|
6.8%
|
|
Nasdaq, Inc.
|
6.0%
|
|
TMX Group Ltd.
|
6.0%
|
|
Singapore Exchange Ltd.
|
5.7%
|
|
Intercontinental Exchange, Inc.
|
5.4%
|
|
CACI International, Inc.
|
4.9%
|
|
Deutsche Boerse AG
|
4.6%
|
|
Miami International Holdings, Inc.
|
4.0%
|
|
Hawaiian Electric Industries, Inc.
|
3.8%
|
|
Top Ten Countries
|
(%)
|
|
United States
|
56.8%
|
|
Canada
|
14.0%
|
|
Singapore
|
5.6%
|
|
Japan
|
5.2%
|
|
Germany
|
4.6%
|
|
United Kingdom
|
3.0%
|
|
Australia
|
2.9%
|
|
Netherlands
|
1.3%
|
|
Greece
|
0.8%
|
|
Cash & Other
|
5.8%
|
WHAT WERE THE FUND COSTS FOR THE PAST YEAR? (based on a hypothetical $10,000 investment)
|
Fund Name
|
Costs of a $10,000 investment
|
Costs paid as a percentage of a $10,000 investment*
|
|
Horizon Kinetics Energy and Remediation ETF
|
$89
|
0.85%
|
HOW DID THE FUND PERFORM LAST YEAR AND WHAT AFFECTED ITS PERFORMANCE?
The Fund’s performance was influenced by energy prices, primarily natural gas and oil. While oil prices (WTI) declined by almost 20% in 2025, natural gas prices (Henry Hub) increased by 28%, enabling the Fund to provide a return of 9.4%. However, price is only part of the equation; volumes matter as well. U.S. oil and gas production continued to edge higher in 2025, which supported activity levels and benefited the companies in which the Fund invests. Infrastructure development is another key driver. Ongoing investment in pipelines and related assets—particularly in Texas—has remained robust, enabling increased throughput and sustaining elevated levels of industry activity.
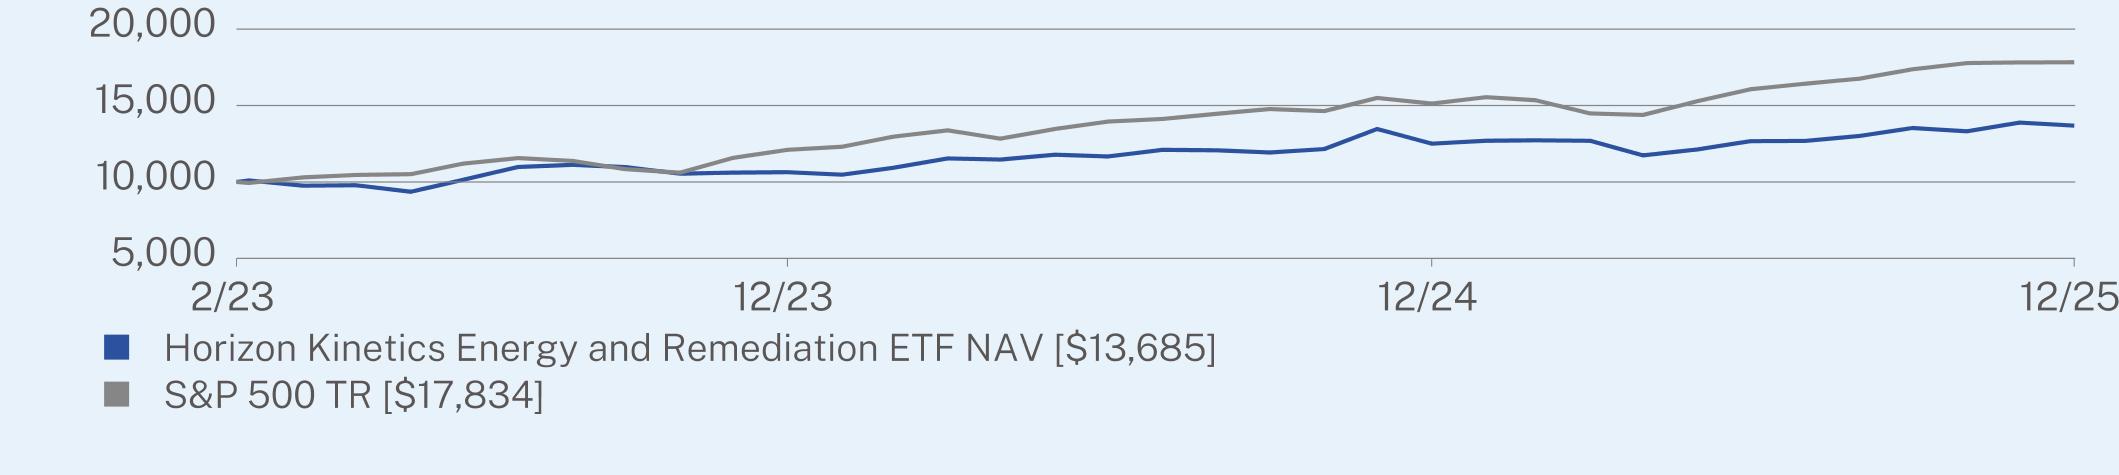
ANNUAL AVERAGE TOTAL RETURN (%)
|
|
1 Year
|
Since Inception
(02/21/2023) |
|
Horizon Kinetics Energy and Remediation ETF NAV
|
9.43
|
11.60
|
|
S&P 500 TR
|
17.88
|
22.44
|
Visit https://horizonkinetics.com/products/etf/nvir/ for more recent performance information.
KEY FUND STATISTICS (as of December 31, 2025)
|
Net Assets
|
$4,072,465
|
|
Number of Holdings
|
37
|
|
Net Advisory Fee
|
$32,742
|
|
Portfolio Turnover
|
7%
|
WHAT DID THE FUND INVEST IN? (as of December 31, 2025)
|
Top Sectors
|
(%)
|
|
Energy
|
75.8%
|
|
Industrial
|
18.8%
|
|
Basic Materials
|
2.1%
|
|
Consumer, Non-cyclical
|
1.8%
|
|
Cash & Other
|
1.5%
|
|
Top 10 Issuers
|
(%)
|
|
CES Energy Solutions Corp.
|
5.4%
|
|
Williams Cos., Inc.
|
5.4%
|
|
Exxon Mobil Corp.
|
5.3%
|
|
EQT Corp.
|
4.9%
|
|
Texas Pacific Land Corp.
|
4.9%
|
|
Expand Energy Corp.
|
3.9%
|
|
Suncor Energy, Inc.
|
3.8%
|
|
Cheniere Energy, Inc.
|
3.7%
|
|
WaterBridge Infrastructure LLC
|
3.7%
|
|
PrairieSky Royalty Ltd.
|
3.4%
|
WHAT WERE THE FUND COSTS FOR THE PAST YEAR? (based on a hypothetical $10,000 investment)
|
Fund Name
|
Costs of a $10,000 investment
|
Costs paid as a percentage of a $10,000 investment*
|
|
Horizon Kinetics Inflation Beneficiaries ETF
|
$93
|
0.85%
|
HOW DID THE FUND PERFORM LAST YEAR AND WHAT AFFECTED ITS PERFORMANCE?
The Fund benefited from its exposure to real asset end markets including precious metals, financial exchanges and nuclear power/uranium. Precious metal (gold, silver, platinum metal group) prices rose sharply during the year as central banks and investment flows drove demand, while exchanges benefited from volatility and product development driving volumes. Energy and related land assets detracted from returns as the market forecasts a short-term excess of supply that obscures attractive long-term balances and incremental growth related to AI data center demand.
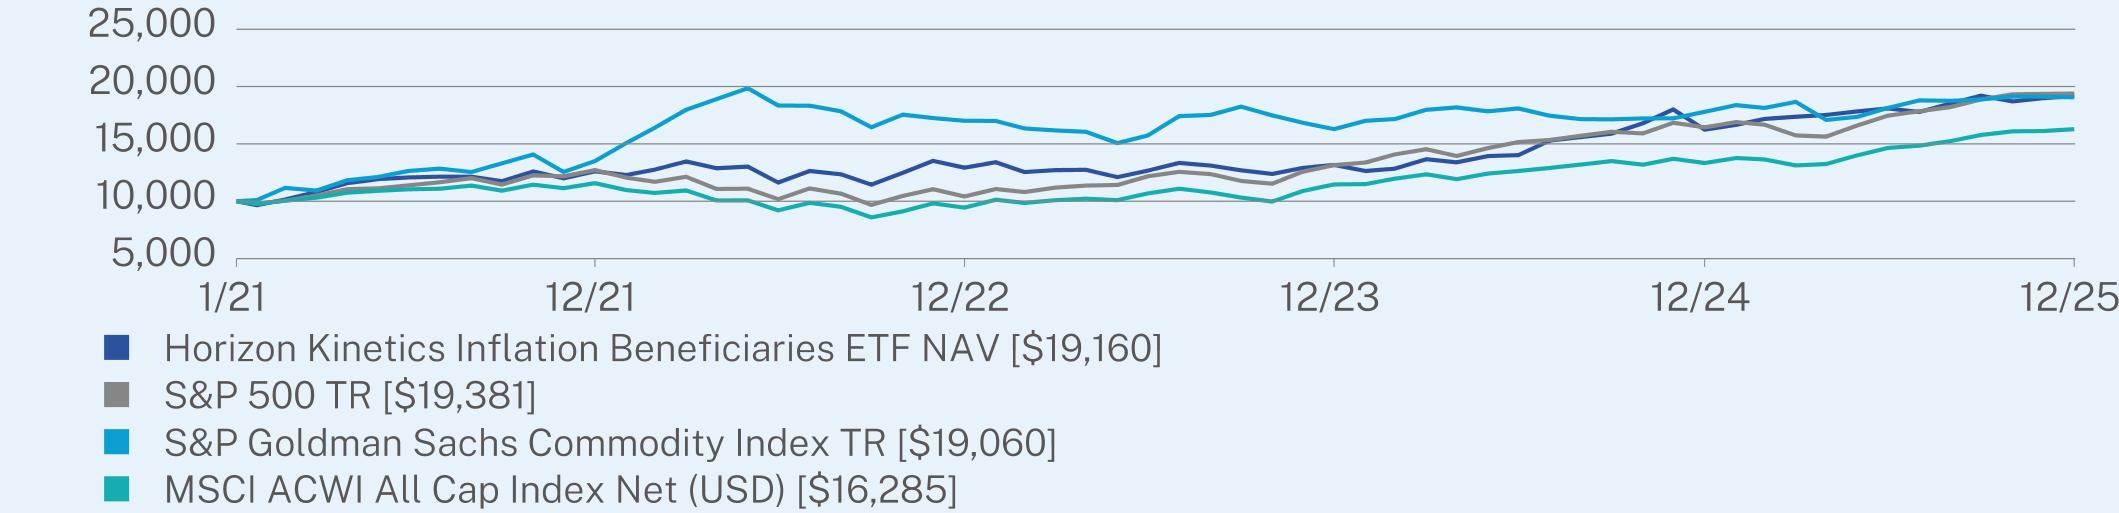
ANNUAL AVERAGE TOTAL RETURN (%)
|
|
1 Year
|
Since Inception
(01/11/2021) |
|
Horizon Kinetics Inflation Beneficiaries ETF NAV
|
17.96
|
13.98
|
|
S&P 500 TR
|
17.88
|
14.24
|
|
S&P Goldman Sachs Commodity Index TR
|
7.11
|
13.86
|
|
MSCI ACWI All Cap Index Net (USD)
|
22.13
|
10.31
|
Visit https://horizonkinetics.com/products/etf/infl/ for more recent performance information.
KEY FUND STATISTICS (as of December 31, 2025)
|
Net Assets
|
$1,321,261,064
|
|
Number of Holdings
|
47
|
|
Net Advisory Fee
|
$10,372,273
|
|
Portfolio Turnover
|
14%
|
WHAT DID THE FUND INVEST IN? (as of December 31, 2025)
|
Security Type
|
(%)
|
|
Common Stocks
|
96.5%
|
|
Cash & Other
|
3.5%
|
|
Top 10 Issuers
|
(%)
|
|
Wheaton Precious Metals Corp.
|
7.8%
|
|
Franco-Nevada Corp.
|
5.1%
|
|
PrairieSky Royalty Ltd.
|
4.7%
|
|
Landbridge Co. LLC
|
4.7%
|
|
Viper Energy, Inc.
|
4.6%
|
|
OR Royalties, Inc.
|
4.3%
|
|
Intercontinental Exchange, Inc.
|
4.1%
|
|
Cameco Corp.
|
4.1%
|
|
Texas Pacific Land Corp.
|
4.1%
|
|
WaterBridge Infrastructure LLC
|
3.8%
|
WHAT WERE THE FUND COSTS FOR THE PAST YEAR? (based on a hypothetical $10,000 investment)
|
Fund Name
|
Costs of a $10,000 investment
|
Costs paid as a percentage of a $10,000 investment*,**
|
|
Horizon Kinetics Japan Owner Operator ETF
|
$55
|
0.85%
|
HOW DID THE FUND PERFORM LAST YEAR AND WHAT AFFECTED ITS PERFORMANCE?
The Fund performance for calendar year 2025 was largely contributed by investment in a defense and shipping technology company. The portfolio of owner operator companies continued to capture opportunities in their niche business areas through leveraging their competitive strength and advantages, and the strategy benefited from what we believe attractive valuations. JAPN primarily invests in Japanese domestic businesses where the impact of currency moves and geopolitical changes are limited. This resulted in performance diversion from the overall Japan equity market, which benefited from weaker JPY versus USD and outperformance by multinational large market capitalization companies during the relevant period.
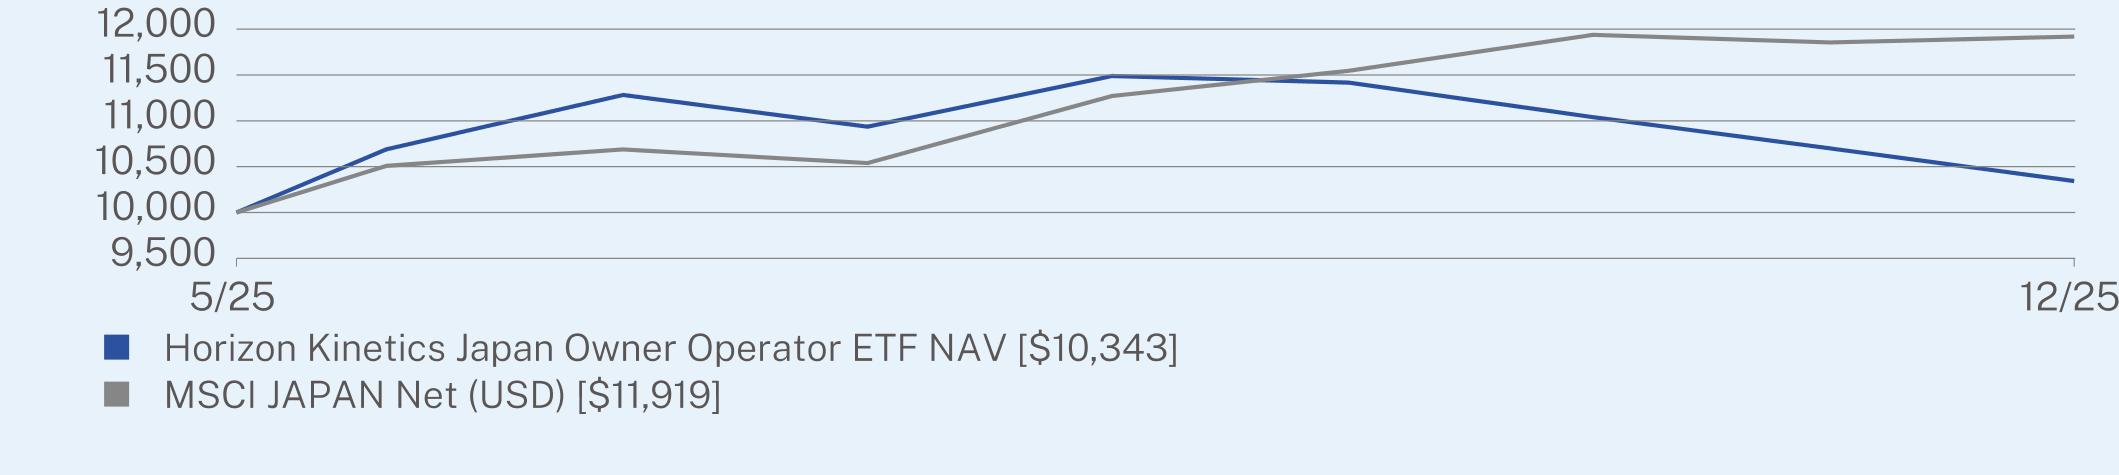
ANNUAL AVERAGE TOTAL RETURN (%)
|
|
Since Inception
(05/12/2025) |
|
Horizon Kinetics Japan Owner Operator ETF NAV
|
3.43
|
|
MSCI JAPAN Net (USD)
|
19.19
|
Visit https://horizonkinetics.com/products/etf/japn/ for more recent performance information.
KEY FUND STATISTICS (as of December 31, 2025)
|
Net Assets
|
$24,948,905
|
|
Number of Holdings
|
31
|
|
Net Advisory Fee
|
$87,960
|
|
Portfolio Turnover
|
0%
|
WHAT DID THE FUND INVEST IN? (as of December 31, 2025)
|
Top Sectors
|
(%)
|
|
Consumer, Cyclical
|
21.6%
|
|
Technology
|
20.6%
|
|
Industrial
|
19.9%
|
|
Consumer, Non-cyclical
|
16.1%
|
|
Communications
|
10.9%
|
|
Utilities
|
4.4%
|
|
Cash & Other
|
6.5%
|
|
Top 10 Issuers
|
(%)
|
|
Furuno Electric Co. Ltd.
|
11.1%
|
|
ULS Group, Inc.
|
4.8%
|
|
Resorttrust, Inc.
|
4.7%
|
|
Japan Elevator Service Holdings Co. Ltd.
|
4.5%
|
|
Hikari Tsushin, Inc.
|
4.4%
|
|
Visional, Inc.
|
4.0%
|
|
M&A Capital Partners Co. Ltd.
|
3.9%
|
|
Pan Pacific International Holdings Corp.
|
3.7%
|
|
Yonex Co. Ltd.
|
3.6%
|
|
AlphaPolis Co. Ltd.
|
3.6%
|
Geographic Breakdown (%)
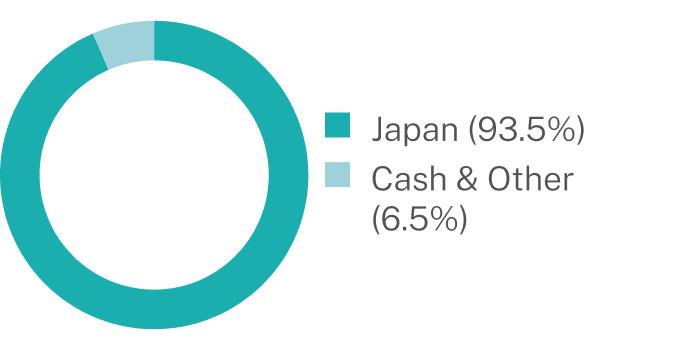
WHAT WERE THE FUND COSTS FOR THE PAST YEAR? (based on a hypothetical $10,000 investment)
|
Fund Name
|
Costs of a $10,000 investment
|
Costs paid as a percentage of a $10,000 investment*
|
|
Horizon Kinetics Medical ETF
|
$97
|
0.85%
|
HOW DID THE FUND PERFORM LAST YEAR AND WHAT AFFECTED ITS PERFORMANCE?
The Fund benefited from its exposure to various major pharmaceutical businesses that develop drugs in the diabetes, oncology, immunology and neuroscience fields. Diabetes drugs continue to have rapid growth amongst GLP-1 agonists that are being used for weight loss applications. The Fund also benefited to a lesser extent from exposure to biotechnology companies targeting various rare and neurological diseases.
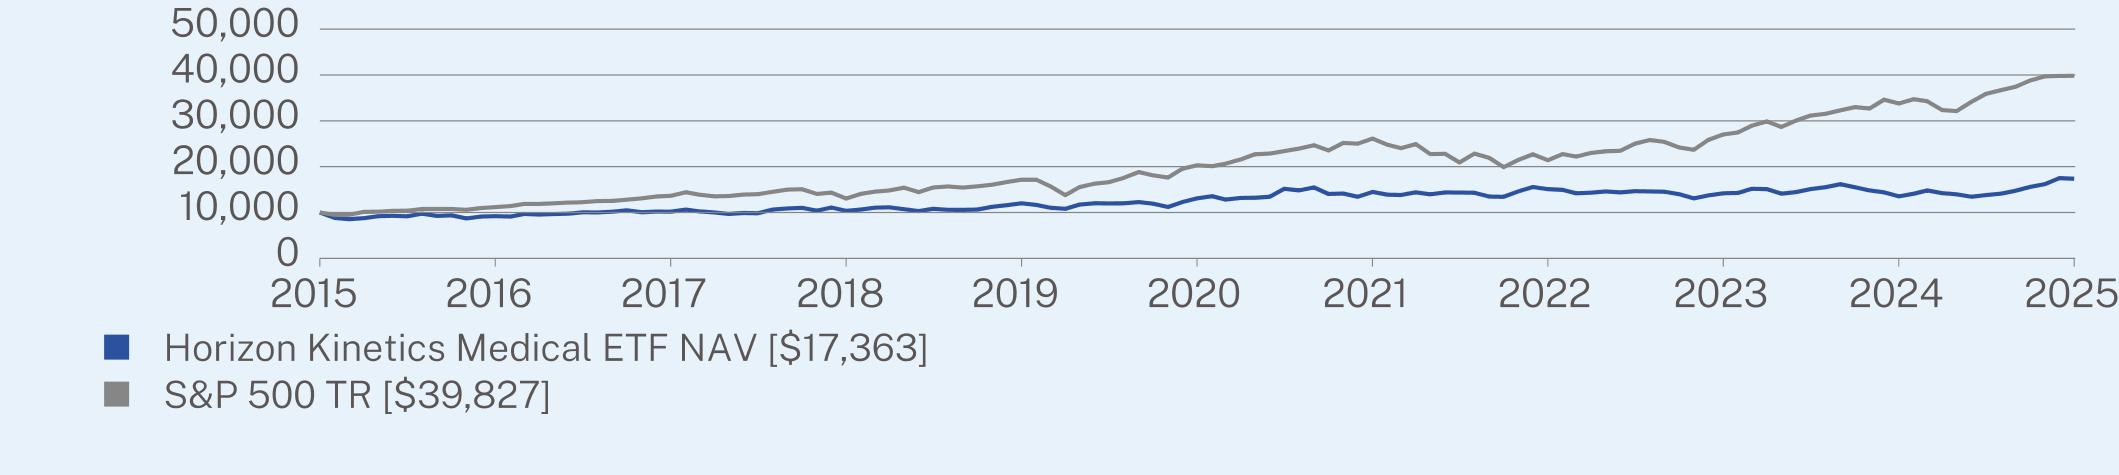
ANNUAL AVERAGE TOTAL RETURN (%)
|
|
1 Year
|
5 Year
|
10 Year
|
|
Horizon Kinetics Medical ETF NAV
|
28.46
|
5.80
|
5.67
|
|
S&P 500 TR
|
17.88
|
14.42
|
14.82
|
Visit https://horizonkinetics.com/products/etf/medx/ for more recent performance information.
KEY FUND STATISTICS (as of December 31, 2025)
|
Net Assets
|
$18,946,057
|
|
Number of Holdings
|
32
|
|
Net Advisory Fee
|
$141,808
|
|
Portfolio Turnover
|
0%
|
WHAT DID THE FUND INVEST IN? (as of December 31, 2025)
|
Top Sectors
|
(%)
|
|
Consumer, Non-cyclical
|
92.5%
|
|
Cash & Other
|
7.5%
|
|
Top 10 Issuers
|
(%)
|
|
Eli Lilly & Co.
|
18.3%
|
|
AbbVie, Inc.
|
8.9%
|
|
Novartis AG
|
6.7%
|
|
AstraZeneca PLC
|
5.3%
|
|
Johnson & Johnson
|
5.0%
|
|
Ionis Pharmaceuticals, Inc.
|
5.0%
|
|
Alnylam Pharmaceuticals, Inc.
|
5.0%
|
|
Bristol-Myers Squibb Co.
|
4.6%
|
|
Amgen, Inc.
|
3.9%
|
|
Merck & Co., Inc.
|
3.6%
|
Other Material Fund Changes:
On November 18, 2025, MEDX added as the last sentence to the first paragraph in the “Principal Investment Strategies” section in the Prospectuses: In addition, the Fund may purchase or engage in short sales of certain leveraged or inverse ETFs.
WHAT WERE THE FUND COSTS FOR THE PAST YEAR? (based on a hypothetical $10,000 investment)
|
Fund Name
|
Costs of a $10,000 investment
|
Costs paid as a percentage of a $10,000 investment*
|
|
Horizon Kinetics SPAC Active ETF
|
$89
|
0.85%
|
HOW DID THE FUND PERFORM LAST YEAR AND WHAT AFFECTED ITS PERFORMANCE?
2025 saw a resurgence in special purpose acquisition company (SPAC) initial public offerings (IPOs), which were led by experienced sponsor teams, and an increase in deal announcements. A still sluggish traditional IPO market and a lighter regulatory environment are some of the factors that contributed to a benign environment for SPACs. Our focus on SPACs led by sponsor teams with a proven track record and backed by a solid underwriter helped drive performance.
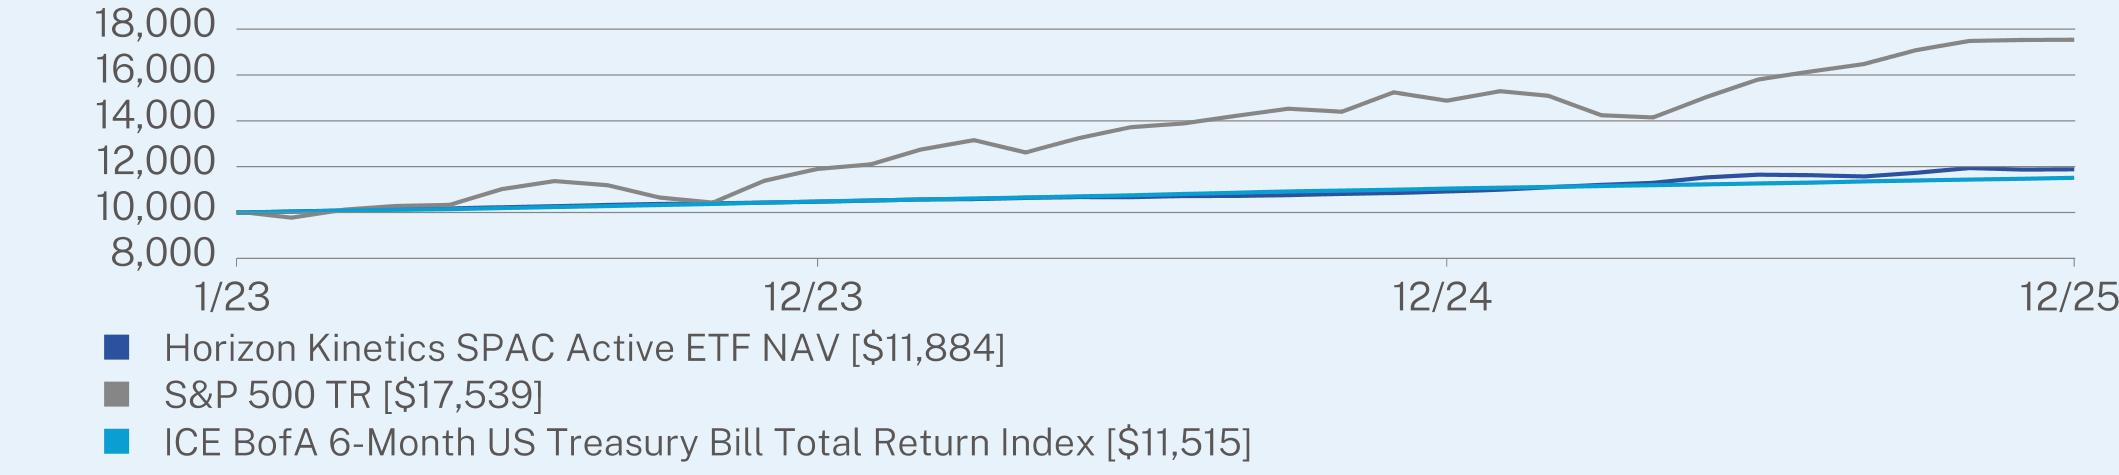
ANNUAL AVERAGE TOTAL RETURN (%)
|
|
1 Year
|
Since Inception
(01/27/2023) |
|
Horizon Kinetics SPAC Active ETF NAV
|
8.85
|
6.08
|
|
S&P 500 TR
|
17.88
|
21.17
|
|
ICE BofA 6-Month US Treasury Bill Total Return Index
|
4.28
|
4.94
|
Visit https://horizonkinetics.com/products/etf/spaq/ for more recent performance information.
KEY FUND STATISTICS (as of December 31, 2025)
|
Net Assets
|
$9,852,028
|
|
Number of Holdings
|
55
|
|
Net Advisory Fee
|
$128,719
|
|
Portfolio Turnover
|
81%
|
WHAT DID THE FUND INVEST IN? (as of December 31, 2025)
|
Top Sectors
|
(%)
|
|
Diversified
|
97.6%
|
|
Cash & Other
|
2.4%
|
|
Top 10 Issuers
|
(%)
|
|
AI Infrastructure Acquisition Corp.
|
6.5%
|
|
Axiom Intelligence Acquisition Corp. 1
|
5.8%
|
|
Aldel Financial II, Inc.
|
5.5%
|
|
Oaktree Acquisition Corp. III Life Sciences
|
5.4%
|
|
Daedalus Special Acquisition Corp.
|
5.3%
|
|
OTG Acquisition Corp. I
|
5.2%
|
|
Legato Merger Corp. III
|
5.0%
|
|
Jackson Acquisition Co. II
|
5.0%
|
|
Roman DBDR Acquisition Corp. II
|
5.0%
|
|
Apex Treasury Corp.
|
4.8%
|
| [1] |
|
||
| [2] |
|
||
| [3] |
|
||
| [4] |
|
||
| [5] |
|
||
| [6] |
|
||
| [7] |
|