Shareholder Report
|
12 Months Ended |
|
Dec. 31, 2025
USD ($)
Holding
|
|---|
| Shareholder Report [Line Items] |
|
| Document Type |
N-CSR
|
| Amendment Flag |
false
|
| Registrant Name |
DEUTSCHE DWS INSTITUTIONAL FUNDS
|
| Entity Central Index Key |
0000862157
|
| Entity Investment Company Type |
N-1A
|
| Document Period End Date |
Dec. 31, 2025
|
| Shareholder Report Annual or Semi-Annual |
Annual Shareholder Report
|
| C000099641 |
|
| Shareholder Report [Line Items] |
|
| Fund Name |
DWS S&P 500 Index Fund
|
| Class Name |
Class A
|
| Trading Symbol |
SXPAX
|
| Annual or Semi-Annual Statement [Text Block] |
This annual shareholder report contains important information about DWS S&P 500 Index Fund (the "Fund") for the period January 1, 2025 to December 31, 2025.
|
| Additional Information [Text Block] |
You can find additional information about the Fund on the Fund's website at dws.com/mutualreports. You can also request this information by contacting us at (800) 728-3337.
|
| Additional Information Phone Number |
(800) 728-3337
|
| Additional Information Website |
<span style="box-sizing: border-box; color: rgb(0, 0, 0); display: inline; flex-wrap: nowrap; font-size: 14.6667px; font-weight: 300; grid-area: auto; line-height: 17.6px; margin: 0px; overflow: visible; text-align: left; text-align-last: auto; white-space-collapse: preserve-breaks;">dws.com/mutualreports</span>
|
| Expenses [Text Block] |
What were the Fund costs for the last year?(Based on a hypothetical $10,000 investment) Fund | Costs of a $10,000 investment | Costs paid as a percentage of a $10,000 investment |
|---|
Class A | $59 | 0.54% |
|---|
The Fund is a feeder fund which invests all of its investable assets in a master portfolio, Deutsche DWS Equity 500 Index Portfolio. Fund costs reflect the expenses of both the feeder and master fund. Gross expense ratio as of the latest prospectus: 0.55%. See prospectus for any contractual or voluntary waivers; without a waiver, costs would have been higher. |
| Expenses Paid, Amount |
$ 59
|
| Expense Ratio, Percent |
0.54%
|
| Expenses Represent Both Master and Feeder [Text] |
The Fund is a feeder fund which invests all of its investable assets in a master portfolio, Deutsche DWS Equity 500 Index Portfolio. Fund costs reflect the expenses of both the feeder and master fund.
|
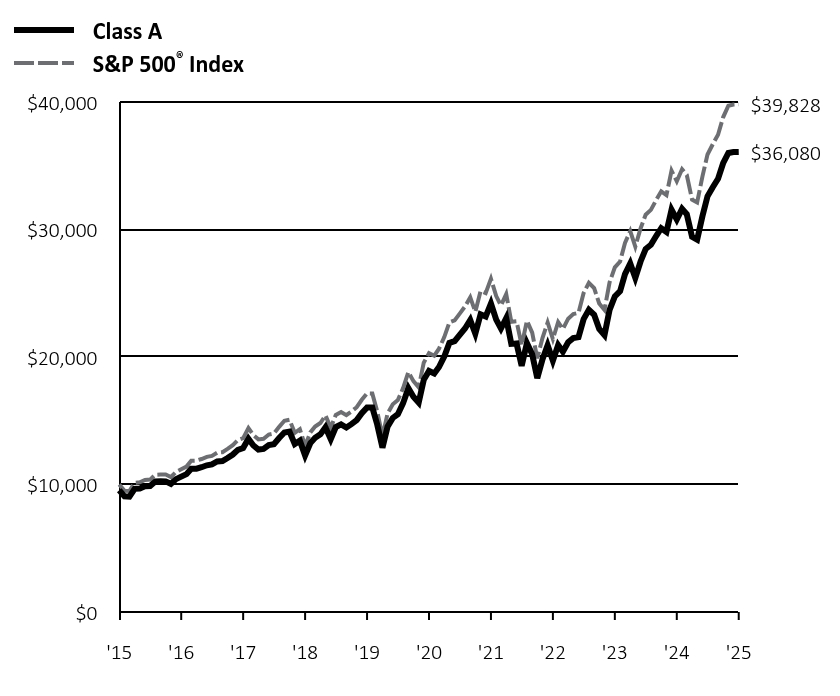
| Factors Affecting Performance [Text Block] |
How did the Fund perform last year and what affected its performance? Class A shares of the Fund returned 17.22% (unadjusted for sales charges) for the period ended December 31, 2025. The Fund's index, the S&P 500® Index, returned 17.88% for the same period. The difference in performance was the result of transaction costs and Fund expenses. The Fund periodically invested in equity index futures in order to keep the portfolio’s positioning in line with that of the index. This strategy had a neutral impact on results. The strong showing for the S&P 500® Index represented its third year in a row with a double-digit return, as well as the sixth year of the past seven. The market backdrop was initially challenging, with stocks falling sharply in early April after President Trump unveiled tariffs that were far higher than investors had been expecting. Stocks quickly recovered, however, as market participants grew confident that the initial announcement was largely a negotiating tactic. Sentiment improved steadily as the year progressed, with incoming data showing that inflation remained in a downtrend and the economy continued to expand despite increased tariffs. The index was also well supported by year-over-year corporate earnings growth of approximately 12% for S&P 500 companies in 2025. Not least, the U.S. Federal Reserve’s decision to enact three quarter-point interest rate cuts and end the multi-year reduction of its balance sheet supported investor sentiment in the second half of 2025. Index-level performance continued to be driven by the impressive returns for a narrow group of mega-cap technology-related stocks, many of which were boosted by optimism about the growth potential of artificial intelligence. The AI theme contributed to sizable outperformance for the information technology and communication services sectors. The semiconductor giant NVIDIA Corp. (7.7%), whose chips are used to power AI, was the leading individual contributor to index performance for the second consecutive year. The optimism surrounding AI also played a role in market-beating gains for the industrials and utilities sectors, which have a high representation of companies expected to benefit from the AI infrastructure buildout and the resulting increase in power demand. Financials, health care, and materials all posted robust returns but didn’t keep pace with the index. Energy, consumer discretionary, consumer staples, and real estate, while producing single-digit gains, were the most notable laggards in relative terms. Percentages in parentheses are based on the Fund's net assets as of December 31, 2025. |
| Performance Past Does Not Indicate Future [Text] |
The Fund's past performance is not a good predictor or guarantee of the Fund's future performance.
|
| Line Graph [Table Text Block] |
 | Class A | S&P 500® Index |
|---|
'15 | $9,550 | $10,000 |
|---|
'16 | $9,069 | $9,504 |
|---|
'16 | $9,050 | $9,491 |
|---|
'16 | $9,660 | $10,135 |
|---|
'16 | $9,691 | $10,174 |
|---|
'16 | $9,862 | $10,357 |
|---|
'16 | $9,881 | $10,384 |
|---|
'16 | $10,241 | $10,766 |
|---|
'16 | $10,248 | $10,782 |
|---|
'16 | $10,243 | $10,784 |
|---|
'16 | $10,052 | $10,587 |
|---|
'16 | $10,419 | $10,979 |
|---|
'16 | $10,618 | $11,196 |
|---|
'17 | $10,813 | $11,408 |
|---|
'17 | $11,239 | $11,861 |
|---|
'17 | $11,243 | $11,875 |
|---|
'17 | $11,351 | $11,997 |
|---|
'17 | $11,506 | $12,166 |
|---|
'17 | $11,574 | $12,242 |
|---|
'17 | $11,804 | $12,494 |
|---|
'17 | $11,836 | $12,532 |
|---|
'17 | $12,074 | $12,790 |
|---|
'17 | $12,350 | $13,089 |
|---|
'17 | $12,722 | $13,490 |
|---|
'17 | $12,858 | $13,640 |
|---|
'18 | $13,587 | $14,421 |
|---|
'18 | $13,081 | $13,890 |
|---|
'18 | $12,740 | $13,537 |
|---|
'18 | $12,787 | $13,589 |
|---|
'18 | $13,087 | $13,916 |
|---|
'18 | $13,158 | $14,002 |
|---|
'18 | $13,643 | $14,523 |
|---|
'18 | $14,081 | $14,996 |
|---|
'18 | $14,153 | $15,081 |
|---|
'18 | $13,180 | $14,050 |
|---|
'18 | $13,440 | $14,337 |
|---|
'18 | $12,272 | $13,042 |
|---|
'19 | $13,248 | $14,087 |
|---|
'19 | $13,666 | $14,540 |
|---|
'19 | $13,930 | $14,822 |
|---|
'19 | $14,485 | $15,422 |
|---|
'19 | $13,557 | $14,442 |
|---|
'19 | $14,507 | $15,460 |
|---|
'19 | $14,710 | $15,682 |
|---|
'19 | $14,471 | $15,434 |
|---|
'19 | $14,733 | $15,723 |
|---|
'19 | $15,047 | $16,063 |
|---|
'19 | $15,588 | $16,646 |
|---|
'19 | $16,045 | $17,149 |
|---|
'20 | $16,035 | $17,142 |
|---|
'20 | $14,705 | $15,731 |
|---|
'20 | $12,885 | $13,788 |
|---|
'20 | $14,533 | $15,556 |
|---|
'20 | $15,218 | $16,296 |
|---|
'20 | $15,514 | $16,620 |
|---|
'20 | $16,380 | $17,558 |
|---|
'20 | $17,553 | $18,820 |
|---|
'20 | $16,876 | $18,105 |
|---|
'20 | $16,422 | $17,623 |
|---|
'20 | $18,208 | $19,552 |
|---|
'20 | $18,901 | $20,304 |
|---|
'21 | $18,701 | $20,099 |
|---|
'21 | $19,213 | $20,653 |
|---|
'21 | $20,042 | $21,558 |
|---|
'21 | $21,104 | $22,708 |
|---|
'21 | $21,242 | $22,867 |
|---|
'21 | $21,729 | $23,401 |
|---|
'21 | $22,235 | $23,957 |
|---|
'21 | $22,901 | $24,685 |
|---|
'21 | $21,823 | $23,537 |
|---|
'21 | $23,345 | $25,186 |
|---|
'21 | $23,174 | $25,011 |
|---|
'21 | $24,198 | $26,132 |
|---|
'22 | $22,933 | $24,780 |
|---|
'22 | $22,235 | $24,038 |
|---|
'22 | $23,049 | $24,931 |
|---|
'22 | $21,028 | $22,757 |
|---|
'22 | $21,055 | $22,798 |
|---|
'22 | $19,311 | $20,917 |
|---|
'22 | $21,084 | $22,845 |
|---|
'22 | $20,211 | $21,913 |
|---|
'22 | $18,343 | $19,895 |
|---|
'22 | $19,820 | $21,506 |
|---|
'22 | $20,919 | $22,708 |
|---|
'22 | $19,706 | $21,400 |
|---|
'23 | $20,936 | $22,744 |
|---|
'23 | $20,412 | $22,189 |
|---|
'23 | $21,152 | $23,004 |
|---|
'23 | $21,477 | $23,363 |
|---|
'23 | $21,557 | $23,464 |
|---|
'23 | $22,971 | $25,015 |
|---|
'23 | $23,697 | $25,819 |
|---|
'23 | $23,314 | $25,407 |
|---|
'23 | $22,190 | $24,196 |
|---|
'23 | $21,714 | $23,687 |
|---|
'23 | $23,687 | $25,851 |
|---|
'23 | $24,756 | $27,025 |
|---|
'24 | $25,158 | $27,479 |
|---|
'24 | $26,494 | $28,946 |
|---|
'24 | $27,332 | $29,878 |
|---|
'24 | $26,208 | $28,657 |
|---|
'24 | $27,491 | $30,078 |
|---|
'24 | $28,468 | $31,158 |
|---|
'24 | $28,799 | $31,537 |
|---|
'24 | $29,486 | $32,302 |
|---|
'24 | $30,099 | $32,992 |
|---|
'24 | $29,811 | $32,693 |
|---|
'24 | $31,549 | $34,612 |
|---|
'24 | $30,779 | $33,787 |
|---|
'25 | $31,620 | $34,727 |
|---|
'25 | $31,196 | $34,274 |
|---|
'25 | $29,424 | $32,343 |
|---|
'25 | $29,206 | $32,124 |
|---|
'25 | $31,033 | $34,146 |
|---|
'25 | $32,599 | $35,882 |
|---|
'25 | $33,314 | $36,688 |
|---|
'25 | $33,972 | $37,431 |
|---|
'25 | $35,194 | $38,797 |
|---|
'25 | $36,001 | $39,706 |
|---|
'25 | $36,072 | $39,803 |
|---|
'25 | $36,080 | $39,828 |
|---|
|
| Average Annual Return [Table Text Block] |
Class/Index
| 1-Year | 5-Year | 10-Year |
|---|
Class A Unadjusted for Sales Charge | 17.22% | 13.80% | 14.22% |
|---|
Class A Adjusted for the Maximum Sales Charge (max 4.5% load) | 11.95% | 12.76% | 13.69% |
|---|
S&P 500® Index | 17.88% | 14.42% | 14.82% |
|---|
|
| No Deduction of Taxes [Text Block] |
The performance graph and returns table do not reflect the deduction of taxes that a shareholder would pay on Fund distributions or the redemption of Fund shares.
|
| AssetsNet |
$ 1,502,296,728
|
| Holdings Count | Holding |
506
|
| Advisory Fees Paid, Amount |
$ 709,209
|
| InvestmentCompanyPortfolioTurnover |
2.00%
|
| Additional Fund Statistics [Text Block] |
Net Assets ($) | 1,502,296,728 |
|---|
Number of Portfolio Holdings | 506 |
|---|
Portfolio Turnover Rate (%) | 2 |
|---|
Total Net Advisory Fees Paid ($) | 709,209 |
|---|
|
| Holdings [Text Block] |
Asset Type | % of Net Assets |
|---|
Common Stocks | 99% |
|---|
Cash Equivalents | 1% |
|---|
Government & Agency Obligations | 0% |
|---|
Other Assets and Liabilities, Net | 0% |
|---|
Total | 100% |
|---|
Sector | % of Net Assets |
|---|
Information Technology | 34% |
|---|
Financials | 13% |
|---|
Communication Services | 11% |
|---|
Consumer Discretionary | 10% |
|---|
Health Care | 10% |
|---|
Industrials | 8% |
|---|
Consumer Staples | 5% |
|---|
Energy | 3% |
|---|
Utilities | 2% |
|---|
Materials | 2% |
|---|
Real Estate | 2% |
|---|
Ten Largest Equity HoldingsHoldings | 40.4% of Net Assets |
|---|
NVIDIA Corp. | 7.7% | Apple, Inc. | 6.8% | Microsoft Corp. | 6.1% | Alphabet, Inc. | 5.6% | Amazon.com, Inc. | 3.8% | Broadcom, Inc. | 2.8% | Meta Platforms, Inc. | 2.4% | Tesla, Inc. | 2.1% | Berkshire Hathaway, Inc. | 1.6% | JPMorgan Chase & Co. | 1.5% |
|
| Material Fund Change [Text Block] |
|
| C000099643 |
|
| Shareholder Report [Line Items] |
|
| Fund Name |
DWS S&P 500 Index Fund
|
| Class Name |
Class C
|
| Trading Symbol |
SXPCX
|
| Annual or Semi-Annual Statement [Text Block] |
This annual shareholder report contains important information about DWS S&P 500 Index Fund (the "Fund") for the period January 1, 2025 to December 31, 2025.
|
| Additional Information [Text Block] |
You can find additional information about the Fund on the Fund's website at dws.com/mutualreports. You can also request this information by contacting us at (800) 728-3337.
|
| Additional Information Phone Number |
(800) 728-3337
|
| Additional Information Website |
<span style="box-sizing: border-box; color: rgb(0, 0, 0); display: inline; flex-wrap: nowrap; font-size: 14.6667px; font-weight: 300; grid-area: auto; line-height: 17.6px; margin: 0px; overflow: visible; text-align: left; text-align-last: auto; white-space-collapse: preserve-breaks;">dws.com/mutualreports</span>
|
| Expenses [Text Block] |
What were the Fund costs for the last year?(Based on a hypothetical $10,000 investment) Fund | Costs of a $10,000 investment | Costs paid as a percentage of a $10,000 investment |
|---|
Class C | $136 | 1.26% |
|---|
The Fund is a feeder fund which invests all of its investable assets in a master portfolio, Deutsche DWS Equity 500 Index Portfolio. Fund costs reflect the expenses of both the feeder and master fund. Gross expense ratio as of the latest prospectus: 1.26%. See prospectus for any contractual or voluntary waivers; without a waiver, costs would have been higher. |
| Expenses Paid, Amount |
$ 136
|
| Expense Ratio, Percent |
1.26%
|
| Expenses Represent Both Master and Feeder [Text] |
The Fund is a feeder fund which invests all of its investable assets in a master portfolio, Deutsche DWS Equity 500 Index Portfolio. Fund costs reflect the expenses of both the feeder and master fund.
|
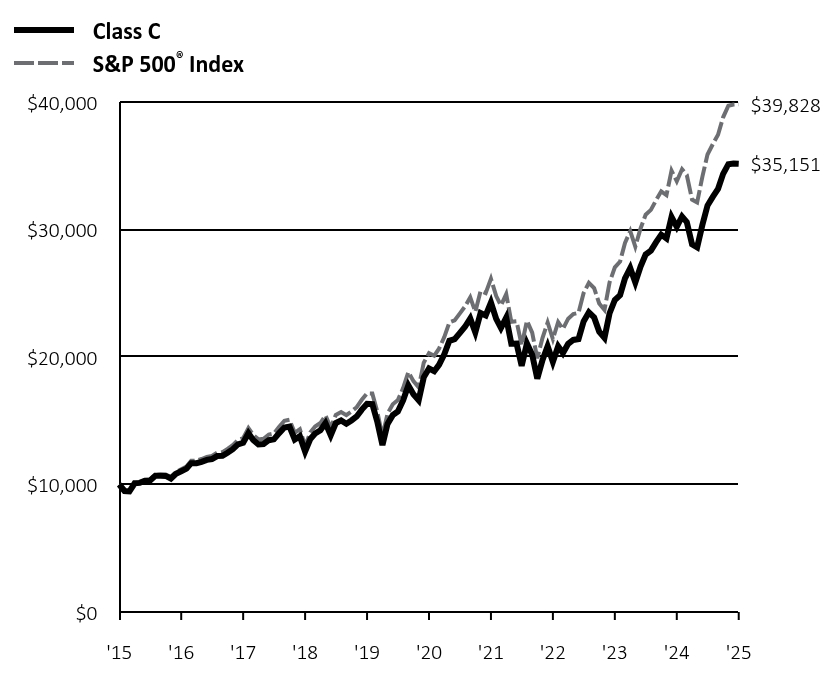
| Factors Affecting Performance [Text Block] |
How did the Fund perform last year and what affected its performance? Class C shares of the Fund returned 16.36% (unadjusted for sales charges) for the period ended December 31, 2025. The Fund's index, the S&P 500® Index, returned 17.88% for the same period. The difference in performance was the result of transaction costs and Fund expenses. The Fund periodically invested in equity index futures in order to keep the portfolio’s positioning in line with that of the index. This strategy had a neutral impact on results. The strong showing for the S&P 500® Index represented its third year in a row with a double-digit return, as well as the sixth year of the past seven. The market backdrop was initially challenging, with stocks falling sharply in early April after President Trump unveiled tariffs that were far higher than investors had been expecting. Stocks quickly recovered, however, as market participants grew confident that the initial announcement was largely a negotiating tactic. Sentiment improved steadily as the year progressed, with incoming data showing that inflation remained in a downtrend and the economy continued to expand despite increased tariffs. The index was also well supported by year-over-year corporate earnings growth of approximately 12% for S&P 500 companies in 2025. Not least, the U.S. Federal Reserve’s decision to enact three quarter-point interest rate cuts and end the multi-year reduction of its balance sheet supported investor sentiment in the second half of 2025. Index-level performance continued to be driven by the impressive returns for a narrow group of mega-cap technology-related stocks, many of which were boosted by optimism about the growth potential of artificial intelligence. The AI theme contributed to sizable outperformance for the information technology and communication services sectors. The semiconductor giant NVIDIA Corp. (7.7%), whose chips are used to power AI, was the leading individual contributor to index performance for the second consecutive year. The optimism surrounding AI also played a role in market-beating gains for the industrials and utilities sectors, which have a high representation of companies expected to benefit from the AI infrastructure buildout and the resulting increase in power demand. Financials, health care, and materials all posted robust returns but didn’t keep pace with the index. Energy, consumer discretionary, consumer staples, and real estate, while producing single-digit gains, were the most notable laggards in relative terms. Percentages in parentheses are based on the Fund's net assets as of December 31, 2025. |
| Performance Past Does Not Indicate Future [Text] |
The Fund's past performance is not a good predictor or guarantee of the Fund's future performance.
|
| Line Graph [Table Text Block] |
 | Class C | S&P 500® Index |
|---|
'15 | $10,000 | $10,000 |
|---|
'16 | $9,491 | $9,504 |
|---|
'16 | $9,467 | $9,491 |
|---|
'16 | $10,098 | $10,135 |
|---|
'16 | $10,126 | $10,174 |
|---|
'16 | $10,297 | $10,357 |
|---|
'16 | $10,313 | $10,384 |
|---|
'16 | $10,680 | $10,766 |
|---|
'16 | $10,684 | $10,782 |
|---|
'16 | $10,672 | $10,784 |
|---|
'16 | $10,468 | $10,587 |
|---|
'16 | $10,844 | $10,979 |
|---|
'16 | $11,044 | $11,196 |
|---|
'17 | $11,242 | $11,408 |
|---|
'17 | $11,674 | $11,861 |
|---|
'17 | $11,675 | $11,875 |
|---|
'17 | $11,778 | $11,997 |
|---|
'17 | $11,932 | $12,166 |
|---|
'17 | $11,993 | $12,242 |
|---|
'17 | $12,228 | $12,494 |
|---|
'17 | $12,249 | $12,532 |
|---|
'17 | $12,491 | $12,790 |
|---|
'17 | $12,767 | $13,089 |
|---|
'17 | $13,145 | $13,490 |
|---|
'17 | $13,274 | $13,640 |
|---|
'18 | $14,020 | $14,421 |
|---|
'18 | $13,492 | $13,890 |
|---|
'18 | $13,138 | $13,537 |
|---|
'18 | $13,173 | $13,589 |
|---|
'18 | $13,474 | $13,916 |
|---|
'18 | $13,541 | $14,002 |
|---|
'18 | $14,032 | $14,523 |
|---|
'18 | $14,471 | $14,996 |
|---|
'18 | $14,537 | $15,081 |
|---|
'18 | $13,531 | $14,050 |
|---|
'18 | $13,790 | $14,337 |
|---|
'18 | $12,582 | $13,042 |
|---|
'19 | $13,575 | $14,087 |
|---|
'19 | $13,999 | $14,540 |
|---|
'19 | $14,254 | $14,822 |
|---|
'19 | $14,820 | $15,422 |
|---|
'19 | $13,857 | $14,442 |
|---|
'19 | $14,820 | $15,460 |
|---|
'19 | $15,018 | $15,682 |
|---|
'19 | $14,764 | $15,434 |
|---|
'19 | $15,023 | $15,723 |
|---|
'19 | $15,334 | $16,063 |
|---|
'19 | $15,873 | $16,646 |
|---|
'19 | $16,332 | $17,149 |
|---|
'20 | $16,308 | $17,142 |
|---|
'20 | $14,946 | $15,731 |
|---|
'20 | $13,087 | $13,788 |
|---|
'20 | $14,750 | $15,556 |
|---|
'20 | $15,438 | $16,296 |
|---|
'20 | $15,730 | $16,620 |
|---|
'20 | $16,601 | $17,558 |
|---|
'20 | $17,773 | $18,820 |
|---|
'20 | $17,081 | $18,105 |
|---|
'20 | $16,610 | $17,623 |
|---|
'20 | $18,408 | $19,552 |
|---|
'20 | $19,095 | $20,304 |
|---|
'21 | $18,882 | $20,099 |
|---|
'21 | $19,385 | $20,653 |
|---|
'21 | $20,213 | $21,558 |
|---|
'21 | $21,271 | $22,708 |
|---|
'21 | $21,395 | $22,867 |
|---|
'21 | $21,873 | $23,401 |
|---|
'21 | $22,369 | $23,957 |
|---|
'21 | $23,025 | $24,685 |
|---|
'21 | $21,929 | $23,537 |
|---|
'21 | $23,446 | $25,186 |
|---|
'21 | $23,258 | $25,011 |
|---|
'21 | $24,272 | $26,132 |
|---|
'22 | $22,988 | $24,780 |
|---|
'22 | $22,276 | $24,038 |
|---|
'22 | $23,082 | $24,931 |
|---|
'22 | $21,043 | $22,757 |
|---|
'22 | $21,059 | $22,798 |
|---|
'22 | $19,301 | $20,917 |
|---|
'22 | $21,061 | $22,845 |
|---|
'22 | $20,176 | $21,913 |
|---|
'22 | $18,303 | $19,895 |
|---|
'22 | $19,763 | $21,506 |
|---|
'22 | $20,846 | $22,708 |
|---|
'22 | $19,623 | $21,400 |
|---|
'23 | $20,834 | $22,744 |
|---|
'23 | $20,305 | $22,189 |
|---|
'23 | $21,030 | $23,004 |
|---|
'23 | $21,337 | $23,363 |
|---|
'23 | $21,405 | $23,464 |
|---|
'23 | $22,789 | $25,015 |
|---|
'23 | $23,501 | $25,819 |
|---|
'23 | $23,102 | $25,407 |
|---|
'23 | $21,977 | $24,196 |
|---|
'23 | $21,493 | $23,687 |
|---|
'23 | $23,429 | $25,851 |
|---|
'23 | $24,473 | $27,025 |
|---|
'24 | $24,854 | $27,479 |
|---|
'24 | $26,159 | $28,946 |
|---|
'24 | $26,971 | $29,878 |
|---|
'24 | $25,840 | $28,657 |
|---|
'24 | $27,098 | $30,078 |
|---|
'24 | $28,037 | $31,158 |
|---|
'24 | $28,345 | $31,537 |
|---|
'24 | $29,005 | $32,302 |
|---|
'24 | $29,594 | $32,992 |
|---|
'24 | $29,291 | $32,693 |
|---|
'24 | $30,980 | $34,612 |
|---|
'24 | $30,209 | $33,787 |
|---|
'25 | $31,017 | $34,727 |
|---|
'25 | $30,581 | $34,274 |
|---|
'25 | $28,828 | $32,343 |
|---|
'25 | $28,594 | $32,124 |
|---|
'25 | $30,363 | $34,146 |
|---|
'25 | $31,875 | $35,882 |
|---|
'25 | $32,557 | $36,688 |
|---|
'25 | $33,177 | $37,431 |
|---|
'25 | $34,358 | $38,797 |
|---|
'25 | $35,122 | $39,706 |
|---|
'25 | $35,173 | $39,803 |
|---|
'25 | $35,151 | $39,828 |
|---|
|
| Average Annual Return [Table Text Block] |
Class/Index
| 1-Year | 5-Year | 10-Year |
|---|
Class C Unadjusted for Sales Charge | 16.36% | 12.98% | 13.40% |
|---|
Class C Adjusted for the Maximum Sales Charge (max 1.00% CDSC) | 15.36% | 12.98% | 13.40% |
|---|
S&P 500® Index | 17.88% | 14.42% | 14.82% |
|---|
|
| No Deduction of Taxes [Text Block] |
The performance graph and returns table do not reflect the deduction of taxes that a shareholder would pay on Fund distributions or the redemption of Fund shares.
|
| AssetsNet |
$ 1,502,296,728
|
| Holdings Count | Holding |
506
|
| Advisory Fees Paid, Amount |
$ 709,209
|
| InvestmentCompanyPortfolioTurnover |
2.00%
|
| Additional Fund Statistics [Text Block] |
Net Assets ($) | 1,502,296,728 |
|---|
Number of Portfolio Holdings | 506 |
|---|
Portfolio Turnover Rate (%) | 2 |
|---|
Total Net Advisory Fees Paid ($) | 709,209 |
|---|
|
| Holdings [Text Block] |
Asset Type | % of Net Assets |
|---|
Common Stocks | 99% |
|---|
Cash Equivalents | 1% |
|---|
Government & Agency Obligations | 0% |
|---|
Other Assets and Liabilities, Net | 0% |
|---|
Total | 100% |
|---|
Sector | % of Net Assets |
|---|
Information Technology | 34% |
|---|
Financials | 13% |
|---|
Communication Services | 11% |
|---|
Consumer Discretionary | 10% |
|---|
Health Care | 10% |
|---|
Industrials | 8% |
|---|
Consumer Staples | 5% |
|---|
Energy | 3% |
|---|
Utilities | 2% |
|---|
Materials | 2% |
|---|
Real Estate | 2% |
|---|
Ten Largest Equity HoldingsHoldings | 40.4% of Net Assets |
|---|
NVIDIA Corp. | 7.7% | Apple, Inc. | 6.8% | Microsoft Corp. | 6.1% | Alphabet, Inc. | 5.6% | Amazon.com, Inc. | 3.8% | Broadcom, Inc. | 2.8% | Meta Platforms, Inc. | 2.4% | Tesla, Inc. | 2.1% | Berkshire Hathaway, Inc. | 1.6% | JPMorgan Chase & Co. | 1.5% |
|
| Material Fund Change [Text Block] |
|
| C000188496 |
|
| Shareholder Report [Line Items] |
|
| Fund Name |
DWS S&P 500 Index Fund
|
| Class Name |
Class R6
|
| Trading Symbol |
SXPRX
|
| Annual or Semi-Annual Statement [Text Block] |
This annual shareholder report contains important information about DWS S&P 500 Index Fund (the "Fund") for the period January 1, 2025 to December 31, 2025.
|
| Additional Information [Text Block] |
You can find additional information about the Fund on the Fund's website at dws.com/mutualreports. You can also request this information by contacting us at (800) 728-3337.
|
| Additional Information Phone Number |
(800) 728-3337
|
| Additional Information Website |
<span style="box-sizing: border-box; color: rgb(0, 0, 0); display: inline; flex-wrap: nowrap; font-size: 14.6667px; font-weight: 300; grid-area: auto; line-height: 17.6px; margin: 0px; overflow: visible; text-align: left; text-align-last: auto; white-space-collapse: preserve-breaks;">dws.com/mutualreports</span>
|
| Expenses [Text Block] |
What were the Fund costs for the last year?(Based on a hypothetical $10,000 investment) Fund | Costs of a $10,000 investment | Costs paid as a percentage of a $10,000 investment |
|---|
Class R6 | $24 | 0.22% |
|---|
The Fund is a feeder fund which invests all of its investable assets in a master portfolio, Deutsche DWS Equity 500 Index Portfolio. Fund costs reflect the expenses of both the feeder and master fund. Gross expense ratio as of the latest prospectus: 0.23%. See prospectus for any contractual or voluntary waivers; without a waiver, costs would have been higher. |
| Expenses Paid, Amount |
$ 24
|
| Expense Ratio, Percent |
0.22%
|
| Expenses Represent Both Master and Feeder [Text] |
The Fund is a feeder fund which invests all of its investable assets in a master portfolio, Deutsche DWS Equity 500 Index Portfolio. Fund costs reflect the expenses of both the feeder and master fund.
|
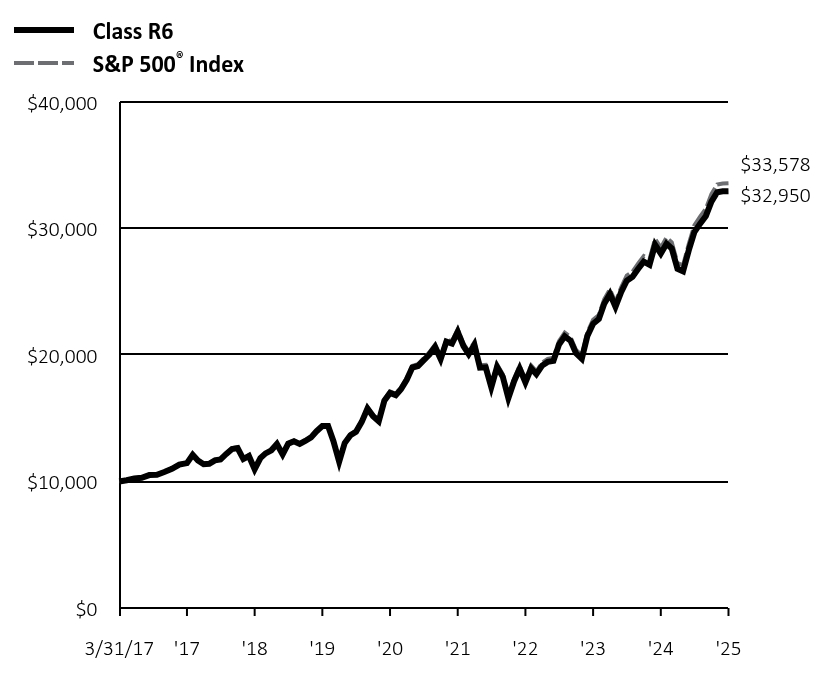
| Factors Affecting Performance [Text Block] |
How did the Fund perform last year and what affected its performance? Class R6 shares of the Fund returned 17.58% for the period ended December 31, 2025. The Fund's index, the S&P 500® Index, returned 17.88% for the same period. The difference in performance was the result of transaction costs and Fund expenses. The Fund periodically invested in equity index futures in order to keep the portfolio’s positioning in line with that of the index. This strategy had a neutral impact on results. The strong showing for the S&P 500® Index represented its third year in a row with a double-digit return, as well as the sixth year of the past seven. The market backdrop was initially challenging, with stocks falling sharply in early April after President Trump unveiled tariffs that were far higher than investors had been expecting. Stocks quickly recovered, however, as market participants grew confident that the initial announcement was largely a negotiating tactic. Sentiment improved steadily as the year progressed, with incoming data showing that inflation remained in a downtrend and the economy continued to expand despite increased tariffs. The index was also well supported by year-over-year corporate earnings growth of approximately 12% for S&P 500 companies in 2025. Not least, the U.S. Federal Reserve’s decision to enact three quarter-point interest rate cuts and end the multi-year reduction of its balance sheet supported investor sentiment in the second half of 2025. Index-level performance continued to be driven by the impressive returns for a narrow group of mega-cap technology-related stocks, many of which were boosted by optimism about the growth potential of artificial intelligence. The AI theme contributed to sizable outperformance for the information technology and communication services sectors. The semiconductor giant NVIDIA Corp. (7.7%), whose chips are used to power AI, was the leading individual contributor to index performance for the second consecutive year. The optimism surrounding AI also played a role in market-beating gains for the industrials and utilities sectors, which have a high representation of companies expected to benefit from the AI infrastructure buildout and the resulting increase in power demand. Financials, health care, and materials all posted robust returns but didn’t keep pace with the index. Energy, consumer discretionary, consumer staples, and real estate, while producing single-digit gains, were the most notable laggards in relative terms. Percentages in parentheses are based on the Fund's net assets as of December 31, 2025. |
| Performance Past Does Not Indicate Future [Text] |
The Fund's past performance is not a good predictor or guarantee of the Fund's future performance.
|
| Line Graph [Table Text Block] |
 | Class R6 | S&P 500® Index |
|---|
3/31/17 | $10,000 | $10,012 |
|---|
4/30/17 | $10,099 | $10,114 |
|---|
5/31/17 | $10,237 | $10,257 |
|---|
6/30/17 | $10,295 | $10,321 |
|---|
7/31/17 | $10,506 | $10,533 |
|---|
8/31/17 | $10,535 | $10,565 |
|---|
9/30/17 | $10,750 | $10,783 |
|---|
10/31/17 | $10,998 | $11,035 |
|---|
11/30/17 | $11,336 | $11,373 |
|---|
12/31/17 | $11,453 | $11,500 |
|---|
1/31/18 | $12,109 | $12,158 |
|---|
2/28/18 | $11,659 | $11,710 |
|---|
3/31/18 | $11,363 | $11,412 |
|---|
4/30/18 | $11,404 | $11,456 |
|---|
5/31/18 | $11,675 | $11,732 |
|---|
6/30/18 | $11,746 | $11,804 |
|---|
7/31/18 | $12,178 | $12,244 |
|---|
8/31/18 | $12,572 | $12,643 |
|---|
9/30/18 | $12,643 | $12,715 |
|---|
10/31/18 | $11,776 | $11,846 |
|---|
11/30/18 | $12,015 | $12,087 |
|---|
12/31/18 | $10,969 | $10,996 |
|---|
1/31/19 | $11,848 | $11,877 |
|---|
2/28/19 | $12,224 | $12,258 |
|---|
3/31/19 | $12,462 | $12,496 |
|---|
4/30/19 | $12,962 | $13,002 |
|---|
5/31/19 | $12,137 | $12,176 |
|---|
6/30/19 | $12,988 | $13,034 |
|---|
7/31/19 | $13,178 | $13,221 |
|---|
8/31/19 | $12,964 | $13,012 |
|---|
9/30/19 | $13,205 | $13,255 |
|---|
10/31/19 | $13,486 | $13,543 |
|---|
11/30/19 | $13,974 | $14,034 |
|---|
12/31/19 | $14,390 | $14,458 |
|---|
1/31/20 | $14,381 | $14,452 |
|---|
2/29/20 | $13,191 | $13,262 |
|---|
3/31/20 | $11,562 | $11,624 |
|---|
4/30/20 | $13,042 | $13,114 |
|---|
5/31/20 | $13,660 | $13,739 |
|---|
6/30/20 | $13,932 | $14,012 |
|---|
7/31/20 | $14,712 | $14,802 |
|---|
8/31/20 | $15,767 | $15,866 |
|---|
9/30/20 | $15,167 | $15,264 |
|---|
10/31/20 | $14,760 | $14,858 |
|---|
11/30/20 | $16,375 | $16,484 |
|---|
12/31/20 | $17,000 | $17,118 |
|---|
1/31/21 | $16,826 | $16,945 |
|---|
2/28/21 | $17,290 | $17,412 |
|---|
3/31/21 | $18,043 | $18,175 |
|---|
4/30/21 | $19,001 | $19,145 |
|---|
5/31/21 | $19,130 | $19,278 |
|---|
6/30/21 | $19,573 | $19,728 |
|---|
7/31/21 | $20,032 | $20,197 |
|---|
8/31/21 | $20,640 | $20,811 |
|---|
9/30/21 | $19,673 | $19,843 |
|---|
10/31/21 | $21,051 | $21,234 |
|---|
11/30/21 | $20,902 | $21,086 |
|---|
12/31/21 | $21,830 | $22,031 |
|---|
1/31/22 | $20,696 | $20,891 |
|---|
2/28/22 | $20,068 | $20,266 |
|---|
3/31/22 | $20,813 | $21,018 |
|---|
4/30/22 | $18,993 | $19,185 |
|---|
5/31/22 | $19,022 | $19,221 |
|---|
6/30/22 | $17,450 | $17,634 |
|---|
7/31/22 | $19,058 | $19,260 |
|---|
8/31/22 | $18,276 | $18,475 |
|---|
9/30/22 | $16,591 | $16,773 |
|---|
10/31/22 | $17,928 | $18,131 |
|---|
11/30/22 | $18,929 | $19,144 |
|---|
12/31/22 | $17,835 | $18,041 |
|---|
1/31/23 | $18,950 | $19,175 |
|---|
2/28/23 | $18,483 | $18,707 |
|---|
3/31/23 | $19,160 | $19,394 |
|---|
4/30/23 | $19,454 | $19,697 |
|---|
5/31/23 | $19,531 | $19,782 |
|---|
6/30/23 | $20,820 | $21,089 |
|---|
7/31/23 | $21,482 | $21,767 |
|---|
8/31/23 | $21,140 | $21,420 |
|---|
9/30/23 | $20,129 | $20,399 |
|---|
10/31/23 | $19,698 | $19,970 |
|---|
11/30/23 | $21,494 | $21,794 |
|---|
12/31/23 | $22,467 | $22,784 |
|---|
1/31/24 | $22,843 | $23,167 |
|---|
2/29/24 | $24,057 | $24,404 |
|---|
3/31/24 | $24,828 | $25,189 |
|---|
4/30/24 | $23,810 | $24,160 |
|---|
5/31/24 | $24,983 | $25,358 |
|---|
6/30/24 | $25,875 | $26,268 |
|---|
7/31/24 | $26,186 | $26,588 |
|---|
8/31/24 | $26,814 | $27,233 |
|---|
9/30/24 | $27,380 | $27,814 |
|---|
10/31/24 | $27,129 | $27,562 |
|---|
11/30/24 | $28,712 | $29,180 |
|---|
12/31/24 | $28,023 | $28,485 |
|---|
1/31/25 | $28,799 | $29,278 |
|---|
2/28/25 | $28,420 | $28,896 |
|---|
3/31/25 | $26,810 | $27,268 |
|---|
4/30/25 | $26,617 | $27,083 |
|---|
5/31/25 | $28,288 | $28,787 |
|---|
6/30/25 | $29,720 | $30,251 |
|---|
7/31/25 | $30,382 | $30,930 |
|---|
8/31/25 | $30,992 | $31,557 |
|---|
9/30/25 | $32,117 | $32,709 |
|---|
10/31/25 | $32,863 | $33,475 |
|---|
11/30/25 | $32,940 | $33,557 |
|---|
12/31/25 | $32,950 | $33,578 |
|---|
|
| Average Annual Return [Table Text Block] |
Class/Index
| 1-Year | 5-Year | Since Inception 3/31/17 |
|---|
Class R6 No Sales Charge | 17.58% | 14.15% | 14.59% |
|---|
S&P 500® Index | 17.88% | 14.42% | 14.84% |
|---|
|
| Performance Inception Date |
Mar. 31, 2017
|
| No Deduction of Taxes [Text Block] |
The performance graph and returns table do not reflect the deduction of taxes that a shareholder would pay on Fund distributions or the redemption of Fund shares.
|
| AssetsNet |
$ 1,502,296,728
|
| Holdings Count | Holding |
506
|
| Advisory Fees Paid, Amount |
$ 709,209
|
| InvestmentCompanyPortfolioTurnover |
2.00%
|
| Additional Fund Statistics [Text Block] |
Net Assets ($) | 1,502,296,728 |
|---|
Number of Portfolio Holdings | 506 |
|---|
Portfolio Turnover Rate (%) | 2 |
|---|
Total Net Advisory Fees Paid ($) | 709,209 |
|---|
|
| Holdings [Text Block] |
Asset Type | % of Net Assets |
|---|
Common Stocks | 99% |
|---|
Cash Equivalents | 1% |
|---|
Government & Agency Obligations | 0% |
|---|
Other Assets and Liabilities, Net | 0% |
|---|
Total | 100% |
|---|
Sector | % of Net Assets |
|---|
Information Technology | 34% |
|---|
Financials | 13% |
|---|
Communication Services | 11% |
|---|
Consumer Discretionary | 10% |
|---|
Health Care | 10% |
|---|
Industrials | 8% |
|---|
Consumer Staples | 5% |
|---|
Energy | 3% |
|---|
Utilities | 2% |
|---|
Materials | 2% |
|---|
Real Estate | 2% |
|---|
Ten Largest Equity HoldingsHoldings | 40.4% of Net Assets |
|---|
NVIDIA Corp. | 7.7% | Apple, Inc. | 6.8% | Microsoft Corp. | 6.1% | Alphabet, Inc. | 5.6% | Amazon.com, Inc. | 3.8% | Broadcom, Inc. | 2.8% | Meta Platforms, Inc. | 2.4% | Tesla, Inc. | 2.1% | Berkshire Hathaway, Inc. | 1.6% | JPMorgan Chase & Co. | 1.5% |
|
| Material Fund Change [Text Block] |
|
| C000099644 |
|
| Shareholder Report [Line Items] |
|
| Fund Name |
DWS S&P 500 Index Fund
|
| Class Name |
Class S
|
| Trading Symbol |
SCPIX
|
| Annual or Semi-Annual Statement [Text Block] |
This annual shareholder report contains important information about DWS S&P 500 Index Fund (the "Fund") for the period January 1, 2025 to December 31, 2025.
|
| Additional Information [Text Block] |
You can find additional information about the Fund on the Fund's website at dws.com/mutualreports. You can also request this information by contacting us at (800) 728-3337.
|
| Additional Information Phone Number |
(800) 728-3337
|
| Additional Information Website |
<span style="box-sizing: border-box; color: rgb(0, 0, 0); display: inline; flex-wrap: nowrap; font-size: 14.6667px; font-weight: 300; grid-area: auto; line-height: 17.6px; margin: 0px; overflow: visible; text-align: left; text-align-last: auto; white-space-collapse: preserve-breaks;">dws.com/mutualreports</span>
|
| Expenses [Text Block] |
What were the Fund costs for the last year?(Based on a hypothetical $10,000 investment) Fund | Costs of a $10,000 investment | Costs paid as a percentage of a $10,000 investment |
|---|
Class S | $32 | 0.29% |
|---|
The Fund is a feeder fund which invests all of its investable assets in a master portfolio, Deutsche DWS Equity 500 Index Portfolio. Fund costs reflect the expenses of both the feeder and master fund. Gross expense ratio as of the latest prospectus: 0.29%. See prospectus for any contractual or voluntary waivers; without a waiver, costs would have been higher. |
| Expenses Paid, Amount |
$ 32
|
| Expense Ratio, Percent |
0.29%
|
| Expenses Represent Both Master and Feeder [Text] |
The Fund is a feeder fund which invests all of its investable assets in a master portfolio, Deutsche DWS Equity 500 Index Portfolio. Fund costs reflect the expenses of both the feeder and master fund.
|
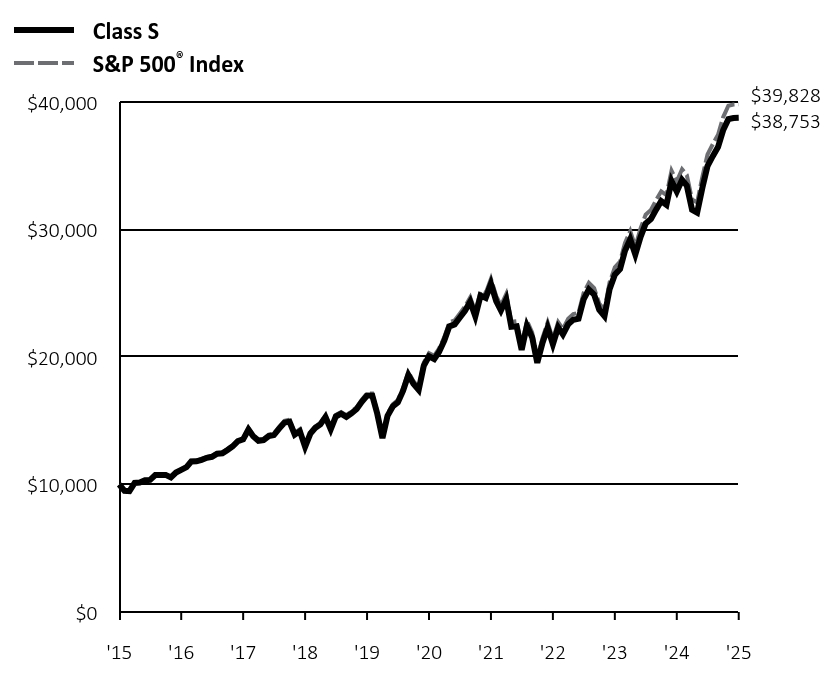
| Factors Affecting Performance [Text Block] |
How did the Fund perform last year and what affected its performance? Class S shares of the Fund returned 17.52% for the period ended December 31, 2025. The Fund's index, the S&P 500® Index, returned 17.88% for the same period. The difference in performance was the result of transaction costs and Fund expenses. The Fund periodically invested in equity index futures in order to keep the portfolio’s positioning in line with that of the index. This strategy had a neutral impact on results. The strong showing for the S&P 500® Index represented its third year in a row with a double-digit return, as well as the sixth year of the past seven. The market backdrop was initially challenging, with stocks falling sharply in early April after President Trump unveiled tariffs that were far higher than investors had been expecting. Stocks quickly recovered, however, as market participants grew confident that the initial announcement was largely a negotiating tactic. Sentiment improved steadily as the year progressed, with incoming data showing that inflation remained in a downtrend and the economy continued to expand despite increased tariffs. The index was also well supported by year-over-year corporate earnings growth of approximately 12% for S&P 500 companies in 2025. Not least, the U.S. Federal Reserve’s decision to enact three quarter-point interest rate cuts and end the multi-year reduction of its balance sheet supported investor sentiment in the second half of 2025. Index-level performance continued to be driven by the impressive returns for a narrow group of mega-cap technology-related stocks, many of which were boosted by optimism about the growth potential of artificial intelligence. The AI theme contributed to sizable outperformance for the information technology and communication services sectors. The semiconductor giant NVIDIA Corp. (7.7%), whose chips are used to power AI, was the leading individual contributor to index performance for the second consecutive year. The optimism surrounding AI also played a role in market-beating gains for the industrials and utilities sectors, which have a high representation of companies expected to benefit from the AI infrastructure buildout and the resulting increase in power demand. Financials, health care, and materials all posted robust returns but didn’t keep pace with the index. Energy, consumer discretionary, consumer staples, and real estate, while producing single-digit gains, were the most notable laggards in relative terms. Percentages in parentheses are based on the Fund's net assets as of December 31, 2025. |
| Performance Past Does Not Indicate Future [Text] |
The Fund's past performance is not a good predictor or guarantee of the Fund's future performance.
|
| Line Graph [Table Text Block] |
 | Class S | S&P 500® Index |
|---|
'15 | $10,000 | $10,000 |
|---|
'16 | $9,497 | $9,504 |
|---|
'16 | $9,481 | $9,491 |
|---|
'16 | $10,123 | $10,135 |
|---|
'16 | $10,159 | $10,174 |
|---|
'16 | $10,338 | $10,357 |
|---|
'16 | $10,362 | $10,384 |
|---|
'16 | $10,742 | $10,766 |
|---|
'16 | $10,754 | $10,782 |
|---|
'16 | $10,752 | $10,784 |
|---|
'16 | $10,551 | $10,587 |
|---|
'16 | $10,940 | $10,979 |
|---|
'16 | $11,152 | $11,196 |
|---|
'17 | $11,360 | $11,408 |
|---|
'17 | $11,806 | $11,861 |
|---|
'17 | $11,815 | $11,875 |
|---|
'17 | $11,932 | $11,997 |
|---|
'17 | $12,095 | $12,166 |
|---|
'17 | $12,170 | $12,242 |
|---|
'17 | $12,416 | $12,494 |
|---|
'17 | $12,449 | $12,532 |
|---|
'17 | $12,704 | $12,790 |
|---|
'17 | $12,997 | $13,089 |
|---|
'17 | $13,393 | $13,490 |
|---|
'17 | $13,536 | $13,640 |
|---|
'18 | $14,307 | $14,421 |
|---|
'18 | $13,779 | $13,890 |
|---|
'18 | $13,425 | $13,537 |
|---|
'18 | $13,474 | $13,589 |
|---|
'18 | $13,794 | $13,916 |
|---|
'18 | $13,874 | $14,002 |
|---|
'18 | $14,384 | $14,523 |
|---|
'18 | $14,849 | $14,996 |
|---|
'18 | $14,930 | $15,081 |
|---|
'18 | $13,906 | $14,050 |
|---|
'18 | $14,184 | $14,337 |
|---|
'18 | $12,950 | $13,042 |
|---|
'19 | $13,987 | $14,087 |
|---|
'19 | $14,432 | $14,540 |
|---|
'19 | $14,710 | $14,822 |
|---|
'19 | $15,300 | $15,422 |
|---|
'19 | $14,326 | $14,442 |
|---|
'19 | $15,333 | $15,460 |
|---|
'19 | $15,551 | $15,682 |
|---|
'19 | $15,299 | $15,434 |
|---|
'19 | $15,581 | $15,723 |
|---|
'19 | $15,917 | $16,063 |
|---|
'19 | $16,488 | $16,646 |
|---|
'19 | $16,981 | $17,149 |
|---|
'20 | $16,971 | $17,142 |
|---|
'20 | $15,566 | $15,731 |
|---|
'20 | $13,642 | $13,788 |
|---|
'20 | $15,388 | $15,556 |
|---|
'20 | $16,117 | $16,296 |
|---|
'20 | $16,435 | $16,620 |
|---|
'20 | $17,356 | $17,558 |
|---|
'20 | $18,600 | $18,820 |
|---|
'20 | $17,891 | $18,105 |
|---|
'20 | $17,411 | $17,623 |
|---|
'20 | $19,311 | $19,552 |
|---|
'20 | $20,051 | $20,304 |
|---|
'21 | $19,840 | $20,099 |
|---|
'21 | $20,387 | $20,653 |
|---|
'21 | $21,277 | $21,558 |
|---|
'21 | $22,402 | $22,708 |
|---|
'21 | $22,554 | $22,867 |
|---|
'21 | $23,079 | $23,401 |
|---|
'21 | $23,620 | $23,957 |
|---|
'21 | $24,332 | $24,685 |
|---|
'21 | $23,193 | $23,537 |
|---|
'21 | $24,812 | $25,186 |
|---|
'21 | $24,636 | $25,011 |
|---|
'21 | $25,732 | $26,132 |
|---|
'22 | $24,390 | $24,780 |
|---|
'22 | $23,650 | $24,038 |
|---|
'22 | $24,523 | $24,931 |
|---|
'22 | $22,378 | $22,757 |
|---|
'22 | $22,418 | $22,798 |
|---|
'22 | $20,557 | $20,917 |
|---|
'22 | $22,451 | $22,845 |
|---|
'22 | $21,530 | $21,913 |
|---|
'22 | $19,541 | $19,895 |
|---|
'22 | $21,122 | $21,506 |
|---|
'22 | $22,296 | $22,708 |
|---|
'22 | $21,004 | $21,400 |
|---|
'23 | $22,323 | $22,744 |
|---|
'23 | $21,772 | $22,189 |
|---|
'23 | $22,567 | $23,004 |
|---|
'23 | $22,913 | $23,363 |
|---|
'23 | $23,004 | $23,464 |
|---|
'23 | $24,518 | $25,015 |
|---|
'23 | $25,298 | $25,819 |
|---|
'23 | $24,896 | $25,407 |
|---|
'23 | $23,702 | $24,196 |
|---|
'23 | $23,201 | $23,687 |
|---|
'23 | $25,309 | $25,851 |
|---|
'23 | $26,459 | $27,025 |
|---|
'24 | $26,894 | $27,479 |
|---|
'24 | $28,324 | $28,946 |
|---|
'24 | $29,230 | $29,878 |
|---|
'24 | $28,031 | $28,657 |
|---|
'24 | $29,412 | $30,078 |
|---|
'24 | $30,460 | $31,158 |
|---|
'24 | $30,820 | $31,537 |
|---|
'24 | $31,559 | $32,302 |
|---|
'24 | $32,228 | $32,992 |
|---|
'24 | $31,926 | $32,693 |
|---|
'24 | $33,796 | $34,612 |
|---|
'24 | $32,974 | $33,787 |
|---|
'25 | $33,887 | $34,727 |
|---|
'25 | $33,441 | $34,274 |
|---|
'25 | $31,548 | $32,343 |
|---|
'25 | $31,321 | $32,124 |
|---|
'25 | $33,281 | $34,146 |
|---|
'25 | $34,968 | $35,882 |
|---|
'25 | $35,747 | $36,688 |
|---|
'25 | $36,458 | $37,431 |
|---|
'25 | $37,780 | $38,797 |
|---|
'25 | $38,651 | $39,706 |
|---|
'25 | $38,741 | $39,803 |
|---|
'25 | $38,753 | $39,828 |
|---|
|
| Average Annual Return [Table Text Block] |
Class/Index
| 1-Year | 5-Year | 10-Year |
|---|
Class S No Sales Charge | 17.52% | 14.09% | 14.51% |
|---|
S&P 500® Index | 17.88% | 14.42% | 14.82% |
|---|
|
| No Deduction of Taxes [Text Block] |
The performance graph and returns table do not reflect the deduction of taxes that a shareholder would pay on Fund distributions or the redemption of Fund shares.
|
| AssetsNet |
$ 1,502,296,728
|
| Holdings Count | Holding |
506
|
| Advisory Fees Paid, Amount |
$ 709,209
|
| InvestmentCompanyPortfolioTurnover |
2.00%
|
| Additional Fund Statistics [Text Block] |
Net Assets ($) | 1,502,296,728 |
|---|
Number of Portfolio Holdings | 506 |
|---|
Portfolio Turnover Rate (%) | 2 |
|---|
Total Net Advisory Fees Paid ($) | 709,209 |
|---|
|
| Holdings [Text Block] |
Asset Type | % of Net Assets |
|---|
Common Stocks | 99% |
|---|
Cash Equivalents | 1% |
|---|
Government & Agency Obligations | 0% |
|---|
Other Assets and Liabilities, Net | 0% |
|---|
Total | 100% |
|---|
Sector | % of Net Assets |
|---|
Information Technology | 34% |
|---|
Financials | 13% |
|---|
Communication Services | 11% |
|---|
Consumer Discretionary | 10% |
|---|
Health Care | 10% |
|---|
Industrials | 8% |
|---|
Consumer Staples | 5% |
|---|
Energy | 3% |
|---|
Utilities | 2% |
|---|
Materials | 2% |
|---|
Real Estate | 2% |
|---|
Ten Largest Equity HoldingsHoldings | 40.4% of Net Assets |
|---|
NVIDIA Corp. | 7.7% | Apple, Inc. | 6.8% | Microsoft Corp. | 6.1% | Alphabet, Inc. | 5.6% | Amazon.com, Inc. | 3.8% | Broadcom, Inc. | 2.8% | Meta Platforms, Inc. | 2.4% | Tesla, Inc. | 2.1% | Berkshire Hathaway, Inc. | 1.6% | JPMorgan Chase & Co. | 1.5% |
|
| Material Fund Change [Text Block] |
|