Pay vs Performance Disclosure - USD ($)
|
12 Months Ended |
Dec. 31, 2025 |
Dec. 31, 2024 |
Dec. 31, 2023 |
Dec. 31, 2022 |
Dec. 31, 2021 |
| Pay vs Performance Disclosure |
|
|
|
|
|
| Pay vs Performance Disclosure, Table |
| | | | | | | | | | | | | | | | | | | | | | | | | | | | | | Year(1) | Summary Compensation Table Total for CEO/PEO ($) | Compensation Actually Paid to CEO/PEO ($)(2) | Average Summary Compensation Table for Non-PEO Named Executive Officers ($) | Average Compensation Actually Paid to Non-PEO Named Executive Officers ($)(3) | Value of Initial Fixed $100
Investment Based On: | Net Income
($ millions) | Adjusted Net Sales ($ millions)(5) | | | Total Shareholder Return ($) | Peer Group Total Shareholder Return ($)(4) | | | 2025 | 23,532,050 | | 32,971,714 | | 5,837,482 | | 5,907,746 | | 265.23 | | 148.36 | | 2,892 | | 19,931 | | | | 2024 | 21,420,801 | | 65,818,468 | | 5,515,833 | | 15,177,435 | | 248.46 | | 129.46 | | 1,846 | | 16,741 | | | | 2023 | 18,723,735 | | 38,596,387 | | 4,865,206 | | 9,121,400 | | 160.81 | | 126.21 | | 1,592 | | 14,257 | | | | 2022 | 16,941,961 | | 21,632,710 | | 4,884,001 | | 5,984,751 | | 128.71 | | 123.67 | | 698 | | 13,206 | | | | 2021 | 16,064,039 | | 20,440,299 | | 3,905,481 | | 4,972,710 | | 118.16 | | 126.13 | | 1,041 | | 11,646 | | |
|
|
|
|
|
| Company Selected Measure Name |
Adjusted Net Sales
|
|
|
|
|
| Named Executive Officers, Footnote |
The CEO/PEO and NEO/Non-PEO Named Executive Officers included in the above compensation columns reflect the following: | | | | | | | | | | Year | CEO/PEO | Non-PEO NEOs | 2025 | Michael F. Mahoney | Jonathan R. Monson, Vance R. Brown, Arthur C. Butcher, Joseph M. Fitzgerald, Daniel J. Brennan and Jeffrey B. Mirviss | 2024 | Michael F. Mahoney | Daniel J. Brennan, Arthur C. Butcher, Joseph M. Fitzgerald, and Jeffrey B. Mirviss | 2023 | Michael F. Mahoney | Daniel J. Brennan, Arthur C. Butcher, Joseph M. Fitzgerald, and Jeffrey B. Mirviss | 2022 | Michael F. Mahoney | Daniel J. Brennan, Arthur C. Butcher, Joseph M. Fitzgerald, and Jeffrey B. Mirviss | 2021 | Michael F. Mahoney | Daniel J. Brennan, Joseph M. Fitzgerald, Jeffrey B. Mirviss and David A. Pierce |
|
|
|
|
|
| Peer Group Issuers, Footnote |
We selected the Standard & Poor’s (S&P) 500 Health Care Index (referred to herein as the “Health Care Index”) as our peer group for purposes of this disclosure, which was comprised of 60-64 companies for the years 2021 through 2025 included in the S&P 500 that are classified as members of the GICS® Health Care sector primarily engaged in Health Care Equipment and Services, Pharmaceuticals, Biotechnology and Life Sciences, including the Company and other mid-cap and large-cap healthcare companies. The Health Care Index is the same performance peer group selected by the Compensation Committee for determining the achievement of targets of TSR performance-based RSUs granted to our NEOs, including our CEO, between 2021 and 2025. See Long Term Incentives on page 66 for additional information.
|
|
|
|
|
| PEO Total Compensation Amount |
$ 23,532,050
|
$ 21,420,801
|
$ 18,723,735
|
$ 16,941,961
|
$ 16,064,039
|
| PEO Actually Paid Compensation Amount |
$ 32,971,714
|
65,818,468
|
38,596,387
|
21,632,710
|
20,440,299
|
| Adjustment To PEO Compensation, Footnote |
"Compensation Actually Paid" to the CEO/PEO reflect the following adjustments from the amount reported in the “Total” compensation column of the Summary Compensation Table on page 76 of this Proxy Statement. | | | | | | | | | | | | | | | | | | | | | | Adjustments to Determine Compensation “Actually Paid” for CEO/PEO | 2025 ($) | 2024 ($) | 2023 ($) | 2022 ($) | 2021 ($) | | Total Reported in Summary Compensation Table | 23,532,050 | | 21,420,801 | | 18,723,735 | | 16,941,961 | | 16,064,039 | | | Less Change in Actuarial Present Value reported under the “Change in Pension Value and Non-qualified Deferred Compensation Earnings” Column of the SCT | 441,611 | | 291,666 | | 291,667 | | 376,667 | | 360,000 | | | Plus “Service Cost” for Pension Plans | — | | — | | — | | — | | — | | | Less Amounts Reported under the “Stock Awards” Column of the SCT | 13,608,056 | | 12,229,998 | | 10,472,753 | | 9,924,100 | | 9,126,292 | | | Less Amounts Reported under the “Option Awards” Column of the SCT | 3,749,980 | | 3,562,493 | | 3,124,984 | | 2,874,985 | | 2,749,999 | | | Plus the Fair Value of Awards Granted during covered year that Remain Unvested as of Year-end | 17,194,877 | | 30,707,960 | | 22,483,365 | | 13,748,034 | | 14,273,008 | | | Plus the Change in Fair Value from prior Year-end to current Year-end of Awards Granted prior to covered year that were Outstanding and Unvested as of Year-end | 3,798,313 | | 26,602,863 | | 11,223,191 | | 4,283,677 | | 2,596,137 | | | Plus the Change in Fair Value from prior Year-end to Vesting Date of Awards Granted prior to covered year that Vested during covered year | 6,246,121 | | 3,171,001 | | 55,500 | | 315,254 | | 903,733 | | | Less the Fair Value as of prior Year-End of Awards Granted prior to covered year that were Forfeited during covered year | — | | — | | — | | 480,464 | | 1,160,327 | | | Total Adjustments | 9,439,664 | | 44,397,667 | | 19,872,652 | | 4,690,749 | | 4,376,260 | | | Compensation Actually Paid | 32,971,714 | | 65,818,468 | | 38,596,387 | | 21,632,710 | | 20,440,299 | | |
*Compensation Actually Paid” does not correlate to the total amount of cash or equity compensation realized during each fiscal year and is different from “realizable” or “realized” compensation as reported in the Compensation Discussion & Analysis section of this Proxy Statement. Instead, it is a nuanced calculation that includes the increase or decrease in value of certain elements of compensation over each fiscal year, including compensation granted in a prior year, in accordance with Item 402(v) of Regulation S-K. The amount of compensation ultimately received may, in fact, be different from the amounts disclosed in these columns of the Pay Versus Performance Table.
|
|
|
|
|
| Non-PEO NEO Average Total Compensation Amount |
$ 5,837,482
|
5,515,833
|
4,865,206
|
4,884,001
|
3,905,481
|
| Non-PEO NEO Average Compensation Actually Paid Amount |
$ 5,907,746
|
15,177,435
|
9,121,400
|
5,984,751
|
4,972,710
|
| Adjustment to Non-PEO NEO Compensation Footnote |
The average "Compensation Actually Paid" to the Non-PEO NEOs reflect the following adjustments from the amount reported in the “Total” compensation column of the Summary Compensation Table on page 76. | | | | | | | | | | | | | | | | | | | | | | Adjustments to Determine Average Compensation “Actually Paid” for Non-PEO NEOs | 2025 Average ($) | 2024 Average ($) | 2023 Average ($) | 2022 Average ($) | 2021 Average ($) | | Total Reported in Summary Compensation Table | 5,837,482 | | 5,515,833 | | 4,865,206 | | 4,884,001 | | 3,905,481 | | | Less Change in Actuarial Present Value reported under the “Change in Pension Value and Non-qualified Deferred Compensation Earnings” Column of the SCT | 399,721 | | 145,042 | | 121,759 | | 122,326 | | 59,942 | | | Plus “Service Cost” for Pension Plans | 6,153 | | 16,633 | | 15,308 | | 16,435 | | — | | | Less Amounts Reported under the “Stock Awards” Column of the SCT | 2,757,988 | | 2,660,420 | | 2,324,937 | | 2,180,154 | | 1,918,553 | | | Less Amounts Reported under the “Option Awards” Column of the SCT | 880,357 | | 774,991 | | 693,748 | | 693,740 | | 578,120 | | | Plus the Fair Value of Awards Granted during covered year that Remain Unvested as of Year-end | 2,814,717 | | 6,680,034 | | 4,991,284 | | 3,103,987 | | 3,000,519 | | | Plus the Change in Fair Value from prior Year-end to current Year-end of Awards Granted prior to covered year that were Outstanding and Unvested as of Year-end | 159,452 | | 5,867,592 | | 2,367,857 | | 1,004,348 | | 636,900 | | | Plus the Change in Fair Value from prior Year-end to Vesting Date of Awards Granted prior to covered year that Vested during covered year | 1,128,008 | | 677,794 | | 22,189 | | 65,014 | | 208,010 | | | Less the Fair Value as of prior Year-End of Awards Granted prior to covered year that were Forfeited during covered year | — | | — | | — | | 92,814 | | 221,585 | | | Total Adjustments | 70,264 | | 9,661,602 | | 4,256,194 | | 1,100,750 | | 1,067,229 | | | Compensation Actually Paid | 5,907,746 | | 15,177,435 | | 9,121,400 | | 5,984,751 | | 4,972,710 | | |
“Compensation Actually Paid” does not correlate to the total amount of cash or equity compensation realized during each fiscal year and is different from “realizable” or “realized” compensation as reported in the Compensation Discussion & Analysis section of this Proxy Statement. Instead, it is a nuanced calculation that includes the increase or decrease in value of certain elements of compensation over each fiscal year, including compensation granted in a prior year, in accordance with Item 402(v) of Regulation S-K. The amount of compensation ultimately received may, in fact, be different from the amounts disclosed in these columns of the Pay Versus Performance Table.
|
|
|
|
|
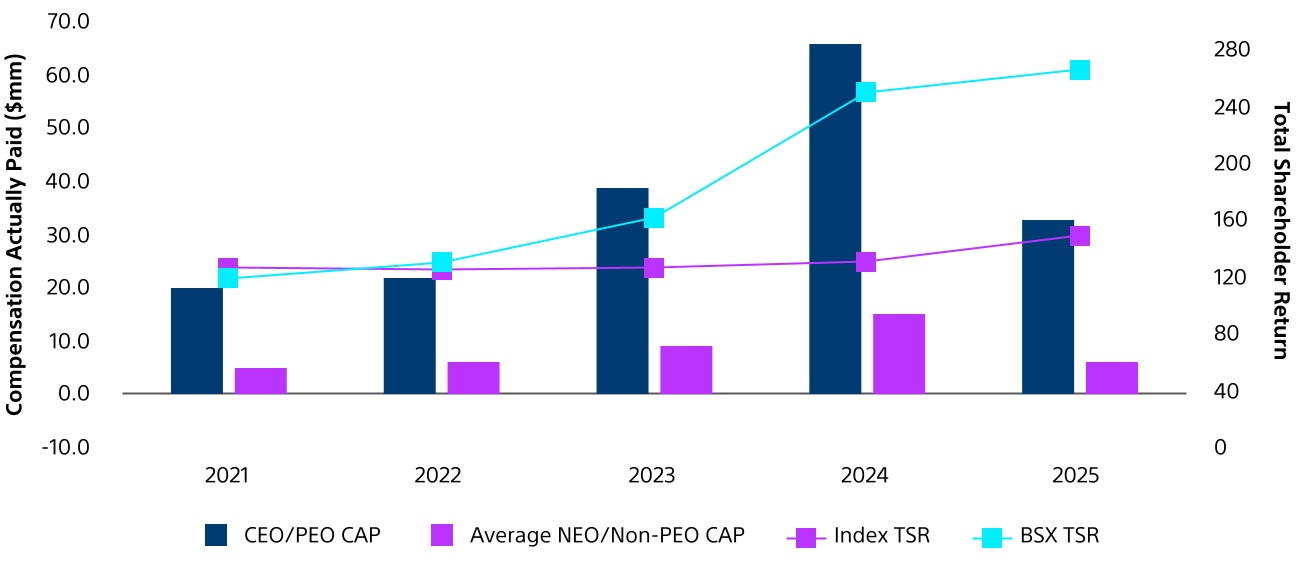
| Compensation Actually Paid vs. Total Shareholder Return |
The graph below shows the relationship between (i) the five-year total return to stockholders on our common stock and the return on the Health Care Index, in each case assuming $100 was invested in our common stock and in the Health Care Index on December 31, 2020 and that any dividends were reinvested, and (ii) the CAP for our CEO/PEO and the average CAP for our non-PEO NEOs for each of 2021 through 2025. Relationship Between Compensation Actually Paid and Company/Peer Group Total Shareholder Return
|
|
|
|
|
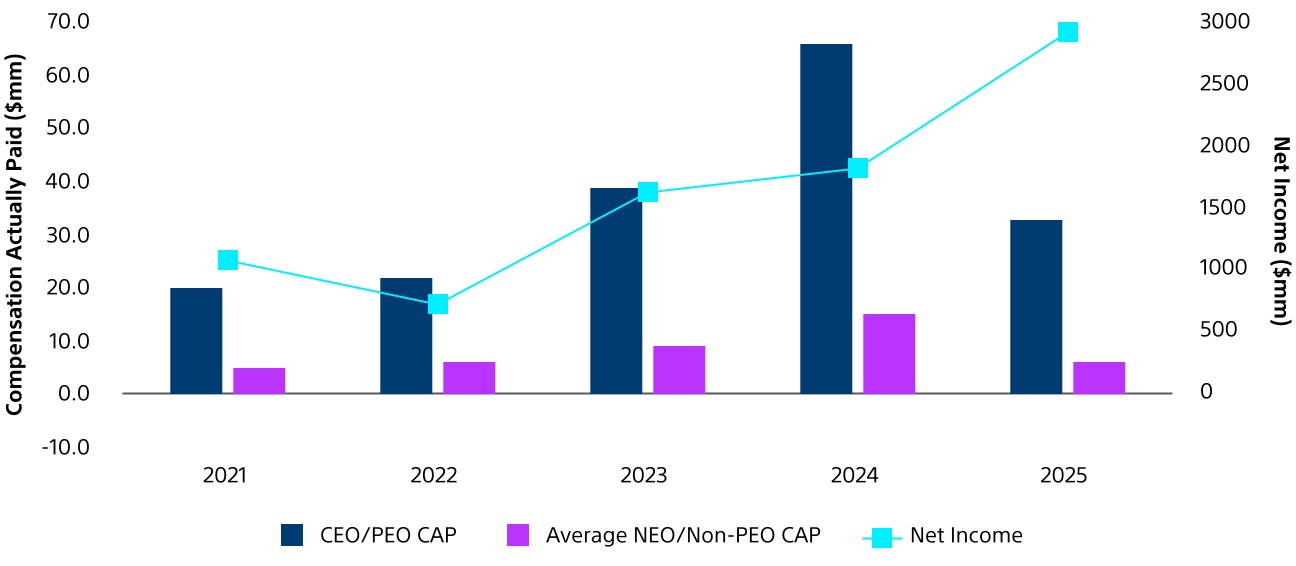
| Compensation Actually Paid vs. Net Income |
The graph below shows the relationship between our net income and the CAP for our CEO/PEO and the average CAP for our non-PEO NEOs for each of 2021 through 2025. Relationship Between Compensation Actually Paid and Net Income
|
|
|
|
|
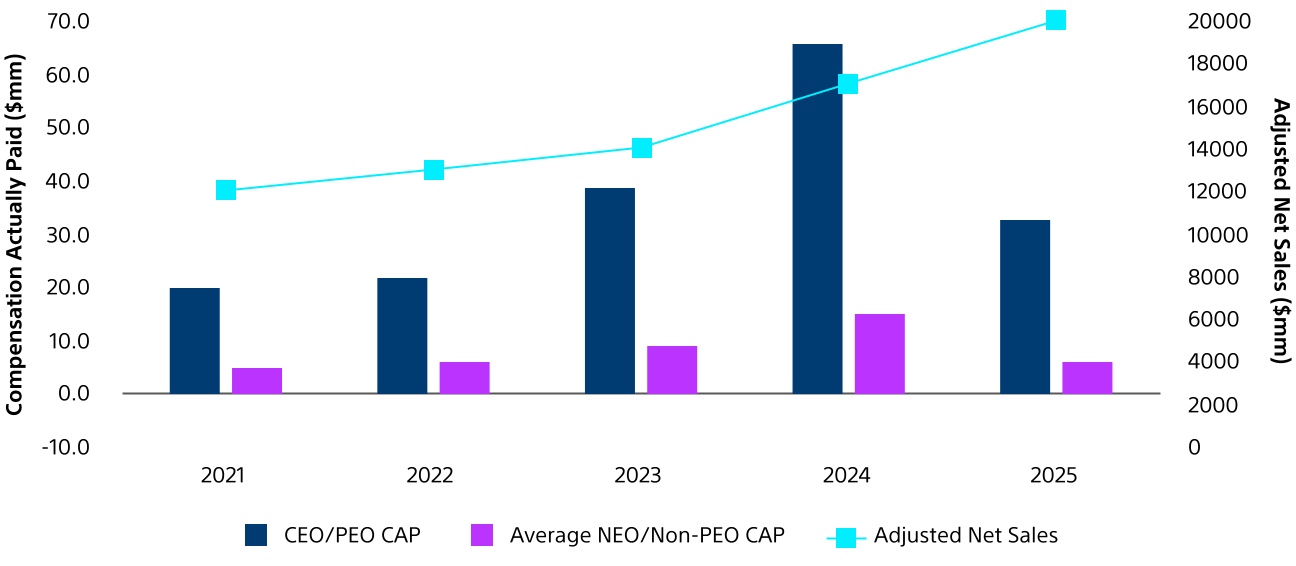
| Compensation Actually Paid vs. Company Selected Measure |
The graph below shows the relationship between our Adjusted Net Sales and the CAP for our CEO/PEO and the average CAP for our non-PEO NEOs for each of 2021 through 2025. Relationship Between Compensation Actually Paid and Adjusted Net Sales
|
|
|
|
|
| Tabular List, Table |
| | | Adjusted Net Sales* | Adjusted EPS* | Adjusted OIM* | Organic Net Sales Growth* | Relative Total Shareholder Return |
|
|
|
|
|
| Total Shareholder Return Amount |
$ 265.23
|
248.46
|
160.81
|
128.71
|
118.16
|
| Peer Group Total Shareholder Return Amount |
148.36
|
129.46
|
126.21
|
123.67
|
126.13
|
| Net Income (Loss) |
$ 2,892,000,000
|
$ 1,846,000,000
|
$ 1,592,000,000
|
$ 698,000,000
|
$ 1,041,000,000
|
| Company Selected Measure Amount |
19,931,000,000
|
16,741,000,000
|
14,257,000,000
|
13,206,000,000
|
11,646,000,000
|
| PEO Name |
Michael F. Mahoney
|
Michael F. Mahoney
|
Michael F. Mahoney
|
Michael F. Mahoney
|
Michael F. Mahoney
|
| Additional 402(v) Disclosure |
* Adjusted Net Sales, Adjusted EPS, Adjusted OIM and Organic Net Sales Growth are non-GAAP financial measures. For a reconciliation of these non-GAAP financial measures to the most directly comparable GAAP financial measures and insight into how these non-GAAP financial measures are considered by management, please see Annex A to this Proxy Statement.
|
|
|
|
|
| Measure:: 1 |
|
|
|
|
|
| Pay vs Performance Disclosure |
|
|
|
|
|
| Name |
Adjusted Net Sales*
|
|
|
|
|
| Non-GAAP Measure Description |
Adjusted Net Sales represents the most important financial performance measure (that is not otherwise required to be disclosed in the table) used by the Company to link CAP to our NEOs, including our CEO, for the most recently completed fiscal year to the Company’s performance. Adjusted Net Sales is a non-GAAP financial measure. For a reconciliation of Adjusted Net Sales to the most directly comparable GAAP financial measure and insight into how Adjusted Net Sales is considered by management, please see Annex A to this Proxy Statement.
|
|
|
|
|
| Measure:: 2 |
|
|
|
|
|
| Pay vs Performance Disclosure |
|
|
|
|
|
| Name |
Adjusted EPS*
|
|
|
|
|
| Measure:: 3 |
|
|
|
|
|
| Pay vs Performance Disclosure |
|
|
|
|
|
| Name |
Adjusted OIM*
|
|
|
|
|
| Measure:: 4 |
|
|
|
|
|
| Pay vs Performance Disclosure |
|
|
|
|
|
| Name |
Organic Net Sales Growth*
|
|
|
|
|
| Measure:: 5 |
|
|
|
|
|
| Pay vs Performance Disclosure |
|
|
|
|
|
| Name |
Relative Total Shareholder Return
|
|
|
|
|
| PEO |
|
|
|
|
|
| Pay vs Performance Disclosure |
|
|
|
|
|
| Adjustment to Compensation, Amount |
$ 9,439,664
|
$ 44,397,667
|
$ 19,872,652
|
$ 4,690,749
|
$ 4,376,260
|
| PEO | Aggregate Change in Present Value of Accumulated Benefit for All Pension Plans Reported in Summary Compensation Table |
|
|
|
|
|
| Pay vs Performance Disclosure |
|
|
|
|
|
| Adjustment to Compensation, Amount |
(441,611)
|
(291,666)
|
(291,667)
|
(376,667)
|
(360,000)
|
| PEO | Pension Adjustments Service Cost |
|
|
|
|
|
| Pay vs Performance Disclosure |
|
|
|
|
|
| Adjustment to Compensation, Amount |
0
|
0
|
0
|
0
|
0
|
| PEO | Aggregate Grant Date Fair Value of Equity Award Amounts Reported in Summary Compensation Table |
|
|
|
|
|
| Pay vs Performance Disclosure |
|
|
|
|
|
| Adjustment to Compensation, Amount |
(13,608,056)
|
(12,229,998)
|
(10,472,753)
|
(9,924,100)
|
(9,126,292)
|
| PEO | Year-end Fair Value of Equity Awards Granted in Covered Year that are Outstanding and Unvested |
|
|
|
|
|
| Pay vs Performance Disclosure |
|
|
|
|
|
| Adjustment to Compensation, Amount |
17,194,877
|
30,707,960
|
22,483,365
|
13,748,034
|
14,273,008
|
| PEO | Year-over-Year Change in Fair Value of Equity Awards Granted in Prior Years That are Outstanding and Unvested |
|
|
|
|
|
| Pay vs Performance Disclosure |
|
|
|
|
|
| Adjustment to Compensation, Amount |
3,798,313
|
26,602,863
|
11,223,191
|
4,283,677
|
2,596,137
|
| PEO | Change in Fair Value as of Vesting Date of Prior Year Equity Awards Vested in Covered Year |
|
|
|
|
|
| Pay vs Performance Disclosure |
|
|
|
|
|
| Adjustment to Compensation, Amount |
6,246,121
|
3,171,001
|
55,500
|
315,254
|
903,733
|
| PEO | Prior Year End Fair Value of Equity Awards Granted in Any Prior Year that Fail to Meet Applicable Vesting Conditions During Covered Year |
|
|
|
|
|
| Pay vs Performance Disclosure |
|
|
|
|
|
| Adjustment to Compensation, Amount |
0
|
0
|
0
|
(480,464)
|
(1,160,327)
|
| PEO | Adjustment, Option Awards [Member] |
|
|
|
|
|
| Pay vs Performance Disclosure |
|
|
|
|
|
| Adjustment to Compensation, Amount |
(3,749,980)
|
(3,562,493)
|
(3,124,984)
|
(2,874,985)
|
(2,749,999)
|
| Non-PEO NEO |
|
|
|
|
|
| Pay vs Performance Disclosure |
|
|
|
|
|
| Adjustment to Compensation, Amount |
70,264
|
9,661,602
|
4,256,194
|
1,100,750
|
1,067,229
|
| Non-PEO NEO | Aggregate Change in Present Value of Accumulated Benefit for All Pension Plans Reported in Summary Compensation Table |
|
|
|
|
|
| Pay vs Performance Disclosure |
|
|
|
|
|
| Adjustment to Compensation, Amount |
(399,721)
|
(145,042)
|
(121,759)
|
(122,326)
|
(59,942)
|
| Non-PEO NEO | Pension Adjustments Service Cost |
|
|
|
|
|
| Pay vs Performance Disclosure |
|
|
|
|
|
| Adjustment to Compensation, Amount |
6,153
|
16,633
|
15,308
|
16,435
|
0
|
| Non-PEO NEO | Aggregate Grant Date Fair Value of Equity Award Amounts Reported in Summary Compensation Table |
|
|
|
|
|
| Pay vs Performance Disclosure |
|
|
|
|
|
| Adjustment to Compensation, Amount |
(2,757,988)
|
(2,660,420)
|
(2,324,937)
|
(2,180,154)
|
(1,918,553)
|
| Non-PEO NEO | Year-end Fair Value of Equity Awards Granted in Covered Year that are Outstanding and Unvested |
|
|
|
|
|
| Pay vs Performance Disclosure |
|
|
|
|
|
| Adjustment to Compensation, Amount |
2,814,717
|
6,680,034
|
4,991,284
|
3,103,987
|
3,000,519
|
| Non-PEO NEO | Year-over-Year Change in Fair Value of Equity Awards Granted in Prior Years That are Outstanding and Unvested |
|
|
|
|
|
| Pay vs Performance Disclosure |
|
|
|
|
|
| Adjustment to Compensation, Amount |
159,452
|
5,867,592
|
2,367,857
|
1,004,348
|
636,900
|
| Non-PEO NEO | Change in Fair Value as of Vesting Date of Prior Year Equity Awards Vested in Covered Year |
|
|
|
|
|
| Pay vs Performance Disclosure |
|
|
|
|
|
| Adjustment to Compensation, Amount |
1,128,008
|
677,794
|
22,189
|
65,014
|
208,010
|
| Non-PEO NEO | Prior Year End Fair Value of Equity Awards Granted in Any Prior Year that Fail to Meet Applicable Vesting Conditions During Covered Year |
|
|
|
|
|
| Pay vs Performance Disclosure |
|
|
|
|
|
| Adjustment to Compensation, Amount |
0
|
0
|
0
|
(92,814)
|
(221,585)
|
| Non-PEO NEO | Adjustment, Option Awards [Member] |
|
|
|
|
|
| Pay vs Performance Disclosure |
|
|
|
|
|
| Adjustment to Compensation, Amount |
$ (880,357)
|
$ (774,991)
|
$ (693,748)
|
$ (693,740)
|
$ (578,120)
|