Exhibit 99.1
Exhibit 99.1

February 2, 2026
Boards of Directors
Columbia Bank MHC
Columbia Financial, Inc.
Columbia Bank
19-01 Route 208 North
Fair Lawn, New Jersey 07410
Members of the Boards of Directors:
At your request, RP® Financial, LC. (“RP Financial”) has completed and hereby provides an independent appraisal (“Appraisal”) of the estimated pro forma market value of the common stock which is to be issued in connection with the two-part transaction whereby (1) Columbia Bank MHC (the “MHC”), the parent mutual holding company and majority shareholder of Columbia Financial, Inc. (the “Company” or “CLBK”), the mid-tier holding company and sole owner of Columbia Bank (the “Bank”), will reorganize by completing a second-step mutual-to-stock conversion to full public ownership (“second-step conversion”), and (2) Northfield Bancorp, Inc., Woodbridge, New Jersey (“Northfield Bancorp” or “NFBK”), will merge into the Company and its wholly-owned Northfield Bank will merge into the Bank (the “Merger”). As a result of the second-step conversion, the Company will be succeeded by a new Maryland corporation, also named Columbia Financial, Inc., and the MHC will be merged with the Company and no longer exist (also referred to herein as the “Company” and CLBK”). As of December 31, 2025, CLBK’s shares were owned 73.1% by the MHC and 26.9% by public shareholders (including stock benefit plans). The Company’s public shares are traded on the Nasdaq Global Select Market (“NasdaqGS”) under the ticker symbol “CLBK.” The Company and Bank will continue as the surviving entities following the Merger. The Company’s Plan of Conversion and Reorganization and Agreement (“Plan of Conversion”) and Plan of Merger (“Plan of Merger”) with NFBK, dated January 31, 2026, are incorporated herein by reference.1
This Appraisal is furnished pursuant to the requirements stipulated in the Code of Federal Regulations and has been prepared in accordance with the 1994 “Guidelines for Appraisal Reports for the Valuation of Savings and Loan Associations Converting from Mutual to Stock Form of Organization” (“Valuation Guidelines”) and applicable regulatory interpretations thereof. These Valuation Guidelines were issued by the Office of Thrift Supervision (“OTS”) and are accepted by the Federal Reserve Board (“FRB”), the Office of the Comptroller of the Currency (“OCC”), and the Federal Deposit Insurance Corporation (“FDIC”). The Valuation Guidelines limit valuation peer group selection to relatively comparable publicly-traded savings institutions. RP Financial requested FRB permission to include publicly-traded commercial banks in the valuation peer group given that (1) there is an insufficient number of public thrifts comparable to the Company in its asset size class and (2) on October 15, 2020 the Bank elected to operate as a “Covered Savings Association,” per Section 5A of the Home Owners’
| 1 | The summary description of the second-step conversion and merger contained herein is not intended to be a complete description of these transactions. |
| Washington Headquarters 1311-A Dolley Madison Blvd., Suite 2A McLean, VA 22101 www.rpfinancial.com |
Telephone: (703) 528-1700 Fax No.: (703) 528-1788 E-Mail: mail@rpfinancial.com |
Boards of Directors
February 2, 2026
Page 2
Loan Act (“HOLA”), enabling it to have the same rights and privileges as national banks and continue its commercial bank transitioning. On January 23, 2026, the FRB indicated that it did not object to our inclusion of public commercial banking companies in the valuation peer group given the limited number of public thrifts comparable to the Company’s profile and characteristics.
Summary of Second-Step Conversion and Merger
Pursuant to the Plan of Conversion, (1) CLBK’s publicly-held shares of common stock will be exchanged for shares in the converted Company to retain the current ownership interest at the time the conversion is completed, subject to an adjustment for net MHC assets to be consolidated with the Company (described below), and (2) shares of common stock, representing the MHC’s majority ownership, will be offered in (a) a subscription offering to Eligible Account Holders, Tax-Qualified Employee Benefit Plans including the Bank’s employee stock ownership plan (the “ESOP”), Supplemental Eligible Account Holders and Other Members, and (b) in a community offering and a stand-by firm commitment offering led by Keefe, Bruyette & Woods, a Stifel Company, if any shares remain after the subscription offering.
NFBK’s issued and outstanding shares of common stock will be converted at the election of the holder into the right to receive either shares of the Company (“Stock Consideration”) or cash (“Cash Consideration”) provided that no more than 30% of the NFBK shares will be converted into Cash Consideration. The Stock Consideration and the Cash Consideration will be dependent upon the “Final Valuation” determined by RP Financial at the closing of the second-step conversion and merger, as follows: (1) if the Final Valuation (full conversion value) is less than $2.3 billion, NFBK shareholders may elect to receive 1.425 shares of CLBK’s common stock, based on a $10.00 per share offering price, or $14.25 in cash for each share of NFBK common stock; (2) if the Final Valuation is equal to or greater than $2.3 billion and less than $2.6 billion, NFBK shareholders may elect to receive 1.450 shares of CLBK’s common stock, based on a $10.00 per share offering price, or $14.50 in cash for each share of Northfield Bancorp common stock; or (3) if the Final Valuation is equal to or greater than $2.6 billion, NFBK shareholders may elect to receive 1.465 shares of CLBK’s common stock, based on a $10.00 per share offering price, or $14.65 in cash for each share of NFBK common stock. Based on the midpoint of the conversion offering range and a 1.425x exchange ratio, the aggregate merger consideration is approximately $597.1 million.
RP® Financial, LC.
RP Financial is a financial consulting firm serving the financial services industry nationwide that, among other things, specializes in financial valuations and analyses of business enterprises and securities, including the pro forma valuation for savings institutions converting from mutual-to-stock form. Our background and experience is detailed in Exhibit V-1. We believe that, except for the fee we will receive for the Appraisal, we are independent of the Company and NFBK. RP Financial is independent from the legal, investment, accounting, and other advisors retained by the Company and NFBK in connection with the second-step conversion and Merger. While RP Financial has previously provided conversion and other valuation services to both the Company and NFBK, at the time of engagement RP Financial was not engaged to provide any services to the Company or NFBK.
Boards of Directors
February 2, 2026
Page 3
Valuation Methodology
In preparing our Appraisal, we have reviewed the Company’s regulatory applications, including the draft prospectus, as filed with the FRB and the Securities and Exchange Commission (“SEC”). We have conducted a financial analysis of the Company that included a review of audited financial information for the five years ended December 31, 2025, recent unaudited information, regulatory, and internal financial reports through December 31, 2025, and related discussions with the Company’s management. We have discussed the conversion and Merger transactions with the Company’s advisors – KPMG LLP, independent auditor; Kilpatrick Townsend & Stockton LLP, conversion counsel; and Keefe Bruyette & Woods, Inc., investment banker. We have reviewed the pro forma financial impact of the Merger based on data and information in the prospectus, NFBK’s audited financial information for the five years ended December 31, 2025, various unaudited, regulatory, and internal financial reports through December 31, 2025, and related discussions with NFBK’s management. We have incorporated the structural aspects of the second-step conversion and merger into our Appraisal analysis, including but not limited to offering range, transaction expenses, stock benefit plan purchases, merger fair value adjustments, after-tax reinvestment rate, and other accounting adjustments. Our Appraisal conclusion was reached independently from such discussions. In addition, where appropriate, we have considered data and information based on other available published sources that we believe are reliable, however we cannot guarantee the accuracy and completeness of such data and information.
We have considered the competitive, economic and demographic characteristics of the Company’s primary market and operating environment. We have assessed the Company’s relative strengths and weaknesses to the industry and the valuation peer group. We have kept abreast of the changing regulatory and legislative environment for financial institutions and analyzed the potential impact on the Company and the industry as a whole. We have analyzed the potential effects of the second-step conversion and the merger on Company’s financial and operating characteristics. We have incorporated the financial and exchange ratio impact of the contribution of the MHC assets to the Company. We have compared the Company’s financial performance and condition incorporating the NFBK merger with the selected valuation peer group and other publicly-traded financial institutions. In selecting the valuation peer group, we excluded those subject to announced or rumored acquisition or have unusual characteristics. We have reviewed current conditions in the securities markets in general and the market for financial institution stocks and the valuation peer group as well as the market for publicly-traded financial institutions and those that recently completed stock conversions. We have also considered the stock price and trading activity of CLBK’s shares prior to and since the announcement of the second-step conversion and merger.
The Appraisal is based on the Company’s representation that the information contained in the regulatory applications and prospectus and additional data and information furnished to us by the Company, NFBK and their respective advisors are truthful, accurate and complete. We did not independently verify the financial statements and other data and information provided by the Company, NFBK, and their respective independent advisors nor did we independently value the individual assets or liabilities of the Company and NFBK. Our Appraisal is predicated on the Company completing the second-step conversion and merger in a manner consistent that are set forth in the regulatory applications and prospectus. Our Appraisal considers the Company only as a going concern and should not be considered as an indication of liquidation or acquisition value.
Boards of Directors
February 2, 2026
Page 4
Our appraised value is predicated on a continuation of the current operating environment for the Company, NFBK, and for all financial institutions and their holding companies. Changes in the local, state and national economy, the legislative and regulatory environment for financial institutions and holding companies, the stock market, interest rates, and other external forces (such as natural disasters or significant world events) may occur from time to time, often with great unpredictability and may materially impact the value of financial institution stocks as a whole or the value of the Company’s stock alone. To the extent that such factors can be foreseen, they have been factored into our analysis. It is our understanding that CLBK has no current plans to sell control following completion of the second-step conversion and merger.
The estimated pro forma market value is defined as the price at which CLBK’s common stock, immediately upon completion of the second-step conversion and merger, would change hands between a willing buyer and a willing seller, neither being under any compulsion to buy or sell and both having reasonable knowledge of relevant facts.
Valuation Conclusion
It is our opinion that, as of February 2, 2026, the estimated aggregate pro forma value of CLBK’s shares of common stock to be issued and outstanding upon completing the conversion offering – including (1) newly-issued shares representing the MHC’s current ownership interest in the Company and (2) exchange shares issued to CLBK’s public shareholders – was $2,291,268,770 at the midpoint, equal to 229,126,877 shares at $10.00 per share. The resulting range of value and pro forma shares, based on $10.00 per share, is: $1,947,578,450 or 194,757,845 shares at the minimum and adjusted minimum; and $2,634,959,080 or 263,495,908 shares at the maximum.
The resulting midpoint offering amount, based on the MHC’s ownership, is $1,675,000,000, or 1,675,000,000 shares at $10.00 per share, resulting in an offering range, based on $10.00 per share, of: $1,423,750,000 or 142,375,000 shares at the minimum and $1,926,250,000 or 192,625,000 shares at the maximum. If there are unsubscribed offering shares below the minimum of the offering range, the Company may apply up to 41,800,140 of the merger shares to the offering (“adjusted minimum”). Accordingly, at the adjusted minimum of the offering range, the indicated public offering is $1,005,748,600, or 100,574,860 shares at $10.00 per share, with merger shares applied to the offering up to $418,001,140, or 41,800,140 shares at $10.00 per share.
The following table reflects the conversion offering shares, exchange shares for minority shareholders, and merger shares issued to NFBK’s shareholders at the maximum, midpoint and minimum of the range, and the full application of merger shares to the offering in the event of an undersubscribed offering, all based on a $10.00 per share price.
Boards of Directors
February 2, 2026
Page 5
| Shares Conclusion |
2nd Step Offering Shares |
2nd Step Exchange Shares |
Full Conversion Shares |
Shares Issued To Target |
Shares Applied to Offering |
Total Market Capitalization Shares |
Exchange Ratio |
Merger Shares Pct. Of Total |
||||||||||||||||||||||||
| Maximum |
192,625,000 | 70,870,908 | 263,495,908 | 42,973,477 | 0 | 306,469,385 | 2.5340 | 14.02 | % | |||||||||||||||||||||||
| Midpoint |
167,500,000 | 61,626,877 | 229,126,877 | 41,800,140 | 0 | 270,927,017 | 2.2035 | 15.43 | % | |||||||||||||||||||||||
| Minimum |
142,375,000 | 52,382,845 | 194,757,845 | 41,800,140 | 0 | 236,557,985 | 1.8729 | 17.67 | % | |||||||||||||||||||||||
| Adusted Minimum(4) |
100,574,860 | 52,382,845 | 194,757,845 | 0 | 41,800,140 | 194,757,845 | 1.8729 | 21.46 | % | |||||||||||||||||||||||
| Market Value Conclusion |
2nd Step Offering Value |
2nd Step Exchange Shares Value |
Full Conversion Value |
Merger Shares Value |
Merger Shares Applied to Offering |
Total Market Capitalization Value |
||||||||||||||||||
| Maximum |
$ | 1,926,250,000 | $ | 708,709,080 | $ | 2,634,959,080 | $ | 429,734,770 | 0 | $ | 3,064,693,850 | |||||||||||||
| Midpoint |
$ | 1,675,000,000 | $ | 616,268,770 | $ | 2,291,268,770 | $ | 418,001,400 | 0 | $ | 2,709,270,170 | |||||||||||||
| Minimum |
$ | 1,423,750,000 | $ | 523,828,450 | $ | 1,947,578,450 | $ | 418,001,400 | 0 | $ | 2,365,579,850 | |||||||||||||
| Adjusted Minimum(4) |
$ | 1,005,748,600 | $ | 523,828,450 | $ | 1,947,578,450 | $ | 0 | 418,001,400 | $ | 1,947,578,450 | |||||||||||||
Board Establishment of Exchange Ratio
The conversion regulations provide that in second-step conversion the mid-tier company’s minority stockholders are entitled to exchange their shares for newly-issued shares in the fully converted company so as to preserve their current ownership ratio. The exchange ratio for minority shareholders is determined by the Board at the close of the offering based on the total shares issued in the second-step conversion per the final appraisal and the offering price per share determined by the Board. The indicated exchange ratio is then subject to FRB policy potentially leading to minority shareholder dilution with the consolidation of the MHC’s net assets with the issuer’s equity at closing. In the Company’s case, however, the MHC has net liabilities of $48,000, leading to a nominal reduction of equity. Accordingly, no adjustment to the minority shareholder exchange ratio per the FRB policy is applicable in the Company’s second-step conversion. Based on the valuation conclusion herein and resulting offering range and the Board’s determination of a $10.00 per share offering price, the indicated minority exchange ratio is as follows: maximum – 2.5340 shares; midpoint – 2.2035 shares; minimum – 1.8729 shares; and minimum, as adjusted – 1.8729 shares.
Limiting Factors and Considerations
The valuation is not intended, and must not be construed, as a recommendation of any kind as to the advisability of purchasing shares of the common stock. Moreover, because such valuation is determined in accordance with applicable regulatory guidelines and is necessarily based upon estimates and projections of a number of matters, all of which are subject to change from time to time, no assurance can be given that persons who purchase shares of common stock in the conversion offering, or prior to that time, will thereafter be able to buy or sell such shares at prices related to the foregoing valuation of the estimated pro forma market value thereof. The Appraisal reflects only a valuation range as of this date for the pro forma market value of the Company immediately upon issuance of the stock and does not take into account any trading activity with respect to the purchase and sale of common stock in the secondary market on the date of issuance of such securities or at anytime thereafter following the completion of the second-step conversion.
Boards of Directors
February 2, 2026
Page 6
RP Financial’s valuation was based on the financial condition, operations and shares outstanding of CLBK and NFBK as of December 31, 2025, the date of the financial data included in the prospectus. The proposed exchange ratio to be received by the current public stockholders of CLBK and the exchange of the public shares for newly issued shares of the Company’s common stock as a full public company was determined independently by CLBK’s Boards of Directors incorporating the required FRB adjustment for MHC assets.
RP Financial is not a seller of securities within the meaning of any federal and state securities laws and any report prepared by RP Financial shall not be used as an offer or solicitation with respect to the purchase or sale of any securities. RP Financial maintains a policy which prohibits RP Financial, its principals or employees, from purchasing stock of its client institutions.
This Appraisal may be updated as provided for in the conversion regulations and guidelines. These updates will consider, among other things, any developments or changes in the financial performance and condition of the Company and NFBK, management policies, and current conditions in the equity markets for thrift shares, both existing issues and new issues. These updates may also consider changes in other external factors which impact value including but not limited to: various changes in the legislative and regulatory environment for financial institutions, the stock market and the market for financial institution stocks, and interest rates. Should any such new developments or changes be material, in our opinion, to the valuation of the shares, appropriate adjustments to the estimated pro forma market value will be made. The reasons for any such adjustments will be explained in the update at the date of the release of the update. The Appraisal will also be updated concurrent with the completion of stock offering and merger.
| Respectfully submitted, |
| RP® FINANCIAL, LC. |

|
| Ronald S. Riggins |
| Managing Director |

|
| Gregory E. Dunn |
| Director |
| RP® Financial, LC. | TABLE OF CONTENTS i |
TABLE OF CONTENTS
COLUMBIA FINANCIAL, INC.
COLUMBIA BANK
Fair Lawn, New Jersey
| DESCRIPTION |
PAGE |
|||
| CHAPTER ONE OVERVIEW AND FINANCIAL ANALYSIS |
| |||
| Introduction |
I.1 | |||
| Plan of Conversion |
I.2 | |||
| Acquisition of Northfield Bancorp, Inc. |
I.2 | |||
| Strategic Overview |
I.4 | |||
| Reasons for the Acquisition of Northfield Bancorp, Inc. |
I.5 | |||
| Reasons for the Second-Step Conversion and Use of Proceeds |
I.6 | |||
| Balance Sheet Trends |
I.7 | |||
| Pro Forma Balance Sheet Impact of Northfield Bancorp Acquisition |
I.11 | |||
| Income and Expense Trends |
I.11 | |||
| Pro Forma Earnings Impact of Northfield Bancorp Acquisition |
I.14 | |||
| Interest Rate Risk Management |
I.15 | |||
| Lending Activities and Strategy |
I.16 | |||
| Asset Quality |
I.19 | |||
| Funding Composition and Strategy |
I.20 | |||
| Subsidiaries |
I.21 | |||
| Legal Proceedings |
I.23 | |||
| CHAPTER TWO MARKET AREA ANALYSIS |
| |||
| Introduction |
II.1 | |||
| National Economic Factors |
II.1 | |||
| Market Area Demographics |
II.5 | |||
| Local Economy |
II.9 | |||
| Unemployment Trends |
II.11 | |||
| Market Area Deposit Characteristics and Competition |
II.12 | |||
| CHAPTER THREE PEER GROUP ANALYSIS |
| |||
| Peer Group Selection |
III.1 | |||
| Financial Condition |
III.6 | |||
| Income and Expense Components |
III.9 | |||
| Loan Composition |
III.11 | |||
| Interest Rate Risk |
III.13 | |||
| Credit Risk |
III.15 | |||
| Summary |
III.15 | |||
| RP® Financial, LC. | TABLE OF CONTENTS ii |
TABLE OF CONTENTS
COLUMBIA FINANCIAL, INC.
COLUMBIA BANK
Fair Lawn, New Jersey
(continued)
| DESCRIPTION |
PAGE NUMBER |
|||
| CHAPTER FOUR VALUATION ANALYSIS |
| |||
| Introduction |
IV.1 | |||
| Appraisal Guidelines |
IV.1 | |||
| RP Financial Approach to the Valuation |
IV.1 | |||
| Valuation Analysis |
IV.2 | |||
| 1. Financial Condition |
IV.3 | |||
| 2. Profitability, Growth and Viability of Earnings |
IV.4 | |||
| 3. Asset Growth |
IV.6 | |||
| 4. Primary Market Area |
IV.6 | |||
| 5. Dividends |
IV.8 | |||
| 6. Liquidity of the Shares |
IV.8 | |||
| 7. Marketing of the Issue |
IV.9 | |||
| A. The Public Market |
IV.9 | |||
| B. The New Issue Market |
IV.14 | |||
| C. The Acquisition Market |
IV.15 | |||
| D. Trading in CLBK’s Stock |
IV.17 | |||
| 8. Management |
IV.18 | |||
| 9. Effect of Government Regulation and Regulatory Reform |
IV.18 | |||
| Summary of Adjustments |
IV.18 | |||
| Valuation Approaches |
IV.19 | |||
| 1. Price-to-Earnings (“P/E”) |
IV.21 | |||
| 2. Price-to-Book (“P/B”) |
IV.23 | |||
| 3. Price-to-Assets (“P/A”) |
IV.23 | |||
| Comparison to Recent Offerings |
IV.24 | |||
| Valuation Conclusion |
IV.24 | |||
| Establishment of the Exchange Ratio |
IV.25 | |||
| RP® Financial, LC. | LIST OF TABLES iii |
LIST OF TABLES
COLUMBIA FINANCIAL, INC.
COLUMBIA BANK
Fair Lawn, New Jersey
| TABLE | ||||||
| NUMBER | DESCRIPTION | PAGE | ||||
| 1.1 | Historical Balance Sheet Data | I.8 | ||||
| 1.2 | Historical Income Statements | I.12 | ||||
| 2.1 | Summary Demographic Data | II.6 | ||||
| 2.2 | Primary Market Area Employment Sectors | II.10 | ||||
| 2.3 | Top Employers in Market Area | II.10 | ||||
| 2.4 | Unemployment Trends | II.11 | ||||
| 2.5 | Deposit Summary | II.13 | ||||
| 2.6 | Market Area Deposit Competitors | II.14 | ||||
| 3.1 | Peer Group of Publicly-Traded Banks and Thrifts | III.3 | ||||
| 3.2 | Balance Sheet Composition and Growth Rates | III.7 | ||||
| 3.3 | Income as a % of Average Assets and Yields, Costs, Spreads | III.10 | ||||
| 3.4 | Loan Portfolio Composition and Related Information | III.12 | ||||
| 3.5 | Interest Rate Risk Measures and Net Interest Income Volatility | III.14 | ||||
| 3.6 | Credit Risk Measures and Related Information | III.16 | ||||
| 4.1 | Market Area Unemployment Rates | IV.7 | ||||
| 4.2 | Pricing Characteristics and After-Market Trends | IV.16 | ||||
| 4.3 | Pro Forma Market Pricing Versus Peer Group | IV.22 | ||||
| RP® Financial, LC. | OVERVIEW AND FINANCIAL ANALYSIS I.1 |
I. OVERVIEW AND FINANCIAL ANALYSIS
Introduction
Columbia Bank (the “Bank”), founded in 1927, is a federally chartered stock savings bank headquartered in Fairlawn, New Jersey. The Bank serves the state of New Jersey and the suburbs surrounding the New York City and Philadelphia metropolitan areas through its headquarters office and 71 full service branch offices, all of which are located in the state of New Jersey. The Bank is subject to regulation and oversight by the Office of the Comptroller of the Currency (the “OCC”). On October 15, 2020 the Bank elected to operate as a “Covered Savings Association”, per section 5A of the Homeowners’ Loan Act (“HOLA”), enabling it to have the same rights and privileges as national banks and continue its commercial bank transitioning. The Bank is a member of the Federal Home Loan Bank (“FHLB”) system, and its deposits are insured up to the regulatory limits by the Federal Deposit Insurance Corporation (the “FDIC”).
Columbia Financial, Inc. (“CLBK”) is the mid-tier holding company of the Bank and owns 100% of the outstanding common stock of the Bank. CLBK is a Delaware corporation that was organized on March 1997 and has since been engaged primarily in the business of holding the common stock of the Bank. Columbia Bank, MHC (the “MHC”) was also organized in March 1997 and is the federally-chartered mutual holding company parent of CLBK. CLBK completed its initial public offering (“IPO”) on April 19, 2018, pursuant to which it sold 49,832,345 shares or 43.0% of its outstanding common stock to the public and issued 62,580,155 shares or 54.0% of its common stock outstanding to the MHC. Additionally, CLBK issued 3,476,675 shares of common stock or 3.0% of its common stock outstanding to the Columbia Bank Foundation. Since the IPO, stock repurchase programs conducted by CLBK have reduced the total number of public shares outstanding, while shares issued to the MHC in connection with acquisitions completed by CLBK of other mutual holding companies and their bank subsidiaries have increased the number of MHC shares outstanding. The MHC and CLBK are subject to supervision and regulation by the Board of Governors of the Federal Reserve System (the “Federal Reserve Board” or the “FRB”). At December 31, 2025, CLBK had total consolidated assets of $11.0 billion, deposits of $8.4 billion and equity of $1.2 billion or 10.53% of total assets. Excluding goodwill and core deposit intangibles of $117.7 million, CLBK’s tangible equity equaled $1.0 billion or 9.47% of total assets at December 31, 2025. CLBK’s audited financial statements for the most recent period are included by reference as Exhibit I-1.
| RP® Financial, LC. | OVERVIEW AND FINANCIAL ANALYSIS I.2 |
Plan of Conversion
On January 31, 2026, the respective Boards of Directors of the MHC and CLBK adopted the Plan of Conversion whereby the MHC will convert to stock form. As a result of the conversion, CLBK, which currently owns all of the issued and outstanding common stock of the Bank, will be succeeded by a new Maryland corporation with the name of Columbia Financial, Inc. (“Columbia Financial” or the “Company”). Following the conversion, the MHC will no longer exist. For purposes of this document, the existing consolidated entity will hereinafter also be referred to as Columbia Financial or the Company, unless otherwise identified as CLBK. As of December 31, 2025, the MHC had a majority ownership interest in, and its principal asset consisted of, approximately 73.10% of the common stock (the “MHC Shares”) of CLBK. The remaining 26.90% of CLBK’s common stock was owned by public shareholders.
Pursuant to the Plan of Conversion, it is our understanding that Columbia Financial will offer its stock representing the majority ownership interest held by the MHC in a subscription offering to Eligible Account Holders, Tax-Qualified Employee Plans including the Bank’s employee stock ownership plan (the “ESOP”), Supplemental Eligible Account Holders and Other Members, as such terms are defined for purposes of applicable federal regulatory requirements governing mutual-to-stock conversions. To the extent that shares remain available for purchase after satisfaction of all subscriptions received in the subscription offering, the shares may be offered for sale to the general public in a community offering and a firm commitment offering. Upon completing the mutual-to-stock conversion and stock offering (the “second-step conversion”), the Company will be 100% owned by public shareholders, the publicly-held shares of CLBK will be exchanged for shares in the Company at a ratio that retains their ownership interest at the time the conversion is completed and the MHC assets will be consolidated with the Company.
Acquisition of Northfield Bancorp, Inc.
In connection with the second-step conversion, the Boards of Directors of CLBK, Columbia Financial and the MHC entered into an Agreement and Plan of Merger (the “Agreement”) with Northfield Bancorp, Inc., Woodbridge, New Jersey (“Northfield Bancorp”). Pursuant to the Agreement, Northfield Bancorp will merge with and into Columbia Financial, with Columbia Financial as the surviving entity (the “Merger”). Immediately following the Merger, Northfield Bank, a federal savings bank and a wholly owned subsidiary of Northfield Bancorp, will merge with and into Columbia Bank with Columbia Bank as the surviving entity.
| RP® Financial, LC. | OVERVIEW AND FINANCIAL ANALYSIS I.3 |
As set forth in Agreement, if the Final Independent Valuation (full conversion value) is less than $2.3 billion, Northfield Bancorp shareholders may elect to receive 1.425 shares of Columbia Financial common stock, based on a $10.00 per share offering price, or $14.25 in cash for each share of Northfield Bancorp common stock. If the Final Independent Valuation is equal to or greater than $2.3 billion and less than $2.6 billion, Northfield Bancorp shareholders may elect to receive 1.450 shares of Columbia Financial common stock, based on a $10.00 per share offering price, or $14.50 in cash for each share of Northfield Bancorp common stock. If the Final Independent Valuation is equal to or greater than $2.6 billion, Northfield Bancorp shareholders may elect to receive 1.465 shares of Columbia Financial common stock, based on a $10.00 per share offering price, or $14.65 in cash for each share of Northfield Bancorp common stock. The proration procedures set forth in the Agreement require that the cash consideration shall not be greater than 30% of the total merger consideration. The aggregate transaction value of the merger consideration, based on an exchange ratio of 1.425x which is the exchange ratio at the midpoint of the offering range, is approximately $597.1 million. Based on Northfield Bancorp’s consolidated balance sheet at December 31, 2025 and estimated fair value accounting adjustments, total intangible assets resulting from the acquisition have been estimated to equal $73.3 million.
Northfield Bancorp, Inc.
Northfield Bancorp is a Delaware corporation and is the bank holding company for Northfield Bank, which is the primary asset of Northfield Bancorp. Northfield Bancorp’s common stock is listed on the NASDAQ Global Market under the symbol “NFBK”. As of December 31, 2025, Northfield Bancorp reported consolidated assets of $5.8 billion, net loans receivable of $3.8 billion, deposits of $4.0 billion, borrowings of $900.2 million, subordinated debt of $61.7 million and stockholders’ equity of $690.1 million, equal to 11.99% of total assets. Northfield Bancorp reported earnings for the year ended December 31, 2025 of $790,000 equal to 0.01% of average assets. Earnings for 2025 were negatively impacted by a $41.0 million charge for impairment of goodwill.
| RP® Financial, LC. | OVERVIEW AND FINANCIAL ANALYSIS I.4 |
Northfield Bank
Northfield Bank was organized in 1887 and is a federally chartered savings bank. Northfield Bank conducts business from its operations center located in Woodbridge, New Jersey, its home office located at a branch in Staten Island, New York and its 36 additional branch offices located in Staten Island, Brooklyn, and the New Jersey counties of Hunterdon, Mercer, Middlesex and Union. Northfield Bank is subject to regulation, examination and supervision by the OCC.
Strategic Overview
Columbia Financial maintains a local community banking emphasis with a primary strategic objective of meeting the borrowing and savings needs of consumers and businesses throughout its market area. The Company considers its market area to be the state of New Jersy and the suburbs surrounding the New York City and Philadelphia metropolitan areas. In recent years, the Company has pursued a strategy of evolving its business model into that of a full service community bank through growing a diversified loan portfolio, increasing core deposits, building non-interest revenue sources and expansion and diversification of the bank franchise through acquisitions. In addition to offering traditional community bank financial services, Columbia Bank maintains wholly owned subsidiaries that offer title insurance and insurance products and investment solutions including personal and business lines of insurance. The Company also offers wealth management services through a third-party relationship.
Columbia Financial’s earnings base is largely dependent upon net interest income and operating expense levels. After experiencing net interest margin compression in 2023 and 2024, the Company’s net interest margin increased in 2025. Net interest margin compression in 2023 and 2024 was due to a more significant increase in the cost of interest-bearing liabilities relative to the increase in yield earned on interest-earning assets, while the increase in the net interest margin during 2025 was facilitated by a balance sheet repositioning transaction completed in the fourth quarter of 2024. During the fourth quarter of 2024, the Company sold $352.3 million of lower yielding available for sale investment securities and the proceeds from the sale were used to fund loan growth, purchase higher yielding investment securities and prepay higher cost borrowings. Operating expenses and revenues derived from sources of non-interest operating income have been maintained at relatively low levels as percent of average assets, while credit loss provisions have generally been a limited factor in the Company’ earnings. Non-operating income and losses were a more significant factor in the Company earnings during 2023 and 2024, which was due to losses recorded on investment securities transactions.
| RP® Financial, LC. | OVERVIEW AND FINANCIAL ANALYSIS I.5 |
Beginning in 2019, the Company has supplemented organic growth through the acquisition of four financial institutions and an insurance agency:
| • | On November 1 2019, the Company completed the acquisition of Stewardship Financial Corporation (“Stewardship Financial”) and its wholly-owned subsidiary, Atlantic Stewardship Bank, a $964 million bank based in Midland Park, New Jersey. |
| • | On April 1, 2020, the Company completed the acquisition of RSB Bancorp, MHC, RSB Bancorp, Inc. and its wholly-owned subsidiary Roselle Bank, a $422 million bank based in Roselle, New Jersey. |
| • | On December 1, 2021, the Company completed the acquisition of Freehold Bancorp, MHC, Freehold Bancorp, Inc. and its wholly owned subsidiary Freehold Bank, a $294 million bank based in Freehold, New Jersey. |
| • | On May 1, 2022, the Company completed the acquisition of RSI Bancorp, M.H.C., RSI Bancorp, Inc. and its wholly owned subsidiary RSI Bank, a $621 million bank based in Rahway, New Jersey. |
| • | On September 17, 2025, the Company completed the acquisition of Jeanne S. Frey Insurance Agency, Inc., a provider of insurance brokerage services based in Newfoundland, New Jersey. |
Reasons for the Acquisition of Northfield Bancorp
Through the acquisition of Northfield Bancorp, the Company will increase its market presence in certain New Jersey markets and provide an expansion of the Company’s markets into the New York City markets of Staten Island and Brooklyn. A map of the Company’s branch network following the acquisition of Northfield Bancorp is set forth in Exhibit I-2. Other reasons for the merger are set forth below.
| • | The combined entity is expected to meaningfully increase net income and return on assets. |
| • | The merger effectively leverages a portion of the capital raised in the offering. |
| • | The larger branch network and expanded geographic presence will enhance customer convenience and facilitate opportunities for growth at all of the Company’s branches. |
| • | The combined entity will have a larger customer base for purposes of cross-selling the Company’s products and services. |
| RP® Financial, LC. | OVERVIEW AND FINANCIAL ANALYSIS I.6 |
| • | The larger asset size, geographic presence and market capitalization that will result from the acquisition will better position the Company to pursue other strategic acquisitions. |
| • | The combined entity will enhance infrastructure resources to facilitate broadening of products and services capabilities, as well as improve product delivery and efficiency. |
| • | Certain operating synergies, net of certain consolidation costs, are anticipated as a result of the merger, including: |
| — | Elimination of certain duplicative professional services, such as legal, audit and tax and consulting; and |
| — | Spreading securities, shareholder reporting and regulatory reporting and examination expenses over a larger asset base. |
Reasons for Second-Step Coversino and Use of Proceeds
A key component of the Company’s business plan is to complete a second-step conversion offering. The second-step offering will strengthen the Company’s capital position and support growth for purposes of building shareholder value, most notably through the acquisition of Northfield Bancorp. A portion of the conversion proceeds will be utilized to fund the cash consideration to be paid for the acquisition and other merger costs. Additionally, the second-step conversion and increased capital resources that will result from the sale and issuance of common stock will support: (1) expansion of lending and deposit gathering activities with a broader geographic distribution and larger lending platform; (2) potential expansion and diversification of operations through acquisitions of other financial institutions or de novo branching as opportunities arise; (3) strengthening of competitive position; (4) earnings enhancements that will be realized from the combined institutions through leveraging of infrastructure and implementation of operating efficiencies; (5) increasing stockholder returns through higher earnings and more flexible capital management strategies, including elimination of the current limitations imposed by the mutual holding company structure on dividend payments; and (6) as a fully-converted stock holding company, there will be a more liquid and active trading market for the Company’s stock and the Company will have greater flexibility to access capital markets through possible future equity and debt offerings. The projected use of proceeds is highlighted below.
| • | Columbia Financial. The Company is expected to retain up to 50% of the net offering proceeds. At present, funds at the Company level, net of the loan to the ESOP, will be used to fund the cash portion of the merger consideration and other related merger costs incurred to facilitate the acquisition of Northfield Bancorp. The remaining balance of cash is expected to be invested into a |
| RP® Financial, LC. | OVERVIEW AND FINANCIAL ANALYSIS I.7 |
| deposit at the Bank. The approximate cash cost to be paid for the acquisition is $179.1 million, assuming an acquisition exchange ratio of 1.425x and 30% of the consideration is cash. Over time, the funds held in a deposit at the Bank may be utilized for various corporate purposes, possibly including acquisitions, infusing additional equity into the Bank, repurchases of common stock and the payment of cash dividends. |
| • | Columbia Bank. Approximately 50% of the net offering proceeds will be infused into the Bank. Cash proceeds infused into the Bank will initially become part of general funds, the substantial portion of which will be deployed into loans and investments. Under the terms of the merger agreement, Northfield Bank will be merged into Columbia Bank. |
Overall, it is the Company’s objective to pursue controlled growth that will serve to increase returns, while continuing to emphasize management of the overall risk associated with Columbia Financial’s operations.
Balance Sheet Trends
Table 1.1 shows the Company’s historical balance sheet data for the past five years through December 31, 2025, as well as the Company’s pro forma balance sheet at December 31, 2025. The pro forma balance sheet reflects the acquisition of Northfield Bancorp before incorporating the capital to be raised in the stock offering. The following discussion describes the historical balance sheet trends for Columbia Financial on a pre-acquisition basis. The pro forma balance sheet impact of the acquisition of Northfield Bancorp will be discussed at the end of this section.
Asset growth trends from yearend 2021 through yearend 2025 show asset growth was stronger in 2022 and 2025, while total assets declined in 2024. The stronger asset growth recorded in 2022 was in part attributable to acquisition-related growth. Loan growth was the main driver of the Company’s asset growth, with a combination of deposit growth and increased utilization of borrowings constituting the primary funding sources for the asset growth. Overall, the Company’s assets increased from $9.2 billion at yearend 2021 to $11.0 billion at yearend 2025, which provided for an annual growth rate of 4.54%. A summary of Columbia Financial’s key operating ratios for the past five years is presented in Exhibit I-3.
Columbia Financial’s loans receivable portfolio increased at a 6.90% annual rate from yearend 2021 through yearend 2025, in which the loans receivable balance trended higher throughout the period with the strongest growth occurring in 2022 and 2025. Net loans receivable at December 31, 2015 totaled $8.2 billion, versus $6.3 billion at December 31, 2021.
| RP® Financial, LC. | OVERVIEW AND FINANCIAL ANALYSIS I.8 |
Table 1.1
Columbia Financial, Inc.
Historical Balance Sheet Data
| 12/31/21- | ||||||||||||||||||||||||||||||||||||||||||||||||||||
| At December 31, | 12/31/25 Annual. Growth Rate |
Pro Forma Combined(2) At December 31, |
||||||||||||||||||||||||||||||||||||||||||||||||||
| 2021 | 2022 | 2023 | 2024 | 2025 | 2025 | |||||||||||||||||||||||||||||||||||||||||||||||
| Amount | Pct(1) | Amount | Pct(1) | Amount | Pct(1) | Amount | Pct(1) | Amount | Pct(1) | Pct | Amount | Pct(1) | ||||||||||||||||||||||||||||||||||||||||
| ($000) | (%) | ($000) | (%) | ($000) | (%) | ($000) | (%) | ($000) | (%) | (%) | ($000) | (%) | ||||||||||||||||||||||||||||||||||||||||
| Total Amount of: |
||||||||||||||||||||||||||||||||||||||||||||||||||||
| Assets |
$ | 9,224,097 | 100.00 | % | $ | 10,408,169 | 100.00 | % | $ | 10,645,568 | 100.00 | % | $ | 10,475,493 | 100.00 | % | $ | 11,018,793 | 100.00 | % | 4.54 | % | $ | 16,488,131 | 100.00 | % | ||||||||||||||||||||||||||
| Cash and cash equivalents |
70,963 | 0.77 | % | 179,228 | 1.72 | % | 423,249 | 3.98 | % | 289,223 | 2.76 | % | 340,806 | 3.09 | % | 48.04 | % | 297,219 | 1.80 | % | ||||||||||||||||||||||||||||||||
| Investment securities |
2,136,291 | 23.16 | % | 1,753,541 | 16.85 | % | 1,498,790 | 14.08 | % | 1,425,009 | 13.60 | % | 1,525,052 | 13.84 | % | -8.08 | % | 2,965,497 | 17.99 | % | ||||||||||||||||||||||||||||||||
| Loans receivable, net |
6,297,912 | 68.28 | % | 7,624,761 | 73.26 | % | 7,819,441 | 73.45 | % | 7,856,970 | 75.00 | % | 8,224,809 | 74.64 | % | 6.90 | % | 11,863,328 | 71.95 | % | ||||||||||||||||||||||||||||||||
| Bank owned life insurance |
247,474 | 2.68 | % | 264,854 | 2.54 | % | 268,362 | 2.52 | % | 274,908 | 2.62 | % | 283,094 | 2.57 | % | 3.42 | % | 465,922 | 2.83 | % | ||||||||||||||||||||||||||||||||
| FHLB stock |
23,141 | 0.25 | % | 58,114 | 0.56 | % | 81,022 | 0.76 | % | 60,387 | 0.58 | % | 64,604 | 0.59 | % | 29.26 | % | 111,172 | 0.67 | % | ||||||||||||||||||||||||||||||||
| Goodwill and intangible assets |
90,538 | 0.98 | % | 124,222 | 1.19 | % | 121,870 | 1.14 | % | 119,679 | 1.14 | % | 117,661 | 1.07 | % | 6.77 | % | 190,926 | 1.16 | % | ||||||||||||||||||||||||||||||||
| Deposits |
7,570,216 | 82.07 | % | 8,001,159 | 76.87 | % | 7,846,556 | 73.71 | % | 8,096,149 | 77.29 | % | 8,444,079 | 76.63 | % | 2.77 | % | 12,458,526 | 75.56 | % | ||||||||||||||||||||||||||||||||
| Borrowings |
377,309 | 4.09 | % | 1,127,047 | 10.83 | % | 1,528,695 | 14.36 | % | 1,080,600 | 10.32 | % | 1,183,472 | 10.74 | % | 33.08 | % | 2,145,504 | 13.01 | % | ||||||||||||||||||||||||||||||||
| Equity |
1,079,081 | 11.70 | % | 1,053,595 | 10.12 | % | 1,040,335 | 9.77 | % | 1,080,376 | 10.31 | % | 1,160,728 | 10.53 | % | 1.84 | % | 1,567,325 | 9.51 | % | ||||||||||||||||||||||||||||||||
| Tangible equity |
988,543 | 10.72 | % | 929,373 | 8.93 | % | 918,465 | 8.63 | % | 960,697 | 9.17 | % | 1,043,067 | 9.47 | % | 1.35 | % | 1,376,399 | 8.35 | % | ||||||||||||||||||||||||||||||||
| Loans/Deposits |
83.19 | % | 95.30 | % | 99.65 | % | 97.05 | % | 97.40 | % | 95.22 | % | ||||||||||||||||||||||||||||||||||||||||
| Full Service Banking Offices Open |
62 | 66 | 65 | 68 | 71 | 108 | ||||||||||||||||||||||||||||||||||||||||||||||
| (1) | Ratios are as a percent of ending assets. |
| (2) | Includes fair value accounting adjustments for the acquisition of Northfield Bancorp. |
Sources: Columbia Financial’s prospectus, Columbia Financial’s and Northfield Bancorp’s audited & unaudited financial statements, Columbia Bank’s and Northfield Bank’s FDIC Call Reports and RP Financial calculations.
| RP® Financial, LC. | OVERVIEW AND FINANCIAL ANALYSIS I.9 |
The Company’s higher loan growth rate compared to its asset growth rate provided for an increase in the loans-to-assets ratio from 68.28% at yearend 2021 to 74.64% at yearend 2025.
Trends in the Company’s loan portfolio composition during 2025 show that the concentration of 1-4 family mortgage loans decreased, equaling 34.4% and 31.0% of total loans at year ends 2024 and 2025, respectively. The decrease in the concentration of 1-4 family loans during 2025 was offset by increases in the concentrations of multi-family loans (18.6% to 20.4%), commercial real estate loans (29.7% to 30.5%) and commercial business loans (7.9% to 9.3%). The remaining loan composition trends for 2025 showed that the concentration of construction loans decreased from 6.0% of total loans to 5.7% of total loans and consumer loans decreased from 3.3% of total loans to 3.1% of total loans.
The intent of the Company’s investment policy is to provide adequate liquidity and to generate a favorable return within the context of supporting Columbia Financial’s overall credit and interest rate risk objectives. It is anticipated that proceeds retained at the holding company level, net of the proceeds used to fund the acquisition of Northfield Bancorp, will primarily be invested into short-term liquid funds held as a deposit at the Bank. Over the past five years, the Company’s level of cash and investment securities (inclusive of FHLB stock) ranged from a low of 16.94% of assets at yearend 2024 to a high of 24.18% of assets at yearend 2021 and equaled 17.52% of assets at yearend 2025. As previously noted, the Company sold $352.3 million of investment securities during the fourth quarter of 2024 to facilitate net interest margin expansion and improve future earnings. Mortgage-backed securities and collateralized mortgage obligations totaling $1.0 billion comprised the most significant component of the Company’s investment portfolio at December 31, 2025. Other investments held by the Company at December 31, 2025 consisted of U.S. government and agency obligations ($443.3 million), corporate debt securities ($66.6 million), equity securities ($6.8 million) and municipal bonds ($2.0 million). As of December 31, 2025, investments designated as held to maturity totaled $396.2 million and investments designated as available for sale totaled 1.122 billion. Investments maintained as available-at December 31, 2025 had a net unrealized loss of $78.2 million. Exhibit I-4 provides historical detail of the Company’s investment portfolio. As of December 31, 2025, the Company also held $340.8 million of cash and cash equivalents and $64.6 million of FHLB stock.
| RP® Financial, LC. | OVERVIEW AND FINANCIAL ANALYSIS I.10 |
The Company also maintains an investment in bank-owned life insurance (“BOLI”) policies, which covers the lives of certain key employees and non-employee directors of the Company. The life insurance policies earn tax-exempt income through cash value accumulation and death proceeds. As of December 31, 2025, the cash surrender value of the Company’s BOLI equaled $283.1 million or 2.57% of assets.
Over the past five fiscal years, Columbia Financial’s funding needs have been addressed through a combination of deposits, borrowings, and internal cash flows. From December 31, 2021 through December 31, 2025, the Company’s deposits increased at a 2.77% annual rate with three of the past four years showing an increase in deposits. Overall, deposits increased from $7.570 billion or 82.07% of assets at December 31, 2021 to $8.444 billion or 76.63% of assets at December 31, 2025. Deposit composition trends from yearend 2023 through yearend 2025 reflect that deposit growth was primarily driven by growth of certificates of deposit (“CDs”), which provided for a decrease in the concentration of transaction and savings accounts comprising total deposits. Transaction and savings account deposits comprised 68.31% of total deposits at December 31, 2023 and 66.22% of total deposits at December 31, 2025.
Borrowings serve as an alternative funding source for the Company to address funding needs for growth and to support management of funding costs and interest rate risk. From December 31, 2021 through December 31, 2025, borrowings increased at an annual rate of 33.08%. Overall, borrowings increased from $377.3 million or 4.09% of assets at December 31, 2021 to $1.183 billion or 10.74% of assets at December 31, 2025. Borrowings currently held by the Company consist substantially of FHLB advances and include a small balance of junior subordinated debt that was acquired in the Stewardship Financial merger.
The Company’s equity increased at a 1.84% annual rate from yearend 2021 through yearend 2025, which was largely attributable to retention of earnings being somewhat offset by an increase in treasury stock and an increase in the adjustment for accumulated other comprehensive loss. Stronger asset growth relative to equity growth provided for a decline in the Company’s equity-to-assets ratio from 11.70% at December 31, 2021 to 10.53% at December 31, 2025. Similarly, the Company’s tangible equity-to-assets ratio declined from 10.72% at December 31, 2021 to 9.47% at December 31, 2025. Goodwill and other intangibles totaled $117.7 million or 1.07% of assets at December 31, 2025, consisting of $110.7 million of goodwill and $6.9 million of core deposit intangibles. The Bank maintained capital surpluses relative to all of its regulatory capital requirements at December 31, 2025. The addition of stock proceeds will serve to strengthen the Company’s capital position, as well as support growth opportunities. At the same time, the significant increase in Columbia Financial’s pro forma capital position will initially depress its ROE.
| RP® Financial, LC. | OVERVIEW AND FINANCIAL ANALYSIS I.11 |
Pro Forma Balance Sheet Impact of Northfield Bancorp Acquisition
The pro forma balance sheet impact of the Northfield Bancorp acquisition is shown in Table 1.1 as of December 31, 2025. On the asset side of the balance sheet, the ratio of loans-to-assets will decrease and the level of cash and investments comprising total assets will increase before factoring in the infusion of the net conversion proceeds. The increase in the pro forma level of cash and investments includes the impact of funding the cash consideration and related acquisition costs, which have been estimated to total $221.4 million in the pro forma adjustments. Intangible assets increased from $117.7 million or 1.07% of assets to $190.9 million or 1.16% of assets on a pro forma combined basis. Pro forma intangible assets consisted of $110.7 million of goodwill and $80.2 million of core deposit intangibles. On the liability side of the balance sheet, deposits decrease from 76.63% of assets to 75.56% of assets on a pro forma combined basis, while borrowings increase from 10.74% of assets to 13.01% of assets on a pro forma combined basis. Before factoring in the impact of the second-step stock offering proceeds, the Company’s equity-to-asset ratio decreases from 10.53% to 9.51% on a pro forma combined basis and the tangible equity-to-assets ratio decreases from 9.47 to 8.35% on a pro forma combined basis.
Income and Expense Trends
Table 1.2 shows the Company’s historical income statements for the past five years, as well as on a pro forma income basis for the twelve months ended December 31, 2025 giving effect to the acquisition of Northfield Bancorp. The following discussion describes the historical income statements of Columbia Financial on a pre-acquisition basis. The pro forma income statement impact of the acquisition of Northfield Bancorp is discussed at the end of this section.
Over the past five years, the Company’s reported earnings ranged from a net loss of $11.7 million or 0.11% of average assets in 2024 to net income of $92.0 million or 1.01% of average assets in 2021. For 2025, the Company reported net income of $51.8 million or 0.48% of average assets. Net interest income and operating expenses represent the primary components of the Company’s earnings. Non-interest operating income has been a stable and somewhat limited source of earnings for the Company. Credit loss provisions have fluctuated over the past five years but generally have not had a significant impact on earnings. Non-operating income and losses had a more significant impact on the Company’s earnings in 2023 and 2024, which stemmed from losses recorded on investment securities transactions.
| RP® Financial, LC. | OVERVIEW AND FINANCIAL ANALYSIS Page I.12 |
Table 1.2
Columbia Financial, Inc.
Historical Income Statements
| Pro Forma Combined | ||||||||||||||||||||||||||||||||||||||||||||||||
| For the Year Ended December 31, | For the 12 months Ended 12/31/25(5) |
|||||||||||||||||||||||||||||||||||||||||||||||
| 2021 | 2022 | 2023 | 2024 | 2025 | ||||||||||||||||||||||||||||||||||||||||||||
| Amount | Pct(1) | Amount | Pct(1) | Amount | Pct(1) | Amount | Pct(1) | Amount | Pct(1) | Amount | Pct(1) | |||||||||||||||||||||||||||||||||||||
| ($000) | (%) | ($000) | (%) | ($000) | (%) | ($000) | (%) | ($000) | (%) | ($000) | (%) | |||||||||||||||||||||||||||||||||||||
| Interest income |
$ | 270,150 | 2.97 | % | $ | 309,670 | 3.18 | % | $ | 394,978 | 3.81 | % | $ | 451,426 | 4.24 | % | $ | 470,951 | 4.37 | % | $ | 755,580 | 4.69 | % | ||||||||||||||||||||||||
| Interest expense |
(37,016 | ) | -0.41 | % | (42,893 | ) | -0.44 | % | (189,102 | ) | -1.82 | % | (273,444 | ) | -2.57 | % | (249,317 | ) | -2.32 | % | ($ | 361,464 | ) | -2.24 | % | |||||||||||||||||||||||
|
|
|
|
|
|
|
|
|
|
|
|
|
|
|
|
|
|
|
|
|
|
|
|
|
|||||||||||||||||||||||||
| Net interest income |
$ | 233,134 | 2.56 | % | $ | 266,777 | 2.74 | % | $ | 205,876 | 1.99 | % | $ | 177,982 | 1.67 | % | $ | 221,634 | 2.06 | % | $ | 394,116 | 2.45 | % | ||||||||||||||||||||||||
| Provision for credit losses |
9,953 | 0.11 | % | (5,485 | ) | -0.06 | % | (4,787 | ) | -0.05 | % | (14,451 | ) | -0.14 | % | (9,822 | ) | -0.09 | % | ($ | 17,224 | ) | -0.11 | % | ||||||||||||||||||||||||
|
|
|
|
|
|
|
|
|
|
|
|
|
|
|
|
|
|
|
|
|
|
|
|
|
|||||||||||||||||||||||||
| Net interest income after provisions |
$ | 243,087 | 2.67 | % | $ | 261,292 | 2.68 | % | $ | 201,089 | 1.94 | % | $ | 163,531 | 1.53 | % | $ | 211,812 | 1.97 | % | $ | 376,892 | 2.34 | % | ||||||||||||||||||||||||
| Non-interest operating income |
$ | 38,598 | 0.42 | % | $ | 30,591 | 0.31 | % | $ | 37,531 | 0.36 | % | $ | 35,151 | 0.33 | % | $ | 35,906 | 0.33 | % | $ | 50,220 | 0.31 | % | ||||||||||||||||||||||||
| Non-interest operating expense |
(154,915 | ) | -1.70 | % | (172,006 | ) | -1.77 | % | (181,811 | ) | -1.75 | % | (179,670 | ) | -1.69 | % | (180,678 | ) | -1.68 | % | (281,676 | ) | -1.75 | % | ||||||||||||||||||||||||
|
|
|
|
|
|
|
|
|
|
|
|
|
|
|
|
|
|
|
|
|
|
|
|
|
|||||||||||||||||||||||||
| Net operating income |
$ | 126,770 | 1.39 | % | $ | 119,877 | 1.23 | % | $ | 56,809 | 0.55 | % | $ | 19,012 | 0.18 | % | $ | 67,040 | 0.62 | % | $ | 145,436 | 0.90 | % | ||||||||||||||||||||||||
| Non-Operating Income(Loss) |
||||||||||||||||||||||||||||||||||||||||||||||||
| Gain (loss) on securities |
$ | 2,025 | 0.02 | % | $ | 210 | 0.00 | % | ($ | 10,847 | ) | -0.10 | % | ($ | 35,851 | ) | -0.34 | % | $ | 290 | 0.00 | % | $ | 290 | 0.00 | % | ||||||||||||||||||||||
| Change in fair value of equity securities |
(1,792 | ) | -0.02 | % | (401 | ) | 0.00 | % | 695 | 0.01 | % | 2,594 | 0.02 | % | 873 | 0.01 | % | 2,567 | 0.02 | % | ||||||||||||||||||||||||||||
| Merger related expenses/Goodwill impairment |
(822 | ) | -0.01 | % | (2,810 | ) | -0.03 | % | (606 | ) | -0.01 | % | (1,665 | ) | -0.02 | % | (214 | ) | 0.00 | % | (41,226 | ) | -0.26 | % | ||||||||||||||||||||||||
|
|
|
|
|
|
|
|
|
|
|
|
|
|
|
|
|
|
|
|
|
|
|
|
|
|||||||||||||||||||||||||
| Net non-operating income |
(589 | ) | -0.01 | % | ($ | 3,001 | ) | -0.03 | % | ( | $10,758 | ) | -0.10 | % | ($ | 34,922 | ) | -0.33 | % | $ | 949 | 0.01 | % | ($ | 38,369 | ) | -0.24 | % | ||||||||||||||||||||
| Net income before tax |
$ | 126,181 | 1.39 | % | $ | 116,876 | 1.20 | % | $ | 46,051 | 0.44 | % | ($ | 15,910 | ) | -0.15 | % | $ | 67,989 | 0.63 | % | $ | 107,067 | 0.66 | % | |||||||||||||||||||||||
| Income tax provision |
(34,132 | ) | -0.37 | % | (30,703 | ) | -0.32 | % | (9,965 | ) | -0.10 | % | 4,257 | 0.04 | % | (16,223 | ) | -0.15 | % | ($ | 38,530 | ) | -0.24 | % | ||||||||||||||||||||||||
|
|
|
|
|
|
|
|
|
|
|
|
|
|
|
|
|
|
|
|
|
|
|
|
|
|||||||||||||||||||||||||
| Net income (loss) |
$ | 92,049 | 1.01 | % | $ | 86,173 | 0.88 | % | $ | 36,086 | 0.35 | % | ($ | 11,653 | ) | -0.11 | % | $ | 51,766 | 0.48 | % | $ | 68,537 | 0.43 | % | |||||||||||||||||||||||
| Adjusted Earnings |
||||||||||||||||||||||||||||||||||||||||||||||||
| Net income |
$ | 92,049 | 1.01 | % | $ | 86,173 | 0.88 | % | $ | 36,086 | 0.35 | % | ($ | 11,653 | ) | -0.11 | % | $ | 51,766 | 0.48 | % | $ | 68,537 | 0.43 | % | |||||||||||||||||||||||
| Add(Deduct): Net non-operating income |
589 | 0.01 | % | 3,001 | 0.03 | % | 10,758 | 0.10 | % | 34,922 | 0.33 | % | (949 | ) | -0.01 | % | 38,369 | 0.24 | % | |||||||||||||||||||||||||||||
| Tax effect (2) |
(159 | ) | 0.00 | % | (810 | ) | -0.01 | % | (2,905 | ) | -0.03 | % | (9,429 | ) | -0.09 | % | 256 | 0.00 | % | (10,360 | ) | -0.06 | % | |||||||||||||||||||||||||
|
|
|
|
|
|
|
|
|
|
|
|
|
|
|
|
|
|
|
|
|
|
|
|
|
|||||||||||||||||||||||||
| Adjusted earnings |
$ | 92,479 | 1.02 | % | $ | 88,364 | 0.91 | % | $ | 43,939 | 0.42 | % | $ | 13,840 | 0.13 | % | $ | 51,073 | 0.47 | % | $ | 96,546 | 0.60 | % | ||||||||||||||||||||||||
| Expense Coverage Ratio (3) |
1.50x | 1.55x | 1.13x | 0.99x | 1.23x | 1.40x | ||||||||||||||||||||||||||||||||||||||||||
| Efficiency Ratio (4) |
57.05 | % | 57.84 | % | 74.69 | % | 84.50 | % | 70.29 | % | 63.41 | % | ||||||||||||||||||||||||||||||||||||
| (1) | Ratios are as a percent of average assets. |
| (2) | Assumes a 27.0% effective tax rate. |
| (3) | Expense coverage ratio calculated as net interest income before provisions for loan losses divided by operating expenses. |
| (4) | Efficiency ratio calculated as operating expenses divided by the sum of net interest income before provisions for loan losses plus non-interest operating income. |
| (5) | Reflects pro forma impact of Northfield Bancorp acquisition. |
| Sources: | Columbia Financial’s prospectus, Columbia Financial’s and Northfield Bancorp’s audited & unaudited financial statements, Columbia Bank’s and Northfield Bank’s FDIC Call Reports and RP Financial caluclations. |
| RP® Financial, LC. | OVERVIEW AND FINANCIAL ANALYSIS I.13 |
From 2021 through 2025, the Company’s net interest income to average assets ratio ranged from a low of 1.67% during 2024 to a high of 2.74% during 2022. For 2025, the net interest income to average assets ratio increased to 2.06%. The decrease in the net interest income ratio during 2023 and 2024 was due to a more significant increase in the interest expense ratio relative to the interest income ratio, which was attributable to interest rate spread compression resulting from a more significant increase in funding costs relative to the increase in the yield earned on interest-earning assets. Comparatively, a higher interest income ratio and a lower interest expense ratio facilitated the increase in the net interest income ratio for 2025, as a higher yield on interest-earning assets and a lower cost of interest-bearing liabilities contributed to an increase in the Company’s interest rate spread during 2025. The Company’s historical net interest rate spreads and yields and costs are set forth in Exhibits I-3 and I-5.
Non-interest operating income has been a limited contributor to the Company’s earnings over the past five years. Throughout the period shown in Table 1.2, non-interest operating income ranged from a low of $30.6 million or 0.31% of average assets during 2022 to a high of $38.6 million or 0.42% of average assets during 2021. For 2025, non-interest operating income amounted to $35.9 million or 0.33% of average assets. Demand deposit account fees, BOLI income, loan fees and service charges and title insurance fees are the primary contributors to the Company’s non-interest operating income.
Operating expenses represent the other major component of the Company’s earnings, which have been maintained at less than 2.00% of average assets over the past five years. Operating expenses totaled $180.7 million or 1.68% of average assets for 2025, versus total operating expenses of $154.9 million or 1.70% of average assets for 2021. The Company’s relatively low operating expense ratio is in part facilitated by maintaining a high ratio of assets per employee, which is supported by the relatively low staffing requirements associated with (1) the Company’s lending strategy that has emphasized growth of higher balance commercial real estate loans and multi-family loans and (2) limited diversification into other products and services that would provide additional sources of non-interest operating income and have a limited impact on increasing assets. As of December 31, 2025, the Company’s ratio of assets per full time equivalent employee equaled $14.310 million.
| RP® Financial, LC. | OVERVIEW AND FINANCIAL ANALYSIS I.14 |
Overall, during the past five years, the Company’s expense coverage ratios (net interest income divided by operating expenses) ranged from a low of 0.99x during 2024 to a high of 1.55x during fiscal year 2022 and equaled 1.23x during 2025. Comparatively, the Company’s efficiency ratio (operating expenses as a percent of the sum of net interest income and other operating income) ranged from a high of 84.50% during 2024 to a low of 57.05% during 2021 and equaled 70.29% during 2025.
During the period covered in Table 1.2, the amount of credit loss provisions established ranged from a recovery of $10.0 million or 0.11% of average assets during 2021 to loss provisions of $14.5 million or 0.14% of average assets during 2024. For 2025, the Company reported credit loss provisions of $9.8 million or 0.09% of average assets. The reduction in credit loss provisions established in 2025 was primarily attributable to a decrease in net charge-offs, which decreased from $9.6 million during 2024 to $5.8 million during 2025. As of December 31, 2025 the Company maintained credit loss allowances of $67.2 million, equal to 0.82% of total loans and 176.84% of non-accruing loans. Exhibit I-6 sets forth the Company’s allowance for credit losses activity for the past three years.
Non-operating income and losses were a more significant factor in the Company’s earnings during 2023 and 2024, as the result of loss on investments securities transactions to facilitate repositioning of the balance sheet. Net non-operating income and losses over the past five years ranged from a net non-operating loss of $34.9 million or 0.33% of average assets during 2024, which included a $35.9 million loss on investment securities, to net non-operating income of $949,000 or 0.01% of average assets during 2025. Overall, the various items that comprise the Company’s non-operating income/expense are not viewed to be part of the Company’s core or recurring earnings base.
The Company’s effective tax rate ranged from a benefit of 26.76% during 2024 to an expense of 27.05% during 2021 and equaled an expense of 23.86% during 2025. As set forth in the prospectus, the Company’s marginal effective tax rate is 27.0%.
Pro Forma Earnings Impact of Northfield Bancorp Acquisition
The pro forma income statement impact of the Northfield Bancorp acquisition is shown in Table 1.2 for the twelve-month period ended December 31, 2025. Pro forma net interest income reflects the yield adjustments for interest rate sensitive assets and liabilities, based on fair value adjustments on Northfield Bancorp’s balance sheet as of December 31, 2025. Non-interest
| RP® Financial, LC. | OVERVIEW AND FINANCIAL ANALYSIS I.15 |
expense was adjusted to account for the amortization of core deposit intangibles. On a pro forma basis, before factoring in the reinvestment of conversion proceeds, Columbia Financial’s earnings increase from $51.8 million or 0.48% of average assets to $68.5 million or 0.43% of average assets. The increase in the Company’s pro forma return on average assets reflects higher net interest income (increasing from 2.06% of average assets to 2.45% of average assets), which is partially offset by higher operating expenses (increasing from 1.68% of average assets to 1.75% of average assets). Approximately $35.1 million of the increase in net interest income was attributable to the net earnings impact of Northfield Bancorp’s fair value accounting adjustments. As a percent of pro forma assets, pro forma non-interest operating income decreased slightly (0.33% to 0.31%), pro forma credit loss provisions increased slightly (0.09% to 0.11%) and pro forma non-operating income/losses decreased (0.01% non-operating income to 0.24% non-operating loss). The pro forma non-operating loss was substantially related to the goodwill impairment charge of $41.0 million that was recorded by Northfield Bancorp. The pro forma earnings do not reflect any potential cost savings in merger synergies that may be realized, as such estimates are considered to be speculative and therefore are not disclosed in the pro forma financial statements set forth in the prospectus.
Interest Rate Risk Management
The Company pursues a number of strategies to manage interest rate risk, particularly with respect to seeking to limit the repricing mismatch between interest rate sensitive assets and liabilities. The Company manages interest rate risk from the asset side of the balance sheet through investing in investment securities with short-terms or adjustable interest rates, maintaining most of the investment portfolio as available for sale, selling originations of longer term 1-4 family fixed rate loans and diversifying into other types of lending beyond 1-4 family permanent mortgage loans which consist primarily of adjustable rate or shorter term fixed rate loans. The Company also hedges a portion of its fixed rate commercial business loan portfolio with interest rate swap contracts. As of December 31, 2025, of the Company’s total loans due after December 31, 2026, adjustable rate loans comprised 38.94% of total loans receivable (see Exhibit I-7). On the liability side of the balance sheet, management of interest rate risk has been pursued through emphasizing growth of lower costing and less interest rate sensitive transaction and savings account deposits and utilizing fixed rate FHLB advances with laddered maturities extending out to more than four years. Transaction and savings account deposits comprised 66.22% of the Company’s total deposits at December 31, 2025. In addition, the Company executes interest rate swaps with third parties in order to hedge the interest rate risk of short-term FHLB advances.
| RP® Financial, LC. | OVERVIEW AND FINANCIAL ANALYSIS I.16 |
As of December 31, 2025, an analysis of the Company’s net portfolio value (“NPV”) and net interest income indicated that in the event of an instantaneous parallel 200 basis point increase in market interest rates NPV would decrease by 13.85% and net interest income would decrease by 9.06% in year one, which were within policy guidelines (see Exhibit I-8).
The infusion of stock proceeds will serve to further limit the Company’s interest rate risk exposure, as most of the net proceeds will be redeployed into interest-earning assets, including shorter-to-intermediate term investments and adjustable rate loans, and the increase in the Company’s capital position will lessen the proportion of interest rate sensitive liabilities funding assets.
Lending Activities and Strategy
Columbia Financial’s lending activities have emphasized mortgage-based lending, which has provided for a loan portfolio composition that is concentrated in commercial real estate and muti-family loans, followed by 1-4 family residential loans. Other areas of lending for the Company include commercial business loans, construction loans and home equity loans and advances. Going forward, the Company’s lending strategy will continue to emphasize commercial real estate and multi-family lending, as well as pursuing lending diversification that will emphasize growth of commercial business loans. Comparatively, Northfield Bancorp’s loan portfolio is more concentrated in commercial real estate/multi-family loans, with the balance of the loan portfolio consisting of home equity loans and lines of credit, 1-4 family mortgage loans, commercial business loans, construction and land loans and other consumer loans. Exhibit I-9 and Exhibit I-9A provide historical detail of Columbia Financial’s and Northfield Bancorp’s loan portfolio compositions, respectively. Exhibit I-10 provides the contractual maturity of the Company’s loan portfolio by loan type as of December 31, 2025.
Commercial Real Estate and Multi-Family Loans. Commercial real estate and multi-family loans consist largely of loans originated by the Company, which are generally collateralized by properties in the Company’s regional lending area. On a limited basis, the Company supplements originations of commercial real estate and multi-family loans with purchased loan participations from local banks. Loan participations are subject to the same underwriting criteria and loan approvals as applied to loans originated by the Company.
| RP® Financial, LC. | OVERVIEW AND FINANCIAL ANALYSIS I.17 |
Columbia Financial generally originates commercial real estate loans up to a loan-to-value (“LTV”) ratio of 75% and multi-family loans up to a LTV ratio of 80%. Commercial real estate and multi-family loans generally require a minimum debt-coverage ratio of 1.2 times. Commercial real estate and multi-family loans are generally originated for terms of up to ten years and with amortization schedules of up to 25 years for commercial properties and up to 30 years for multi-family and industrial commercial real estate properties. Loan terms offered on commercial real estate and multi-family loans include fixed rate and adjustable rate loans. Adjustable rate loans are typically fixed from three to ten years. Properties securing the commercial real estate and multi-family loan portfolio include non-medical office buildings, industrial/warehouse facilities, retail shopping centers, medical office buildings, hotels, assisted-living facilities and apartment buildings. At December 31, 2025, the Company’s largest commercial real estate loan was a $30.6 million participation loan and was secured by a retail shopping center. At December 31, 2025, this loan was performing in accordance with its original terms. At December 31, 2025, the Company’s largest multi-family loan had an outstanding balance of $48.7 million and was secured by three garden style apartment buildings. At December 31, 2025, this loan was performing in accordance with its original terms. As of December 31, 2025, the Company’s outstanding balance of commercial real estate and multi-family loans totaled $4.2 billion, equal to 51.39% of total loans outstanding, and consisted of $2.5 billion of commercial real estate loans and $1.7 billion of multi-family loans. As of December 31, 2025, Northfield Bancorp’s outstanding balance of commercial real estate and multi-family loans totaled $3.3 billion, equal to 84.86% of total loans outstanding, and consisted of $911.4 million of commercial real estate loans and $2.4 billion of multi-family loans.
1-4 Family Residential Loans. Columbia Financial offers both fixed rate and adjustable rate 1-4 family permanent mortgage loans with terms of up to 30 years. Loans are generally underwritten to secondary market guidelines, so as to allow for the sale of such loans if such a strategy is warranted for purposes of interest rate risk management. Adjustable rate loans offered by the Company have initial repricing terms of up to seven years and then reprice annually for the balance of the loan term. Adjustable rate loans are indexed to the U.S. Treasury security index. As of December 31, 2025, the Company’s outstanding balance of 1-4 family loans totaled $2.6 billion equal to 31.03% of total loans outstanding. As of December 31, 2025, Northfield Bancorp’s outstanding balance of 1-4 family loans totaled $165.1 million equal to 4.28% of total loans outstanding.
| RP® Financial, LC. | OVERVIEW AND FINANCIAL ANALYSIS I.18 |
Home Equity Loans and Advances. The Company’s 1-4 family lending activities include home equity loans and advances. Home equity loans are offered as fixed rate loans with terms of up to 20 years. Home equity advances have adjustable rates and are indexed to the prime rate as published in The Wall Street Journal. Home equity advances can have repayment schedules of both principal and interest or interest only paid monthly The Company will generally originate home equity loans and advances up to a combined maximum LTV ratio of 80%. As of December 31, 2025, the Company’s outstanding balance of home equity loans and advances totaled $255.1 million equal to 3.09% of total loans outstanding. As of December 31, 2025, Northfield Bancorp’s outstanding balance of home equity loans and lines of credit totaled $198.6 million equal to 5.15% of total loans outstanding.
Construction Loans. Construction loans originated by the Company consist of loans to professional builders to finance the construction and acquisition of personal residences, apartment buildings, retail, industrial, warehouse, office buildings and special purpose facilities. The Company also originates construction loans on unimproved land. Construction loans are interest only loans during the construction period, which is usually up to 36 months, and are generally offered up to a maximum LTV ratio of 75% of as completed and stabilized appraised value, and up to 65% of the lower of the appraised value or the cost of the land for unimproved land. Commercial real estate construction loans are typically based upon the prime rate as published in The Wall Street Journal. Most residential construction loans and many of the commercial construction loans convert to permanent amortizing loans upon completion of the construction. As of December 31, 2025, the Company’s outstanding balance of construction loans totaled $469.4 million equal to 5.69% of total loans outstanding. As of December 31, 2025, Northfield Bancorp’s outstanding balance of construction and land loans totaled $44.5 million equal to 1.15% of total loans outstanding.
Commercial Business Loans. The commercial business loan portfolio is generated through extending loans to businesses operating in the local market area. Expansion of commercial business lending activities is a desired area of loan growth for the Company, pursuant to which the Company is seeking to become a full service community bank to its commercial loan customers through offering a full range of commercial loan products that can be packaged with lower cost commercial deposit products. The Company offers a variety of secured and unsecured commercial business loans that include term loans for equipment financing and business acquisitions, working capital loans, inventory financing and revolving lines of credit. Fixed rate loans are generally offered for terms of up to ten years and are fully
| RP® Financial, LC. | OVERVIEW AND FINANCIAL ANALYSIS I.19 |
amortizing. Revolving and asset based lines of credit are generally extended as floating rate loans indexed to The Wall Street Journal prime rate for periods of up to 24 months. At December 31, 2025, the Company’s largest commercial business loan was a $24.6 million loan made to a distributor of medical and other disposable discount retail supplies. At December 31, 2025, this loan was performing in accordance with its original terms and was secured by its business assets. As of December 31, 2025, the Company’s outstanding balance of commercial business loans totaled $766.8 million equal to 9.30% of total loans outstanding. As of December 31, 2025, Northfield Bancorp’s outstanding balance of commercial business loans totaled $166.2 million equal to 4.31% of total loans outstanding.
Other Consumer Loans. Consumer lending other than home equity loans and advances has been a limited area of lending diversification for the Company, with such loans consisting of loans for automobiles, personal loans, unsecured lines of credit and overdraft lines of credit. As of December 31, 2025, the Company held $2.9 million of other consumer loans equal to 0.04% of total loans outstanding. As of December 31, 2025, Northfield Bancorp held $1.4 million of other consumer loans equal to 0.04% of total loans outstanding.
Loan Originations, Purchases, and Sales
Exhibit I-11 provides a summary of the Company’s lending activities over the past three years. Total loans originated ranged from a low of $834.6 million during 2024 to a high of $1.342 billion during 2025. The increase in loans originated during 2025 was primarily driven by increased originations of commercial real estate and multi-family loans. The Company’s organic loan growth during 2025 was supplemented with loan purchases of $150.9 million, which was mostly related to the purchase of a $130.9 million portfolio of equipment finance loans. Principal repayments ranged from a low of $687.0 million during 2023 to a high of $1.034 billion during 2025. Loan sales ranged from a low of $18.9 million during 2024 to a high of $121.4 million during 2023. Loan growth was recorded during 2024 and 2025, with the strongest growth occurring in 2025.
Asset Quality
The Company has maintained relatively low levels of non-performing assets in recent years, although there has been a slight upward trend in the balance of non-performing assets during the past two years. Over the past three years, Columbia Financial’s balance of non-performing assets ranged from a low of $12.6 million or 0.12% of assets at yearend 2023 to a
| RP® Financial, LC. | OVERVIEW AND FINANCIAL ANALYSIS I.20 |
high of $38.0 million or 0.34% of assets at yearend 2025. Increases in non-accruing 1-4 family loans, commercial real estate loans, construction loans, commercial business loans and home equity loans and advances all contributed to the upward trend in the non-accruing loan balance during the past two years. As shown in Exhibit I-12, the balance of non-performing assets at December 31, 2025 consisted entirely of non-accruing loans. Non-accruing loans held by the Company at December 31, 2025 were concentrated in commercial business loans and 1-4 family permanent mortgage loans with balances of $15.3 million and $9.8 million, respectively. As shown in Exhibit I-12A, Northfield Bancorp’s non-performing assets at December 31, 2025 totaled $16.1 million or 0.28% of assets and consisted mostly of non-accruing loans with the largest concentrations consisting of commercial real estate loans, commercial business loans and multi-family loans.
To track the Company’s asset quality and the adequacy of valuation allowances, the Company has established detailed asset classification policies and procedures which are consistent with regulatory guidelines. Classified assets are reviewed on a regular basis by senior management and the Board. Pursuant to these procedures, when needed, the Company establishes additional valuation allowances to cover anticipated losses in classified or non-classified assets. As of December 31, 2025, the Company maintained credit loss allowances of $67.2 million, equal to 0.82% of gross loans outstanding and 176.84% of non-performing loans.
Funding Composition and Strategy
Deposits have consistently served as the Company’s primary funding source and at December 31, 2025 deposits accounted for 87.71% of Columbia Financial’s combined balance of deposits and borrowings. Exhibit I-13 sets forth the Company’s deposit composition for the past three years. Transaction and savings account deposits constituted 66.22% of total deposits at December 31, 2025, as compared to 68.31% of total deposits at December 31, 2023. The decrease in the concentration of core deposits comprising total deposits since yearend 2023 was realized through comparatively stronger growth of CDs relative to growth of core deposits. Transaction account deposits (both interest bearing and non-interest bearing) comprise the largest concentration of the Company’s core deposit and, as of December 31, 2025, transaction account deposits totaled $3.503 billion or 62.65% of core deposits.
| RP® Financial, LC. | OVERVIEW AND FINANCIAL ANALYSIS I.21 |
The balance of the Company’s deposits consists of CDs, which equaled 33.78% of total deposits at December 31, 2025 compared to 31.69% of total deposits at December 31, 2023. Columbia Financial’s current CD composition reflects a higher concentration of short-term CDs (maturities of one year or less). The CD portfolio totaled $2.852 billion at December 31, 2025 and $2.469 billion or 86.55% of the CDs were scheduled to mature in one year or less. Exhibit I-14 sets forth the maturity schedule of the Company’s CDs as of December 31, 2025. As of December 31, 2025, jumbo CDs (CD accounts with balances of $250,000 or more) amounted to $723.3 million or 25.36% of total CDs.
Northfield Bancorp maintained total deposits of $4.015 billion at December 31, 2025, which consisted of 81.97% of transaction and savings account deposits and 18.03% of CDs.
Borrowings serve as an alternative funding source for the Company to facilitate management of funding costs and interest rate risk Additionally, the Company holds a small balance of junior subordinated debt, which was acquired in connection with the acquisition of Stewardship Financial. Borrowings totaled $1.183 billion at December 31, 2025 and consisted of $1.176 billion of FHLB advances and $7.1 million of junior subordinated debt. For the year ended December 31, 2025 the FHLB advances had a weighted average interest rate of 4.34% and the junior subordinated debt had a weighted average interest rate of 7.98%. Exhibit I-15 provides further detail of the Company’s borrowings activities during the past three years.
Northfield Bancorp maintained total borrowings of $961.9 million at December 31, 2025, which consisted of $893.8 million of FHLB advances, $6.4 million of floating rate advances and other interest-bearing liabilities and $61.7 million of junior subordinated debt.
Subsidiaries
Columbia Bank is a wholly owned subsidiary of Columbia Financial. Columba Financial also maintains a Delaware trust subsidiary, Stewardship Trust I, that was formed in connection with the prior issuance of trust preferred securities. Stewardship Statutory Trust I was acquired by the Company as the result of its acquisition of Stewardship Financial in November 2019.
Columbia Bank’s active subsidiaries are as follows:
First Jersey Title Services, Inc., a title insurance agency that Columbia Bank acquired in 2002. At December 31, 2025, total assets were approximately $18.2 million. For the year ended December 31, 2025, First Jersey Title Services, Inc. had net income of approximately $724,000.
1901 Commercial Management Co. LLC, which was established in 2009 to hold commercial other real estate owned, and 1901 Residential Management Co. LLC, which was established in 2009 to hold residential other real estate owned. At December 31, 2025, these subsidiaries held approximately $100,000 and $125,000 in total assets, respectively.
| RP® Financial, LC. | OVERVIEW AND FINANCIAL ANALYSIS I.22 |
1901 Community Development Corporation, which was established in 2024 to make public welfare investments that promote and support affordable housing in low and moderate-income neighborhoods. At December 31, 2025, total assets were approximately $1.0 million.
Stewardship Realty LLC is a New Jersey limited liability company which was formed in 2005 and acquired by the Company as a result of its acquisition of Steward Financial in November 2019. At December 31, 2025, total assets were approximately $100,000.
Columbia Investment Services, Inc. was established in 1982 and maintains the requirements for our wealth management licenses. At December 31, 2025, total assets were approximately $575,000.
Columbia Insurance Services, Inc. (formerly RSI Insurance Agency, Inc.), which was formed 2009 and acquired by the Company as a result of its acquisition of RSI Bank in May 2022, is a full-service insurance agency and whose primary business is to offer a broad range of insurance products and investment solutions, including personal and business lines of insurance to Columbia Bank customers and primarily New Jersey residents. In October 2024, Columbia Bank changed the corporate name of this insurance agency subsidiary from “RSI Insurance Agency” to “Columbia Insurance Services, Inc.” At December 31, 2025 total assets were approximately $3.0 million. For the year ended December 31, 2025, Columbia Insurance Services, Inc. had a net loss of approximately $412,000.
Northfield Bancorp owns 100% of Northfield Investments, Inc., an inactive New Jersey investment company, and 100% of Northfield Bank. Northfield Bank owns 100% of NSB Services Corp., a Delaware corporation, which in turn owns 100% of the voting common stock of NSB Realty Trust. NSB Realty Trust is a Maryland real estate investment trust that holds mortgage loans, mortgage-backed securities and other investments. These entities enable Northfield Bank to segregate certain assets for management purposes , and/or borrow against assets or stock of these entities for liquidity purposes. At December 31, 2025, Northfield Bank’s investment in NSB Service Corp. was $918.2 million, and NSB Services Corp. had assets of $918.7 million and liabilities of $632,000 at that date. At December 31, 2025, NSB Services Corp.’s investment in NSB Realty Trust was $918.3 million and NSB Realty Trust had $918.3 million in assets and liabilities of $56,000 at that date.
| RP® Financial, LC. | OVERVIEW AND FINANCIAL ANALYSIS I.23 |
Legal Proceedings
The Company is involved in routine legal proceedings in the ordinary course of business from time to time. At December 31, 2025, the Company was not party to any pending legal proceedings that the Company’s management believed would have a material adverse effect on the Company’s financial condition, results of operations or cash flows.
Northfield Bancorp is involved in routine legal proceedings in the ordinary course of business from time to time. At December 31, 2025, Northfield Bancorp was not party to any pending legal proceedings that Northfield Bancorp’s management believed would have a material adverse effect on Northfield Bancorp’s financial condition, results of operations or cash flows.
| RP® Financial, LC. | MARKET AREA II.1 |
II. MARKET AREA
Introduction
Headquartered in Fair Lawn, New Jersey, Columbia Financial serves the state of New Jersey and the suburbs surrounding the New York City and Philadelphia metropolitan areas through its headquarters office and 68 full service branch offices. The Company’s branch network covers a twelve-county market area in the state of New Jersey: Bergen, Burlington, Camden, Essex, Gloucester, Hunterdon, Middlesex, Monmouth, Morris, Passaic, Somerset and Union. The acquisition of Northfield Bancorp will expand the Company’s branch network into New York and increase its market presence in New Jersey. Northfield Bancorp maintains a total of 36 branches, which are located in the New York counties of Richmond (Staten Island) and Kings (Brooklyn) and the New Jersey counties of Hunterdon, Mercer, Middlesex and Union. Exhibit II-1 provides information on the Company’s office facilities.
With operations in major metropolitan areas, the Company’s competitive environment includes a significant number of commercial banks, thrifts and other financial services companies, some of which have a regional or national presence. These institutions also have greater resources at their disposal than the Company. The New York City and Philadelphia metropolitan areas have highly developed economies, with a relatively high concentration of highly skilled workers who are employed in a number of different industry clusters including financial services, healthcare, diverse industrial, service, retail and high technology businesses.
Future growth opportunities for Columbia Financial depend on the future growth and stability of the local and regional economy, demographic growth trends, and the nature and intensity of the competitive environment. These factors have been briefly examined to help determine the growth potential that exists for the Company, the relative economic health of the Company’s market area, and the resultant impact on value.
National Economic Factors
The future success of the Company’s operations is partially dependent upon various national and local economic trends. Manufacturing activity for April 2025 slowed to an index reading of 48.7, versus service sector activity for April accelerating to an index reading of 51.6. April unemployment data showed 177,000 jobs were added to the U.S. economy, while the unemployment rate held steady at 4.2%. Retail sales for April increased 0.1%. Existing home
| RP® Financial, LC. | MARKET AREA II.2 |
sales decreased 0.5% in April, as potential buyers faced mounting economic uncertainty and steep housing costs. Comparatively, April new home sales jumped 10.9%, as builders lowered prices to attract buyers. Manufacturing activity for May contracted to an index reading of 48.5 and May service sector activity contracted to an index reading of 49.9, which was the first contraction in service sector activity since June 2024. May’s employment report showed that the U.S. economy added 139,000 jobs and the unemployment rate held steady at 4.2%. A 0.9% decrease in May retail sales was more than expected. Existing and new home sales for May reflected a reversal in trends, with existing home sales increasing 0.8% and new home sales falling 13.7%. Manufacturing activity for June improved slightly with an index reading of 49.0%, while service sector activity for June slowed slightly with an index reading of 48.8. The U.S. economy added 147,000 jobs in June and the June unemployment rate decreased to 4.1%. June retail sales increased 0.6%, which was above expectations. Existing home sales fell 2.7% in June, as higher home prices and mortgage rates above 6.5% weighed on sales. New home sales edged up 0.6% in June, which was less than expected. GDP for the second quarter increased at a 3.0% annual rate (subsequently revised upward to a 3.8% annualized growth rate).
Job growth slowed in July 2025, as the U.S. economy added 73,000 jobs in July and the July unemployment rate increased to 4.2%. Manufacturing activity contracted for a fifth straight month in July with an index reading of 48.0, while service sector activity for July increased to an index reading of 50.1. A slight easing in mortgage rates provided for a 2.0% increase in July existing home sales, while new homes sales for July were down 0.6%. Both manufacturing activity and service sector activity increased in August, with respective index readings of 48.7 and 52.0. Only 22,000 jobs were added in August and the August unemployment rate increased to 4.3%. August retail sales increased 0.6%, which was higher than expected. While existing home sales slipped 0.2% in August, new home sales for August jumped 20.5%. September manufacturing activity edged up to an index reading of 49.1, while service sector activity for September slowed to an index reading of 50.0. The U.S. economy added 119,000 jobs in September and the September unemployment rate edged up to 4.4%. Existing home sales for September increased 1.5%, as lower mortgage rates boosted activity. Comparatively, new home sales for September were down 5.1%. Retail sales for September showed a slight increase of 0.2%. Third quarter GDP growth exceeded expectations, with a 4.3% annualized growth rate.
| RP® Financial, LC. | MARKET AREA II.3 |
Manufacturing activity for October slowed to an index reading of 48.7, versus service sector activity for October accelerating to an index reading of 52.4. October existing home sales increased 1.2%, as slightly lower mortgage rates helped sales reach an eight-month high. Retail sales of October were unchanged. November manufacturing activity slowed to an index reading of 48.2, for a ninth consecutive month of contraction. In contrast, service sector activity for November edged up to an index reading of 52.6. The U.S. economy added 64,000 jobs in November and the November unemployment rate crept up to 4.6%. Lower mortgage rates contributed to existing home sales increasing 0.5% in November, which was third consecutive month of rising sales. Manufacturing activity for December slowed to an index reading of 47.9, while December service sector activity accelerated to an index reading of 54.4. Job growth slowed slightly in December with the U.S. economy adding 50,000 jobs, while the December unemployment rate edged lower to 4.4%. While existing home sales increased 5.1% in December, as a whole 2025 ranked as one of the worst slumps for home sales in years. January 2026 manufacturing activity accelerated to an index reading of 52.6, which was the highest reading since August 2022.
In terms of interest rates trends over the past few quarters, concerns that President Trump’s escalating trade war could push the U.S. economy into a recession fueled a bond market rally at the start of the second quarter of 2025, as the 10-year Treasury yield dipped below 4.0%. As the trade war with China escalated, long-term Treasury yields reversed course and moved higher heading into mid-April. Long-term Treasury yields edged lower in the second half of April, with the 10-year Treasury yield dropping to 4.17% at the end of April in reaction to the GDP for the first quarter showing a decline. April’s employment report showing stronger-than-expected job growth translated into long-term Treasury yields edging higher in early-May. The Federal Reserve’s early-May meeting concluded with no change in interest rates, along with a warning that tariffs were raising risks of higher unemployment and higher inflation. Following the Federal Reserve meeting, long-term Treasury yields moved higher through mid-May notwithstanding April’s CPI report showing inflation pressures eased. The 10-year Treasury yield rose above 4.5% going into the second half of May, as Treasury yields increased after Moody’s stripped the U.S. of its triple-A credit rating. After edging lower at the end of May, Treasury bonds rallied in early-June based on a weak report for service sector activity which boosted investor confidence that the Federal Reserve would cut interest rates in the coming months. Treasury yields spiked higher on news of a stronger-than-expected employment report for May, which was followed by a downward trend in long-term Treasury yield through the end of June. Factors contributing to the rally in Treasury bonds included the consumer price report for May showing tariffs did not cause prices to spiral up and the Federal Reserve holding interest rates steady at its mid-June meeting, while leaving the door open to cut interest rates in the second half of 2025.
| RP® Financial, LC. | MARKET AREA II.4 |
Renewed trade tensions pushed Treasury yields higher at the start of the third quarter of 2025, reflecting concerns that the pending implementation of reciprocal tariffs would lead to higher inflation. An uptick in inflation, as indicated by the 2.7% increase in the June CPI, sustained the upward trend in long-term Treasury yields through mid-July. Some announced tariff deals with the U.S. and signs of progress with other trade partners provided for slightly lower interest rates in the second half of July. The Federal Reserve concluded its end of July meeting holding interest rates steady. Signs of a slowing economy, as reflected in the July reports for employment and service sector activity, translated into long-term Treasury yields declining in early-August. A 2.7% increase in the July CPI provided for a slight upward trend in long-term Treasury yields through mid-August, which was followed by long-term Treasury yields drifting lower through the end of August. The weak employment report for September sustained the rally in Treasury bonds through the first two weeks of September. Long-term Treasury yields edged higher through the balance of September, as markets reacted to inflation edging higher with a 2.9% in the August CPI and the Federal Reserve approving a mid-September 0.25% interest rate cut.
A slight downward trend in long-term Treasury yields prevailed through the first half of October 2025, with the 10-year Treasury stabilizing around 4.0% going into late-October. A 3.0% increase in the September CPI, along with the Federal Reserve tempering expectations of further rate cuts following its second consecutive 0.25% rate-cut in late-October, resulted in the 10-year Treasury yield trending up to 4.15% in mid-November. After edging down to 4.0% in late-November, the 10-year Treasury yield trended slightly higher ahead of the Federal Reserve’s December meeting. The Federal Reserve concluded its December meeting with a third consecutive 0.25% rate-cut, while signaling a pause in further rate cuts. Long-term Treasury yields stabilized through balance of 2025, as a 2.7% increase in the November CPI provided an indication of a slower pace of inflation.
| RP® Financial, LC. | MARKET AREA II.5 |
A stable interest rate environment continued to prevail during the first couple of weeks of January 2026, with the December CPI showing no change from the 2.7% increase in the November CPI. Treasury yields edged higher in the second half of January, as President Trump’s threat to apply new restrictions on trade with Europe sparked a selloff in Treasury bonds. The late-January meeting of the Federal Reserve concluded with holding its benchmark rate steady and signaling little urgency to resume cutting rates further. As of February 2, 2026, the bond equivalent yields for U.S. Treasury bonds with terms of one and ten years equaled 3.49% and 4.29%, respectively, versus comparable year ago yields of 4.17% and 4.58%. Exhibit II-2 provides historical interest rate trends.
Based on the consensus outlook of economists surveyed by The Wall Street Journal in January 2026, GDP was projected to increase 2.2% in 2026 and then edge down to a 2.1% annual growth rate in 2027. The U.S. unemployment rate was forecasted to equal 4.5% in December 2026 and 4.4% in June 2027. An average of 65,000 jobs were projected to be added per month over the next four quarters. On average, the economists forecasted the federal funds rate would equal 3.08% in December 2026 and 3.04% in June 2027. On average, the economists forecasted that the 10-year Treasury yield would equal 4.18% in December 2026 and 4.16% in June 2027.
The January 2026 mortgage finance forecast from the Mortgage Bankers Association (the “MBA”) was for 2026 existing home sales to increase by 8.1% from 2025 sales, while 2026 new home sales were forecasted to increase by 7.3% from sales in 2025. The 2026 median sale prices for existing and new homes were forecasted to increase 0.2% and decrease 1.5%, respectively. Total mortgage production was forecasted to increase in 2026 to $2.203 trillion, compared to $2.050 trillion in 2025. The forecasted increase in 2026 originations was based on a 6.4% increase in purchase volume and a 9.5% increase in refinancing volume. Purchase mortgage originations were forecasted to total $1.443 trillion in 2026, versus refinancing volume totaling $760 billion. Housing starts for 2026 were projected to decrease by 3.1% to total 1.303 million.
Market Area Demographics
Demographic and economic growth trends, measured by changes in population, number of households, age distribution and median household income, provide key insight into the health of the market areas served by Columbia Financial and Northfield Bancorp. Table 2.1 presents information regarding the demographic trends for the Company’s and Northfield Bancorp’s primary market area counties. Data for the nation and the states of New Jersey and New York are included for comparative purposes.
| RP® Financial, LC. | MARKET AREA II.6 |
Table 2.1
Columbia Financial, Inc.
Summary Demographic Data
| Year | Growth Rate | |||||||||||||||||||
| 2021 | 2026 | 2031 | 2021-2026 | 2026-2031 | ||||||||||||||||
| (%) | (%) | |||||||||||||||||||
| Population (000) |
||||||||||||||||||||
| USA |
330,946 | 342,966 | 351,802 | 0.7 | % | 0.5 | % | |||||||||||||
| New Jersey |
8,884 | 9,593 | 9,841 | 1.5 | % | 0.5 | % | |||||||||||||
| New York |
19,402 | 19,894 | 19,944 | 0.5 | % | 0.0 | % | |||||||||||||
| Bergen, NJ |
934 | 988 | 1,014 | 1.1 | % | 0.5 | % | |||||||||||||
| Burlington, NJ |
445 | 480 | 492 | 1.5 | % | 0.5 | % | |||||||||||||
| Camden, NJ |
506 | 537 | 547 | 1.2 | % | 0.4 | % | |||||||||||||
| Essex, NJ |
801 | 894 | 925 | 2.2 | % | 0.7 | % | |||||||||||||
| Gloucester, NJ |
292 | 314 | 322 | 1.5 | % | 0.5 | % | |||||||||||||
| Hunterdon, NJ |
124 | 132 | 135 | 1.3 | % | 0.4 | % | |||||||||||||
| Mercer, NJ |
367 | 396 | 406 | 1.6 | % | 0.5 | % | |||||||||||||
| Middlesex, NJ |
825 | 902 | 933 | 1.8 | % | 0.7 | % | |||||||||||||
| Monmouth, NJ |
616 | 647 | 648 | 1.0 | % | 0.0 | % | |||||||||||||
| Morris, NJ |
491 | 528 | 541 | 1.5 | % | 0.5 | % | |||||||||||||
| Passaic, NJ |
501 | 530 | 537 | 1.1 | % | 0.3 | % | |||||||||||||
| Somerset, NJ |
329 | 362 | 375 | 2.0 | % | 0.7 | % | |||||||||||||
| Union, NJ |
558 | 604 | 629 | 1.6 | % | 0.8 | % | |||||||||||||
| Kings, NY |
2,552 | 2,615 | 2,604 | 0.5 | % | -0.1 | % | |||||||||||||
| Richmond, NY |
477 | 501 | 508 | 1.0 | % | 0.3 | % | |||||||||||||
| Households (000) |
||||||||||||||||||||
| USA |
125,733 | 131,761 | 135,556 | 0.9 | % | 0.6 | % | |||||||||||||
| New Jersey |
3,255 | 3,554 | 3,653 | 1.8 | % | 0.6 | % | |||||||||||||
| New York |
7,402 | 7,605 | 7,644 | 0.5 | % | 0.1 | % | |||||||||||||
| Bergen, NJ |
344 | 361 | 370 | 1.0 | % | 0.5 | % | |||||||||||||
| Burlington, NJ |
167 | 183 | 188 | 1.8 | % | 0.6 | % | |||||||||||||
| Camden, NJ |
190 | 206 | 211 | 1.7 | % | 0.5 | % | |||||||||||||
| Essex, NJ |
293 | 326 | 337 | 2.1 | % | 0.7 | % | |||||||||||||
| Gloucester, NJ |
106 | 116 | 120 | 1.8 | % | 0.6 | % | |||||||||||||
| Hunterdon, NJ |
47 | 51 | 52 | 1.7 | % | 0.5 | % | |||||||||||||
| Mercer, NJ |
133 | 144 | 147 | 1.5 | % | 0.5 | % | |||||||||||||
| Middlesex, NJ |
283 | 315 | 326 | 2.1 | % | 0.7 | % | |||||||||||||
| Monmouth, NJ |
231 | 248 | 250 | 1.4 | % | 0.1 | % | |||||||||||||
| Morris, NJ |
182 | 196 | 202 | 1.5 | % | 0.6 | % | |||||||||||||
| Passaic, NJ |
166 | 180 | 183 | 1.6 | % | 0.3 | % | |||||||||||||
| Somerset, NJ |
118 | 132 | 136 | 2.2 | % | 0.7 | % | |||||||||||||
| Union, NJ |
194 | 210 | 218 | 1.6 | % | 0.8 | % | |||||||||||||
| Kings, NY |
950 | 963 | 962 | 0.3 | % | 0.0 | % | |||||||||||||
| Richmond, NY |
169 | 174 | 176 | 0.6 | % | 0.3 | % | |||||||||||||
| Median Household Income ($) |
||||||||||||||||||||
| USA |
67,761 | 86,867 | 96,684 | 5.1 | % | 2.2 | % | |||||||||||||
| New Jersey |
89,080 | 108,801 | 119,949 | 4.1 | % | 2.0 | % | |||||||||||||
| New York |
74,462 | 91,356 | 100,931 | 4.2 | % | 2.0 | % | |||||||||||||
| Bergen, NJ |
107,018 | 128,320 | 141,642 | 3.7 | % | 2.0 | % | |||||||||||||
| Burlington, NJ |
92,296 | 111,564 | 121,008 | 3.9 | % | 1.6 | % | |||||||||||||
| Camden, NJ |
72,960 | 91,749 | 99,620 | 4.7 | % | 1.7 | % | |||||||||||||
| Essex, NJ |
68,779 | 89,274 | 102,149 | 5.4 | % | 2.7 | % | |||||||||||||
| Gloucester, NJ |
89,994 | 107,541 | 117,053 | 3.6 | % | 1.7 | % | |||||||||||||
| Hunterdon, NJ |
118,864 | 145,344 | 154,289 | 4.1 | % | 1.2 | % | |||||||||||||
| Mercer, NJ |
86,188 | 101,310 | 108,043 | 3.3 | % | 1.3 | % | |||||||||||||
| Middlesex, NJ |
95,004 | 116,859 | 129,681 | 4.2 | % | 2.1 | % | |||||||||||||
| Monmouth, NJ |
107,218 | 129,329 | 141,916 | 3.8 | % | 1.9 | % | |||||||||||||
| Morris, NJ |
120,735 | 145,692 | 158,579 | 3.8 | % | 1.7 | % | |||||||||||||
| Passaic, NJ |
78,541 | 91,298 | 100,559 | 3.1 | % | 2.0 | % | |||||||||||||
| Somerset, NJ |
129,885 | 152,240 | 167,847 | 3.2 | % | 2.0 | % | |||||||||||||
| Union, NJ |
90,213 | 113,069 | 127,144 | 4.6 | % | 2.4 | % | |||||||||||||
| Kings, NY |
68,871 | 85,915 | 97,319 | 4.5 | % | 2.5 | % | |||||||||||||
| Richmond, NY |
92,563 | 101,853 | 108,829 | 1.9 | % | 1.3 | % | |||||||||||||
| RP® Financial, LC. | MARKET AREA II.7 |
Table 2.1(continued)
Columbia Financial, Inc.
Summary Demographic Data
| Year | Growth Rate | |||||||||||||||||||
| 2021 | 2026 | 2031 | 2021-2026 | 2026-2031 | ||||||||||||||||
| (%) | (%) | |||||||||||||||||||
| Per Capita Income ($) |
||||||||||||||||||||
| USA |
37,689 | 48,879 | 54,670 | 5.3 | % | 2.3 | % | |||||||||||||
| New Jersey |
47,674 | 59,479 | 65,174 | 4.5 | % | 1.8 | % | |||||||||||||
| New York |
43,801 | 54,351 | 60,035 | 4.4 | % | 2.0 | % | |||||||||||||
| Bergen, NJ |
57,183 | 68,660 | 74,352 | 3.7 | % | 1.6 | % | |||||||||||||
| Burlington, NJ |
47,821 | 58,777 | 64,229 | 4.2 | % | 1.8 | % | |||||||||||||
| Camden, NJ |
38,017 | 48,873 | 53,745 | 5.2 | % | 1.9 | % | |||||||||||||
| Essex, NJ |
43,048 | 55,052 | 61,602 | 5.0 | % | 2.3 | % | |||||||||||||
| Gloucester, NJ |
43,520 | 53,764 | 59,140 | 4.3 | % | 1.9 | % | |||||||||||||
| Hunterdon, NJ |
63,772 | 79,235 | 83,758 | 4.4 | % | 1.1 | % | |||||||||||||
| Mercer, NJ |
47,815 | 56,479 | 59,920 | 3.4 | % | 1.2 | % | |||||||||||||
| Middlesex, NJ |
44,549 | 58,680 | 64,748 | 5.7 | % | 2.0 | % | |||||||||||||
| Monmouth, NJ |
57,044 | 72,185 | 78,386 | 4.8 | % | 1.7 | % | |||||||||||||
| Morris, NJ |
64,337 | 77,947 | 83,302 | 3.9 | % | 1.3 | % | |||||||||||||
| Passaic, NJ |
37,142 | 44,632 | 49,505 | 3.7 | % | 2.1 | % | |||||||||||||
| Somerset, NJ |
65,173 | 78,048 | 83,761 | 3.7 | % | 1.4 | % | |||||||||||||
| Union, NJ |
45,316 | 58,227 | 64,486 | 5.1 | % | 2.1 | % | |||||||||||||
| Kings, NY |
39,799 | 50,330 | 56,658 | 4.8 | % | 2.4 | % | |||||||||||||
| Richmond, NY |
43,382 | 49,122 | 52,507 | 2.5 | % | 1.3 | % | |||||||||||||
| 2026 Age Distribution (%) |
0-14 Yrs. | 15-34 Yrs. | 35-54 Yrs. | 55-69 Yrs. | 70+ Yrs. | |||||||||||||||
| USA |
18.3 | 26.8 | 25.1 | 18.4 | 11.4 | |||||||||||||||
| New Jersey |
17.8 | 25.3 | 25.9 | 19.4 | 11.6 | |||||||||||||||
| New York |
17.2 | 26.9 | 25.2 | 19.0 | 11.8 | |||||||||||||||
| Bergen, NJ |
16.7 | 23.7 | 26.9 | 20.1 | 12.6 | |||||||||||||||
| Burlington, NJ |
16.5 | 24.7 | 25.8 | 20.8 | 12.2 | |||||||||||||||
| Camden, NJ |
18.5 | 25.6 | 25.7 | 18.9 | 11.2 | |||||||||||||||
| Essex, NJ |
19.5 | 26.1 | 27.4 | 17.3 | 9.7 | |||||||||||||||
| Gloucester, NJ |
17.0 | 25.5 | 26.0 | 20.4 | 11.2 | |||||||||||||||
| Hunterdon, NJ |
14.3 | 22.7 | 24.6 | 25.4 | 13.0 | |||||||||||||||
| Mercer, NJ |
17.1 | 27.7 | 25.7 | 18.5 | 10.9 | |||||||||||||||
| Middlesex, NJ |
17.6 | 26.2 | 27.1 | 18.4 | 10.8 | |||||||||||||||
| Monmouth, NJ |
16.3 | 23.9 | 24.8 | 22.4 | 12.5 | |||||||||||||||
| Morris, NJ |
16.3 | 24.1 | 26.2 | 21.0 | 12.4 | |||||||||||||||
| Passaic, NJ |
19.8 | 26.8 | 25.2 | 17.8 | 10.4 | |||||||||||||||
| Somerset, NJ |
16.7 | 24.2 | 26.9 | 20.8 | 11.4 | |||||||||||||||
| Union, NJ |
19.1 | 25.1 | 27.2 | 18.3 | 10.3 | |||||||||||||||
| Kings, NY |
19.8 | 28.5 | 26.2 | 15.7 | 9.9 | |||||||||||||||
| Richmond, NY |
17.6 | 25.5 | 25.7 | 19.7 | 11.4 | |||||||||||||||
| 2026 HH Income Dist. (%) |
Less Than 25,000 |
$25,000 to 50,000 |
$50,000 to 100,000 |
$100,000+ | ||||||||||||
| USA |
18.0 | 20.3 | 29.0 | 32.7 | ||||||||||||
| New Jersey |
14.1 | 15.5 | 25.6 | 44.8 | ||||||||||||
| New York |
18.4 | 17.5 | 26.0 | 38.1 | ||||||||||||
| Bergen, NJ |
11.5 | 13.2 | 22.5 | 52.8 | ||||||||||||
| Burlington, NJ |
10.0 | 14.7 | 29.7 | 45.7 | ||||||||||||
| Camden, NJ |
18.4 | 17.9 | 27.0 | 36.6 | ||||||||||||
| Essex, NJ |
21.6 | 18.2 | 23.9 | 36.3 | ||||||||||||
| Gloucester, NJ |
11.3 | 16.1 | 27.8 | 44.8 | ||||||||||||
| Hunterdon, NJ |
7.6 | 11.8 | 22.3 | 58.2 | ||||||||||||
| Mercer, NJ |
15.8 | 15.0 | 25.9 | 43.3 | ||||||||||||
| Middlesex, NJ |
11.5 | 14.5 | 26.5 | 47.5 | ||||||||||||
| Monmouth, NJ |
11.1 | 12.7 | 23.4 | 52.8 | ||||||||||||
| Morris, NJ |
7.9 | 10.7 | 22.7 | 58.6 | ||||||||||||
| Passaic, NJ |
17.4 | 16.4 | 27.0 | 39.2 | ||||||||||||
| Somerset, NJ |
8.1 | 10.4 | 20.4 | 61.2 | ||||||||||||
| Union, NJ |
12.8 | 15.4 | 26.6 | 45.3 | ||||||||||||
| Kings, NY |
22.4 | 17.6 | 23.9 | 36.2 | ||||||||||||
| Richmond, NY |
16.3 | 13.1 | 24.0 | 46.7 | ||||||||||||
Source: S&P Global Market Intelligence.
| RP® Financial, LC. | MARKET AREA II.8 |
The primary market area counties are densely populated markets, ranking among the largest populations in the states of New Jersey and New York. The primary market area counties populations ranged from 132,000 in Hunterdon County to 2.6 million in Kings County. Overall, the Company’s primary market area counties in New Jersey include eight of the ten highest populated counties in the state, while Kings County is most populous county in the state of New York. Population and household growth rates varied among the primary market counties, with the most densely populated markets experiencing the slowest growth rates. Population and household growth rates were the strongest in the counties of Middlesex, Essex and Somerset. Over the past five years, five of the New Jersey primary market area counties recorded stronger population growth rates compared to the New Jersey annual growth rate of 1.5% and three of the New Jersey counties recorded stronger household growth rates compared to the New Jersey annual growth rate of 1.8%. Population and household growth rates for Richmond County outpaced the comparable Kings County growth rates, as well as the state of New York annual population and household growth rates that were both equal to 0.5% over the past five years. Comparative annual population and household growth rates for the U.S. equaled 0.7% and 0.9%, respectively, which fell below all of the primary market area counties growth rates with the exception of Kings County (lower population and household growth rates) and Richmond County (lower household growth rate). Consistent with the U.S. and state trends, population and household growth rates for all of the primary market area counties are projected to be lower over the next five years with Kings County projected to experience a slight decline population over the next five years.
Age distribution measures reflect that the primary market area counties were generally in-line with the New Jersey, New York and U.S age distribution measures, with the counties of Essex, Passaic, Union and Kings showing comparatively younger populations and the counties of Bergen, Burlington, Hunterdon, Monmouth and Morris skewing towards slightly older populations.
The primary market area counties encompass the metropolitan areas of New York City and Philadelphia, which has fostered some relatively affluent markets that are served by the Company’s and Northfield Bancorp’s branch network. U.S. Census Bureau data for 2024 shows that New Jersey ranks second in the United States in terms of median household income. The counties of Hunterdon, Morris and Somerset showed the highest household and per capita income measures among the primary market area counties, while counties with relative low income measures included Camden, Passaic, Kings and Richmond.
| RP® Financial, LC. | MARKET AREA II.9 |
The primary market area counties had estimated 2026 median household incomes ranging from $85,915 in Kings County to $145,344 in Hunterdon County, as compared to $86,867 for the U.S., $108,801 for New Jersey and $91,365 for New York. Per capita income measures for the primary market area counties ranged from $48,873 for Camden County to $79,235 for Hunterdon County, versus $48,879 for the U.S, $59,479 for New Jersey and $54,351 for New York. Projected income growth rates for the primary market area counties are generally fairly consistent or slightly below the comparable state and U.S. projected income growth rates, which all show slower projected income growth rates compared to the past five years.
The relative affluence of the primary market area counties with the higher income measures is further evidenced by a comparison of household income distribution measures, as these counties maintain a lower percentage of households with incomes of less than $25,000 and a higher percentage of households with incomes over $100,000 relative to the U.S. Comparatively, the counties of Camden, Essex and Kings were the only primary market area counties that maintained a higher percentage of households with incomes of less than $25,000 compared to the U.S., while all of the primary market area counties maintained a higher percent of households with incomes over $100,000 compared to the U.S.
Local Economy
The markets served by the Company have large and diverse economies. Comparative employment data in Table 2.2 shows that employment in services and education, healthcare and social services constitute the primary sources of employment for all of the primary market area counties. Wholesale/retail jobs were the third largest employment sector for all of the primary market area counties. Other noteworthy sources of employment throughout the Company’s primary market area include the manufacturing and finance/insurance/real estate sectors.
| RP® Financial, LC. | MARKET AREA II.10 |
| Table 2.2 | ||||||||||||||||||||||||||||||||||||||||||||||||||||||||||||||||||||
| Columbia Financial, Inc. | ||||||||||||||||||||||||||||||||||||||||||||||||||||||||||||||||||||
| Primary Market Area Employment Sectors | ||||||||||||||||||||||||||||||||||||||||||||||||||||||||||||||||||||
| (Percent of Labor Force) | ||||||||||||||||||||||||||||||||||||||||||||||||||||||||||||||||||||
| Employment Sector |
New Jersey |
New York |
Bergen County, NJ |
Burlington County, NJ |
Camden County, NJ |
Essex County, NJ |
Gloucester County, NJ |
Hunterdon County, NJ |
Mercer County, NJ |
Middlesex County, NJ |
Monmouth County, NJ |
Morris County, NJ |
Passaic County, NJ |
Somerset County, NJ |
Union County, NJ |
Kings County, NY |
Richmond County, NY |
|||||||||||||||||||||||||||||||||||||||||||||||||||
| Services |
26.1 | % | 26.4 | % | 27.7 | % | 23.4 | % | 24.2 | % | 26.8 | % | 20.5 | % | 23.7 | % | 25.7 | % | 26.0 | % | 28.1 | % | 27.4 | % | 25.4 | % | 27.2 | % | 24.6 | % | 31.1 | % | 23.9 | % | ||||||||||||||||||||||||||||||||||
| Education,Healthcare, Soc. Serv. |
24.1 | % | 29.0 | % | 24.4 | % | 25.4 | % | 26.3 | % | 24.8 | % | 28.4 | % | 23.3 | % | 24.3 | % | 22.1 | % | 24.0 | % | 23.4 | % | 23.3 | % | 22.3 | % | 23.3 | % | 29.1 | % | 31.6 | % | ||||||||||||||||||||||||||||||||||
| Government |
4.3 | % | 4.7 | % | 2.9 | % | 7.4 | % | 4.9 | % | 4.2 | % | 5.0 | % | 3.2 | % | 5.5 | % | 3.9 | % | 4.1 | % | 3.6 | % | 3.3 | % | 3.2 | % | 4.1 | % | 4.0 | % | 5.9 | % | ||||||||||||||||||||||||||||||||||
| Wholesale/Retail Trade |
12.9 | % | 11.3 | % | 13.6 | % | 13.9 | % | 14.6 | % | 10.5 | % | 15.2 | % | 13.9 | % | 12.2 | % | 13.5 | % | 12.2 | % | 11.3 | % | 15.2 | % | 11.2 | % | 12.1 | % | 9.7 | % | 10.6 | % | ||||||||||||||||||||||||||||||||||
| Finance/Insurance/Real Estate |
8.6 | % | 8.0 | % | 10.7 | % | 7.9 | % | 7.6 | % | 7.8 | % | 6.6 | % | 9.5 | % | 8.2 | % | 9.3 | % | 10.1 | % | 10.5 | % | 5.5 | % | 9.7 | % | 8.6 | % | 7.6 | % | 8.9 | % | ||||||||||||||||||||||||||||||||||
| Manufacturing |
8.3 | % | 5.9 | % | 7.4 | % | 7.6 | % | 7.3 | % | 6.3 | % | 8.0 | % | 13.8 | % | 9.1 | % | 9.9 | % | 6.4 | % | 11.5 | % | 10.4 | % | 14.4 | % | 8.1 | % | 3.0 | % | 3.0 | % | ||||||||||||||||||||||||||||||||||
| Construction |
6.2 | % | 5.6 | % | 5.6 | % | 5.6 | % | 6.5 | % | 7.5 | % | 6.3 | % | 5.7 | % | 6.0 | % | 4.5 | % | 6.8 | % | 4.9 | % | 7.4 | % | 4.2 | % | 7.0 | % | 4.4 | % | 6.4 | % | ||||||||||||||||||||||||||||||||||
| Information |
2.6 | % | 2.8 | % | 2.5 | % | 2.3 | % | 1.9 | % | 3.0 | % | 2.0 | % | 3.2 | % | 2.7 | % | 2.7 | % | 3.4 | % | 3.1 | % | 1.8 | % | 3.4 | % | 2.0 | % | 4.8 | % | 2.2 | % | ||||||||||||||||||||||||||||||||||
| Transportation/Utility |
6.5 | % | 5.8 | % | 5.0 | % | 6.5 | % | 6.4 | % | 9.0 | % | 7.4 | % | 3.0 | % | 5.7 | % | 7.9 | % | 4.5 | % | 4.1 | % | 7.5 | % | 4.3 | % | 10.2 | % | 6.2 | % | 7.3 | % | ||||||||||||||||||||||||||||||||||
| Agriculture |
0.3 | % | 0.5 | % | 0.2 | % | 0.1 | % | 0.3 | % | 0.1 | % | 0.4 | % | 0.7 | % | 0.6 | % | 0.2 | % | 0.4 | % | 0.3 | % | 0.2 | % | 0.1 | % | 0.1 | % | 0.1 | % | 0.1 | % | ||||||||||||||||||||||||||||||||||
|
|
|
|
|
|
|
|
|
|
|
|
|
|
|
|
|
|
|
|
|
|
|
|
|
|
|
|
|
|
|
|
|
|
|
|||||||||||||||||||||||||||||||||||
| 100.0% | 100.0% | 100.0% | 100.0% | 100.0% | 100.0% | 100.0% | 100.0% | 100.0% | 100.0% | 100.0% | 100.0% | 100.0% | 100.0% | 100.0% | 100.0% | 100.0% | ||||||||||||||||||||||||||||||||||||||||||||||||||||
Source: S&P Global Market Intelligence.
The primary market area economy is relatively broad based and due to the overall geographic size covered by the Company’s branch network is somewhat reflective of the New Jersey state economy. Healthcare, education, retail, financial services and technology companies constitute some of the largest employers in the Company’s primary market area counties. Major sources of employment in the New York primary counties include healthcare, government, education, financial services, retail and technology services. Table 2.3 lists the largest employers in the state of New Jersey.
| Table 2.3 | ||||||||
| Columbia Financial, Inc. | ||||||||
| Top Employers in Market Area |
||||||||
| Company | County | Industry | # of Employees | |||||
| Cognizant Technology Solutions |
Bergen | IT Services | 336,300 | |||||
| Johnson & Johnson |
Middlesex | Healthcare | 138,100 | |||||
| Merck & Co |
Union | Pharmaceuticals & Healthcare | 75,000 | |||||
| Becton Dickinson and Co |
Bergen | Medical Technology | 73,000 | |||||
| Automatic Data Processing (ADP) |
Essex | Payroll/HR Services | 64,000 | |||||
| Conduent |
Morris | Business Services & Supplies | 55,000 | |||||
| Burlington Stores |
Burlington | Retail | 44,100 | |||||
| Prudential Financial |
Essex | Financial Services | 40,400 | |||||
| Bristol-Myers Squibb |
Mercer | Pharmaceuticals & Biopharmaceuticals | 34,100 | |||||
| Rutgers University |
Middlesex | Higher Education | 27,000 | |||||
| TD Bank |
Camden | Financial Services | 26,700 | |||||
| Kenvue |
Union | Consumer Health | 22,000 | |||||
| Avis Budget Group |
Morris | Car Rental | 21,300 | |||||
| Campbell’s |
Camden | Food Processing | 14,400 | |||||
| Zoetis |
Morris | Animal Health & Pharmaceuticals | 14,100 | |||||
| Panasonic North America |
Essex | Electronics/Technology/Manufacturing | 14,000 | |||||
| Public Service Enterprise Group |
Essex | Energy/Utilities | 12,500 | |||||
|
Source: New Jersey Jobs: Work Opportunities & Economic Guide, April 2025. |
||||||||
| RP® Financial, LC. | MARKET AREA II.11 |
Unemployment Trends
Comparative unemployment rates for the primary market area counties, as well as for the U.S., New Jersey and New York are shown in Table 2.4. November 2025 unemployment rates for the primary market area counties ranged from a low of 3.9% for Hunterdon County to a high of 5.8% for Essex County. The majority of the primary market area counties reported unemployment rates that were above the November 2025 U.S. unemployment rate of 4.3%. The November 2025 unemployment rates for the states of New Jersey and New York equaled 4.8% and 4.5%, respectively. All of the New Jersey primary market area counties reported higher unemployment rates for November 2025 compared to November 2024, which was consistent with the statewide and national trends. Comparatively, November 2025 unemployment rates for Kings County and Richmond County were respectively slightly lower and unchanged compared to a year ago, while New York’s November 2025 unemployment rate was higher compared to a year ago.
| Table 2.4 | ||||||||
| Columbia Financial, Inc. | ||||||||
| Unemployment Trends(1) | ||||||||
| Nov. 2024 | Nov. 2025 | |||||||
| Region |
Unemployment | Unemployment | ||||||
| USA |
4.0 | % | 4.3 | % | ||||
| New Jersey |
4.3 | % | 4.8 | % | ||||
| New York |
4.2 | % | 4.5 | % | ||||
| Bergen, NJ |
3.5 | % | 3.9 | % | ||||
| Burlington, NJ |
4.1 | % | 4.6 | % | ||||
| Camden, NJ |
4.7 | % | 5.4 | % | ||||
| Essex, NJ |
5.3 | % | 5.8 | % | ||||
| Gloucester, NJ |
4.2 | % | 4.7 | % | ||||
| Hunterdon, NJ |
3.3 | % | 3.9 | % | ||||
| Mercer, NJ |
4.2 | % | 4.8 | % | ||||
| Middlesex, NJ |
4.3 | % | 4.8 | % | ||||
| Monmouth, NJ |
3.9 | % | 4.3 | % | ||||
| Morris, NJ |
3.5 | % | 4.0 | % | ||||
| Passaic, NJ |
5.0 | % | 5.3 | % | ||||
| Somerset, NJ |
3.6 | % | 4.2 | % | ||||
| Union, NJ |
4.6 | % | 5.0 | % | ||||
| Kings, NY |
5.7 | % | 5.6 | % | ||||
| Richmond, NY |
4.9 | % | 4.9 | % | ||||
| (1) | Unemployment rates are not seasonally adjusted. |
Source: S&P Global Market Intelligence.
| RP® Financial, LC. | MARKET AREA II.12 |
Market Area Deposit Characteristics and Competition
The Company’s and Northfield Bancorp’s deposit bases are closely tied to the markets that comprise the New York City and Philadelphia metropolitan areas in the surrounding suburbs of New Jersey. Table 2.5 displays deposit market trends from June 30, 2020 through June 30, 2025 for the primary market counties. Additional data is also presented for the states of New Jersey and New York. Consistent with New Jersey and New York, commercial banks maintained a larger market share of deposits than savings institutions in all of the primary market area counties. Overall, from June 30, 2020 to June 30, 2025, bank and thrift deposits increased in all but two of the primary market area counties, with annual deposit growth rates ranging from negative 3.5% for Union County to positive 6.8% for Passaic County.
Columbia Financial’s highest balance and largest market share of deposits is in Bergen County, where the Company maintains its largest branch presence (20 branches) and headquarters. The Company’s $2.9 million of deposits at the Bergen County branches represented a 4.3% market share of bank and thrift deposits at June 30, 2025. Northfield Bancorp maintains its largest balance and market share of deposits in Richmond County, where it maintains its largest branch presence (12 branches) including the home office in Staten Island. Based on June 30, 2025 deposit data, Northfield Bancorp’s $1.8 billion of deposits provided for a 9.6% market share of bank and thrift deposits in Richmond County.
The Company’s deposit market share at June 30, 2025 ranged from a low of 0.4% in Somerset County to a high of 4.3% in Bergen County. Over the past five years, Columbia Financial gained deposit market share in nine of the counties served by its branches. Northfield Bancorp’s deposit market share at June 30, 2025 ranged from a low of 0.6% in Kings County to a high of 9.6% in Richmond County. Over the past five years, Union County was the only county where Northfield Bancorp gained deposit market share.
Columbia Financial and Northfield Bancorp operate in markets that are highly competitive for financial services, in which the competitive landscape includes other community-based thrifts and banks, as well as regional, super-regional and money center banks. Table 2.6 lists the Company’s and Northfield Bancorp’s largest competitors in the primary market area counties currently served by their branches, based on deposit market share as noted parenthetically. The Company’s and Northfield Bancorp’s deposit market share and market rank have also been provided in Table 2.6.
| RP® Financial, LC. | MARKET AREA II.13 |
| Table 2.5 | ||||||||||||||||||||||||||||
| Columbia Financial, Inc. | ||||||||||||||||||||||||||||
| Deposit Summary | ||||||||||||||||||||||||||||
| As of June 30, | ||||||||||||||||||||||||||||
| 2020 | 2025 | Deposit | ||||||||||||||||||||||||||
| Market | No. of | Market | No. of | Growth Rate |
||||||||||||||||||||||||
| Deposits | Share | Branches | Deposits | Share | Branches | 2020-2025 | ||||||||||||||||||||||
| (Dollars in Millions) | (%) | |||||||||||||||||||||||||||
| New Jersey |
$ | 403,731 | 100.0 | % | 2,714 | $ | 436,803 | 100.0 | % | 2,258 | 1.6 | % | ||||||||||||||||
| Commercial Banks |
$ | 363,767 | 90.1 | % | 2,278 | $ | 384,990 | 88.1 | % | 1,812 | 1.1 | % | ||||||||||||||||
| Savings Institutions |
$ | 39,964 | 9.9 | % | 436 | $ | 51,812 | 11.9 | % | 446 | 5.3 | % | ||||||||||||||||
| New York |
$ | 2,187,268 | 100.0 | % | 4,635 | $ | 2,613,706 | 100.0 | % | 4,014 | 3.6 | % | ||||||||||||||||
| Commercial Banks |
$ | 2,076,016 | 94.9 | % | 4,004 | $ | 2,508,123 | 96.0 | % | 3,555 | 3.9 | % | ||||||||||||||||
| Savings Institutions |
$ | 69,743 | 3.2 | % | 623 | $ | 49,506 | 1.9 | % | 451 | -6.6 | % | ||||||||||||||||
| Other |
$ | 41,509 | 1.9 | % | 8 | $ | 56,077 | 2.1 | % | 8 | 6.2 | % | ||||||||||||||||
| Bergen County, NJ |
$ | 63,678 | 100.0 | % | 396 | $ | 68,617 | 100.0 | % | 348 | 1.5 | % | ||||||||||||||||
| Commercial Banks |
$ | 55,851 | 87.7 | % | 323 | $ | 58,523 | 85.3 | % | 254 | 0.9 | % | ||||||||||||||||
| Savings Institutions |
$ | 7,828 | 12.3 | % | 73 | $ | 10,095 | 14.7 | % | 94 | 5.2 | % | ||||||||||||||||
| Columbia Financial, Inc. |
$ | 2,649 | 4.2 | % | 19 | $ | 2,948 | 4.3 | % | 20 | 2.2 | % | ||||||||||||||||
| Burlington County, NJ |
$ | 13,555 | 100.0 | % | 111 | $ | 14,139 | 100.0 | % | 90 | 0.8 | % | ||||||||||||||||
| Commercial Banks |
$ | 12,007 | 88.6 | % | 95 | $ | 12,307 | 87.0 | % | 78 | 0.5 | % | ||||||||||||||||
| Savings Institutions |
$ | 1,548 | 11.4 | % | 16 | $ | 1,831 | 13.0 | % | 12 | 3.4 | % | ||||||||||||||||
| Columbia Financial, Inc. |
$ | 304 | 2.2 | % | 3 | $ | 426 | 3.0 | % | 3 | 7.0 | % | ||||||||||||||||
| Camden County, NJ |
$ | 13,801 | 100.0 | % | 114 | $ | 14,548 | 100.0 | % | 89 | 1.1 | % | ||||||||||||||||
| Commercial Banks |
$ | 12,945 | 93.8 | % | 105 | $ | 13,582 | 93.4 | % | 82 | 1.0 | % | ||||||||||||||||
| Savings Institutions |
$ | 856 | 6.2 | % | 9 | $ | 966 | 6.6 | % | 7 | 2.4 | % | ||||||||||||||||
| Columbia Financial, Inc. |
$ | 180 | 1.3 | % | 1 | $ | 236 | 1.6 | % | 2 | 5.6 | % | ||||||||||||||||
| Essex County, NJ |
$ | 28,538 | 100.0 | % | 224 | $ | 28,727 | 100.0 | % | 188 | 0.1 | % | ||||||||||||||||
| Commercial Banks |
$ | 25,467 | 89.2 | % | 184 | $ | 26,366 | 91.8 | % | 158 | 0.7 | % | ||||||||||||||||
| Savings Institutions |
$ | 3,071 | 10.8 | % | 40 | $ | 2,362 | 8.2 | % | 30 | -5.1 | % | ||||||||||||||||
| Columbia Financial, Inc. |
$ | 353 | 1.2 | % | 5 | $ | 386 | 1.3 | % | 6 | 1.8 | % | ||||||||||||||||
| Gloucester County, NJ |
$ | 7,739 | 100.0 | % | 71 | $ | 8,907 | 100.0 | % | 65 | 2.9 | % | ||||||||||||||||
| Commercial Banks |
$ | 7,233 | 93.5 | % | 62 | $ | 8,250 | 92.6 | % | 56 | 2.7 | % | ||||||||||||||||
| Savings Institutions |
$ | 506 | 6.5 | % | 9 | $ | 657 | 7.4 | % | 9 | 5.4 | % | ||||||||||||||||
| Columbia Financial, Inc. |
$ | 261 | 3.4 | % | 3 | $ | 372 | 4.2 | % | 3 | 7.3 | % | ||||||||||||||||
| Hunterdon County, NJ |
$ | 5,600 | 100.0 | % | 41 | $ | 6,034 | 100.0 | % | 31 | 1.5 | % | ||||||||||||||||
| Commercial Banks |
$ | 5,096 | 91.0 | % | 33 | $ | 5,583 | 92.5 | % | 26 | 1.8 | % | ||||||||||||||||
| Savings Institutions |
$ | 503 | 9.0 | % | 8 | $ | 451 | 7.5 | % | 5 | -2.2 | % | ||||||||||||||||
| Columbia Financial, Inc. |
$ | 52 | 0.9 | % | 1 | $ | 53 | 0.9 | % | 1 | 0.2 | % | ||||||||||||||||
| Northfield Bancorp, Inc. |
$ | 172 | 3.1 | % | 3 | $ | 186 | 3.1 | % | 3 | 1.6 | % | ||||||||||||||||
| Mercer County, NJ |
$ | 20,283 | 100.0 | % | 137 | $ | 21,750 | 100.0 | % | 101 | 1.4 | % | ||||||||||||||||
| Commercial Banks |
$ | 18,727 | 92.3 | % | 127 | $ | 20,617 | 94.8 | % | 91 | 1.9 | % | ||||||||||||||||
| Savings Institutions |
$ | 1,556 | 7.7 | % | 10 | $ | 1,133 | 5.2 | % | 10 | -6.1 | % | ||||||||||||||||
| Northfield Bancorp, Inc. |
$ | 411 | 2.0 | % | 6 | $ | 295 | 1.4 | % | 5 | -6.4 | % | ||||||||||||||||
| Middlesex County, NJ |
$ | 45,365 | 100.0 | % | 249 | $ | 50,837 | 100.0 | % | 217 | 2.3 | % | ||||||||||||||||
| Commercial Banks |
$ | 39,883 | 87.9 | % | 195 | $ | 43,605 | 85.8 | % | 166 | 1.8 | % | ||||||||||||||||
| Savings Institutions |
$ | 5,482 | 12.1 | % | 54 | $ | 7,232 | 14.2 | % | 51 | 5.7 | % | ||||||||||||||||
| Columbia Financial, Inc. |
$ | 733 | 1.6 | % | 8 | $ | 1,038 | 2.0 | % | 9 | 7.2 | % | ||||||||||||||||
| Northfield Bancorp, Inc. |
$ | 620 | 1.4 | % | 4 | $ | 593 | 1.2 | % | 4 | -0.9 | % | ||||||||||||||||
| Monmouth County, NJ |
$ | 29,325 | 100.0 | % | 237 | $ | 29,823 | 100.0 | % | 186 | 0.3 | % | ||||||||||||||||
| Commercial Banks |
$ | 26,142 | 89.1 | % | 199 | $ | 25,815 | 86.6 | % | 150 | -0.3 | % | ||||||||||||||||
| Savings Institutions |
$ | 3,183 | 10.9 | % | 38 | $ | 4,008 | 13.4 | % | 36 | 4.7 | % | ||||||||||||||||
| Columbia Financial, Inc. |
$ | 283 | 1.0 | % | 3 | $ | 487 | 1.6 | % | 5 | 11.5 | % | ||||||||||||||||
| Morris County, NJ |
$ | 27,468 | 100.0 | % | 199 | $ | 27,331 | 100.0 | % | 160 | -0.1 | % | ||||||||||||||||
| Commercial Banks |
$ | 24,876 | 90.6 | % | 173 | $ | 23,129 | 84.6 | % | 126 | -1.4 | % | ||||||||||||||||
| Savings Institutions |
$ | 2,592 | 9.4 | % | 26 | $ | 4,202 | 15.4 | % | 34 | 10.1 | % | ||||||||||||||||
| Columbia Financial, Inc. |
$ | 418 | 1.5 | % | 5 | $ | 504 | 1.8 | % | 5 | 3.8 | % | ||||||||||||||||
| Passaic County, NJ |
$ | 19,431 | 100.0 | % | 115 | $ | 27,037 | 100.0 | % | 96 | 6.8 | % | ||||||||||||||||
| Commercial Banks |
$ | 17,355 | 89.3 | % | 95 | $ | 23,777 | 87.9 | % | 70 | 6.5 | % | ||||||||||||||||
| Savings Institutions |
$ | 2,076 | 10.7 | % | 20 | $ | 3,260 | 12.1 | % | 26 | 9.4 | % | ||||||||||||||||
| Columbia Financial, Inc. |
$ | 890 | 4.6 | % | 8 | $ | 873 | 3.2 | % | 8 | -0.4 | % | ||||||||||||||||
| Somerset County, NJ |
$ | 15,995 | 100.0 | % | 115 | $ | 17,323 | 100.0 | % | 94 | 1.6 | % | ||||||||||||||||
| Commercial Banks |
$ | 15,086 | 94.3 | % | 100 | $ | 16,322 | 94.2 | % | 82 | 1.6 | % | ||||||||||||||||
| Savings Institutions |
$ | 910 | 5.7 | % | 15 | $ | 1,001 | 5.8 | % | 12 | 1.9 | % | ||||||||||||||||
| Columbia Financial, Inc. |
$ | 65 | 0.4 | % | 1 | $ | 64 | 0.4 | % | 1 | -0.3 | % | ||||||||||||||||
| Union County, NJ |
$ | 29,207 | 100.0 | % | 173 | $ | 24,494 | 100.0 | % | 147 | -3.5 | % | ||||||||||||||||
| Commercial Banks |
$ | 25,170 | 86.2 | % | 138 | $ | 20,363 | 83.1 | % | 117 | -4.2 | % | ||||||||||||||||
| Savings Institutions |
$ | 4,037 | 13.8 | % | 35 | $ | 4,132 | 16.9 | % | 30 | 0.5 | % | ||||||||||||||||
| Columbia Financial, Inc. |
$ | 545 | 1.9 | % | 5 | $ | 810 | 3.3 | % | 6 | 8.3 | % | ||||||||||||||||
| Northfield Bancorp, Inc. |
$ | 303 | 1.0 | % | 4 | $ | 729 | 3.0 | % | 5 | 19.2 | % | ||||||||||||||||
| Kings County, NY |
$ | 67,774 | 100.0 | % | 356 | $ | 68,338 | 100.0 | % | 330 | 0.2 | % | ||||||||||||||||
| Commercial Banks |
$ | 63,317 | 93.4 | % | 301 | $ | 64,666 | 94.6 | % | 288 | 0.4 | % | ||||||||||||||||
| Savings Institutions |
$ | 4,457 | 6.6 | % | 55 | $ | 3,672 | 5.4 | % | 42 | -3.8 | % | ||||||||||||||||
| Northfield Bancorp, Inc. |
$ | 492 | 0.7 | % | 8 | $ | 444 | 0.6 | % | 8 | -2.0 | % | ||||||||||||||||
| Richmond County, NY |
$ | 16,034 | 100.0 | % | 113 | $ | 18,500 | 100.0 | % | 92 | 2.9 | % | ||||||||||||||||
| Commercial Banks |
$ | 11,770 | 73.4 | % | 79 | $ | 16,440 | 88.9 | % | 78 | 6.9 | % | ||||||||||||||||
| Savings Institutions |
$ | 4,264 | 26.6 | % | 34 | $ | 2,060 | 11.1 | % | 14 | -13.5 | % | ||||||||||||||||
| Northfield Bancorp, Inc. |
$ | 1,680 | 10.5 | % | 12 | $ | 1,784 | 9.6 | % | 12 | 1.2 | % | ||||||||||||||||
Source: FDIC.
| RP® Financial, LC. |
MARKET AREA II.14 |
| Table 2.6 | ||||||||||
| Columbia Financial, inc. | ||||||||||
| Market Area Deposit Competitors | ||||||||||
| As of June 30, 2025 | ||||||||||
| Location |
Name |
Market |
Rank |
|||||||
| Bergen County, NJ |
The Toronto-Dominion Bank | 13.95 | ||||||||
| JPMorgan Chase & Co. (NY) | 13.03 | |||||||||
| Bank of America Corporation (NC) | 11.04 | |||||||||
| CRB Group Inc. (NJ) | 9.69 | |||||||||
| Valley National Bancorp (NJ) | 7.29 | |||||||||
| Columbia Financial, Inc. (NJ) | 4.30 | 8 out of 41 | ||||||||
| Burlington County, NJ |
The Toronto-Dominion Bank | 30.08 | ||||||||
| Wells Fargo & Co. (CA) | 12.56 | |||||||||
| The PNC Finl Svcs Grp (PA) | 10.94 | |||||||||
| WSFS Financial Corp. (DE) | 9.94 | |||||||||
| Bank of America Corporation (NC) | 8.65 | |||||||||
| Columbia Financial, Inc. (NJ) | 3.01 | 8 out of 17 | ||||||||
| Camden County, NJ |
The Toronto-Dominion Bank | 38.39 | ||||||||
| The PNC Finl Svcs Grp (PA) | 12.78 | |||||||||
| Fulton Financial Corp. (PA) | 10.41 | |||||||||
| Wells Fargo & Co. (CA) | 8.89 | |||||||||
| Bank of America Corporation (NC) | 4.68 | |||||||||
| Columbia Financial, Inc. (NJ) | 1.62 | 11 out of 18 | ||||||||
| Essex County, NJ |
Flagstar Bank (NY) | 14.43 | ||||||||
| JPMorgan Chase & Co. (NY) | 12.40 | |||||||||
| Bank of America Corporation (NC) | 10.35 | |||||||||
| Wells Fargo & Co. (CA) | 9.74 | |||||||||
| Valley National Bancorp (NJ) | 8.89 | |||||||||
| Columbia Financial, Inc. (NJ) | 1.34 | 14 out of 30 | ||||||||
| Gloucester County, NJ |
The Toronto-Dominion Bank | 30.16 | ||||||||
| Fulton Financial Corp. (PA) | 17.96 | |||||||||
| Parke Bancorp Inc. (NJ) | 11.48 | |||||||||
| Wells Fargo & Co. (CA) | 6.99 | |||||||||
| The PNC Finl Svcs Grp (PA) | 5.79 | |||||||||
| Columbia Financial, Inc. (NJ) | 4.17 | 7 out of 19 | ||||||||
| Hunterdon County, NJ |
The Toronto-Dominion Bank | 26.08 | ||||||||
| The PNC Finl Svcs Grp (PA) | 14.52 | |||||||||
| Unity Bancorp Inc. (NJ) | 12.37 | |||||||||
| Bank of America Corporation (NC) | 12.37 | |||||||||
| Peapack-Gladstone Financial (NJ) | 6.60 | |||||||||
| Columbia Financial, Inc. (NJ) | 0.87 | 15 out of 15 | ||||||||
| Northfield Bancorp, Inc. (NY) | 3.09 | 10 out of 15 | ||||||||
| Mercer County, NJ |
Bank of America Corporation (NC) | 27.78 | ||||||||
| Wells Fargo & Co. (CA) | 14.82 | |||||||||
| The PNC Finl Svcs Grp (PA) | 14.03 | |||||||||
| The Toronto-Dominion Bank | 8.39 | |||||||||
| JPMorgan Chase & Co. (NY) | 6.72 | |||||||||
| Northfield Bancorp, Inc. (NY) | 1.39 | 11 out of 20 | ||||||||
| Middlesex County, NJ |
The PNC Finl Svcs Grp (PA) | 29.67 | ||||||||
| Bank of America Corporation (NC) | 10.74 | |||||||||
| Wells Fargo & Co. (CA) | 8.27 | |||||||||
| Provident Financial Services (NJ) | 7.77 | |||||||||
| The Toronto-Dominion Bank | 7.53 | |||||||||
| Columbia Financial, Inc. (NJ) | 2.04 | 11 out of 40 | ||||||||
| Northfield Bancorp, Inc. (NY) | 1.17 | 15 out of 40 | ||||||||
| Monmouth County, NJ |
The Toronto-Dominion Bank | 14.11 | ||||||||
| Bank of America Corporation (NC) | 13.00 | |||||||||
| Wells Fargo & Co. (CA) | 11.49 | |||||||||
| JPMorgan Chase & Co. (NY) | 11.31 | |||||||||
| Banco Santander S.A. | 10.99 | |||||||||
| Columbia Financial, Inc. (NJ) | 1.63 | 13 out of 22 | ||||||||
| Morris County, NJ |
JPMorgan Chase & Co. (NY) | 14.72 | ||||||||
| Bank of America Corporation (NC) | 14.56 | |||||||||
| The Toronto-Dominion Bank | 12.31 | |||||||||
| Provident Financial Services (NJ) | 9.70 | |||||||||
| Wells Fargo & Co. (CA) | 8.98 | |||||||||
| Columbia Financial, Inc. (NJ) | 1.84 | 13 out of 26 | ||||||||
| Passaic County, NJ |
Valley National Bancorp (NJ) | 57.47 | ||||||||
| The Toronto-Dominion Bank | 7.13 | |||||||||
| JPMorgan Chase & Co. (NY) | 5.93 | |||||||||
| Provident Financial Services (NJ) | 5.59 | |||||||||
| Wells Fargo & Co. (CA) | 5.49 | |||||||||
| Columbia Financial, Inc. (NJ) | 3.23 | 8 out of 18 | ||||||||
| Somerset County, NJ |
Bank of America Corporation (NC) | 17.19 | ||||||||
| The Toronto-Dominion Bank | 16.81 | |||||||||
| Peapack-Gladstone Financial (NJ) | 16.71 | |||||||||
| JPMorgan Chase & Co. (NY) | 10.83 | |||||||||
| The PNC Finl Svcs Grp (PA) | 9.74 | |||||||||
| Columbia Financial, Inc. (NJ) | 0.37 | 19 out of 20 | ||||||||
| Union County, NJ |
Wells Fargo & Co. (CA) | 21.02 | ||||||||
| Bank of America Corporation (NC) | 14.84 | |||||||||
| The Toronto-Dominion Bank | 10.94 | |||||||||
| JPMorgan Chase & Co. (NY) | 7.56 | |||||||||
| Union County SB (NJ) | 5.69 | |||||||||
| Columbia Financial, Inc. (NJ) | 3.33 | 10 out of 29 | ||||||||
| Northfield Bancorp, Inc. (NY) | 2.99 | 11 out of 29 | ||||||||
| Kings County, NY |
JPMorgan Chase & Co. (NY) | 39.40 | ||||||||
| Citigroup Inc. (NY) | 11.78 | |||||||||
| The Toronto-Dominion Bank | 8.84 | |||||||||
| Banco Santander S.A. | 6.93 | |||||||||
| Bank of America Corporation (NY) | 5.74 | |||||||||
| Northfield Bancorp, Inc. (NY) | 0.65 | 17 out of 40 | ||||||||
| Richmond County, NY |
JPMorgan Chase & Co. (NY) | 21,.75 | ||||||||
| Flagstar Bank (NY) | 15.86 | |||||||||
| Banco Santander S.A. | 15.19 | |||||||||
| The Toronto-Dominion Bank | 11.45 | |||||||||
| Citigroup Inc. (NY) | 10.42 | |||||||||
| Northfield Bancorp, Inc. (NY) | 9.64 | 6 out of 16 | ||||||||
| Source: S&P Global Market Intelligence. |
||||||||||
| RP® Financial, LC. | PEER GROUP ANALYSIS III.1 |
III. PEER GROUP ANALYSIS
This chapter presents an analysis of Columbia Financial’s operations versus a group of comparable savings institutions (the “Peer Group”) selected from the universe of all publicly-traded savings and banking institutions in a manner consistent with the regulatory valuation guidelines. The basis of the pro forma market valuation of Columbia Financial is derived from the pricing ratios of the Peer Group institutions, incorporating valuation adjustments for key differences in relation to the Peer Group. Since no Peer Group can be exactly comparable to Columbia Financial, key areas examined for differences are: financial condition; profitability, growth and viability of earnings; asset growth; primary market area; dividends; liquidity of the shares; marketing of the issue; management; and effect of government regulations and regulatory reform. Our comparative analysis of Columbia Financial and the Peer Group took into consideration the pro forma impact of the acquisition of Northfield Bancorp. Such data was derived from the prospectus and RP Financial calculations.
Peer Group Selection
The Peer Group selection process is governed by the general parameters set forth in the regulatory valuation guidelines. In applying the selection criteria it was appropriate to include public commercial banking companies as well as public thrifts to assemble at least a ten member Peer Group of financial institutions meeting the asset size and regional criteria. Further, recognizing that Columbia Bank operates as a “Covered Savings Association” which incorporates the same rights and privileges to operate as a National Bank, we considered the Company’s operating strategy and financial characteristics in selecting Peer Group members. Since the inclusion of commercial banking companies in the Peer Group was an exception to the applicable regulatory valuation guidelines, RP Financial sought and received prior authorization from the FRB to include commercial banking companies in the Peer Group along with the comparable public thrifts selected. The inclusion of these commercial banking companies narrows some of the key differences that may have resulted with an all thrift Peer Group, as the asset size range and region of the country would have been broader and their operating strategies and financial characteristics would have been more diverse.
| RP® Financial, LC. | PEER GROUP ANALYSIS III.2 |
Specifically, we have limited the Peer Group composition to publicly-traded thrift and commercial banking companies whose common stock is either listed on the NYSE or NASDAQ, since their stock trading activity is regularly reported and generally more frequent than non- publicly traded and closely-held institutions. Institutions that are not listed on the NYSE or NASDAQ are inappropriate, since the trading activity for thinly-traded or closely-held stocks is typically highly irregular in terms of frequency and price and thus may not be a reliable indicator of market value. We have also excluded from the Peer Group those companies under acquisition or subject to rumored acquisition and recent conversions, since their pricing ratios are subject to unusual distortion and/or have limited trading history. A recent listing of the universe of all publicly-traded banking companies and savings institutions is included as Exhibit III-1.
From the universe of publicly-traded thrifts and commercial banking companies, we selected 12 institutions with characteristics similar to those of Columbia Financial. In the selection process, we applied the following “screen” to the universe of all public companies that were eligible for consideration:
| • | Screen #1 Mid-Atlantic thrifts and commercial banking companies with assets between $7.0 billion and $25.0 billion, tangible equity/assets ratios of greater than 8.0% and positive core earnings. Sixteen companies met the criteria for Screen #1 and twelve were included in the Peer Group: CNB Financial Corporation of Pennsylvania, ConnectOne Bancorp, Inc. of New Jersey, Dime Community Bancshares, Inc. of New York, First Commonwealth Financial Corporation of Pennsylvania, Kearny Financial Corp. of New Jersey, NBT Bancorp Inc. of New York, Peapack-Gladstone Financial Corporation of New Jersey, Provident Financial Services, Inc. of New Jersey, S&T Bancorp, Inc. of Pennsylvania, Tompkins Financial Corporation of New York, Univest Financial Corporation of Pennsylvania and WSFS Financial Corporation of Delaware. |
Three of the companies that met the selection criteria were excluded on the basis of operating characteristics that were not consistent with the Company’s community banking strategy: Amalgamated Financial Corp. of New York, Customers Bancorp, Inc. of Pennsylvania and Metropolitan Bank Holding Corp. of New York. The fourth company that was excluded was Flushing Financial Corporation of New York, which was excluded due to being the target of an announced acquisition. Exhibit III-2 provides financial and public market pricing characteristics of all publicly-traded Mid-Atlantic thrifts and commercial banking companies.
Table 3.1 shows the general characteristics of each of the twelve Peer Group companies and Exhibit III-3 provides summary demographic and deposit market share data for the primary market areas served by each of the Peer Group companies. While there are expectedly some differences between the Peer Group companies and Columbia Financial, we believe that the Peer Group companies, on average, provide a good basis for valuation subject to valuation adjustments. The following sections present a comparison of Columbia Financial’s
| RP® Financial, LC. | PEER GROUP ANALYSIS III.3 |
| Exhibit III-3 | ||||||||||||||||||||||||||||||||||||
| Peer Group Market Area Comparative Analysis | ||||||||||||||||||||||||||||||||||||
| Population | Proj. Pop. |
2021-2026 % Change |
2026-2031 % Change |
Per Capita Income |
Deposit Share(1) |
|||||||||||||||||||||||||||||||
| Institution |
County |
2021 |
2026 |
2031 |
2026 Amount |
% State |
||||||||||||||||||||||||||||||
| CNB Financial Corporation |
Clearfield, PA | 78,742 | 77,527 | 75,714 | -0.3 | % | -0.5 | % | 38,422 | 81.4 | % | 56.18 | % | |||||||||||||||||||||||
| ConnectOne Bancorp, Inc. |
Bergen, NJ | 934,026 | 988,027 | 1,014,061 | 1.1 | % | 0.5 | % | 68,660 | 154.4 | % | 6.94 | % | |||||||||||||||||||||||
| Dime Community Bancshares, Inc. |
Suffolk, NY | 1,471,007 | 1,538,850 | 1,554,171 | 0.9 | % | 0.2 | % | 63,182 | 159.8 | % | 10.10 | % | |||||||||||||||||||||||
| First Commonwealth Financial Corporation |
Indiana, PA | 83,236 | 82,516 | 81,759 | -0.2 | % | -0.2 | % | 35,538 | 75.3 | % | 25.88 | % | |||||||||||||||||||||||
| Kearny Financial Corp. |
Essex, NJ | 801,147 | 894,352 | 924,581 | 2.2 | % | 0.7 | % | 55,052 | 101.3 | % | 0.61 | % | |||||||||||||||||||||||
| NBT Bancorp Inc. |
Chenango, NY | 46,647 | 45,357 | 44,301 | -0.6 | % | -0.5 | % | 39,543 | 102.4 | % | 97.81 | % | |||||||||||||||||||||||
| Peapack-Gladstone Financial Corporation |
Somerset, NJ | 328,529 | 362,139 | 374,903 | 2.0 | % | 0.7 | % | 78,048 | 153.5 | % | 16.84 | % | |||||||||||||||||||||||
| Provident Financial Services, Inc. |
Hudson, NJ | 675,195 | 748,928 | 776,160 | 2.1 | % | 0.7 | % | 61,458 | 144.9 | % | 2.45 | % | |||||||||||||||||||||||
| S&T Bancorp, Inc. |
Indiana, PA | 83,236 | 82,516 | 81,759 | -0.2 | % | -0.2 | % | 35,538 | 73.6 | % | 45.83 | % | |||||||||||||||||||||||
| Tompkins Financial Corporation |
Tompkins, NY | 101,898 | 105,404 | 105,439 | 0.7 | % | 0.0 | % | 51,785 | 95.3 | % | 60.58 | % | |||||||||||||||||||||||
| Univest Financial Corporation |
Montgomery, PA | 835,577 | 884,715 | 903,614 | 1.1 | % | 0.4 | % | 65,772 | 134.1 | % | 9.33 | % | |||||||||||||||||||||||
| WSFS Financial Corporation |
New Castle, DE | 560,931 | 593,555 | 613,254 | 1.1 | % | 0.7 | % | 52,415 | 88.1 | % | 1.43 | % | |||||||||||||||||||||||
| Averages: | 500,014 | 533,657 | 545,810 | 0.8 | % | 0.2 | % | 53,784 | 113.7 | % | 27.83 | % | ||||||||||||||||||||||||
| Medians: | 444,730 | 477,847 | 494,079 | 1.0 | % | 0.3 | % | 53,734 | 101.9 | % | 13.47 | % | ||||||||||||||||||||||||
| Columbia Financial, Inc. |
Bergen, NJ | 934,026 | 988,027 | 1,014,061 | 1.1 | % | 0.5 | % | 68,660 | 115.4 | % | 4.30 | % | |||||||||||||||||||||||
| (1) | Total institution deposits in headquarters county as percent of total county deposits as of June 30, 2025. |
Sources: S&P Capital IQ and FDIC.
| RP® Financial, LC. | PEER GROUP ANALYSIS III.4 |
financial condition, income and expense trends, loan composition, interest rate risk and credit risk versus the Peer Group as of the most recent publicly available date. Comparative data for all publicly-traded thrifts and banks, and public New Jersey thrifts and banks have been included in the Chapter III tables as well.
In addition to the selection criteria used to identify the Peer Group companies, a summary description of the key comparable characteristics of each of the Peer Group companies relative to Columbia Financial’s characteristics is detailed below.
| • | CNB Financial Corporation of Pennsylvania (commercial bank). Comparable due to similar interest-earning asset composition, similar impact of credit loss provisions on earnings, similar concentration of 1-4 family loans as a percent of assets and similar ratio of non-performing assets as a percent of assets. |
| • | ConnectOne Bancorp, Inc. of New Jersey (commercial bank). Comparable due to New Jersey market area, limited earnings contribution from sources of non-interest operating income, relatively lower operating expense-to-average assets ratio and similar concentration of multi-family loans as a percent of assets. |
| • | Dime Community Bancshares, Inc. of New York (converted from thrift to commercial bank). Comparable due to similar concentration of loans as a percent of assets, limited earnings contribution from sources of non-interest operating income, relatively low operating expense-to-average assets ratio and similar concentration of multi-family loans as a percent of assets. |
| • | First Commonwealth Financial Corporation of Pennsylvania (commercial bank). Comparable due to similar concentrations of 1-4 family loans and commercial real estate loans as a percent of assets. |
| • | Kearny Financial Corp. of New Jersey (thrift). Comparable due to New Jersey market aera, similar interest-earning asset composition, similar interest-bearing funding composition, limited earnings contribution from sources of non-interest operating income and relatively low operating expense-to-average assets ratio. |
| • | NBT Bancorp, Inc. of New York (commercial bank). Comparable due to similar asset size as Columbia Financial’s pro forma assets, similar interest-earning asset composition, similar concentrations of 1-4 family loans and commercial real estate loans as a percent of assets and similar ratio of non-performing assets as a percent of assets. |
| • | Peapack-Gladstone Financial Corporation of New Jersey (commercial bank). Comparable due to New Jersey market area and similar concentrations of multi-family loans and commercial real estate loans as a percent of assets. |
| • | Provident Financial Services, Inc. of New Jersey (thrift). Comparable due to New Jersey market area, similar concentration of deposits funding assets, limited earnings contribution from sources of non-interest operating income, relatively low operating expense-to-average assets ratio and similar ratio of non-performing assets as a percent of assets. |
| • | S&T Bancorp, Inc. of Pennsylvania (commercial bank). Comparable due to similar combined concentration of mortgage-backed securities and 1-4 family loans as a percent of assets. |
| RP® Financial, LC. | PEER GROUP ANALYSIS III.5 |
| • | Tompkins Financial Corporation of New York (commercial bank). Comparable due to similar interest-earning asset composition, similar impact of credit loss provisions on earnings and similar concentration of 1-4 family loans as a percent of assets. |
| • | Univest Financial Corporation of Pennsylvania (commercial bank). Comparable due to similar impact of credit loss provisions on earnings and similar concentration of 1-4 family loans as a percent of assets. |
| • | WSFS Financial Corporation of Delaware (thrift). Comparable due to similar combined concentration of mortgage-backed securities and 1-4 family loans as a percent of assets and similar concentration of commercial real estate loans as a percent of assets. |
In aggregate, the Peer Group companies maintained a slightly lower level of tangible equity than the industry average (9.00% of assets versus 9.97% for all public companies), generated slightly lower earnings as a percent of average assets (0.97% core ROAA versus 1.06% for all public companies) and earned a slightly lower ROE (8.66% core ROE versus 9.60% for all public companies). Overall, the Peer Group’s average P/TB ratio and average core P/E multiple were below and similar to the respective averages for all publicly-traded banks and thrifts.
| All Publicly-Traded |
Peer Group | |||||||
| Financial Characteristics (Averages) |
||||||||
| Assets ($Mil) |
$ | 72,262 | $ | 12,738 | ||||
| Market capitalization ($Mil)(1) |
$ | 10,077 | $ | 1,619 | ||||
| Tangible equity/assets (%) |
9.97 | % | 9.00 | % | ||||
| Core return on average assets (%) |
1.06 | 0.97 | ||||||
| Core return on average equity (%) |
9.60 | 8.66 | ||||||
| Pricing Ratios (Averages)(1) |
||||||||
| Core price/earnings (x) |
12.90x | 12.81x | ||||||
| Price/tangible book (%) |
149.05 | % | 136.39 | % | ||||
| Price/assets (%) |
13.88 | 12.04 | ||||||
| (1) | Based on market prices as of February 2, 2026. |
Since the Peer Group companies have some differences to the Company, as will be evaluated in the following pages, it is necessary to determine such differences for the purpose of determining valuation adjustments in the next chapter. However, in general, those selected for the Peer Group are relatively comparable to Columbia Financial, and provide a good basis for the valuation analysis incorporated herein. The financial data presented for Columbia Financial includes the estimated pro forma impact of the acquisition of Northfield Bancorp, unless otherwise noted.
| RP® Financial, LC. | PEER GROUP ANALYSIS III.6 |
Financial Condition
Table 3.2 shows comparative balance sheet measures for Columbia Financial and the Peer Group, reflecting the expected similarities and some differences given the selection procedures outlined above. Columbia Financial’s ratios include the pro forma impact of the Northfield Bancorp acquisition before the impact of the second-step stock offering. The Company’s and the Peer Group’s ratios reflect balances as of December 31, 2025. Columbia Financial’s equity-to-assets ratio of 9.51% was below the Peer Group’s average net worth ratio of 11.28%. Comparatively, tangible equity-to-assets ratios equaled 8.35% and 9.00% for the Company and the Peer Group, respectively, as goodwill and intangibles were a less significant factor on the Company’s balance sheet (1.16% of assets versus 2.29% for the Peer Group). Columbia Financial’s pro forma capital position will increase with the addition of stock proceeds, which will provide the Company with a tangible equity-to-assets ratio that will exceed the Peer Group’s ratio. The increase in Columbia Financial’s pro forma capital position will be favorable from a risk perspective and in terms of future earnings potential that could be realized through leverage and lower funding costs. At the same time, the Company’s higher pro forma capitalization will initially depress pro forma ROE. Both Columbia Financial’s (stand-alone basis) and the Peer Group’s capital ratios reflected capital surpluses with respect to the regulatory capital requirements.
The interest-earning asset compositions for the Company and the Peer Group were somewhat similar, with loans constituting the highest concentration of interest-earning assets for both Columbia Financial and the Peer Group. The Company’s loans-to-assets ratio of 71.95% was lower than the comparable Peer Group ratio of 75.71%. Comparatively, the Company’s cash and investments-to-assets ratio of 20.46% was higher than the comparable Peer Group ratio of 17.53%. Overall, Columbia Financial’s interest-earning assets amounted to 92.41% of assets, which was slightly lower than the comparable Peer Group ratio of 93.24%. The Peer Group’s non-interest earning assets included bank-owned life insurance (“BOLI”) equal to 1.81% of assets and goodwill/intangibles equal to 2.29% of assets, while the Company maintained BOLI equal to 2.83% of assets and goodwill/intangibles equal to 1.16% of assets.
Columbia Financial’s funding liabilities reflected a funding composition that was somewhat similar to that of the Peer Group’s funding composition. The Company’s deposits equaled 75.56% of assets, which was below the Peer Group’s ratio of 81.85%. Comparatively, the Company maintained a higher level of borrowings (inclusive of subordinated debt) than the Peer Group, as indicated by borrowings-to-assets ratios of 13.01% and 5.44% for Columbia Financial and the Peer Group, respectively. Total interest-bearing liabilities maintained by the Company and the Peer Group, as a percent of assets, equaled 88.57% and 87.29%, respectively.
| RP® Financial, LC. | PEER GROUP ANALYSIS III.7 |
| Table 3.2 | ||||||||||||||||||||||||||||||||||||||||||||||||||||||||||||||||||||||||||||||||||||
| Balance Sheet Composition and Growth Rates | ||||||||||||||||||||||||||||||||||||||||||||||||||||||||||||||||||||||||||||||||||||
| Comparable Institution Analysis | ||||||||||||||||||||||||||||||||||||||||||||||||||||||||||||||||||||||||||||||||||||
| As of December 31, 2025 or the Most Recent Date Available | ||||||||||||||||||||||||||||||||||||||||||||||||||||||||||||||||||||||||||||||||||||
| Balance Sheet as a Percent of Assets | Balance Sheet Annual Growth Rates | Regulatory Capital | ||||||||||||||||||||||||||||||||||||||||||||||||||||||||||||||||||||||||||||||||||
| Cash & |
MBS & |
BOLI |
Net |
Deposits |
Borrowed |
Sub. |
Total |
Goodwill & Intang |
Tangible |
Assets |
MBS, Cash |
Loans |
Deposits |
Borrows. |
Total |
Tangible |
Tier 1 |
Tier 1 Risk-Based |
Risk-Based |
|||||||||||||||||||||||||||||||||||||||||||||||||||||||||||||||||
| Columbia Financial, Inc. |
NJ | |||||||||||||||||||||||||||||||||||||||||||||||||||||||||||||||||||||||||||||||||||
| December 31, 2025 |
1.80 | % | 18.66 | % | 2.83 | % | 71.95 | % | 75.56 | % | 12.64 | % | 0.37 | % | 9.51 | % | 1.16 | % | 8.35 | % | 57.40 | % | 90.12 | % | 50.99 | % | 53.88 | % | 98.52 | % | 45.09 | % | 43.30 | % | 10.27 | % | 14.03 | % | 14.92 | % | ||||||||||||||||||||||||||||||||||||||||||||
| All Public Banks and Non-MHC Thrifts |
||||||||||||||||||||||||||||||||||||||||||||||||||||||||||||||||||||||||||||||||||||
| Averages |
6.14 | % | 15.22 | % | 1.56 | % | 70.90 | % | 81.26 | % | 4.62 | % | 0.80 | % | 11.60 | % | 1.65 | % | 9.97 | % | 7.64 | % | 8.10 | % | 8.19 | % | 7.98 | % | -4.94 | % | 15.93 | % | 25.22 | % | 10.34 | % | 13.43 | % | 15.36 | % | ||||||||||||||||||||||||||||||||||||||||||||
| Medians |
4.83 | % | 14.36 | % | 1.54 | % | 73.01 | % | 82.37 | % | 3.65 | % | 0.68 | % | 11.05 | % | 1.18 | % | 9.23 | % | 4.26 | % | 4.58 | % | 5.17 | % | 4.34 | % | -8.06 | % | 10.81 | % | 12.75 | % | 10.00 | % | 12.79 | % | 14.75 | % | ||||||||||||||||||||||||||||||||||||||||||||
| Comparable Group |
||||||||||||||||||||||||||||||||||||||||||||||||||||||||||||||||||||||||||||||||||||
| Averages |
4.32 | % | 13.21 | % | 1.81 | % | 75.71 | % | 81.85 | % | 4.41 | % | 1.03 | % | 11.28 | % | 2.29 | % | 9.00 | % | 10.99 | % | 13.55 | % | 11.02 | % | 11.41 | % | -0.56 | % | 14.91 | % | 16.15 | % | 10.03 | % | 12.66 | % | 13.78 | % | ||||||||||||||||||||||||||||||||||||||||||||
| Medians |
2.61 | % | 12.33 | % | 1.77 | % | 76.98 | % | 82.91 | % | 2.64 | % | 1.21 | % | 11.21 | % | 2.05 | % | 8.80 | % | 6.71 | % | 9.15 | % | 5.78 | % | 6.56 | % | -11.87 | % | 8.78 | % | 11.69 | % | 10.07 | % | 12.26 | % | 13.38 | % | ||||||||||||||||||||||||||||||||||||||||||||
| Comparable Group |
||||||||||||||||||||||||||||||||||||||||||||||||||||||||||||||||||||||||||||||||||||
| CCNE |
CNB Financial Corporation | PA | 6.29 | % | 10.21 | % | 1.90 | % | 76.57 | % | 83.69 | % | 1.95 | % | 1.26 | % | 10.39 | % | 1.46 | % | 8.93 | % | 35.60 | % | 9.14 | % | 40.92 | % | 30.83 | % | 67.75 | % | 42.81 | % | 32.35 | % | 10.50 | % | 13.57 | % | 14.34 | % | ||||||||||||||||||||||||||||||||||||||||||
| CNOB |
ConnectOne Bancorp, Inc. | NJ | 2.72 | % | 9.46 | % | 2.65 | % | 80.69 | % | 80.27 | % | 6.68 | % | 1.44 | % | 11.24 | % | 2.00 | % | 9.24 | % | 41.73 | % | 65.64 | % | 37.92 | % | 43.74 | % | 44.99 | % | 26.71 | % | 25.71 | % | 10.59 | % | 12.36 | % | 13.33 | % | ||||||||||||||||||||||||||||||||||||||||||
| DCOM |
Dime Community Bancshares, Inc. | NY | 15.34 | % | 9.67 | % | 2.61 | % | 69.50 | % | 83.70 | % | 3.61 | % | 1.78 | % | 9.62 | % | 1.03 | % | 8.58 | % | 6.89 | % | 43.17 | % | -1.32 | % | 9.88 | % | -15.63 | % | 5.67 | % | 6.49 | % | 10.17 | % | 14.40 | % | 15.35 | % | ||||||||||||||||||||||||||||||||||||||||||
| FCF |
First Commonwealth Financial Corporation |
PA | 1.46 | % | 12.74 | % | 1.89 | % | 78.21 | % | 83.05 | % | 2.28 | % | 1.04 | % | 12.59 | % | 3.24 | % | 9.35 | % | 6.54 | % | 1.85 | % | 8.26 | % | 5.92 | % | 5.66 | % | 10.62 | % | 12.94 | % | 9.97 | % | 11.69 | % | 13.43 | % | ||||||||||||||||||||||||||||||||||||||||||
| KRNY |
Kearny Financial Corp. | NJ | 1.93 | % | 15.36 | % | 4.06 | % | 75.02 | % | 74.95 | % | 14.37 | % | 0.00 | % | 9.94 | % | 1.51 | % | 8.43 | % | -1.43 | % | -2.50 | % | -0.62 | % | 0.71 | % | -13.02 | % | 1.68 | % | 2.08 | % | 8.86 | % | 13.79 | % | 14.75 | % | ||||||||||||||||||||||||||||||||||||||||||
| NBTB |
NBT Bancorp Inc. | NY | 3.05 | % | 17.00 | % | 1.99 | % | 71.65 | % | 84.40 | % | 1.20 | % | 0.85 | % | 11.85 | % | 3.19 | % | 8.66 | % | 16.02 | % | 15.41 | % | 16.20 | % | 16.91 | % | -26.48 | % | 24.25 | % | 22.90 | % | 9.35 | % | 11.92 | % | 13.02 | % | ||||||||||||||||||||||||||||||||||||||||||
| PGC |
Peapack-Gladstone Financial Corporation |
NJ | 2.50 | % | 11.93 | % | 0.63 | % | 82.21 | % | 87.54 | % | 1.56 | % | 1.32 | % | 8.75 | % | 0.58 | % | 8.16 | % | 7.35 | % | -16.66 | % | 13.58 | % | 7.50 | % | 21.46 | % | 8.64 | % | 9.82 | % | 9.89 | % | 11.52 | % | 12.64 | % | ||||||||||||||||||||||||||||||||||||||||||
| PFS |
Provident Financial Services, Inc. | NJ | 0.85 | % | 14.34 | % | 1.66 | % | 77.40 | % | 77.17 | % | 8.45 | % | 1.63 | % | 11.34 | % | 3.13 | % | 8.21 | % | 3.86 | % | 10.47 | % | 3.79 | % | 3.52 | % | 1.26 | % | 8.92 | % | 15.03 | % | 10.38 | % | 12.15 | % | 13.08 | % | ||||||||||||||||||||||||||||||||||||||||||
| STBA |
S&T Bancorp, Inc. | PA | 1.66 | % | 10.17 | % | 0.87 | % | 80.84 | % | 80.63 | % | 2.19 | % | 0.50 | % | 14.83 | % | 3.81 | % | 11.02 | % | 2.21 | % | -7.41 | % | 4.43 | % | 2.26 | % | -10.73 | % | 6.06 | % | 8.41 | % | 11.91 | % | 14.30 | % | 15.86 | % | ||||||||||||||||||||||||||||||||||||||||||
| TMP |
Tompkins Financial Corporation | NY | 1.53 | % | 19.93 | % | 0.90 | % | 73.70 | % | 80.04 | % | 7.61 | % | 0.00 | % | 10.83 | % | 0.84 | % | 9.99 | % | 6.90 | % | 8.08 | % | 7.13 | % | 7.20 | % | -22.88 | % | 31.53 | % | 39.67 | % | 8.92 | % | 11.48 | % | 12.39 | % | ||||||||||||||||||||||||||||||||||||||||||
| UVSP |
Univest Financial Corporation | PA | 6.56 | % | 6.33 | % | 1.66 | % | 81.10 | % | 84.00 | % | 3.00 | % | 1.17 | % | 11.18 | % | 2.10 | % | 9.08 | % | 3.80 | % | 26.22 | % | 1.27 | % | 4.85 | % | -15.62 | % | 6.31 | % | 7.94 | % | 9.07 | % | 10.72 | % | 11.97 | % | ||||||||||||||||||||||||||||||||||||||||||
| WSFS |
WSFS Financial Corporation | DE | 7.93 | % | 21.37 | % | 0.87 | % | 61.67 | % | 82.77 | % | 0.07 | % | 1.35 | % | 12.85 | % | 4.55 | % | 8.30 | % | 2.40 | % | 9.15 | % | 0.75 | % | 3.60 | % | -43.53 | % | 5.76 | % | 10.43 | % | 10.69 | % | 14.06 | % | 15.25 | % | ||||||||||||||||||||||||||||||||||||||||||
| (1) Includes loans held for sale. |
||||||||||||||||||||||||||||||||||||||||||||||||||||||||||||||||||||||||||||||||||||
| Source: S&P Global Market Intelligence and RP® Financial, LC. calculations. The information provided in this table has been obtained from sources we believe are reliable, but we cannot guarantee the accuracy or completeness of such information. |
|
|||||||||||||||||||||||||||||||||||||||||||||||||||||||||||||||||||||||||||||||||||
| Copyright (c) 2026 by RP® Financial, LC. |
|
|||||||||||||||||||||||||||||||||||||||||||||||||||||||||||||||||||||||||||||||||||
| RP® Financial, LC. | PEER GROUP ANALYSIS III.8 |
A key measure of balance sheet strength for a banking institution is its IEA/IBL ratio. Presently, the Company’s IEA/IBL is slightly lower than the Peer Group’s ratio, based on IEA/IBL ratios of 104.34% and 106.82%, respectively. The additional capital realized from stock proceeds should provide Columbia Financial with an IEA/IBL ratio that exceeds the Peer Group’s ratio, as the increase in capital provided by the infusion of stock proceeds will serve to lower the level of interest-bearing liabilities funding assets and on the asset side of the balance sheet the net proceeds, net of the cash consideration to fund the acquisition of Northfield Bancorp, will be primarily deployed into interest-earning assets.
The growth rate section of Table 3.2 shows annual growth rates for key balance sheet items. Columbia Financial’s and the Peer Group’s growth rates are based on annual growth for the twelve months ended December 31, 2025. The Company’s growth rates reflect Columbia Financial’s growth and the pro forma growth resulting from the acquisition of Northfield Bancorp. Columbia Financial recorded a 57.40% increase in assets, versus asset growth of 10.99% recorded by the Peer Group. Asset growth for Columbia Financial was driven by a 50.99% increase in loans and a 90.12% increase in cash and investments. Asset growth for the Peer Group included an 11.02% increase in loans and a 13.55% increase in cash and investments.
Acquisition-related growth was also the primary driver behind the Company’s higher deposit growth rate, with the Company and the Peer Group posting deposit growth rates of 53.88% and 11.41%, respectively. With the acquisition of Northfield Bancorp, the Company’s borrowings increased by 98.52% compared to a 0.56% decrease for the Peer Group’s borrowings. The Company’s tangible capital growth rate of 43.30% includes the issuance of stock to fund 30% of the consideration to be paid for the acquisition of Northfield Bancorp, which was partially offset by the goodwill and intangibles resulting from the acquisition. Comparatively, the Peer Group’s tangible capital increased by 16.15%. The Company’s post-conversion capital growth rate will initially be constrained by maintenance of a higher pro forma capital position. Additionally, implementation of any stock repurchases and dividend payments, pursuant to regulatory limitations and guidelines, could also slow the Company’s capital growth rate in the longer term following the stock offering.
| RP® Financial, LC. | PEER GROUP ANALYSIS III.9 |
Income and Expense Components
Table 3.3 displays income statement ratios for the Company and the Peer Group. The Company’s and the Peer Group’s ratios are based on earnings for the twelve months ended December 31, 2025. The Company’s earnings have been adjusted to reflect the pro forma impact of the Northfield Bancorp acquisition, unless otherwise noted. Columbia Financial and the Peer Group reported net income to average assets ratios of 0.43% and 1.06%, respectively. Higher ratios of net interest income. non-interest operating income and non-operating income represented earnings advantages for the Peer Group, while lower ratios for credit loss provisions and operating expenses were earnings advantages for the Company.
The Peer Group’s higher net interest income to average assets ratio was realized through a higher interest income ratio and a lower interest expense ratio. A higher yield earned on interest-earning assets facilitated the Peer Group’s higher interest income ratio (5.36% versus 4.76% for the Company). Interest expense ratios equaled 2.24% and 1.94% for the Company and the Peer Group, respectively, which was consistent with the Company’s higher cost of interest-bearing liabilities (3.13% versus 2.89% for the Peer Group). Yields and costs reflected for the Company are on a stand-alone basis. Overall, Columbia Financial and the Peer Group reported net interest income to average assets ratios of 2.45% and 3.06%, respectively.
In another key area of core earnings strength, the Company maintained a lower level of operating expenses than the Peer Group. For the period covered in Table 3.3, the Company and the Peer Group reported operating expense to average assets ratios of 1.75% and 2.30%, respectively. The Company’s lower operating expense ratio was viewed to be in part attributable to an interest-earning asset composition that consisted of a higher concentration of cash and investments and a lower concentration of loans relative to the Peer Group’s interest-earning asset composition. Additionally, the Company’s less significant diversification into areas that generate sources of non-interest operating income would tend to support a lower level of operating expenses. The Company’s lower operating expense ratio was also facilitated in part through maintaining a comparatively lower number of employees relative to its asset size. Assets per full-time equivalent employee equaled $14.3 million for the Company, versus $11.0 million for the Peer Group. It should be noted that the Company’s pro forma operating expense ratio does not reflect any cost savings merger synergies that are expected to be realized from the merger.
| RP® Financial, LC. | PEER GROUP ANALYSIS III.10 |
| Table 3.3 | ||||||||||||||||||||||||||||||||||||||||||||||||||||||||||||||||||||||||||
| Income as Percent of Average Assets and Yields, Costs, Spreads | ||||||||||||||||||||||||||||||||||||||||||||||||||||||||||||||||||||||||||
| Comparable Institution Analysis | ||||||||||||||||||||||||||||||||||||||||||||||||||||||||||||||||||||||||||
| For the 12 Months Ended December 31, 2025 or the Most Recent 12 Months Available | ||||||||||||||||||||||||||||||||||||||||||||||||||||||||||||||||||||||||||
| Net Interest Income | Non-Interest Income | NonOp Items | Yields, Costs, and Spreads | |||||||||||||||||||||||||||||||||||||||||||||||||||||||||||||||||||||||
| Net |
Income |
Expense |
NII |
Loss |
NII |
Gain |
Other |
Total |
Net Gains/ |
Extrao. |
Provision |
Yield |
Cost |
Yld-Cost |
MEMO: |
MEMO: |
||||||||||||||||||||||||||||||||||||||||||||||||||||||||||
| (%) | (%) | (%) | (%) | (%) | (%) | (%) | (%) | (%) | (%) | (%) | (%) | (%) | (%) | (%) | ($000) | (%) | ||||||||||||||||||||||||||||||||||||||||||||||||||||||||||
| Columbia Financial, Inc. |
NJ | |||||||||||||||||||||||||||||||||||||||||||||||||||||||||||||||||||||||||
| December 31, 2025 |
0.43 | % | 4.69 | % | 2.24 | % | 2.45 | % | 0.11 | % | 2.34 | % | 0.01 | % | 0.30 | % | 1.75 | % | -0.24 | % | 0.00 | % | 0.24 | % | 4.76 | % | 3.13 | % | 1.63 | % | $ | 14,325 | 35.99 | % | ||||||||||||||||||||||||||||||||||||||||
| All Public Banks and Non-MHC Thrifts |
||||||||||||||||||||||||||||||||||||||||||||||||||||||||||||||||||||||||||
| Averages |
1.00 | % | 5.27 | % | 1.98 | % | 3.29 | % | 0.25 | % | 3.03 | % | 0.12 | % | 0.71 | % | 2.55 | % | -0.09 | % | 0.00 | % | 0.28 | % | 5.64 | % | 2.87 | % | 2.78 | % | $ | 10,595 | 21.14 | % | ||||||||||||||||||||||||||||||||||||||||
| Medians |
1.06 | % | 5.13 | % | 1.92 | % | 3.23 | % | 0.13 | % | 3.05 | % | 0.03 | % | 0.46 | % | 2.41 | % | -0.01 | % | 0.00 | % | 0.27 | % | 5.55 | % | 2.81 | % | 2.76 | % | $ | 9,251 | 21.15 | % | ||||||||||||||||||||||||||||||||||||||||
| Comparable Group |
||||||||||||||||||||||||||||||||||||||||||||||||||||||||||||||||||||||||||
| Averages |
1.06 | % | 5.00 | % | 1.94 | % | 3.06 | % | 0.17 | % | 2.90 | % | 0.02 | % | 0.71 | % | 2.30 | % | 0.07 | % | 0.00 | % | 0.34 | % | 5.36 | % | 2.89 | % | 2.47 | % | $ | 11,003 | 24.16 | % | ||||||||||||||||||||||||||||||||||||||||
| Medians |
1.11 | % | 5.12 | % | 2.02 | % | 3.07 | % | 0.14 | % | 2.98 | % | 0.01 | % | 0.61 | % | 2.44 | % | -0.01 | % | 0.00 | % | 0.32 | % | 5.52 | % | 2.90 | % | 2.53 | % | $ | 8,916 | 23.70 | % | ||||||||||||||||||||||||||||||||||||||||
| Comparable Group |
||||||||||||||||||||||||||||||||||||||||||||||||||||||||||||||||||||||||||
| CCNE |
CNB Financial Corporation | PA | 0.93 | % | 5.50 | % | 2.11 | % | 3.39 | % | 0.12 | % | 3.27 | % | 0.00 | % | 0.50 | % | 2.48 | % | -0.13 | % | 0.00 | % | 0.23 | % | 5.90 | % | 2.85 | % | 3.05 | % | $ | 8,735 | 19.81 | % | ||||||||||||||||||||||||||||||||||||||
| CNOB |
ConnectOne Bancorp, Inc. | NJ | 0.66 | % | 5.28 | % | 2.39 | % | 2.89 | % | 0.38 | % | 2.51 | % | 0.02 | % | 0.17 | % | 1.57 | % | -0.21 | % | 0.00 | % | 0.26 | % | 5.66 | % | 3.42 | % | 2.24 | % | $ | 19,002 | 28.65 | % | ||||||||||||||||||||||||||||||||||||||
| DCOM |
Dime Community Bancshares, Inc. | NY | 0.77 | % | 4.78 | % | 1.94 | % | 2.85 | % | 0.29 | % | 2.56 | % | 0.01 | % | 0.31 | % | 1.72 | % | -0.01 | % | 0.00 | % | 0.32 | % | 5.06 | % | 3.17 | % | 1.89 | % | $ | 15,940 | 29.41 | % | ||||||||||||||||||||||||||||||||||||||
| FCF |
First Commonwealth Financial Corporation | PA | 1.26 | % | 5.25 | % | 1.71 | % | 3.53 | % | 0.03 | % | 3.50 | % | 0.06 | % | 0.68 | % | 2.41 | % | 0.06 | % | 0.00 | % | 0.32 | % | 5.70 | % | 2.62 | % | 3.08 | % | $ | 7,952 | 20.41 | % | ||||||||||||||||||||||||||||||||||||||
| KRNY |
Kearny Financial Corp. | NJ | 0.43 | % | 4.24 | % | 2.33 | % | 1.91 | % | 0.03 | % | 1.88 | % | 0.01 | % | 0.25 | % | 1.62 | % | 0.01 | % | 0.00 | % | 0.10 | % | 4.51 | % | 2.95 | % | 1.56 | % | $ | 14,651 | 18.57 | % | ||||||||||||||||||||||||||||||||||||||
| NBTB |
NBT Bancorp Inc. | NY | 1.11 | % | 4.65 | % | 1.37 | % | 3.28 | % | 0.21 | % | 3.07 | % | 0.00 | % | 1.28 | % | 2.78 | % | -0.13 | % | 0.00 | % | 0.33 | % | 5.09 | % | 2.26 | % | 2.83 | % | $ | 7,070 | 22.88 | % | ||||||||||||||||||||||||||||||||||||||
| PGC |
Peapack-Gladstone Financial Corporation | NJ | 0.52 | % | 5.03 | % | 2.24 | % | 2.79 | % | 0.33 | % | 2.46 | % | 0.02 | % | 1.10 | % | 2.87 | % | 0.02 | % | 0.00 | % | 0.21 | % | 5.11 | % | 3.25 | % | 1.86 | % | $ | 10,766 | 28.64 | % | ||||||||||||||||||||||||||||||||||||||
| PFS |
Provident Financial Services, Inc. | NJ | 1.19 | % | 5.21 | % | 2.10 | % | 3.11 | % | 0.02 | % | 3.10 | % | 0.00 | % | 0.44 | % | 1.88 | % | 0.01 | % | 0.00 | % | 0.48 | % | 5.64 | % | 2.95 | % | 2.69 | % | $ | 13,497 | 28.66 | % | ||||||||||||||||||||||||||||||||||||||
| STBA |
S&T Bancorp, Inc. | PA | 1.38 | % | 5.30 | % | 1.71 | % | 3.59 | % | 0.06 | % | 3.53 | % | 0.00 | % | 0.56 | % | 2.33 | % | -0.02 | % | 0.00 | % | 0.35 | % | 5.74 | % | 2.84 | % | 2.90 | % | $ | 8,060 | 20.07 | % | ||||||||||||||||||||||||||||||||||||||
| TMP |
Tompkins Financial Corporation | NY | 1.96 | % | 4.65 | % | 1.61 | % | 3.04 | % | 0.14 | % | 2.90 | % | 0.00 | % | 0.66 | % | 2.50 | % | 1.28 | % | 0.00 | % | 0.78 | % | 4.84 | % | 2.46 | % | 2.38 | % | $ | 8,528 | 28.37 | % | ||||||||||||||||||||||||||||||||||||||
| UVSP |
Univest Financial Corporation | PA | 1.11 | % | 5.27 | % | 2.33 | % | 2.94 | % | 0.15 | % | 2.79 | % | 0.04 | % | 1.03 | % | 2.48 | % | 0.00 | % | 0.00 | % | 0.28 | % | 5.61 | % | 3.39 | % | 2.22 | % | $ | 9,053 | 19.93 | % | ||||||||||||||||||||||||||||||||||||||
| WSFS |
WSFS Financial Corporation | DE | 1.36 | % | 4.83 | % | 1.39 | % | 3.44 | % | 0.23 | % | 3.21 | % | 0.04 | % | 1.59 | % | 3.01 | % | -0.02 | % | 0.00 | % | 0.44 | % | 5.43 | % | 2.52 | % | 2.91 | % | $ | 8,779 | 24.53 | % | ||||||||||||||||||||||||||||||||||||||
| (1) Net gains/losses includes gain/loss on sale of securities and nonrecurring income and expense. |
|
|||||||||||||||||||||||||||||||||||||||||||||||||||||||||||||||||||||||||
| Source: S&P Global Market Intelligence and RP® Financial, LC. calculations. The information provided in this table has been obtained from sources we believe are reliable, but we cannot guarantee the accuracy or completeness of such information. |
|
|||||||||||||||||||||||||||||||||||||||||||||||||||||||||||||||||||||||||
| Copyright (c) 2026 by RP® Financial, LC. |
||||||||||||||||||||||||||||||||||||||||||||||||||||||||||||||||||||||||||
| RP® Financial, LC. | PEER GROUP ANALYSIS III.I1 |
When viewed together, net interest income and operating expenses provide considerable insight into a thrift’s earnings strength, since those sources of income and expenses are typically the most prominent components of earnings and are generally more predictable than losses and gains realized from the sale of assets or other non-recurring activities. In this regard, as measured by their expense coverage ratios (net interest income divided by operating expenses), the Company’s earnings were slightly more favorable than the Peer Group’s earnings. Expense coverage ratios for Columbia Financial and the Peer Group equaled 1.40x and 1.33x, respectively.
Sources of non-interest operating income provided a larger contribution to the Peer Group’s earnings, with such income amounting to 0.31% and 0.73% of Columbia Financial’s and the Peer Group’s average assets, respectively. Taking non-interest operating income into account in comparing the Company’s and the Peer Group’s earnings, Columbia Financial’s efficiency ratio (operating expenses, as a percent of the sum of non-interest operating income and net interest income) of 63.41% was slightly less favorable than the Peer Group’s efficiency ratio of 60.69%. It is expected that with cost savings to be realized from merger synergies, the Company’s efficiency ratio will improve with the integration of the acquisition of Northfield Bancorp.
Credit loss provisions had a slightly larger impact on the Peer Group’s earnings, based on credit loss provisions to average assets ratios of 0.11% and 0.17% for Columbia Financial and the Peer Group, respectively.
The Company recorded a net non-operating loss equal to 0.24% of average assets, while the Peer Group’s earnings reflected net non-operating income equal to 0.07% of average assets. Typically, gains and losses generated from the sale of assets and other non-operating activities are viewed as earnings with a relatively high degree of volatility, and, thus, are not considered to be part of an institution’s core earnings. Extraordinary items were not a factor in either the Company’s or the Peer Group’s earnings.
The Company recorded an effective tax rate of 35.99%, which was higher than the Peer Group’s effective tax rate of 24.16%. As indicated in the prospectus, the Company’s effective marginal tax rate is equal to 27.00%.
Loan Composition
Table 3.4 presents data related to the Company’s and the Peer Group’s loan portfolio compositions (including the investment in mortgage-backed securities). Columbia Financial’s ratios include the pro forma impact of the Northfield Bancorp acquisition. In comparison to the
| RP® Financial, LC. | PEER GROUP ANALYSIS III.12 |
| Table 3.4 | ||||||||||||||||||||||||||||||||||||||||||
| Loan Portfolio Composition and Related Information | ||||||||||||||||||||||||||||||||||||||||||
| Comparable Institution Analysis | ||||||||||||||||||||||||||||||||||||||||||
| As of December 31, 2025 or the Most Recent Date Available | ||||||||||||||||||||||||||||||||||||||||||
| Portfolio Composition as a Percent of Assets | ||||||||||||||||||||||||||||||||||||||||||
| MBS |
1-4 |
Constr. |
Multi- |
Comm RE |
Commerc. |
Consumer |
RWA/ |
Servicing |
||||||||||||||||||||||||||||||||||
| (%) | (%) | (%) | (%) | (%) | (%) | (%) | (%) | ($000) | ||||||||||||||||||||||||||||||||||
| Columbia Financial, Inc. |
NJ | |||||||||||||||||||||||||||||||||||||||||
| December 31, 2025 |
14.52 | % | 19.27 | % | 3.12 | % | 24.50 | % | 20.77 | % | 5.66 | % | 0.03 | % | 76.21 | % | $ | 1,484 | ||||||||||||||||||||||||
| All Public Banks and Non-MHC Thrifts |
||||||||||||||||||||||||||||||||||||||||||
| Averages |
8.88 | % | 16.74 | % | 4.92 | % | 7.11 | % | 24.05 | % | 13.49 | % | 3.35 | % | 73.80 | % | $ | 98,940 | ||||||||||||||||||||||||
| Medians |
8.09 | % | 15.80 | % | 4.26 | % | 5.08 | % | 24.99 | % | 11.57 | % | 0.81 | % | 77.00 | % | $ | 810 | ||||||||||||||||||||||||
| Comparable Group |
||||||||||||||||||||||||||||||||||||||||||
| Averages |
8.82 | % | 17.27 | % | 3.57 | % | 13.95 | % | 25.66 | % | 12.48 | % | 2.68 | % | 77.81 | % | $ | 1,827 | ||||||||||||||||||||||||
| Medians |
7.84 | % | 19.50 | % | 3.63 | % | 8.95 | % | 25.56 | % | 11.26 | % | 0.97 | % | 78.49 | % | $ | 1,318 | ||||||||||||||||||||||||
| Comparable Group |
||||||||||||||||||||||||||||||||||||||||||
| CCNE |
CNB Financial Corporation | PA | 4.44 | % | 25.06 | % | 5.13 | % | 8.63 | % | 24.74 | % | 11.94 | % | 1.54 | % | 75.43 | % | $ | 2,634 | ||||||||||||||||||||||
| CNOB |
ConnectOne Bancorp, Inc. | NJ | 6.82 | % | 11.29 | % | 7.31 | % | 24.43 | % | 27.15 | % | 10.57 | % | 0.01 | % | 83.99 | % | $ | 0 | ||||||||||||||||||||||
| DCOM |
Dime Community Bancshares, Inc. | NY | 6.27 | % | 6.72 | % | 0.91 | % | 22.88 | % | 29.76 | % | 9.63 | % | 0.01 | % | 68.97 | % | $ | 2,070 | ||||||||||||||||||||||
| FCF |
First Commonwealth Financial Corporation | PA | 11.54 | % | 19.44 | % | 3.78 | % | 5.32 | % | 22.50 | % | 16.28 | % | 11.69 | % | 82.41 | % | $ | 715 | ||||||||||||||||||||||
| KRNY |
Kearny Financial Corp. | NJ | 7.86 | % | 23.85 | % | 2.48 | % | 34.61 | % | 12.93 | % | 1.87 | % | 0.03 | % | 63.51 | % | $ | 0 | ||||||||||||||||||||||
| NBTB |
NBT Bancorp Inc. | NY | 10.44 | % | 19.57 | % | 2.92 | % | 9.27 | % | 17.18 | % | 10.12 | % | 13.44 | % | 76.96 | % | $ | 2,088 | ||||||||||||||||||||||
| PGC |
Peapack-Gladstone Financial Corporation | NJ | 7.83 | % | 9.18 | % | 0.34 | % | 23.87 | % | 17.56 | % | 26.90 | % | 2.24 | % | 84.98 | % | $ | 0 | ||||||||||||||||||||||
| PFS |
Provident Financial Services, Inc. | NJ | 10.20 | % | 11.16 | % | 3.17 | % | 14.15 | % | 39.34 | % | 9.37 | % | 0.08 | % | 82.64 | % | $ | 1,058 | ||||||||||||||||||||||
| STBA |
S&T Bancorp, Inc. | PA | 6.93 | % | 24.31 | % | 3.64 | % | 7.59 | % | 29.43 | % | 14.85 | % | 1.04 | % | 80.02 | % | $ | 5,149 | ||||||||||||||||||||||
| TMP |
Tompkins Financial Corporation | NY | 9.25 | % | 21.41 | % | 4.72 | % | 7.89 | % | 26.38 | % | 11.14 | % | 1.00 | % | 74.90 | % | $ | 1,522 | ||||||||||||||||||||||
| UVSP |
Univest Financial Corporation | PA | 4.99 | % | 20.43 | % | 3.62 | % | 3.98 | % | 36.59 | % | 15.73 | % | 0.16 | % | 84.13 | % | $ | 5,571 | ||||||||||||||||||||||
| WSFS |
WSFS Financial Corporation | DE | 19.31 | % | 14.87 | % | 4.84 | % | 4.81 | % | 24.33 | % | 11.39 | % | 0.95 | % | 75.72 | % | $ | 1,113 | ||||||||||||||||||||||
| Source: S&P Global Market Intelligence and RP® Financial, LC. calculations. The information provided in this table has been obtained from sources we believe are reliable, but we cannot guarantee the accuracy or completeness of such information. |
| |||||||||||||||||||||||||||||||||||||||||
| Copyright (c) 2026 by RP® Financial, LC. |
||||||||||||||||||||||||||||||||||||||||||
| RP® Financial, LC. | PEER GROUP ANALYSIS III.13 |
Peer Group, the Company’s loan portfolio composition reflected a higher combined concentration of 1-4 family permanent mortgage loans and mortgage-backed securities (33.79% of assets versus 26.09% for the Peer Group), as the Company maintained higher concentrations of both 1-4 family loans and mortgage-backed securities. Loan servicing intangibles constituted a similar balance sheet item for the Company and the Peer Group, equaling $1.5 million and $1.8 million for the Company and the Peer Group, respectively.
Diversification into higher risk and higher yielding types of lending was fairly similar for the Company and the Peer Group. The Peer Group’s loan portfolio composition reflected higher concentrations of commercial real estate loans (25.66% of assets versus 20.77% of assets for the Company), construction/land loans (3.57% of assets versus 3.12% of assets for the Company), commercial business loans (12.48% of assets versus 5.66% of assets for the Company) and consumer loans (2.68% of assets versus 0.03% of assets for the Company), while the Company maintained a higher concentration of multi-family loans (24.50% of assets versus 13.95% of assets for the Peer Group). In total, construction/land, commercial real estate, multi-family, commercial business and consumer loans comprised 54.08% and 58.26% of the Company’s and the Peer Group’s assets, respectively. Overall, the Company and the Peer Group had similar risk-weighted assets/assets ratios of 76.21% and 77.81%, respectively.
Interest Rate Risk
Table 3.5 reflects various key ratios highlighting the relative interest rate risk exposure of the Company versus the Peer Group. The Bank’s ratios for “Balance Sheet Measures” reflect the pro forma impact of the Northfield Bancorp acquisition before factoring in the benefit of the second-step offering proceeds. The “Quarterly Change in Net Interest Income” figures reflect Columbia Financial’s operations only, due to the absence of data for the merged entity. Additionally, the historical fluctuations in Northfieldl Bancorp’s net interest income ratios are considered to be less meaningful for purposes of analyzing interest rate risk of the combined entity, since the interest rate sensitive assets and liabilities of Northfield Bancorp will be marked to fair value based on prevailing interest rates at the time the acquisition becomes effective.
In terms of balance sheet composition, Columbia Financial’s interest rate risk characteristics implied a slightly higher degree of interest rate risk exposure relative to the comparable measures for the Peer Group. In particular, the Company’s tangible equity-to-assets ratio and IEA/IBL ratio were slightly below and above the respective Peer Group ratios, while the Company’s ratio of non-interest earning assets as a percent of assets was slightly above the Peer Group’s ratio. On a pro forma basis, the infusion of stock proceeds should serve to strengthen the Company’s balance sheet interest rate risk characteristics, given the increases that will be realized in the Company’s tangible equity-to-assets and IEA/IBL ratios.
| RP® Financial, LC. | PEER GROUP ANALYSIS III.14 |
| Table 3.5 | ||||||||||||||||||||||||||||||||||||||||||||
| Interest Rate Risk Measures and Net Interest Income Volatility | ||||||||||||||||||||||||||||||||||||||||||||
| Comparable Institution Analysis | ||||||||||||||||||||||||||||||||||||||||||||
| As of December 31, 2025 or the Most Recent Date Available | ||||||||||||||||||||||||||||||||||||||||||||
| Balance Sheet Measures | ||||||||||||||||||||||||||||||||||||||||||||
| Tangible | Non-Earn. | Quarterly Change in Net Interest Income | ||||||||||||||||||||||||||||||||||||||||||
| Equity/ | IEA/ | Assets/ | ||||||||||||||||||||||||||||||||||||||||||
| Assets |
IBL |
Assets |
12/31/2025 |
9/30/2025 |
6/30/2025 |
3/31/2025 |
12/31/2024 |
9/30/2024 |
||||||||||||||||||||||||||||||||||||
| (%) | (%) | (%) | (change in net interest income is annualized in basis points) | |||||||||||||||||||||||||||||||||||||||||
| Columbia Financial, Inc. |
|
NJ | ||||||||||||||||||||||||||||||||||||||||||
| December 31, 2025 |
|
8.4 | % | 104.3 | % | 7.6 | % | 5 | 12 | 9 | 2 | 15 | 6 | |||||||||||||||||||||||||||||||
| All Public Banks and Non-MHC Thrifts |
|
|||||||||||||||||||||||||||||||||||||||||||
| Average |
|
10.1 | % | 106.4 | % | 7.7 | % | 5 | 9 | 11 | 3 | 3 | 5 | |||||||||||||||||||||||||||||||
| Median |
9.4 | % | 106.3 | % | 7.8 | % | 4 | 8 | 11 | 2 | 4 | 5 | ||||||||||||||||||||||||||||||||
| Comparable Group |
|
|||||||||||||||||||||||||||||||||||||||||||
| Average |
|
9.0 | % | 106.8 | % | 6.8 | % | 8 | 8 | 13 | 3 | 7 | 5 | |||||||||||||||||||||||||||||||
| Median |
8.8 | % | 106.7 | % | 7.2 | % | 6 | 9 | 12 | 1 | 4 | 5 | ||||||||||||||||||||||||||||||||
| Comparable Group |
|
|||||||||||||||||||||||||||||||||||||||||||
| CCNE |
CNB Financial Corporation | PA | 8.9 | % | 107.1 | % | 6.9 | % | 14 | 10 | 23 | -11 | 1 | 9 | ||||||||||||||||||||||||||||||
| CNOB |
ConnectOne Bancorp, Inc. | NJ | 9.2 | % | 105.1 | % | 7.1 | % | 15 | 6 | 14 | 1 | 18 | -2 | ||||||||||||||||||||||||||||||
| DCOM |
Dime Community Bancshares, Inc. | NY | 8.6 | % | 106.1 | % | 5.5 | % | 10 | 7 | 5 | 10 | 28 | 12 | ||||||||||||||||||||||||||||||
| FCF |
First Commonwealth Financial Corporation | PA | 9.4 | % | 107.0 | % | 7.6 | % | 6 | 13 | 24 | 0 | -1 | 3 | ||||||||||||||||||||||||||||||
| KRNY |
Kearny Financial Corp. | NJ | 8.4 | % | 103.4 | % | 7.7 | % | 3 | 10 | 9 | 7 | 2 | -4 | ||||||||||||||||||||||||||||||
| NBTB |
NBT Bancorp Inc. | NY | 8.7 | % | 106.1 | % | 8.3 | % | 0 | 10 | 16 | 3 | 7 | 11 | ||||||||||||||||||||||||||||||
| PGC |
Peapack-Gladstone Financial Corporation | NJ | 8.2 | % | 106.9 | % | 3.4 | % | 26 | 7 | 11 | 17 | 13 | 11 | ||||||||||||||||||||||||||||||
| PFS |
Provident Financial Services, Inc. | NJ | 8.2 | % | 106.1 | % | 7.4 | % | 2 | 10 | 5 | -2 | 1 | 8 | ||||||||||||||||||||||||||||||
| STBA |
S&T Bancorp, Inc. | PA | 11.0 | % | 111.2 | % | 7.3 | % | 7 | 8 | 10 | -2 | -3 | 1 | ||||||||||||||||||||||||||||||
| TMP |
Tompkins Financial Corporation | NY | 10.0 | % | 108.6 | % | 4.8 | % | 22 | 13 | 13 | -1 | 13 | 8 | ||||||||||||||||||||||||||||||
| UVSP |
Univest Financial Corporation | PA | 9.1 | % | 106.6 | % | 6.0 | % | -6 | 1 | 14 | 13 | 6 | 1 | ||||||||||||||||||||||||||||||
| WSFS |
WSFS Financial Corporation | DE | 8.3 | % | 108.0 | % | 9.0 | % | -5 | 6 | 5 | -1 | 2 | 1 | ||||||||||||||||||||||||||||||
| NA=Change is greater than 100 basis points during the quarter. |
|
|||||||||||||||||||||||||||||||||||||||||||
| Source: S&P Global Market Intelligence and RP® Financial, LC. calculations. The information provided in this table has been obtained from sources we believe are reliable, but we cannot guarantee the accuracy or completeness of such information. |
| |||||||||||||||||||||||||||||||||||||||||||
| Copyright (c) 2026 by RP® Financial, LC. |
|
|||||||||||||||||||||||||||||||||||||||||||
| RP® Financial, LC. | PEER GROUP ANALYSIS III.15 |
To analyze interest rate risk associated with the net interest margin, we reviewed quarterly changes in net interest income as a percent of average assets for Columbia Financial (stand-alone basis) and the Peer Group. In general, the comparative fluctuations in the Company’s and the Peer Group’s net interest income ratios implied that a similar degree of interest rate risk was associated with the Company’s and the Peer Group’s net interest margins, based on the interest rate environment that prevailed during the period covered in Table 3.5. The stability of the Company’s net interest margin should be enhanced by the infusion of stock proceeds, as interest rate sensitive liabilities will be funding a lower portion of Columbia Financial’s assets and the proceeds will be substantially deployed into interest-earning assets.
Credit Risk
Overall, based on a comparison of credit risk measures, the Company’s implied credit risk exposure was viewed to be slightly less than the Peer Group’s implied credit risk exposure. Columbia Financial’s ratios include the pro forma impact of the Northfield Bancorp acquisition. As shown in Table 3.6, the Company’s ratios for non-performing/assets and non-performing loans/loans equaled 0.39% and 0.53%, respectively, versus comparable measures of 0.79% and 0.95% for the Peer Group. These ratios include accruing loans that are classified as troubled debt restructurings. The Company’s and Peer Group’s loss reserves as a percent of non-performing loans equaled 105.02% and 146.38%, respectively. Loss reserves maintained as percent of loans receivable equaled 0.56% for the Company, versus 1.11% for the Peer Group. The Company’s lower reserve ratio reflects fair value accounting for the acquisition of Northfield Bancorp. Net loan charge-offs were a larger factor for the Peer Group, as net loan charge-offs for the Company and the Peer Group equaled 0.08% and 0.21% of loans, respectively.
| RP® Financial, LC. | Peer Group Analysis Page III.16 |
Table 3.6
Credit Risk Measures and Related Information
Comparable Institution Analysis
As of December 31, 2025 or the Most Recent Date Available
| REO/ Assets |
NPAs & 90+Del/ Assets (1) |
NPLs/ Loans (2) |
Rsrves/ Loans HFI |
Rsrves/ NPLs (2) |
Rsrves/ NPAs & 90+Del (1) |
Net Loan Chargeoffs (3) |
NLCs/ Loans |
|||||||||||||||||||||||||||
| (%) | (%) | (%) | (%) | (%) | (%) | ($000) | (%) | |||||||||||||||||||||||||||
| Columbia Financial, Inc. |
NJ | |||||||||||||||||||||||||||||||||
| December 31, 2025 |
0.00 | % | 0.39 | % | 0.53 | % | 0.56 | % | 105.02 | % | 105.02 | % | $ | 10,222 | 0.08 | % | ||||||||||||||||||
| All Public Banks and Non-MHC Thrifts |
||||||||||||||||||||||||||||||||||
| Averages |
0.05 | % | 0.53 | % | 0.68 | % | 1.27 | % | 258.01 | % | 227.23 | % | $ | 201,856 | 0.29 | % | ||||||||||||||||||
| Medians |
0.01 | % | 0.44 | % | 0.54 | % | 1.18 | % | 208.88 | % | 185.68 | % | $ | 6,703 | 0.13 | % | ||||||||||||||||||
| Comparable Group |
||||||||||||||||||||||||||||||||||
| Averages |
0.03 | % | 0.79 | % | 0.95 | % | 1.11 | % | 146.38 | % | 128.43 | % | $ | 20,085 | 0.21 | % | ||||||||||||||||||
| Medians |
0.00 | % | 0.72 | % | 0.85 | % | 1.15 | % | 127.05 | % | 122.71 | % | $ | 16,239 | 0.18 | % | ||||||||||||||||||
| Comparable Group |
||||||||||||||||||||||||||||||||||
| CCNE CNB Financial Corporation |
PA | 0.03 | % | 0.52 | % | 0.63 | % | 1.00 | % | 158.54 | % | 150.02 | % | $ | 7,193 | 0.10 | % | |||||||||||||||||
| CNOB ConnectOne Bancorp, Inc. |
NJ | 0.00 | % | 0.71 | % | 0.72 | % | 1.35 | % | 187.03 | % | 154.34 | % | $ | 18,234 | 0.18 | % | |||||||||||||||||
| DCOM Dime Community Bancshares, Inc. |
NY | 0.00 | % | 0.81 | % | 1.16 | % | 0.91 | % | 78.09 | % | 78.09 | % | $ | 32,320 | 0.30 | % | |||||||||||||||||
| FCF First Commonwealth Financial Corporation |
PA | 0.01 | % | 0.88 | % | 1.08 | % | 1.32 | % | 119.10 | % | 116.59 | % | $ | 29,375 | 0.31 | % | |||||||||||||||||
| KRNY Kearny Financial Corp. |
NJ | 0.00 | % | 0.73 | % | 0.97 | % | 0.78 | % | 80.61 | % | 80.61 | % | $ | 2,135 | 0.04 | % | |||||||||||||||||
| NBTB NBT Bancorp Inc. |
NY | 0.00 | % | 0.34 | % | 0.40 | % | 1.19 | % | 300.08 | % | 257.85 | % | $ | 17,980 | 0.16 | % | |||||||||||||||||
| PGC Peapack-Gladstone Financial Corporation |
NJ | 0.00 | % | 2.17 | % | 2.61 | % | 1.14 | % | 43.45 | % | 43.45 | % | $ | 25,554 | 0.44 | % | |||||||||||||||||
| PFS Provident Financial Services, Inc. |
NJ | 0.01 | % | 0.46 | % | 0.58 | % | 0.95 | % | 163.53 | % | 160.67 | % | $ | 12,790 | 0.07 | % | |||||||||||||||||
| STBA S&T Bancorp, Inc. |
PA | 0.00 | % | 0.73 | % | 0.90 | % | 1.15 | % | 128.82 | % | 128.82 | % | $ | 14,498 | 0.18 | % | |||||||||||||||||
| TMP Tompkins Financial Corporation |
NY | 0.00 | % | 0.60 | % | 0.80 | % | 0.90 | % | 110.69 | % | 109.90 | % | $ | 10,389 | 0.17 | % | |||||||||||||||||
| UVSP Univest Financial Corporation |
PA | 0.28 | % | 0.69 | % | 0.49 | % | 1.28 | % | 261.29 | % | 152.65 | % | $ | 11,118 | 0.16 | % | |||||||||||||||||
| WSFS WSFS Financial Corporation |
DE | 0.00 | % | 0.78 | % | 1.08 | % | 1.35 | % | 125.27 | % | 108.21 | % | $ | 59,429 | 0.45 | % | |||||||||||||||||
| (1) | NPAs are defined as nonaccrual loans, accruing loans 90 days or more past due, performing TDRs, and OREO. |
| (2) | NPLs are defined as nonaccrual loans, accruing loans 90 days or more past due and performing TDRs. |
| (3) | Net loan chargeoffs are shown on a last twelve month basis. |
Source: S&P Global Market Intelligence and RP® Financial, LC. calculations. The information provided in this table has been obrained from sources we believe are reliable, but we cannot guarantee the accuracy or completeness of such information.
Copyright (c) 2026 by RP® Financial, LC.
| RP® Financial, LC. | PEER GROUP ANALYSIS III.17 |
Summary
Based on the above analysis, RP Financial concluded that the Peer Group forms a reasonable basis for determining the pro forma market value of the Company. Such general characteristics as asset size, capital position, interest-earning asset composition, funding composition, core earnings measures, loan composition, credit quality and exposure to interest rate risk all tend to support the reasonability of the Peer Group from a financial standpoint. Those areas where differences exist will be addressed in the form of valuation adjustments to the extent necessary.
| RP® Financial, LC. | VALUATION ANALYSIS IV.1 |
IV. VALUATION ANALYSIS
Introduction
This chapter presents the valuation analysis and methodology, prepared pursuant to the regulatory valuation guidelines, and valuation adjustments and assumptions used to determine the estimated pro forma market value of the common stock to be issued in conjunction with the Company’s conversion transaction.
Appraisal Guidelines
The federal regulatory appraisal guidelines required by the FRB, the OCC, the FDIC and state banking agencies specify the pro forma market value methodology for estimating the pro forma market value of a converting thrift. Pursuant to this methodology: (1) a peer group of comparable publicly-traded institutions is selected; (2) a financial and operational comparison of the subject company to the peer group is conducted to discern key differences; and (3) a valuation analysis in which the pro forma market value of the subject company is determined based on the market pricing of the peer group as of the date of valuation, incorporating valuation adjustments for key differences. In addition, the pricing characteristics of recent conversions, both at conversion and in the aftermarket, must be considered.
RP Financial Approach to the Valuation
The valuation analysis herein complies with such regulatory approval guidelines. Accordingly, the valuation incorporates a detailed analysis based on the Peer Group, discussed in Chapter III, which constitutes “fundamental analysis” techniques. Additionally, the valuation incorporates a “technical analysis” of recently completed stock conversions, particularly second-step conversions, including closing pricing and aftermarket trading of such offerings. It should be noted that these valuation analyses cannot possibly fully account for all the market forces which impact trading activity and pricing characteristics of a particular stock on a given day.
The pro forma market value determined herein is a preliminary value for the Company’s to-be-issued stock. Throughout the conversion process, RP Financial will: (1) review changes in the Company’s and Northfield Bancorp’s operations and financial condition; (2) monitor the operations and financial condition of the combined institutions relative to the Peer Group to identify any fundamental changes; (3) monitor the external factors affecting value including, but
| RP® Financial, LC. | VALUATION ANALYSIS IV.2 |
not limited to, local and national economic conditions, interest rates, and the stock market environment, including the market for bank and thrift stocks and CLBK’s stock specifically; and (4) monitor pending conversion offerings, particularly second-step conversions, (including those in the offering phase), both regionally and nationally. If during the second-step conversion process material changes occur, RP Financial will determine if updated valuation reports should be prepared to reflect such changes and their related impact on value, if any. RP Financial will also prepare a final valuation update at the closing of the offering to determine if the prepared valuation analysis and resulting range of value continues to be appropriate.
The appraised value determined herein is based on the current market and operating environment for the Company and for all banks and thrifts. Subsequent changes in the local and national economy, the legislative and regulatory environment, the stock market, interest rates, and other external forces (such as natural disasters or major world events), which may occur from time to time (often with great unpredictability) may materially impact the market value of all bank and thrift stocks, including Columbia Financial’s value or Columbia Financial’s value alone. To the extent a change in factors impacting the Company’s value can be reasonably anticipated and/or quantified, RP Financial has incorporated the estimated impact into the analysis.
Valuation Analysis
A fundamental analysis discussing similarities and differences relative to the Peer Group was presented in Chapter III. The following sections summarize the key differences between the Company and the Peer Group, incorporating the Northfield Bancorp acquisition, and how those differences affect the pro forma valuation. Emphasis is placed on the specific strengths and weaknesses of the Company relative to the Peer Group in such key areas as financial condition, profitability, growth and viability of earnings, asset growth, primary market area, dividends, liquidity of the shares, marketing of the issue, management and the effect of government regulations and/or regulatory reform. We have also considered the market for bank and thrift stocks, in particular new issues, to assess the impact on value of the Company coming to market at this time.
| RP® Financial, LC. | VALUATION ANALYSIS IV.3 |
1. Financial Condition
The financial condition of an institution is an important determinant in pro forma market value because investors typically look to such factors as liquidity, capital, asset composition and quality and funding sources in assessing investment attractiveness. The similarities and differences in the Company’s and the Peer Group’s financial strengths are noted as follows:
| • | Overall A/L Composition. In comparison to the Peer Group, the Company’s interest-earning asset composition showed a slightly lower concentration of loans and a slightly higher concentration of cash and investments. Diversification into higher risk and higher yielding types of loans was slightly higher for the Peer Group, while the Company maintained a slightly higher concentration of 1-4 family loans. Overall, in comparison to the Peer Group, the Company’s interest-earning asset composition provided for a lower yield earned on interest-earning assets. Columbia Financial’s funding composition reflected a lower level of deposits and a higher level of borrowings relative to the comparable Peer Group measures, which translated into a higher cost of funds for the Company. Overall, as a percent of assets, the Company maintained a slightly lower level of interest-earning assets and a slightly higher level of interest-bearing liabilities compared to the Peer Group’s ratios, which resulted in a slightly lower IEA/IBL ratio for the Company. However, after factoring in the impact of the net stock proceeds, the Company’s IEA/IBL ratio will likely exceed the Peer Group’s IEA/IBL ratio. On balance, RP Financial concluded that asset/liability composition was a neutral factor in our adjustment for financial condition. |
| • | Credit Quality. The Company’s ratios for non-performing assets and non-performing loans were lower than the comparable Peer Group ratios. The Company maintained lower levels of loss reserves as a percent of non-performing loans and as a percent of loans. The Company’s lower reserve ratios were in part related to the fair value accounting adjustments applied for the acquisition of Northfield Bancorp. Net loan charge-offs were a larger factor for the Peer Group. Overall, RP Financial concluded that credit quality was a slightly positive factor in our adjustment for financial condition. |
| • | Balance Sheet Liquidity. The Company currently has a higher level of cash and investment securities relative to the Peer Group (20.46% of assets versus 17.53% for the Peer Group). The Bank’s cash and investments ratio reflects the reduction in cash related to the acquisition of Northfield Bancorp. Accordingly after taking into account the pro forma impact of the stock offering, the Company’s cash and investments ratio is expected to increase as the net proceeds will initially be largely deployed into cash and investments. The Company’s future borrowing capacity was considered to be slightly less than the Peer Group’s borrowing capacity, based on the higher level of borrowings that are currently maintained by the Company. Overall, RP Financial concluded that balance sheet liquidity was a slightly positive factor in our adjustment for financial condition. |
| • | Funding Liabilities. The Company’s interest-bearing funding composition reflected a lower concentration of deposits and a higher concentration of borrowings relative to the comparable Peer Group ratios, which translated into a higher cost of funds for the Company. Total interest-bearing liabilities as a percent of assets were slightly higher for the Company. Following the stock offering, the increase in the Company’s capital position will reduce the level of interest-bearing liabilities funding the Company’s assets. Overall, RP Financial concluded that funding liabilities were a neutral factor in our adjustment for financial condition. |
| RP® Financial, LC. | VALUATION ANALYSIS IV.4 |
| • | Capital. The Company currently maintains a slightly lower tangible equity-to-assets ratio than the Peer Group, which reflects the goodwill and intangibles resulting from the acquisition of Northfield Bancorp. However, following the stock offering, Columbia Financial’s pro forma capital position will likely exceed the Peer Group’s equity-to-assets ratio. The increase in the Company’s pro forma capital position will result in greater leverage potential and reduce the level of interest-bearing liabilities utilized to fund assets. At the same time, the Company’s more significant capital surplus will likely result in a lower ROE. On balance, RP Financial concluded that capital strength was a slightly positive factor in our adjustment for financial condition. |
On balance, Columbia Financial’s pro forma balance sheet strength was considered to be slightly more favorable than the Peer Group’s balance sheet strength and, thus, a slight upward adjustment was applied for the Company’s financial condition.
2. Profitability, Growth and Viability of Earnings
Earnings are a key factor in determining pro forma market value, as the level and risk characteristics of an institution’s earnings stream and the prospects and ability to generate future earnings heavily influence the multiple that the investment community will pay for earnings. The major factors considered in the valuation are described below.
| • | Reported Earnings. The Company’s reported earnings were lower than the Peer Group’s on a ROAA basis. The Peer Group’s higher return was realized through higher ratios for net interest income, non-interest operating income and non-operating income and a lower effective tax rate. The Company maintained earnings advantages with respect to lower ratios for operating expenses and credit loss provisions. Reinvestment of stock proceeds into interest-earning assets will serve to increase the Company’s earnings, with the benefit of reinvesting proceeds expected to be somewhat offset by implementation of the stock benefit plans in connection with the second-step offering. Additionally, while the Company’s earnings include the impact of the Northfield Bancorp acquisition, there has been no adjustment to earnings for the potential increase in earnings that may be realized from cost savings and merger synergies that are expected to result from the merger. Overall, the Company’s pro forma reported earnings were considered to be slightly less favorable than the Peer Group’s reported earnings and, thus, RP Financial concluded that this was a slightly negative factor in our adjustment for profitability, growth and viability of earnings. |
| • | Core Earnings. Net interest income, operating expenses, non-interest operating income and credit loss provisions were reviewed in assessing the relative strengths and weaknesses of the Company’s and the Peer Group’s core earnings. The Company maintained a lower net interest income ratio, a lower operating expense ratio and a lower level of non-interest operating income. The Company’s less favorable net interest income ratio and more favorable operating expense ratio translated into a slightly higher expense coverage ratio in comparison to the Peer Group’s ratio. Comparatively, the Company’s efficiency ratio was slightly less favorable than the Peer Group’s efficiency ratio. Credit loss provisions had a slightly larger negative impact on the Peer Group’s earnings. After adjusting the Company’s and the Peer Group’s earnings for net non-operating losses and gains, the Peer |
| RP® Financial, LC. | VALUATION ANALYSIS IV.5 |
| Group’s core earnings remained somewhat higher than the Company’s core earnings on a ROAA basis. Overall, these measures, as well as the expected earnings benefits the Company should realize from the redeployment of stock proceeds into interest-earning assets, potential cost savings resulting from the merger and leveraging of post-conversion capital, which will be somewhat negated by expenses associated with the stock benefit plans, indicate that the Company’s pro forma core earnings will remain slightly less favorable than the Peer Group’s core earnings. Therefore, RP Financial concluded that this was a slightly negative factor in our adjustment for profitability, growth and viability of earnings. |
| • | Interest Rate Risk. Quarterly changes in the Company’s and the Peer Group’s net interest income to average assets ratios indicated a similar degree of volatility was associated with the Company’s and the Peer Group’s respective net interest margins. Other measures of interest rate risk, such as tangible equity/assets, IEA/IBL and non-interest earning assets/assets ratios were slightly more favorable for the Peer Group. On a pro forma basis, the infusion of stock proceeds can be expected to provide the Company with tangible equity-to-assets and IEA/IBL ratios that will exceed the Peer Group’s ratios, as well as enhance the stability of the Company’s net interest margin through the reinvestment of stock proceeds into interest-earning assets. On balance, RP Financial concluded that interest rate risk was a neutral factor in our adjustment for profitability, growth and viability of earnings. |
| • | Credit Risk. Credit loss provisions were a slightly larger factor in the Peer Group’s earnings (0.17% of average assets versus 0.11% of average assets for the Company). In terms of future exposure to credit quality related losses, lending diversification into higher risk types of loans was slightly greater for the Peer Group. The Company’s credit quality measures generally implied a slightly lower degree of credit risk exposure relative to the comparable credit quality measures indicated for the Peer Group. The fair value adjustments to Northfield Bancorp’s loan portfolio further enhances the credit risk profile of the Company. Overall, RP Financial concluded that credit risk was a slightly positive factor in our adjustment for profitability, growth and viability of earnings. |
| • | Earnings Growth Potential. Several factors were considered in assessing earnings growth potential. First, the Peer Group maintained a higher interest rate spread than the Peer Group, which would tend to facilitate continuation of a higher net interest margin for the Peer Group going forward based on the current prevailing interest rate environment. The reinvestment of the net proceeds will add to the Company’s net interest income, which will be somewhat negated by expenses associated with the new stock benefit plans. Second, the infusion of stock proceeds will provide the Company with greater growth potential through leverage than currently maintained by the Peer Group. Third, the Peer Group’s higher ratio of non-interest operating income and the Company’s lower operating expense ratio were viewed as respective advantages for the Peer Group and the Company to sustain earnings growth during periods when net interest margins come under pressure as the result of adverse changes in interest rates. Lastly, potential earnings growth that may be facilitated by the acquisition of Northfield Bancorp, including cost savings and merger synergies, was considered a positive for the Company. Overall, earnings growth potential was considered to be a slightly positive factor in our adjustment for profitability, growth and viability of earnings. |
| RP® Financial, LC. | VALUATION ANALYSIS IV.6 |
| • | Return on Equity. Currently, the Company’s core ROE is lower than the Peer Group’s core ROE. As the result of the increase in capital that will be realized from the infusion of net stock proceeds into the Company’s equity, the Company’s pro forma return equity on a core earnings basis will remain lower than the Peer Group’s core ROE. Accordingly, this was a slightly negative factor in the adjustment for profitability, growth and viability of earnings. |
On balance, Columbia Financial’s pro forma earnings strength was considered to be less favorable than the Peer Group’s earnings strength and, thus, a slight downward adjustment was applied for profitability, growth and viability of earnings.
3. Asset Growth
As the result of the acquisition-related growth, Columbia Financial’s asset growth was significantly stronger than the Peer Group’s asset growth. The Company’s organic asset growth was less than the Peer Group’s asset growth, which included a stronger rate of loan growth for the Peer Group. On a pro forma basis, the Company’s tangible equity-to-assets ratio will exceed the Peer Group’s tangible equity-to-assets ratio, indicating greater leverage capacity for the Company. On balance, a slight upward adjustment was applied for asset growth.
4. Primary Market Area
The general condition of an institution’s market area has an impact on value, as future success is in part dependent upon opportunities for profitable activities in the local market served. Markets served by Columbia Financial encompass the state of New Jersey, with branch locations concentrated in the suburbs surrounding the New York City and Philadelphia metropolitan areas. The acquisition of Northfield Bancorp will expand the Company’s branch network into New York City and increase its market presence in New Jersey. Operating in densely populated markets provide the Company with growth opportunities, but such growth must be achieved in a highly competitive market environment. The Company competes against significantly larger institutions that provide a larger array of services and have significantly larger branch networks than maintained by Columbia Financial.
The Peer Group companies generally operate in markets with smaller populations in comparison to Bergen County. Population growth for the primary market area counties served by the Peer Group companies reflected a range of growth rates, but, overall, population growth rates in the markets served by the Peer Group companies were slightly less than Bergen County’s recent historical and projected population growth rates. Bergen County has a higher
| RP® Financial, LC. | VALUATION ANALYSIS IV.7 |
per capita income compared to the Peer Group’s average per capita income and, on average, the Peer Group’s primary market area counties were similarly affluent markets within their respective states compared to Bergen County’s per capita income as a percent of New Jersey’s per capita income (113.7% for the Peer Group versus 115.4% for Bergen County). The average and median deposit market shares maintained by the Peer Group companies were well above the Company’s market share of deposits in Bergen County. Overall, the degree of competition faced by the Peer Group companies was viewed as less than the Company’s competitive environment in Bergen County, while the growth potential in the markets served by the Peer Group companies was for the most part viewed to be slightly less favorable than provided by the Company’s primary market area. Summary demographic and deposit market share data for the Company and the Peer Group companies is provided in Exhibit III-4. As shown in Table 4.1, the average unemployment rate for the primary market area states served by the Peer Group companies was slightly above the unemployment rate reflected for New Jersey. On balance, we concluded that no adjustment was appropriate for the Company’s market area.
Table 4.1
Market Area Unemployment Rates
Columbia Financial, Inc. and the Peer Group Companies(1)
| State |
November 2025 Unemployment |
|||||
| Columbia Financial, Inc. – NJ |
New Jersey | 4.3 | % | |||
| Peer Group Average |
4.4 | % | ||||
| CNB Financial Corporation – PA |
Pennsylvania | 3.8 | % | |||
| ConnectOne Bancorp, Inc. - NJ |
New Jersey | 4.3 | ||||
| Dime Community Bancshares, Inc. – NY |
New York | 4.8 | ||||
| First Commonwealth Fin. Corp. – PA |
Pennsylvania | 3.8 | ||||
| Kearny Financial Corp.– NJ |
New Jersey | 4.3 | ||||
| NBT Bancorp, Inc.– NY |
New York | 4.8 | ||||
| Peapack-Gladstone Fin. Corp. – NJ |
New Jersey | 4.3 | ||||
| Provident Financial Services, Inc.– NJ |
New Jersey | 4.3 | ||||
| S&T Bancorp, Inc. – PA |
Pennsylvania | 3.8 | ||||
| Tompkins Financial Corporation – NY |
New York | 4.8 | ||||
| Univest Financial Corporation – PA |
Pennsylvania | 3.8 | ||||
| WSFS Financial Corporation – DE |
Delaware | 5.4 | ||||
| (1) | Unemployment rates are not seasonally adjusted. |
Source: S&P Global Market Intelligence.
| RP® Financial, LC. | VALUATION ANALYSIS IV.8 |
5. Dividends
Community Financial has indicated its intention to pay a cash dividend following the second-step conversion. Initially, the Company expects to pay quarterly dividends of $0.05 per share or $0.20 per share annually, which equals a yield of 2.0% based on a price of $10.00 per share. The initial dividend and future declarations of dividends by the Board of Directors will depend upon a number of factors, including investment opportunities, growth objectives, financial condition, profitability, tax considerations, minimum capital requirements, regulatory limitations, stock market characteristics and general economic conditions.
All twelve of the Peer Group companies pay regular cash dividends, with implied dividend yields ranging from 0.61% to 5.45%. The average dividend yield on the stocks of the Peer Group institutions was 2.89% as of February 2, 2026. Comparatively, as of February 2, 2026, the average dividend yield on the stocks of all publicly-traded banks and thrifts equaled 2.67%. The Company’s payout ratio at the midpoint of 57.14% was above the Peer Group’s average payout ratio of 36.44%
Overall, following the second-step conversion, the Company’s capacity to pay dividends is viewed to be comparable to the Peer Group’s capacity to pay dividends based on pro forma earnings and capitalization. On balance, we concluded that no adjustment was warranted for this factor.
6. Liquidity of the Shares
The Peer Group is by definition composed of companies that are traded in the public markets. Nine of the Peer Group companies trade on the NASDAQGS and three trade on the NYSE or NYSEAM. Typically, the number of shares outstanding and market capitalization provides an indication of how much liquidity there will be in a particular stock. The market capitalization of the Peer Group companies ranged from $507.1 million to $3.6 billion as of February 2, 2026, with average and median market values of $1.6 billion and $1.5 billion, respectively. The shares issued and outstanding of the Peer Group companies ranged from 14.4 million to 130.6 million, with average and median shares outstanding equal to 52.5 million and 47.1 million, respectively. The Company’s second-step stock offering is expected to provide for a pro forma market value that will be in the upper half of the Peer Group’s range of market values and above the Peer Group’s range of shares outstanding. Following the second-step conversion, the Company’s stock will continue to be traded on the NASDAQGS. Overall, we anticipate that the Company’s stock will have a fairly comparable trading market as the Peer Group companies on average and, therefore, concluded no adjustment was necessary for this factor.
| RP® Financial, LC. | VALUATION ANALYSIS IV.9 |
7. Marketing of the Issue
We believe that four separate markets exist for thrift stocks, including those coming to market such as Columbia Financial: (A) the after-market for public companies, in which trading activity is regular and investment decisions are made based upon financial condition, earnings, capital, ROE, dividends and future prospects; (B) the new issue market in which converting thrifts are evaluated on the basis of the same factors, but on a pro forma basis without the benefit of prior operations as a fully-converted company; (C) the acquisition market for thrift and bank franchises based in New Jersey; and (D) the market for the public stock of CLBK. All of these markets were considered in the valuation of the Company’s to-be-issued stock.
A. The Public Market
The value of publicly-traded bank and thrift stocks is easily measurable, and is tracked by most investment houses and related organizations. Exhibit IV-1 provides pricing and financial data on all publicly-traded banks and thrifts. In general, bank and thrift stock values react to market stimuli such as interest rates, inflation, perceived industry health, projected rates of economic growth, regulatory issues and stock market conditions in general. Exhibit IV-2 displays historical stock market trends for various indices and includes historical stock price index values for publicly-traded thrifts and commercial banks. Exhibit IV-3 displays various stock price indices as of February 2, 2026.
In terms of assessing general stock market conditions, the performance of the overall stock market has been mixed in recent quarters. U.S. stocks plunged at the start of the second quarter of 2025, as the new tariffs unveiled by President Trump were more severe than expected and, in turn, ignited an escalating trade war with China. On April 9th, major U.S. stock indexes staged a historic rally after President Trump paused steep tariffs on most countries and signaled a willingness to negotiate on trade. Following the one-day rally, volatility prevailed in the broader stock market going into the second half of April amid uncertainty over U.S. trade policy and mounting tensions between the Trump administration and the Federal Reserve. A broad stock market selloff was followed by stocks surging higher in the last week of April, as stocks were buoyed by President Trump’s softer stance on the trade war with China and his
| RP® Financial, LC. | VALUATION ANALYSIS IV.10 |
statement that he didn’t plan to replace the Federal Reserve Chairman. April’s employment report showing better-than-expected job growth and more signs of a potential thaw between Washington and China extended the multi-day climb in the stock market at the beginning of May, with the Dow Jones Industrial Average (“DJIA”) and S&P 500 posting gains for nine consecutive sessions before declining on May 5th. A de-escalation in the U.S.-China trade war powered a stock market surge heading into mid-May 2025, as the U.S. and China agreed to slash tariffs for 90 days pending more negotiations. Stocks gyrated in the second half of May, based on varied reports regarding the progress of tariff negotiations with China and Europe. For the month of May overall, the broader stock market posted its best month since late-2023 with major U.S. stock indexes closing slightly above where they were at the beginning of 2025. Employment data showing better-than-expected job growth in May and signs of progress in the trade talks between the U.S. and China spurred a positive trend for stocks during the first 10 days of June. The outbreak of attacks between Israel and Iraq provided for a choppy market in mid-June, based on day-to-day fluctuations in investor sentiment on how quickly the conflict would de-escalate. Heading into the close of the second quarter, oil prices retreated and stocks rallied after Iran’s retaliation against the U.S. avoided striking critical infrastructure and a cease-fire between Israel and Iran appeared to take hold. Fueled by robust corporate earnings and solid economic data, a volatile second quarter ended with the S&P 500 and NASDAQ closing at fresh highs.
Stocks traded unevenly at the start of the third quarter of 2025, as trade tensions moved to the forefront with President Trump setting an August 1 deadline for targeted nations to avoid the U.S. imposing reciprocal tariffs. NASDAQ closed at a record high in the second week of July, which was facilitated by Nividia becoming the first company to reach a market value of $4 trillion. New tariff threats and June’s CPI showing an acceleration of inflation pressured stocks lower in mid-July. The S&P 500 and the NASDAQ closed at record highs going into the second half of July, as upbeat earnings reports from some major companies lifted investor optimism that corporate earnings could weather uncertainty in the market regarding U.S. tariff negotiations. A U.S.-Japan tariff deal and signs of progress with other trade partners lifted stocks heading into the final week of July, with the S&P 500 and NASDAQ extending a run of record high closes into the last week of July. Stocks ended July closing lower and started August with a sharp one-day selloff, as investors reacted to July’s employment report showing lower-than-expected job growth and the signing of an executive order that would raise tariffs on many nations beginning on August 7th. The one-day selloff was followed by stocks rebounding
| RP® Financial, LC. | VALUATION ANALYSIS IV.11 |
to start the first full week of Augst, as worries about the economy gave way to growing optimism that the Federal Reserve would cut rates in September. A mid-August 2025 stock market rally was spurred by favorable inflation data, which raised investor optimism that the Federal Reserve would cut rates in September. After trading in a mixed range heading into the second half of August, stocks surged higher in a one-day rally as the Federal Reserve Chairman’s speech on the economy raised hopes of a rate cut in September. An upward revision to second quarter GDP growth served as a catalyst for the DJIA and S&P 500 closing at record highs in late-August. After posting gains for the month of August, inflation concerns and a weak employment report for August pressured major U.S. stock indexes lower at the start of September. Stocks rallied heading into mid-September, with all three of the major U.S. stock indexes closing at record highs on heightened expectations that the Federal Reserve would move to cut interest rates in September. After the Federal Reserve cut rates by a quarter point as expected, the positive trend in the broader stock market continued going into the second half of September. Tech shares led major U.S. stock indexes lower for three consecutive sessions in late-September, which was followed by major U.S. stock indexes trading higher in the last few trading sessions of the third quarter.
Major U.S. stock indexes edged higher to close at record highs at the beginning of the fourth quarter of 2025, while renewal of a trade war between the U.S. and China provided for choppy stock market conditions going into mid-October. Strong corporate earnings reports, easing trade tensions with China and encouraging inflation data propelled major U.S. stock indexes to record high closes in the second half of October. Stocks finished mixed after the Federal Reserve cut interest rates on October 29th, while casting doubt on expectations of future rate cuts. A slide in big tech shares led the broader stock market lower in the first week of November, as investors gave consideration to the rally in AI shares, the uncertain outlook for future rate cuts by the Federal Reserve and weak economic data. As Congress moved closer to ending the government shutdown, stocks advanced with the DJIA closing above 48000 on November 12th. The upturn in stocks was followed by a selloff, as concerns about a flood of delayed economic data, the prospect of slowing interest rate cuts and overvalued tech companies pressured stocks lower going into the second half of November. Growing optimism that the Federal Reserve would cut rates in December fueled a stock market rebound in the final week of November. Stocks dipped lower at start of December in reaction to the Bank of Japan’s governor hinting at a potential rate increase, which was followed by stocks trading mixed ahead of the Federal Reserve’s December meeting. The Federal Reserve’s quarter-point rate cut on
| oRP® Financial, LC. | VALUATION ANALYSIS IV.12 |
December 10th sparked a stock market rally, with the DJIA closing at a record high. Following the rate-cut rally, stocks retreated through mid-December as investors took into consideration an increase in the November unemployment rate and the potential for AI growth not meeting expectations. November’s CPI reading showing lower-than-expected inflation helped stocks to reverse course and trade higher going into the second half of December. Stronger-than-expected third quarter GDP growth sustained the positive trend for the broader stock market going into the last week of 2025, with the S&P 500 closing at a record high. Stocks retreated in the final trading days of 2025, which was led by a decline in tech shares on yearend profit taking. Overall, the DJIA closed at 48063.29 on the last day of trading in 2025, an increase of 13.0% for 2025, while the S&P 500 and the NASDAQ Composite ended 2025 with respective increases of 16.4% and 20.4%.
Broad-based gains pushed the DJIA and S&P 500 to record highs in the first few days of trading in 2026, with energy and bank shares being among the strongest performing sectors. Expectations of an improving economy in 2026 helped to sustain the upward trend in stocks going into mid-January, which was followed by a heightened degree of market volatility in the second half of January. Stocks plunged on January 20th after President Trump stepped up his campaign to take over Greenland and threatened new restrictions on trade with Europe. The one-day selloff was followed by stocks rallying on news that Presdint Trump and NATO had agreed on a framework for a deal on Greenland that would take away the need for new tariffs on Europe. A sharp selloff in gold and silver futures weighed on the broader stock market at the end of January, which was followed by stocks advancing at the beginning of February on signs that the U.S. economy was gaining momentum. On February 2, 2026, the DJIA closed at 49407.66, an increase of 11.2% from one year ago and an increase of 2.8% year-to-date, and the NASDAQ Composite closed at 23592.11, an increase of 21.7% from one year ago and an increase of 1.5% year-to-date. The S&P 500 Index closed at 6976.44 on February 2, 2026, an increase of 16.4% from one year ago and an increase of 1.9% year-to-date.
The market for financial shares has also generally experienced an upward trend in recent quarters. Concerns that President Trump’s new tariff plan would result in an economic slowdown served as the basis for bank shares selling off at the beginning of the second quarter of 2025, with the large banks experiencing more significant declines. Bank shares participated in the broader stock market rally on April 9th and then gave back some of those gains heading into mid-April at the start of the second quarter earnings season. Easing trade tensions and first quarter earnings that generally met expectations provided for a generally positive trend in bank
| RP® Financial, LC. | VALUATION ANALYSIS IV.13 |
shares through the second half of April, with the favorable employment report for April helping to extend the advance in bank stocks into early-May. Positive developments in the U.S.-China trade war translated into bank stocks advancing along with the broader stock market heading into mid-May 2025. The mid-May rally was followed by a pullback in interest rate sensitive issues, as a weak auction for 20-year Treasury bonds exacerbated worries about the rising U.S. debt. For the balance of May and into-early June, banks shares edged higher and continued to advance going into the second week of June in consideration of May’s employment report showing favorable job growth and signs that the U.S. and China were making progress in their trade negotiations. The escalating conflict between Israel and Iran translated into bank shares retreating slightly in mid-June, which was followed by bank shares rebounding in late-June as markets were calmed by the cease-fire between Israel and Iran.
The positive trend in bank shares continued at the start of the third quarter of 2025, which was followed by a slight pullback in bank shares ahead of the start of the second quarter earnings season on news that inflation accelerated in June. Bank shares edged higher going into the second half of July, as second quarter earnings posted by some of the big banks were viewed as generally favorable. Announcements of some tariff deals getting done contributed to bank shares trading higher heading into late-July, which was followed by bank shares retreating at the start of August pursuant to the employment report for July triggering concerns that the U.S. economy was beginning to weaken. Banks shares edged higher following the August 1st selloff, as investors weighed the growing likelihood that the Federal Reserve would cut interest rates in September against more signs that the economy was cooling. Inflation data that boosted investor confidence for a Federal Reserve rate cut lifted bank shares in mid-August. Bank stocks participated in the broader stock market rally that was triggered by the Federal Reserve Chairman’s August 22nd speech on the economy, which raised hopes of a rate cut in September. The positive trend in bank shares continued for the balance of August, which was followed by bank stocks edging lower at the start of September as higher interest rates and the disappointing jobs report for August weighed on economically sensitive stocks. As investors became more confident that the Federal Reserve would cut interest rates, bank shares traded up slightly ahead of the Federal Reserve’s mid-September meeting. The Federal Reserve’s as expected quarter-point rate cut and penciling in two more rate cuts for 2025 boosted bank shares going into the second half of September and then for the balance of the third quarter bank stocks traded in a narrow range.
| RP® Financial, LC. | VALUATION ANALYSIS IV.14 |
Profit taking and an uncertain outlook for the economy translated into bank stocks edging lower at the start of the fourth quarter of 2025. A flare-up in the U.S.-China trade war furthered the downturn in bank shares going into the mid-October with the onset of the third quarter earnings season. Credit loss concerns triggered by loan losses recorded by some regional banks and the rekindling of the U.S.-China trade war pressured bank stocks lower going into the second half of October. Bank stocks traded higher along with the broader stock market in late-October and then closed lower on October 29th as the Federal Reserve lowered rates as expected but tempered expectations of further rate cuts. The slight pullback was followed by bank shares edging higher in the first week of November. After trading higher on signs that Congress was closing in on a deal to reopen the government, bank shares retreated in conjunction with the broader market through mid-November. The growing likelihood of a December Federal Reserve rate-cut served as the basis for bank shares trading higher to close out November and into early-December. JPMorgan’s forecast of higher than forecasted expenses for 2026 pulled bank shares lower ahead of the Federal Reserve’s rate decision, which was followed by bank shares trading up on news of the December 10th 25 basis point rate-cut. Bank shares traded in a narrow range through the mid-December release of November’s employment report, which showed an uptick in the unemployment rate. Stronger-than-expected third quarter GDP growth contributed to bank shares edging higher in the second half of December. For 2025 overall, the S&P U.S. BMI Banks Index closed at 254.1 on the last day of trading in 2025, an increase of 25.1% for 2025.
Bank stocks participated in the broader stock market rally in the first week of trading for 2026, which was followed by a mid-January downturn in bank shares as JPMorgan’s fourth quarter earnings report left investors disappointed. As fourth quarter bank earnings generally met expectations, bank shares traded in a narrow range for the balance of January. A strong manufacturing reading for January contributed to bank stocks advancing at the start of February. On February 2, 2026, the S&P U.S. BMI Banks Index closed at 255.8, an increase of 16.0% from one year ago and an increase of 0.7% year-to-date.
B. The New Issue Market
In addition to thrift stock market conditions in general, the new issue market for converting thrifts is also an important consideration in determining the Company’s pro forma market value. The new issue market is separate and distinct from the market for seasoned thrift stocks in that the pricing ratios for converting issues are computed on a pro forma basis,
| RP® Financial, LC. | VALUATION ANALYSIS IV.15 |
specifically: (1) the numerator and denominator are both impacted by the conversion offering amount, unlike existing stock issues in which price change affects only the numerator; and (2) the pro forma pricing ratio incorporates assumptions regarding source and use of proceeds, effective tax rates, stock plan purchases, etc. which impact pro forma financials, whereas pricing for existing issues are based on reported financials. The distinction between pricing of converting and existing issues is perhaps no clearer than in the case of the price/book (“P/B”) ratio in that the P/B ratio of a converting thrift will typically result in a discount to book value whereas in the current market for existing thrifts the P/B ratio may reflect a premium to book value. Therefore, it is appropriate to also consider the market for new issues, both at the time of the conversion and in the aftermarket.
As shown in Table 4.2, three standard conversions, three second-step conversions and one mutual company offering have been completed during the past twelve months. The second-step conversion offerings are considered to be more relevant for Columbia Financial’s pro forma pricing. The average closing pro forma price/tangible book ratio of the three recent second-step conversion offerings equaled 61.0%. On average, the three recent second-step conversion offerings had price appreciation of 8.0% after their first week of trading and, as of February 2, 2026, the three recent second-step conversion offerings showed an average price increase of 30.3% from their respective IPO prices.
The comparability of the recent second-step conversion offerings to Columbia Financial’s second-step offering is somewhat limited by the significantly larger size of the Company’s offering, which is expected to attract additional investor interest relative to the investor community that participates in the smaller second-step offerings.
C. The Acquisition Market
Also considered in the valuation was the potential impact on Columbia Financial’s stock price of recently completed and pending acquisitions of other thrift and bank institutions operating in New Jersey. As shown in Exhibit IV-4, there were five acquisitions of New Jersey based bank and savings institutions completed from the beginning of 2022 through February 2, 2026 and there are currently three acquisitions pending for a New Jersey based bank or savings institution including Columbia Financial’s pending acquisition of Northfield Bancorp. The recent acquisition activity involving New Jersey bank and savings institutions may imply a certain degree of acquisition speculation for the Company’s stock. To the extent that acquisition speculation may impact the Company’s offering, we have largely taken this into
| RP® Financial, LC. | VALUATION ANALYSIS IV.16 |
| Table 4.2 | ||||||||||||||||||||||||||||||||||||||||||||||||||||||||||||||||||||||||||||||||||||||||||||||||||||||||||||||||||||||||||||||||
| Pricing Characteristics and After-Market Trends | ||||||||||||||||||||||||||||||||||||||||||||||||||||||||||||||||||||||||||||||||||||||||||||||||||||||||||||||||||||||||||||||||
| Conversions Completed Twelve Months Ended February 2, 2026 | ||||||||||||||||||||||||||||||||||||||||||||||||||||||||||||||||||||||||||||||||||||||||||||||||||||||||||||||||||||||||||||||||
| Institutional Information | Pre-Conversion Data | Offering Information | Contribution to Char. Found. |
Insider Purchases | Pro Forma Data | Post-IPO Pricing Trends | ||||||||||||||||||||||||||||||||||||||||||||||||||||||||||||||||||||||||||||||||||||||||||||||||||||||||||||||||||||||||||
| Financial Info. | Asset Quality |
|
% Off Incl. Fdn.+Merger Shares | Pricing Ratios(2)(5) | Financial Charac. | Closing Price: | ||||||||||||||||||||||||||||||||||||||||||||||||||||||||||||||||||||||||||||||||||||||||||||||||||||||||||||||||||||||||||
| Excluding Foundation | % of | Benefit Plans | Initial | First | After | After | ||||||||||||||||||||||||||||||||||||||||||||||||||||||||||||||||||||||||||||||||||||||||||||||||||||||||||||||||||||||||||
| Institution |
Conversion Date |
Ticker | Assets | Equity/ Assets |
NPAs/ Assets |
Res. Cov. |
Gross Proc. |
% Offer |
% of Mid. |
Exp./ Proc. |
Form | Public Off. Inc. Fdn. |
ESOP | Recog Plans |
Stk Option |
Mgmt.& Dirs. |
Div. Yield |
P/TB | Core P/E |
P/A | Core ROA |
TE/ A |
Core ROE |
IPO Price |
Trading Day |
% Chg |
First Week(3) |
% Chg |
First Month(4) |
% Chg |
Thru 2/2/2026 |
% Chg |
||||||||||||||||||||||||||||||||||||||||||||||||||||||||||||||||||||||||||||||||||||||||||||||||
| ($Mil) | (%) | (%) | (%) | ($Mil.) | (%) | (%) | (%) | (%) | (%) | (%) | (%) | (%)(1) | (%) | (%) | (x) | (%) | (%) | (%) | (%) | ($) | ($) | (%) | ($) | (%) | ($) | (%) | ($) | (%) | ||||||||||||||||||||||||||||||||||||||||||||||||||||||||||||||||||||||||||||||||||||||||||||||||||||
| Standard Conversions |
||||||||||||||||||||||||||||||||||||||||||||||||||||||||||||||||||||||||||||||||||||||||||||||||||||||||||||||||||||||||||||||||
| Hoyne Bancorp, Inc. - IL* |
12/4/25 | |
HYNE- NASDAQ |
$ | 453 | 19.60 | % | 0.20 | % | 269 | % | $ | 79.4 | 100 | % | 132 | % | 3.4 | % | C/S | $ | 250/2.00 | % | 8.0 | % | 4.0 | % | 10.0 | % | 3.0 | % | 0.00 | % | 52.0 | % | NM | 15.6 | % | 0.0 | % | 30.0 | % | -0.1 | % | $ | 10.00 | $ | 14.00 | 40.0 | % | $ | 13.75 | 37.5 | % | $ | 14.19 | 41.9 | % | $ | 14.47 | 44.7 | % | ||||||||||||||||||||||||||||||||||||||||||||||||||||||||||||||||||
| Security Midwest Bancorp, Inc., IL |
8/1/25 | |
SBMW- OTCQB |
$ | 218 | 6.41 | % | 0.40 | % | 129 | % | $ | 8.9 | 100 | % | 89 | % | 15.2 | % | N.A. | N.A. | 7.0 | % | 3.0 | % | 10.0 | % | 13.5 | % | 0.00 | % | 45.4 | % | 9.0x | 4.0 | % | 0.4 | % | 8.8 | % | 5.1 | % | $ | 10.00 | $ | 11.40 | 14.0 | % | $ | 11.12 | 11.2 | % | $ | 12.30 | 23.0 | % | $ | 15.25 | 52.5 | % | ||||||||||||||||||||||||||||||||||||||||||||||||||||||||||||||||||||
| Avidia Bancorp, Inc., MA* |
8/1/25 | |
AVBC- NYSE |
$ | 2,707 | 6.87 | % | 0.44 | % | 184 | % | $ | 191.8 | 100 | % | 132 | % | 3.0 | % | C/S | $ | 1,000/4.48 | % | 8.0 | % | 4.0 | % | 10.0 | % | 3.4 | % | 0.00 | % | 59.5 | % | 14.2x | 7.0 | % | 0.5 | % | 11.8 | % | 4.1 | % | $ | 10.00 | $ | 14.64 | 46.4 | % | $ | 14.58 | 45.8 | % | $ | 15.47 | 54.7 | % | $ | 18.73 | 87.3 | % | ||||||||||||||||||||||||||||||||||||||||||||||||||||||||||||||||||
| |
Averages - Standard Conversions: |
|
$ | 1,126 | 10.96 | % | 0.35 | % | 194 | % | $ | 93.4 | 100 | % | 118 | % | 7.2 | % | N.A. | N.A. | 7.7 | % | 3.7 | % | 10.0 | % | 6.6 | % | 0.00 | % | 52.3 | % | 11.6x | 8.9 | % | 0.3 | % | 16.9 | % | 3.0 | % | $ | 10.00 | $ | 13.35 | 33.5 | % | $ | 13.15 | 31.5 | % | $ | 13.99 | 39.9 | % | $ | 16.15 | 61.5 | % | |||||||||||||||||||||||||||||||||||||||||||||||||||||||||||||||||||||
| |
Medians - Standard Conversions: |
|
$ | 453 | 6.87 | % | 0.40 | % | 184 | % | $ | 79.4 | 100 | % | 132 | % | 3.4 | % | N.A. | N.A. | 8.0 | % | 4.0 | % | 10.0 | % | 3.4 | % | 0.00 | % | 52.0 | % | 11.6x | 7.0 | % | 0.4 | % | 11.8 | % | 4.1 | % | $ | 10.00 | $ | 14.00 | 40.0 | % | $ | 13.75 | 37.5 | % | $ | 14.19 | 41.9 | % | $ | 15.25 | 52.5 | % | |||||||||||||||||||||||||||||||||||||||||||||||||||||||||||||||||||||
| Second Step Conversions |
|
|||||||||||||||||||||||||||||||||||||||||||||||||||||||||||||||||||||||||||||||||||||||||||||||||||||||||||||||||||||||||||||||
| Seneca Bancorp, Inc., NY* |
10/16/25 | |
SNNF- OTCQX |
$ | 299 | 7.94 | % | 0.31 | % | 186 | % | $ | 10.4 | 58 | % | 100 | % | 15.1 | % | N.A. | N.A. | 8.0 | % | 4.0 | % | 10.0 | % | 9.6 | % | 0.00 | % | 58.6 | % | 20.8x | 5.8 | % | 0.3 | % | 16.9 | % | 2.8 | % | $ | 10.00 | $ | 10.22 | 2.2 | % | $ | 10.10 | 1.0 | % | $ | 9.75 | -2.5 | % | $ | 10.65 | 6.5 | % | ||||||||||||||||||||||||||||||||||||||||||||||||||||||||||||||||||||
| Lake Shore Bancorp, Inc., NY* |
7/21/25 | |
LSBK- NASDAQ |
$ | 689 | 13.16 | % | 0.66 | % | 114 | % | $ | 49.5 | 63 | % | 99 | % | 4.4 | % | N.A. | N.A. | 8.0 | % | 4.0 | % | 10.0 | % | 5.3 | % | 0.00 | % | 59.2 | % | 14.4x | 10.7 | % | 0.7 | % | 18.1 | % | 4.1 | % | $ | 10.00 | $ | 11.95 | 19.5 | % | $ | 12.11 | 21.1 | % | $ | 12.33 | 23.3 | % | $ | 15.50 | 55.0 | % | ||||||||||||||||||||||||||||||||||||||||||||||||||||||||||||||||||||
| Marathon Bancorp, Inc., WI* |
4/22/25 | |
MBBC- NASDAQ |
$ | 218 | 14.58 | % | 0.66 | % | 124 | % | $ | 16.9 | 58 | % | 103 | % | 9.5 | % | N.A. | N.A. | 8.0 | % | 4.0 | % | 10.0 | % | 1.9 | % | 0.00 | % | 65.3 | % | 42.8x | 12.7 | % | 0.3 | % | 19.5 | % | 1.5 | % | $ | 10.00 | $ | 9.95 | -0.5 | % | $ | 10.20 | 2.0 | % | $ | 10.02 | 0.2 | % | $ | 12.94 | 29.4 | % | ||||||||||||||||||||||||||||||||||||||||||||||||||||||||||||||||||||
| |
Averages - Second |
|
$ | 402 | 11.89 | % | 0.54 | % | 141 | % | $ | 25.6 | 60 | % | 101 | % | 9.7 | % | N.A. | N.A. | 8.0 | % | 4.0 | % | 10.0 | % | 5.6 | % | 0.00 | % | 61.0 | % | 26.0x | 9.7 | % | 0.4 | % | 18.2 | % | 2.8 | % | $ | 10.00 | $ | 10.71 | 7.1 | % | $ | 10.80 | 8.0 | % | $ | 10.70 | 7.0 | % | $ | 13.03 | 30.3 | % | |||||||||||||||||||||||||||||||||||||||||||||||||||||||||||||||||||||
| |
Medians - Second Step Conversions: |
|
$ | 299 | 13.16 | % | 0.66 | % | 124 | % | $ | 16.9 | 58 | % | 100 | % | 9.5 | % | N.A. | N.A. | 8.0 | % | 4.0 | % | 10.0 | % | 5.3 | % | 0.00 | % | 59.2 | % | 20.8x | 10.7 | % | 0.3 | % | 18.1 | % | 2.8 | % | $ | 10.00 | $ | 10.22 | 2.2 | % | $ | 10.20 | 2.0 | % | $ | 10.02 | 0.2 | % | $ | 12.94 | 29.4 | % | |||||||||||||||||||||||||||||||||||||||||||||||||||||||||||||||||||||
| Mutual Holding Companies |
||||||||||||||||||||||||||||||||||||||||||||||||||||||||||||||||||||||||||||||||||||||||||||||||||||||||||||||||||||||||||||||||
| Winchester Bancorp, Inc., MA* |
5/2/25 | |
WSBK- NASDAQ |
$ | 894 | 8.98 | % | 0.22 | % | 188 | % | $ | 40.0 | 43 | % | 130 | % | 4.5 | % | C/S | $ | 400/4.65 | % | 8.0 | % | 4.0 | % | 10.0 | % | 13.6 | % | 0.00 | % | 59.0 | % | NM | 9.6 | % | 0.0 | % | 12.2 | % | -0.2 | % | $ | 10.00 | $ | 9.30 | -7.0 | % | $ | 9.33 | -6.7 | % | $ | 9.35 | -6.5 | % | $ | 11.40 | 14.0 | % | ||||||||||||||||||||||||||||||||||||||||||||||||||||||||||||||||||
| |
Averages - MHC Conversions: |
|
$ | 894 | 8.98 | % | 0.22 | % | 188 | % | $ | 40.0 | 43 | % | 130 | % | 4.5 | % | N.A. | N.A. | 8.0 | % | 4.0 | % | 10.0 | % | 13.6 | % | 0.00 | % | 59.0 | % | NM | 9.6 | % | 0.0 | % | 12.2 | % | -0.2 | % | $ | 10.00 | $ | 9.30 | -7.0 | % | $ | 9.33 | -6.7 | % | $ | 9.35 | -6.5 | % | $ | 11.40 | 14.0 | % | |||||||||||||||||||||||||||||||||||||||||||||||||||||||||||||||||||||
| |
Medians - MHC Conversions: |
|
$ | 894 | 8.98 | % | 0.22 | % | 188 | % | $ | 40.0 | 43 | % | 130 | % | 4.5 | % | N.A. | N.A. | 8.0 | % | 4.0 | % | 10.0 | % | 13.6 | % | 0.00 | % | 59.0 | % | NM | 9.6 | % | 0.0 | % | 12.2 | % | -0.2 | % | $ | 10.00 | $ | 9.30 | -7.0 | % | $ | 9.33 | -6.7 | % | $ | 9.35 | -6.5 | % | $ | 11.40 | 14.0 | % | |||||||||||||||||||||||||||||||||||||||||||||||||||||||||||||||||||||
| |
Averages - All Conversions: |
|
$ | 783 | 11.08 | % | 0.41 | % | 171 | % | $ | 56.7 | 75 | % | 112 | % | 7.9 | % | N.A. | N.A. | 7.9 | % | 3.9 | % | 10.0 | % | 7.2 | % | 0.00 | % | 57.0 | % | 20.2x | 9.3 | % | 0.3 | % | 16.8 | % | 2.5 | % | $ | 10.00 | $ | 11.64 | 16.4 | % | $ | 11.60 | 16.0 | % | $ | 11.92 | 19.2 | % | $ | 14.13 | 41.3 | % | |||||||||||||||||||||||||||||||||||||||||||||||||||||||||||||||||||||
| |
Medians - All Conversions: |
|
$ | 453 | 8.98 | % | 0.40 | % | 184 | % | $ | 40.0 | 63 | % | 103 | % | 4.5 | % | N.A. | N.A. | 8.0 | % | 4.0 | % | 10.0 | % | 5.3 | % | 0.00 | % | 59.0 | % | 14.4x | 9.6 | % | 0.3 | % | 16.9 | % | 2.8 | % | $ | 10.00 | $ | 11.40 | 14.0 | % | $ | 11.12 | 11.2 | % | $ | 12.30 | 23.0 | % | $ | 14.47 | 44.7 | % | |||||||||||||||||||||||||||||||||||||||||||||||||||||||||||||||||||||
Note: * - Appraisal performed by RP Financial; BOLD = RP Financial assisted in the business plan preparation, “NT”—Not Traded; “NA” - Not Applicable, Not Available; C/S-Cash/Stock.
| (1) As a percent of MHC offering for MHC transactions. (2) Does not take into account the adoption of SOP 93-6. (3) Latest price if offering is less than one week old. (4) Latest price if offering is more than one week but less than one month old. |
(5) Mutual holding company pro forma data on full conversion basis. (6) Simultaneously completed acquisition of another financial institution. (7) Simultaneously converted to a commercial bank charter. (8) Former credit union. |
2/2/2026
| RP® Financial, LC. | VALUATION ANALYSIS IV.17 |
account in selecting companies for the Peer Group that could be subject to the same type of acquisition speculation that may influence Columbia Financial’s stock. However, since converting thrifts are subject to a three-year regulatory moratorium from being acquired, acquisition speculation in Columbia Financial’s stock would tend to be less compared to the stocks of the Peer Group companies.
Trading in CLBK’s Stock
Since CLBK’s minority stock currently trades under the symbol “CLBK” on the NASDAQGS, RP Financial also considered the recent trading activity in the valuation analysis. CLBK had a total of 103,984,649 shares issued and outstanding at December 31, 2025, of which 27,968,125 shares were held by public shareholders and traded as public securities. The Company’s stock has had a 52 week trading range of $13.07 to $17.71 per share, which was its closing price on February 2, 2026. There are significant differences between the Company’s minority stock (currently being traded) and the conversion stock that will be issued by the Company. Such differences include different liquidity characteristics, a different return on equity for the conversion stock and the stock is currently traded based on its MHC ownership structure. Since the pro forma impact has not been publicly disseminated to date, it is appropriate to discount the current trading level. CLBK’s stock price increased after the February 2, 2026 announcement of the second-step conversion and merger with Northfield Bancorp, including preliminary estimates of the pro forma impact of the second-step offering and merger. As more information of the conversion and merger is disclosed in the prospectus, the trading level will become more informative.
* * * * * * * * * * *
In determining our valuation adjustment for marketing of the issue, we considered trends in both the overall thrift market, the new issue market including the new issue market for second-step conversions, the acquisition market and recent trading activity in the Company’s minority stock. Taking these factors and trends into account, RP Financial concluded that no adjustment was appropriate in the valuation analysis for purposes of marketing of the issue.
| RP® Financial, LC. | VALUATION ANALYSIS IV.18 |
8. Management
The Company’s management team appears to have experience and expertise in all of the key areas of the Company’s operations. The directors and staff that will be added through the acquisition of Northfield Bancorp is expected to strengthen personnel depth and expertise. Exhibit IV-5 provides summary resumes of the Company’s Board of Directors and senior management following the second-step offering and acquisition of Northfield Bancorp. The financial characteristics of the Company suggest that the Board and senior management have been effective in the implementation of the Company’s operating strategy and there appears to be a well-defined organizational structure for the merged entity.
Similarly, the returns, equity positions and other operating measures of the Peer Group companies are indicative of well-managed financial institutions, which have Boards and management teams that have been effective in implementing competitive operating strategies. Therefore, on balance, we concluded no valuation adjustment relative to the Peer Group was appropriate for this factor.
9. Effect of Government Regulation and Regulatory Reform
As a fully-converted regulated institution, Columbia Financial will operate in substantially the same regulatory environment as the Peer Group members — all of whom are adequately capitalized institutions and are operating with no apparent restrictions. Exhibit IV-6 reflects the Bank’s pro forma regulatory capital ratios. On balance, no adjustment has been applied for the effect of government regulation and regulatory reform.
Summary of Adjustments
Overall, based on the factors discussed above, we concluded that the Company’s pro forma market value should reflect the following valuation adjustments relative to the Peer Group:
| Key Valuation Parameters: | Valuation Adjustment | |
| Financial Condition | Slight Upward | |
| Profitability, Growth and Viability of Earnings | Slight Downward | |
| Asset Growth | Slight Upward | |
| Primary Market Area | No Adjustment | |
| Dividends | No Adjustment | |
| Liquidity of the Shares | No Adjustment | |
| Marketing of the Issue | No Adjustment | |
| Management | No Adjustment | |
| Effect of Govt. Regulations and Regulatory Reform | No Adjustment |
| RP® Financial, LC. | VALUATION ANALYSIS IV.19 |
Valuation Approaches
In applying the accepted valuation methodology promulgated by the FRB, i.e., the pro forma market value approach, we considered the three key pricing ratios in valuing the Company’s to-be-issued stock — price/earnings (“P/E”), price/book (“P/B”), and price/assets (“P/A”) approaches — all performed on a pro forma basis including the effects of the stock proceeds. In computing the pro forma impact of the conversion and the related pricing ratios, we have incorporated the valuation parameters disclosed in the Company’s prospectus for reinvestment rate, effective tax rate, stock benefit plan assumptions, expenses and the Northfield Bancorp merger (summarized in Exhibits IV-7 and IV-8). In our estimate of value, we assessed the relationship of the pro forma pricing ratios relative to the Peer Group and recent conversion offerings.
RP Financial’s valuation placed an emphasis on the following:
| • | P/E Approach. The P/E approach is generally the best indicator of long-term value for a stock and we have given it significant weight among the valuation approaches. Given certain similarities between the Company’s and the Peer Group’s earnings composition and overall financial condition, the P/E approach was carefully considered in this valuation. At the same time, recognizing that (1) the earnings multiples will be evaluated on a pro forma basis for the Company; and (2) the Peer Group companies have had the opportunity to realize the benefit of reinvesting and leveraging their offering proceeds, we also gave weight to the other valuation approaches. |
| • | P/B Approach. P/B ratios have generally served as a useful benchmark in the valuation of thrift stocks, particularly in the context of a public offering, as the earnings approach involves assumptions regarding the use of proceeds. RP Financial considered the P/B approach to be a valuable indicator of pro forma value, taking into account the pricing ratios under the P/E and P/A approaches. We have also modified the P/B approach to exclude the impact of intangible assets (i.e., price/tangible book value or “P/TB”), in that the investment community frequently makes this adjustment in its evaluation of this pricing approach. |
| • | P/A Approach. P/A ratios are generally a less reliable indicator of market value, as investors typically assign less weight to assets and attribute greater weight to book value and earnings. Furthermore, this approach as set forth in the regulatory valuation guidelines does not take into account the amount of stock purchases funded by deposit withdrawals, thus understating the pro forma P/A ratio. At the same time, the P/A ratio is an indicator of franchise value, and, in the case of highly capitalized institutions, high P/A ratios may limit the investment community’s willingness to pay market multiples for earnings or book value when ROE is expected to be low. |
| RP® Financial, LC. | VALUATION ANALYSIS IV.20 |
| • | Trading of CLBK stock. Converting institutions generally do not have stock outstanding. CLBK, however, has public shares outstanding due to the mutual holding company form of ownership and first-step minority stock offering. Since CLBK’s’ stock is currently traded on the NASDAQGS, it is an indicator of the Company’s current market value and, therefore, received some limited consideration in our valuation. Based on the February 2, 2026 closing stock price of $17.71 per share and the 103,984,649 shares of CLBK common stock outstanding, the Company’s implied market value of $1.8 billion was considered in the valuation process. However, since the Company’s conversion stock will have different characteristics than the minority shares and the prospectus pro forma information has not been publicly disseminated to date, the current trading price of CLBK’s stock was somewhat discounted herein but will become more important towards the closing of the offering. |
The Company has adopted “Employers’ Accounting for Employee Stock Ownership Plans” (“ASC 718-40”), which causes earnings per share computations to be based on shares issued and outstanding excluding unreleased ESOP shares. For purposes of preparing the pro forma pricing analyses, we have reflected all shares issued in the offering, including all ESOP shares, to capture the full dilutive impact, particularly since the ESOP shares are economically dilutive, receive dividends and can be voted. However, we did consider the impact of ASC 718-40 in the valuation.
In preparing the pro forma pricing analysis, we took into account the FRB’s policy potentially leading to minority shareholder dilution with the consolidation of the MHC’s net assets with the issuer’s equity at closing. In the Company’s case, however, the MHC has net liabilities of $48,000, leading to a nominal reduction of equity. Accordingly, no adjustment to the minority shareholder exchange ratio per the FRB policy is applicable in the Company’s second-step conversion and, therefore, the public shareholders’ ownership interest equaled 26.90% and the MHC’s ownership interest equaled 73.10%.
Based on the application of the three valuation approaches, taking into consideration the valuation adjustments discussed above, RP Financial concluded that as of February 2, 2026, the aggregate pro forma market value of Columbia Financial’s conversion stock equaled $2,291,268,770 at the midpoint, equal to 229,126,877 shares at $10.00 per share. The $10.00 per share price was determined by the Boards of Directors of CLBK and the MHC. The midpoint and resulting valuation range is based on the sale of a 73.10% ownership interest to the public, which provides for a $1,675,000,000 public offering at the midpoint value. The aggregate pro forma market value of Columbia Financial’s conversion stock, including the 418,001,400 shares of stock to-be-issued for the acquisition of Northfield Bancorp, was $2,709,270,170 at the midpoint, equal to 270,927,017 shares at $10.00 per share.
| RP® Financial, LC. | VALUATION ANALYSIS IV.21 |
1. Price-to-Earnings (“P/E”). The application of the P/E valuation method requires calculating the Company’s pro forma market value by applying a valuation P/E multiple to the pro forma earnings base. In applying this technique, we considered both reported earnings and a recurring earnings base, that is, earnings adjusted to exclude any one-time non-operating items, plus the estimated after-tax earnings benefit of the reinvestment of the net proceeds. The Company’s reported earnings, including the estimated pro forma earnings impact of the Northfield Bancorp acquisition, equaled $68.537 million for the twelve months ended December 31, 2025. In deriving Columbia Financial’s core earnings, the adjustments we made to reported earnings included the elimination of gain on securities of $290,000, change in fair value of equity securities of $2.567 million, goodwill impairment of $41.012 million and merger related expense of $214,000. As shown below, on a tax-effected basis, assuming an effective marginal tax rate of 27.0% for the earnings adjustments, the Company’s core earnings were determined to equal $96.546 million for the twelve months ended December 31, 2025.
| Amount | ||||
| ($000) | ||||
| Net income(loss) |
$ | 68,537 | ||
| Deduct; Gain on equity securities (1) |
(212 | ) | ||
| Deduct: Change in fair value of equity securities (1) |
(1,874 | ) | ||
| Add: Goodwill impairment (1) |
29,939 | |||
| Add: Merger related expenses (1) |
156 | |||
|
|
|
|||
| Core earnings estimate |
$ | 96,546 | ||
(1) Tax effected at 27.0%.
Based on the Company’s reported and core earnings and incorporating the impact of the pro forma assumptions discussed previously, the Company’s pro forma reported and core P/E multiples at the $2.709 billion midpoint value equaled 28.58x and 22.06x, respectively, indicating premiums of 122.41% and 72.21% relative to the Peer Group’s average reported and core earnings multiples of 12.85x and 12.81x, respectively (see Table 4.3). In comparison to the Peer Group’s median reported and core earnings multiples of 12.73x and 12.28x, respectively, the Company’s pro forma reported and core P/E multiples at the midpoint value indicated premiums of 124.51% and 79.64%, respectively. The Company’s pro forma P/E ratios based on reported earnings at the adjusted minimum and the maximum equaled 24.83x and 30.81x, respectively, and based on core earnings at the adjusted minimum and the maximum equaled 18.30x and 24.04x, respectively.
| RP® Financial, LC. | VALUATION ANALYSIS IV.22 |
Table 4.3
Pro Forma Market Pricing Versus Peer Group
Columbia Financial, Inc.
As of February 2, 2026
| Market Capitalization |
Per Share Data | |||||||||||||||||||||||||||||||||||||||||||||||||||||||||||||||||||||||||||||||||||||||||||
| Core |
Book Value/ |
Dividends(3) | Financial Characteristics(5) | |||||||||||||||||||||||||||||||||||||||||||||||||||||||||||||||||||||||||||||||||||||||||
| Price/ | Market | Pricing Ratios(2) | Amount/ | Yield | Payout | Total | Equity/ | Tang. Eq./ | NPAs/ | Reported | Core | Offering | Exchange | |||||||||||||||||||||||||||||||||||||||||||||||||||||||||||||||||||||||||||||||
| Share | Value | EPS(1) | Share | P/E | P/B | P/A | P/TB | P/Core | Share | Ratio(4) | Assets | Assets | T. Assets | Assets | ROAA | ROAE | ROAA | ROAE | Range | Ratio | ||||||||||||||||||||||||||||||||||||||||||||||||||||||||||||||||||||||||
| ($) | ($Mil) | ($) | ($) | (x) | (%) | (%) | (%) | (x) | ($) | (%) | ($Mil) | (%) | (%) | (%) | (%) | (%) | (%) | (%) | (%) | ($Mil) | (xl) | |||||||||||||||||||||||||||||||||||||||||||||||||||||||||||||||||||||||
| Columbia Financial, Inc. |
NJ | |||||||||||||||||||||||||||||||||||||||||||||||||||||||||||||||||||||||||||||||||||||||||||
| Maximum |
$ | 10.00 | $ | 3,064.69 | $ | 0.42 | $ | 10.90 | 30.81x | 91.74 | % | 16.77 | % | 97.28 | % | 24.04x | $ | 0.20 | 2.00 | % | 62.50 | % | $ | 18,275 | 18.28 | % | 17.42 | % | 0.37 | % | 0.54 | % | 2.98 | % | 0.70 | % | 3.82 | % | $ | 1,926.25 | 2.5340x | |||||||||||||||||||||||||||||||||||||||||||||||||||
| Midpoint |
$ | 10.00 | $ | 2,709.27 | $ | 0.45 | $ | 11.49 | 28.58x | 87.03 | % | 15.02 | % | 92.76 | % | 22.06x | $ | 0.20 | 2.00 | % | 57.14 | % | $ | 18,033 | 17.26 | % | 16.37 | % | 0.37 | % | 0.53 | % | 3.05 | % | 0.68 | % | 3.95 | % | $ | 1,675.00 | 2.2035x | |||||||||||||||||||||||||||||||||||||||||||||||||||
| Minimum |
$ | 10.00 | $ | 2,365.58 | $ | 0.50 | $ | 12.16 | 26.31x | 82.24 | % | 13.29 | % | 88.03 | % | 20.06x | $ | 0.20 | 2.00 | % | 52.63 | % | $ | 17,798 | 16.17 | % | 15.26 | % | 0.38 | % | 0.51 | % | 3.12 | % | 0.66 | % | 4.10 | % | $ | 1,423.75 | 1.8729x | |||||||||||||||||||||||||||||||||||||||||||||||||||
| Adjusted Minimum |
$ | 10.00 | $ | 1,947.58 | $ | 0.55 | $ | 12.61 | 24.83x | 79.30 | % | 11.21 | % | 85.98 | % | 18.30x | $ | 0.20 | 2.00 | % | 50.00 | % | $ | 17,377 | 14.13 | % | 13.18 | % | 0.39 | % | 0.45 | % | 3.19 | % | 0.61 | % | 4.33 | % | $ | 1,005.75 | 1.8729x | |||||||||||||||||||||||||||||||||||||||||||||||||||
| All Public Banks and Non-MHC Thrifts(6) |
||||||||||||||||||||||||||||||||||||||||||||||||||||||||||||||||||||||||||||||||||||||||||||
| Averages |
$ | 53.07 | $ | 10,076.84 | $ | 4.02 | $ | 40.23 | 13.46x | 124.42 | % | 13.88 | % | 149.05 | % | 12.90x | $ | 1.17 | 2.67 | % | 36.68 | % | $ | 72,262 | 11.45 | % | 9.95 | % | 0.55 | % | 0.94 | % | 8.45 | % | 1.06 | % | 9.60 | % | ||||||||||||||||||||||||||||||||||||||||||||||||||||||
| Median |
$ | 33.39 | $ | 804.99 | $ | 2.74 | $ | 27.89 | 12.69x | 116.43 | % | 12.89 | % | 140.49 | % | 12.01x | $ | 0.96 | 2.63 | % | 32.23 | % | $ | 6,091 | 10.94 | % | 9.29 | % | 0.38 | % | 1.00 | % | 9.50 | % | 1.09 | % | 10.57 | % | ||||||||||||||||||||||||||||||||||||||||||||||||||||||
| All Public Banks and Non-MHC Thrifts State of NJ(6) |
||||||||||||||||||||||||||||||||||||||||||||||||||||||||||||||||||||||||||||||||||||||||||||
| Averages |
$ | 23.38 | $ | 1,190.74 | $ | 1.79 | $ | 24.18 | 14.31x | 91.52 | % | 10.26 | % | 106.21 | % | 14.31x | $ | 0.58 | 2.88 | % | 37.17 | % | $ | 11,389 | 11.68 | % | 10.37 | % | 0.72 | % | 0.84 | % | 7.09 | % | 0.87 | % | 7.37 | % | ||||||||||||||||||||||||||||||||||||||||||||||||||||||
| Medians |
$ | 19.01 | $ | 507.06 | $ | 1.71 | $ | 22.12 | 13.17x | 93.73 | % | 10.75 | % | 100.07 | % | 12.47x | $ | 0.44 | 2.64 | % | 40.39 | % | $ | 4,033 | 11.54 | % | 9.40 | % | 0.58 | % | 0.77 | % | 6.75 | % | 0.82 | % | 6.98 | % | ||||||||||||||||||||||||||||||||||||||||||||||||||||||
| Comparable Group |
||||||||||||||||||||||||||||||||||||||||||||||||||||||||||||||||||||||||||||||||||||||||||||
| Averages |
$ | 36.96 | $ | 1,619.18 | $ | 2.79 | $ | 31.71 | 12.85x | 107.09 | % | 12.04 | % | 136.39 | % | 12.81x | $ | 0.98 | 2.89 | % | 36.44 | % | $ | 12,738 | 11.10 | % | 8.98 | % | 0.54 | % | 0.89 | % | 7.91 | % | 0.97 | % | 8.66 | % | ||||||||||||||||||||||||||||||||||||||||||||||||||||||
| Medians |
$ | 33.69 | $ | 1,460.42 | $ | 2.34 | $ | 31.55 | 12.73x | 107.53 | % | 11.67 | % | 132.17 | % | 12.28x | $ | 0.80 | 2.89 | % | 38.42 | % | $ | 11,064 | 10.93 | % | 8.87 | % | 0.50 | % | 1.03 | % | 9.24 | % | 1.05 | % | 9.58 | % | ||||||||||||||||||||||||||||||||||||||||||||||||||||||
| Comparable Group |
||||||||||||||||||||||||||||||||||||||||||||||||||||||||||||||||||||||||||||||||||||||||||||
| CCNE CNB Financial Corporation |
PA | $ | 28.29 | $ | 826.70 | $ | 2.16 | $ | 26.68 | 11.36x | 102.39 | % | 10.00 | % | 120.47 | % | 9.96x | $ | 0.72 | 2.55 | % | 28.92 | % | $ | 8,254 | 10.23 | % | 8.81 | % | 0.49 | % | 0.72 | % | 7.20 | % | 0.79 | % | 7.82 | % | |||||||||||||||||||||||||||||||||||||||||||||||||||||
| CNOB ConnectOne Bancorp, Inc. |
NJ | $ | 27.31 | $ | 1,369.88 | $ | 1.82 | $ | 28.39 | 16.75x | 93.88 | % | 9.88 | % | 116.13 | % | 12.39x | $ | 0.72 | 2.64 | % | 44.17 | % | $ | 14,024 | 10.97 | % | 9.16 | % | 0.28 | % | 0.55 | % | 4.58 | % | 0.76 | % | 6.31 | % | |||||||||||||||||||||||||||||||||||||||||||||||||||||
| DCOM Dime Community Bancshares, Inc. |
NY | $ | 35.36 | $ | 1,550.96 | $ | 2.37 | $ | 30.44 | 14.98x | 114.11 | % | 10.19 | % | 129.20 | % | 14.92x | $ | 1.00 | 2.83 | % | 42.37 | % | $ | 14,539 | 9.99 | % | 8.99 | % | 0.50 | % | 0.42 | % | 4.12 | % | 0.60 | % | 6.69 | % | |||||||||||||||||||||||||||||||||||||||||||||||||||||
| FCF First Commonwealth Financial Corporation |
PA | $ | 18.27 | $ | 1,872.70 | $ | 1.45 | $ | 14.78 | 12.43x | 120.88 | % | 15.22 | % | 162.80 | % | 11.88x | $ | 0.54 | 2.96 | % | 36.73 | % | $ | 12,310 | 12.52 | % | 9.59 | % | 0.74 | % | 1.20 | % | 9.79 | % | 1.27 | % | 10.29 | % | |||||||||||||||||||||||||||||||||||||||||||||||||||||
| KRNY Kearny Financial Corp. |
NJ | $ | 8.07 | $ | 507.06 | $ | 0.47 | $ | 11.63 | 15.52x | 68.98 | % | 6.86 | % | 81.85 | % | 15.57x | $ | 0.44 | 5.45 | % | 84.62 | % | $ | 7,648 | 9.85 | % | 8.47 | % | 0.58 | % | 0.39 | % | 3.96 | % | 0.39 | % | 3.94 | % | |||||||||||||||||||||||||||||||||||||||||||||||||||||
| NBTB NBT Bancorp Inc. |
NY | $ | 45.41 | $ | 2,375.63 | $ | 3.48 | $ | 35.33 | 13.64x | 125.03 | % | 14.82 | % | 171.14 | % | 11.90x | $ | 1.48 | 3.26 | % | 43.54 | % | $ | 16,113 | 11.50 | % | 8.58 | % | 0.29 | % | 1.02 | % | 9.09 | % | 1.19 | % | 10.57 | % | |||||||||||||||||||||||||||||||||||||||||||||||||||||
| PGC Peapack-Gladstone Financial Corporation |
NJ | $ | 33.01 | $ | 575.17 | $ | 1.88 | $ | 36.62 | 15.72x | 88.06 | % | 7.70 | % | 94.34 | % | 15.80x | $ | 0.20 | 0.61 | % | 9.52 | % | $ | 7,440 | 8.64 | % | 8.07 | % | 1.13 | % | 0.49 | % | 5.59 | % | 0.47 | % | 5.43 | % | |||||||||||||||||||||||||||||||||||||||||||||||||||||
| PFS Provident Financial Services, Inc. |
NJ | $ | 22.70 | $ | 2,965.07 | $ | 2.31 | $ | 21.18 | 10.18x | 104.65 | % | 11.87 | % | 144.56 | % | 10.22x | $ | 0.96 | 4.23 | % | 43.05 | % | $ | 24,833 | 11.14 | % | 8.22 | % | 0.41 | % | 1.06 | % | 9.59 | % | 1.25 | % | 11.29 | % | |||||||||||||||||||||||||||||||||||||||||||||||||||||
| STBA S&T Bancorp, Inc. |
PA | $ | 43.21 | $ | 1,616.17 | $ | 3.58 | $ | 38.47 | 12.38x | 110.40 | % | 16.37 | % | 148.52 | % | 12.16x | $ | 1.44 | 3.33 | % | 40.11 | % | $ | 9,817 | 15.03 | % | 11.65 | % | 0.51 | % | 1.38 | % | 9.40 | % | 1.42 | % | 9.66 | % | |||||||||||||||||||||||||||||||||||||||||||||||||||||
| TMP Tompkins Financial Corporation |
NY | $ | 81.12 | $ | 1,163.70 | $ | 5.91 | $ | 54.66 | 7.22x | 124.66 | % | 13.50 | % | 135.14 | % | 14.87x | $ | 2.68 | 3.30 | % | 22.78 | % | $ | 8,469 | 9.31 | % | 8.30 | % | 0.62 | % | 1.04 | % | 11.40 | % | 1.04 | % | 11.44 | % | |||||||||||||||||||||||||||||||||||||||||||||||||||||
| UVSP Univest Financial Corporation |
PA | $ | 34.38 | $ | 978.85 | $ | 2.96 | $ | 32.66 | 10.98x | 102.61 | % | 11.47 | % | 126.38 | % | 11.14x | $ | 0.88 | 2.56 | % | 28.12 | % | $ | 8,574 | 10.88 | % | 9.00 | % | 0.60 | % | 1.08 | % | 9.64 | % | 1.06 | % | 9.49 | % | |||||||||||||||||||||||||||||||||||||||||||||||||||||
| WSFS WSFS Financial Corporation |
DE | $ | 66.36 | $ | 3,628.30 | $ | 5.09 | $ | 49.67 | 13.04x | 129.42 | % | 16.62 | % | 206.16 | % | 12.85x | $ | 0.68 | 1.02 | % | 13.36 | % | $ | 20,840 | 13.16 | % | 8.93 | % | 0.35 | % | 1.33 | % | 10.53 | % | 1.40 | % | 11.02 | % | |||||||||||||||||||||||||||||||||||||||||||||||||||||
| (1) Core income, on a diluted per-share basis. Core income is net income after taxes and before extraordinary items, less net income attributable to noncontrolling interest, gain on the sale of securities, amortization of intangibles, goodwill and nonrecurring items. (2) P/E = Price to earnings; P/B = Price to book; P/A = Price to assets; P/TB = Price to tangible book value; and P/Core = Price to core earnings. P/E and P/Core =NM if the ratio is negative or above 35x. (3) Indicated 12 month dividend, based on last quarterly dividend declared. (4) Indicated 12 month dividend as a percent of trailing 12 month earnings. (5) Equity and tangible equity equal common equity and tangible common equity, respectively. ROAA (return on average assets) and ROAE (return on average equity) are indicated ratios based on trailing 12 month earnings and average equity and assets balances. (6) Excludes from averages and medians those companies the subject of actual or rumored acquisition activities or unusual operating characteristics.
Source: S&P Global Market Intelligence and RP Financial, LC. calculations. The information provided in this report has been obtained from sources we believe are reliable, but we cannot guarantee the accuracy or completeness of such information. Copyright (c) 2026 by RP® Financial, LC. |
| |||||||||||||||||||||||||||||||||||||||||||||||||||||||||||||||||||||||||||||||||||||||||||
| RP® Financial, LC. | VALUATION ANALYSIS IV.23 |
2. Price-to-Book (“P/B”). The application of the P/B valuation method requires calculating the Company’s pro forma market value by applying a valuation P/B ratio, as derived from the Peer Group’s P/B ratio, to the Company’s pro forma book value taking into account the estimated pro forma impact of the Northfield Bancorp acquisition. In applying the P/B approach we considered both reported book value and tangible book value. Based on the $2.709 billion midpoint valuation, the Company’s pro forma P/B and P/TB ratios equaled 87.03% and 92.76%, respectively. In comparison to the average P/B and P/TB ratios for the Peer Group of 107.09% and 136.39%, respectively, the Company’s ratios reflected discounts of 18.73% on a P/B basis and 32.00% on a P/TB basis. In comparison to the Peer Group’s median P/B and P/TB ratios of 107.53% and 132.17%, respectively, the Company’s pro forma P/B and P/TB ratios at the midpoint value reflected discounts of 19.06% on a P/B basis and 29.82% on a P/TB basis. At the maximum of the range, the Company’s P/B and P/TB ratios equaled 91.74% and 97.28%, respectively. In comparison to the Peer Group’s average P/B and P/TB ratios, the Company’s P/B and P/TB ratios at the maximum of the range reflected discounts of 14.33% and 28.68%, respectively. In comparison to the Peer Group’s median P/B and P/TB ratios, the Company’s P/B and P/TB ratio at the maximum of the range reflected discounts of 14.68% and 26.40%, respectively.
3. Price-to-Assets (“P/A”). The P/A valuation methodology determines market value by applying a valuation P/A ratio to the Company’s pro forma asset base taking into account the estimated pro forma impact of the Northfield Bancorp acquisition and conservatively assuming no deposit withdrawals are made to fund stock purchases. In all likelihood there will be deposit withdrawals, which results in understating the pro forma P/A ratio which is computed herein. At the $2.709 billion midpoint of the valuation range, the Company’s value equaled 15.02% of pro forma assets. Comparatively, the Peer Group companies exhibited an average P/A ratio of 12.04%, which implies a premium of 24.75% has been applied to the Company’s pro forma P/A ratio. In comparison to the Peer Group’s median P/A ratio of 11.67%, the Company’s pro forma P/A ratio at the midpoint value reflects a premium of 28.71%.
| RP® Financial, LC. | VALUATION ANALYSIS IV.24 |
Comparison to Recent Offerings
As indicated at the beginning of this chapter, RP Financial’s analysis of recent conversion offering pricing characteristics at closing and in the aftermarket has been limited to a “technical” analysis and, thus, the pricing characteristics of recent conversion offerings cannot be a primary determinate of value. Particular focus was placed on the P/TB approach in this analysis, since the P/E multiples do not reflect the actual impact of reinvestment and the source of the stock proceeds (i.e., external funds vs. deposit withdrawals). In comparison to the 61.00% average closing forma P/TB ratio of the three second-step conversions completed during the past twelve months, the Company’s P/TB ratio of 92.68% at the midpoint value reflects an implied premium of 51.93%. At the maximum, the Bank’s P/TB ratio of 97.28% reflects an implied premium of 59.48% relative to the recent second-step conversions average P/TB ratio at closing.
Valuation Conclusion
Based on the foregoing, it is our opinion that, as of February 2, 2026, the estimated aggregate pro forma value of the shares of common stock of the Company to be issued and outstanding upon completing the conversion offering – including (1) newly-issued shares representing the MHC’s current ownership interest in the Company and (2) exchange shares issued to existing public shareholders of Columbia Financial – was $2,291,268,770 at the midpoint, equal to 229,126,877 shares at $10.00 per share. The resulting range of value and pro forma shares, all based on $10.00 per share, are as follows: $1,947,578,450 or 194,757,845 shares at the minimum/adjusted minimum and $2,634,959,080 or 263,495,908 shares at the maximum.
Based on this valuation and taking into account the MHC’s ownership interest, the midpoint of the offering range is $1,675,000,000 equal to 1,675,000,000 shares at $10.00 per share. The resulting offering range and offering shares, all based on $10.00 per share, are as follows: $1,423,750,000 or 142,375,000 shares at the minimum and $1,926,250,000 or 192,625,000 shares at the maximum, At the adjusted minimum of the offering range, the public offering is $1,005,748,600 equal to 100,574,860 shares at $10.00 per share and the merger shares applied to the offering range is $418,001,400 equal to 41,800,140 shares at $10.00 per share.
| RP® Financial, LC. | VALUATION ANALYSIS IV.25 |
Taking into account the Company’s use of proceeds, as of February 2, 2026, the estimated aggregate pro forma market value of the shares to be issued immediately following the conversion, including the 41,800,140 merger shares issued to Northfield Bancorp’s shareholders as part of the $597.1 million cash and stock merger with Northfield Bancorp was $2,709,270,170 at the midpoint, equal to 270,927,017 shares at a per share value of $10.00. Based on the foregoing valuation, the corresponding range of shares and market values based on a $10.00 per share price are as follows: The pro forma valuation calculations relative to the Peer Group are shown in Table 4.3 and are detailed in Exhibit IV-7 and Exhibit IV-8.
| Shares | 2nd Step | 2nd Step Exchange |
Full Conversion | Merger Shares Issued To |
Merger Shares Applied to |
Total Market Capitalization |
Exchange | Merger Shares | ||||||||||||||||||||||||
| Conclusion |
Offering Shares | Shares | Shares | Target | Offering | Shares | Ratio | Pct. Of Total | ||||||||||||||||||||||||
| Maximum |
192,625,000 | 70,870,908 | 263,495,908 | 42,973,477 | 0 | 306,469,385 | 2.5340 | 14.02 | % | |||||||||||||||||||||||
| Midpoint |
167,500,000 | 61,626,877 | 229,126,877 | 41,800,140 | 0 | 270,927,017 | 2.2035 | 15.43 | % | |||||||||||||||||||||||
| Minimum |
142,375,000 | 52,382,845 | 194,757,845 | 41,800,140 | 0 | 236,557,985 | 1.8729 | 17.67 | % | |||||||||||||||||||||||
| Adusted Minimum(4) |
100,574,860 | 52,382,845 | 194,757,845 | 0 | 41,800,140 | 194,757,845 | 1.8729 | 21.46 | % | |||||||||||||||||||||||
| Market Value | 2nd Step | 2nd Step Exchange |
Full Conversion | Merger Shares | Merger Shares Applied to |
Total Market Capitalization |
||||||||||||||||||||||||||
| Conclusion |
Offering Value | Shares Value | Value | Value | Offering | Value | ||||||||||||||||||||||||||
| Maximum |
$ | 1,926,250,000 | $ | 708,709,080 | $ | 2,634,959,080 | $ | 429,734,770 | 0 | $ | 3,064,693,850 | |||||||||||||||||||||
| Midpoint |
$ | 1,675,000,000 | $ | 616,268,770 | $ | 2,291,268,770 | $ | 418,001,400 | 0 | $ | 2,709,270,170 | |||||||||||||||||||||
| Minimum |
$ | 1,423,750,000 | $ | 523,828,450 | $ | 1,947,578,450 | $ | 418,001,400 | 0 | $ | 2,365,579,850 | |||||||||||||||||||||
| Adjusted Minimum(4) |
$ | 1,005,748,600 | $ | 523,828,450 | $ | 1,947,578,450 | $ | 0 | 418,001,400 | $ | 1,947,578,450 | |||||||||||||||||||||
Establishment of the Exchange Ratio
Conversion regulations provide that in a conversion of a mutual holding company, the minority shareholders are entitled to exchange the public shares for newly issued shares in the fully converted company. The Boards of Directors of the MHC and CLBK have independently determined the exchange ratio, which has been designed to preserve the current aggregate percentage ownership in the Company. The exchange ratio to be received by the existing minority shareholders of the Company will be determined at the end of the offering, based on the total number of shares sold in the second-step conversion offering and the final appraisal. Based on the valuation conclusion herein, the resulting offering value and the $10.00 per share offering price, the indicated exchange ratio at the midpoint is 2.2035 shares of the Company for every one public share held by public shareholders. Furthermore, based on the offering range of value, the indicated exchange ratio is 1.8729 at the minimum/adjusted minimum and 2.5340 at the maximum. RP Financial expresses no opinion on the proposed exchange of newly issued Company shares for the shares held by the public shareholders or on the proposed exchange ratio.
EXHIBITS
LIST OF EXHIBITS
| Exhibit Number |
Description | |
| I-1 | Audited Financial Statements | |
| I-2 | Map of Office Locations | |
| I-3 | Key Operating Ratios | |
| I-4 | Investment Portfolio Composition | |
| I-5 | Yields and Costs | |
| I-6 | Credit Loss Allowance Activity | |
| I-7 | Fixed and Adjustable Rate Loans | |
| I-8 | Interest Rate Risk Analysis | |
| I-9 | Loan Portfolio Composition | |
| I-9A | Loan Portfolio Composition – Northfield Bancorp, Inc. | |
| I-10 | Contractual Maturity by Loan Type | |
| I-11 | Loan Originations, Purchases, Sales and Repayments | |
| I-12 | Non-Performing Assets | |
| I-12A | Non-Performing Assets – Northfield Bancorp, Inc. | |
| I-13 | Deposit Composition | |
| I-14 | Maturity of Time Deposits | |
| I-15 | Borrowing Activity | |
| II-1 | Description of Office Properties | |
| II-2 | Historical Interest Rates | |
LIST OF EXHIBITS (continued)
| Exhibit |
Description | |
| III-1 | General Characteristics of Publicly-Traded Bank and Thrift Institutions | |
| III-2 | Public Market Pricing of Mid-Atlantic Bank and Thrift Institutions | |
| III-3 | Peer Group Market Area Comparative Analysis | |
| IV-1 | Stock Prices: As of February 2, 2026 | |
| IV-2 | Historical Stock Price Indices | |
| IV-3 | Stock Indices as of February 2, 2026 | |
| IV-4 | New Jersey Bank and Thrift Acquisitions 2022 - Present | |
| IV-5 | Director and Senior Management Summary Resumes | |
| IV-6 | Pro Forma Regulatory Capital Ratios | |
| IV-7 | Pro Forma Analysis Sheet | |
| IV-8 | Pro Forma Effect of Conversion Proceeds | |
| V-1 | Firm Qualifications Statement | |
EXHIBIT I-1
Columbia Financial, Inc.
Audited Financial Statements
[Incorporated by Reference]
EXHIBIT I-2
Columbia Financial, Inc.
Map of Office Locations
Exhibit I-2
Columbia Financial, Inc.
Map of Office Locations
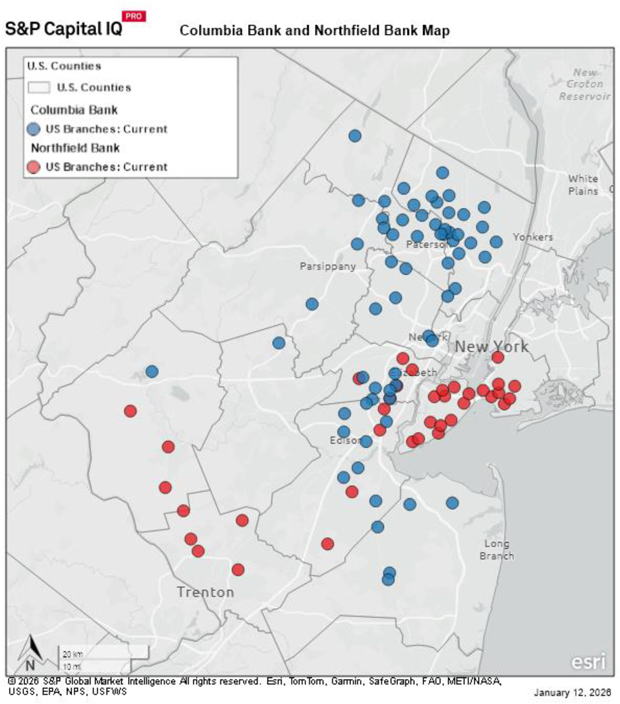
EXHIBIT I-3
Columbia Financial, Inc.
Key Operating Ratios
Exhibit I-3
Columbia Financial, Inc.
Key Operating Ratios
| At and For the Year Ended December 31, | ||||||||||||||||||||
| 2025 | 2024 | 2023 | 2022 | 2021 | ||||||||||||||||
| Performance Ratios: |
||||||||||||||||||||
| Return on average assets |
0.48 | % | (0.11 | )% | 0.35 | % | 0.88 | % | 1.01 | % | ||||||||||
| Return on average equity |
4.63 | (1.11 | ) | 3.29 | 8.09 | 8.98 | ||||||||||||||
| Interest rate spread(1) |
1.63 | 1.17 | 1.62 | 2.82 | 2.62 | |||||||||||||||
| Net interest margin(2) |
2.24 | 1.82 | 2.16 | 2.98 | 2.76 | |||||||||||||||
| Non-interest expense to average assets |
1.70 | 1.73 | 1.80 | 1.74 | 1.71 | |||||||||||||||
| Efficiency ratio(3) |
69.92 | 100.81 | 78.20 | 58.63 | 57.26 | |||||||||||||||
| Average interest-earning assets/average interest-bearing liabilities |
124.84 | 124.02 | 125.32 | 130.79 | 133.17 | |||||||||||||||
| Average equity to average assets |
||||||||||||||||||||
| Capital Ratios:(4) |
||||||||||||||||||||
| Total capital (to risk-weighted assets) |
14.09 | 14.41 | 14.02 | 14.12 | 15.39 | |||||||||||||||
| Tier 1 capital (to risk-weighted assets) |
13.20 | 13.56 | 13.22 | 13.32 | 14.38 | |||||||||||||||
| Common equity Tier 1 capital (to risk- weighted assets) |
13.20 | 13.56 | 13.22 | 13.32 | 14.38 | |||||||||||||||
| Core (Tier 1) capital (to adjusted total assets) |
9.67 | 9.64 | 9.48 | 9.74 | 9.80 | |||||||||||||||
| At and For the Year Ended December 31, | ||||||||||||||||||||
| 2025 | 2024 | 2023 | 2022 | 2021 | ||||||||||||||||
| Asset Quality Ratios: |
||||||||||||||||||||
| Allowance for loan losses as a percent of gross loans |
0.82 | % | 0.76 | % | 0.70 | % | 0.69 | % | 0.99 | % | ||||||||||
| Allowance for loan losses as a percent of non-performing loans |
176.84 | 276.29 | 436.65 | 785.64 | 1,591.50 | |||||||||||||||
| Net charge-offs to average outstanding loans during the period |
0.03 | 0.07 | 0.01 | — | 0.03 | |||||||||||||||
| Non-performing loans as a percent of gross loans(5) |
0.46 | 0.28 | 0.16 | 0.09 | 0.06 | |||||||||||||||
| Non-performing assets as a percent of total assets(5) |
0.34 | 0.22 | 0.12 | 0.06 | 0.04 | |||||||||||||||
| Other Data: |
||||||||||||||||||||
| Number of offices |
71 | 69 | 67 | 67 | 64 | |||||||||||||||
| (1) | Represents the difference between the weighted average yield on average interest-earning assets and the weighted average cost of average interest-bearing liabilities. |
| (2) | Represents net interest income as a percent of average interest-earning assets. |
| (3) | Represents non-interest expense divided by the sum of net interest income and non-interest income. |
| (4) | Ratios are for Columbia Bank. |
| (5) | Non-performing loans include loans on non-accrual, accruing loans past due 90 days or more and non-performing assets include non-performing loans and other real estate owned. |
Source: Columbia Financial’s prospectus.
EXHIBIT I-4
Columbia Financial, Inc.
Investment Portfolio Composition
Exhibit I-4
Columbia Financial, Inc.
Investment Portfolio Composition
| At December 31, | ||||||||||||||||||||||||
| 2025 | 2024 | 2023 | ||||||||||||||||||||||
| Amortized Cost |
Fair Value |
Amortized Cost |
Fair Value |
Amortized Cost |
Fair Value |
|||||||||||||||||||
| (In thousands) | ||||||||||||||||||||||||
| Debt securities available for sale: |
||||||||||||||||||||||||
| U.S. government and agency obligations |
$ | 393,875 | $ | 398,470 | $ | 314,494 | $ | 314,702 | $ | 146,387 | $ | 145,501 | ||||||||||||
| Mortgage-backed securities and collateralized mortgage obligations |
732,393 | 654,973 | 729,488 | 622,957 | 1,009,508 | 867,585 | ||||||||||||||||||
| Municipal obligations |
1,975 | 1,961 | 2,378 | 2,359 | 2,770 | 2,702 | ||||||||||||||||||
| Corporate debt securities |
71,976 | 66,613 | 95,508 | 85,928 | 92,565 | 77,769 | ||||||||||||||||||
|
|
|
|
|
|
|
|
|
|
|
|
|
|||||||||||||
| Total securities available for sale |
$ | 1,200,219 | $ | 1,122,017 | $ | 1,141,868 | $ | 1,025,946 | $ | 1,251,230 | $ | 1,093,557 | ||||||||||||
|
|
|
|
|
|
|
|
|
|
|
|
|
|||||||||||||
| Debt securities held to maturity: |
||||||||||||||||||||||||
| U.S. government and agency obligations |
$ | 44,872 | $ | 41,551 | $ | 44,871 | $ | 39,583 | $ | 49,871 | $ | 43,969 | ||||||||||||
| Mortgage-backed securities and collateralized mortgage obligations |
351,361 | 325,738 | 347,969 | 310,570 | 351,283 | 313,208 | ||||||||||||||||||
|
|
|
|
|
|
|
|
|
|
|
|
|
|||||||||||||
| Total debt securities held to maturity |
$ | 396,233 | $ | 367,289 | $ | 392,840 | $ | 350,153 | $ | 401,154 | $ | 357,177 | ||||||||||||
|
|
|
|
|
|
|
|
|
|
|
|
|
|||||||||||||
| Equity securities |
$ | 3,598 | $ | 6,802 | $ | 3,943 | $ | 6,673 | $ | 3,943 | $ | 3,384 | ||||||||||||
|
|
|
|
|
|
|
|
|
|
|
|
|
|||||||||||||
| Total securities |
$ | 1,600,050 | $ | 1,496,108 | $ | 1,538,651 | $ | 1,382,772 | $ | 1,656,327 | $ | 1,454,118 | ||||||||||||
|
|
|
|
|
|
|
|
|
|
|
|
|
|||||||||||||
Source: Columbia Financial’s prospectus.
EXHIBIT I-5
Columbia Financial, Inc.
Yields and Costs
Exhibit I-5
Columbia Financial, Inc.
Yields and Costs
| Years Ended December 31, | ||||||||||||||||||||||||
| 2025 | 2024 | |||||||||||||||||||||||
| Average Balance |
Interest | Yield / Cost | Average Balance |
Interest | Yield / Cost | |||||||||||||||||||
| (Dollars in thousands) | ||||||||||||||||||||||||
| Interest earning assets: |
||||||||||||||||||||||||
| Loans (1) |
$ | 8,094,854 | $ | 403,173 | 4.98 | % | $ | 7,801,939 | $ | 382,266 | 4.90 | % | ||||||||||||
| Securities (2) |
1,490,679 | 51,304 | 3.44 | % | 1,622,519 | 46,377 | 2.86 | % | ||||||||||||||||
| Other interest-earning assets |
317,974 | 16,474 | 5.18 | % | 363,370 | 22,783 | 6.27 | % | ||||||||||||||||
|
|
|
|
|
|
|
|
|
|||||||||||||||||
| Total interest-earning assets |
9,903,507 | $ | 470,951 | 4.76 | % | 9,787,828 | $ | 451,426 | 4.61 | % | ||||||||||||||
| Non-interest-earning assets |
864,630 | 865,684 | ||||||||||||||||||||||
|
|
|
|
|
|||||||||||||||||||||
| Total assets |
$ | 10,768,137 | $ | 10,653,512 | ||||||||||||||||||||
|
|
|
|
|
|||||||||||||||||||||
| Interest-bearing liabilities: |
||||||||||||||||||||||||
| Interest-bearing demand |
$ | 1,966,173 | $ | 43,733 | 2.22 | % | $ | 1,986,215 | $ | 55,360 | 2.79 | % | ||||||||||||
| Money market accounts |
1,361,204 | 38,070 | 2.80 | % | 1,235,495 | 32,977 | 2.67 | % | ||||||||||||||||
| Savings and club deposits |
641,020 | 4,015 | 0.63 | % | 667,836 | 5,130 | 0.77 | % | ||||||||||||||||
| Certificates of deposit |
2,803,958 | 111,556 | 3.98 | % | 2,587,360 | 108,916 | 4.21 | % | ||||||||||||||||
|
|
|
|
|
|
|
|
|
|||||||||||||||||
| Total interest-bearing deposits |
6,772,355 | 197,374 | 2.91 | % | 6,476,906 | 202,383 | 3.12 | % | ||||||||||||||||
| FHLB advances |
1,183,612 | 51,381 | 4.34 | % | 1,454,674 | 70,418 | 4.84 | % | ||||||||||||||||
| Junior subordinated debentures |
7,046 | 562 | 7.98 | % | 7,023 | 640 | 9.11 | % | ||||||||||||||||
| Other borrowings |
— | — | — | % | 55 | 3 | 5.45 | % | ||||||||||||||||
|
|
|
|
|
|
|
|
|
|||||||||||||||||
| Total borrowings |
1,190,658 | 51,943 | 4.36 | % | 1,461,752 | 71,061 | 4.86 | % | ||||||||||||||||
|
|
|
|
|
|
|
|
|
|||||||||||||||||
| Total interest-bearing liabilities |
7,963,013 | $ | 249,317 | 3.13 | % | 7,938,658 | $ | 273,444 | 3.44 | % | ||||||||||||||
| Non-interest-bearing liabilities: |
||||||||||||||||||||||||
| Non-interest-bearing deposits |
1,468,900 | 1,420,104 | ||||||||||||||||||||||
| Other non-interest-bearing liabilities |
218,497 | 242,290 | ||||||||||||||||||||||
|
|
|
|
|
|||||||||||||||||||||
| Total liabilities |
9,650,409 | 9,601,052 | ||||||||||||||||||||||
| Total stockholders’ equity |
1,117,728 | 1,052,460 | ||||||||||||||||||||||
|
|
|
|
|
|||||||||||||||||||||
| Total liabilities and stockholders’ equity |
$ | 10,768,137 | $ | 10,653,512 | ||||||||||||||||||||
|
|
|
|
|
|||||||||||||||||||||
| Net interest income |
$ | 221,634 | $ | 177,982 | ||||||||||||||||||||
| Interest rate spread (3) |
1.63 | % | 1.17 | % | ||||||||||||||||||||
| Net interest-earning assets (4) |
$ | 1,940,494 | $ | 1,849,170 | ||||||||||||||||||||
| Net interest margin (5) |
2.24 | % | 1.82 | % | ||||||||||||||||||||
| Ratio of interest-earning assets to interest-bearing liabilities |
124.37 | % | 123.29 | % | ||||||||||||||||||||
| (1) | Includes loans held-for-sale, non-accrual and PCD loan balances. |
| (2) | Includes debt securities available for sale, debt securities held to maturity and equity securities. |
| (3) | Interest rate spread represents the difference between the yield on average interest-earning assets and the cost of average interest-bearing liabilities. |
| (4) | Net interest-earning assets represent total interest-earning assets less total interest-bearing liabilities. |
| (5) | Net interest margin represents net interest income divided by average total interest-earning assets. |
Exhibit I-5 (continued) Columbia Financial, Inc.
Yields and Costs
| Year Ended December 31, | ||||||||||||
| 2023 | ||||||||||||
| Average Balance |
Interest | Yield / Cost | ||||||||||
| (Dollars in thousands) | ||||||||||||
| Interest earning assets: |
||||||||||||
| Loans (1) |
$ | 7,748,096 | $ | 343,770 | 4.44 | % | ||||||
| Securities (2) |
1,540,726 | 37,828 | 2.46 | % | ||||||||
| Other interest-earning assets |
241,520 | 13,380 | 5.54 | % | ||||||||
|
|
|
|
|
|||||||||
| Total interest-earning assets |
9,530,342 | $ | 394,978 | 4.14 | % | |||||||
| Non-interest-earning assets |
840,215 | |||||||||||
|
|
|
|||||||||||
| Total assets |
$ | 10,370,557 | ||||||||||
|
|
|
|||||||||||
| Interest-bearing liabilities: |
||||||||||||
| Interest-bearing demand |
$ | 2,183,333 | $ | 37,774 | 1.73 | % | ||||||
| Money market accounts |
951,174 | 24,296 | 2.55 | % | ||||||||
| Savings and club deposits |
793,303 | 2,231 | 0.28 | % | ||||||||
| Certificates of deposit |
2,229,042 | 60,861 | 2.73 | % | ||||||||
|
|
|
|
|
|||||||||
| Total interest-bearing deposits |
6,156,852 | 125,162 | 2.03 | % | ||||||||
| FHLB advances |
1,315,401 | 62,398 | 4.74 | % | ||||||||
| Notes payable |
22,780 | 918 | 4.03 | % | ||||||||
| Junior subordinated debentures |
7,054 | 624 | 8.85 | % | ||||||||
|
|
|
|
|
|||||||||
| Total borrowings |
1,345,235 | 63,940 | 4.75 | % | ||||||||
|
|
|
|
|
|||||||||
| Total interest-bearing liabilities |
7,502,087 | $ | 189,102 | 2.52 | % | |||||||
| Non-interest-bearing liabilities: |
||||||||||||
| Non-interest-bearing deposits |
1,539,354 | |||||||||||
| Other non-interest-bearing liabilities |
231,018 | |||||||||||
|
|
|
|||||||||||
| Total liabilities |
9,272,459 | |||||||||||
| Total stockholders’ equity |
1,098,098 | |||||||||||
|
|
|
|||||||||||
| Total liabilities and stockholders’ equity |
$ | 10,370,557 | ||||||||||
|
|
|
|||||||||||
| Net interest income |
$ | 205,876 | ||||||||||
| Interest rate spread (3) |
1.62 | % | ||||||||||
| Net interest-earning assets (4) |
$ | 2,028,255 | ||||||||||
| Net interest margin (5) |
2.16 | % | ||||||||||
| Ratio of interest-earning assets to interest-bearing liabilities |
127.04 | % | ||||||||||
| (1) | Includes loans held-for-sale, non-accrual and PCD loan balances. |
| (2) | Includes debt securities available for sale, debt securities held to maturity and equity securities. |
| (3) | Interest rate spread represents the difference between the yield on average interest-earning assets and the cost of average interest-bearing liabilities. |
| (4) | Net interest-earning assets represent total interest-earning assets less total interest-bearing liabilities. |
| (5) | Net interest margin represents net interest income divided by average total interest-earning assets. |
Source: Columbia Financial’s prospectus.
EXHIBIT I-6
Columbia Financial, Inc.
Credit Loss Allowance Activity
Exhibit I-6
Columbia Financial, Inc.
Credit Loss Allowance Activity
| At or For the Years Ended December 31, | ||||||||||||
| 2025 | 2024 | 2023 | ||||||||||
| (Dollars in thousands) | ||||||||||||
| Allowance at beginning of period |
$ | 59,958 | $ | 55,096 | $ | 52,803 | ||||||
| Initial allowance related to PCD loans |
3,202 | — | — | |||||||||
| Provision for credit losses |
9,822 | 14,451 | 4,787 | |||||||||
| Charge-offs: |
||||||||||||
| Real estate loans: |
||||||||||||
| One-to-four family |
— | (2 | ) | (585 | ) | |||||||
| Commercial real estate |
(119 | ) | (120 | ) | (150 | ) | ||||||
| Construction |
(53 | ) | — | — | ||||||||
|
|
|
|
|
|
|
|||||||
| Total real estate loans |
(172 | ) | (122 | ) | (735 | ) | ||||||
|
|
|
|
|
|
|
|||||||
| Commercial business loans |
(6,887 | ) | (9,814 | ) | (2,618 | ) | ||||||
| Consumer loans: |
||||||||||||
| Home equity loans and advances |
— | — | (26 | ) | ||||||||
| Other consumer loans |
(165 | ) | (262 | ) | (115 | ) | ||||||
|
|
|
|
|
|
|
|||||||
| Total consumer loans |
(165 | ) | (262 | ) | (141 | ) | ||||||
|
|
|
|
|
|
|
|||||||
| Total charge-offs |
(7,224 | ) | (10,198 | ) | (3,494 | ) | ||||||
|
|
|
|
|
|
|
|||||||
| Recoveries: |
||||||||||||
| Real estate loans: |
||||||||||||
| One-to-four family |
73 | 11 | 17 | |||||||||
| Commercial real estate |
1 | 36 | 21 | |||||||||
| Construction |
3 | 4 | — | |||||||||
|
|
|
|
|
|
|
|||||||
| Total real estate loans |
77 | 51 | 38 | |||||||||
|
|
|
|
|
|
|
|||||||
| Commercial business loans |
1,269 | 536 | 879 | |||||||||
| Consumer loans: |
||||||||||||
| Home equity loans and advances |
90 | 19 | 77 | |||||||||
| Other consumer loans |
7 | 3 | 6 | |||||||||
|
|
|
|
|
|
|
|||||||
| Total consumer loans |
97 | 22 | 83 | |||||||||
|
|
|
|
|
|
|
|||||||
| Total recoveries |
1,443 | 609 | 1,000 | |||||||||
|
|
|
|
|
|
|
|||||||
| Net charge-offs |
(5,781 | ) | (9,589 | ) | (2,494 | ) | ||||||
|
|
|
|
|
|
|
|||||||
| Allowance at end of period: |
$ | 67,201 | $ | 59,958 | $ | 55,096 | ||||||
|
|
|
|
|
|
|
|||||||
| Total gross loans outstanding |
$ | 8,243,376 | $ | 7,869,447 | $ | 7,824,665 | ||||||
| Average gross loans outstanding |
$ | 8,094,854 | $ | 7,801,939 | $ | 7,748,096 | ||||||
| ACL to total non-performing loans |
176.84 | % | 276.29 | % | 436.65 | % | ||||||
| ACL to total gross loans at end of period |
0.82 | % | 0.76 | % | 0.70 | % | ||||||
| Net charge-offs to average outstanding loans |
0.07 | % | 0.12 | % | 0.03 | % | ||||||
Source: Columbia Financial’s prospectus.
EXHIBIT I-7
Columbia Financial, Inc.
Fixed and Adjustable Rate Loans
Exhibit I-7
Columbia Financial, Inc.
Fixed and Adjustable Rate Loans
| Due After December 31, 2026 | ||||||||||||
| Fixed Rates | Floating or Adjustable Rates |
Total | ||||||||||
| (In thousands) | ||||||||||||
| Real estate loans: |
||||||||||||
| One-to-four family |
$ | 2,279,902 | $ | 278,158 | $ | 2,558,060 | ||||||
| Multifamily |
713,619 | 839,949 | 1,553,568 | |||||||||
| Commercial real estate |
996,960 | 1,335,535 | 2,332,495 | |||||||||
| Construction |
14,443 | 152,918 | 167,361 | |||||||||
| Commercial business loans |
324,247 | 130,048 | 454,295 | |||||||||
| Consumer loans: |
||||||||||||
| Home equity loans and advances |
139,931 | 114,271 | 254,202 | |||||||||
| Other consumer loans |
540 | 51 | 591 | |||||||||
|
|
|
|
|
|
|
|||||||
| Total loans |
$ | 4,469,642 | $ | 2,850,930 | $ | 7,320,572 | ||||||
|
|
|
|
|
|
|
|||||||
Source: Columbia Financial’s prospectus.
EXHIBIT I-8
Columbia Financial, Inc.
Interest Rate Risk Analysis
Exhibit I-8
Columbia Financial, Inc.
Interest Rate Risk Analysis
| Twelve Months Net Interest Income | Net Portfolio Value (“NPV”) | |||||||||||||||||||||||
| Change in Interest Rates (Basis Points) |
Amount | Dollar Change |
Percent of Change |
Estimated NPV | Present Value Ratio |
Percent Change |
||||||||||||||||||
| (Dollars in thousands) | ||||||||||||||||||||||||
| +400 |
$ | 201,945 | $ | (48,399 | ) | (19.33 | )% | $ | 929,777 | 9.73 | % | (29.97 | )% | |||||||||||
| +300 |
215,009 | (35,335 | ) | (14.11 | ) | 1,039,563 | 10.62 | (21.70 | ) | |||||||||||||||
| +200 |
227,652 | (22,692 | ) | (9.06 | ) | 1,143,708 | 11.40 | (13.85 | ) | |||||||||||||||
| +100 |
240,061 | (10,283 | ) | (4.11 | ) | 1,243,178 | 12.09 | (6.36 | ) | |||||||||||||||
| Base |
250,344 | — | — | 1,327,616 | 12.60 | — | ||||||||||||||||||
| -100 |
260,689 | 10,345 | 4.13 | 1,399,486 | 12.95 | 5.41 | ||||||||||||||||||
| -200 |
272,128 | 21,784 | 8.70 | 1,452,075 | 13.11 | 9.37 | ||||||||||||||||||
| -300 |
281,326 | 30,982 | 12.38 | 1,464,133 | 12.89 | 10.28 | ||||||||||||||||||
| -400 |
279,289 | 28,945 | 11.56 | 1,356,951 | 11.66 | 2.21 | ||||||||||||||||||
Source: Columbia Financial’s prospectus.
EXHIBIT I-9
Columbia Financial, Inc.
Loan Portfolio Composition
Exhibit I-9
Columbia Financial, Inc.
Loan Portfolio Composition
| At December 31, | ||||||||||||||||
| 2025 | 2024 | |||||||||||||||
| Amount | Percent | Amount | Percent | |||||||||||||
| (Dollars in thousands) | ||||||||||||||||
| Real estate loans: |
||||||||||||||||
| One-to-four family |
$ | 2,558,252 | 31.0 | % | $ | 2,710,937 | 34.4 | % | ||||||||
| Multifamily |
1,677,613 | 20.4 | 1,460,641 | 18.6 | % | |||||||||||
| Commercial real estate |
2,513,260 | 30.5 | 2,339,883 | 29.7 | % | |||||||||||
| Construction |
469,438 | 5.7 | 473,573 | 6.0 | % | |||||||||||
|
|
|
|
|
|
|
|
|
|||||||||
| Total real estate loans |
7,218,563 | 87.6 | 6,985,034 | 88.7 | ||||||||||||
| Commercial business loans |
766,792 | 9.3 | 622,000 | 7.9 | ||||||||||||
| Consumer loans: |
||||||||||||||||
| Home equity loans and advances |
255,126 | 3.1 | 259,009 | 3.3 | ||||||||||||
| Other consumer loans |
2,895 | — | 3,404 | — | ||||||||||||
|
|
|
|
|
|
|
|
|
|||||||||
| Total consumer loans |
258,021 | 3.1 | 262,413 | 3.3 | ||||||||||||
|
|
|
|
|
|
|
|
|
|||||||||
| Total gross loans |
8,243,376 | 100.0 | % | 7,869,447 | 100.0 | % | ||||||||||
|
|
|
|
|
|||||||||||||
| PCD loans |
10,442 | 11,686 | ||||||||||||||
| Net deferred loan costs, fees and purchased premiums and discounts |
38,192 | 35,795 | ||||||||||||||
| Allowance for credit losses |
(67,201 | ) | (59,958 | ) | ||||||||||||
|
|
|
|
|
|||||||||||||
| Loans receivable, net |
$ | 8,224,809 | $ | 7,856,970 | ||||||||||||
|
|
|
|
|
|||||||||||||
Source: Columbia Financial’s prospectus.
EXHIBIT I-9A
Columbia Financial, Inc.
Loan Portfolio Composition – Northfield Bancorp, Inc.
Exhibit I-9A
Columbia Financial, Inc.
Loan Portfolio Composition – Northfield Bancorp, Inc.
| At December 31, | ||||||||||||||||||||||||
| 2025 | 2024 | 2023 | ||||||||||||||||||||||
| Amount | Percent | Amount | Percent | Amount | Percent | |||||||||||||||||||
| (Dollars in thousands) | ||||||||||||||||||||||||
| Total loans: |
||||||||||||||||||||||||
| Real estate loans: |
||||||||||||||||||||||||
| Multifamily |
$ | 2,361,365 | 61.23 | % | $ | 2,597,484 | 64.59 | % | $ | 2,750,996 | 65.44 | % | ||||||||||||
| Commercial mortgage |
911,390 | 23.63 | 889,801 | 22.12 | 929,595 | 2.11 | ||||||||||||||||||
| One-to-four family residential |
165,100 | 4.28 | 150,217 | 3.73 | 160,824 | 3.83 | ||||||||||||||||||
| Home equity and lines of credit |
198,557 | 5.15 | 174,062 | 4.33 | 163,520 | 3.89 | ||||||||||||||||||
| Construction and land |
44,522 | 1.15 | 35,897 | 0.89 | 30,967 | 0.74 | ||||||||||||||||||
| Commercial and industrial loans |
166,167 | 4.31 | 163,425 | 4.06 | 155,268 | 3.69 | ||||||||||||||||||
| Other loans |
1,409 | 0.04 | 2,165 | 0.05 | 2,585 | 0.06 | ||||||||||||||||||
|
|
|
|
|
|
|
|
|
|
|
|
|
|||||||||||||
| Total loans originated |
3,848,510 | 99.79 | 4,013,051 | 99.77 | 4,193,755 | 99.76 | ||||||||||||||||||
|
|
|
|
|
|
|
|
|
|
|
|
|
|||||||||||||
| Purchased credit-deteriorated (“PCD”) loans |
8,263 | 0.21 | 9,173 | 0.23 | 9,899 | 0.24 | ||||||||||||||||||
|
|
|
|
|
|
|
|
|
|
|
|
|
|||||||||||||
| Total loans |
$ | 3,856,773 | 100.00 | % | $ | 4,022,224 | 100.00 | % | $ | 4,203,654 | 100.00 | % | ||||||||||||
|
|
|
|
|
|
|
|||||||||||||||||||
| Other items: |
||||||||||||||||||||||||
| Allowance for credit losses |
(38,144 | ) | (35,183 | ) | (37,535 | ) | ||||||||||||||||||
|
|
|
|
|
|
|
|||||||||||||||||||
| Net loans held-for-investment |
$ | 3,818,629 | $ | 3,987,041 | $ | 4,166,119 | ||||||||||||||||||
|
|
|
|
|
|
|
|||||||||||||||||||
Source: Columbia Financial’s prospectus.
EXHIBIT I-10
Columbia Financial, Inc.
Contractual Maturity by Loan Type
Exhibit I-10
Columbia Financial, Inc.
Contractual Maturity by Loan Type
| December 31, 2025 | ||||||||||||||||||||||||||||||||
| Real Estate | ||||||||||||||||||||||||||||||||
| One-to-four Family |
Multifamily | Commercial Real Estate |
Construction | Commercial Business |
Home Equity Loans and Advances |
Other Consumer Loans |
Total | |||||||||||||||||||||||||
| (In thousands) | ||||||||||||||||||||||||||||||||
| Amounts due in: |
||||||||||||||||||||||||||||||||
| One year or less |
$ | 1,459 | $ | 124,045 | $ | 188,656 | $ | 302,077 | $ | 313,781 | $ | 924 | $ | 2,304 | $ | 933,246 | ||||||||||||||||
| More than one year to five years |
52,091 | 823,901 | 1,051,669 | 156,186 | 313,249 | 17,815 | 591 | 2,415,502 | ||||||||||||||||||||||||
| More than five years to fifteen years |
401,063 | 652,425 | 1,078,240 | — | 136,479 | 96,753 | — | 2,364,960 | ||||||||||||||||||||||||
| More than fifteen years |
2,104,906 | 77,242 | 202,586 | 11,175 | 4,567 | 139,634 | — | 2,540,110 | ||||||||||||||||||||||||
|
|
|
|
|
|
|
|
|
|
|
|
|
|
|
|
|
|||||||||||||||||
| Total |
$ | 2,559,519 | $ | 1,677,613 | $ | 2,521,151 | $ | 469,438 | $ | 768,076 | $ | 255,126 | $ | 2,895 | $ | 8,253,818 | ||||||||||||||||
|
|
|
|
|
|
|
|
|
|
|
|
|
|
|
|
|
|||||||||||||||||
Source: Columbia Financial’s prospectus.
EXHIBIT I-11
Columbia Financial, Inc.
Loan Originations, Purchases, Sales and Repayments
Exhibit I-11
Columbia Financial, Inc.
Loan Originations, Purchases, Sales and Repayments
| Years Ended December 31, | ||||||||||||
| 2025 | 2024 | 2023 | ||||||||||
| (In thousands) | ||||||||||||
| Total loans at beginning of period |
$ | 7,916,928 | $ | 7,874,537 | $ | 7,677,564 | ||||||
| Originations: |
||||||||||||
| Real estate loans: |
||||||||||||
| One-to-four family |
118,218 | 123,399 | 215,266 | |||||||||
| Multifamily |
233,076 | 87,476 | 124,660 | |||||||||
| Commercial real estate |
325,216 | 21,837 | 146,303 | |||||||||
| Construction |
355,402 | 295,052 | 335,749 | |||||||||
|
|
|
|
|
|
|
|||||||
| Total real estate loans |
1,031,912 | 527,764 | 821,978 | |||||||||
|
|
|
|
|
|
|
|||||||
| Commercial business loans |
246,391 | 227,262 | 209,003 | |||||||||
| Consumer loans: |
||||||||||||
| Home equity loans and advances |
63,437 | 79,515 | 80,396 | |||||||||
| Other consumer loans |
191 | 90 | 182 | |||||||||
|
|
|
|
|
|
|
|||||||
| Total consumer loans |
63,628 | 79,605 | 80,578 | |||||||||
|
|
|
|
|
|
|
|||||||
| Total loans originated |
1,341,931 | 834,631 | 1,111,559 | |||||||||
| Purchases |
150,882 | 78,719 | 14,729 | |||||||||
| Loans acquired |
— | — | — | |||||||||
| Less: |
||||||||||||
| Principal payments, repayments, and other items, net |
(1,034,289 | ) | (832,011 | ) | (686,988 | ) | ||||||
| Loan sales |
(35,375 | ) | (18,895 | ) | (121,372 | ) | ||||||
| Securitization of loans |
(13,340 | ) | — | — | ||||||||
| Transfer of loans receivable to loans held-for-sale |
(34,727 | ) | (18,079 | ) | (120,955 | ) | ||||||
| Transfer to real estate owned |
— | (1,974 | ) | — | ||||||||
|
|
|
|
|
|
|
|||||||
| Total loans receivable at end of period |
$ | 8,292,010 | $ | 7,916,928 | $ | 7,874,537 | ||||||
|
|
|
|
|
|
|
|||||||
Source: Columbia Financial’s prospectus.
EXHIBIT I-12
Columbia Financial, Inc.
Non-Performing Assets
Exhibit I-12
Columbia Financial, Inc.
Non-Performing Assets
| At December 31, | ||||||||||||
| 2025 | 2024 | 2023 | ||||||||||
| (Dollars in thousands) | ||||||||||||
| Non-accrual loans: |
||||||||||||
| Real estate loans: |
||||||||||||
| One-to-four family |
$ | 9,787 | $ | 8,750 | $ | 3,139 | ||||||
| Commercial real estate |
5,766 | 2,920 | 2,740 | |||||||||
| Construction |
5,923 | — | — | |||||||||
|
|
|
|
|
|
|
|||||||
| Total real estate loans |
21,476 | 11,670 | 5,879 | |||||||||
| Commercial business loans |
15,281 | 9,785 | 6,518 | |||||||||
| Home equity loans and advances |
1,243 | 246 | 221 | |||||||||
|
|
|
|
|
|
|
|||||||
| Total non-accrual loans (1) |
38,000 | 21,701 | 12,618 | |||||||||
|
|
|
|
|
|
|
|||||||
| Total non-performing loans |
38,000 | 21,701 | 12,618 | |||||||||
| Real estate owned |
— | 1,334 | — | |||||||||
|
|
|
|
|
|
|
|||||||
| Total non-performing assets |
$ | 38,000 | $ | 23,035 | $ | 12,618 | ||||||
|
|
|
|
|
|
|
|||||||
| Total non-performing loans to total loans |
0.46 | % | 0.28 | % | 0.16 | % | ||||||
| Total non-performing assets total assets |
0.34 | % | 0.22 | % | 0.12 | % | ||||||
| (1) | Includes $1.3 million, $3.1 million and $237,000 of loan modifications on non-accrual status as of December 31, 2025, 2024 and 2023, respectively. |
Source: Columbia Financial’s prospectus.
EXHIBIT I-12A
Columbia Financial, Inc.
Non-Performing Assets – Northfield Bancorp, Inc.
Exhibit I-12A
Columbia Financial, Inc.
Non-Performing Assets – Northfield Bancorp, Inc.
| At December 31, | ||||||||||||
| 2025 | 2024 | 2023 | ||||||||||
| (Dollars in thousands) | ||||||||||||
| Non-accrual loans held-for-investment: |
||||||||||||
| Real estate loans: |
||||||||||||
| Commercial mortgage |
$ | 5,012 | $ | 4,578 | $ | 6,491 | ||||||
| One-to-four family residential |
— | — | 104 | |||||||||
| Multifamily |
3,688 | 2,609 | 2,709 | |||||||||
| Home equity and lines of credit |
1,778 | 1,270 | 499 | |||||||||
| Commercial and industrial loans |
4,732 | 5,807 | 305 | |||||||||
| Other |
— | — | 7 | |||||||||
|
|
|
|
|
|
|
|||||||
| Total non-accrual loans held-for-investment |
15,210 | 14,264 | 10,115 | |||||||||
| Loans delinquent 90 days or more and still accruing held-for-investment: |
||||||||||||
| Real estate loans: |
||||||||||||
| Commercial mortgage |
51 | — | — | |||||||||
| One-to-four family residential |
863 | 882 | 406 | |||||||||
| Multifamily |
— | 164 | 201 | |||||||||
| Home equity and lines of credit |
7 | 140 | 711 | |||||||||
| Other |
4 | — | — | |||||||||
|
|
|
|
|
|
|
|||||||
| Total loans delinquent 90 days or more and still accruing |
925 | 1,186 | 1,318 | |||||||||
| Non-performing loans held-for-sale |
||||||||||||
| Commercial mortgage |
— | 4,397 | — | |||||||||
| Commercial and industrial loans |
— | 500 | — | |||||||||
| Total non-performing loans held-for-sale |
— | 4,897 | — | |||||||||
| Total non-performing loans held-for-investment |
16,135 | 20,347 | 11,433 | |||||||||
|
|
|
|
|
|
|
|||||||
| Total non-performing assets |
$ | 16,135 | $ | 20,347 | $ | 11,433 | ||||||
|
|
|
|
|
|
|
|||||||
| Ratios: |
||||||||||||
| Non-performing loans to total loans (1) |
0.42 | % | 0.51 | % | 0.27 | % | ||||||
| Non-accrual loans held-for-investment to total loans held-for-investment, net |
0.39 | % | 0.35 | % | 0.24 | % | ||||||
| Non-performing assets to total assets |
0.28 | % | 0.36 | % | 0.20 | % | ||||||
| Total assets |
$ | 5,754,010 | $ | 5,666,378 | $ | 5,598,396 | ||||||
| Loans held-for-investment, net |
$ | 3,856,773 | $ | 4,022,224 | $ | 4,203,654 | ||||||
| (1) | Includes non-performing loans transferred to held-for-sale. |
Source: Columbia Financial’s prospectus.
EXHIBIT I-13
Columbia Financial, Inc.
Deposit Composition
Exhibit I-13
Columbia Financial, Inc.
Deposit Composition
| At December 31, | ||||||||||||||||||||||||
| 2025 | 2024 | 2023 | ||||||||||||||||||||||
| Amount | Percent of Total Deposits |
Amount | Percent of Total Deposits |
Amount | Percent of Total Deposits |
|||||||||||||||||||
| (Dollars in thousands) | ||||||||||||||||||||||||
| Non-interest-bearing demand |
$ | 1,517,399 | 18.0 | % | $ | 1,438,030 | 17.8 | % | $ | 1,437,361 | 18.3 | % | ||||||||||||
| Interest-bearing demand |
1,985,871 | 23.5 | 2,021,312 | 25.0 | 1,966,463 | 25.1 | ||||||||||||||||||
| Money market accounts |
1,465,028 | 17.3 | 1,241,691 | 15.3 | 1,255,528 | 16.0 | ||||||||||||||||||
| Savings and club deposits |
623,444 | 7.4 | 652,501 | 8.1 | 700,348 | 8.9 | ||||||||||||||||||
| Certificates of deposit |
2,852,337 | 33.8 | 2,742,615 | 33.8 | 2,486,856 | 31.7 | ||||||||||||||||||
|
|
|
|
|
|
|
|
|
|
|
|
|
|||||||||||||
| Total deposits |
$ | 8,444,079 | 100.0 | % | $ | 8,096,149 | 100.00 | % | $ | 7,846,556 | 100.0 | % | ||||||||||||
|
|
|
|
|
|
|
|
|
|
|
|
|
|||||||||||||
Source: Columbia Financial’s prospectus.
EXHIBIT I-14
Columbia Financial, Inc.
Maturity of Time Deposits
Exhibit I-14
Columbia Financial, Inc.
Maturity of Time Deposits
| Period to Maturity | ||||||||||||||||||||||||||||
| One Year or Less |
More Than One Year to Two Years |
More Than Two Years to Three Years |
More Than Three Years to Four Years |
More Than Four Years |
Total | Percentage of Certificate Accounts |
||||||||||||||||||||||
| (Dollars in thousands) | ||||||||||||||||||||||||||||
| Less than 0.50% |
$ | 10,428 | $ | 2,738 | $ | 176 | $ | 5 | $ | — | $ | 13,347 | 0.4 | % | ||||||||||||||
| 0.50% to 0.99% |
14,904 | 3,033 | 985 | 186 | — | 19,108 | 0.7 | |||||||||||||||||||||
| 1.00% to 1.49% |
756 | 3,290 | 222 | 232 | — | 4,500 | 0.2 | |||||||||||||||||||||
| 1.50% to 1.99% |
4,740 | 2,874 | 523 | 7 | 8 | 8,152 | 0.3 | |||||||||||||||||||||
| 2.00% to 2.49% |
6,935 | — | 98 | 195 | — | 7,228 | 0.3 | |||||||||||||||||||||
| 2.50% to 2.99% |
27,720 | 15,508 | 5,223 | 5,514 | 3,700 | 57,665 | 2.0 | |||||||||||||||||||||
| 3.00% to 3.49% |
124,841 | 45,248 | 7,533 | 976 | 4,752 | 183,350 | 6.4 | |||||||||||||||||||||
| 3.50% to 3.99% |
1,755,989 | 139,385 | 71,257 | 6,922 | 11,971 | 1,985,524 | 69.6 | |||||||||||||||||||||
| 4.00% to 4.49% |
500,534 | 51,135 | — | — | — | 551,669 | 19.3 | |||||||||||||||||||||
| 4.50% to 4.99% |
18,956 | — | — | — | — | 18,956 | 0.7 | |||||||||||||||||||||
| 5.00% and greater |
2,838 | — | — | — | — | 2,838 | 0.1 | |||||||||||||||||||||
|
|
|
|
|
|
|
|
|
|
|
|
|
|
|
|||||||||||||||
| Total |
$ | 2,468,641 | $ | 263,211 | $ | 86,017 | $ | 14,037 | $ | 20,431 | $ | 2,852,337 | 100.0 | % | ||||||||||||||
|
|
|
|
|
|
|
|
|
|
|
|
|
|
|
|||||||||||||||
Source: Columbia Financial’s prospectus.
EXHIBIT I-15
Columbia Financial, Inc.
Borrowing Activity
Exhibit I-15
Columbia Financial, Inc.
Borrowing Activity
| Years Ended December 31, | ||||||||||||
| 2025 | 2024 | 2023 | ||||||||||
| (Dollars in thousands) | ||||||||||||
| Maximum amount outstanding at any month-end during the year: |
||||||||||||
| Lines of credit |
$ | — | $ | 26,500 | $ | 168,800 | ||||||
| FHLB advances |
1,318,251 | 1,676,705 | 1,659,706 | |||||||||
| Notes payable |
— | — | 29,934 | |||||||||
| Junior subordinated debentures |
7,057 | 7,036 | 6,962 | |||||||||
| Average outstanding balance during the year: |
||||||||||||
| Lines of credit |
$ | 1,017 | $ | 339 | $ | 18,036 | ||||||
| FHLB advances |
1,182,595 | 1,454,335 | 1,297,365 | |||||||||
| Notes payable |
— | — | 22,780 | |||||||||
| Junior subordinated debentures |
7,046 | 7,023 | 7,054 | |||||||||
| Other borrowings |
— | 55 | — | |||||||||
| Weighted average interest rate during the year: |
||||||||||||
| Lines of credit |
4.33 | % | 5.31 | % | 9.26 | % | ||||||
| FHLB advances |
4.34 | 4.84 | 4.68 | |||||||||
| Notes payable |
— | — | 4.03 | |||||||||
| Junior subordinated debentures |
7.98 | 9.11 | 8.85 | |||||||||
| Other borrowings |
— | 5.45 | — | |||||||||
| Balance outstanding at end of the year: |
||||||||||||
| Lines of credit |
$ | — | $ | — | $ | — | ||||||
| FHLB advances |
1,176,415 | 1,073,564 | 1,521,733 | |||||||||
| Junior subordinated debentures |
7,057 | 7,036 | 6,962 | |||||||||
| Weighted average interest rate at end of year: |
||||||||||||
| FHLB advances |
4.17 | % | 4.42 | % | 4.92 | % | ||||||
| Junior subordinated debentures |
6.92 | 7.5 | 8.59 | |||||||||
Source: Columbia Financial’s prospectus.
EXHIBIT II-1
Description of Office Properties
Exhibit II-1
Columbia Financial, Inc.
Description of Office Properties
We are headquartered in Fair Lawn, New Jersey. As of December 31, 2025, Columbia Bank operated 71 full-service banking offices in 12 of New Jersey’s 21 counties. In addition, (i) First Jersey Title Services, Inc., a wholly-owned subsidiary of Columbia Bank, operates in one of Columbia Bank’s offices in Fair Lawn, New Jersey and (ii) Columbia Insurance Services, Inc., a wholly-owned subsidiary of Columbia Bank, operates in one of Columbia Bank’s offices in Rahway, New Jersey.
Source: Columbia Financial’s prospectus.
EXHIBIT II-2
Historical Interest Rates
Exhibit II-2
Historical Interest Rates(1)
| Year/Qtr. Ended |
Prime Rate |
90 Day T-Note |
One Year T-Note |
10 Year T-Note |
||||||||||
| 2015: Quarter 1 | 3.25% | 0.03 | % | 0.26 | % | 1.94 | % | |||||||
| Quarter 2 | 3.25% | 0.01 | % | 0.28 | % | 2.35 | % | |||||||
| Quarter 3 | 3.25% | 0.00 | % | 0.33 | % | 2.06 | % | |||||||
| Quarter 4 | 3.50% | 0.16 | % | 0.65 | % | 2.27 | % | |||||||
| 2016: Quarter 1 | 3.50% | 0.21 | % | 0.59 | % | 1.78 | % | |||||||
| Quarter 2 | 3.50% | 0.26 | % | 0.45 | % | 1.49 | % | |||||||
| Quarter 3 | 3.50% | 0.29 | % | 0.59 | % | 1.60 | % | |||||||
| Quarter 4 | 3.75% | 0.51 | % | 0.85 | % | 2.45 | % | |||||||
| 2017: Quarter 1 | 4.00% | 0.76 | % | 1.03 | % | 2.40 | % | |||||||
| Quarter 2 | 4.25% | 1.03 | % | 1.24 | % | 2.31 | % | |||||||
| Quarter 3 | 4.25% | 1.06 | % | 1.31 | % | 2.33 | % | |||||||
| Quarter 4 | 4.50% | 1.39 | % | 1.76 | % | 2.40 | % | |||||||
| 2018: Quarter 1 | 4.75% | 1.73 | % | 2.09 | % | 2.74 | % | |||||||
| Quarter 2 | 5.00% | 1.93 | % | 2.33 | % | 2.85 | % | |||||||
| Quarter 3 | 5.25% | 2.19 | % | 2.59 | % | 3.05 | % | |||||||
| Quarter 4 | 5.50% | 2.45 | % | 2.63 | % | 2.69 | % | |||||||
| 2019: Quarter 1 | 5.50% | 2.40 | % | 2.40 | % | 2.41 | % | |||||||
| Quarter 2 | 5.00% | 2.12 | % | 1.92 | % | 2.00 | % | |||||||
| Quarter 3 | 4.75% | 1.88 | % | 1.75 | % | 1.68 | % | |||||||
| Quarter 4 | 4.75% | 1.55 | % | 1.59 | % | 1.92 | % | |||||||
| 2020: Quarter 1 | 3.25% | 0.11 | % | 0.17 | % | 0.70 | % | |||||||
| Quarter 2 | 3.25% | 0.16 | % | 0.16 | % | 0.66 | % | |||||||
| Quarter 3 | 3.25% | 0.10 | % | 0.12 | % | 0.69 | % | |||||||
| Quarter 4 | 3.25% | 0.09 | % | 0.10 | % | 0.93 | % | |||||||
| 2021: Quarter 1 | 3.25% | 0.03 | % | 0.07 | % | 1.74 | % | |||||||
| Quarter 2 | 3.25% | 0.05 | % | 0.08 | % | 1.44 | % | |||||||
| Quarter 3 | 3.25% | 0.04 | % | 0.09 | % | 1.52 | % | |||||||
| Quarter 4 | 3.25% | 0.06 | % | 0.39 | % | 1.52 | % | |||||||
| 2022: Quarter 1 | 3.50% | 0.52 | % | 1.63 | % | 2.32 | % | |||||||
| Quarter 2 | 4.75% | 1.72 | % | 2.80 | % | 2.98 | % | |||||||
| Quarter 3 | 6.25% | 3.33 | % | 4.05 | % | 3.83 | % | |||||||
| Quarter 4 | 7.50% | 4.42 | % | 4.73 | % | 3.88 | % | |||||||
| 2023: Quarter 1 | 8.00% | 4.85 | % | 4.64 | % | 3.48 | % | |||||||
| Quarter 2 | 8.25% | 5.43 | % | 5.40 | % | 3.81 | % | |||||||
| Quarter 3 | 8.50% | 5.55 | % | 5.46 | % | 4.59 | % | |||||||
| Quarter 4 | 8.50% | 5.40 | % | 4.79 | % | 3.88 | % | |||||||
| 2024: Quarter 1 | 8.50% | 5.46 | % | 5.03 | % | 4.20 | % | |||||||
| Quarter 2 | 8.50% | 5.48 | % | 5.09 | % | 4.36 | % | |||||||
| Quarter 3 | 8.00% | 4.73 | % | 3.98 | % | 3.81 | % | |||||||
| Quarter 4 | 7.50% | 4.37 | % | 4.16 | % | 4.58 | % | |||||||
| 2025: Quarter 1 | 7.50% | 4.32 | % | 4.03 | % | 4.23 | % | |||||||
| Quarter 2 | 7.50% | 4.41 | % | 3.96 | % | 4.24 | % | |||||||
| Quarter 3 | 7.25% | 4.02 | % | 3.68 | % | 4.16 | % | |||||||
| Quarter 4 | 6.75% | 3.67 | % | 3.48 | % | 4.18 | % | |||||||
| As of February 2, 2026 | 6.75% | 3.69 | % | 3.49 | % | 4.29 | % | |||||||
| (1) End of period data. |
| |||||||||||||
| Sources: Federal Reserve and The Wall Street Journal. |
| |||||||||||||
| 1991: Quarter 1 | 8.75% | 5.92 | % | 6.24 | % | 8.26 | % | |||||||
| Quarter 2 | 8.50% | 5.72 | % | 6.35 | % | 8.43 | % | |||||||
| Quarter 3 | 8.00% | 5.22 | % | 5.38 | % | 7.80 | % | |||||||
| Quarter 4 | 6.50% | 3.95 | % | 4.10 | % | 7.47 | % | |||||||
| 1992: Quarter 1 | 6.50% | 4.15 | % | 4.53 | % | 7.97 | % | |||||||
| Quarter 2 | 6.50% | 3.65 | % | 4.06 | % | 7.79 | % | |||||||
| Quarter 3 | 6.00% | 2.75 | % | 3.06 | % | 7.38 | % | |||||||
| Quarter 4 | 6.00% | 3.15 | % | 3.59 | % | 7.40 | % | |||||||
| 1993: Quarter 1 | 6.00% | 2.95 | % | 3.18 | % | 6.93 | % | |||||||
| Quarter 2 | 6.00% | 3.09 | % | 3.45 | % | 6.67 | % | |||||||
| Quarter 3 | 6.00% | 2.97 | % | 3.36 | % | 6.03 | % | |||||||
| Quarter 4 | 6.00% | 3.06 | % | 3.59 | % | 6.34 | % | |||||||
| 1994: Quarter 1 | 6.25% | 3.56 | % | 4.50 | % | 6.77 | % | |||||||
| Quarter 2 | 7.25% | 4.26 | % | 5.51 | % | 7.34 | % | |||||||
| Quarter 3 | 7.75% | 4.80 | % | 5.96 | % | 7.62 | % | |||||||
| Quarter 4 | 8.50% | 5.68 | % | 7.20 | % | 7.84 | % | |||||||
| Quarter 2 | 9.00% | 5.60 | % | 5.65 | % | 6.21 | % | |||||||
| Quarter 3 | 8.75% | 5.40 | % | 5.65 | % | 6.17 | % | |||||||
| Quarter 4 | 8.50% | 5.10 | % | 5.18 | % | 5.58 | % | |||||||
| 1996: Quarter 1 | 8.25% | 5.13 | % | 5.41 | % | 6.34 | % | |||||||
| Quarter 2 | 8.25% | 5.18 | % | 5.70 | % | 6.73 | % | |||||||
| Quarter 3 | 8.25% | 5.14 | % | 5.71 | % | 6.72 | % | |||||||
| Quarter 4 | 8.25% | 5.21 | % | 5.51 | % | 6.43 | % | |||||||
| 1997: Quarter 1 | 8.50% | 5.35 | % | 6.02 | % | 6.92 | % | |||||||
| Quarter 2 | 8.50% | 5.25 | % | 5.67 | % | 6.51 | % | |||||||
| Quarter 3 | 8.50% | 5.06 | % | 5.47 | % | 6.12 | % | |||||||
| Quarter 4 | 8.50% | 5.36 | % | 5.51 | % | 5.75 | % | |||||||
| Quarter 2 | 8.50% | 5.10 | % | 5.38 | % | 5.44 | % | |||||||
| Quarter 3 | 8.25% | 4.37 | % | 4.41 | % | 4.44 | % | |||||||
| Quarter 4 | 7.75% | 4.48 | % | 4.53 | % | 4.65 | % | |||||||
| 1999: Quarter 1 | 7.75% | 4.49 | % | 4.72 | % | 5.25 | % | |||||||
| Quarter 2 | 7.75% | 4.78 | % | 5.07 | % | 5.81 | % | |||||||
| Quarter 3 | 8.25% | 4.88 | % | 5.22 | % | 5.90 | % | |||||||
| Quarter 4 | 8.50% | 5.33 | % | 5.98 | % | 6.45 | % | |||||||
EXHIBIT III-1
General Characteristics of Publicly-Traded Bank and Thrift Institutions
Exhibit III-1
Characteristics of Publicly-Traded Thrifts
February 2, 2026
| As of February 2, 2026 |
||||||||||||||||||||||||||
| Ticker |
Financial Institution |
Exchange |
Region |
City |
State |
Total Assets | Offices | Stock Price |
Market Value |
|||||||||||||||||
| ($Mil) | ($) | ($Mil) | ||||||||||||||||||||||||
| SRCE |
1st Source Corporation | NASDAQGS | MW | South Bend | IN | $ | 9,055 | 82 | $ | 68.47 | $ | 1,669 | ||||||||||||||
| ACNB |
ACNB Corporation | NASDAQCM | MA | Gettysburg | PA | $ | 3,228 | 33 | $ | 51.49 | $ | 534 | ||||||||||||||
| AFBI |
Affinity Bancshares, Inc. | NASDAQCM | SE | Covington | GA | $ | 882 | 2 | $ | 20.33 | $ | 124 | ||||||||||||||
| ALRS |
Alerus Financial Corporation | NASDAQCM | MW | Grand Forks | ND | $ | 5,230 | 26 | $ | 25.06 | $ | 637 | ||||||||||||||
| AMAL |
Amalgamated Financial Corp. | NASDAQGM | MA | New York | NY | $ | 8,870 | 6 | $ | 40.19 | $ | 1,198 | ||||||||||||||
| AMTB |
Amerant Bancorp Inc. | NYSE | SE | Coral Gables | FL | $ | 9,777 | 23 | $ | 21.89 | $ | 888 | ||||||||||||||
| ABCB |
Ameris Bancorp | NYSE | SE | Atlanta | GA | $ | 27,516 | 173 | $ | 79.89 | $ | 5,413 | ||||||||||||||
| ASRV |
AmeriServ Financial, Inc. | NASDAQGM | MA | Johnstown | PA | $ | 1,454 | 17 | $ | 3.55 | $ | 59 | ||||||||||||||
| ATLO |
Ames National Corporation | NASDAQCM | MW | Ames | IA | $ | 2,134 | 19 | $ | 26.79 | $ | 238 | ||||||||||||||
| AROW |
Arrow Financial Corporation | NASDAQGS | MA | Glens Falls | NY | $ | 4,446 | 38 | $ | 34.63 | $ | 570 | ||||||||||||||
| ASB |
Associated Banc-Corp | NYSE | MW | Green Bay | WI | $ | 45,203 | 188 | $ | 27.80 | $ | 4,547 | ||||||||||||||
| AUB |
Atlantic Union Bankshares Corporation | NYSE | SE | Glen Allen | VA | $ | 37,586 | 184 | $ | 39.57 | $ | 5,610 | ||||||||||||||
| AUBN |
Auburn National Bancorporation, Inc. | NASDAQGM | SE | Auburn | AL | $ | 1,019 | 8 | $ | 24.51 | $ | 86 | ||||||||||||||
| AVBH |
Avidbank Holdings, Inc. | NASDAQGS | WE | San Jose | CA | $ | 2,570 | 3 | $ | 30.01 | $ | 329 | ||||||||||||||
| AVBC |
Avidia Bancorp, Inc. | NYSE | NE | Hudson | MA | $ | 2,837 | 10 | $ | 18.73 | $ | 376 | ||||||||||||||
| AX |
Axos Financial, Inc. | NYSE | WE | Las Vegas | NV | $ | 28,201 | 2 | $ | 98.42 | $ | 5,578 | ||||||||||||||
| BANC |
Banc of California, Inc. | NYSE | WE | Los Angeles | CA | $ | 34,797 | 81 | $ | 20.38 | $ | 3,074 | ||||||||||||||
| BANF |
BancFirst Corporation | NASDAQGS | SW | Oklahoma City | OK | $ | 14,839 | 127 | $ | 112.10 | $ | 3,760 | ||||||||||||||
| BFC |
Bank First Corporation | NASDAQCM | MW | Manitowoc | WI | $ | 4,506 | 39 | $ | 144.96 | $ | 1,626 | ||||||||||||||
| BAC |
Bank of America Corporation | NYSE | SE | Charlotte | NC | $ | 3,410,394 | 3,597 | $ | 54.03 | $ | 389,689 | ||||||||||||||
| BOH |
Bank of Hawaii Corporation | NYSE | WE | Honolulu | HI | $ | 24,176 | 51 | $ | 75.44 | $ | 3,001 | ||||||||||||||
| BMRC |
Bank of Marin Bancorp | NASDAQGS | WE | Novato | CA | $ | 3,905 | 28 | $ | 27.41 | $ | 437 | ||||||||||||||
| BOTJ |
Bank of the James Financial Group, Inc. | NASDAQCM | SE | Lynchburg | VA | $ | 1,020 | 20 | $ | 20.00 | $ | 91 | ||||||||||||||
| OZK |
Bank OZK | NASDAQGS | SE | Little Rock | AR | $ | 40,786 | 252 | $ | 48.44 | $ | 5,347 | ||||||||||||||
| BSVN |
Bank7 Corp. | NASDAQGS | SW | Oklahoma City | OK | $ | 1,964 | 12 | $ | 45.33 | $ | 429 | ||||||||||||||
| BKU |
BankUnited, Inc. | NYSE | SE | Miami Lakes | FL | $ | 35,039 | 55 | $ | 47.97 | $ | 3,556 | ||||||||||||||
| BWFG |
Bankwell Financial Group, Inc. | NASDAQGM | NE | New Canaan | CT | $ | 3,360 | 10 | $ | 48.95 | $ | 378 | ||||||||||||||
| BANR |
Banner Corporation | NASDAQGS | WE | Walla Walla | WA | $ | 16,354 | 137 | $ | 63.09 | $ | 2,151 | ||||||||||||||
| BHB |
Bar Harbor Bankshares | NYSEAM | NE | Bar Harbor | ME | $ | 4,684 | 64 | $ | 34.60 | $ | 578 | ||||||||||||||
| BCML |
BayCom Corp | NASDAQGS | WE | Walnut Creek | CA | $ | 2,594 | 34 | $ | 29.39 | $ | 318 | ||||||||||||||
| BAFN |
BayFirst Financial Corp. | NASDAQCM | SE | Saint Petersburg | FL | $ | 1,300 | 12 | $ | 6.68 | $ | 27 | ||||||||||||||
| BCBP |
BCB Bancorp, Inc. | NASDAQGM | MA | Bayonne | NJ | $ | 3,279 | 27 | $ | 8.25 | $ | 142 | ||||||||||||||
| BBT |
Beacon Financial Corporation | NYSE | NE | Boston | MA | $ | 23,220 | 150 | $ | 29.00 | $ | 2,437 | ||||||||||||||
| BRBS |
Blue Ridge Bankshares, Inc. | NYSEAM | SE | Richmond | VA | $ | 2,433 | 30 | $ | 4.29 | $ | 378 | ||||||||||||||
| BOKF |
BOK Financial Corporation | NASDAQGS | SW | Tulsa | OK | $ | 52,238 | 115 | $ | 130.30 | $ | 7,899 | ||||||||||||||
| BWB |
Bridgewater Bancshares, Inc. | NASDAQCM | MW | Saint Louis Park | MN | $ | 5,407 | 9 | $ | 19.63 | $ | 545 | ||||||||||||||
| BYFC |
Broadway Financial Corporation | NASDAQCM | WE | Los Angeles | CA | $ | 1,248 | 4 | $ | 8.39 | $ | 51 | ||||||||||||||
| BHRB |
Burke & Herbert Financial Services Corp. | NASDAQCM | SE | Alexandria | VA | $ | 7,921 | 80 | $ | 66.89 | $ | 1,005 | ||||||||||||||
| BFST |
Business First Bancshares, Inc. | NASDAQGS | SW | Baton Rouge | LA | $ | 8,215 | 62 | $ | 28.83 | $ | 943 | ||||||||||||||
| BVFL |
BV Financial, Inc. | NASDAQCM | MA | Baltimore | MD | $ | 912 | 12 | $ | 19.72 | $ | 189 | ||||||||||||||
| BY |
Byline Bancorp, Inc. | NYSE | MW | Chicago | IL | $ | 9,653 | 49 | $ | 32.76 | $ | 1,492 | ||||||||||||||
| CFFI |
C&F Financial Corporation | NASDAQGS | SE | Toano | VA | $ | 2,768 | 31 | $ | 76.80 | $ | 249 | ||||||||||||||
| BCAL |
California BanCorp | NASDAQCM | WE | San Diego | CA | $ | 4,033 | 14 | $ | 18.32 | $ | 594 | ||||||||||||||
| CAC |
Camden National Corporation | NASDAQGS | NE | Camden | ME | $ | 6,975 | 72 | $ | 49.15 | $ | 832 | ||||||||||||||
| CBNK |
Capital Bancorp, Inc. | NASDAQGS | MA | Rockville | MD | $ | 3,606 | 8 | $ | 31.71 | $ | 524 | ||||||||||||||
| CCBG |
Capital City Bank Group, Inc. | NASDAQGS | SE | Tallahassee | FL | $ | 4,386 | 67 | $ | 42.53 | $ | 726 | ||||||||||||||
| COF |
Capital One Financial Corporation | NYSE | SE | McLean | VA | $ | 669,009 | 261 | $ | 223.68 | $ | 139,822 | ||||||||||||||
| CFFN |
Capitol Federal Financial, Inc. | NASDAQGS | MW | Topeka | KS | $ | 9,778 | 47 | $ | 7.54 | $ | 959 | ||||||||||||||
| CARE |
Carter Bankshares, Inc. | NASDAQGS | SE | Martinsville | VA | $ | 4,852 | 67 | $ | 21.85 | $ | 483 | ||||||||||||||
| CLST |
Catalyst Bancorp, Inc. | NASDAQCM | SW | Opelousas | LA | $ | 283 | 6 | $ | 15.55 | $ | 65 | ||||||||||||||
| CATY |
Cathay General Bancorp | NASDAQGS | WE | Los Angeles | CA | $ | 24,230 | 62 | $ | 52.57 | $ | 3,533 | ||||||||||||||
| CBFV |
CB Financial Services, Inc. | NASDAQGM | MA | Carmichaels | PA | $ | 1,548 | 15 | $ | 36.41 | $ | 183 | ||||||||||||||
| CBC |
Central Bancompany, Inc. | NASDAQGS | MW | Jefferson City | MO | $ | 20,752 | 175 | $ | 24.90 | $ | 5,937 | ||||||||||||||
| CPF |
Central Pacific Financial Corp. | NYSE | WE | Honolulu | HI | $ | 7,409 | 27 | $ | 32.98 | $ | 885 | ||||||||||||||
| CPBI |
Central Plains Bancshares, Inc. | NASDAQCM | MW | Grand Island | NE | $ | 510 | 9 | $ | 17.62 | $ | 69 | ||||||||||||||
| CFBK |
CF Bankshares Inc. | NASDAQCM | MW | Columbus | OH | $ | 2,111 | 8 | $ | 30.58 | $ | 195 | ||||||||||||||
| CBNA |
Chain Bridge Bancorp, Inc. | NYSE | SE | McLean | VA | $ | 1,750 | 1 | $ | 37.04 | $ | 122 | ||||||||||||||
| CHMG |
Chemung Financial Corporation | NASDAQGS | MA | Elmira | NY | $ | 2,710 | 30 | $ | 61.76 | $ | 296 | ||||||||||||||
| COFS |
ChoiceOne Financial Services, Inc. | NASDAQCM | MW | Sparta | MI | $ | 4,411 | 53 | $ | 29.65 | $ | 445 | ||||||||||||||
| C |
Citigroup Inc. | NYSE | MA | New York | NY | $ | 2,657,202 | 669 | $ | 116.23 | $ | 203,112 | ||||||||||||||
| CZNC |
Citizens & Northern Corporation | NASDAQCM | MA | Wellsboro | PA | $ | 3,132 | 36 | $ | 22.70 | $ | 405 | ||||||||||||||
| CZWI |
Citizens Community Bancorp, Inc. | NASDAQGM | MW | Eau Claire | WI | $ | 1,782 | 21 | $ | 18.53 | $ | 178 | ||||||||||||||
| CFG |
Citizens Financial Group, Inc. | NYSE | NE | Providence | RI | $ | 226,351 | 977 | $ | 64.86 | $ | 27,841 | ||||||||||||||
| CZFS |
Citizens Financial Services, Inc. | NASDAQCM | MA | Mansfield | PA | $ | 3,065 | 43 | $ | 65.36 | $ | 314 | ||||||||||||||
| CHCO |
City Holding Company | NASDAQGS | SE | Charleston | WV | $ | 6,722 | 97 | $ | 125.24 | $ | 1,798 | ||||||||||||||
| CIVB |
Civista Bancshares, Inc. | NASDAQCM | MW | Sandusky | OH | $ | 4,336 | 44 | $ | 24.62 | $ | 511 | ||||||||||||||
| CCNE |
CNB Financial Corporation | NASDAQGS | MA | Clearfield | PA | $ | 8,396 | 81 | $ | 28.29 | $ | 827 | ||||||||||||||
Exhibit III-1
Characteristics of Publicly-Traded Thrifts
February 2, 2026
| As of February 2, 2026 |
||||||||||||||||||||||||||
| Ticker |
Financial Institution |
Exchange |
Region |
City |
State |
Total Assets |
Offices | Stock Price | Market Value |
|||||||||||||||||
| ($Mil) | ($) | ($Mil) | ||||||||||||||||||||||||
| CCB |
Coastal Financial Corporation | NASDAQGS | WE | Everett | WA | $ | 4,741 | 15 | $ | 98.41 | $ | 1,490 | ||||||||||||||
| COSO |
CoastalSouth Bancshares, Inc. | NYSE | SE | Atlanta | GA | $ | 2,307 | 11 | $ | 24.58 | $ | 257 | ||||||||||||||
| CBAN |
Colony Bankcorp, Inc. | NYSE | SE | Fitzgerald | GA | $ | 3,735 | 37 | $ | 20.11 | $ | 427 | ||||||||||||||
| COLB |
Columbia Banking System, Inc. | NASDAQGS | WE | Tacoma | WA | $ | 66,832 | 362 | $ | 29.69 | $ | 8,771 | ||||||||||||||
| CBSH |
Commerce Bancshares, Inc. | NASDAQGS | MW | Kansas City | MO | $ | 32,915 | 152 | $ | 53.23 | $ | 7,844 | ||||||||||||||
| CBK |
Commercial Bancgroup, Inc. | NASDAQCM | SE | Harrogate | TN | $ | 2,291 | 36 | $ | 26.94 | $ | 369 | ||||||||||||||
| CMTV |
Community Bancorp | NASDAQCM | NE | Derby | VT | $ | 1,288 | 13 | $ | 31.20 | $ | 174 | ||||||||||||||
| CBU |
Community Financial System, Inc. | NYSE | MA | Dewitt | NY | $ | 17,303 | 201 | $ | 63.76 | $ | 3,359 | ||||||||||||||
| CTBI |
Community Trust Bancorp, Inc. | NASDAQGS | MW | Pikeville | KY | $ | 6,684 | 83 | $ | 62.83 | $ | 1,138 | ||||||||||||||
| CWBC |
Community West Bancshares | NASDAQCM | WE | Fresno | CA | $ | 3,690 | 28 | $ | 24.84 | $ | 476 | ||||||||||||||
| CNOB |
ConnectOne Bancorp, Inc. | NASDAQGS | MA | Englewood Cliffs | NJ | $ | 14,003 | 60 | $ | 27.31 | $ | 1,370 | ||||||||||||||
| CFR |
Cullen/Frost Bankers, Inc. | NYSE | SW | San Antonio | TX | $ | 53,041 | 218 | $ | 139.06 | $ | 8,892 | ||||||||||||||
| CUBI |
Customers Bancorp, Inc. | NYSE | MA | West Reading | PA | $ | 24,896 | 19 | $ | 79.58 | $ | 2,721 | ||||||||||||||
| CVBF |
CVB Financial Corp. | NASDAQGS | WE | Ontario | CA | $ | 15,631 | 65 | $ | 20.12 | $ | 2,727 | ||||||||||||||
| DCOM |
Dime Community Bancshares, Inc. | NASDAQGS | MA | Hauppauge | NY | $ | 15,342 | 64 | $ | 35.36 | $ | 1,551 | ||||||||||||||
| EBMT |
Eagle Bancorp Montana, Inc. | NASDAQGM | WE | Helena | MT | $ | 2,106 | 30 | $ | 22.44 | $ | 175 | ||||||||||||||
| EGBN |
Eagle Bancorp, Inc. | NASDAQCM | MA | Bethesda | MD | $ | 10,497 | 13 | $ | 27.27 | $ | 828 | ||||||||||||||
| EFSI |
Eagle Financial Services, Inc. | NASDAQCM | SE | Berryville | VA | $ | 1,889 | 16 | $ | 38.22 | $ | 203 | ||||||||||||||
| EWBC |
East West Bancorp, Inc. | NASDAQGS | WE | Pasadena | CA | $ | 80,435 | 98 | $ | 114.63 | $ | 15,771 | ||||||||||||||
| EBC |
Eastern Bankshares, Inc. | NASDAQGS | NE | Boston | MA | $ | 30,587 | 142 | $ | 21.20 | $ | 4,784 | ||||||||||||||
| ECBK |
ECB Bancorp, Inc. | NASDAQCM | NE | Everett | MA | $ | 1,553 | 3 | $ | 17.94 | $ | 158 | ||||||||||||||
| EFSC |
Enterprise Financial Services Corp | NASDAQGS | MW | Clayton | MO | $ | 17,301 | 56 | $ | 58.71 | $ | 2,170 | ||||||||||||||
| EQBK |
Equity Bancshares, Inc. | NYSE | MW | Wichita | KS | $ | 6,373 | 87 | $ | 47.13 | $ | 893 | ||||||||||||||
| ESQ |
Esquire Financial Holdings, Inc. | NASDAQCM | MA | Jericho | NY | $ | 2,366 | 4 | $ | 110.48 | $ | 895 | ||||||||||||||
| FNB |
F.N.B. Corporation | NYSE | MA | Pittsburgh | PA | $ | 50,229 | 357 | $ | 17.84 | $ | 6,374 | ||||||||||||||
| FMAO |
Farmers & Merchants Bancorp, Inc. | NASDAQCM | MW | Archbold | OH | $ | 3,391 | 43 | $ | 27.69 | $ | 376 | ||||||||||||||
| FMNB |
Farmers National Banc Corp. | NASDAQCM | MW | Canfield | OH | $ | 5,246 | 62 | $ | 13.02 | $ | 490 | ||||||||||||||
| FBLA |
FB Bancorp, Inc. | NASDAQCM | SW | New Orleans | LA | $ | 1,264 | 20 | $ | 13.14 | $ | 241 | ||||||||||||||
| FBK |
FB Financial Corporation | NYSE | SE | Nashville | TN | $ | 16,300 | 99 | $ | 58.76 | $ | 3,041 | ||||||||||||||
| FDBC |
Fidelity D & D Bancorp, Inc. | NASDAQGM | MA | Dunmore | PA | $ | 2,748 | 23 | $ | 46.50 | $ | 268 | ||||||||||||||
| FDSB |
Fifth District Bancorp, Inc. | NASDAQCM | SW | New Orleans | LA | $ | 540 | 7 | $ | 15.18 | $ | 84 | ||||||||||||||
| FITB |
Fifth Third Bancorp | NASDAQGS | MW | Cincinnati | OH | $ | 214,376 | 1,494 | $ | 51.95 | $ | 34,349 | ||||||||||||||
| FISI |
Financial Institutions, Inc. | NASDAQGS | MA | Warsaw | NY | $ | 6,274 | 50 | $ | 33.95 | $ | 672 | ||||||||||||||
| FNWD |
Finward Bancorp | NASDAQCM | MW | Munster | IN | $ | 2,021 | 26 | $ | 37.02 | $ | 160 | ||||||||||||||
| FINW |
FinWise Bancorp | NASDAQGM | SW | Murray | UT | $ | 977 | 2 | $ | 18.86 | $ | 258 | ||||||||||||||
| FBNC |
First Bancorp | NASDAQGS | SE | Southern Pines | NC | $ | 12,668 | 114 | $ | 58.68 | $ | 2,433 | ||||||||||||||
| FBP |
First BanCorp. | NYSE | MA | San Juan | PR | $ | 19,133 | 75 | $ | 22.49 | $ | 3,499 | ||||||||||||||
| FRBA |
First Bank | NASDAQGM | MA | Hamilton | NJ | $ | 3,958 | 26 | $ | 16.76 | $ | 416 | ||||||||||||||
| BUSE |
First Busey Corporation | NASDAQGS | MW | Leawood | KS | $ | 18,105 | 79 | $ | 25.44 | $ | 2,229 | ||||||||||||||
| FCAP |
First Capital, Inc. | NASDAQCM | MW | Corydon | IN | $ | 1,272 | 17 | $ | 57.96 | $ | 194 | ||||||||||||||
| FCNC.A |
First Citizens BancShares, Inc. | NASDAQGS | SE | Raleigh | NC | $ | 229,698 | 523 | $ | 2,097.35 | $ | 23,176 | ||||||||||||||
| FCF |
First Commonwealth Financial Corporation | NYSE | MA | Indiana | PA | $ | 12,343 | 129 | $ | 18.27 | $ | 1,873 | ||||||||||||||
| FCBC |
First Community Bankshares, Inc. | NASDAQGS | SE | Bluefield | VA | $ | 3,260 | 65 | $ | 37.84 | $ | 694 | ||||||||||||||
| FCCO |
First Community Corporation | NASDAQCM | SE | Lexington | SC | $ | 2,058 | 24 | $ | 30.21 | $ | 232 | ||||||||||||||
| FFBC |
First Financial Bancorp. | NASDAQGS | MW | Cincinnati | OH | $ | 21,129 | 158 | $ | 29.17 | $ | 2,874 | ||||||||||||||
| FFIN |
First Financial Bankshares, Inc. | NASDAQGS | SW | Abilene | TX | $ | 15,446 | 82 | $ | 32.41 | $ | 4,611 | ||||||||||||||
| THFF |
First Financial Corporation | NASDAQGS | MW | Terre Haute | IN | $ | 5,670 | 80 | $ | 65.89 | $ | 781 | ||||||||||||||
| FGBI |
First Guaranty Bancshares, Inc. | NASDAQGM | SW | Hammond | LA | $ | 4,078 | 30 | $ | 9.26 | $ | 146 | ||||||||||||||
| FHB |
First Hawaiian, Inc. | NASDAQGS | WE | Honolulu | HI | $ | 23,955 | 49 | $ | 26.38 | $ | 3,237 | ||||||||||||||
| FHN |
First Horizon Corporation | NYSE | SE | Memphis | TN | $ | 83,876 | 412 | $ | 24.82 | $ | 12,038 | ||||||||||||||
| INBK |
First Internet Bancorp | NASDAQGS | MW | Fishers | IN | $ | 5,572 | 1 | $ | 23.00 | $ | 200 | ||||||||||||||
| FIBK |
First Interstate BancSystem, Inc. | NASDAQGS | WE | Billings | MT | $ | 26,641 | 291 | $ | 36.81 | $ | 3,722 | ||||||||||||||
| FRME |
First Merchants Corporation | NASDAQGS | MW | Muncie | IN | $ | 19,025 | 133 | $ | 40.89 | $ | 2,329 | ||||||||||||||
| FMBH |
First Mid Bancshares, Inc. | NASDAQGM | MW | Mattoon | IL | $ | 7,967 | 74 | $ | 43.58 | $ | 1,045 | ||||||||||||||
| FXNC |
First National Corporation | NASDAQCM | SE | Strasburg | VA | $ | 2,039 | 36 | $ | 27.01 | $ | 244 | ||||||||||||||
| FNWB |
First Northwest Bancorp | NASDAQGM | WE | Port Angeles | WA | $ | 2,108 | 15 | $ | 10.78 | $ | 95 | ||||||||||||||
| FSEA |
First Seacoast Bancorp, Inc. | NASDAQCM | NE | Dover | NH | $ | 610 | 5 | $ | 13.07 | $ | 57 | ||||||||||||||
| FUNC |
First United Corporation | NASDAQGS | MA | Oakland | MD | $ | 2,024 | 22 | $ | 39.56 | $ | 257 | ||||||||||||||
| FUSB |
First US Bancshares, Inc. | NASDAQCM | SE | Birmingham | AL | $ | 1,155 | 15 | $ | 15.94 | $ | 91 | ||||||||||||||
| MYFW |
First Western Financial, Inc. | NASDAQGS | SW | Denver | CO | $ | 3,155 | 15 | $ | 25.60 | $ | 249 | ||||||||||||||
| FSBC |
Five Star Bancorp | NASDAQGS | WE | Rancho Cordova | CA | $ | 4,755 | 11 | $ | 40.14 | $ | 858 | ||||||||||||||
| FLG |
Flagstar Bank, National Association | NYSE | MA | Hicksville | NY | $ | 87,512 | 340 | $ | 13.50 | $ | 5,616 | ||||||||||||||
| FRAF |
Franklin Financial Services Corporation | NASDAQCM | MA | Chambersburg | PA | $ | 2,239 | 24 | $ | 51.59 | $ | 228 | ||||||||||||||
| FSBW |
FS Bancorp, Inc. | NASDAQCM | WE | Mountlake Terrace | WA | $ | 3,197 | 38 | $ | 42.73 | $ | 316 | ||||||||||||||
| FULT |
Fulton Financial Corporation | NASDAQGS | MA | Lancaster | PA | $ | 32,118 | 209 | $ | 21.03 | $ | 3,783 | ||||||||||||||
| FVCB |
FVCBankcorp, Inc. | NASDAQCM | SE | Fairfax | VA | $ | 2,292 | 9 | $ | 15.51 | $ | 278 | ||||||||||||||
| GBFH |
GBank Financial Holdings Inc. | NASDAQCM | WE | Las Vegas | NV | $ | 1,359 | 2 | $ | 32.99 | $ | 475 | ||||||||||||||
Exhibit III-1
Characteristics of Publicly-Traded Thrifts
February 2, 2026
| As of February 2, 2026 |
||||||||||||||||||||||||||
| Ticker |
Financial Institution |
Exchange |
Region |
City |
State |
Total Assets | Offices | Stock Price |
Market Value |
|||||||||||||||||
| ($Mil) | ($) | ($Mil) | ||||||||||||||||||||||||
| GABC |
German American Bancorp, Inc. | NASDAQGS | MW | Jasper | IN | $ | 8,389 | 96 | $ | 43.20 | $ | 1,620 | ||||||||||||||
| GBCI |
Glacier Bancorp, Inc. | NYSE | WE | Kalispell | MT | $ | 31,978 | 255 | $ | 50.71 | $ | 6,591 | ||||||||||||||
| GSBC |
Great Southern Bancorp, Inc. | NASDAQGS | MW | Springfield | MO | $ | 5,599 | 98 | $ | 62.41 | $ | 690 | ||||||||||||||
| HWC |
Hancock Whitney Corporation | NASDAQGS | SE | Gulfport | MS | $ | 35,473 | 184 | $ | 69.74 | $ | 5,737 | ||||||||||||||
| HAFC |
Hanmi Financial Corporation | NASDAQGS | WE | Los Angeles | CA | $ | 7,869 | 39 | $ | 27.44 | $ | 813 | ||||||||||||||
| HNVR |
Hanover Bancorp, Inc. | NASDAQGS | MA | Mineola | NY | $ | 2,383 | 10 | $ | 23.41 | $ | 173 | ||||||||||||||
| HWBK |
Hawthorn Bancshares, Inc. | NASDAQGS | MW | Jefferson City | MO | $ | 1,895 | 18 | $ | 34.91 | $ | 241 | ||||||||||||||
| HBT |
HBT Financial, Inc. | NASDAQGS | MW | Bloomington | IL | $ | 5,071 | 70 | $ | 27.92 | $ | 878 | ||||||||||||||
| HFWA |
Heritage Financial Corporation | NASDAQGS | WE | Olympia | WA | $ | 6,967 | 67 | $ | 26.45 | $ | 1,088 | ||||||||||||||
| HTH |
Hilltop Holdings Inc. | NYSE | SW | Dallas | TX | $ | 15,845 | 55 | $ | 37.96 | $ | 2,260 | ||||||||||||||
| HIFS |
Hingham Institution for Savings | NASDAQGM | NE | Hingham | MA | $ | 4,543 | 9 | $ | 303.99 | $ | 663 | ||||||||||||||
| HBCP |
Home Bancorp, Inc. | NASDAQGS | SW | Lafayette | LA | $ | 3,493 | 42 | $ | 61.03 | $ | 478 | ||||||||||||||
| HOMB |
Home Bancshares, Inc. (Conway, AR) | NYSE | SE | Conway | AR | $ | 22,882 | 224 | $ | 29.21 | $ | 5,736 | ||||||||||||||
| HFBL |
Home Federal Bancorp, Inc. of Louisiana | NASDAQCM | SW | Shreveport | LA | $ | 621 | 11 | $ | 18.23 | $ | 55 | ||||||||||||||
| HTB |
HomeTrust Bancshares, Inc. | NYSE | SE | Asheville | NC | $ | 4,546 | 33 | $ | 44.19 | $ | 757 | ||||||||||||||
| HOPE |
Hope Bancorp, Inc. | NASDAQGS | WE | Los Angeles | CA | $ | 18,532 | 75 | $ | 12.21 | $ | 1,565 | ||||||||||||||
| HBNC |
Horizon Bancorp, Inc. | NASDAQGS | MW | Michigan City | IN | $ | 6,437 | 71 | $ | 17.96 | $ | 916 | ||||||||||||||
| HYNE |
Hoyne Bancorp, Inc. | NASDAQCM | MW | Oak Park | IL | $ | 455 | — | $ | 14.47 | $ | 117 | ||||||||||||||
| HBAN |
Huntington Bancshares Incorporated | NASDAQGS | MW | Columbus | OH | $ | 225,106 | 1,451 | $ | 17.88 | $ | 28,031 | ||||||||||||||
| INDB |
Independent Bank Corp. | NASDAQGS | NE | Rockland | MA | $ | 24,913 | 152 | $ | 82.09 | $ | 4,042 | ||||||||||||||
| IBCP |
Independent Bank Corporation | NASDAQGS | MW | Grand Rapids | MI | $ | 5,506 | 59 | $ | 36.34 | $ | 747 | ||||||||||||||
| IBOC |
International Bancshares Corporation | NASDAQGS | SW | Laredo | TX | $ | 16,551 | 175 | $ | 71.89 | $ | 4,469 | ||||||||||||||
| ISTR |
Investar Holding Corporation | NASDAQGM | SW | Baton Rouge | LA | $ | 2,833 | 37 | $ | 29.44 | $ | 405 | ||||||||||||||
| ISBA |
Isabella Bank Corporation | NASDAQCM | MW | Mount Pleasant | MI | $ | 2,260 | 31 | $ | 49.73 | $ | 365 | ||||||||||||||
| JMSB |
John Marshall Bancorp, Inc. | NASDAQCM | SE | Reston | VA | $ | 2,333 | 8 | $ | 20.93 | $ | 296 | ||||||||||||||
| JPM |
JPMorgan Chase & Co. | NYSE | MA | New York | NY | $ | 4,424,900 | 5,068 | $ | 308.14 | $ | 830,807 | ||||||||||||||
| KRNY |
Kearny Financial Corp. | NASDAQGS | MA | Fairfield | NJ | $ | 7,621 | 41 | $ | 8.07 | $ | 507 | ||||||||||||||
| KEY |
KeyCorp | NYSE | MW | Cleveland | OH | $ | 184,381 | 952 | $ | 22.00 | $ | 24,253 | ||||||||||||||
| LSBK |
Lake Shore Bancorp, Inc. | NASDAQGM | MA | Dunkirk | NY | $ | 727 | 11 | $ | 15.50 | $ | 113 | ||||||||||||||
| LKFN |
Lakeland Financial Corporation | NASDAQGS | MW | Warsaw | IN | $ | 6,990 | 56 | $ | 60.76 | $ | 1,532 | ||||||||||||||
| LARK |
Landmark Bancorp, Inc. | NASDAQGM | MW | Manhattan | KS | $ | 1,607 | 29 | $ | 27.82 | $ | 169 | ||||||||||||||
| LCNB |
LCNB Corp. | NASDAQCM | MW | Lebanon | OH | $ | 2,241 | 35 | $ | 17.56 | $ | 249 | ||||||||||||||
| LC |
LendingClub Corporation | NYSE | WE | San Francisco | CA | $ | 11,568 | 3 | $ | 16.86 | $ | 1,945 | ||||||||||||||
| LOB |
Live Oak Bancshares, Inc. | NYSE | SE | Wilmington | NC | $ | 15,135 | 1 | $ | 41.15 | $ | 1,894 | ||||||||||||||
| MTB |
M&T Bank Corporation | NYSE | MA | Buffalo | NY | $ | 213,510 | 998 | $ | 225.54 | $ | 34,246 | ||||||||||||||
| MGYR |
Magyar Bancorp, Inc. | NASDAQGM | MA | New Brunswick | NJ | $ | 1,045 | 7 | $ | 17.75 | $ | 116 | ||||||||||||||
| MNSB |
MainStreet Bancshares, Inc. | NASDAQCM | SE | Fairfax | VA | $ | 2,213 | 6 | $ | 22.38 | $ | 162 | ||||||||||||||
| MBBC |
Marathon Bancorp, Inc. | NASDAQCM | MW | Wausau | WI | $ | 246 | 5 | $ | 12.94 | $ | 38 | ||||||||||||||
| MCHB |
Mechanics Bancorp | NASDAQGS | WE | Walnut Creek | CA | $ | 22,351 | 168 | $ | 15.69 | $ | 3,455 | ||||||||||||||
| MBWM |
Mercantile Bank Corporation | NASDAQGS | MW | Grand Rapids | MI | $ | 6,835 | 54 | $ | 53.46 | $ | 919 | ||||||||||||||
| MBIN |
Merchants Bancorp | NASDAQCM | MW | Carmel | IN | $ | 19,449 | 7 | $ | 42.64 | $ | 1,957 | ||||||||||||||
| MRBK |
Meridian Corporation | NASDAQGS | MA | Malvern | PA | $ | 2,560 | 7 | $ | 19.26 | $ | 225 | ||||||||||||||
| MCBS |
MetroCity Bankshares, Inc. | NASDAQGS | SE | Doraville | GA | $ | 4,768 | 32 | $ | 29.26 | $ | 843 | ||||||||||||||
| MCB |
Metropolitan Bank Holding Corp. | NYSE | MA | New York | NY | $ | 8,256 | 8 | $ | 94.62 | $ | 955 | ||||||||||||||
| MPB |
Mid Penn Bancorp, Inc. | NASDAQGM | MA | Harrisburg | PA | $ | 6,134 | 63 | $ | 33.83 | $ | 780 | ||||||||||||||
| MSBI |
Midland States Bancorp, Inc. | NASDAQGS | MW | Effingham | IL | $ | 6,511 | 58 | $ | 23.25 | $ | 492 | ||||||||||||||
| MVBF |
MVB Financial Corp. | NASDAQCM | SE | Fairmont | WV | $ | 3,233 | 7 | $ | 29.40 | $ | 370 | ||||||||||||||
| NBHC |
National Bank Holdings Corporation | NYSE | SW | Greenwood Village | CO | $ | 9,884 | 103 | $ | 40.62 | $ | 1,534 | ||||||||||||||
| NKSH |
National Bankshares, Inc. | NASDAQCM | SE | Blacksburg | VA | $ | 1,825 | 29 | $ | 37.36 | $ | 238 | ||||||||||||||
| NBBK |
NB Bancorp, Inc. | NASDAQCM | NE | Needham | MA | $ | 7,006 | 19 | $ | 22.05 | $ | 809 | ||||||||||||||
| NBTB |
NBT Bancorp Inc. | NASDAQGS | MA | Norwich | NY | $ | 15,995 | 178 | $ | 45.41 | $ | 2,376 | ||||||||||||||
| NEWT |
NewtekOne, Inc. | NASDAQGM | SE | Boca Raton | FL | $ | 2,745 | 1 | $ | 13.44 | $ | 385 | ||||||||||||||
| NIC |
Nicolet Bankshares, Inc. | NYSE | MW | Green Bay | WI | $ | 9,185 | 59 | $ | 148.55 | $ | 2,179 | ||||||||||||||
| NBN |
Northeast Bank | NASDAQGM | NE | Portland | ME | $ | 4,947 | 9 | $ | 119.14 | $ | 1,019 | ||||||||||||||
| NECB |
Northeast Community Bancorp, Inc. | NASDAQCM | MA | White Plains | NY | $ | 2,064 | 12 | $ | 24.44 | $ | 343 | ||||||||||||||
| NTRS |
Northern Trust Corporation | NASDAQGS | MW | Chicago | IL | $ | 177,133 | 57 | $ | 151.62 | $ | 28,253 | ||||||||||||||
| NPB |
Northpointe Bancshares, Inc. | NYSE | MW | Grand Rapids | MI | $ | 7,023 | 1 | $ | 17.77 | $ | 542 | ||||||||||||||
| NRIM |
Northrim BanCorp, Inc. | NASDAQGS | WE | Anchorage | AK | $ | 3,290 | 20 | $ | 24.48 | $ | 541 | ||||||||||||||
| NWBI |
Northwest Bancshares, Inc. | NASDAQGS | MW | Columbus | OH | $ | 16,767 | 164 | $ | 13.04 | $ | 1,905 | ||||||||||||||
| NWFL |
Norwood Financial Corp. | NASDAQGM | MA | Honesdale | PA | $ | 2,425 | 34 | $ | 31.44 | $ | 291 | ||||||||||||||
| NSTS |
NSTS Bancorp, Inc. | NASDAQCM | MW | Waukegan | IL | $ | 270 | 3 | $ | 12.52 | $ | 61 | ||||||||||||||
| OVLY |
Oak Valley Bancorp | NASDAQCM | WE | Oakdale | CA | $ | 2,023 | 20 | $ | 32.31 | $ | 267 | ||||||||||||||
| OCFC |
OceanFirst Financial Corp. | NASDAQGS | MA | Toms River | NJ | $ | 14,564 | 50 | $ | 19.01 | $ | 1,091 | ||||||||||||||
| OFG |
OFG Bancorp | NYSE | MA | San Juan | PR | $ | 12,466 | 45 | $ | 40.73 | $ | 1,762 | ||||||||||||||
| OVBC |
Ohio Valley Banc Corp. | NASDAQGM | MW | Gallipolis | OH | $ | 1,583 | 19 | $ | 41.51 | $ | 196 | ||||||||||||||
| ONB |
Old National Bancorp | NASDAQGS | MW | Evansville | IN | $ | 72,152 | 355 | $ | 24.91 | $ | 9,706 | ||||||||||||||
| OSBC |
Old Second Bancorp, Inc. | NASDAQGS | MW | Aurora | IL | $ | 6,903 | 57 | $ | 20.24 | $ | 1,066 | ||||||||||||||
Exhibit III-1
Characteristics of Publicly-Traded Thrifts
February 2, 2026
| As of February 2, 2026 |
||||||||||||||||||||||||||
| Ticker |
Financial Institution |
Exchange |
Region |
City |
State |
Total Assets |
Offices | Stock Price |
Market Value |
|||||||||||||||||
| ($Mil) | ($) | ($Mil) | ||||||||||||||||||||||||
| OPBK |
OP Bancorp | NASDAQGM | WE | Los Angeles | CA | $ | 2,650 | 17 | $ | 14.50 | $ | 216 | ||||||||||||||
| OPHC |
OptimumBank Holdings, Inc. | NYSEAM | SE | Fort Lauderdale | FL | $ | 1,112 | 4 | $ | 4.86 | $ | 56 | ||||||||||||||
| OBT |
Orange County Bancorp, Inc. | NASDAQCM | MA | Middletown | NY | $ | 2,636 | 16 | $ | 31.85 | $ | 426 | ||||||||||||||
| OBK |
Origin Bancorp, Inc. | NYSE | SW | Ruston | LA | $ | 9,725 | 60 | $ | 44.18 | $ | 1,367 | ||||||||||||||
| ORRF |
Orrstown Financial Services, Inc. | NASDAQCM | MA | Harrisburg | PA | $ | 5,542 | 43 | $ | 37.46 | $ | 731 | ||||||||||||||
| PRK |
Park National Corporation | NYSEAM | MW | Newark | OH | $ | 9,805 | 110 | $ | 166.27 | $ | 2,673 | ||||||||||||||
| PKBK |
Parke Bancorp, Inc. | NASDAQCM | MA | Washington Township | NJ | $ | 2,249 | 7 | $ | 28.26 | $ | 328 | ||||||||||||||
| PBHC |
Pathfinder Bancorp, Inc. | NASDAQCM | MA | Oswego | NY | $ | 1,425 | 12 | $ | 13.68 | $ | 66 | ||||||||||||||
| CASH |
Pathward Financial, Inc. | NASDAQGS | MW | Sioux Falls | SD | $ | 7,560 | 1 | $ | 91.08 | $ | 2,019 | ||||||||||||||
| PNBK |
Patriot National Bancorp, Inc. | NASDAQGM | NE | Stamford | CT | $ | 951 | 8 | $ | 1.60 | $ | 184 | ||||||||||||||
| PCB |
PCB Bancorp | NASDAQGS | WE | Los Angeles | CA | $ | 3,282 | 15 | $ | 22.96 | $ | 324 | ||||||||||||||
| PGC |
Peapack-Gladstone Financial Corporation | NASDAQGS | MA | Bedminster | NJ | $ | 7,526 | 19 | $ | 33.01 | $ | 575 | ||||||||||||||
| PEBO |
Peoples Bancorp Inc. | NASDAQGS | MW | Marietta | OH | $ | 9,650 | 130 | $ | 32.59 | $ | 1,139 | ||||||||||||||
| PEBK |
Peoples Bancorp of North Carolina, Inc. | NASDAQGM | SE | Newton | NC | $ | 1,702 | 17 | $ | 36.98 | $ | 196 | ||||||||||||||
| PFIS |
Peoples Financial Services Corp. | NASDAQGS | MA | Moosic | PA | $ | 5,271 | 40 | $ | 53.87 | $ | 538 | ||||||||||||||
| PNFP |
Pinnacle Financial Partners, Inc. | NYSE | SE | Nashville | TN | $ | 57,706 | 400 | $ | 98.13 | $ | 14,773 | ||||||||||||||
| PLBC |
Plumas Bancorp | NASDAQCM | WE | Reno | NV | $ | 2,239 | 20 | $ | 51.96 | $ | 362 | ||||||||||||||
| PDLB |
Ponce Financial Group, Inc. | NASDAQGM | MA | Bronx | NY | $ | 3,224 | 15 | $ | 16.95 | $ | 386 | ||||||||||||||
| BPOP |
Popular, Inc. | NASDAQGS | MA | Hato Rey | PR | $ | 75,348 | 195 | $ | 136.69 | $ | 8,983 | ||||||||||||||
| PFBC |
Preferred Bank | NASDAQGS | WE | Los Angeles | CA | $ | 7,601 | 16 | $ | 87.54 | $ | 1,066 | ||||||||||||||
| FRST |
Primis Financial Corp. | NASDAQGM | SE | McLean | VA | $ | 4,047 | 28 | $ | 14.10 | $ | 347 | ||||||||||||||
| BPRN |
Princeton Bancorp, Inc. | NASDAQGS | MA | Princeton | NJ | $ | 2,283 | 35 | $ | 37.50 | $ | 254 | ||||||||||||||
| PB |
Prosperity Bancshares, Inc. | NYSE | SW | Houston | TX | $ | 38,463 | 339 | $ | 69.71 | $ | 6,800 | ||||||||||||||
| PROV |
Provident Financial Holdings, Inc. | NASDAQGS | WE | Riverside | CA | $ | 1,228 | 14 | $ | 16.14 | $ | 104 | ||||||||||||||
| PFS |
Provident Financial Services, Inc. | NYSE | MA | Jersey City | NJ | $ | 24,981 | 144 | $ | 22.70 | $ | 2,965 | ||||||||||||||
| QCRH |
QCR Holdings, Inc. | NASDAQGM | MW | Moline | IL | $ | 9,575 | 36 | $ | 92.35 | $ | 1,541 | ||||||||||||||
| RBB |
RBB Bancorp | NASDAQGS | WE | Los Angeles | CA | $ | 4,208 | 24 | $ | 21.34 | $ | 364 | ||||||||||||||
| RRBI |
Red River Bancshares, Inc. | NASDAQGS | SW | Alexandria | LA | $ | 3,351 | 30 | $ | 87.39 | $ | 575 | ||||||||||||||
| RF |
Regions Financial Corporation | NYSE | SE | Birmingham | AL | $ | 159,553 | 1,252 | $ | 29.12 | $ | 25,276 | ||||||||||||||
| RNST |
Renasant Corporation | NYSE | SE | Tupelo | MS | $ | 26,751 | 267 | $ | 37.82 | $ | 3,579 | ||||||||||||||
| RBCA.A |
Republic Bancorp, Inc. | NASDAQGS | MW | Louisville | KY | $ | 7,042 | 47 | $ | 73.42 | $ | 1,277 | ||||||||||||||
| RMBI |
Richmond Mutual Bancorporation, Inc. | NASDAQCM | MW | Richmond | IN | $ | 1,526 | 14 | $ | 14.30 | $ | 138 | ||||||||||||||
| RVSB |
Riverview Bancorp, Inc. | NASDAQGS | WE | Vancouver | WA | $ | 1,512 | 17 | $ | 5.40 | $ | 112 | ||||||||||||||
| STBA |
S&T Bancorp, Inc. | NASDAQGS | MA | Indiana | PA | $ | 9,871 | 73 | $ | 43.21 | $ | 1,616 | ||||||||||||||
| SBFG |
SB Financial Group, Inc. | NASDAQCM | MW | Defiance | OH | $ | 1,545 | 31 | $ | 22.52 | $ | 141 | ||||||||||||||
| SBCF |
Seacoast Banking Corporation of Florida | NASDAQGS | SE | Stuart | FL | $ | 20,842 | 105 | $ | 33.39 | $ | 3,234 | ||||||||||||||
| SFBS |
ServisFirst Bancshares, Inc. | NYSE | SE | Birmingham | AL | $ | 17,727 | 33 | $ | 84.33 | $ | 4,607 | ||||||||||||||
| SHBI |
Shore Bancshares, Inc. | NASDAQGS | MA | Easton | MD | $ | 6,259 | 45 | $ | 19.42 | $ | 649 | ||||||||||||||
| BSRR |
Sierra Bancorp | NASDAQGS | WE | Porterville | CA | $ | 3,829 | 36 | $ | 37.13 | $ | 486 | ||||||||||||||
| SFNC |
Simmons First National Corporation | NASDAQGS | SE | Pine Bluff | AR | $ | 24,541 | 233 | $ | 20.58 | $ | 2,979 | ||||||||||||||
| SMBK |
SmartFinancial, Inc. | NYSE | SE | Knoxville | TN | $ | 5,861 | 43 | $ | 41.88 | $ | 713 | ||||||||||||||
| SFBC |
Sound Financial Bancorp, Inc. | NASDAQCM | WE | Seattle | WA | $ | 1,092 | 10 | $ | 44.01 | $ | 112 | ||||||||||||||
| SPFI |
South Plains Financial, Inc. | NASDAQGS | SW | Lubbock | TX | $ | 4,481 | 27 | $ | 42.80 | $ | 697 | ||||||||||||||
| SFST |
Southern First Bancshares, Inc. | NASDAQGM | SE | Greenville | SC | $ | 4,403 | 12 | $ | 56.43 | $ | 462 | ||||||||||||||
| SMBC |
Southern Missouri Bancorp, Inc. | NASDAQGM | MW | Poplar Bluff | MO | $ | 5,094 | 68 | $ | 64.30 | $ | 716 | ||||||||||||||
| SBSI |
Southside Bancshares, Inc. | NYSE | SW | Tyler | TX | $ | 8,515 | 57 | $ | 33.10 | $ | 984 | ||||||||||||||
| SSB |
SouthState Bank Corporation | NYSE | SE | Winter Haven | FL | $ | 67,197 | 344 | $ | 102.97 | $ | 10,208 | ||||||||||||||
| SRBK |
SR Bancorp, Inc. | NASDAQCM | MA | Bound Brook | NJ | $ | 1,143 | 14 | $ | 17.17 | $ | 138 | ||||||||||||||
| STT |
State Street Corporation | NYSE | NE | Boston | MA | $ | 366,047 | 3 | $ | 132.58 | $ | 37,000 | ||||||||||||||
| SYBT |
Stock Yards Bancorp, Inc. | NASDAQGS | MW | Louisville | KY | $ | 9,536 | 76 | $ | 68.63 | $ | 2,023 | ||||||||||||||
| SSBI |
Summit State Bank | NASDAQGM | WE | Santa Rosa | CA | $ | 1,005 | 5 | $ | 13.74 | $ | 93 | ||||||||||||||
| TCBI |
Texas Capital Bancshares, Inc. | NASDAQGS | SW | Dallas | TX | $ | 31,540 | 9 | $ | 102.48 | $ | 4,535 | ||||||||||||||
| TCBS |
Texas Community Bancshares, Inc. | NASDAQCM | SW | Mineola | TX | $ | 439 | 7 | $ | 17.00 | $ | 46 | ||||||||||||||
| TBBK |
The Bancorp, Inc. | NASDAQGS | MA | Wilmington | DE | $ | 9,352 | 1 | $ | 62.77 | $ | 2,658 | ||||||||||||||
| BK |
The Bank of New York Mellon Corporation | NYSE | MA | New York | NY | $ | 472,300 | 46 | $ | 121.61 | $ | 83,696 | ||||||||||||||
| FNLC |
The First Bancorp, Inc. | NASDAQGS | NE | Damariscotta | ME | $ | 3,166 | 18 | $ | 27.95 | $ | 314 | ||||||||||||||
| PNC |
The PNC Financial Services Group, Inc. | NYSE | MA | Pittsburgh | PA | $ | 573,572 | 2,407 | $ | 227.63 | $ | 88,870 | ||||||||||||||
| TCBX |
Third Coast Bancshares, Inc. | NYSE | SW | Humble | TX | $ | 5,341 | 24 | $ | 42.13 | $ | 585 | ||||||||||||||
| TSBK |
Timberland Bancorp, Inc. | NASDAQGM | WE | Hoquiam | WA | $ | 2,006 | 24 | $ | 39.12 | $ | 308 | ||||||||||||||
| TMP |
Tompkins Financial Corporation | NYSEAM | MA | Ithaca | NY | $ | 8,668 | 59 | $ | 81.12 | $ | 1,164 | ||||||||||||||
| TOWN |
TowneBank | NASDAQGS | SE | Portsmouth | VA | $ | 19,687 | 91 | $ | 35.66 | $ | 2,777 | ||||||||||||||
| TCBK |
TriCo Bancshares | NASDAQGS | WE | Chico | CA | $ | 9,822 | 71 | $ | 51.04 | $ | 1,659 | ||||||||||||||
| TFIN |
Triumph Financial, Inc. | NYSE | SW | Dallas | TX | $ | 6,381 | 63 | $ | 64.02 | $ | 1,521 | ||||||||||||||
| TFC |
Truist Financial Corporation | NYSE | SE | Charlotte | NC | $ | 547,538 | 1,928 | $ | 52.66 | $ | 66,482 | ||||||||||||||
| TRST |
TrustCo Bank Corp NY | NASDAQGS | MA | Glenville | NY | $ | 6,441 | 134 | $ | 44.65 | $ | 805 | ||||||||||||||
| TRMK |
Trustmark Corporation | NASDAQGS | SE | Jackson | MS | $ | 18,925 | 178 | $ | 43.01 | $ | 2,579 | ||||||||||||||
| USB |
U.S. Bancorp | NYSE | MW | Minneapolis | MN | $ | 692,345 | 2,097 | $ | 57.36 | $ | 89,162 | ||||||||||||||
Exhibit III-1
Characteristics of Publicly-Traded Thrifts
February 2, 2026
| As of February 2, 2026 |
||||||||||||||||||||||||||
| Ticker |
Financial Institution |
Exchange |
Region |
City |
State |
Total Assets | Offices | Stock Price |
Market Value |
|||||||||||||||||
| ($Mil) | ($) | ($Mil) | ||||||||||||||||||||||||
| UMBF |
UMB Financial Corporation | NASDAQGS | MW | Kansas City | MO | $ | 73,094 | 194 | $ | 128.05 | $ | 9,727 | ||||||||||||||
| UNB |
Union Bankshares, Inc. | NASDAQGM | NE | Morrisville | VT | $ | 1,620 | 18 | $ | 24.86 | $ | 114 | ||||||||||||||
| UBCP |
United Bancorp, Inc. | NASDAQCM | MW | Martins Ferry | OH | $ | 867 | 20 | $ | 14.00 | $ | 81 | ||||||||||||||
| UBSI |
United Bankshares, Inc. | NASDAQGS | SE | Charleston | WV | $ | 33,660 | 235 | $ | 43.07 | $ | 6,010 | ||||||||||||||
| UCB |
United Community Banks, Inc. | NYSE | SE | Greenville | SC | $ | 28,003 | 195 | $ | 34.99 | $ | 4,220 | ||||||||||||||
| UNTY |
Unity Bancorp, Inc. | NASDAQGM | MA | Clinton | NJ | $ | 2,967 | 22 | $ | 55.52 | $ | 554 | ||||||||||||||
| UVSP |
Univest Financial Corporation | NASDAQGS | MA | Souderton | PA | $ | 8,437 | 51 | $ | 34.38 | $ | 979 | ||||||||||||||
| USCB |
USCB Financial Holdings, Inc. | NASDAQGM | SE | Doral | FL | $ | 2,792 | 10 | $ | 19.43 | $ | 352 | ||||||||||||||
| VLY |
Valley National Bancorp | NASDAQGS | MA | Morristown | NJ | $ | 64,133 | 229 | $ | 12.62 | $ | 7,025 | ||||||||||||||
| VABK |
Virginia National Bankshares Corporation | NASDAQCM | SE | Charlottesville | VA | $ | 1,650 | 13 | $ | 42.00 | $ | 227 | ||||||||||||||
| WAFD |
WaFd, Inc. | NASDAQGS | WE | Seattle | WA | $ | 27,286 | 210 | $ | 33.07 | $ | 2,528 | ||||||||||||||
| WASH |
Washington Trust Bancorp, Inc. | NASDAQGS | NE | Westerly | RI | $ | 6,622 | 29 | $ | 35.26 | $ | 671 | ||||||||||||||
| WSBF |
Waterstone Financial, Inc. | NASDAQGS | MW | Wauwatosa | WI | $ | 2,260 | 16 | $ | 18.76 | $ | 352 | ||||||||||||||
| WBS |
Webster Financial Corporation | NYSE | NE | Stamford | CT | $ | 84,074 | 196 | $ | 66.00 | $ | 10,640 | ||||||||||||||
| WFC |
Wells Fargo & Company | NYSE | WE | San Francisco | CA | $ | 2,148,631 | 4,165 | $ | 92.27 | $ | 285,356 | ||||||||||||||
| WSBC |
WesBanco, Inc. | NASDAQGS | SE | Wheeling | WV | $ | 27,696 | 227 | $ | 36.01 | $ | 3,459 | ||||||||||||||
| WTBA |
West Bancorporation, Inc. | NASDAQGS | MW | West Des Moines | IA | $ | 4,142 | 11 | $ | 25.54 | $ | 433 | ||||||||||||||
| WABC |
Westamerica Bancorporation | NASDAQGS | WE | San Rafael | CA | $ | 5,960 | 76 | $ | 51.15 | $ | 1,259 | ||||||||||||||
| WAL |
Western Alliance Bancorporation | NYSE | WE | Phoenix | AZ | $ | 92,774 | 55 | $ | 89.65 | $ | 9,691 | ||||||||||||||
| WNEB |
Western New England Bancorp, Inc. | NASDAQGS | NE | Westfield | MA | $ | 2,736 | 27 | $ | 13.81 | $ | 278 | ||||||||||||||
| WTFC |
Wintrust Financial Corporation | NASDAQGS | MW | Rosemont | IL | $ | 71,142 | 212 | $ | 149.71 | $ | 10,027 | ||||||||||||||
| WSFS |
WSFS Financial Corporation | NASDAQGS | MA | Wilmington | DE | $ | 21,314 | 94 | $ | 66.36 | $ | 3,628 | ||||||||||||||
| ZION |
Zions Bancorporation, National Association | NASDAQGS | SW | Salt Lake City | UT | $ | 88,990 | 409 | $ | 60.99 | $ | 9,005 | ||||||||||||||
| BSBK |
Bogota Financial Corp. | NASDAQCM | MA | Teaneck | NJ | $ | 926 | 10 | $ | 8.54 | $ | 108 | ||||||||||||||
| CLBK |
Columbia Financial, Inc. | NASDAQGS | MA | Fair Lawn | NJ | $ | 11,019 | 71 | $ | 17.71 | $ | 1,842 | ||||||||||||||
| GCBC |
Greene County Bancorp, Inc. | NASDAQCM | MA | Catskill | NY | $ | 3,147 | 22 | $ | 23.88 | $ | 407 | ||||||||||||||
| KFFB |
Kentucky First Federal Bancorp | NASDAQGM | MW | Hazard | KY | $ | 366 | 7 | $ | 4.51 | $ | 36 | ||||||||||||||
| PBFS |
Pioneer Bancorp, Inc. | NASDAQCM | MA | Albany | NY | $ | 2,151 | 21 | $ | 14.23 | $ | 347 | ||||||||||||||
| RBKB |
Rhinebeck Bancorp, Inc. | NASDAQCM | MA | Poughkeepsie | NY | $ | 1,302 | 17 | $ | 11.93 | $ | 130 | ||||||||||||||
| TFSL |
TFS Financial Corporation | NASDAQGS | MW | Cleveland | OH | $ | 17,499 | 36 | $ | 14.24 | $ | 3,969 | ||||||||||||||
| WSBK |
Winchester Bancorp, Inc. | NASDAQCM | NE | Winchester | MA | $ | 1,016 | 5 | $ | 11.40 | $ | 106 | ||||||||||||||
| BLFY |
Blue Foundry Bancorp | NASDAQGS | MA | Rutherford | NJ | $ | 2,156 | 21 | $ | 13.41 | $ | 253 | ||||||||||||||
| FBIZ |
First Business Financial Services, Inc. | NASDAQGS | MW | Madison | WI | $ | 4,082 | 4 | $ | 58.84 | $ | 490 | ||||||||||||||
| FFWM |
First Foundation Inc. | NYSE | SW | Irving | TX | $ | 11,904 | 30 | $ | 6.47 | $ | 536 | ||||||||||||||
| FSUN |
FirstSun Capital Bancorp | NASDAQGS | SW | Denver | CO | $ | 8,485 | 72 | $ | 40.56 | $ | 1,131 | ||||||||||||||
| FFIC |
Flushing Financial Corporation | NASDAQGS | MA | Uniondale | NY | $ | 8,693 | 31 | $ | 16.15 | $ | 546 | ||||||||||||||
| HTBK |
Heritage Commerce Corp | NASDAQGS | WE | San Jose | CA | $ | 5,765 | 16 | $ | 13.08 | $ | 803 | ||||||||||||||
| IROQ |
IF Bancorp, Inc. | NASDAQCM | MW | Watseka | IL | $ | 830 | 8 | $ | 27.21 | $ | 88 | ||||||||||||||
| LNKB |
LINKBANCORP, Inc. | NASDAQCM | MA | Camp Hill | PA | $ | 3,070 | 29 | $ | 8.92 | $ | 334 | ||||||||||||||
| MBCN |
Middlefield Banc Corp. | NASDAQCM | MW | Middlefield | OH | $ | 1,979 | 22 | $ | 33.65 | $ | 272 | ||||||||||||||
| MOFG |
MidWestOne Financial Group, Inc. | NASDAQGS | MW | Iowa City | IA | $ | 6,250 | 58 | $ | 47.07 | $ | 971 | ||||||||||||||
| NFBK |
Northfield Bancorp, Inc. (Staten Island, NY) | NASDAQGS | MA | Woodbridge | NJ | $ | 5,754 | 37 | $ | 13.79 | $ | 576 | ||||||||||||||
| STEL |
Stellar Bancorp, Inc. | NYSE | SW | Houston | TX | $ | 10,807 | 52 | $ | 37.42 | $ | 1,899 | ||||||||||||||
| UBFO |
United Security Bancshares | NASDAQGS | WE | Fresno | CA | $ | 1,248 | 14 | $ | 11.11 | $ | 195 | ||||||||||||||
Source: S&P Global Market Intelligence.
EXHIBIT III-2
Public Market Pricing of Mid-Atlantic Bank and Thrift Institutions
| Exhibit III-2 |
| |||||||||||||||||||||||||||||||||||||||||||||||||||||||||||||||||||||||||||||||||||||
| Public Market Pricing Mid-Atlantic Institutions |
| |||||||||||||||||||||||||||||||||||||||||||||||||||||||||||||||||||||||||||||||||||||
| As of February 2, 2026 |
| |||||||||||||||||||||||||||||||||||||||||||||||||||||||||||||||||||||||||||||||||||||
| Market | Per Share Data | |||||||||||||||||||||||||||||||||||||||||||||||||||||||||||||||||||||||||||||||||||||
| Capitalization | Core | Book | Dividends(3) | Financial Characteristics(5) | ||||||||||||||||||||||||||||||||||||||||||||||||||||||||||||||||||||||||||||||||||
| Price/ | Market | 12 Month | Value/ | Pricing Ratios(2) | Amount/ | Payout | Total | Equity/ | Tang. Eq./ | NPAs/ | Reported | Core | ||||||||||||||||||||||||||||||||||||||||||||||||||||||||||||||||||||||||||
| Share | Value | EPS(1) | Share | P/E | P/B | P/A | P/TB | P/Core | Share | Yield | Ratio(4) | Assets | Assets | T. Assets | Assets | ROAA | ROAE | ROAA | ROAE | |||||||||||||||||||||||||||||||||||||||||||||||||||||||||||||||||||
| ($) | ($Mil) | ($) | ($) | (x) | (%) | (%) | (%) | (x) | ($) | (%) | (%) | ($Mil) | (%) | (%) | (%) | (%) | (%) | (%) | (%) | |||||||||||||||||||||||||||||||||||||||||||||||||||||||||||||||||||
| All Public Banks and Non-MHC Thrifts(6) |
||||||||||||||||||||||||||||||||||||||||||||||||||||||||||||||||||||||||||||||||||||||
| Averages |
$ | 53.07 | $ | 10,076.84 | $ | 4.34 | $ | 41.27 | 13.46x | 124.42 | % | 13.88 | % | 149.05 | % | 12.90x | $ | 1.17 | 2.67 | % | 36.68 | % | $ | 72,241 | 11.59 | % | 10.11 | % | 0.54 | % | 1.00 | % | 8.91 | % | 1.10 | % | 9.70 | % | ||||||||||||||||||||||||||||||||||||||||||||||||
| Median |
$ | 33.39 | $ | 804.99 | $ | 3.05 | $ | 28.67 | 12.69x | 116.43 | % | 12.89 | % | 140.49 | % | 12.01x | $ | 0.96 | 2.63 | % | 32.23 | % | $ | 6,134 | 11.02 | % | 9.32 | % | 0.41 | % | 1.06 | % | 9.93 | % | 1.16 | % | 10.67 | % | ||||||||||||||||||||||||||||||||||||||||||||||||
| Comparable Group |
||||||||||||||||||||||||||||||||||||||||||||||||||||||||||||||||||||||||||||||||||||||
| Averages |
$ | 50.02 | $ | 20,352.31 | $ | 4.20 | $ | 38.57 | 12.92x | 122.07 | % | 13.02 | % | 144.25 | % | 12.30x | $ | 1.23 | 2.67 | % | 34.69 | % | $ | 138,991 | 11.07 | % | 9.78 | % | 0.66 | % | 1.05 | % | 9.78 | % | 1.09 | % | 10.17 | % | ||||||||||||||||||||||||||||||||||||||||||||||||
| Medians |
$ | 33.95 | $ | 730.74 | $ | 3.23 | $ | 30.65 | 12.46x | 114.73 | % | 12.05 | % | 129.38 | % | 11.54x | $ | 0.80 | 2.76 | % | 33.76 | % | $ | 6,274 | 10.67 | % | 9.06 | % | 0.48 | % | 1.11 | % | 10.15 | % | 1.17 | % | 10.90 | % | ||||||||||||||||||||||||||||||||||||||||||||||||
| Comparable Group |
||||||||||||||||||||||||||||||||||||||||||||||||||||||||||||||||||||||||||||||||||||||
| ACNB |
ACNB Corporation | PA | $ | 51.49 | $ | 534.07 | $ | 5.00 | $ | 40.49 | 14.30x | 127.17 | % | 16.54 | % | 160.34 | % | 10.30x | $ | 1.52 | 2.95 | % | 40.00 | % | $ | 3,228 | 13.01 | % | 10.60 | % | NA | 1.16 | % | 9.44 | % | 1.61 | % | 13.10 | % | |||||||||||||||||||||||||||||||||||||||||||||||
| AMAL |
Amalgamated Financial Corp. | NY | $ | 40.19 | $ | 1,198.40 | $ | 3.54 | $ | 26.64 | 11.79x | 150.84 | % | 13.51 | % | 153.52 | % | 11.34x | $ | 0.68 | 1.69 | % | 17.30 | % | $ | 8,870 | 8.96 | % | 8.81 | % | 0.32 | % | 1.23 | % | 13.88 | % | 1.28 | % | 14.42 | % | ||||||||||||||||||||||||||||||||||||||||||||||
| ASRV |
AmeriServ Financial, Inc. | PA | $ | 3.55 | $ | 58.65 | NA | $ | 7.22 | 10.44x | 49.16 | % | 4.03 | % | 55.52 | % | NM | $ | 0.12 | 3.38 | % | 35.29 | % | $ | 1,454 | 8.21 | % | 7.34 | % | NA | 0.39 | % | 5.03 | % | NA | NA | ||||||||||||||||||||||||||||||||||||||||||||||||||
| AROW |
Arrow Financial Corporation | NY | $ | 34.63 | $ | 569.50 | $ | 2.75 | $ | 26.26 | 13.07x | 131.87 | % | 12.81 | % | 140.02 | % | 12.59x | $ | 1.20 | 3.47 | % | 43.77 | % | $ | 4,446 | 9.71 | % | 9.20 | % | 0.15 | % | 1.00 | % | 10.66 | % | 1.04 | % | 11.06 | % | ||||||||||||||||||||||||||||||||||||||||||||||
| BCBP |
BCB Bancorp, Inc. | NJ | $ | 8.25 | $ | 142.13 | ($ | 0.13 | ) | $ | 16.15 | NM | 51.07 | % | 4.38 | % | 52.05 | % | NM | $ | 0.32 | 3.88 | % | NA | $ | 3,279 | 9.28 | % | 9.13 | % | 2.08 | % | -0.37 | % | -3.94 | % | -0.01 | % | -0.12 | % | ||||||||||||||||||||||||||||||||||||||||||||||
| BVFL |
BV Financial, Inc. | MD | $ | 19.72 | $ | 189.33 | $ | 1.45 | $ | 20.76 | 13.79x | 94.98 | % | 19.14 | % | 103.46 | % | 13.62x | $ | 0.13 | 0.00 | % | NA | $ | 912 | 20.15 | % | 18.81 | % | NA | 1.48 | % | 7.01 | % | 1.50 | % | 7.10 | % | ||||||||||||||||||||||||||||||||||||||||||||||||
| CBNK |
Capital Bancorp, Inc. | MD | $ | 31.71 | $ | 523.88 | $ | 3.57 | $ | 24.54 | 9.30x | 129.22 | % | 14.40 | % | 144.52 | % | 8.89x | $ | 0.48 | 1.51 | % | 13.49 | % | $ | 3,606 | 11.15 | % | 10.09 | % | 1.62 | % | 1.71 | % | 15.13 | % | 1.79 | % | 15.84 | % | ||||||||||||||||||||||||||||||||||||||||||||||
| CBFV |
CB Financial Services, Inc. | PA | $ | 36.41 | $ | 183.38 | $ | 4.45 | $ | 31.28 | NM | 116.40 | % | 11.85 | % | 124.07 | % | 8.19x | $ | 1.12 | 3.08 | % | 114.13 | % | $ | 1,548 | 10.18 | % | 9.61 | % | NA | 0.33 | % | 3.27 | % | 1.58 | % | 15.82 | % | |||||||||||||||||||||||||||||||||||||||||||||||
| CHMG |
Chemung Financial Corporation | NY | $ | 61.76 | $ | 296.10 | $ | 5.88 | $ | 52.97 | 19.67x | 116.61 | % | 10.96 | % | 127.53 | % | 10.51x | $ | 1.36 | 2.20 | % | 42.04 | % | $ | 2,710 | 9.40 | % | 8.66 | % | 0.30 | % | 0.55 | % | 6.40 | % | 1.03 | % | 11.97 | % | ||||||||||||||||||||||||||||||||||||||||||||||
| C |
Citigroup Inc. | NY | $ | 116.23 | $ | 203,111.93 | $ | 7.30 | $ | 110.01 | 16.63x | 105.65 | % | 7.71 | % | 119.75 | % | 15.92x | $ | 2.40 | 2.06 | % | 33.76 | % | $ | 2,657,202 | 8.05 | % | 7.26 | % | 0.14 | % | 0.55 | % | 6.78 | % | 0.57 | % | 7.09 | % | ||||||||||||||||||||||||||||||||||||||||||||||
| CZNC |
Citizens & Northern Corporation | PA | $ | 22.70 | $ | 404.59 | NA | $ | 19.17 | 15.55x | 118.40 | % | 12.92 | % | 151.63 | % | NM | $ | 1.12 | 4.93 | % | 76.71 | % | $ | 3,132 | 10.91 | % | 8.73 | % | NA | 0.85 | % | 7.87 | % | NA | NA | ||||||||||||||||||||||||||||||||||||||||||||||||||
| CZFS |
Citizens Financial Services, Inc. | PA | $ | 65.36 | $ | 314.19 | $ | 7.69 | $ | 70.32 | 8.58x | 92.94 | % | 10.25 | % | 125.36 | % | 8.50x | $ | 2.00 | 3.06 | % | 25.99 | % | $ | 3,065 | 11.03 | % | 8.42 | % | 0.94 | % | 1.20 | % | 10.84 | % | 1.21 | % | 10.94 | % | ||||||||||||||||||||||||||||||||||||||||||||||
| CCNE |
CNB Financial Corporation | PA | $ | 28.29 | $ | 826.70 | $ | 2.84 | $ | 27.63 | 11.36x | 102.39 | % | 10.00 | % | 120.47 | % | 9.96x | $ | 0.72 | 2.55 | % | 28.92 | % | $ | 8,396 | 10.39 | % | 9.06 | % | 0.50 | % | 0.93 | % | 9.14 | % | 1.05 | % | 10.34 | % | ||||||||||||||||||||||||||||||||||||||||||||||
| CBU |
Community Financial System, Inc. | NY | $ | 63.76 | $ | 3,359.00 | $ | 4.25 | $ | 38.08 | 16.06x | 167.45 | % | 19.41 | % | 315.90 | % | 15.00x | $ | 1.88 | 2.95 | % | 47.10 | % | $ | 17,303 | 11.59 | % | 6.50 | % | 0.33 | % | 1.26 | % | 11.29 | % | 1.35 | % | 12.09 | % | ||||||||||||||||||||||||||||||||||||||||||||||
| CNOB |
ConnectOne Bancorp, Inc. | NJ | $ | 27.31 | $ | 1,369.88 | $ | 2.20 | $ | 29.09 | 16.75x | 93.88 | % | 9.88 | % | 116.13 | % | 12.39x | $ | 0.72 | 2.64 | % | 44.17 | % | $ | 14,003 | 11.24 | % | 9.42 | % | 0.33 | % | 0.66 | % | 5.67 | % | 0.87 | % | 7.52 | % | ||||||||||||||||||||||||||||||||||||||||||||||
| CUBI |
Customers Bancorp, Inc. | PA | $ | 79.58 | $ | 2,720.94 | $ | 7.53 | $ | 61.87 | 12.71x | 128.62 | % | 10.93 | % | 128.84 | % | 10.56x | NA | NA | NA | $ | 24,896 | 8.50 | % | 8.48 | % | 0.29 | % | 0.96 | % | 11.39 | % | 1.14 | % | 13.55 | % | |||||||||||||||||||||||||||||||||||||||||||||||||
| DCOM |
Dime Community Bancshares, Inc. | NY | $ | 35.36 | $ | 1,550.96 | NA | $ | 30.99 | 14.98x | 114.11 | % | 10.19 | % | 129.20 | % | NM | $ | 1.00 | 2.83 | % | 42.37 | % | $ | 15,342 | 9.62 | % | 8.67 | % | 0.34 | % | 0.77 | % | 7.64 | % | NA | NA | |||||||||||||||||||||||||||||||||||||||||||||||||
| EGBN |
Eagle Bancorp, Inc. | MD | $ | 27.27 | $ | 827.91 | ($ | 3.73 | ) | $ | 37.59 | NM | 72.54 | % | 7.89 | % | 72.54 | % | NM | $ | 0.04 | 0.15 | % | NA | $ | 10,497 | 10.87 | % | 10.87 | % | 1.04 | % | -1.07 | % | -10.63 | % | -0.95 | % | -9.42 | % | ||||||||||||||||||||||||||||||||||||||||||||||
| ESQ |
Esquire Financial Holdings, Inc. | NY | $ | 110.48 | $ | 895.48 | NA | $ | 33.86 | 18.82x | 326.27 | % | 39.94 | % | 326.27 | % | NM | $ | 0.80 | 0.72 | % | 12.35 | % | $ | 2,366 | 12.24 | % | 12.24 | % | NA | 2.43 | % | 19.41 | % | NA | NA | ||||||||||||||||||||||||||||||||||||||||||||||||||
| FNB |
F.N.B. Corporation | PA | $ | 17.84 | $ | 6,374.29 | $ | 1.58 | $ | 18.92 | 11.44x | 94.31 | % | 12.69 | % | 150.25 | % | 11.28x | $ | 0.48 | 2.69 | % | 30.77 | % | $ | 50,229 | 13.46 | % | 8.89 | % | 0.22 | % | 1.15 | % | 8.66 | % | 1.16 | % | 8.78 | % | ||||||||||||||||||||||||||||||||||||||||||||||
| FDBC |
Fidelity D & D Bancorp, Inc. | PA | $ | 46.50 | $ | 268.18 | $ | 5.04 | $ | 41.39 | 9.57x | 112.35 | % | 9.77 | % | 122.75 | % | 9.24x | $ | 1.72 | 3.70 | % | 34.16 | % | $ | 2,748 | 8.69 | % | 8.01 | % | NA | 1.05 | % | 12.88 | % | 1.09 | % | 13.34 | % | |||||||||||||||||||||||||||||||||||||||||||||||
| FISI |
Financial Institutions, Inc. | NY | $ | 33.95 | $ | 672.11 | $ | 3.54 | $ | 30.89 | 9.40x | 109.90 | % | 10.74 | % | 121.93 | % | 9.60x | $ | 1.24 | 3.65 | % | 34.35 | % | $ | 6,274 | 10.02 | % | 9.15 | % | NA | 1.20 | % | 12.38 | % | 1.18 | % | 12.13 | % | |||||||||||||||||||||||||||||||||||||||||||||||
| FBP |
First BanCorp. | PR | $ | 22.49 | $ | 3,499.05 | NA | $ | 12.56 | 10.46x | 179.09 | % | 18.41 | % | 183.00 | % | NM | $ | 0.80 | 3.56 | % | 34.42 | % | $ | 19,133 | 10.28 | % | 10.08 | % | 0.60 | % | 1.81 | % | 18.74 | % | NA | NA | |||||||||||||||||||||||||||||||||||||||||||||||||
| FRBA |
First Bank | NJ | $ | 16.76 | $ | 415.65 | NA | $ | 17.88 | 9.63x | 93.72 | % | 10.50 | % | 105.98 | % | NM | $ | 0.36 | 2.15 | % | 15.52 | % | $ | 3,958 | 11.21 | % | 10.04 | % | NA | 1.11 | % | 10.26 | % | NA | NA | ||||||||||||||||||||||||||||||||||||||||||||||||||
| FCF |
First Commonwealth Financial Corporation | PA | $ | 18.27 | $ | 1,872.70 | $ | 1.54 | $ | 15.11 | 12.43x | 120.88 | % | 15.22 | % | 162.80 | % | 11.88x | $ | 0.54 | 2.96 | % | 36.73 | % | $ | 12,343 | 12.59 | % | 9.66 | % | 0.77 | % | 1.26 | % | 10.15 | % | 1.32 | % | 10.61 | % | ||||||||||||||||||||||||||||||||||||||||||||||
| FUNC |
First United Corporation | MD | $ | 39.56 | $ | 257.02 | $ | 3.86 | $ | 30.65 | 10.33x | 129.09 | % | 12.70 | % | 137.02 | % | 10.25x | $ | 1.04 | 2.63 | % | 25.07 | % | $ | 2,024 | 9.84 | % | 9.32 | % | 0.47 | % | 1.25 | % | 13.39 | % | 1.26 | % | 13.48 | % | ||||||||||||||||||||||||||||||||||||||||||||||
| FLG |
Flagstar Bank, National Association | NY | $ | 13.50 | $ | 5,615.76 | ($ | 0.16 | ) | $ | 18.37 | NM | 73.50 | % | 6.45 | % | 77.36 | % | NM | $ | 0.04 | 0.30 | % | NA | $ | 87,512 | 9.31 | % | 8.91 | % | 3.41 | % | -0.19 | % | -2.18 | % | -0.04 | % | -0.42 | % | ||||||||||||||||||||||||||||||||||||||||||||||
| FRAF |
Franklin Financial Services Corporation | PA | $ | 51.59 | $ | 228.39 | NA | $ | 39.11 | 10.88x | 131.92 | % | 10.32 | % | 139.07 | % | NM | $ | 1.32 | 2.56 | % | 27.85 | % | $ | 2,239 | 7.83 | % | 7.45 | % | NA | 0.94 | % | 13.52 | % | NA | NA | ||||||||||||||||||||||||||||||||||||||||||||||||||
| FULT |
Fulton Financial Corporation | PA | $ | 21.03 | $ | 3,783.19 | $ | 2.19 | $ | 18.33 | 10.11x | 114.73 | % | 11.85 | % | 140.92 | % | 9.60x | $ | 0.76 | 3.61 | % | 35.10 | % | $ | 32,118 | 10.87 | % | 9.13 | % | 0.48 | % | 1.23 | % | 11.70 | % | 1.29 | % | 12.31 | % | ||||||||||||||||||||||||||||||||||||||||||||||
| HNVR |
Hanover Bancorp, Inc. | NY | $ | 23.41 | $ | 173.48 | $ | 1.32 | NA | 23.41x | 85.56 | % | NA | 94.90 | % | 17.75x | $ | 0.40 | 1.71 | % | 40.00 | % | $ | 2,383 | 8.40 | % | 7.65 | % | NA | 0.33 | % | 3.73 | % | 0.44 | % | 4.92 | % | |||||||||||||||||||||||||||||||||||||||||||||||||
| JPM |
JPMorgan Chase & Co. | NY | $ | 308.14 | $ | 830,807.07 | $ | 19.65 | $ | 126.99 | 15.39x | 242.65 | % | 18.86 | % | 289.38 | % | 15.68x | $ | 6.00 | 1.95 | % | 28.97 | % | $ | 4,424,900 | 8.19 | % | 7.03 | % | 0.23 | % | 1.29 | % | 16.17 | % | 1.26 | % | 15.88 | % | ||||||||||||||||||||||||||||||||||||||||||||||
| KRNY |
Kearny Financial Corp. | NJ | $ | 8.07 | $ | 507.06 | $ | 0.52 | $ | 11.70 | 15.52x | 68.98 | % | 6.86 | % | 81.85 | % | 15.57x | $ | 0.44 | 5.45 | % | 84.62 | % | $ | 7,621 | 9.94 | % | NA | 0.67 | % | 0.43 | % | 4.33 | % | 0.42 | % | 4.32 | % | |||||||||||||||||||||||||||||||||||||||||||||||
| LSBK |
Lake Shore Bancorp, Inc. | NY | $ | 15.50 | $ | 113.32 | NA | $ | 18.10 | 15.98x | 85.64 | % | 16.68 | % | 85.64 | % | NM | $ | 0.36 | 2.32 | % | 27.84 | % | $ | 727 | 19.47 | % | 19.47 | % | NA | 1.02 | % | 6.41 | % | NA | NA | ||||||||||||||||||||||||||||||||||||||||||||||||||
| MTB |
M&T Bank Corporation | NY | $ | 225.54 | $ | 34,245.99 | $ | 16.65 | $ | 173.49 | 13.27x | 130.00 | % | 16.26 | % | 192.24 | % | 13.54x | $ | 6.00 | 2.66 | % | 33.53 | % | $ | 213,510 | 13.67 | % | 10.07 | % | NA | 1.35 | % | 9.90 | % | 1.33 | % | 9.71 | % | |||||||||||||||||||||||||||||||||||||||||||||||
| MGYR |
Magyar Bancorp, Inc. | NJ | $ | 17.75 | $ | 116.02 | $ | 1.73 | $ | 18.79 | 10.26x | 94.47 | % | 11.00 | % | 97.14 | % | 10.26x | $ | 0.40 | 2.25 | % | 18.50 | % | $ | 1,045 | 11.64 | % | NA | NA | 1.06 | % | 9.36 | % | 1.06 | % | 9.36 | % | ||||||||||||||||||||||||||||||||||||||||||||||||
| MRBK |
Meridian Corporation | PA | $ | 19.26 | $ | 225.20 | $ | 1.87 | $ | 16.75 | 10.19x | 114.95 | % | 8.90 | % | 122.72 | % | 10.30x | $ | 0.56 | 2.91 | % | 27.25 | % | $ | 2,560 | 7.74 | % | NA | NA | 0.87 | % | 12.00 | % | 0.86 | % | 11.87 | % | ||||||||||||||||||||||||||||||||||||||||||||||||
| MCB |
Metropolitan Bank Holding Corp. | NY | $ | 94.62 | $ | 954.58 | $ | 6.51 | $ | 73.66 | 14.29x | 128.46 | % | 11.56 | % | 130.16 | % | 14.53x | $ | 0.80 | 0.85 | % | 7.55 | % | $ | 8,256 | 9.00 | % | 8.89 | % | NA | 0.90 | % | 9.70 | % | 0.89 | % | 9.54 | % | |||||||||||||||||||||||||||||||||||||||||||||||
| MPB |
Mid Penn Bancorp, Inc. | PA | $ | 33.83 | $ | 779.69 | $ | 2.99 | $ | 35.32 | 13.37x | 95.78 | % | 12.71 | % | 117.64 | % | 11.32x | $ | 0.88 | 2.60 | % | 35.18 | % | $ | 6,134 | 13.27 | % | 11.08 | % | 0.50 | % | 0.93 | % | 7.71 | % | 1.10 | % | 9.11 | % | ||||||||||||||||||||||||||||||||||||||||||||||
| NBTB |
NBT Bancorp Inc. | NY | $ | 45.41 | $ | 2,375.63 | $ | 3.82 | $ | 36.32 | 13.64x | 125.03 | % | 14.82 | % | 171.14 | % | 11.90x | $ | 1.48 | 3.26 | % | 43.54 | % | $ | 15,995 | 11.85 | % | 8.95 | % | 0.28 | % | 1.11 | % | 9.75 | % | 1.27 | % | 11.18 | % | ||||||||||||||||||||||||||||||||||||||||||||||
| NECB |
Northeast Community Bancorp, Inc. | NY | $ | 24.44 | $ | 342.83 | $ | 3.22 | $ | 25.19 | 7.52x | 97.03 | % | 16.54 | % | 97.03 | % | 7.60x | $ | 0.80 | 3.27 | % | 30.77 | % | $ | 2,064 | 17.04 | % | 17.04 | % | 0.00 | % | 2.21 | % | 13.12 | % | 2.19 | % | 12.99 | % | ||||||||||||||||||||||||||||||||||||||||||||||
| NWFL |
Norwood Financial Corp. | PA | $ | 31.44 | $ | 290.69 | $ | 3.12 | $ | 26.06 | 10.45x | 120.67 | % | 12.05 | % | 137.32 | % | 10.07x | $ | 1.28 | 4.07 | % | 41.53 | % | $ | 2,425 | 9.99 | % | 8.88 | % | NA | 1.17 | % | 12.22 | % | 1.21 | % | 12.67 | % | |||||||||||||||||||||||||||||||||||||||||||||||
| OCFC |
OceanFirst Financial Corp. | NJ | $ | 19.01 | $ | 1,090.99 | NA | $ | 28.97 | 16.25x | 65.62 | % | 7.49 | % | 96.04 | % | NM | $ | 0.80 | 4.21 | % | 68.38 | % | $ | 14,564 | 11.42 | % | 8.09 | % | 0.26 | % | 0.52 | % | 4.23 | % | NA | NA | |||||||||||||||||||||||||||||||||||||||||||||||||
| OFG |
OFG Bancorp | PR | $ | 40.73 | $ | 1,761.86 | NA | $ | 32.13 | 8.89x | 126.75 | % | 14.13 | % | 135.96 | % | NM | $ | 1.40 | 3.44 | % | 27.29 | % | $ | 12,466 | 11.15 | % | 10.47 | % | NA | 1.70 | % | 15.29 | % | NA | NA | ||||||||||||||||||||||||||||||||||||||||||||||||||
| OBT |
Orange County Bancorp, Inc. | NY | $ | 31.85 | $ | 425.73 | $ | 2.71 | $ | 20.21 | 10.55x | 157.61 | % | 16.15 | % | 161.17 | % | 11.74x | $ | 0.72 | 2.26 | % | 18.87 | % | $ | 2,636 | 10.25 | % | 10.04 | % | 0.46 | % | 1.42 | % | 16.97 | % | 1.27 | % | 15.16 | % | ||||||||||||||||||||||||||||||||||||||||||||||
| ORRF |
Orrstown Financial Services, Inc. | PA | $ | 37.46 | $ | 730.74 | $ | 4.68 | $ | 30.32 | 8.96x | 123.53 | % | 13.18 | % | 151.04 | % | 8.00x | $ | 1.20 | 3.20 | % | 26.32 | % | $ | 5,542 | 10.67 | % | 8.90 | % | 0.51 | % | 1.49 | % | 14.76 | % | 1.67 | % | 16.54 | % | ||||||||||||||||||||||||||||||||||||||||||||||
| PKBK |
Parke Bancorp, Inc. | NJ | $ | 28.26 | $ | 327.69 | $ | 3.16 | NA | 8.94x | 104.12 | % | NA | 104.12 | % | 8.94x | $ | 0.72 | 2.55 | % | 22.78 | % | $ | 2,249 | 14.43 | % | 14.43 | % | 0.61 | % | 1.76 | % | 12.09 | % | 1.76 | % | 12.09 | % | ||||||||||||||||||||||||||||||||||||||||||||||||
| PBHC |
Pathfinder Bancorp, Inc. | NY | $ | 13.68 | $ | 84.62 | ($ | 0.19 | ) | $ | 19.56 | NM | 69.95 | % | 5.94 | % | 76.54 | % | NM | $ | 0.40 | 2.92 | % | NA | $ | 1,425 | 8.49 | % | 7.81 | % | 1.94 | % | -0.23 | % | -2.71 | % | -0.08 | % | -0.95 | % | ||||||||||||||||||||||||||||||||||||||||||||||
| PGC |
Peapack-Gladstone Financial Corporation | NJ | $ | 33.01 | $ | 575.17 | $ | 2.09 | $ | 37.49 | 15.72x | 88.06 | % | 7.70 | % | 94.34 | % | 15.80x | $ | 0.20 | 0.61 | % | 9.52 | % | $ | 7,526 | 8.75 | % | 8.21 | % | 0.91 | % | 0.52 | % | 5.95 | % | 0.52 | % | 5.92 | % | ||||||||||||||||||||||||||||||||||||||||||||||
| PFIS |
Peoples Financial Services Corp. | PA | $ | 53.87 | $ | 538.41 | $ | 6.56 | $ | 52.01 | 9.16x | 103.57 | % | 10.22 | % | 129.38 | % | 8.21x | $ | 2.50 | 4.64 | % | 42.13 | % | $ | 5,271 | 9.86 | % | 8.05 | % | NA | 1.17 | % | 11.89 | % | 1.30 | % | 13.26 | % | |||||||||||||||||||||||||||||||||||||||||||||||
| PDLB |
Ponce Financial Group, Inc. | NY | $ | 16.95 | $ | 386.45 | $ | 1.16 | $ | 13.12 | 14.13x | 129.24 | % | 13.64 | % | 129.24 | % | 14.66x | NA | NA | NA | $ | 3,224 | 16.80 | % | 16.80 | % | NA | 0.91 | % | 5.48 | % | 0.88 | % | 5.29 | % | ||||||||||||||||||||||||||||||||||||||||||||||||||
| BPOP |
Popular, Inc. | PR | $ | 136.69 | $ | 8,983.18 | $ | 12.27 | $ | 94.75 | 11.11x | 144.26 | % | 11.93 | % | 165.38 | % | 11.14x | $ | 3.00 | 2.19 | % | 23.58 | % | $ | 75,348 | 8.29 | % | 7.32 | % | 0.72 | % | 1.11 | % | 11.56 | % | 1.11 | % | 11.54 | % | ||||||||||||||||||||||||||||||||||||||||||||||
| BPRN |
Princeton Bancorp, Inc. | NJ | $ | 37.50 | $ | 253.73 | $ | 2.86 | $ | 40.01 | 13.84x | 93.73 | % | 11.11 | % | 100.07 | % | 13.10x | $ | 1.40 | 3.73 | % | 47.97 | % | $ | 2,283 | 11.86 | % | 11.19 | % | NA | 0.81 | % | 7.02 | % | 0.86 | % | 7.42 | % | |||||||||||||||||||||||||||||||||||||||||||||||
| PFS |
Provident Financial Services, Inc. | NJ | $ | 22.70 | $ | 2,965.07 | $ | 2.22 | $ | 21.69 | 10.18x | 104.65 | % | 11.87 | % | 144.56 | % | 10.22x | $ | 0.96 | 4.23 | % | 43.05 | % | $ | 24,981 | 11.34 | % | 8.48 | % | 0.32 | % | 1.19 | % | 10.71 | % | 1.19 | % | 10.67 | % | ||||||||||||||||||||||||||||||||||||||||||||||
| STBA |
S&T Bancorp, Inc. | PA | $ | 43.21 | $ | 1,616.17 | $ | 3.55 | $ | 39.14 | 12.38x | 110.40 | % | 16.37 | % | 148.52 | % | 12.16x | $ | 1.44 | 3.33 | % | 40.11 | % | $ | 9,871 | 14.83 | % | 11.46 | % | NA | 1.38 | % | 9.29 | % | 1.40 | % | 9.46 | % | |||||||||||||||||||||||||||||||||||||||||||||||
| SHBI |
Shore Bancshares, Inc. | MD | $ | 19.42 | $ | 648.89 | NA | $ | 17.65 | 10.91x | 110.01 | % | 10.37 | % | 130.59 | % | NM | $ | 0.48 | 2.47 | % | 26.97 | % | $ | 6,259 | 9.42 | % | 8.06 | % | 0.69 | % | 0.98 | % | 10.52 | % | NA | NA | |||||||||||||||||||||||||||||||||||||||||||||||||
| SRBK |
SR Bancorp, Inc. | NJ | $ | 17.17 | $ | 137.55 | $ | 0.51 | $ | 22.35 | 32.40x | 76.83 | % | 12.67 | % | 89.18 | % | 33.55x | $ | 0.20 | 1.16 | % | 37.74 | % | $ | 1,143 | 16.49 | % | 14.54 | % | NA | 0.39 | % | 2.24 | % | 0.38 | % | 2.15 | % | |||||||||||||||||||||||||||||||||||||||||||||||
| TBBK |
The Bancorp, Inc. | DE | $ | 62.77 | $ | 2,658.43 | $ | 4.89 | $ | 16.29 | 12.76x | 385.39 | % | 28.43 | % | 385.87 | % | 12.84x | NA | NA | NA | $ | 9,352 | 7.38 | % | 7.37 | % | 1.24 | % | 2.54 | % | 28.90 | % | 2.52 | % | 28.71 | % | |||||||||||||||||||||||||||||||||||||||||||||||||
| BK |
The Bank of New York Mellon Corporation | NY | $ | 121.61 | $ | 83,696.38 | $ | 7.36 | $ | 57.36 | 16.43x | 212.01 | % | 17.92 | % | 420.84 | % | 16.52x | $ | 2.12 | 1.74 | % | 27.84 | % | $ | 472,300 | 9.47 | % | 5.55 | % | NA | 1.28 | % | 12.80 | % | 1.27 | % | 12.87 | % | |||||||||||||||||||||||||||||||||||||||||||||||
| PNC |
The PNC Financial Services Group, Inc. | PA | $ | 227.63 | $ | 88,869.91 | $ | 16.36 | $ | 140.44 | 13.72x | 162.09 | % | 15.65 | % | 203.41 | % | 13.92x | $ | 6.80 | 2.99 | % | 40.39 | % | $ | 573,572 | 10.57 | % | 8.80 | % | 0.41 | % | 1.24 | % | 12.25 | % | 1.22 | % | 11.98 | % | ||||||||||||||||||||||||||||||||||||||||||||||
| TMP |
Tompkins Financial Corporation | NY | $ | 81.12 | $ | 1,163.70 | $ | 5.45 | $ | 65.07 | 7.22x | 124.66 | % | 13.50 | % | 135.14 | % | 14.87x | $ | 2.68 | 3.30 | % | 22.78 | % | $ | 8,668 | 10.83 | % | 10.07 | % | 0.55 | % | 1.96 | % | 20.61 | % | 0.95 | % | 10.00 | % | ||||||||||||||||||||||||||||||||||||||||||||||
| TRST |
TrustCo Bank Corp NY | NY | $ | 44.65 | $ | 804.99 | $ | 3.25 | $ | 38.08 | 13.74x | 117.25 | % | 12.50 | % | 117.34 | % | 13.74x | $ | 1.52 | 3.40 | % | 45.54 | % | $ | 6,441 | 10.66 | % | 10.65 | % | 0.34 | % | 0.97 | % | 8.88 | % | 0.97 | % | 8.88 | % | ||||||||||||||||||||||||||||||||||||||||||||||
| UNTY |
Unity Bancorp, Inc. | NJ | $ | 55.52 | $ | 554.20 | $ | 5.20 | $ | 34.63 | 9.79x | 160.34 | % | 18.68 | % | 167.91 | % | 10.68x | $ | 0.60 | 1.08 | % | 10.23 | % | $ | 2,967 | 11.65 | % | NA | NA | 2.17 | % | 18.07 | % | 1.99 | % | 16.57 | % | ||||||||||||||||||||||||||||||||||||||||||||||||
| UVSP |
Univest Financial Corporation | PA | $ | 34.38 | $ | 978.85 | $ | 3.09 | $ | 33.50 | 10.98x | 102.61 | % | 11.47 | % | 126.38 | % | 11.14x | $ | 0.88 | 2.56 | % | 28.12 | % | $ | 8,437 | 11.18 | % | 9.27 | % | 0.45 | % | 1.11 | % | 9.90 | % | 1.10 | % | 9.76 | % | ||||||||||||||||||||||||||||||||||||||||||||||
| VLY |
Valley National Bancorp | NJ | $ | 12.62 | $ | 7,024.52 | $ | 1.01 | $ | 13.39 | 12.50x | 94.25 | % | 11.01 | % | 131.43 | % | 12.54x | $ | 0.44 | 3.49 | % | 43.56 | % | $ | 64,133 | 12.17 | % | NA | 0.69 | % | 0.96 | % | 7.89 | % | 0.95 | % | 7.86 | % | |||||||||||||||||||||||||||||||||||||||||||||||
| WSFS |
WSFS Financial Corporation | DE | $ | 66.36 | $ | 3,628.30 | $ | 5.16 | $ | 51.27 | 13.04x | 129.42 | % | 16.62 | % | 206.16 | % | 12.85x | $ | 0.68 | 1.02 | % | 13.36 | % | $ | 21,314 | 12.80 | % | NA | 0.34 | % | 1.36 | % | 10.75 | % | 1.38 | % | 10.86 | % | |||||||||||||||||||||||||||||||||||||||||||||||
| MHCs |
||||||||||||||||||||||||||||||||||||||||||||||||||||||||||||||||||||||||||||||||||||||
| BSBK |
Bogota Financial Corp. | NJ | $ | 8.54 | $ | 107.65 | $ | 0.01 | $ | 10.82 | NM | 78.89 | % | 11.99 | % | 78.96 | % | NM | NA | NA | NA | $ | 926 | 15.20 | % | 15.19 | % | 2.21 | % | 0.05 | % | 0.35 | % | 0.00 | % | 0.02 | % | |||||||||||||||||||||||||||||||||||||||||||||||||
| CLBK |
Columbia Financial, Inc. | NJ | $ | 17.71 | $ | 1,841.57 | $ | 0.52 | $ | 11.16 | 34.73x | 158.66 | % | 16.71 | % | 176.55 | % | 33.97x | NA | NA | NA | $ | 11,019 | 10.53 | % | 9.57 | % | 0.34 | % | 0.48 | % | 4.63 | % | 0.49 | % | 4.73 | % | |||||||||||||||||||||||||||||||||||||||||||||||||
| GCBC |
Greene County Bancorp, Inc. | NY | $ | 23.88 | $ | 406.60 | NA | $ | 15.17 | 11.16x | 157.43 | % | 12.92 | % | 157.43 | % | NM | $ | 0.40 | 1.68 | % | 18.22 | % | $ | 3,147 | 8.21 | % | 8.21 | % | NA | 1.22 | % | 15.33 | % | NA | NA | ||||||||||||||||||||||||||||||||||||||||||||||||||
| PBFS |
Pioneer Bancorp, Inc. | NY | $ | 14.23 | $ | 347.30 | NA | NA | 17.14x | 113.60 | % | NA | 118.60 | % | NM | NA | NA | NA | $ | 2,151 | 15.06 | % | NA | NA | 0.99 | % | 6.54 | % | NA | NA | ||||||||||||||||||||||||||||||||||||||||||||||||||||||||
| RBKB |
Rhinebeck Bancorp, Inc. | NY | $ | 11.93 | $ | 129.52 | $ | 0.92 | $ | 12.28 | 12.97x | 97.12 | % | 10.21 | % | 98.81 | % | 12.91x | NA | NA | NA | $ | 1,302 | 10.51 | % | 10.35 | % | NA | 0.78 | % | 7.77 | % | 0.79 | % | 7.80 | % | ||||||||||||||||||||||||||||||||||||||||||||||||||
| Under Acquisition |
||||||||||||||||||||||||||||||||||||||||||||||||||||||||||||||||||||||||||||||||||||||
| BLFY |
Blue Foundry Bancorp | NJ | $ | 13.41 | $ | 252.70 | ($ | 0.46 | ) | $ | 15.14 | NM | 88.55 | % | 12.91 | % | 88.58 | % | NM | NA | NA | NA | $ | 2,156 | 14.58 | % | 14.58 | % | 0.53 | % | -0.44 | % | -2.80 | % | -0.44 | % | -2.80 | % | ||||||||||||||||||||||||||||||||||||||||||||||||
| FFIC |
Flushing Financial Corporation | NY | $ | 16.15 | $ | 545.52 | $ | 1.09 | $ | 20.96 | 29.91x | 77.05 | % | 6.28 | % | 77.14 | % | 14.85x | $ | 0.88 | 5.45 | % | 162.96 | % | $ | 8,693 | 8.14 | % | 8.14 | % | 0.68 | % | 0.21 | % | 2.63 | % | 0.42 | % | 5.22 | % | ||||||||||||||||||||||||||||||||||||||||||||||
| LNKB |
LINKBANCORP, Inc. | PA | $ | 8.92 | $ | 334.12 | $ | 0.79 | $ | 8.18 | 9.91x | 109.04 | % | 10.88 | % | 143.86 | % | 11.30x | $ | 0.30 | 3.36 | % | 33.33 | % | $ | 3,070 | 9.98 | % | 7.75 | % | NA | 1.14 | % | 11.28 | % | 1.00 | % | 9.90 | % | |||||||||||||||||||||||||||||||||||||||||||||||
| NFBK |
Northfield Bancorp, Inc. (Staten Island, NY) | NJ | $ | 13.79 | $ | 575.92 | $ | 0.84 | $ | 16.51 | NM | 83.54 | % | 10.02 | % | 83.54 | % | 16.51x | $ | 0.52 | 3.77 | % | NA | $ | 5,754 | 11.99 | % | 11.99 | % | NA | 0.01 | % | 0.11 | % | 0.59 | % | 4.66 | % | ||||||||||||||||||||||||||||||||||||||||||||||||
|
(1) Core income, on a diluted per-share basis. Core income is net income after taxes and before extraordinary items, less net income attributable to noncontrolling interest, gain on the sale of securities, amortization of intangibles, goodwill and nonrecurring items. Assumed tax rate is 35%. (2) P/E = Price to earnings; P/B = Price to book; P/A = Price to assets; P/TB = Price to tangible book value; and P/Core = Price to core earnings. P/E and P/Core =NM if the ratio is negative or above 35x. (3) Indicated 12 month dividend, based on last quarterly dividend declared. (4) Indicated 12 month dividend as a percent of trailing 12 month earnings. (5) Equity and tangible equity equal common equity and tangible common equity, respectively. ROAA (return on average assets) and ROAE (return on average equity) are indicated ratios based on trailing 12 month earnings and average equity and assets balances. (6) Excludes from averages and medians those companies the subject of actual or rumored acquisition activities or unusual operating characteristics.
Source: S&P Global Market Intelligence and RP Financial, LC. calculations. The information provided in this report has been obtained from sources we believe are reliable, but we cannot guarantee the accuracy or completeness of such information.
Copyright (c) 2026 by RP® Financial, LC. |
| |||||||||||||||||||||||||||||||||||||||||||||||||||||||||||||||||||||||||||||||||||||
EXHIBIT III-3
Peer Group Market Area Comparative Analysis
| Exhibit III-3 | ||||||||||||||||||
| Peer Group Market Area Comparative Analysis | ||||||||||||||||||
| Proj. | Per Capita Income | Deposit | ||||||||||||||||||||||||||||||||
| Population | Pop. | 2021-2026 | 2026-2031 | 2026 | % State | Market | ||||||||||||||||||||||||||||
| Institution |
County | 2021 | 2026 | 2031 | % Change | % Change | Amount | Average | Share(1) | |||||||||||||||||||||||||
| CNB Financial Corporation |
Clearfield, PA | 78,742 | 77,527 | 75,714 | -0.3 | % | -0.5 | % | 38,422 | 81.4 | % | 56.18 | % | |||||||||||||||||||||
| ConnectOne Bancorp, Inc. |
Bergen, NJ | 934,026 | 988,027 | 1,014,061 | 1.1 | % | 0.5 | % | 68,660 | 154.4 | % | 6.94 | % | |||||||||||||||||||||
| Dime Community Bancshares, Inc. |
Suffolk, NY | 1,471,007 | 1,538,850 | 1,554,171 | 0.9 | % | 0.2 | % | 63,182 | 159.8 | % | 10.10 | % | |||||||||||||||||||||
| First Commonwealth Financial Corporation |
Indiana, PA | 83,236 | 82,516 | 81,759 | -0.2 | % | -0.2 | % | 35,538 | 75.3 | % | 25.88 | % | |||||||||||||||||||||
| Kearny Financial Corp. |
Essex, NJ | 801,147 | 894,352 | 924,581 | 2.2 | % | 0.7 | % | 55,052 | 101.3 | % | 0.61 | % | |||||||||||||||||||||
| NBT Bancorp Inc. |
Chenango, NY | 46,647 | 45,357 | 44,301 | -0.6 | % | -0.5 | % | 39,543 | 102.4 | % | 97.81 | % | |||||||||||||||||||||
| Peapack-Gladstone Financial Corporation |
Somerset, NJ | 328,529 | 362,139 | 374,903 | 2.0 | % | 0.7 | % | 78,048 | 153.5 | % | 16.84 | % | |||||||||||||||||||||
| Provident Financial Services, Inc. |
Hudson, NJ | 675,195 | 748,928 | 776,160 | 2.1 | % | 0.7 | % | 61,458 | 144.9 | % | 2.45 | % | |||||||||||||||||||||
| S&T Bancorp, Inc. |
Indiana, PA | 83,236 | 82,516 | 81,759 | -0.2 | % | -0.2 | % | 35,538 | 73.6 | % | 45.83 | % | |||||||||||||||||||||
| Tompkins Financial Corporation |
Tompkins, NY | 101,898 | 105,404 | 105,439 | 0.7 | % | 0.0 | % | 51,785 | 95.3 | % | 60.58 | % | |||||||||||||||||||||
| Univest Financial Corporation |
Montgomery, PA | 835,577 | 884,715 | 903,614 | 1.1 | % | 0.4 | % | 65,772 | 134.1 | % | 9.33 | % | |||||||||||||||||||||
| WSFS Financial Corporation |
New Castle, DE | 560,931 | 593,555 | 613,254 | 1.1 | % | 0.7 | % | 52,415 | 88.1 | % | 1.43 | % | |||||||||||||||||||||
| Averages: | 500,014 | 533,657 | 545,810 | 0.8 | % | 0.2 | % | 53,784 | 113.7 | % | 27.83 | % | ||||||||||||||||||||||
| Medians: | 444,730 | 477,847 | 494,079 | 1.0 | % | 0.3 | % | 53,734 | 101.9 | % | 13.47 | % | ||||||||||||||||||||||
| Columbia Financial, Inc. |
Bergen, NJ | 934,026 | 988,027 | 1,014,061 | 1.1 | % | 0.5 | % | 68,660 | 115.4 | % | 4.30 | % | |||||||||||||||||||||
| (1) | Total institution deposits in headquarters county as percent of total county deposits as of June 30, 2025. |
Sources: S&P Capital IQ and FDIC.
EXHIBIT IV-1
Stock Prices:
As of February 2, 2026
| Exhibit IV-1A |
|
|||||||||||||||||||||||||||||||||||||||||||||||||||||||||||||||||
| Weekly Bank and Thrift Market Line—Part One |
|
|||||||||||||||||||||||||||||||||||||||||||||||||||||||||||||||||
| Prices As of February 2, 2026 |
|
|||||||||||||||||||||||||||||||||||||||||||||||||||||||||||||||||
| Market Capitalization | Price Change Data | Current Per Share Financials | ||||||||||||||||||||||||||||||||||||||||||||||||||||||||||||||||
| Price/ | Shares | Market | 52 Week (1) | % Change From | LTM | LTM Core | BV/ | TBV/ | Assets/ | Assets | ||||||||||||||||||||||||||||||||||||||||||||||||||||||||
| Share(1) | Outstanding | Capitalization | High | Low | Last Wk | Last Wk | 52 Wks (2) | MRY (2) | EPS (3) | EPS (3) | Share | Share (4) | Share | |||||||||||||||||||||||||||||||||||||||||||||||||||||
| ($) | (000) | ($Mil) | ($) | ($) | ($) | (%) | (%) | (%) | ($) | ($) | ($) | ($) | ($) | |||||||||||||||||||||||||||||||||||||||||||||||||||||
| Companies |
||||||||||||||||||||||||||||||||||||||||||||||||||||||||||||||||||
| SRCE |
1st Source Corporation | MW | 68.47 | 24,369 | 1,668.5 | 69.29 | 52.14 | 66.99 | 2.21 | 9.17 | 9.57 | 6.41 | 6.69 | 52.32 | 48.88 | 371.59 | 9,055,270 | |||||||||||||||||||||||||||||||||||||||||||||||||
| ACNB |
ACNB Corporation | MA | 51.49 | 10,372 | 534.1 | 53.41 | 35.70 | 48.36 | 6.47 | 25.28 | 6.49 | 3.60 | 5.00 | 40.49 | 32.11 | 311.23 | 3,228,126 | |||||||||||||||||||||||||||||||||||||||||||||||||
| AFBI |
Affinity Bancshares, Inc. | SE | 20.33 | 6,096 | 123.9 | 22.50 | 17.00 | 20.51 | -0.88 | 11.40 | -0.68 | 1.29 | 1.35 | 20.84 | 17.89 | 144.64 | 881,697 | |||||||||||||||||||||||||||||||||||||||||||||||||
| ALRS |
Alerus Financial Corporation | MW | 25.06 | 25,406 | 636.7 | 25.45 | 15.78 | 23.74 | 5.56 | 18.54 | 11.28 | 0.68 | 3.13 | 22.24 | 17.55 | 205.86 | 5,230,084 | |||||||||||||||||||||||||||||||||||||||||||||||||
| AMAL |
Amalgamated Financial Corp. | MA | 40.19 | 29,818 | 1,198.4 | 40.48 | 25.03 | 38.21 | 5.18 | 15.03 | 25.48 | 3.41 | 3.54 | 26.64 | 26.18 | 297.46 | 8,869,836 | |||||||||||||||||||||||||||||||||||||||||||||||||
| AMTB |
Amerant Bancorp Inc. | SE | 21.89 | 40,559 | 887.8 | 24.30 | 15.62 | 20.82 | 5.14 | -5.65 | 12.20 | 1.26 | 1.58 | 23.13 | NA | 241.06 | 9,777,018 | |||||||||||||||||||||||||||||||||||||||||||||||||
| ABCB |
Ameris Bancorp | SE | 79.89 | 67,753 | 5,412.8 | 83.64 | 48.27 | 80.40 | -0.63 | 21.69 | 7.57 | 6.00 | 6.14 | 59.92 | NA | 406.12 | 27,515,879 | |||||||||||||||||||||||||||||||||||||||||||||||||
| ASRV |
AmeriServ Financial, Inc. | MA | 3.55 | 16,522 | 58.7 | 3.60 | 2.03 | 3.23 | 9.91 | 31.00 | 11.29 | 0.34 | NA | 7.22 | 6.39 | 87.99 | 1,453,813 | |||||||||||||||||||||||||||||||||||||||||||||||||
| ATLO |
Ames National Corporation | MW | 26.79 | 8,857 | 238.2 | 26.95 | 16.09 | 25.22 | 6.23 | 47.77 | 16.68 | 2.14 | 2.17 | 23.47 | 21.98 | 240.88 | 2,133,540 | |||||||||||||||||||||||||||||||||||||||||||||||||
| AROW |
Arrow Financial Corporation | MA | 34.63 | 16,445 | 569.5 | 34.92 | 22.72 | 32.64 | 6.10 | 30.14 | 10.29 | 2.65 | 2.75 | 26.26 | 24.73 | 270.34 | 4,445,862 | |||||||||||||||||||||||||||||||||||||||||||||||||
| ASB |
Associated Banc-Corp | MW | 27.80 | 165,993 | 4,547.1 | 28.15 | 18.32 | 26.96 | 3.12 | 10.58 | 7.92 | 2.77 | 2.85 | 28.81 | 22.01 | 272.32 | 45,202,596 | |||||||||||||||||||||||||||||||||||||||||||||||||
| AUB |
Atlantic Union Bankshares Corporation | SE | 39.57 | 141,777 | 5,610.1 | 40.71 | 22.85 | 38.95 | 1.59 | 4.77 | 12.10 | 2.03 | 3.19 | 34.14 | 19.69 | 265.10 | 37,585,754 | |||||||||||||||||||||||||||||||||||||||||||||||||
| AUBN |
Auburn National Bancorporation, Inc. | SE | 24.51 | 3,494 | 85.6 | 29.00 | 19.00 | 25.32 | -3.20 | 13.47 | -9.05 | 2.08 | NA | 26.35 | 26.35 | 291.61 | 1,018,797 | |||||||||||||||||||||||||||||||||||||||||||||||||
| AVBH |
Avidbank Holdings, Inc. | WE | 30.01 | 10,948 | 328.5 | 30.31 | 19.75 | 27.39 | 9.57 | 28.30 | 12.99 | -2.25 | 3.42 | 25.66 | 25.66 | 234.71 | 2,569,643 | |||||||||||||||||||||||||||||||||||||||||||||||||
| AVBC |
Avidia Bancorp, Inc. | NE | 18.73 | 20,076 | 376.0 | 18.90 | 14.00 | 16.95 | 10.50 | 27.94 | 11.42 | -0.18 | 0.33 | 18.88 | 18.28 | 141.32 | 2,837,090 | |||||||||||||||||||||||||||||||||||||||||||||||||
| AX |
Axos Financial, Inc. | WE | 98.42 | 56,678 | 5,578.3 | 100.75 | 54.46 | 93.46 | 5.31 | 40.74 | 14.23 | 7.89 | 8.05 | 51.70 | 48.24 | 497.57 | 28,201,406 | |||||||||||||||||||||||||||||||||||||||||||||||||
| BANC |
Banc of California, Inc. | WE | 20.38 | 155,456 | 3,168.2 | 21.61 | 11.52 | 20.19 | 0.94 | 27.22 | 5.65 | 1.17 | 1.31 | 19.56 | 17.51 | 223.84 | 34,797,442 | |||||||||||||||||||||||||||||||||||||||||||||||||
| BANF |
BancFirst Corporation | SW | 112.10 | 33,539 | 3,759.7 | 138.77 | 97.02 | 108.59 | 3.23 | -5.86 | 5.73 | 7.11 | 7.18 | 55.28 | 49.20 | 442.44 | 14,838,893 | |||||||||||||||||||||||||||||||||||||||||||||||||
| BFC |
Bank First Corporation | MW | 144.96 | 11,218 | 1,626.1 | 145.54 | 93.00 | 139.25 | 4.10 | 43.27 | 19.00 | 7.23 | 7.73 | 65.47 | 46.01 | 401.70 | 4,506,095 | |||||||||||||||||||||||||||||||||||||||||||||||||
| BAC |
Bank of America Corporation | SE | 54.03 | 7,212,464 | 389,689.4 | 57.55 | 33.07 | 52.02 | 3.86 | 16.70 | -1.76 | 3.81 | NA | 38.44 | 28.62 | 472.85 | 3,410,394,000 | |||||||||||||||||||||||||||||||||||||||||||||||||
| BOH |
Bank of Hawaii Corporation | WE | 75.44 | 39,726 | 3,001.4 | 78.25 | 57.45 | 75.11 | 0.44 | 1.25 | 10.34 | 4.63 | 4.80 | 38.14 | 37.35 | 608.58 | 24,176,364 | |||||||||||||||||||||||||||||||||||||||||||||||||
| BMRC |
Bank of Marin Bancorp | WE | 27.41 | 15,951 | 437.2 | 28.48 | 19.14 | 27.41 | 0.00 | 8.47 | 5.38 | -2.24 | 2.16 | 24.51 | 19.87 | 244.79 | 3,904,778 | |||||||||||||||||||||||||||||||||||||||||||||||||
| BOTJ |
Bank of the James Financial Group, Inc. | SE | 20.00 | 4,543 | 90.9 | 20.02 | 12.75 | 18.35 | 8.99 | 43.88 | 7.64 | 1.76 | 1.95 | 16.94 | 15.10 | 224.53 | 1,020,125 | |||||||||||||||||||||||||||||||||||||||||||||||||
| OZK |
Bank OZK | SE | 48.44 | 110,383 | 5,346.9 | 53.66 | 35.71 | 46.27 | 4.69 | -4.63 | 5.26 | 6.18 | 6.18 | 52.46 | 46.48 | 369.50 | 40,785,840 | |||||||||||||||||||||||||||||||||||||||||||||||||
| BSVN |
Bank7 Corp. | SW | 45.33 | 9,463 | 428.9 | 50.10 | 32.49 | 43.57 | 4.04 | 5.52 | 10.61 | 4.50 | 4.51 | 26.52 | 25.26 | 207.51 | 1,963,640 | |||||||||||||||||||||||||||||||||||||||||||||||||
| BKU |
BankUnited, Inc. | SE | 47.97 | 74,138 | 3,556.4 | 52.11 | 28.21 | 47.51 | 0.97 | 16.69 | 7.63 | 3.53 | NA | 41.19 | 40.14 | 472.62 | 35,039,451 | |||||||||||||||||||||||||||||||||||||||||||||||||
| BWFG |
Bankwell Financial Group, Inc. | NE | 48.95 | 7,716 | 377.7 | 51.54 | 26.39 | 47.67 | 2.69 | 56.99 | 6.83 | 4.45 | NA | 38.16 | NA | 435.46 | 3,359,859 | |||||||||||||||||||||||||||||||||||||||||||||||||
| BANR |
Banner Corporation | WE | 63.09 | 34,098 | 2,151.2 | 71.75 | 54.01 | 61.11 | 3.24 | -10.73 | 0.69 | 5.64 | 5.71 | 57.08 | NA | 479.63 | 16,354,488 | |||||||||||||||||||||||||||||||||||||||||||||||||
| BHB |
Bar Harbor Bankshares | NE | 34.60 | 16,702 | 577.9 | 35.29 | 26.43 | 33.07 | 4.63 | 9.22 | 11.43 | 2.31 | 3.17 | 31.88 | 22.41 | 280.44 | 4,683,891 | |||||||||||||||||||||||||||||||||||||||||||||||||
| BCML |
BayCom Corp | WE | 29.39 | 10,814 | 317.8 | 33.15 | 22.22 | 29.55 | -0.54 | 5.00 | -0.03 | 2.18 | 2.26 | 31.10 | 27.37 | 239.84 | 2,593,677 | |||||||||||||||||||||||||||||||||||||||||||||||||
| BAFN |
BayFirst Financial Corp. | SE | 6.68 | 4,108 | 27.4 | 19.75 | 5.72 | 6.82 | -2.05 | -56.55 | -14.90 | -5.93 | -4.54 | 17.48 | NA | 316.51 | 1,300,258 | |||||||||||||||||||||||||||||||||||||||||||||||||
| BCBP |
BCB Bancorp, Inc. | MA | 8.25 | 17,274 | 142.1 | 11.07 | 7.31 | 7.67 | 7.56 | -23.82 | 2.23 | -0.84 | -0.13 | 16.15 | 15.85 | 189.85 | 3,279,466 | |||||||||||||||||||||||||||||||||||||||||||||||||
| BBT |
Beacon Financial Corporation | NE | 29.00 | 84,031 | 2,436.9 | 30.50 | 22.27 | 28.31 | 2.44 | -1.39 | 9.97 | 1.03 | 1.72 | 29.70 | 23.26 | 276.33 | 23,220,372 | |||||||||||||||||||||||||||||||||||||||||||||||||
| BRBS |
Blue Ridge Bankshares, Inc. | SE | 4.29 | 88,022 | 377.6 | 4.79 | 2.92 | 4.31 | -0.46 | 27.30 | 0.47 | 0.11 | NA | 3.54 | 3.51 | 27.64 | 2,432,589 | |||||||||||||||||||||||||||||||||||||||||||||||||
| BOKF |
BOK Financial Corporation | SW | 130.30 | 60,621 | 7,898.9 | 138.09 | 85.08 | 130.46 | -0.12 | 18.00 | 9.99 | 9.17 | 8.86 | 97.63 | 79.83 | 861.71 | 52,237,501 | |||||||||||||||||||||||||||||||||||||||||||||||||
| BWB |
Bridgewater Bancshares, Inc. | MW | 19.63 | 27,760 | 544.9 | 19.87 | 11.93 | 18.36 | 6.92 | 39.02 | 11.98 | 1.49 | 1.55 | 16.23 | 15.55 | 194.78 | 5,407,002 | |||||||||||||||||||||||||||||||||||||||||||||||||
| BYFC |
Broadway Financial Corporation | WE | 8.39 | 9,181 | 77.0 | 8.85 | 5.51 | 8.39 | -0.06 | 8.75 | 13.31 | -0.36 | -0.16 | 14.65 | 11.66 | 135.88 | 1,247,517 | |||||||||||||||||||||||||||||||||||||||||||||||||
| BHRB |
Burke & Herbert Financial Services Corp. | SE | 66.89 | 15,029 | 1,005.3 | 70.51 | 47.57 | 64.12 | 4.32 | 4.01 | 7.35 | 7.72 | 8.43 | 56.18 | 51.13 | 527.04 | 7,920,626 | |||||||||||||||||||||||||||||||||||||||||||||||||
| BFST |
Business First Bancshares, Inc. | SW | 28.83 | 32,708 | 943.0 | 28.99 | 20.07 | 27.46 | 4.99 | 6.82 | 10.29 | 2.79 | 2.91 | 27.95 | 23.36 | 251.15 | 8,214,740 | |||||||||||||||||||||||||||||||||||||||||||||||||
| BVFL |
BV Financial, Inc. | MA | 19.72 | 9,601 | 189.3 | 19.74 | 13.53 | 18.80 | 4.89 | 29.40 | 8.71 | 1.43 | 1.45 | 20.76 | 19.06 | 95.01 | 912,213 | |||||||||||||||||||||||||||||||||||||||||||||||||
| BY |
Byline Bancorp, Inc. | MW | 32.76 | 45,546 | 1,492.1 | 32.88 | 22.63 | 31.14 | 5.20 | 11.66 | 12.38 | 2.89 | 3.05 | 27.84 | NA | 211.93 | 9,652,676 | |||||||||||||||||||||||||||||||||||||||||||||||||
| CFFI |
C&F Financial Corporation | SE | 76.80 | 3,246 | 249.3 | 89.90 | 53.14 | 71.60 | 7.26 | 0.50 | 5.80 | 8.29 | NA | 80.64 | 72.60 | 852.90 | 2,768,494 | |||||||||||||||||||||||||||||||||||||||||||||||||
| BCAL |
California BanCorp | WE | 18.32 | 32,418 | 593.9 | 20.47 | 11.87 | 18.46 | -0.76 | 10.36 | -1.87 | 1.93 | 2.06 | 17.79 | 13.79 | 124.42 | 4,033,386 | |||||||||||||||||||||||||||||||||||||||||||||||||
| CAC |
Camden National Corporation | NE | 49.15 | 16,924 | 831.8 | 49.46 | 34.53 | 47.19 | 4.15 | 8.36 | 13.30 | 3.84 | 4.52 | 41.16 | 29.69 | 412.10 | 6,974,584 | |||||||||||||||||||||||||||||||||||||||||||||||||
| CBNK |
Capital Bancorp, Inc. | MA | 31.71 | 16,381 | 523.9 | 36.40 | 24.69 | 29.40 | 7.86 | 2.22 | 12.57 | 3.41 | 3.57 | 24.54 | 21.94 | 220.14 | 3,606,207 | |||||||||||||||||||||||||||||||||||||||||||||||||
| CCBG |
Capital City Bank Group, Inc. | SE | 42.53 | 17,084 | 725.9 | 46.83 | 32.38 | 44.64 | -4.73 | 15.29 | -0.09 | 3.60 | 3.29 | 32.36 | 27.15 | 256.72 | 4,385,765 | |||||||||||||||||||||||||||||||||||||||||||||||||
| COF |
Capital One Financial Corporation | SE | 223.68 | 625,100 | 139,822.4 | 259.64 | 143.22 | 220.18 | 1.59 | 9.80 | -7.71 | 3.36 | 7.01 | 173.11 | 100.98 | 1070.24 | 669,009,000 | |||||||||||||||||||||||||||||||||||||||||||||||||
| CFFN |
Capitol Federal Financial, Inc. | MW | 7.54 | 127,245 | 959.4 | 7.67 | 4.90 | 6.80 | 10.88 | 26.72 | 10.72 | 0.56 | 0.56 | 8.02 | NA | 76.85 | 9,778,400 | |||||||||||||||||||||||||||||||||||||||||||||||||
| CARE |
Carter Bankshares, Inc. | SE | 21.85 | 22,083 | 482.5 | 22.24 | 13.61 | 20.00 | 9.25 | 24.01 | 11.14 | 1.38 | 1.36 | 19.01 | 18.91 | 219.71 | 4,851,922 | |||||||||||||||||||||||||||||||||||||||||||||||||
| CLST |
Catalyst Bancorp, Inc. | SW | 15.55 | 4,161 | 64.7 | 15.97 | 10.67 | 15.68 | -0.83 | 32.64 | -1.27 | 0.56 | 0.51 | 20.06 | 20.06 | 68.00 | 282,927 | |||||||||||||||||||||||||||||||||||||||||||||||||
| CATY |
Cathay General Bancorp | WE | 52.57 | 67,200 | 3,532.7 | 54.99 | 36.06 | 49.98 | 5.18 | 10.70 | 8.64 | 4.54 | 4.47 | 43.53 | NA | 360.56 | 24,229,575 | |||||||||||||||||||||||||||||||||||||||||||||||||
| CBFV |
CB Financial Services, Inc. | MA | 36.41 | 5,037 | 183.4 | 37.45 | 26.01 | 35.09 | 3.76 | 22.18 | 4.45 | 0.92 | 4.45 | 31.28 | 29.35 | 307.29 | 1,547,693 | |||||||||||||||||||||||||||||||||||||||||||||||||
| CBC |
Central Bancompany, Inc. | MW | 24.90 | 238,443 | 5,937.2 | 25.43 | 9.80 | 24.58 | 1.30 | 82.82 | 3.23 | 1.75 | 1.83 | 15.69 | 14.24 | 87.03 | 20,751,978 | |||||||||||||||||||||||||||||||||||||||||||||||||
| CPF |
Central Pacific Financial Corp. | WE | 32.98 | 26,375 | 884.8 | 34.67 | 23.16 | 31.65 | 4.20 | 10.34 | 5.84 | 2.86 | NA | 22.47 | 22.47 | 280.92 | 7,409,241 | |||||||||||||||||||||||||||||||||||||||||||||||||
| CPBI |
Central Plains Bancshares, Inc. | MW | 17.62 | 3,919 | 69.0 | 17.75 | 13.00 | 17.70 | -0.45 | 19.05 | 4.14 | 0.97 | 0.97 | 20.43 | NA | 130.15 | 510,003 | |||||||||||||||||||||||||||||||||||||||||||||||||
| CFBK |
CF Bankshares Inc. | MW | 30.58 | 6,444 | 197.1 | 30.60 | 19.22 | 28.83 | 6.07 | 25.12 | 22.57 | 2.49 | 2.50 | 27.42 | 27.42 | 327.61 | 2,111,017 | |||||||||||||||||||||||||||||||||||||||||||||||||
| CBNA |
Chain Bridge Bancorp, Inc. | SE | 37.04 | 6,562 | 243.0 | 38.43 | 20.01 | 33.29 | 11.26 | 50.57 | 6.93 | 3.08 | 3.08 | 25.79 | 25.79 | 266.76 | 1,750,399 | |||||||||||||||||||||||||||||||||||||||||||||||||
| CHMG |
Chemung Financial Corporation | MA | 61.76 | 4,809 | 296.1 | 62.69 | 40.71 | 57.68 | 7.07 | 22.18 | 10.68 | 3.14 | 5.88 | 52.97 | 48.43 | 563.58 | 2,710,235 | |||||||||||||||||||||||||||||||||||||||||||||||||
| COFS |
ChoiceOne Financial Services, Inc. | MW | 29.65 | 15,001 | 444.8 | 35.40 | 24.89 | 28.94 | 2.45 | -11.52 | 0.44 | 2.01 | 3.27 | 31.02 | 20.29 | 294.02 | 4,410,551 | |||||||||||||||||||||||||||||||||||||||||||||||||
| C |
Citigroup Inc. | MA | 116.23 | 1,747,500 | 203,111.9 | 124.17 | 55.51 | 114.82 | 1.23 | 42.74 | -0.39 | 6.99 | 7.30 | 110.01 | 97.06 | 1520.57 | 2,657,202,000 | |||||||||||||||||||||||||||||||||||||||||||||||||
| CZNC |
Citizens & Northern Corporation | MA | 22.70 | 17,823 | 404.6 | 23.13 | 18.02 | 21.42 | 5.98 | 6.42 | 12.54 | 1.46 | NA | 19.17 | 14.97 | 175.75 | 3,132,469 | |||||||||||||||||||||||||||||||||||||||||||||||||
| CZWI |
Citizens Community Bancorp, Inc. | MW | 18.53 | 9,617 | 178.2 | 18.99 | 12.69 | 18.06 | 2.60 | 16.98 | 3.98 | 1.46 | 1.49 | 19.54 | 16.23 | 185.27 | 1,781,755 | |||||||||||||||||||||||||||||||||||||||||||||||||
| CFG |
Citizens Financial Group, Inc. | NE | 64.86 | 429,242 | 27,840.6 | 65.88 | 32.60 | 62.52 | 3.74 | 36.35 | 11.04 | 3.86 | 3.82 | 56.39 | 37.05 | 527.33 | 226,351,000 | |||||||||||||||||||||||||||||||||||||||||||||||||
| CZFS |
Citizens Financial Services, Inc. | MA | 65.36 | 4,807 | 314.2 | 69.30 | 49.96 | 64.70 | 1.02 | 7.79 | 14.63 | 7.62 | 7.69 | 70.32 | 52.14 | 637.51 | 3,064,564 | |||||||||||||||||||||||||||||||||||||||||||||||||
| CHCO |
City Holding Company | SE | 125.24 | 14,354 | 1,797.7 | 133.59 | 102.22 | 121.38 | 3.18 | 6.02 | 5.07 | 8.93 | 9.07 | 56.41 | 45.41 | 468.30 | 6,722,018 | |||||||||||||||||||||||||||||||||||||||||||||||||
| CIVB |
Civista Bancshares, Inc. | MW | 24.62 | 20,746 | 510.8 | 25.59 | 17.47 | 22.92 | 7.42 | 11.60 | 10.80 | 2.64 | 2.92 | 26.20 | NA | 209.02 | 4,336,453 | |||||||||||||||||||||||||||||||||||||||||||||||||
| CCNE |
CNB Financial Corporation | MA | 28.29 | 29,222 | 826.7 | 28.74 | 19.32 | 27.09 | 4.43 | 11.82 | 8.10 | 2.49 | 2.84 | 27.63 | 23.48 | 287.33 | 8,396,435 | |||||||||||||||||||||||||||||||||||||||||||||||||
| CCB |
Coastal Financial Corporation | WE | 98.41 | 15,140 | 1,489.9 | 120.05 | 76.11 | 109.70 | -10.29 | 10.35 | -14.12 | 3.06 | 3.21 | 32.43 | 32.13 | 313.17 | 4,741,437 | |||||||||||||||||||||||||||||||||||||||||||||||||
| COSO |
CoastalSouth Bancshares, Inc. | SE | 24.58 | 11,979 | 294.5 | 25.56 | 19.24 | 23.71 | 3.67 | 15.07 | 5.72 | 2.16 | 2.17 | 21.66 | 21.25 | 192.55 | 2,306,586 | |||||||||||||||||||||||||||||||||||||||||||||||||
| CBAN |
Colony Bankcorp, Inc. | SE | 20.11 | 21,251 | 427.4 | 20.23 | 13.99 | 18.59 | 8.18 | 19.35 | 12.85 | 1.59 | 1.78 | 17.69 | 14.31 | 175.77 | 3,735,401 | |||||||||||||||||||||||||||||||||||||||||||||||||
| COLB |
Columbia Banking System, Inc. | WE | 29.69 | 295,422 | 8,771.1 | 31.11 | 19.61 | 28.87 | 2.84 | 6.42 | 6.23 | 2.30 | 3.35 | 26.54 | NA | 226.23 | 66,832,000 | |||||||||||||||||||||||||||||||||||||||||||||||||
| CBSH |
Commerce Bancshares, Inc. | MW | 53.23 | 147,357 | 7,843.8 | 65.59 | 48.69 | 52.78 | 0.85 | -16.33 | 1.70 | 4.04 | 4.05 | 27.58 | NA | 223.37 | 32,915,089 | |||||||||||||||||||||||||||||||||||||||||||||||||
| CBK |
Commercial Bancgroup, Inc. | SE | 26.94 | 13,698 | 369.0 | 27.73 | 23.24 | 25.37 | 6.19 | 12.25 | 9.69 | 2.92 | 3.04 | 20.81 | 19.88 | 167.26 | 2,291,112 | |||||||||||||||||||||||||||||||||||||||||||||||||
| CMTV |
Community Bancorp | NE | 31.20 | 5,565 | 173.6 | 31.78 | 16.99 | 28.00 | 11.43 | 73.43 | 25.35 | 3.01 | NA | 20.36 | 18.29 | 231.38 | 1,287,559 | |||||||||||||||||||||||||||||||||||||||||||||||||
| CBU |
Community Financial System, Inc. | MA | 63.76 | 52,682 | 3,359.0 | 68.11 | 49.44 | 61.77 | 3.22 | -2.70 | 11.00 | 3.97 | 4.25 | 38.08 | 20.18 | 328.45 | 17,303,296 | |||||||||||||||||||||||||||||||||||||||||||||||||
| CTBI |
Community Trust Bancorp, Inc. | MW | 62.83 | 18,116 | 1,138.2 | 65.48 | 44.60 | 61.10 | 2.83 | 17.42 | 11.20 | 5.43 | 5.41 | 47.26 | 43.64 | 368.97 | 6,684,138 | |||||||||||||||||||||||||||||||||||||||||||||||||
| CWBC |
Community West Bancshares | WE | 24.84 | 19,163 | 476.0 | 25.05 | 15.57 | 23.71 | 4.77 | 27.45 | 10.40 | 2.00 | 2.07 | 21.37 | 15.89 | 192.57 | 3,690,317 | |||||||||||||||||||||||||||||||||||||||||||||||||
| CNOB |
ConnectOne Bancorp, Inc. | MA | 27.31 | 50,160 | 1,369.9 | 29.28 | 20.61 | 27.94 | -2.25 | 7.77 | 4.16 | 1.63 | 2.20 | 29.09 | 23.52 | 279.16 | 14,002,700 | |||||||||||||||||||||||||||||||||||||||||||||||||
| CFR |
Cullen/Frost Bankers, Inc. | SW | 139.06 | 63,287 | 8,891.6 | 145.53 | 100.31 | 136.33 | 2.00 | -0.24 | 9.82 | 9.92 | 9.93 | 69.96 | NA | 838.10 | 53,041,000 | |||||||||||||||||||||||||||||||||||||||||||||||||
| CUBI |
Customers Bancorp, Inc. | MA | 79.58 | 34,191 | 2,720.9 | 82.56 | 40.75 | 77.52 | 2.66 | 39.66 | 8.83 | 6.26 | 7.53 | 61.87 | 61.77 | 728.14 | 24,895,868 | |||||||||||||||||||||||||||||||||||||||||||||||||
| CVBF |
CVB Financial Corp. | WE | 20.12 | 135,552 | 2,726.6 | 21.34 | 16.01 | 19.84 | 1.39 | -3.48 | 8.15 | 1.52 | 1.58 | 16.93 | 11.24 | 115.31 | 15,631,054 | |||||||||||||||||||||||||||||||||||||||||||||||||
| DCOM |
Dime Community Bancshares, Inc. | MA | 35.36 | 43,862 | 1,551.0 | 35.56 | 23.25 | 33.09 | 6.86 | 13.22 | 17.51 | 2.36 | NA | 30.99 | 27.37 | 349.77 | 15,341,631 | |||||||||||||||||||||||||||||||||||||||||||||||||
| EBMT |
Eagle Bancorp Montana, Inc. | WE | 22.44 | 7,814 | 175.4 | 22.51 | 14.87 | 20.60 | 8.93 | 45.71 | 12.76 | 1.90 | 2.02 | 24.10 | 19.32 | 269.56 | 2,106,367 | |||||||||||||||||||||||||||||||||||||||||||||||||
| EGBN |
Eagle Bancorp, Inc. | MA | 27.27 | 30,360 | 827.9 | 29.26 | 15.03 | 26.31 | 3.65 | 4.04 | 27.31 | -4.21 | -3.73 | 37.59 | 37.59 | 345.76 | 10,497,203 | |||||||||||||||||||||||||||||||||||||||||||||||||
| EFSI |
Eagle Financial Services, Inc. | SE | 38.22 | 5,302 | 202.6 | 41.12 | 28.70 | 39.90 | -4.21 | 5.43 | -3.96 | 1.59 | 3.45 | 35.14 | 35.14 | 356.20 | 1,888,626 | |||||||||||||||||||||||||||||||||||||||||||||||||
| EWBC |
East West Bancorp, Inc. | WE | 114.63 | 137,579 | 15,770.7 | 119.73 | 68.27 | 113.52 | 0.98 | 11.32 | 1.99 | 9.52 | 9.46 | 64.68 | 61.30 | 584.65 | 80,434,997 | |||||||||||||||||||||||||||||||||||||||||||||||||
| EBC |
Eastern Bankshares, Inc. | NE | 21.20 | 225,666 | 4,784.1 | 21.25 | 13.51 | 20.12 | 5.37 | 15.47 | 15.03 | 0.43 | 1.73 | 18.42 | 12.90 | 135.54 | 30,586,900 | |||||||||||||||||||||||||||||||||||||||||||||||||
| ECBK |
ECB Bancorp, Inc. | NE | 17.94 | 8,797 | 157.8 | 18.49 | 13.47 | 17.40 | 3.10 | 33.18 | 3.16 | 0.79 | 0.79 | 19.18 | 19.18 | 176.50 | 1,552,653 | |||||||||||||||||||||||||||||||||||||||||||||||||
| EFSC |
Enterprise Financial Services Corp | MW | 58.71 | 36,965 | 2,170.2 | 62.60 | 45.22 | 55.92 | 4.99 | -1.89 | 8.72 | 5.31 | 4.77 | 53.22 | 41.37 | 468.03 | 17,300,884 | |||||||||||||||||||||||||||||||||||||||||||||||||
| EQBK |
Equity Bancshares, Inc. | MW | 47.13 | 18,945 | 892.9 | 50.07 | 34.11 | 45.48 | 3.63 | 8.10 | 5.55 | 1.23 | 4.02 | 38.64 | 32.86 | 336.40 | 6,373,172 | |||||||||||||||||||||||||||||||||||||||||||||||||
| ESQ |
Esquire Financial Holdings, Inc. | MA | 110.48 | 8,105 | 895.5 | 134.82 | 68.90 | 109.00 | 1.36 | 23.62 | 8.24 | 5.87 | NA | 33.86 | 33.86 | 291.86 | 2,365,661 | |||||||||||||||||||||||||||||||||||||||||||||||||
| FNB |
F.N.B. Corporation | MA | 17.84 | 357,303 | 6,374.3 | 18.30 | 10.88 | 17.38 | 2.65 | 13.70 | 4.33 | 1.56 | 1.58 | 18.92 | 11.87 | 140.58 | 50,229,000 | |||||||||||||||||||||||||||||||||||||||||||||||||
| FMAO |
Farmers & Merchants Bancorp, Inc. | MW | 27.69 | 13,592 | 376.4 | 28.39 | 20.88 | 26.13 | 5.97 | 1.91 | 12.01 | 2.32 | 2.42 | 26.31 | 19.71 | 249.47 | 3,390,752 | |||||||||||||||||||||||||||||||||||||||||||||||||
| FMNB |
Farmers National Banc Corp. | MW | 13.02 | 37,653 | 490.2 | 15.50 | 11.58 | 13.50 | -3.56 | -5.38 | -2.25 | 1.45 | 1.64 | 12.90 | 7.98 | 139.32 | 5,245,870 | |||||||||||||||||||||||||||||||||||||||||||||||||
| FBLA |
FB Bancorp, Inc. | SW | 13.14 | 18,362 | 241.3 | 13.29 | 9.81 | 12.74 | 3.14 | 12.40 | 2.26 | -0.23 | 0.08 | 17.05 | 17.05 | 68.85 | 1,264,141 | |||||||||||||||||||||||||||||||||||||||||||||||||
| FBK |
FB Financial Corporation | SE | 58.76 | 51,752 | 3,041.0 | 62.37 | 38.83 | 58.00 | 1.31 | 11.27 | 5.30 | 2.45 | 3.85 | 37.64 | 30.27 | 314.97 | 16,300,292 | |||||||||||||||||||||||||||||||||||||||||||||||||
| FDBC |
Fidelity D & D Bancorp, Inc. | MA | 46.50 | 5,771 | 268.2 | 50.00 | 37.00 | 44.09 | 5.47 | 3.79 | 6.82 | 4.86 | 5.04 | 41.39 | 37.88 | 476.17 | 2,748,058 | |||||||||||||||||||||||||||||||||||||||||||||||||
| FDSB |
Fifth District Bancorp, Inc. | SW | 15.18 | 5,559 | 84.4 | 15.64 | 11.35 | 15.05 | 0.86 | 17.14 | 1.20 | 0.73 | 0.73 | 23.77 | 23.77 | 97.04 | 539,500 | |||||||||||||||||||||||||||||||||||||||||||||||||
| FITB |
Fifth Third Bancorp | MW | 51.95 | 661,198 | 34,349.2 | 53.33 | 32.25 | 50.49 | 2.89 | 17.24 | 10.98 | 3.53 | 3.49 | 30.18 | 22.59 | 324.22 | 214,376,000 | |||||||||||||||||||||||||||||||||||||||||||||||||
| FISI |
Financial Institutions, Inc. | MA | 33.95 | 19,797 | 672.1 | 34.40 | 20.97 | 32.07 | 5.86 | 28.74 | 8.92 | 3.61 | 3.54 | 30.89 | 27.84 | 316.92 | 6,274,140 | |||||||||||||||||||||||||||||||||||||||||||||||||
| FNWD |
Finward Bancorp | MW | 37.02 | 4,327 | 160.2 | 39.99 | 26.12 | 36.48 | 1.48 | 39.33 | 5.20 | 1.88 | 2.24 | 40.37 | 34.92 | 467.14 | 2,021,181 | |||||||||||||||||||||||||||||||||||||||||||||||||
| FINW |
FinWise Bancorp | SW | 18.86 | 13,656 | 257.6 | 22.49 | 13.49 | 17.99 | 4.84 | 1.78 | 5.13 | 1.13 | 1.13 | 14.15 | 13.89 | 71.55 | 977,135 | |||||||||||||||||||||||||||||||||||||||||||||||||
| FBNC |
First Bancorp | SE | 58.68 | 41,466 | 2,433.2 | 62.31 | 34.50 | 57.53 | 2.00 | 32.97 | 15.53 | 2.68 | 4.07 | 39.89 | 27.93 | 305.51 | 12,668,339 | |||||||||||||||||||||||||||||||||||||||||||||||||
| FBP |
First BanCorp. | MA | 22.49 | 155,583 | 3,499.1 | 22.75 | 16.40 | 20.89 | 7.66 | 8.33 | 8.49 | 2.15 | NA | 12.56 | 12.29 | 122.98 | 19,132,892 | |||||||||||||||||||||||||||||||||||||||||||||||||
| FRBA |
First Bank | MA | 16.76 | 24,800 | 415.7 | 18.11 | 12.74 | 16.77 | -0.06 | 10.19 | 1.82 | 1.74 | NA | 17.88 | 15.81 | 159.60 | 3,958,036 | |||||||||||||||||||||||||||||||||||||||||||||||||
| BUSE |
First Busey Corporation | MW | 25.44 | 87,624 | 2,229.2 | 26.08 | 18.40 | 24.72 | 2.91 | 4.78 | 6.94 | 1.47 | 2.23 | 25.72 | NA | 206.62 | 18,104,736 | |||||||||||||||||||||||||||||||||||||||||||||||||
| FCAP |
First Capital, Inc. | MW | 57.96 | 3,348 | 194.0 | 71.00 | 31.25 | 51.96 | 11.55 | 81.13 | -2.09 | 4.89 | 4.92 | NA | NA | 379.97 | 1,271,995 | |||||||||||||||||||||||||||||||||||||||||||||||||
| FCNC.A |
First Citizens BancShares, Inc. | SE | 2097.35 | 12,055 | 24,934.7 | 2245.34 | 1473.62 | 2014.66 | 4.10 | -4.87 | -2.28 | 165.24 | 175.75 | 1718.65 | 1674.09 | 19053.94 | 229,698,000 | |||||||||||||||||||||||||||||||||||||||||||||||||
| FCF |
First Commonwealth Financial Corporation | MA | 18.27 | 102,501 | 1,872.7 | 18.48 | 13.54 | 17.53 | 4.22 | 9.53 | 8.36 | 1.47 | 1.54 | 15.11 | 11.22 | 120.42 | 12,343,036 | |||||||||||||||||||||||||||||||||||||||||||||||||
| FCBC |
First Community Bankshares, Inc. | SE | 37.84 | 18,335 | 693.8 | 45.57 | 31.21 | 33.94 | 11.49 | -12.75 | 12.18 | 2.65 | 2.86 | 27.30 | 18.84 | 177.78 | 3,259,643 | |||||||||||||||||||||||||||||||||||||||||||||||||
| FCCO |
First Community Corporation | SE | 30.21 | 7,693 | 232.4 | 31.50 | 19.46 | 28.72 | 5.19 | 16.51 | 1.89 | 2.47 | NA | 21.78 | 19.84 | 267.47 | 2,057,732 | |||||||||||||||||||||||||||||||||||||||||||||||||
| FFBC |
First Financial Bancorp. | MW | 29.17 | 98,522 | 2,873.9 | 29.68 | 21.10 | 27.14 | 7.48 | 4.10 | 16.59 | 2.66 | 3.02 | 28.11 | NA | 214.46 | 21,129,379 | |||||||||||||||||||||||||||||||||||||||||||||||||
| FFIN |
First Financial Bankshares, Inc. | SW | 32.41 | 142,282 | 4,611.4 | 38.74 | 29.44 | 32.05 | 1.12 | -13.02 | 8.50 | 1.77 | 1.77 | 13.39 | 11.20 | 108.56 | 15,446,476 | |||||||||||||||||||||||||||||||||||||||||||||||||
| THFF |
First Financial Corporation | MW | 65.89 | 11,851 | 780.8 | 66.61 | 42.05 | 62.74 | 5.02 | 36.73 | 9.05 | 6.24 | 6.62 | 52.50 | 42.75 | 478.43 | 5,669,686 | |||||||||||||||||||||||||||||||||||||||||||||||||
| FGBI |
First Guaranty Bancshares, Inc. | SW | 9.26 | 15,793 | 146.2 | 10.55 | 4.31 | 8.24 | 12.38 | -9.92 | 72.44 | -4.17 | -3.40 | 12.23 | 12.08 | 258.23 | 4,078,321 | |||||||||||||||||||||||||||||||||||||||||||||||||
| FHB |
First Hawaiian, Inc. | WE | 26.38 | 122,689 | 3,236.5 | 28.35 | 20.32 | 27.48 | -4.00 | -4.49 | 4.27 | 2.20 | 2.20 | 22.57 | 14.46 | 195.25 | 23,955,252 | |||||||||||||||||||||||||||||||||||||||||||||||||
| FHN |
First Horizon Corporation | SE | 24.82 | 485,000 | 12,037.7 | 25.21 | 15.19 | 24.23 | 2.43 | 13.39 | 3.85 | 1.87 | 1.87 | 17.52 | 14.19 | 172.94 | 83,876,000 | |||||||||||||||||||||||||||||||||||||||||||||||||
| INBK |
First Internet Bancorp | MW | 23.00 | 8,687 | 199.8 | 34.21 | 17.05 | 22.67 | 1.46 | -29.38 | 10.21 | -4.03 | -0.57 | 41.41 | NA | 641.38 | 5,571,647 | |||||||||||||||||||||||||||||||||||||||||||||||||
| Exhibit IV-1A |
|
|||||||||||||||||||||||||||||||||||||||||||||||||||||||||||||||||
| Weekly Bank and Thrift Market Line—Part One |
|
|||||||||||||||||||||||||||||||||||||||||||||||||||||||||||||||||
| Prices As of February 2, 2026 |
|
|||||||||||||||||||||||||||||||||||||||||||||||||||||||||||||||||
| Market Capitalization | Price Change Data | Current Per Share Financials | ||||||||||||||||||||||||||||||||||||||||||||||||||||||||||||||||
| Price/ | Shares | Market | 52 Week (1) | % Change From | LTM | LTM Core | BV/ | TBV/ | Assets/ | Assets | ||||||||||||||||||||||||||||||||||||||||||||||||||||||||
| Share(1) | Outstanding | Capitalization | High | Low | Last Wk | Last Wk | 52 Wks (2) | MRY (2) | EPS (3) | EPS (3) | Share | Share (4) | Share | |||||||||||||||||||||||||||||||||||||||||||||||||||||
| ($) | (000) | ($Mil) | ($) | ($) | ($) | (%) | (%) | (%) | ($) | ($) | ($) | ($) | ($) | |||||||||||||||||||||||||||||||||||||||||||||||||||||
| Companies |
||||||||||||||||||||||||||||||||||||||||||||||||||||||||||||||||||
| FIBK |
First Interstate BancSystem, Inc. |
WE | 36.81 | 101,106 | 3,721.7 | 38.78 | 22.95 | 36.72 | 0.25 | 11.71 | 6.39 | 2.94 | 2.61 | 34.09 | 22.40 | 263.49 | 26,640,600 | |||||||||||||||||||||||||||||||||||||||||||||||||
| FRME |
First Merchants Corporation |
MW | 40.89 | 56,952 | 2,328.8 | 45.62 | 33.13 | 38.01 | 7.58 | -7.99 | 9.10 | 3.88 | 3.96 | 42.87 | 30.13 | 334.06 | 19,025,101 | |||||||||||||||||||||||||||||||||||||||||||||||||
| FMBH |
First Mid Bancshares, Inc. |
MW | 43.58 | 23,986 | 1,045.3 | 44.32 | 27.58 | 42.30 | 3.03 | 14.90 | 11.74 | 3.83 | 3.94 | 39.97 | NA | 332.13 | 7,966,658 | |||||||||||||||||||||||||||||||||||||||||||||||||
| FXNC |
First National Corporation |
SE | 27.01 | 9,025 | 243.8 | 27.55 | 18.26 | 25.96 | 4.04 | 6.34 | 7.01 | 1.97 | 2.21 | 20.63 | 18.83 | 225.88 | 2,038,694 | |||||||||||||||||||||||||||||||||||||||||||||||||
| FNWB |
First Northwest Bancorp |
WE | 10.78 | 8,814 | 95.0 | 12.10 | 6.05 | 10.50 | 2.67 | -1.55 | 14.93 | -0.48 | -0.77 | 16.61 | 16.50 | 239.16 | 2,107,895 | |||||||||||||||||||||||||||||||||||||||||||||||||
| FSEA |
First Seacoast Bancorp, Inc. |
NE | 13.07 | 4,356 | 56.9 | 15.00 | 10.10 | 12.80 | 2.11 | 26.89 | -0.98 | -0.51 | -0.51 | 13.44 | 13.40 | 139.94 | 609,627 | |||||||||||||||||||||||||||||||||||||||||||||||||
| FUNC |
First United Corporation |
MA | 39.56 | 6,497 | 257.0 | 42.50 | 24.66 | 36.90 | 7.21 | 21.42 | 5.66 | 3.83 | 3.86 | 30.65 | 28.87 | 311.53 | 2,023,974 | |||||||||||||||||||||||||||||||||||||||||||||||||
| FUSB |
First US Bancshares, Inc. |
SE | 15.94 | 5,700 | 90.9 | 15.99 | 10.30 | 14.41 | 10.62 | 29.59 | 14.10 | 1.00 | NA | 18.54 | 17.23 | 202.60 | 1,154,785 | |||||||||||||||||||||||||||||||||||||||||||||||||
| MYFW |
First Western Financial, Inc. |
SW | 25.60 | 9,726 | 249.0 | 28.00 | 17.52 | 25.61 | -0.04 | 21.33 | -4.51 | 1.34 | 1.36 | 27.30 | 24.07 | 324.40 | 3,154,981 | |||||||||||||||||||||||||||||||||||||||||||||||||
| FSBC |
Five Star Bancorp |
WE | 40.14 | 21,367 | 857.7 | 40.59 | 22.22 | 38.80 | 3.45 | 32.00 | 12.19 | 2.90 | NA | 20.87 | 20.87 | 222.53 | 4,754,861 | |||||||||||||||||||||||||||||||||||||||||||||||||
| FLG |
Flagstar Bank, National Association |
MA | 13.50 | 415,982 | 5,615.8 | 13.85 | 9.64 | 12.99 | 3.93 | 14.12 | 7.23 | -0.50 | -0.16 | 18.37 | 17.45 | 210.37 | 87,512,000 | |||||||||||||||||||||||||||||||||||||||||||||||||
| FRAF |
Franklin Financial Services Corporation |
MA | 51.59 | 4,427 | 228.4 | 59.95 | 32.39 | 48.41 | 6.57 | 49.15 | 2.77 | 4.74 | NA | 39.11 | 37.10 | 505.76 | 2,239,018 | |||||||||||||||||||||||||||||||||||||||||||||||||
| FSBW |
FS Bancorp, Inc. |
WE | 42.73 | 7,405 | 316.4 | 44.22 | 34.61 | 41.00 | 4.22 | 5.66 | 3.79 | 4.29 | 4.49 | 40.98 | 39.11 | 431.74 | 3,196,847 | |||||||||||||||||||||||||||||||||||||||||||||||||
| FULT |
Fulton Financial Corporation |
MA | 21.03 | 179,895 | 3,783.2 | 21.29 | 14.33 | 20.43 | 2.94 | 3.39 | 8.79 | 2.08 | 2.19 | 18.33 | 14.92 | 178.54 | 32,118,400 | |||||||||||||||||||||||||||||||||||||||||||||||||
| FVCB |
FVCBankcorp, Inc. |
SE | 15.51 | 17,918 | 277.9 | 15.64 | 9.49 | 15.01 | 3.33 | 28.50 | 11.50 | 1.21 | NA | 14.15 | 13.75 | 127.93 | 2,292,256 | |||||||||||||||||||||||||||||||||||||||||||||||||
| GBFH |
GBank Financial Holdings Inc. |
WE | 32.99 | 14,385 | 474.6 | 45.00 | 27.30 | 33.70 | -2.11 | -21.36 | -2.66 | 1.44 | 1.54 | 11.52 | 11.52 | 94.51 | 1,359,491 | |||||||||||||||||||||||||||||||||||||||||||||||||
| GABC |
German American Bancorp, Inc. |
MW | 43.20 | 37,496 | 1,619.8 | 43.35 | 32.75 | 40.58 | 6.46 | 4.52 | 10.26 | 3.06 | 3.41 | 31.00 | 20.08 | 223.73 | 8,388,780 | |||||||||||||||||||||||||||||||||||||||||||||||||
| GBCI |
Glacier Bancorp, Inc. |
WE | 50.71 | 129,972 | 6,590.9 | 51.75 | 36.76 | 48.52 | 4.51 | 2.09 | 15.12 | 1.99 | 2.19 | 32.42 | 21.01 | 246.04 | 31,978,063 | |||||||||||||||||||||||||||||||||||||||||||||||||
| GSBC |
Great Southern Bancorp, Inc. |
MW | 62.41 | 11,062 | 690.4 | 67.70 | 47.57 | 60.37 | 3.38 | 6.16 | 1.38 | 6.19 | 6.12 | 57.50 | 56.63 | 506.10 | 5,598,606 | |||||||||||||||||||||||||||||||||||||||||||||||||
| HWC |
Hancock Whitney Corporation |
SE | 69.74 | 82,259 | 5,736.7 | 71.20 | 43.90 | 67.42 | 3.44 | 16.74 | 9.52 | 5.67 | 5.82 | 54.22 | 42.16 | 431.23 | 35,472,762 | |||||||||||||||||||||||||||||||||||||||||||||||||
| HAFC |
Hanmi Financial Corporation |
WE | 27.44 | 29,636 | 813.2 | 30.20 | 19.25 | 28.41 | -3.41 | 14.24 | 1.52 | 2.51 | 2.48 | 26.64 | NA | 265.53 | 7,869,185 | |||||||||||||||||||||||||||||||||||||||||||||||||
| HNVR |
Hanover Bancorp, Inc. |
MA | 23.41 | 7,410 | 173.5 | 26.93 | 18.31 | 23.85 | -1.84 | -11.96 | 1.30 | 1.00 | 1.32 | NA | NA | 321.59 | 2,383,096 | |||||||||||||||||||||||||||||||||||||||||||||||||
| HWBK |
Hawthorn Bancshares, Inc. |
MW | 34.91 | 6,898 | 240.8 | 36.49 | 25.21 | 32.25 | 8.25 | 6.76 | 0.09 | 3.43 | 3.42 | 25.13 | 25.13 | 274.71 | 1,894,850 | |||||||||||||||||||||||||||||||||||||||||||||||||
| HBT |
HBT Financial, Inc. |
MW | 27.92 | 31,432 | 877.6 | 29.33 | 19.46 | 26.76 | 4.33 | 14.80 | 8.01 | 2.44 | 2.55 | 19.58 | 17.20 | 161.35 | 5,071,390 | |||||||||||||||||||||||||||||||||||||||||||||||||
| HFWA |
Heritage Financial Corporation |
WE | 26.45 | 41,131 | 1,087.9 | 28.35 | 19.84 | 26.35 | 0.38 | 2.92 | 11.84 | 1.96 | 2.25 | 27.13 | 19.98 | 169.39 | 6,967,350 | |||||||||||||||||||||||||||||||||||||||||||||||||
| HTH |
Hilltop Holdings Inc. |
SW | 37.96 | 59,540 | 2,260.1 | 38.74 | 27.35 | 35.93 | 5.65 | 25.78 | 11.84 | 2.64 | NA | 36.42 | 31.83 | 266.12 | 15,844,994 | |||||||||||||||||||||||||||||||||||||||||||||||||
| HIFS |
Hingham Institution for Savings |
NE | 303.99 | 2,182 | 663.4 | 320.00 | 209.71 | 303.97 | 0.01 | 19.10 | 7.05 | 24.76 | 14.44 | 219.82 | 219.82 | 2081.64 | 4,542,654 | |||||||||||||||||||||||||||||||||||||||||||||||||
| HBCP |
Home Bancorp, Inc. |
SW | 61.03 | 7,831 | 477.9 | 64.17 | 39.59 | 60.47 | 0.93 | 21.57 | 5.59 | 5.87 | 6.07 | 55.56 | 44.84 | 445.98 | 3,492,626 | |||||||||||||||||||||||||||||||||||||||||||||||||
| HOMB |
Home Bancshares, Inc. (Conway, AR) |
SE | 29.21 | 196,357 | 5,735.6 | 31.27 | 24.22 | 28.54 | 2.35 | -3.25 | 5.15 | 2.41 | 2.39 | 21.88 | 14.60 | 116.53 | 22,881,879 | |||||||||||||||||||||||||||||||||||||||||||||||||
| HFBL |
Home Federal Bancorp, Inc. of Louisiana |
SW | 18.23 | 3,002 | 54.7 | 20.00 | 12.31 | 19.13 | -4.70 | 43.54 | 1.28 | 1.68 | 1.75 | 18.76 | 17.53 | 207.00 | 621,449 | |||||||||||||||||||||||||||||||||||||||||||||||||
| HTB |
HomeTrust Bancshares, Inc. |
SE | 44.19 | 17,141 | 757.5 | 47.64 | 30.95 | 42.10 | 4.96 | 20.18 | 2.91 | 3.72 | 3.73 | 34.75 | 32.50 | 265.19 | 4,545,635 | |||||||||||||||||||||||||||||||||||||||||||||||||
| HOPE |
Hope Bancorp, Inc. |
WE | 12.21 | 128,202 | 1,565.3 | 12.38 | 8.83 | 11.78 | 3.65 | 4.72 | 11.41 | 0.49 | NA | 17.81 | NA | 144.55 | 18,531,626 | |||||||||||||||||||||||||||||||||||||||||||||||||
| HBNC |
Horizon Bancorp, Inc. |
MW | 17.96 | 50,978 | 915.6 | 19.07 | 12.70 | 17.38 | 3.34 | 6.97 | 5.90 | -3.24 | 2.14 | 13.50 | 10.32 | 126.26 | 6,436,611 | |||||||||||||||||||||||||||||||||||||||||||||||||
| HYNE |
Hoyne Bancorp, Inc. |
MW | 14.47 | 8,097 | 117.2 | 14.85 | 13.35 | 14.45 | 0.14 | 3.36 | -0.14 | NA | NA | NA | NA | 56.16 | 454,754 | |||||||||||||||||||||||||||||||||||||||||||||||||
| HBAN |
Huntington Bancshares Incorporated |
MW | 17.88 | 1,567,733 | 28,031.1 | 18.91 | 11.92 | 17.34 | 3.11 | 3.95 | 3.05 | 1.39 | 1.49 | 13.78 | 9.86 | 143.59 | 225,106,000 | |||||||||||||||||||||||||||||||||||||||||||||||||
| INDB |
Independent Bank Corp. |
NE | 82.09 | 49,244 | 4,042.4 | 82.69 | 52.15 | 78.65 | 4.37 | 22.23 | 12.33 | 4.44 | NA | 72.41 | 47.55 | 505.91 | 24,912,896 | |||||||||||||||||||||||||||||||||||||||||||||||||
| IBCP |
Independent Bank Corporation |
MW | 36.34 | 20,549 | 746.7 | 37.13 | 26.75 | 34.93 | 4.04 | -0.16 | 11.71 | 3.27 | 3.30 | 24.48 | 23.05 | 267.93 | 5,505,720 | |||||||||||||||||||||||||||||||||||||||||||||||||
| IBOC |
International Bancshares Corporation |
SW | 71.89 | 62,164 | 4,469.0 | 73.66 | 54.11 | 68.35 | 5.18 | 9.11 | 8.20 | 6.76 | 6.73 | 50.32 | 45.77 | 266.25 | 16,551,421 | |||||||||||||||||||||||||||||||||||||||||||||||||
| ISTR |
Investar Holding Corporation |
SW | 29.44 | 13,754 | 404.9 | 31.77 | 15.39 | 28.17 | 4.51 | 54.38 | 10.18 | 2.13 | 2.20 | 27.63 | 23.42 | 205.98 | 2,833,048 | |||||||||||||||||||||||||||||||||||||||||||||||||
| ISBA |
Isabella Bank Corporation |
MW | 49.73 | 7,335 | 364.8 | 58.83 | 21.50 | 50.75 | -2.01 | 92.75 | -0.54 | 2.46 | 2.52 | 30.94 | 24.37 | 308.06 | 2,259,654 | |||||||||||||||||||||||||||||||||||||||||||||||||
| JMSB |
John Marshall Bancorp, Inc. |
SE | 20.93 | 14,146 | 296.1 | 21.58 | 13.81 | 20.00 | 4.65 | 10.68 | 4.70 | 1.49 | NA | 18.70 | 18.70 | 164.89 | 2,332,550 | |||||||||||||||||||||||||||||||||||||||||||||||||
| JPM |
JPMorgan Chase & Co. |
MA | 308.14 | 2,696,200 | 830,807.1 | 337.25 | 202.16 | 301.04 | 2.36 | 15.28 | -4.37 | 20.02 | 19.65 | 126.99 | 106.48 | 1641.16 | 4,424,900,000 | |||||||||||||||||||||||||||||||||||||||||||||||||
| KRNY |
Kearny Financial Corp. |
MA | 8.07 | 62,833 | 507.1 | 8.50 | 5.45 | 7.71 | 4.67 | 16.96 | 8.91 | 0.52 | 0.52 | 11.70 | NA | 121.29 | 7,620,878 | |||||||||||||||||||||||||||||||||||||||||||||||||
| KEY |
KeyCorp | MW | 22.00 | 1,102,401 | 24,252.8 | 22.07 | 12.73 | 21.29 | 3.33 | 22.36 | 6.59 | 1.52 | 1.52 | 16.22 | 13.72 | 167.25 | 184,381,000 | |||||||||||||||||||||||||||||||||||||||||||||||||
| LSBK |
Lake Shore Bancorp, Inc. |
MA | 15.50 | 7,311 | 113.3 | 16.95 | 11.50 | 15.50 | 0.00 | -0.90 | 5.73 | 0.97 | NA | 18.10 | 18.10 | 99.48 | 727,323 | |||||||||||||||||||||||||||||||||||||||||||||||||
| LKFN |
Lakeland Financial Corporation |
MW | 60.76 | 25,220 | 1,532.3 | 70.80 | 50.00 | 61.30 | -0.88 | -10.70 | 6.48 | 4.01 | 4.02 | 30.23 | 30.03 | 277.17 | 6,990,022 | |||||||||||||||||||||||||||||||||||||||||||||||||
| LARK |
Landmark Bancorp, Inc. |
MW | 27.82 | 6,074 | 169.0 | 29.56 | 21.31 | 26.99 | 3.08 | 20.16 | 6.22 | 3.07 | 3.21 | 26.44 | 20.79 | 264.49 | 1,606,642 | |||||||||||||||||||||||||||||||||||||||||||||||||
| LCNB |
LCNB Corp. | MW | 17.56 | 14,194 | 249.2 | 17.84 | 13.34 | 16.80 | 4.52 | 13.58 | 7.14 | 1.63 | NA | 19.30 | 12.45 | 157.87 | 2,240,769 | |||||||||||||||||||||||||||||||||||||||||||||||||
| LC |
LendingClub Corporation |
WE | 16.86 | 115,369 | 1,945.1 | 21.67 | 7.90 | 21.31 | -20.88 | 24.98 | -10.98 | 1.16 | 1.16 | 13.01 | NA | 100.27 | 11,567,816 | |||||||||||||||||||||||||||||||||||||||||||||||||
| LOB |
Live Oak Bancshares, Inc. |
SE | 41.15 | 46,032 | 1,894.2 | 42.89 | 22.68 | 39.24 | 4.87 | 15.95 | 19.80 | 2.23 | 1.88 | 25.06 | NA | 328.79 | 15,134,778 | |||||||||||||||||||||||||||||||||||||||||||||||||
| MTB |
M&T Bank Corporation |
MA | 225.54 | 151,840 | 34,246.0 | 226.10 | 150.75 | 214.25 | 5.27 | 12.08 | 11.94 | 17.00 | 16.65 | 173.49 | 117.32 | 1406.15 | 213,510,000 | |||||||||||||||||||||||||||||||||||||||||||||||||
| MGYR |
Magyar Bancorp, Inc. |
MA | 17.75 | 6,536 | 116.0 | 19.04 | 13.52 | 17.87 | -0.67 | 23.78 | 2.72 | 1.73 | 1.73 | 18.79 | NA | 159.96 | 1,045,498 | |||||||||||||||||||||||||||||||||||||||||||||||||
| MNSB |
MainStreet Bancshares, Inc. |
SE | 22.38 | 7,251 | 162.3 | 22.98 | 15.00 | 20.17 | 10.96 | 34.74 | 9.92 | 1.76 | 1.91 | 25.52 | 25.52 | 305.16 | 2,212,669 | |||||||||||||||||||||||||||||||||||||||||||||||||
| MBBC |
Marathon Bancorp, Inc. |
MW | 12.94 | 2,939 | 38.0 | 13.03 | 9.14 | 12.61 | 2.62 | 26.89 | 6.41 | 0.13 | 0.13 | 15.75 | 15.75 | 83.71 | 245,988 | |||||||||||||||||||||||||||||||||||||||||||||||||
| MCHB |
Mechanics Bancorp |
WE | 15.69 | 221,305 | 3,472.3 | 15.91 | 6.45 | 14.66 | 7.03 | 95.45 | 7.25 | 1.22 | 1.00 | 12.37 | 7.81 | 101.00 | 22,351,475 | |||||||||||||||||||||||||||||||||||||||||||||||||
| MBWM |
Mercantile Bank Corporation |
MW | 53.46 | 17,181 | 918.5 | 54.60 | 37.76 | 51.02 | 4.78 | 9.53 | 11.14 | 5.47 | 5.51 | 42.19 | 36.78 | 397.83 | 6,835,219 | |||||||||||||||||||||||||||||||||||||||||||||||||
| MBIN |
Merchants Bancorp |
MW | 42.64 | 45,893 | 1,956.9 | 43.77 | 27.25 | 35.36 | 20.59 | 1.69 | 25.19 | 3.78 | 3.78 | 37.68 | 37.51 | 423.79 | 19,448,943 | |||||||||||||||||||||||||||||||||||||||||||||||||
| MRBK |
Meridian Corporation |
MA | 19.26 | 11,693 | 225.2 | 19.45 | 11.16 | 18.26 | 5.48 | 15.19 | 9.56 | 1.89 | 1.87 | 16.75 | NA | 218.98 | 2,560,420 | |||||||||||||||||||||||||||||||||||||||||||||||||
| MCBS |
MetroCity Bankshares, Inc. |
SE | 29.26 | 28,818 | 843.2 | 32.37 | 24.24 | 27.31 | 7.14 | -5.18 | 10.25 | 2.64 | NA | 18.89 | 16.14 | 165.47 | 4,768,395 | |||||||||||||||||||||||||||||||||||||||||||||||||
| MCB |
Metropolitan Bank Holding Corp. |
MA | 94.62 | 10,089 | 954.6 | 96.75 | 47.08 | 88.77 | 6.59 | 47.54 | 23.91 | 6.62 | 6.51 | 73.66 | 72.69 | 818.32 | 8,255,716 | |||||||||||||||||||||||||||||||||||||||||||||||||
| MPB |
Mid Penn Bancorp, Inc. |
MA | 33.83 | 23,047 | 779.7 | 35.15 | 22.50 | 31.64 | 6.92 | 12.32 | 9.06 | 2.53 | 2.99 | 35.32 | 28.76 | 266.14 | 6,133,896 | |||||||||||||||||||||||||||||||||||||||||||||||||
| MSBI |
Midland States Bancorp, Inc. |
MW | 23.25 | 21,170 | 492.2 | 24.57 | 14.24 | 23.05 | 0.87 | 20.72 | 9.83 | -6.12 | 0.53 | 21.49 | 20.70 | 307.57 | 6,511,127 | |||||||||||||||||||||||||||||||||||||||||||||||||
| MVBF |
MVB Financial Corp. |
SE | 29.40 | 12,722 | 374.0 | 29.59 | 15.59 | 28.05 | 4.81 | 50.69 | 13.82 | 2.46 | -0.37 | 26.07 | 25.91 | 254.12 | 3,232,953 | |||||||||||||||||||||||||||||||||||||||||||||||||
| NBHC |
National Bank Holdings Corporation |
SW | 40.62 | 37,773 | 1,534.3 | 44.11 | 32.83 | 40.31 | 0.77 | -5.82 | 6.87 | 2.85 | NA | 36.67 | NA | 261.66 | 9,883,518 | |||||||||||||||||||||||||||||||||||||||||||||||||
| NKSH |
National Bankshares, Inc. |
SE | 37.36 | 6,363 | 237.7 | 37.65 | 23.75 | 36.15 | 3.35 | 27.12 | 11.42 | 2.49 | 2.79 | 29.04 | 27.12 | 286.72 | 1,824,506 | |||||||||||||||||||||||||||||||||||||||||||||||||
| NBBK |
NB Bancorp, Inc. |
NE | 22.05 | 36,709 | 809.4 | 22.31 | 15.09 | 20.55 | 7.30 | 15.08 | 11.25 | 1.33 | 1.70 | 18.77 | 17.98 | 190.86 | 7,006,130 | |||||||||||||||||||||||||||||||||||||||||||||||||
| NBTB |
NBT Bancorp Inc. |
MA | 45.41 | 52,315 | 2,375.6 | 49.18 | 37.31 | 43.91 | 3.42 | -4.66 | 9.37 | 3.33 | 3.82 | 36.32 | 26.53 | 305.75 | 15,995,121 | |||||||||||||||||||||||||||||||||||||||||||||||||
| NEWT |
NewtekOne, Inc. |
SE | 13.44 | 28,658 | 385.2 | 14.91 | 9.12 | 13.76 | -2.33 | 1.20 | 18.41 | 2.18 | 1.29 | 12.19 | 11.68 | 95.78 | 2,744,819 | |||||||||||||||||||||||||||||||||||||||||||||||||
| NIC |
Nicolet Bankshares, Inc. |
MW | 148.55 | 14,667 | 2,178.8 | 148.72 | 97.90 | 143.60 | 3.45 | 32.48 | 22.46 | 9.78 | NA | NA | NA | 626.25 | 9,185,107 | |||||||||||||||||||||||||||||||||||||||||||||||||
| NBN |
Northeast Bank |
NE | 119.14 | 8,555 | 1,019.3 | 121.48 | 78.17 | 114.25 | 4.28 | 17.73 | 14.63 | 10.37 | 10.35 | 57.78 | NA | 578.27 | 4,947,308 | |||||||||||||||||||||||||||||||||||||||||||||||||
| NECB |
Northeast Community Bancorp, Inc. |
MA | 24.44 | 14,027 | 342.8 | 25.49 | 19.27 | 23.03 | 6.12 | -1.45 | 8.09 | 3.25 | 3.22 | 25.19 | 25.19 | 147.11 | 2,063,508 | |||||||||||||||||||||||||||||||||||||||||||||||||
| NTRS |
Northern Trust Corporation |
MW | 151.62 | 186,338 | 28,252.6 | 157.60 | 81.62 | 149.65 | 1.32 | 35.03 | 11.00 | 8.74 | 8.78 | 64.79 | NA | 950.60 | 177,132,700 | |||||||||||||||||||||||||||||||||||||||||||||||||
| NPB |
Northpointe Bancshares, Inc. |
MW | 17.77 | 34,494 | 613.0 | 19.48 | 11.43 | 17.89 | -0.67 | 22.55 | 5.90 | 2.11 | NA | 15.77 | 15.73 | 203.59 | 7,022,825 | |||||||||||||||||||||||||||||||||||||||||||||||||
| NRIM |
Northrim BanCorp, Inc. |
WE | 24.48 | 22,112 | 541.3 | 30.82 | 16.18 | 23.92 | 2.34 | 15.02 | -8.00 | 2.87 | 2.44 | 14.77 | NA | 148.80 | 3,290,273 | |||||||||||||||||||||||||||||||||||||||||||||||||
| NWBI |
Northwest Bancshares, Inc. |
MW | 13.04 | 146,108 | 1,905.2 | 13.62 | 10.75 | 12.66 | 3.00 | -1.29 | 8.67 | 0.92 | 1.20 | 12.94 | 9.63 | 114.75 | 16,766,617 | |||||||||||||||||||||||||||||||||||||||||||||||||
| NWFL |
Norwood Financial Corp. |
MA | 31.44 | 9,246 | 290.7 | 32.12 | 21.25 | 28.19 | 11.53 | 18.11 | 12.09 | 3.01 | 3.12 | 26.06 | 22.90 | 262.26 | 2,424,842 | |||||||||||||||||||||||||||||||||||||||||||||||||
| NSTS |
NSTS Bancorp, Inc. |
MW | 12.52 | 4,888 | 61.2 | 13.32 | 10.72 | 12.65 | -1.03 | 3.90 | -3.32 | -0.12 | -0.12 | 15.07 | 15.07 | 55.21 | 269,842 | |||||||||||||||||||||||||||||||||||||||||||||||||
| OVLY |
Oak Valley Bancorp |
WE | 32.31 | 8,256 | 266.7 | 32.87 | 22.70 | 32.13 | 0.56 | 24.89 | 7.49 | 2.88 | NA | 24.79 | 24.40 | 245.06 | 2,023,116 | |||||||||||||||||||||||||||||||||||||||||||||||||
| OCFC |
OceanFirst Financial Corp. |
MA | 19.01 | 57,391 | 1,091.0 | 20.61 | 14.29 | 18.35 | 3.60 | 5.85 | 5.91 | 1.17 | NA | 28.97 | 19.79 | 253.78 | 14,564,317 | |||||||||||||||||||||||||||||||||||||||||||||||||
| OFG |
OFG Bancorp | MA | 40.73 | 43,257 | 1,761.9 | 46.11 | 33.15 | 37.15 | 9.64 | -4.64 | -0.61 | 4.58 | NA | 32.13 | 29.96 | 288.18 | 12,465,657 | |||||||||||||||||||||||||||||||||||||||||||||||||
| OVBC |
Ohio Valley Banc Corp. |
MW | 41.51 | 4,711 | 195.6 | 42.00 | 23.00 | 40.32 | 2.95 | 74.05 | 3.83 | 3.31 | 3.94 | 36.14 | 34.59 | 335.95 | 1,582,654 | |||||||||||||||||||||||||||||||||||||||||||||||||
| ONB |
Old National Bancorp |
MW | 24.91 | 389,662 | 9,706.5 | 25.06 | 16.83 | 23.69 | 5.15 | 4.44 | 11.65 | 1.79 | NA | 21.17 | 13.71 | 185.17 | 72,151,967 | |||||||||||||||||||||||||||||||||||||||||||||||||
| OSBC |
Old Second Bancorp, Inc. |
MW | 20.24 | 52,669 | 1,066.0 | 22.00 | 14.14 | 19.88 | 1.81 | 7.72 | 3.79 | 1.62 | 1.93 | 17.03 | 14.12 | 131.06 | 6,902,675 | |||||||||||||||||||||||||||||||||||||||||||||||||
| OPBK |
OP Bancorp | WE | 14.50 | 14,890 | 215.9 | 15.27 | 10.43 | 13.56 | 6.93 | 9.19 | 2.69 | 1.72 | NA | 15.31 | NA | 177.99 | 2,650,226 | |||||||||||||||||||||||||||||||||||||||||||||||||
| OPHC |
OptimumBank Holdings, Inc. |
SE | 4.86 | 11,534 | 56.1 | 4.94 | 3.53 | 4.80 | 1.25 | 6.58 | 14.35 | 0.71 | 0.71 | 10.39 | 10.39 | 96.38 | 1,111,679 | |||||||||||||||||||||||||||||||||||||||||||||||||
| OBT |
Orange County Bancorp, Inc. |
MA | 31.85 | 13,367 | 425.7 | 32.66 | 20.97 | 29.80 | 6.88 | 23.12 | 11.56 | 3.02 | 2.71 | 20.21 | 19.76 | 197.24 | 2,636,450 | |||||||||||||||||||||||||||||||||||||||||||||||||
| OBK |
Origin Bancorp, Inc. |
SW | 44.18 | 30,952 | 1,367.5 | 44.88 | 28.80 | 40.76 | 8.39 | 16.51 | 17.47 | 2.40 | 2.81 | 40.28 | 35.04 | 314.18 | 9,724,722 | |||||||||||||||||||||||||||||||||||||||||||||||||
| ORRF |
Orrstown Financial Services, Inc. |
MA | 37.46 | 19,507 | 730.7 | 38.38 | 25.57 | 36.04 | 3.94 | 3.08 | 5.76 | 4.18 | 4.68 | 30.32 | 24.80 | 284.11 | 5,542,255 | |||||||||||||||||||||||||||||||||||||||||||||||||
| PRK |
Park National Corporation |
MW | 166.27 | 16,078 | 2,673.3 | 179.48 | 137.97 | 161.34 | 3.06 | -2.03 | 9.26 | 11.11 | 11.17 | 84.14 | 74.06 | 609.83 | 9,805,013 | |||||||||||||||||||||||||||||||||||||||||||||||||
| PKBK |
Parke Bancorp, Inc. |
MA | 28.26 | 11,596 | 327.7 | 28.61 | 16.94 | 27.34 | 3.37 | 39.62 | 12.86 | 3.16 | 3.16 | NA | NA | 193.99 | 2,249,436 | |||||||||||||||||||||||||||||||||||||||||||||||||
| PBHC |
Pathfinder Bancorp, Inc. |
MA | 13.68 | 6,186 | 84.6 | 17.50 | 13.35 | 14.24 | -3.93 | -17.99 | -3.05 | -0.54 | -0.19 | 19.56 | 17.87 | 230.40 | 1,425,152 | |||||||||||||||||||||||||||||||||||||||||||||||||
| CASH |
Pathward Financial, Inc. |
MW | 91.08 | 22,170 | 2,019.2 | 92.37 | 64.45 | 85.43 | 6.61 | 14.24 | 28.28 | 8.21 | NA | 38.55 | 24.58 | 341.02 | 7,560,205 | |||||||||||||||||||||||||||||||||||||||||||||||||
| PNBK |
Patriot National Bancorp, Inc. |
NE | 1.60 | 122,258 | 195.6 | 7.47 | 0.90 | 1.53 | 4.58 | 2.56 | -12.09 | -2.60 | -2.52 | 0.83 | 0.82 | 7.78 | 950,752 | |||||||||||||||||||||||||||||||||||||||||||||||||
| PCB |
PCB Bancorp | WE | 22.96 | 14,114 | 324.0 | 24.04 | 16.00 | 21.98 | 4.46 | 19.03 | 6.05 | 2.58 | 2.61 | 22.55 | NA | 232.53 | 3,281,771 | |||||||||||||||||||||||||||||||||||||||||||||||||
| PGC |
Peapack- Gladstone Financial Corporation |
MA | 33.01 | 17,424 | 575.2 | 35.41 | 23.96 | 29.43 | 12.16 | 4.30 | 18.53 | 2.10 | 2.09 | 37.49 | 34.99 | 431.95 | 7,526,409 | |||||||||||||||||||||||||||||||||||||||||||||||||
| PEBO |
Peoples Bancorp Inc. |
MW | 32.59 | 34,939 | 1,138.7 | 33.83 | 26.21 | 31.70 | 2.81 | -0.18 | 8.52 | 2.99 | NA | 33.78 | 22.80 | 276.19 | 9,649,630 | |||||||||||||||||||||||||||||||||||||||||||||||||
| PEBK |
Peoples Bancorp of North Carolina, Inc. |
SE | 36.98 | 5,309 | 196.3 | 38.46 | 23.74 | 35.89 | 3.04 | 29.80 | 2.15 | 3.62 | 3.28 | 28.78 | 28.78 | 320.61 | 1,702,148 | |||||||||||||||||||||||||||||||||||||||||||||||||
| PFIS |
Peoples Financial Services Corp. |
MA | 53.87 | 9,995 | 538.4 | 54.73 | 38.90 | 50.75 | 6.15 | 4.66 | 10.59 | 5.88 | 6.56 | 52.01 | 41.64 | 527.34 | 5,270,578 | |||||||||||||||||||||||||||||||||||||||||||||||||
| PNFP |
Pinnacle Financial Partners, Inc. |
SE | 98.13 | 150,543 | 14,772.8 | 126.81 | 81.57 | 95.90 | 2.33 | -21.35 | 2.85 | 8.07 | 8.32 | 87.90 | 63.71 | 383.32 | 57,706,053 | |||||||||||||||||||||||||||||||||||||||||||||||||
| PLBC |
Plumas Bancorp |
WE | 51.96 | 6,959 | 361.6 | 52.30 | 38.71 | 49.85 | 4.23 | 13.95 | 16.27 | 4.54 | 4.83 | 37.52 | 32.44 | 321.67 | 2,238,523 | |||||||||||||||||||||||||||||||||||||||||||||||||
| PDLB |
Ponce Financial Group, Inc. |
MA | 16.95 | 22,799 | 386.5 | 18.01 | 10.88 | 16.44 | 3.10 | 27.73 | 3.67 | 1.20 | 1.16 | 13.12 | 13.12 | 141.41 | 3,223,970 | |||||||||||||||||||||||||||||||||||||||||||||||||
| BPOP |
Popular, Inc. | MA | 136.69 | 65,719 | 8,983.2 | 136.86 | 78.23 | 122.87 | 11.25 | 32.79 | 9.77 | 12.30 | 12.27 | 94.75 | 82.65 | 1146.52 | 75,348,267 | |||||||||||||||||||||||||||||||||||||||||||||||||
| PFBC |
Preferred Bank |
WE | 87.54 | 12,178 | 1,066.0 | 103.05 | 71.90 | 83.54 | 4.79 | -4.18 | -7.30 | 10.41 | 10.41 | 64.83 | 64.80 | 624.19 | 7,601,165 | |||||||||||||||||||||||||||||||||||||||||||||||||
| FRST |
Primis Financial Corp. |
SE | 14.10 | 24,695 | 347.5 | 14.38 | 7.59 | 13.45 | 4.83 | 27.14 | 1.37 | 2.49 | 0.55 | 17.12 | 13.34 | 163.89 | 4,047,388 | |||||||||||||||||||||||||||||||||||||||||||||||||
| BPRN |
Princeton Bancorp, Inc. |
MA | 37.50 | 6,766 | 253.7 | 37.99 | 27.25 | 36.30 | 3.31 | 22.87 | 8.10 | 2.71 | 2.86 | 40.01 | 37.47 | 337.44 | 2,283,147 | |||||||||||||||||||||||||||||||||||||||||||||||||
| PB |
Prosperity Bancshares, Inc. |
SW | 69.71 | 97,543 | 6,799.7 | 81.53 | 61.07 | 71.97 | -3.14 | -12.86 | 0.87 | 5.72 | 5.84 | 81.84 | 43.64 | 394.32 | 38,463,425 | |||||||||||||||||||||||||||||||||||||||||||||||||
| PROV |
Provident Financial Holdings, Inc. |
WE | 16.14 | 6,415 | 104.5 | 16.36 | 12.98 | 16.13 | 0.06 | 0.62 | 1.45 | 0.99 | NA | 19.87 | 19.87 | 191.42 | 1,227,892 | |||||||||||||||||||||||||||||||||||||||||||||||||
| PFS |
Provident Financial Services, Inc. |
MA | 22.70 | 130,620 | 2,965.1 | 22.97 | 14.34 | 20.59 | 10.25 | 22.24 | 14.94 | 2.23 | 2.22 | 21.69 | 15.70 | 191.25 | 24,980,710 | |||||||||||||||||||||||||||||||||||||||||||||||||
| QCRH |
QCR Holdings, Inc. |
MW | 92.35 | 16,691 | 1,541.4 | 92.87 | 60.83 | 87.17 | 5.95 | 18.76 | 10.86 | 7.49 | 7.72 | 66.64 | 57.86 | 573.70 | 9,575,470 | |||||||||||||||||||||||||||||||||||||||||||||||||
Exhibit IV-1A
Weekly Bank and Thrift Market Line—Part One
Prices As of February 2, 2026
| Market Capitalization | Price Change Data | Current Per Share Financials | ||||||||||||||||||||||||||||||||||||||||||||||||||||||||||||||||
| Price/ | Shares | Market | 52 Week (1) | % Change From | LTM | LTM Core | BV/ | TBV/ | Assets/ | Assets | ||||||||||||||||||||||||||||||||||||||||||||||||||||||||
| Share(1) | Outstanding | Capitalization | High | Low | Last Wk | Last Wk | 52 Wks (2) | MRY (2) | EPS (3) | EPS (3) | Share | Share (4) | Share | |||||||||||||||||||||||||||||||||||||||||||||||||||||
| ($) | (000) | ($Mil) | ($) | ($) | ($) | (%) | (%) | (%) | ($) | ($) | ($) | ($) | ($) | |||||||||||||||||||||||||||||||||||||||||||||||||||||
| Companies |
||||||||||||||||||||||||||||||||||||||||||||||||||||||||||||||||||
| RBB |
RBB Bancorp | WE | 21.34 | 17,057 | 364.0 | 22.59 | 14.40 | 21.57 | -1.07 | 13.45 | 3.39 | 1.83 | 1.60 | 30.68 | NA | 246.71 | 4,208,294 | |||||||||||||||||||||||||||||||||||||||||||||||||
| RRBI |
Red River Bancshares, Inc. | SW | 87.39 | 6,577 | 574.7 | 87.93 | 46.33 | 76.67 | 13.98 | 56.61 | 22.34 | 6.38 | 6.33 | 55.52 | 55.29 | 509.52 | 3,350,910 | |||||||||||||||||||||||||||||||||||||||||||||||||
| RF |
Regions Financial Corporation | SE | 29.12 | 868,000 | 25,276.2 | 29.26 | 17.74 | 27.74 | 4.97 | 18.18 | 7.45 | 2.30 | 2.35 | 20.36 | 13.60 | 183.82 | 159,553,000 | |||||||||||||||||||||||||||||||||||||||||||||||||
| RNST |
Renasant Corporation | SE | 37.82 | 94,636 | 3,579.1 | 40.40 | 26.97 | 37.27 | 1.48 | -2.73 | 7.38 | 2.07 | 2.76 | 41.05 | 24.65 | 282.68 | 26,751,426 | |||||||||||||||||||||||||||||||||||||||||||||||||
| RBCA.A |
Republic Bancorp, Inc. | MW | 73.42 | 19,541 | 1,434.7 | 78.25 | 56.79 | 71.43 | 2.79 | 12.18 | 6.42 | 6.72 | NA | 56.41 | 54.26 | 360.37 | 7,042,061 | |||||||||||||||||||||||||||||||||||||||||||||||||
| RMBI |
Richmond Mutual Bancorporation, Inc. | MW | 14.30 | 9,664 | 138.2 | 15.24 | 11.37 | 14.19 | 0.78 | -0.83 | 1.85 | 1.17 | NA | 13.88 | 13.88 | 157.88 | 1,525,790 | |||||||||||||||||||||||||||||||||||||||||||||||||
| RVSB |
Riverview Bancorp, Inc. | WE | 5.40 | 20,711 | 111.8 | 6.59 | 4.74 | 5.10 | 5.88 | -4.26 | 7.57 | 0.23 | NA | 7.93 | 6.62 | 73.02 | 1,512,311 | |||||||||||||||||||||||||||||||||||||||||||||||||
| STBA |
S&T Bancorp, Inc. | MA | 43.21 | 37,403 | 1,616.2 | 43.90 | 30.84 | 41.98 | 2.93 | 9.56 | 9.81 | 3.49 | 3.55 | 39.14 | 29.09 | 263.91 | 9,870,980 | |||||||||||||||||||||||||||||||||||||||||||||||||
| SBFG |
SB Financial Group, Inc. | MW | 22.52 | 6,270 | 141.2 | 24.48 | 17.10 | 22.07 | 2.04 | 0.67 | 1.12 | 2.19 | 2.31 | 22.65 | 18.00 | 246.48 | 1,545,367 | |||||||||||||||||||||||||||||||||||||||||||||||||
| SBCF |
Seacoast Banking Corporation of Florida | SE | 33.39 | 96,854 | 3,233.9 | 35.46 | 21.36 | 33.40 | -0.03 | 17.36 | 6.27 | 1.58 | 2.08 | NA | NA | 215.19 | 20,842,331 | |||||||||||||||||||||||||||||||||||||||||||||||||
| SFBS |
ServisFirst Bancshares, Inc. | SE | 84.33 | 54,625 | 4,606.5 | 93.89 | 66.48 | 81.81 | 3.08 | -6.99 | 17.47 | 5.06 | 5.30 | 33.86 | 33.62 | 324.53 | 17,727,190 | |||||||||||||||||||||||||||||||||||||||||||||||||
| SHBI |
Shore Bancshares, Inc. | MA | 19.42 | 33,414 | 648.9 | 19.64 | 11.47 | 18.43 | 5.37 | 18.78 | 9.84 | 1.78 | NA | 17.65 | 14.87 | 187.31 | 6,258,818 | |||||||||||||||||||||||||||||||||||||||||||||||||
| BSRR |
Sierra Bancorp | WE | 37.13 | 13,089 | 486.0 | 38.00 | 22.42 | 34.30 | 8.25 | 23.19 | 13.62 | 3.11 | 3.10 | 27.49 | 25.42 | 292.55 | 3,829,279 | |||||||||||||||||||||||||||||||||||||||||||||||||
| SFNC |
Simmons First National Corporation | SE | 20.58 | 144,763 | 2,979.2 | 23.44 | 17.00 | 20.01 | 2.85 | -9.42 | 9.18 | -2.95 | 1.87 | 23.62 | 13.91 | 169.52 | 24,540,877 | |||||||||||||||||||||||||||||||||||||||||||||||||
| SMBK |
SmartFinancial, Inc. | SE | 41.88 | 17,029 | 713.2 | 42.96 | 26.31 | 39.07 | 7.19 | 18.77 | 13.22 | 2.98 | 3.13 | 32.44 | 26.84 | 344.16 | 5,860,810 | |||||||||||||||||||||||||||||||||||||||||||||||||
| SFBC |
Sound Financial Bancorp, Inc. | WE | 44.01 | 2,551 | 112.3 | 52.86 | 42.75 | 44.02 | -0.02 | -16.74 | 0.87 | 2.77 | 2.77 | 42.60 | 42.30 | 428.17 | 1,092,173 | |||||||||||||||||||||||||||||||||||||||||||||||||
| SPFI |
South Plains Financial, Inc. | SW | 42.80 | 16,294 | 697.4 | 43.90 | 30.01 | 41.32 | 3.58 | 19.12 | 10.31 | 3.44 | 3.49 | 30.31 | 29.05 | 274.99 | 4,480,500 | |||||||||||||||||||||||||||||||||||||||||||||||||
| SFST |
Southern First Bancshares, Inc. | SE | 56.43 | 8,213 | 462.1 | 58.77 | 29.14 | 54.04 | 4.42 | 53.34 | 9.53 | 3.75 | 3.80 | 44.89 | 44.89 | 536.16 | 4,403,494 | |||||||||||||||||||||||||||||||||||||||||||||||||
| SMBC |
Southern Missouri Bancorp, Inc. | MW | 64.30 | 11,143 | 716.5 | 65.64 | 45.10 | 60.68 | 5.97 | 8.65 | 8.76 | 5.78 | 6.09 | 50.92 | NA | 457.19 | 5,094,387 | |||||||||||||||||||||||||||||||||||||||||||||||||
| SBSI |
Southside Bancshares, Inc. | SW | 33.10 | 29,723 | 983.8 | 33.96 | 25.85 | 32.23 | 2.70 | 5.31 | 8.92 | 2.29 | NA | 28.52 | 21.72 | 286.46 | 8,514,590 | |||||||||||||||||||||||||||||||||||||||||||||||||
| SSB |
SouthState Bank Corporation | SE | 102.97 | 99,138 | 10,208.3 | 108.18 | 77.74 | 100.35 | 2.61 | -2.48 | 9.41 | 7.87 | 9.49 | 91.38 | 56.27 | 677.82 | 67,197,412 | |||||||||||||||||||||||||||||||||||||||||||||||||
| SRBK |
SR Bancorp, Inc. | MA | 17.17 | 8,011 | 137.6 | 17.21 | 11.36 | 16.63 | 3.25 | 36.16 | 9.09 | 0.53 | 0.51 | 22.35 | 19.25 | 142.67 | 1,142,961 | |||||||||||||||||||||||||||||||||||||||||||||||||
| STT |
State Street Corporation | NE | 132.58 | 279,078 | 37,000.1 | 137.05 | 72.81 | 127.59 | 3.91 | 30.47 | 2.77 | 9.40 | 10.33 | 87.01 | 54.42 | 1311.63 | 366,047,000 | |||||||||||||||||||||||||||||||||||||||||||||||||
| SYBT |
Stock Yards Bancorp, Inc. | MW | 68.63 | 29,479 | 2,023.1 | 83.83 | 60.75 | 68.01 | 0.91 | -6.89 | 5.67 | 4.75 | 4.85 | 36.49 | 29.50 | 323.49 | 9,536,124 | |||||||||||||||||||||||||||||||||||||||||||||||||
| SSBI |
Summit State Bank | WE | 13.74 | 6,772 | 93.0 | 14.00 | 6.95 | 13.58 | 1.18 | 86.68 | 18.14 | 1.01 | 1.01 | 14.94 | NA | 148.35 | 1,004,586 | |||||||||||||||||||||||||||||||||||||||||||||||||
| TCBI |
Texas Capital Bancshares, Inc. | SW | 102.48 | 44,254 | 4,535.1 | 105.36 | 59.37 | 97.63 | 4.97 | 29.80 | 13.19 | 6.79 | NA | 75.28 | 75.25 | 712.72 | 31,540,274 | |||||||||||||||||||||||||||||||||||||||||||||||||
| TCBS |
Texas Community Bancshares, Inc. | SW | 17.00 | 2,721 | 46.3 | 20.00 | 15.01 | 17.55 | -3.13 | 8.14 | -5.40 | 0.85 | 0.87 | 18.22 | 18.21 | 161.50 | 439,485 | |||||||||||||||||||||||||||||||||||||||||||||||||
| TBBK |
The Bancorp, Inc. | MA | 62.77 | 42,355 | 2,658.4 | 81.65 | 40.51 | 67.50 | -7.01 | 2.79 | -7.04 | 4.92 | 4.89 | 16.29 | 16.27 | 220.81 | 9,352,425 | |||||||||||||||||||||||||||||||||||||||||||||||||
| BK |
The Bank of New York Mellon Corporation | MA | 121.61 | 688,236 | 83,696.4 | 125.89 | 70.46 | 119.02 | 2.18 | 41.52 | 4.75 | 7.40 | 7.36 | 57.36 | 28.90 | 686.25 | 472,300,000 | |||||||||||||||||||||||||||||||||||||||||||||||||
| FNLC |
The First Bancorp, Inc. | NE | 27.95 | 11,222 | 313.7 | 28.60 | 22.11 | 27.10 | 3.14 | 8.17 | 5.71 | 3.07 | 3.07 | 25.23 | 22.49 | 282.14 | 3,166,303 | |||||||||||||||||||||||||||||||||||||||||||||||||
| PNC |
The PNC Financial Services Group, Inc. | MA | 227.63 | 390,414 | 88,869.9 | 227.88 | 145.12 | 220.75 | 3.12 | 13.28 | 9.05 | 16.59 | 16.36 | 140.44 | 111.91 | 1469.14 | 573,572,000 | |||||||||||||||||||||||||||||||||||||||||||||||||
| TCBX |
Third Coast Bancshares, Inc. | SW | 42.13 | 13,891 | 585.2 | 42.63 | 25.17 | 39.75 | 5.99 | 16.87 | 10.84 | 3.79 | 3.88 | 33.47 | 32.12 | 384.47 | 5,340,759 | |||||||||||||||||||||||||||||||||||||||||||||||||
| TSBK |
Timberland Bancorp, Inc. | WE | 39.12 | 7,880 | 308.3 | 39.99 | 27.51 | 36.53 | 7.09 | 30.31 | 9.27 | 3.86 | NA | 34.06 | 32.11 | 254.59 | 2,006,127 | |||||||||||||||||||||||||||||||||||||||||||||||||
| TMP |
Tompkins Financial Corporation | MA | 81.12 | 14,345 | 1,163.7 | 81.73 | 54.16 | 76.14 | 6.54 | 15.77 | 11.86 | 11.24 | 5.45 | 65.07 | 60.03 | 604.26 | 8,668,268 | |||||||||||||||||||||||||||||||||||||||||||||||||
| TOWN |
TowneBank | SE | 35.66 | 77,878 | 2,777.1 | 38.01 | 29.43 | 36.15 | -1.36 | -0.31 | 6.86 | 2.21 | 2.91 | 30.67 | 21.93 | 252.80 | 19,687,341 | |||||||||||||||||||||||||||||||||||||||||||||||||
| TCBK |
TriCo Bancshares | WE | 51.04 | 32,335 | 1,659.4 | 52.05 | 35.20 | 49.48 | 3.15 | 16.34 | 7.75 | 3.70 | 3.79 | 41.07 | 31.52 | 303.76 | 9,822,063 | |||||||||||||||||||||||||||||||||||||||||||||||||
| TFIN |
Triumph Financial, Inc. | SW | 64.02 | 23,765 | 1,521.5 | 79.08 | 42.90 | 70.56 | -9.27 | -16.92 | 2.22 | 0.93 | NA | 37.73 | 20.77 | 268.48 | 6,380,588 | |||||||||||||||||||||||||||||||||||||||||||||||||
| TFC |
Truist Financial Corporation | SE | 52.66 | 1,262,470 | 66,481.7 | 52.72 | 33.56 | 50.19 | 4.92 | 10.58 | 7.01 | 3.82 | 4.18 | 47.74 | 33.18 | 433.70 | 547,538,000 | |||||||||||||||||||||||||||||||||||||||||||||||||
| TRST |
TrustCo Bank Corp NY | MA | 44.65 | 18,029 | 805.0 | 48.45 | 27.18 | 42.51 | 5.03 | 38.84 | 8.03 | 3.25 | 3.25 | 38.08 | 38.05 | 357.24 | 6,440,700 | |||||||||||||||||||||||||||||||||||||||||||||||||
| TRMK |
Trustmark Corporation | SE | 43.01 | 59,012 | 2,578.8 | 43.55 | 29.77 | 40.91 | 5.13 | 14.69 | 10.42 | 3.70 | 3.67 | 35.95 | 30.28 | 320.70 | 18,925,211 | |||||||||||||||||||||||||||||||||||||||||||||||||
| USB |
U.S. Bancorp | MW | 57.36 | 1,554,434 | 89,162.3 | 57.42 | 35.18 | 55.83 | 2.74 | 20.05 | 7.50 | 4.62 | 4.89 | 37.55 | 28.30 | 445.40 | 692,345,000 | |||||||||||||||||||||||||||||||||||||||||||||||||
| UMBF |
UMB Financial Corporation | MW | 128.05 | 75,961 | 9,726.8 | 129.98 | 82.00 | 122.50 | 4.53 | 8.61 | 11.31 | 9.29 | 11.54 | 97.41 | 66.78 | 962.26 | 73,094,090 | |||||||||||||||||||||||||||||||||||||||||||||||||
| UNB |
Union Bankshares, Inc. | NE | 24.86 | 4,582 | 113.9 | 36.00 | 20.65 | 24.24 | 2.56 | -22.07 | 4.76 | NA | NA | NA | NA | 353.52 | 1,620,000 | |||||||||||||||||||||||||||||||||||||||||||||||||
| UBCP |
United Bancorp, Inc. | MW | 14.00 | 5,774 | 80.8 | 15.64 | 12.25 | 13.95 | 0.36 | 11.91 | -2.44 | 1.30 | 1.30 | 11.16 | 11.04 | 150.11 | 866,756 | |||||||||||||||||||||||||||||||||||||||||||||||||
| UBSI |
United Bankshares, Inc. | SE | 43.07 | 139,552 | 6,010.5 | 43.78 | 30.51 | 41.38 | 4.08 | 11.87 | 12.16 | 3.27 | 3.30 | 39.29 | 24.63 | 0.00 | 33,660,281 | |||||||||||||||||||||||||||||||||||||||||||||||||
| UCB |
United Community Banks, Inc. | SE | 34.99 | 120,598 | 4,219.7 | 35.72 | 22.93 | 33.57 | 4.23 | 5.49 | 12.08 | 2.62 | 2.76 | 30.17 | NA | 0.00 | 28,002,554 | |||||||||||||||||||||||||||||||||||||||||||||||||
| UNTY |
Unity Bancorp, Inc. | MA | 55.52 | 9,982 | 554.2 | 57.24 | 36.65 | 52.33 | 6.10 | 14.83 | 7.35 | 5.67 | 5.20 | 34.63 | NA | 0.00 | 2,966,652 | |||||||||||||||||||||||||||||||||||||||||||||||||
| UVSP |
Univest Financial Corporation | MA | 34.38 | 28,157 | 978.9 | 35.65 | 22.83 | 33.44 | 2.80 | 13.11 | 4.99 | 3.13 | 3.09 | 33.50 | 27.20 | 0.00 | 8,436,897 | |||||||||||||||||||||||||||||||||||||||||||||||||
| USCB |
USCB Financial Holdings, Inc. | SE | 19.43 | 18,138 | 352.4 | 20.79 | 15.39 | 19.35 | 0.41 | 2.37 | 5.48 | 1.33 | 1.64 | 11.97 | 11.97 | 0.00 | 2,791,540 | |||||||||||||||||||||||||||||||||||||||||||||||||
| VLY |
Valley National Bancorp | MA | 12.62 | 556,618 | 7,024.5 | 12.97 | 7.48 | 12.13 | 4.04 | 22.76 | 8.05 | 1.01 | 1.01 | 13.39 | NA | 0.00 | 64,132,725 | |||||||||||||||||||||||||||||||||||||||||||||||||
| VABK |
Virginia National Bankshares Corporation | SE | 42.00 | 5,393 | 226.5 | 44.57 | 34.12 | 40.43 | 3.88 | 15.19 | 5.40 | 3.55 | 3.67 | 34.15 | 32.21 | 0.00 | 1,649,742 | |||||||||||||||||||||||||||||||||||||||||||||||||
| WAFD |
WaFd, Inc. | WE | 33.07 | 76,448 | 2,528.1 | 33.92 | 23.75 | 31.82 | 3.93 | 11.42 | 3.25 | 2.89 | 2.97 | 35.70 | 29.91 | 0.00 | 27,285,744 | |||||||||||||||||||||||||||||||||||||||||||||||||
| WASH |
Washington Trust Bancorp, Inc. | NE | 35.26 | 19,035 | 671.2 | 35.70 | 24.95 | 30.18 | 16.83 | 7.60 | 19.32 | 2.71 | 2.72 | 28.56 | 24.97 | 0.00 | 6,621,694 | |||||||||||||||||||||||||||||||||||||||||||||||||
| WSBF |
Waterstone Financial, Inc. | MW | 18.76 | 19,076 | 352.2 | 18.86 | 11.61 | 17.55 | 6.89 | 36.54 | 13.35 | 1.48 | 1.48 | 19.03 | NA | 0.00 | 2,259,507 | |||||||||||||||||||||||||||||||||||||||||||||||||
| WBS |
Webster Financial Corporation | NE | 66.00 | 161,216 | 10,640.3 | 67.43 | 39.43 | 64.63 | 2.12 | 9.56 | 4.86 | 5.90 | 6.06 | 57.12 | 37.20 | 0.00 | 84,073,663 | |||||||||||||||||||||||||||||||||||||||||||||||||
| WFC |
Wells Fargo & Company | WE | 92.27 | 3,092,619 | 285,355.9 | 97.76 | 58.42 | 88.05 | 4.79 | 17.09 | -1.00 | 6.26 | 6.11 | 53.19 | 44.63 | 0.00 | 2,148,631,000 | |||||||||||||||||||||||||||||||||||||||||||||||||
| WSBC |
WesBanco, Inc. | SE | 36.01 | 96,068 | 3,459.4 | 37.18 | 26.42 | 34.90 | 3.18 | 2.77 | 8.33 | 2.23 | 3.11 | 39.64 | 21.70 | 0.00 | 27,696,333 | |||||||||||||||||||||||||||||||||||||||||||||||||
| WTBA |
West Bancorporation, Inc. | MW | 25.54 | 16,941 | 432.7 | 25.74 | 17.31 | 22.74 | 12.31 | 16.46 | 15.10 | 1.92 | 2.10 | 15.70 | 15.70 | 0.00 | 4,142,244 | |||||||||||||||||||||||||||||||||||||||||||||||||
| WABC |
Westamerica Bancorporation | WE | 51.15 | 24,623 | 1,259.5 | 52.84 | 42.00 | 49.91 | 2.48 | -1.18 | 6.94 | 4.52 | 4.52 | 37.91 | 32.97 | 0.00 | 5,960,180 | |||||||||||||||||||||||||||||||||||||||||||||||||
| WAL |
Western Alliance Bancorporation | WE | 89.65 | 108,100 | 9,691.2 | 93.81 | 57.05 | 88.42 | 1.39 | 2.03 | 6.64 | 8.73 | 8.17 | 67.20 | 61.27 | 0.00 | 92,774,000 | |||||||||||||||||||||||||||||||||||||||||||||||||
| WNEB |
Western New England Bancorp, Inc. | NE | 13.81 | 20,153 | 278.3 | 13.95 | 7.63 | 12.88 | 7.22 | 46.60 | 9.43 | 0.75 | 0.75 | 12.16 | 11.49 | 0.00 | 2,736,480 | |||||||||||||||||||||||||||||||||||||||||||||||||
| WTFC |
Wintrust Financial Corporation | MW | 149.71 | 66,975 | 10,026.8 | 155.99 | 89.10 | 146.44 | 2.23 | 14.45 | 7.07 | 11.40 | 11.62 | 102.03 | 88.66 | 0.00 | 71,142,046 | |||||||||||||||||||||||||||||||||||||||||||||||||
| WSFS |
WSFS Financial Corporation | MA | 66.36 | 54,676 | 3,628.3 | 66.68 | 42.44 | 57.92 | 14.57 | 18.50 | 20.13 | 5.09 | 5.16 | 51.27 | NA | 0.00 | 21,314,076 | |||||||||||||||||||||||||||||||||||||||||||||||||
| ZION |
Zions Bancorporation, National Association | SW | 60.99 | 147,653 | 9,005.4 | 62.26 | 39.32 | 59.18 | 3.06 | 5.41 | 4.19 | 6.01 | 5.70 | 48.18 | 40.79 | 0.00 | 88,990,000 | |||||||||||||||||||||||||||||||||||||||||||||||||
| MHCs |
||||||||||||||||||||||||||||||||||||||||||||||||||||||||||||||||||
| BSBK |
Bogota Financial Corp. | MA | 8.54 | 12,606 | 107.7 | 9.50 | 6.59 | 8.62 | -0.93 | 11.05 | 1.07 | 0.05 | 0.01 | 10.82 | 10.82 | 0.00 | 925,814 | |||||||||||||||||||||||||||||||||||||||||||||||||
| CLBK |
Columbia Financial, Inc. | MA | 17.71 | 103,985 | 1,841.6 | 18.87 | 12.64 | 15.85 | 11.74 | 19.74 | 13.96 | 0.51 | 0.52 | 11.16 | 10.03 | 0.00 | 11,018,793 | |||||||||||||||||||||||||||||||||||||||||||||||||
| GCBC |
Greene County Bancorp, Inc. | MA | 23.88 | 17,027 | 406.6 | 27.62 | 20.00 | 22.45 | 6.37 | -9.89 | 7.42 | 2.14 | NA | 15.17 | 15.17 | 0.00 | 3,146,995 | |||||||||||||||||||||||||||||||||||||||||||||||||
| KFFB |
Kentucky First Federal Bancorp | MW | 4.51 | 8,087 | 36.5 | 4.97 | 1.96 | 4.52 | -0.22 | 45.96 | -3.01 | 0.06 | 0.06 | 6.03 | 6.03 | 0.00 | 366,492 | |||||||||||||||||||||||||||||||||||||||||||||||||
| PBFS |
Pioneer Bancorp, Inc. | MA | 14.23 | 24,406 | 347.3 | 14.94 | 10.60 | 13.68 | 4.02 | 22.88 | 5.56 | 0.83 | NA | NA | NA | 0.00 | 2,150,684 | |||||||||||||||||||||||||||||||||||||||||||||||||
| RBKB |
Rhinebeck Bancorp, Inc. | MA | 11.93 | 10,857 | 129.5 | 13.99 | 9.31 | 12.34 | -3.32 | 19.06 | -0.75 | 0.92 | 0.92 | 12.28 | 12.07 | 0.00 | 1,301,766 | |||||||||||||||||||||||||||||||||||||||||||||||||
| TFSL |
TFS Financial Corporation | MW | 14.24 | 278,792 | 3,968.6 | 14.73 | 11.29 | 14.16 | 0.53 | 3.75 | 6.39 | 0.32 | 0.32 | NA | NA | 0.00 | 17,498,683 | |||||||||||||||||||||||||||||||||||||||||||||||||
| WSBK |
Winchester Bancorp, Inc. | NE | 11.40 | 9,295 | 106.0 | 11.41 | 8.76 | 11.00 | 3.64 | 22.58 | 9.09 | NA | NA | 12.72 | 12.72 | 0.00 | 1,015,970 | |||||||||||||||||||||||||||||||||||||||||||||||||
| Under Acquisition |
||||||||||||||||||||||||||||||||||||||||||||||||||||||||||||||||||
| BLFY |
Blue Foundry Bancorp | MA | 13.41 | 18,845 | 252.7 | 13.57 | 7.61 | 13.00 | 3.15 | 37.54 | 7.88 | -0.46 | -0.46 | 15.14 | 15.14 | 0.00 | 2,155,792 | |||||||||||||||||||||||||||||||||||||||||||||||||
| FBIZ |
First Business Financial Services, Inc. | MW | 58.84 | 8,325 | 489.9 | 59.86 | 42.18 | 56.60 | 3.96 | 13.90 | 8.36 | 5.94 | 5.92 | 43.19 | NA | 0.00 | 4,081,887 | |||||||||||||||||||||||||||||||||||||||||||||||||
| FFWM |
First Foundation Inc. | SW | 6.47 | 82,884 | 536.3 | 6.62 | 4.42 | 6.05 | 6.94 | 25.63 | 5.03 | -1.88 | -1.93 | 9.96 | 9.93 | 0.00 | 11,904,077 | |||||||||||||||||||||||||||||||||||||||||||||||||
| FSUN |
FirstSun Capital Bancorp | SW | 40.56 | 27,887 | 1,131.1 | 45.32 | 29.95 | 37.81 | 7.27 | -3.89 | 7.77 | 3.47 | NA | 41.36 | 37.83 | 0.00 | 8,485,162 | |||||||||||||||||||||||||||||||||||||||||||||||||
| FFIC |
Flushing Financial Corporation | MA | 16.15 | 33,778 | 545.5 | 17.79 | 10.65 | 15.50 | 4.19 | 15.77 | 6.46 | 0.54 | 1.09 | 20.96 | 20.94 | 0.00 | 8,693,302 | |||||||||||||||||||||||||||||||||||||||||||||||||
| HTBK |
Heritage Commerce Corp | WE | 13.08 | 61,369 | 802.7 | 13.64 | 8.09 | 12.78 | 2.35 | 34.98 | 8.91 | 0.78 | 0.92 | 11.55 | NA | 0.00 | 5,764,697 | |||||||||||||||||||||||||||||||||||||||||||||||||
| IROQ |
IF Bancorp, Inc. | MW | 27.21 | 3,241 | 88.2 | 27.93 | 23.00 | 27.38 | -0.62 | 13.56 | 0.93 | 1.60 | NA | 26.07 | 26.07 | 0.00 | 830,382 | |||||||||||||||||||||||||||||||||||||||||||||||||
| LNKB |
LINKBANCORP, Inc. | MA | 8.92 | 37,458 | 334.1 | 9.04 | 6.09 | 8.60 | 3.72 | 26.17 | 7.99 | 0.90 | 0.79 | 8.18 | 6.20 | 0.00 | 3,069,992 | |||||||||||||||||||||||||||||||||||||||||||||||||
| MBCN |
Middlefield Banc Corp. | MW | 33.65 | 8,087 | 272.1 | 37.68 | 22.74 | 35.06 | -4.02 | 29.87 | -2.58 | 2.61 | 2.59 | 27.71 | 22.62 | 0.00 | 1,978,893 | |||||||||||||||||||||||||||||||||||||||||||||||||
| MOFG |
MidWestOne Financial Group, Inc. | MW | 47.07 | 20,634 | 971.3 | 47.10 | 24.62 | 45.50 | 3.45 | 48.81 | 22.26 | 2.81 | 3.02 | 29.37 | 24.96 | 0.00 | 6,249,752 | |||||||||||||||||||||||||||||||||||||||||||||||||
| NFBK |
Northfield Bancorp, Inc. (Staten Island, NY) | MA | 13.79 | 41,764 | 575.9 | 13.99 | 9.40 | 11.89 | 15.98 | 18.17 | 20.65 | 0.02 | 0.84 | 16.51 | 16.51 | 0.00 | 5,754,010 | |||||||||||||||||||||||||||||||||||||||||||||||||
| STEL |
Stellar Bancorp, Inc. | SW | 37.42 | 50,760 | 1,899.4 | 37.53 | 24.13 | 32.55 | 14.96 | 31.76 | 20.94 | 1.99 | NA | 32.78 | 21.62 | 0.00 | 10,806,594 | |||||||||||||||||||||||||||||||||||||||||||||||||
| UBFO |
United Security Bancshares | WE | 11.11 | 17,582 | 195.3 | 11.20 | 7.32 | 10.57 | 5.11 | 16.09 | 10.33 | 0.70 | NA | 7.94 | 7.69 | 0.00 | 1,248,313 | |||||||||||||||||||||||||||||||||||||||||||||||||
|
(1) Average of High/Low or Bid/Ask price per share. (2) Or since offering price if converted of first listed in the past 52 weeks. Percent change figures are actual year-to-date and are not annualized. (3) EPS (earnings per share) is based on actual trailing 12 month data and is not shown on a pro forma basis. (4) Excludes intangibles (such as goodwill, value of core deposits, etc.). (5) ROA (return on assets) and ROE (return on equity) are indicated ratios based on trailing 12 month common earnings and average common equity and total assets balances. (6) Annualized based on last regular quarterly cash dividend announcement. (7) Indicated dividend as a percent of trailing 12 month earnings. (8) Excluded from averages due to actual or rumored acquisition activities or unusual operating characteristics. (9) For MHC institutions, market value reflects share price multiplied by public (non-MHC) shares.
Source: S&P Global Market Intelligence and RP® Financial, LC. calculations. The information provided in this table has been obtained from sources we believe are reliable, but we cannot guarantee the accuracy or completeness of such information.
Copyright (c) 2026 by RP® Financial, LC. |
| |||||||||||||||||||||||||||||||||||||||||||||||||||||||||||||||||
RP® Financial, LC.
Exhibit IV-1B
Weekly Bank and Thrift Market Line—Part Two
Prices As of February 2, 2026
| Key Financial Ratios | Asset Quality Ratios | Pricing Ratios | Dividend Data (6) | |||||||||||||||||||||||||||||||||||||||||||||||||||||||||||||||||||
| Equity/ | Tang Equity/ | Reported Earnings | Core Earnings | NPAs/ | Rsvs/ | Price/ | Price/ | Price/ | Price/ | Price/ | Div/ | Dividend | Payout | |||||||||||||||||||||||||||||||||||||||||||||||||||||||||
| Assets(1) | Assets(1) | ROA(5) | ROE(5) | ROA(5) | ROE(5) | Assets | NPLs | Earnings | Book | Assets | Tang Book | Core Earnings | Share | Yield | Ratio (7) | |||||||||||||||||||||||||||||||||||||||||||||||||||||||
| (%) | (%) | (%) | (%) | (%) | (%) | (%) | (%) | (x) | (%) | (%) | (%) | (x) | ($) | (%) | (%) | |||||||||||||||||||||||||||||||||||||||||||||||||||||||
| Companies |
||||||||||||||||||||||||||||||||||||||||||||||||||||||||||||||||||||||
| SRCE |
1st Source Corporation | MW | 14.56 | 13.76 | 1.76 | 12.56 | 1.84 | 13.73 | 0.85 | 211.28 | 10.68 | 130.87 | 18.51 | 140.09 | 10.24 | 1.60 | 2.34 | 24.34 | ||||||||||||||||||||||||||||||||||||||||||||||||||||
| ACNB |
ACNB Corporation | MA | 13.01 | 10.60 | 1.16 | 9.44 | 1.61 | 13.10 | NA | NA | 14.30 | 127.17 | 16.54 | 160.34 | 10.30 | 1.52 | 2.95 | 40.00 | ||||||||||||||||||||||||||||||||||||||||||||||||||||
| AFBI |
Affinity Bancshares, Inc. | SE | 14.41 | 12.62 | 0.91 | 6.59 | 0.95 | 6.87 | NA | NA | 15.76 | 97.56 | 14.06 | 113.66 | 15.11 | NA | NA | 116.28 | ||||||||||||||||||||||||||||||||||||||||||||||||||||
| ALRS |
Alerus Financial Corporation | MW | 10.80 | 8.72 | 0.33 | 3.32 | 1.52 | 15.29 | 1.27 | 93.60 | 36.85 | 112.70 | 12.17 | 142.78 | 8.01 | 0.84 | 3.35 | 122.06 | ||||||||||||||||||||||||||||||||||||||||||||||||||||
| AMAL |
Amalgamated Financial Corp. | MA | 8.96 | 8.81 | 1.23 | 13.88 | 1.28 | 14.42 | 0.32 | 201.03 | 11.79 | 150.84 | 13.51 | 153.52 | 11.34 | 0.68 | 1.69 | 17.30 | ||||||||||||||||||||||||||||||||||||||||||||||||||||
| AMTB |
Amerant Bancorp Inc. | SE | 9.60 | NA | 0.51 | 5.62 | 0.64 | 7.04 | 1.88 | 47.11 | 17.37 | 94.66 | 9.09 | 97.92 | 13.88 | 0.36 | 1.64 | 28.57 | ||||||||||||||||||||||||||||||||||||||||||||||||||||
| ABCB |
Ameris Bancorp | SE | 14.81 | NA | 1.54 | 10.52 | 1.57 | 10.76 | NA | NA | 13.32 | 133.32 | 19.75 | 186.39 | 13.01 | 0.80 | 1.00 | 13.33 | ||||||||||||||||||||||||||||||||||||||||||||||||||||
| ASRV |
AmeriServ Financial, Inc. | MA | 8.21 | 7.34 | 0.39 | 5.03 | NA | NA | NA | NA | 10.44 | 49.16 | 4.03 | 55.52 | NA | 0.12 | 3.38 | 35.29 | ||||||||||||||||||||||||||||||||||||||||||||||||||||
| ATLO |
Ames National Corporation | MW | 9.74 | 9.18 | 0.90 | 9.95 | 0.92 | 10.08 | NA | NA | 12.52 | 114.14 | 11.12 | 121.89 | 12.36 | 0.80 | 2.99 | 28.04 | ||||||||||||||||||||||||||||||||||||||||||||||||||||
| AROW |
Arrow Financial Corporation | MA | 9.71 | 9.20 | 1.00 | 10.66 | 1.04 | 11.06 | 0.15 | 535.03 | 13.07 | 131.87 | 12.81 | 140.02 | 12.59 | 1.20 | 3.47 | 43.77 | ||||||||||||||||||||||||||||||||||||||||||||||||||||
| ASB |
Associated Banc-Corp | MW | 11.01 | 8.73 | 1.09 | 9.95 | 1.12 | 10.21 | 0.29 | 376.46 | 10.04 | 96.51 | 10.25 | 126.30 | 9.77 | 0.96 | 3.45 | 33.94 | ||||||||||||||||||||||||||||||||||||||||||||||||||||
| AUB |
Atlantic Union Bankshares Corporation | SE | 13.32 | 8.32 | 0.80 | 6.16 | 1.23 | 9.51 | 0.31 | 256.50 | 19.49 | 115.91 | 14.99 | 200.99 | 12.42 | 1.48 | 3.74 | 69.95 | ||||||||||||||||||||||||||||||||||||||||||||||||||||
| AUBN |
Auburn National Bancorporation, Inc. | SE | 9.04 | 9.04 | 0.73 | 8.61 | NA | NA | NA | NM | 11.78 | 93.02 | 8.41 | 93.02 | NA | 1.08 | 4.41 | 51.92 | ||||||||||||||||||||||||||||||||||||||||||||||||||||
| AVBH |
Avidbank Holdings, Inc. | WE | 10.93 | 10.93 | -0.83 | -8.61 | 1.26 | 13.09 | 0.95 | 90.85 | NM | 116.93 | 12.79 | 116.93 | 8.77 | NA | NA | NM | ||||||||||||||||||||||||||||||||||||||||||||||||||||
| AVBC |
Avidia Bancorp, Inc. | NE | 13.36 | 12.99 | -0.12 | -1.22 | 0.22 | 2.23 | 0.71 | 109.03 | NM | 99.22 | 13.25 | 102.44 | 56.81 | 0.20 | 1.07 | NM | ||||||||||||||||||||||||||||||||||||||||||||||||||||
| AX |
Axos Financial, Inc. | WE | 10.39 | 9.76 | 1.80 | 16.68 | 1.82 | 16.87 | 0.56 | 215.81 | 12.47 | 190.38 | 19.78 | 204.03 | 12.23 | NA | NA | NM | ||||||||||||||||||||||||||||||||||||||||||||||||||||
| BANC |
Banc of California, Inc. | WE | 10.18 | 9.34 | 0.68 | 6.60 | 0.75 | 7.24 | 0.51 | 154.31 | 17.42 | 104.17 | 9.24 | 116.41 | 15.58 | 0.40 | 1.96 | 34.19 | ||||||||||||||||||||||||||||||||||||||||||||||||||||
| BANF |
BancFirst Corporation | SW | 12.50 | 11.27 | 1.70 | 13.93 | 1.72 | 14.07 | 0.67 | 206.41 | 15.77 | 202.78 | 25.34 | 227.86 | 15.61 | 1.96 | 1.75 | 26.72 | ||||||||||||||||||||||||||||||||||||||||||||||||||||
| BFC |
Bank First Corporation | MW | 14.29 | 10.49 | 1.62 | 11.32 | 1.73 | 12.11 | NA | NA | 20.05 | 221.43 | 31.64 | 315.03 | 18.74 | 2.00 | 1.38 | 74.00 | ||||||||||||||||||||||||||||||||||||||||||||||||||||
| BAC |
Bank of America Corporation | SE | 8.89 | 6.96 | 0.89 | 10.22 | NA | NA | 0.19 | 208.88 | 14.18 | 140.55 | 11.51 | 188.81 | NA | 1.12 | 2.07 | 21.52 | ||||||||||||||||||||||||||||||||||||||||||||||||||||
| BOH |
Bank of Hawaii Corporation | WE | 7.66 | 7.54 | 0.87 | 11.86 | 0.89 | 12.26 | 0.06 | NM | 16.29 | 197.80 | 12.57 | 202.00 | 15.70 | 2.80 | 3.71 | 60.48 | ||||||||||||||||||||||||||||||||||||||||||||||||||||
| BMRC |
Bank of Marin Bancorp | WE | 10.11 | 8.35 | -0.94 | -8.19 | 0.91 | 7.91 | NA | 111.84 | NM | 111.84 | NA | 137.94 | 12.67 | 1.00 | 3.65 | NM | ||||||||||||||||||||||||||||||||||||||||||||||||||||
| BOTJ |
Bank of the James Financial Group, Inc. | SE | 7.55 | 6.78 | 0.78 | 11.59 | 0.86 | 12.85 | 0.19 | 332.35 | 11.36 | 118.05 | 8.91 | 132.43 | 10.25 | 0.40 | 2.00 | 17.05 | ||||||||||||||||||||||||||||||||||||||||||||||||||||
| OZK |
Bank OZK | SE | 15.03 | 13.63 | 1.79 | 12.04 | 1.79 | 12.04 | NA | NA | 7.84 | 92.33 | 13.22 | 104.23 | 7.84 | 1.84 | 3.80 | 28.80 | ||||||||||||||||||||||||||||||||||||||||||||||||||||
| BSVN |
Bank7 Corp. | SW | 12.78 | 12.25 | 2.37 | 18.51 | 2.37 | 18.55 | NA | NA | 10.07 | 170.90 | 21.84 | 179.45 | 10.05 | 1.08 | 2.38 | 17.33 | ||||||||||||||||||||||||||||||||||||||||||||||||||||
| BKU |
BankUnited, Inc. | SE | 8.72 | 8.51 | 0.77 | 8.99 | NA | NA | NA | NA | 13.59 | 116.46 | 10.15 | 119.50 | NA | 1.24 | 2.58 | 35.13 | ||||||||||||||||||||||||||||||||||||||||||||||||||||
| BWFG |
Bankwell Financial Group, Inc. | NE | 8.97 | NA | 1.09 | 12.32 | NA | NA | 0.49 | 188.33 | 11.00 | 128.26 | 11.51 | 133.25 | NA | 0.80 | 1.63 | 17.98 | ||||||||||||||||||||||||||||||||||||||||||||||||||||
| BANR |
Banner Corporation | WE | 11.90 | NA | 1.21 | 10.51 | 1.22 | 10.64 | 0.29 | 385.97 | 11.19 | 110.53 | 13.15 | 140.95 | 11.04 | 2.00 | 3.17 | 34.75 | ||||||||||||||||||||||||||||||||||||||||||||||||||||
| BHB |
Bar Harbor Bankshares | NE | 11.37 | 8.27 | 0.85 | 7.49 | 1.17 | 10.29 | 0.29 | 293.70 | 14.98 | 108.52 | 12.34 | 154.39 | 10.91 | 1.28 | 3.70 | 55.41 | ||||||||||||||||||||||||||||||||||||||||||||||||||||
| BCML |
BayCom Corp | WE | 13.05 | 11.67 | 0.92 | 7.19 | 0.96 | 7.47 | NA | 169.14 | 13.48 | 94.52 | 12.34 | 107.39 | 12.98 | 1.20 | 4.08 | 41.28 | ||||||||||||||||||||||||||||||||||||||||||||||||||||
| BAFN |
BayFirst Financial Corp. | SE | 6.73 | NA | -1.73 | -21.81 | -1.30 | -16.34 | NA | NA | NM | 38.20 | 2.14 | NA | NM | 0.00 | 0.00 | NM | ||||||||||||||||||||||||||||||||||||||||||||||||||||
| BCBP |
BCB Bancorp, Inc. | MA | 9.28 | 9.13 | -0.37 | -3.94 | -0.01 | -0.12 | 2.08 | 53.26 | NM | 51.07 | 4.38 | 52.05 | NM | 0.32 | 3.88 | NM | ||||||||||||||||||||||||||||||||||||||||||||||||||||
| BBT |
Beacon Financial Corporation | NE | 10.75 | 8.62 | 0.59 | 5.44 | 0.99 | 9.11 | NA | NA | 28.16 | 97.63 | 10.49 | 124.66 | 16.83 | 1.29 | 4.45 | 62.62 | ||||||||||||||||||||||||||||||||||||||||||||||||||||
| BRBS |
Blue Ridge Bankshares, Inc. | SE | 13.31 | 13.21 | 0.41 | 3.18 | NA | NA | NA | NA | 39.00 | 121.24 | 16.13 | 122.23 | NA | 0.00 | 0.00 | 227.27 | ||||||||||||||||||||||||||||||||||||||||||||||||||||
| BOKF |
BOK Financial Corporation | SW | 11.33 | 9.46 | 1.12 | 9.89 | 1.08 | 9.56 | 0.13 | 419.41 | 14.21 | 133.46 | 15.12 | 163.23 | 14.70 | 2.52 | 1.93 | 19.30 | ||||||||||||||||||||||||||||||||||||||||||||||||||||
| BWB |
Bridgewater Bancshares, Inc. | MW | 9.56 | 9.25 | 0.87 | 9.53 | 0.90 | 9.85 | 0.41 | 256.16 | 13.17 | 120.94 | 10.20 | 126.24 | 12.70 | NA | NA | NM | ||||||||||||||||||||||||||||||||||||||||||||||||||||
| BYFC |
Broadway Financial Corporation | WE | 22.84 | 21.10 | -0.01 | -0.03 | 0.13 | 0.59 | NA | 182.02 | NM | 57.25 | 7.03 | 71.93 | NM | 0.00 | 0.00 | NM | ||||||||||||||||||||||||||||||||||||||||||||||||||||
| BHRB |
Burke & Herbert Financial Services Corp. | SE | 10.79 | 9.93 | 1.49 | 14.90 | 1.63 | 16.26 | NA | NA | 8.66 | 119.07 | 12.71 | 130.84 | 7.93 | 2.20 | 3.29 | 28.50 | ||||||||||||||||||||||||||||||||||||||||||||||||||||
| BFST |
Business First Bancshares, Inc. | SW | 10.92 | 9.42 | 1.12 | 10.33 | 1.16 | 10.74 | 1.06 | 72.46 | 10.33 | 103.13 | 10.45 | 123.43 | 9.91 | 0.60 | 2.08 | 20.79 | ||||||||||||||||||||||||||||||||||||||||||||||||||||
| BVFL |
BV Financial, Inc. | MA | 20.15 | 18.81 | 1.48 | 7.01 | 1.50 | 7.10 | NA | NA | 13.79 | 94.98 | 19.14 | 103.46 | 13.62 | 0.13 | 0.00 | NM | ||||||||||||||||||||||||||||||||||||||||||||||||||||
| BY |
Byline Bancorp, Inc. | MW | 13.14 | NA | 1.36 | 10.86 | 1.44 | 11.48 | 0.67 | 176.75 | 11.34 | 117.68 | 15.46 | 146.44 | 10.73 | 0.48 | 1.47 | 14.53 | ||||||||||||||||||||||||||||||||||||||||||||||||||||
| CFFI |
C&F Financial Corporation | SE | 9.48 | 8.61 | 1.01 | 11.11 | NA | NA | NA | NM | 9.26 | 95.24 | 9.01 | 105.79 | NA | 1.84 | 2.40 | 22.20 | ||||||||||||||||||||||||||||||||||||||||||||||||||||
| BCAL |
California BanCorp | WE | 14.30 | 11.45 | 1.57 | 11.56 | 1.67 | 12.35 | 0.39 | 216.53 | 9.49 | 103.00 | 14.72 | 132.81 | 8.89 | 0.40 | 2.18 | 5.18 | ||||||||||||||||||||||||||||||||||||||||||||||||||||
| CAC |
Camden National Corporation | NE | 9.99 | 7.41 | 0.94 | 9.96 | 1.11 | 11.71 | 0.10 | 644.68 | 12.80 | 119.42 | 11.93 | 165.55 | 10.89 | 1.68 | 3.42 | 43.75 | ||||||||||||||||||||||||||||||||||||||||||||||||||||
| CBNK |
Capital Bancorp, Inc. | MA | 11.15 | 10.09 | 1.71 | 15.13 | 1.79 | 15.84 | 1.62 | 100.44 | 9.30 | 129.22 | 14.40 | 144.52 | 8.89 | 0.48 | 1.51 | 13.49 | ||||||||||||||||||||||||||||||||||||||||||||||||||||
| CCBG |
Capital City Bank Group, Inc. | SE | 12.61 | 10.79 | 1.42 | 11.51 | 1.30 | 10.53 | 0.24 | 360.69 | 11.81 | 131.42 | 16.57 | 156.67 | 12.91 | 1.04 | 2.45 | 27.78 | ||||||||||||||||||||||||||||||||||||||||||||||||||||
| COF |
Capital One Financial Corporation | SE | 16.98 | 10.98 | 0.41 | 2.59 | 0.68 | 4.30 | NA | NA | 55.50 | 129.22 | 21.07 | 221.51 | 31.89 | 3.20 | 1.43 | 64.52 | ||||||||||||||||||||||||||||||||||||||||||||||||||||
| CFFN |
Capitol Federal Financial, Inc. | MW | 10.65 | NA | 0.75 | 6.98 | 0.75 | 6.98 | 0.50 | 50.27 | 13.46 | 94.01 | 10.01 | 96.02 | 13.41 | 0.34 | 4.51 | 67.86 | ||||||||||||||||||||||||||||||||||||||||||||||||||||
| CARE |
Carter Bankshares, Inc. | SE | 8.65 | 8.61 | 0.66 | 7.74 | 0.65 | 7.61 | 5.03 | 29.30 | 15.83 | 114.97 | 9.94 | 115.55 | 16.12 | 0.00 | 0.00 | NM | ||||||||||||||||||||||||||||||||||||||||||||||||||||
| CLST |
Catalyst Bancorp, Inc. | SW | 28.89 | 28.89 | 0.75 | 2.53 | 0.69 | 2.32 | 0.81 | 105.29 | 27.77 | 77.53 | 22.40 | 77.53 | 30.29 | NA | NA | NM | ||||||||||||||||||||||||||||||||||||||||||||||||||||
| CATY |
Cathay General Bancorp | WE | 12.07 | NA | 1.33 | 10.87 | 1.31 | 10.69 | 0.59 | 174.36 | 11.58 | 120.76 | 14.58 | 142.21 | 11.77 | 1.36 | 2.59 | 29.96 | ||||||||||||||||||||||||||||||||||||||||||||||||||||
| CBFV |
CB Financial Services, Inc. | MA | 10.18 | 9.61 | 0.33 | 3.27 | 1.58 | 15.82 | NA | NA | 39.58 | 116.40 | 11.85 | 124.07 | 8.19 | 1.12 | 3.08 | 114.13 | ||||||||||||||||||||||||||||||||||||||||||||||||||||
| CBC |
Central Bancompany, Inc. | MW | 18.23 | 16.82 | 2.03 | 11.90 | 2.12 | 12.47 | NA | NA | 14.23 | 158.66 | 28.93 | 174.91 | 13.58 | 0.00 | 0.02 | 55.32 | ||||||||||||||||||||||||||||||||||||||||||||||||||||
| CPF |
Central Pacific Financial Corp. | WE | 8.00 | 8.00 | 1.06 | 13.62 | NA | NA | 0.19 | 414.44 | 11.53 | 146.79 | 11.74 | 146.79 | NA | 1.16 | 3.52 | 38.81 | ||||||||||||||||||||||||||||||||||||||||||||||||||||
| CPBI |
Central Plains Bancshares, Inc. | MW | 16.90 | NA | 0.74 | 5.27 | 0.74 | 5.27 | NA | NM | 18.16 | 86.23 | 14.57 | NA | 18.16 | NA | NA | NM | ||||||||||||||||||||||||||||||||||||||||||||||||||||
| CFBK |
CF Bankshares Inc. | MW | 8.49 | 8.49 | 0.78 | 9.37 | 0.79 | 9.41 | 0.40 | 197.34 | 12.28 | 111.52 | 9.35 | 111.52 | 12.22 | 0.36 | 1.18 | 12.85 | ||||||||||||||||||||||||||||||||||||||||||||||||||||
| CBNA |
Chain Bridge Bancorp, Inc. | SE | 9.67 | 9.67 | 1.32 | 12.88 | 1.32 | 12.88 | 0.00 | NM | 12.03 | 143.63 | 13.89 | 143.63 | 12.03 | NA | NA | NM | ||||||||||||||||||||||||||||||||||||||||||||||||||||
| CHMG |
Chemung Financial Corporation | MA | 9.40 | 8.66 | 0.55 | 6.40 | 1.03 | 11.97 | 0.30 | 306.13 | 19.67 | 116.61 | 10.96 | 127.53 | 10.51 | 1.36 | 2.20 | 42.04 | ||||||||||||||||||||||||||||||||||||||||||||||||||||
| COFS |
ChoiceOne Financial Services, Inc. | MW | 10.55 | 7.16 | 0.69 | 6.92 | 1.12 | 11.25 | NA | NA | 14.75 | 95.58 | 10.08 | 146.14 | 9.08 | 1.16 | 3.91 | 56.22 | ||||||||||||||||||||||||||||||||||||||||||||||||||||
| C |
Citigroup Inc. | MA | 8.05 | 7.26 | 0.55 | 6.78 | 0.57 | 7.09 | 0.14 | 531.83 | 16.63 | 105.65 | 7.71 | 119.75 | 15.92 | 2.40 | 2.06 | 33.76 | ||||||||||||||||||||||||||||||||||||||||||||||||||||
| CZNC |
Citizens & Northern Corporation | MA | 10.91 | 8.73 | 0.85 | 7.87 | NA | NA | NA | NA | 15.55 | 118.40 | 12.92 | 151.63 | NA | 1.12 | 4.93 | 76.71 | ||||||||||||||||||||||||||||||||||||||||||||||||||||
| CZWI |
Citizens Community Bancorp, Inc. | MW | 10.55 | 8.92 | 0.82 | 7.89 | 0.84 | 8.04 | 0.94 | 141.30 | 12.69 | 94.82 | 10.00 | 114.20 | 12.45 | 0.42 | 2.27 | 7.19 | ||||||||||||||||||||||||||||||||||||||||||||||||||||
| CFG |
Citizens Financial Group, Inc. | NE | 11.63 | 8.26 | 0.84 | 7.29 | 0.83 | 7.23 | NA | 129.19 | 16.80 | 115.02 | 12.42 | 175.05 | 16.97 | 1.84 | 2.84 | 45.60 | ||||||||||||||||||||||||||||||||||||||||||||||||||||
| CZFS |
Citizens Financial Services, Inc. | MA | 11.03 | 8.42 | 1.20 | 10.84 | 1.21 | 10.94 | 0.94 | 85.73 | 8.58 | 92.94 | 10.25 | 125.36 | 8.50 | 2.00 | 3.06 | 25.99 | ||||||||||||||||||||||||||||||||||||||||||||||||||||
| CHCO |
City Holding Company | SE | 12.05 | 9.93 | 1.97 | 16.88 | 2.01 | 17.14 | 0.21 | 143.82 | 14.02 | 222.03 | 26.74 | 275.80 | 13.81 | 3.48 | 2.78 | 37.18 | ||||||||||||||||||||||||||||||||||||||||||||||||||||
| CIVB |
Civista Bancshares, Inc. | MW | 12.53 | NA | 1.11 | 10.28 | 1.23 | 11.35 | 0.71 | 136.36 | 9.33 | 93.98 | 11.78 | 128.69 | 8.44 | 0.72 | 2.92 | 26.14 | ||||||||||||||||||||||||||||||||||||||||||||||||||||
| CCNE |
CNB Financial Corporation | MA | 10.39 | 9.06 | 0.93 | 9.14 | 1.05 | 10.34 | 0.50 | 168.29 | 11.36 | 102.39 | 10.00 | 120.47 | 9.96 | 0.72 | 2.55 | 28.92 | ||||||||||||||||||||||||||||||||||||||||||||||||||||
| CCB |
Coastal Financial Corporation | WE | 10.35 | 10.27 | 1.05 | 10.17 | 1.10 | 10.67 | 0.65 | 547.44 | 32.16 | 303.48 | 31.42 | 306.31 | 30.66 | NA | NA | NM | ||||||||||||||||||||||||||||||||||||||||||||||||||||
| COSO |
CoastalSouth Bancshares, Inc. | SE | 11.25 | 11.06 | 1.13 | 10.94 | 1.13 | 11.00 | 0.62 | 131.84 | 11.38 | 113.47 | 12.77 | 115.69 | 11.32 | 0.20 | 0.81 | 2.31 | ||||||||||||||||||||||||||||||||||||||||||||||||||||
| CBAN |
Colony Bankcorp, Inc. | SE | 10.06 | 8.30 | 0.89 | 9.49 | 1.00 | 10.65 | 0.53 | 123.68 | 12.65 | 113.69 | 11.44 | 140.49 | 11.27 | 0.48 | 2.39 | 29.25 | ||||||||||||||||||||||||||||||||||||||||||||||||||||
| COLB |
Columbia Banking System, Inc. | WE | 11.73 | NA | 0.97 | 8.98 | 1.41 | 13.08 | NA | NA | 12.91 | 111.88 | 13.12 | 159.93 | 8.86 | 1.48 | 4.98 | 63.04 | ||||||||||||||||||||||||||||||||||||||||||||||||||||
| CBSH |
Commerce Bancshares, Inc. | MW | 11.59 | NA | 1.80 | 15.89 | 1.79 | 15.71 | NA | NM | 13.18 | 192.99 | 22.25 | 205.30 | 13.15 | 1.05 | 1.97 | 19.45 | ||||||||||||||||||||||||||||||||||||||||||||||||||||
| CBK |
Commercial Bancgroup, Inc. | SE | 12.44 | 11.95 | 1.65 | 15.60 | 1.72 | 16.23 | 0.28 | 285.51 | 9.23 | 129.44 | 16.11 | 135.51 | 8.87 | 0.00 | 0.00 | 3.42 | ||||||||||||||||||||||||||||||||||||||||||||||||||||
| CMTV |
Community Bancorp | NE | 8.83 | 8.00 | 1.41 | 15.97 | NA | NA | NA | NA | 10.37 | 153.22 | 13.53 | 170.58 | NA | 1.00 | 3.21 | 32.56 | ||||||||||||||||||||||||||||||||||||||||||||||||||||
| CBU |
Community Financial System, Inc. | MA | 11.59 | 6.50 | 1.26 | 11.29 | 1.35 | 12.09 | 0.33 | 177.59 | 16.06 | 167.45 | 19.41 | 315.90 | 15.00 | 1.88 | 2.95 | 47.10 | ||||||||||||||||||||||||||||||||||||||||||||||||||||
| CTBI |
Community Trust Bancorp, Inc. | MW | 12.81 | 11.94 | 1.53 | 12.07 | 1.52 | 12.03 | 0.17 | 704.64 | 11.57 | 132.96 | 17.03 | 143.97 | 11.62 | 2.12 | 3.37 | 37.94 | ||||||||||||||||||||||||||||||||||||||||||||||||||||
| CWBC |
Community West Bancshares | WE | 11.10 | 8.49 | 1.07 | 9.92 | 1.10 | 10.26 | NA | 432.37 | 12.42 | 116.22 | 12.90 | 156.33 | 12.01 | 0.48 | 1.93 | 24.00 | ||||||||||||||||||||||||||||||||||||||||||||||||||||
| CNOB |
ConnectOne Bancorp, Inc. | MA | 11.24 | 9.42 | 0.66 | 5.67 | 0.87 | 7.52 | 0.33 | 336.07 | 16.75 | 93.88 | 9.88 | 116.13 | 12.39 | 0.72 | 2.64 | 44.17 | ||||||||||||||||||||||||||||||||||||||||||||||||||||
| CFR |
Cullen/Frost Bankers, Inc. | SW | 8.62 | NA | 1.25 | 15.28 | 1.25 | 15.30 | NA | 399.39 | 14.02 | 198.77 | 16.64 | 245.13 | 14.00 | 4.00 | 2.88 | 40.32 | ||||||||||||||||||||||||||||||||||||||||||||||||||||
| CUBI |
Customers Bancorp, Inc. | MA | 8.50 | 8.48 | 0.96 | 11.39 | 1.14 | 13.55 | 0.29 | 356.29 | 12.71 | 128.62 | 10.93 | 128.84 | 10.56 | NA | NA | NM | ||||||||||||||||||||||||||||||||||||||||||||||||||||
| CVBF |
CVB Financial Corp. | WE | 14.68 | 10.25 | 1.36 | 9.26 | 1.42 | 9.63 | 0.03 | NM | 13.23 | 118.80 | 17.44 | 178.96 | 12.72 | 0.80 | 3.98 | 52.63 | ||||||||||||||||||||||||||||||||||||||||||||||||||||
| DCOM |
Dime Community Bancshares, Inc. | MA | 9.62 | 8.67 | 0.77 | 7.64 | NA | NA | 0.34 | 186.14 | 14.98 | 114.11 | 10.19 | 129.20 | NA | 1.00 | 2.83 | 42.37 | ||||||||||||||||||||||||||||||||||||||||||||||||||||
| EBMT |
Eagle Bancorp Montana, Inc. | WE | 9.11 | 7.43 | 0.70 | 8.12 | 0.75 | 8.63 | 0.10 | 831.90 | 11.81 | 93.10 | 8.48 | 116.14 | 11.10 | 0.58 | 2.58 | 30.39 | ||||||||||||||||||||||||||||||||||||||||||||||||||||
| EGBN |
Eagle Bancorp, Inc. | MA | 10.87 | 10.87 | -1.07 | -10.63 | -0.95 | -9.42 | 1.04 | 149.39 | NM | 72.54 | 7.89 | 72.54 | NM | 0.04 | 0.15 | NM | ||||||||||||||||||||||||||||||||||||||||||||||||||||
| EFSI |
Eagle Financial Services, Inc. | SE | 10.00 | 10.00 | 0.42 | 4.82 | 0.92 | 10.45 | 0.77 | 106.40 | 24.04 | 108.77 | 10.88 | 108.77 | 11.07 | 1.24 | 3.24 | 77.99 | ||||||||||||||||||||||||||||||||||||||||||||||||||||
| EWBC |
East West Bancorp, Inc. | WE | 11.06 | 10.55 | 1.70 | 16.01 | 1.69 | 15.92 | 0.26 | 433.46 | 12.04 | 177.21 | 19.61 | 187.00 | 12.11 | 3.20 | 2.79 | 27.31 | ||||||||||||||||||||||||||||||||||||||||||||||||||||
| EBC |
Eastern Bankshares, Inc. | NE | 14.19 | 10.38 | 0.34 | 2.34 | 1.36 | 9.40 | 0.56 | 192.57 | 49.30 | 115.07 | 16.33 | 164.32 | 12.25 | 0.52 | 2.45 | 120.93 | ||||||||||||||||||||||||||||||||||||||||||||||||||||
| ECBK |
ECB Bancorp, Inc. | NE | 10.90 | 10.90 | 0.45 | 3.92 | 0.45 | 3.92 | NA | 871.63 | 22.71 | 93.52 | 10.20 | 93.52 | 22.71 | NA | NA | NM | ||||||||||||||||||||||||||||||||||||||||||||||||||||
| EFSC |
Enterprise Financial Services Corp | MW | 11.79 | 9.50 | 1.24 | 10.38 | 1.12 | 9.35 | NA | NA | 11.06 | 110.31 | 12.60 | 141.91 | 12.31 | 1.32 | 2.25 | 23.73 | ||||||||||||||||||||||||||||||||||||||||||||||||||||
| EQBK |
Equity Bancshares, Inc. | MW | 11.49 | 9.94 | 0.40 | 3.40 | 1.31 | 11.10 | 0.69 | 130.91 | 38.32 | 121.97 | 14.01 | 143.41 | 11.73 | 0.72 | 1.53 | 53.66 | ||||||||||||||||||||||||||||||||||||||||||||||||||||
RP® Financial, LC.
Exhibit IV-1B
Weekly Bank and Thrift Market Line—Part Two
Prices As of February 2, 2026
| Key Financial Ratios | Asset Quality Ratios | Pricing Ratios | Dividend Data (6) | |||||||||||||||||||||||||||||||||||||||||||||||||||||||||||||||||||
| Equity/ | Tang Equity/ | Reported Earnings | Core Earnings | NPAs/ | Rsvs/ | Price/ | Price/ | Price/ | Price/ | Price/ | Div/ | Dividend | Payout | |||||||||||||||||||||||||||||||||||||||||||||||||||||||||
| Assets(1) | Assets(1) | ROA(5) | ROE(5) | ROA(5) | ROE(5) | Assets | NPLs | Earnings | Book | Assets | Tang Book | Core Earnings | Share | Yield | Ratio (7) | |||||||||||||||||||||||||||||||||||||||||||||||||||||||
| (%) | (%) | (%) | (%) | (%) | (%) | (%) | (%) | (x) | (%) | (%) | (%) | (x) | ($) | (%) | (%) | |||||||||||||||||||||||||||||||||||||||||||||||||||||||
| Companies |
||||||||||||||||||||||||||||||||||||||||||||||||||||||||||||||||||||||
| ESQ |
Esquire Financial Holdings, Inc. | MA | 12.24 | 12.24 | 2.43 | 19.41 | NA | NA | NA | 280.24 | 18.82 | 326.27 | 39.94 | 326.27 | NA | 0.80 | 0.72 | 12.35 | ||||||||||||||||||||||||||||||||||||||||||||||||||||
| FNB |
F.N.B. Corporation | MA | 13.46 | 8.89 | 1.15 | 8.66 | 1.16 | 8.78 | 0.22 | 418.10 | 11.44 | 94.31 | 12.69 | 150.25 | 11.28 | 0.48 | 2.69 | 30.77 | ||||||||||||||||||||||||||||||||||||||||||||||||||||
| FMAO |
Farmers & Merchants Bancorp, Inc. | MW | 10.67 | 8.21 | 0.95 | 9.24 | 0.99 | 9.65 | 0.15 | 532.98 | 11.94 | 105.24 | 11.23 | 140.50 | 11.42 | 0.92 | 3.32 | 38.79 | ||||||||||||||||||||||||||||||||||||||||||||||||||||
| FMNB |
Farmers National Banc Corp. | MW | 9.26 | 5.94 | 1.06 | 12.38 | 1.20 | 14.00 | NA | NA | 8.98 | 100.93 | 9.35 | 163.18 | 7.94 | 0.68 | 5.22 | 58.62 | ||||||||||||||||||||||||||||||||||||||||||||||||||||
| FBLA |
FB Bancorp, Inc. | SW | 26.75 | 26.75 | -0.22 | -0.84 | 0.14 | 0.53 | 1.32 | 43.02 | NM | 77.08 | 20.62 | 77.08 | 155.49 | NA | NA | NM | ||||||||||||||||||||||||||||||||||||||||||||||||||||
| FBK |
FB Financial Corporation | SE | 11.95 | 9.84 | 0.84 | 6.90 | 1.32 | 10.84 | 0.60 | 212.02 | 23.98 | 156.09 | 18.66 | 194.12 | 15.26 | 0.84 | 1.43 | 31.84 | ||||||||||||||||||||||||||||||||||||||||||||||||||||
| FDBC |
Fidelity D & D Bancorp, Inc. | MA | 8.69 | 8.01 | 1.05 | 12.88 | 1.09 | 13.34 | NA | NA | 9.57 | 112.35 | 9.77 | 122.75 | 9.24 | 1.72 | 3.70 | 34.16 | ||||||||||||||||||||||||||||||||||||||||||||||||||||
| FDSB |
Fifth District Bancorp, Inc. | SW | 24.34 | 24.34 | 0.70 | 2.88 | 0.70 | 2.88 | 0.04 | 858.08 | 20.79 | 63.85 | 15.54 | 63.85 | 20.79 | NA | NA | NM | ||||||||||||||||||||||||||||||||||||||||||||||||||||
| FITB |
Fifth Third Bancorp | MW | 10.13 | 7.98 | 1.19 | 12.09 | 1.18 | 11.97 | NA | NA | 14.72 | 172.14 | 16.16 | 229.95 | 14.87 | 1.60 | 3.08 | 43.63 | ||||||||||||||||||||||||||||||||||||||||||||||||||||
| FISI |
Financial Institutions, Inc. | MA | 10.02 | 9.15 | 1.20 | 12.38 | 1.18 | 12.13 | NA | NA | 9.40 | 109.90 | 10.74 | 121.93 | 9.60 | 1.24 | 3.65 | 34.35 | ||||||||||||||||||||||||||||||||||||||||||||||||||||
| FNWD |
Finward Bancorp | MW | 8.64 | 7.56 | 0.39 | 5.10 | 0.47 | 6.07 | 0.68 | 147.12 | 19.69 | 91.71 | 7.92 | 106.01 | 16.56 | 0.48 | 1.30 | 19.15 | ||||||||||||||||||||||||||||||||||||||||||||||||||||
| FINW |
FinWise Bancorp | SW | 19.77 | 19.48 | 1.92 | 8.86 | 1.92 | 8.86 | NA | NA | 16.69 | 133.31 | 26.36 | 135.80 | 16.69 | NA | NA | NM | ||||||||||||||||||||||||||||||||||||||||||||||||||||
| FBNC |
First Bancorp | SE | 13.06 | 9.51 | 0.89 | 7.16 | 1.35 | 10.87 | 0.30 | 340.30 | 21.90 | 147.10 | 19.21 | 210.09 | 14.43 | 0.96 | 1.64 | 42.91 | ||||||||||||||||||||||||||||||||||||||||||||||||||||
| FBP |
First BanCorp. | MA | 10.28 | 10.08 | 1.81 | 18.74 | NA | NA | 0.60 | 269.05 | 10.46 | 179.09 | 18.41 | 183.00 | NA | 0.80 | 3.56 | 34.42 | ||||||||||||||||||||||||||||||||||||||||||||||||||||
| FRBA |
First Bank | MA | 11.21 | 10.04 | 1.11 | 10.26 | NA | NA | NA | NA | 9.63 | 93.72 | 10.50 | 105.98 | NA | 0.36 | 2.15 | 15.52 | ||||||||||||||||||||||||||||||||||||||||||||||||||||
| BUSE |
First Busey Corporation | MW | 13.64 | NA | 0.76 | 5.93 | 1.13 | 8.76 | NA | NA | 17.31 | 98.91 | 12.46 | 129.36 | 11.42 | 1.04 | 4.09 | 68.71 | ||||||||||||||||||||||||||||||||||||||||||||||||||||
| FCAP |
First Capital, Inc. | MW | NA | NA | 1.34 | 13.19 | 1.35 | 13.13 | 0.34 | 236.83 | 11.85 | 146.78 | NA | 154.32 | 11.78 | 1.24 | 2.14 | 24.54 | ||||||||||||||||||||||||||||||||||||||||||||||||||||
| FCNC.A |
First Citizens BancShares, Inc. | SE | 9.68 | 9.47 | 0.96 | 9.87 | 1.02 | 10.48 | NA | NA | 12.69 | 122.03 | 11.15 | 125.28 | 11.93 | 8.40 | 0.40 | 4.90 | ||||||||||||||||||||||||||||||||||||||||||||||||||||
| FCF |
First Commonwealth Financial Corporation | MA | 12.59 | 9.66 | 1.26 | 10.15 | 1.32 | 10.61 | 0.77 | 137.07 | 12.43 | 120.88 | 15.22 | 162.80 | 11.88 | 0.54 | 2.96 | 36.73 | ||||||||||||||||||||||||||||||||||||||||||||||||||||
| FCBC |
First Community Bankshares, Inc. | SE | 15.36 | 11.13 | 1.52 | 9.64 | 1.64 | 10.39 | 0.43 | 220.65 | 14.28 | 138.61 | 21.28 | 200.81 | 13.24 | 1.24 | 3.28 | 84.53 | ||||||||||||||||||||||||||||||||||||||||||||||||||||
| FCCO |
First Community Corporation | SE | 8.14 | 7.47 | 0.94 | 12.36 | NA | NA | 0.02 | NM | 12.23 | 138.71 | 11.29 | 152.27 | NA | 0.64 | 2.12 | 25.51 | ||||||||||||||||||||||||||||||||||||||||||||||||||||
| FFBC |
First Financial Bancorp. | MW | 13.11 | NA | 1.35 | 9.98 | 1.53 | 11.31 | 0.48 | 183.18 | 10.97 | 103.78 | 13.60 | 177.86 | 9.67 | 1.00 | 3.43 | 37.22 | ||||||||||||||||||||||||||||||||||||||||||||||||||||
| FFIN |
First Financial Bankshares, Inc. | SW | 12.41 | 10.60 | 1.76 | 14.59 | 1.76 | 14.60 | 0.36 | 191.46 | 18.31 | 242.08 | 30.05 | 289.43 | 18.29 | 0.76 | 2.34 | 32.20 | ||||||||||||||||||||||||||||||||||||||||||||||||||||
| THFF |
First Financial Corporation | MW | 10.97 | 9.12 | 1.34 | 12.88 | 1.42 | 13.67 | 0.31 | 271.39 | 10.56 | 125.49 | 13.77 | 154.13 | 9.95 | 2.24 | 3.40 | 33.49 | ||||||||||||||||||||||||||||||||||||||||||||||||||||
| FGBI |
First Guaranty Bancshares, Inc. | SW | 5.55 | 5.49 | -1.43 | -22.52 | -1.16 | -18.20 | NA | NA | NM | 75.71 | 3.62 | 76.65 | NM | 0.04 | 0.43 | NM | ||||||||||||||||||||||||||||||||||||||||||||||||||||
| FHB |
First Hawaiian, Inc. | WE | 11.56 | 7.73 | 1.16 | 10.26 | 1.15 | 10.25 | 0.17 | 410.62 | 11.99 | 116.87 | 13.51 | 182.46 | 12.00 | 1.04 | 3.94 | 47.27 | ||||||||||||||||||||||||||||||||||||||||||||||||||||
| FHN |
First Horizon Corporation | SE | 10.90 | 9.15 | 1.22 | 10.92 | 1.22 | 11.27 | NA | NA | 13.27 | 141.65 | 14.46 | 174.89 | 13.28 | 0.68 | 2.74 | 33.16 | ||||||||||||||||||||||||||||||||||||||||||||||||||||
| INBK |
First Internet Bancorp | MW | 6.46 | NA | -0.60 | -9.15 | -0.08 | -1.29 | NA | NA | NM | 55.54 | 3.59 | 60.13 | NM | 0.24 | 1.04 | NM | ||||||||||||||||||||||||||||||||||||||||||||||||||||
| FIBK |
First Interstate BancSystem, Inc. | WE | 12.94 | 8.90 | 1.09 | 8.83 | 0.97 | 7.84 | 0.51 | 143.37 | 12.52 | 107.97 | 13.97 | 164.33 | 14.11 | 1.88 | 5.11 | 63.95 | ||||||||||||||||||||||||||||||||||||||||||||||||||||
| FRME |
First Merchants Corporation | MW | 12.97 | 9.51 | 1.21 | 9.51 | 1.24 | 9.72 | 0.38 | 272.52 | 10.54 | 95.38 | 12.26 | 135.73 | 10.32 | 1.44 | 3.52 | 36.86 | ||||||||||||||||||||||||||||||||||||||||||||||||||||
| FMBH |
First Mid Bancshares, Inc. | MW | 12.03 | NA | 1.20 | 10.24 | 1.23 | 10.55 | NA | NA | 11.38 | 109.04 | 13.12 | 153.39 | 11.05 | 1.00 | 2.29 | 25.85 | ||||||||||||||||||||||||||||||||||||||||||||||||||||
| FXNC |
First National Corporation | SE | 9.13 | 8.40 | 0.87 | 10.10 | 0.98 | 11.33 | 0.23 | 316.27 | 13.71 | 130.92 | 11.96 | 143.44 | 12.22 | 0.68 | 2.52 | 32.23 | ||||||||||||||||||||||||||||||||||||||||||||||||||||
| FNWB |
First Northwest Bancorp | WE | 7.46 | 7.41 | -0.20 | -2.74 | -0.31 | -4.37 | 1.14 | 75.18 | NM | 64.90 | 4.84 | 65.34 | NM | 0.00 | 0.00 | NM | ||||||||||||||||||||||||||||||||||||||||||||||||||||
| FSEA |
First Seacoast Bancorp, Inc. | NE | 10.36 | 10.33 | -0.36 | -3.50 | -0.36 | -3.46 | 0.03 | NM | NM | 97.22 | 10.07 | 97.51 | NM | NA | NA | NM | ||||||||||||||||||||||||||||||||||||||||||||||||||||
| FUNC |
First United Corporation | MA | 9.84 | 9.32 | 1.25 | 13.39 | 1.26 | 13.48 | 0.47 | 499.06 | 10.33 | 129.09 | 12.70 | 137.02 | 10.25 | 1.04 | 2.63 | 25.07 | ||||||||||||||||||||||||||||||||||||||||||||||||||||
| FUSB |
First US Bancshares, Inc. | SE | 9.15 | 8.56 | 0.53 | 5.86 | NA | NA | NA | 779.61 | 15.94 | 86.00 | 7.87 | 92.51 | NA | 0.28 | 1.76 | 28.00 | ||||||||||||||||||||||||||||||||||||||||||||||||||||
| MYFW |
First Western Financial, Inc. | SW | 8.42 | 7.50 | 0.44 | 5.12 | 0.45 | 5.18 | 0.62 | 129.26 | 19.10 | 93.76 | 7.89 | 106.34 | 18.89 | NA | NA | NM | ||||||||||||||||||||||||||||||||||||||||||||||||||||
| FSBC |
Five Star Bancorp | WE | 9.38 | 9.38 | 1.41 | 14.74 | NA | NA | NA | NA | 13.84 | 192.38 | 18.04 | 192.38 | NA | 1.00 | 2.49 | 29.31 | ||||||||||||||||||||||||||||||||||||||||||||||||||||
| FLG |
Flagstar Bank, National Association | MA | 9.31 | 8.91 | -0.19 | -2.18 | -0.04 | -0.42 | 3.41 | 34.62 | NM | 73.50 | 6.45 | 77.36 | NM | 0.04 | 0.30 | NM | ||||||||||||||||||||||||||||||||||||||||||||||||||||
| FRAF |
Franklin Financial Services Corporation | MA | 7.83 | 7.45 | 0.94 | 13.52 | NA | NA | NA | NA | 10.88 | 131.92 | 10.32 | 139.07 | NA | 1.32 | 2.56 | 27.85 | ||||||||||||||||||||||||||||||||||||||||||||||||||||
| FSBW |
FS Bancorp, Inc. | WE | 9.62 | 9.22 | 1.06 | 10.96 | 1.11 | 11.48 | NA | NA | 9.96 | 104.26 | 10.03 | 109.27 | 9.51 | 1.16 | 2.71 | 31.47 | ||||||||||||||||||||||||||||||||||||||||||||||||||||
| FULT |
Fulton Financial Corporation | MA | 10.87 | 9.13 | 1.23 | 11.70 | 1.29 | 12.31 | 0.48 | 236.86 | 10.11 | 114.73 | 11.85 | 140.92 | 9.60 | 0.76 | 3.61 | 35.10 | ||||||||||||||||||||||||||||||||||||||||||||||||||||
| FVCB |
FVCBankcorp, Inc. | SE | 11.06 | 10.78 | 0.99 | 8.99 | NA | NA | 0.44 | 185.56 | 12.82 | 109.58 | 12.12 | 112.83 | NA | 0.24 | 1.55 | 14.88 | ||||||||||||||||||||||||||||||||||||||||||||||||||||
| GBFH |
GBank Financial Holdings Inc. | WE | 12.19 | 12.19 | 1.70 | 13.61 | 1.83 | 14.59 | 0.86 | 135.63 | 22.91 | 286.30 | 34.91 | 286.30 | 21.37 | NA | NA | NM | ||||||||||||||||||||||||||||||||||||||||||||||||||||
| GABC |
German American Bancorp, Inc. | MW | 13.86 | 9.44 | 1.37 | 10.72 | 1.53 | 11.95 | 0.35 | 265.00 | 14.12 | 139.36 | 19.31 | 215.10 | 12.66 | 1.24 | 2.87 | 38.56 | ||||||||||||||||||||||||||||||||||||||||||||||||||||
| GBCI |
Glacier Bancorp, Inc. | WE | 13.18 | 8.95 | 0.81 | 6.59 | 0.89 | 7.25 | 0.17 | 474.98 | 25.48 | 156.41 | 20.61 | 241.40 | 23.19 | 1.32 | 2.60 | 66.33 | ||||||||||||||||||||||||||||||||||||||||||||||||||||
| GSBC |
Great Southern Bancorp, Inc. | MW | 11.36 | 11.21 | 1.22 | 11.38 | 1.21 | 11.24 | 0.15 | NM | 10.08 | 108.53 | 12.33 | 110.20 | 10.20 | 1.72 | 2.76 | 26.82 | ||||||||||||||||||||||||||||||||||||||||||||||||||||
| HWC |
Hancock Whitney Corporation | SE | 12.57 | 10.06 | 1.40 | 11.27 | 1.44 | 11.56 | 0.34 | 287.95 | 12.30 | 128.62 | 16.17 | 165.44 | 11.99 | 2.00 | 2.87 | 32.63 | ||||||||||||||||||||||||||||||||||||||||||||||||||||
| HAFC |
Hanmi Financial Corporation | WE | 10.12 | NA | 0.98 | 9.32 | 0.97 | 9.20 | NA | NA | 10.93 | 103.00 | 10.42 | 107.29 | 11.08 | 1.12 | 4.08 | 43.43 | ||||||||||||||||||||||||||||||||||||||||||||||||||||
| HNVR |
Hanover Bancorp, Inc. | MA | 8.40 | 7.65 | 0.33 | 3.73 | 0.44 | 4.92 | NA | 104.24 | 23.41 | 85.56 | NA | 94.90 | 17.75 | 0.40 | 1.71 | 40.00 | ||||||||||||||||||||||||||||||||||||||||||||||||||||
| HWBK |
Hawthorn Bancshares, Inc. | MW | 9.19 | 9.19 | 1.29 | 14.96 | 1.29 | 14.90 | NA | NA | 10.18 | 138.92 | 12.77 | 138.92 | 10.22 | 0.84 | 2.41 | 23.62 | ||||||||||||||||||||||||||||||||||||||||||||||||||||
| HBT |
HBT Financial, Inc. | MW | 12.14 | 10.82 | 1.53 | 13.24 | 1.59 | 13.83 | 0.13 | 774.04 | 11.44 | 142.58 | 17.30 | 162.35 | 10.96 | 0.92 | 3.30 | 35.25 | ||||||||||||||||||||||||||||||||||||||||||||||||||||
| HFWA |
Heritage Financial Corporation | WE | 13.23 | 10.09 | 0.96 | 7.61 | 1.10 | 8.73 | NA | NA | 13.49 | 97.49 | 12.89 | 132.38 | 11.76 | 0.96 | 3.63 | 48.98 | ||||||||||||||||||||||||||||||||||||||||||||||||||||
| HTH |
Hilltop Holdings Inc. | SW | 13.87 | 12.36 | 1.10 | 7.79 | NA | NA | 0.39 | 171.26 | 14.38 | 104.23 | 14.29 | 119.25 | NA | 0.80 | 2.11 | 28.03 | ||||||||||||||||||||||||||||||||||||||||||||||||||||
| HIFS |
Hingham Institution for Savings | NE | 10.56 | 10.56 | 1.22 | 12.00 | 0.71 | 7.00 | NA | NA | 12.28 | 138.29 | 14.60 | 138.29 | 21.05 | 2.52 | 0.83 | 13.00 | ||||||||||||||||||||||||||||||||||||||||||||||||||||
| HBCP |
Home Bancorp, Inc. | SW | 12.46 | 10.30 | 1.33 | 11.14 | 1.37 | 11.51 | 1.03 | 97.16 | 10.40 | 109.85 | 13.68 | 136.11 | 10.06 | 1.24 | 2.03 | 20.10 | ||||||||||||||||||||||||||||||||||||||||||||||||||||
| HOMB |
Home Bancshares, Inc. (Conway, AR) | SE | 18.78 | 13.36 | 2.10 | 11.61 | 2.08 | 11.53 | 0.51 | 381.51 | 12.12 | 133.48 | 25.07 | 200.10 | 12.21 | 0.84 | 2.88 | 34.02 | ||||||||||||||||||||||||||||||||||||||||||||||||||||
| HFBL |
Home Federal Bancorp, Inc. of Louisiana | SW | 9.29 | 8.74 | 0.85 | 9.37 | 0.88 | 9.75 | NA | NA | 10.85 | 97.18 | 9.03 | 103.98 | 10.42 | 0.54 | 2.96 | 31.85 | ||||||||||||||||||||||||||||||||||||||||||||||||||||
| HTB |
HomeTrust Bancshares, Inc. | SE | 13.21 | 12.46 | 1.46 | 11.06 | 1.46 | 11.07 | 0.98 | NA | 11.88 | 127.17 | 16.80 | 135.99 | 11.86 | 0.52 | 1.18 | 13.44 | ||||||||||||||||||||||||||||||||||||||||||||||||||||
| HOPE |
Hope Bancorp, Inc. | WE | 12.32 | NA | 0.34 | 2.77 | NA | NA | 0.71 | 118.91 | 24.92 | 68.56 | 8.45 | 90.36 | NA | 0.56 | 4.59 | 114.29 | ||||||||||||||||||||||||||||||||||||||||||||||||||||
| HBNC |
Horizon Bancorp, Inc. | MW | 10.69 | 8.38 | -2.06 | -20.19 | 1.36 | 13.33 | 0.59 | 158.05 | NM | 133.03 | 14.22 | 174.11 | 8.39 | 0.64 | 3.56 | NM | ||||||||||||||||||||||||||||||||||||||||||||||||||||
| HYNE |
Hoyne Bancorp, Inc. | MW | 19.82 | 19.79 | NA | -0.45 | NA | -0.29 | 0.38 | 298.59 | NA | NA | NA | NA | NA | NA | NA | NA | ||||||||||||||||||||||||||||||||||||||||||||||||||||
| HBAN |
Huntington Bancshares Incorporated | MW | 10.83 | 8.32 | 1.06 | 10.37 | 1.13 | 11.11 | NA | NA | 12.86 | 129.71 | 12.61 | 181.37 | 11.98 | 0.62 | 3.47 | 44.60 | ||||||||||||||||||||||||||||||||||||||||||||||||||||
| INDB |
Independent Bank Corp. | NE | 14.31 | 9.88 | 0.92 | 6.20 | NA | NA | NA | NA | 18.49 | 113.37 | 16.23 | 172.64 | NA | 2.36 | 2.87 | 53.15 | ||||||||||||||||||||||||||||||||||||||||||||||||||||
| IBCP |
Independent Bank Corporation | MW | 9.14 | 8.65 | 1.27 | 14.43 | 1.28 | 14.58 | 0.44 | 274.33 | 11.11 | 148.47 | 13.56 | 157.66 | 11.00 | 1.12 | 3.08 | 32.42 | ||||||||||||||||||||||||||||||||||||||||||||||||||||
| IBOC |
International Bancshares Corporation | SW | 18.98 | 17.57 | 2.61 | 14.43 | 2.60 | 14.43 | 1.07 | 101.06 | 10.63 | 142.88 | 27.02 | 157.07 | 10.68 | 1.46 | 2.03 | 31.51 | ||||||||||||||||||||||||||||||||||||||||||||||||||||
| ISTR |
Investar Holding Corporation | SW | 10.63 | 9.31 | 0.83 | 8.36 | 0.85 | 8.64 | NA | NA | 13.82 | 106.56 | 10.29 | 125.68 | 13.35 | 0.44 | 1.49 | 20.42 | ||||||||||||||||||||||||||||||||||||||||||||||||||||
| ISBA |
Isabella Bank Corporation | MW | 10.06 | 8.10 | 0.86 | 8.37 | 0.88 | 8.59 | 0.20 | 381.91 | 20.22 | 160.74 | 16.18 | 204.06 | 19.70 | 1.12 | 2.25 | 45.53 | ||||||||||||||||||||||||||||||||||||||||||||||||||||
| JMSB |
John Marshall Bancorp, Inc. | SE | 11.39 | 11.39 | 0.93 | 8.26 | NA | NA | 0.00 | NM | 14.05 | 111.92 | 12.75 | 111.92 | NA | 0.36 | 1.72 | 26.17 | ||||||||||||||||||||||||||||||||||||||||||||||||||||
| JPM |
JPMorgan Chase & Co. | MA | 8.19 | 7.03 | 1.29 | 16.17 | 1.26 | 15.88 | 0.23 | 261.39 | 15.39 | 242.65 | 18.86 | 289.38 | 15.68 | 6.00 | 1.95 | 28.97 | ||||||||||||||||||||||||||||||||||||||||||||||||||||
| KRNY |
Kearny Financial Corp. | MA | 9.94 | NA | 0.43 | 4.33 | 0.42 | 4.32 | 0.67 | 87.63 | 15.52 | 68.98 | 6.86 | 81.85 | 15.57 | 0.44 | 5.45 | 84.62 | ||||||||||||||||||||||||||||||||||||||||||||||||||||
| KEY |
KeyCorp | MW | 11.05 | 9.70 | 0.98 | 9.38 | 0.98 | 9.38 | 0.34 | 230.91 | 14.47 | 135.63 | 13.33 | 160.39 | 14.48 | 0.82 | 3.73 | 53.95 | ||||||||||||||||||||||||||||||||||||||||||||||||||||
| LSBK |
Lake Shore Bancorp, Inc. | MA | 19.47 | 19.47 | 1.02 | 6.41 | NA | NA | NA | NA | 15.98 | 85.64 | 16.68 | 85.64 | NA | 0.36 | 2.32 | 27.84 | ||||||||||||||||||||||||||||||||||||||||||||||||||||
| LKFN |
Lakeland Financial Corporation | MW | 10.91 | 10.84 | 1.50 | 14.40 | 1.50 | 14.40 | 0.30 | 330.56 | 15.15 | 200.99 | 21.92 | 202.31 | 15.13 | 2.08 | 3.42 | 50.37 | ||||||||||||||||||||||||||||||||||||||||||||||||||||
| LARK |
Landmark Bancorp, Inc. | MW | 10.00 | 8.03 | 1.17 | 12.68 | 1.23 | 13.24 | 0.62 | 124.65 | 9.06 | 105.20 | 10.52 | 133.84 | 8.68 | 0.84 | 3.02 | 32.90 | ||||||||||||||||||||||||||||||||||||||||||||||||||||
| LCNB |
LCNB Corp. | MW | 12.22 | 8.24 | 1.02 | 8.76 | NA | NA | 0.08 | 763.88 | 10.77 | 90.99 | 11.12 | 141.06 | NA | 0.88 | 5.01 | 53.99 | ||||||||||||||||||||||||||||||||||||||||||||||||||||
| LC |
LendingClub Corporation | WE | 12.97 | NA | 1.27 | 9.64 | 1.27 | 9.64 | NA | NA | 14.53 | 129.64 | 16.81 | 148.08 | 14.53 | NA | NA | NM | ||||||||||||||||||||||||||||||||||||||||||||||||||||
| LOB |
Live Oak Bancshares, Inc. | SE | 8.29 | NA | 0.76 | 9.36 | 0.64 | 7.94 | NA | 189.66 | 18.45 | 164.20 | 12.60 | NA | 21.94 | 0.12 | 0.29 | 5.38 | ||||||||||||||||||||||||||||||||||||||||||||||||||||
| MTB |
M&T Bank Corporation | MA | 13.67 | 10.07 | 1.35 | 9.90 | 1.33 | 9.71 | NA | 181.01 | 13.27 | 130.00 | 16.26 | 192.24 | 13.54 | 6.00 | 2.66 | 33.53 | ||||||||||||||||||||||||||||||||||||||||||||||||||||
| MGYR |
Magyar Bancorp, Inc. | MA | 11.64 | NA | 1.06 | 9.36 | 1.06 | 9.36 | NA | NA | 10.26 | 94.47 | 11.00 | 97.14 | 10.26 | 0.40 | 2.25 | 18.50 | ||||||||||||||||||||||||||||||||||||||||||||||||||||
| MNSB |
MainStreet Bancshares, Inc. | SE | 9.88 | 9.88 | 0.73 | 7.33 | 0.78 | 7.85 | 1.50 | 61.33 | 12.72 | 87.69 | 7.68 | 87.69 | 11.73 | 0.40 | 1.79 | 22.73 | ||||||||||||||||||||||||||||||||||||||||||||||||||||
| MBBC |
Marathon Bancorp, Inc. | MW | 18.81 | 18.81 | 0.14 | 0.91 | 0.14 | 0.91 | 0.48 | 878.42 | 98.23 | 82.18 | 15.46 | 82.18 | 98.23 | NA | NA | NM | ||||||||||||||||||||||||||||||||||||||||||||||||||||
| MCHB |
Mechanics Bancorp | WE | 12.81 | 8.48 | 1.44 | 10.57 | 1.18 | 8.70 | 0.21 | 357.70 | 12.86 | 126.81 | 16.24 | 200.91 | 15.63 | 2.52 | 16.06 | 17.21 | ||||||||||||||||||||||||||||||||||||||||||||||||||||
| MBWM |
Mercantile Bank Corporation | MW | 10.61 | 9.37 | 1.44 | 14.08 | 1.45 | 14.18 | 0.12 | 739.40 | 9.77 | 126.71 | 13.44 | 145.37 | 9.70 | 1.56 | 2.92 | 27.79 | ||||||||||||||||||||||||||||||||||||||||||||||||||||
| MBIN |
Merchants Bancorp | MW | 11.73 | 11.69 | 1.16 | 9.88 | 1.16 | 9.88 | 1.33 | 42.11 | 11.28 | 113.15 | 10.36 | 113.68 | 11.28 | 0.40 | 0.94 | 10.58 | ||||||||||||||||||||||||||||||||||||||||||||||||||||
| MRBK |
Meridian Corporation | MA | 7.74 | NA | 0.87 | 12.00 | 0.86 | 11.87 | NA | NA | 10.19 | 114.95 | 8.90 | 122.72 | 10.30 | 0.56 | 2.91 | 27.25 | ||||||||||||||||||||||||||||||||||||||||||||||||||||
| MCBS |
MetroCity Bankshares, Inc. | SE | 11.42 | 9.92 | 1.85 | 15.63 | NA | NA | 0.55 | 107.48 | 11.08 | 154.90 | 17.68 | 181.30 | NA | 1.00 | 3.42 | 37.12 | ||||||||||||||||||||||||||||||||||||||||||||||||||||
| MCB |
Metropolitan Bank Holding Corp. | MA | 9.00 | 8.89 | 0.90 | 9.70 | 0.89 | 9.54 | NA | NA | 14.29 | 128.46 | 11.56 | 130.16 | 14.53 | 0.80 | 0.85 | 7.55 | ||||||||||||||||||||||||||||||||||||||||||||||||||||
| MPB |
Mid Penn Bancorp, Inc. | MA | 13.27 | 11.08 | 0.93 | 7.71 | 1.10 | 9.11 | 0.50 | 157.25 | 13.37 | 95.78 | 12.71 | 117.64 | 11.32 | 0.88 | 2.60 | 35.18 | ||||||||||||||||||||||||||||||||||||||||||||||||||||
| MSBI |
Midland States Bancorp, Inc. | MW | 8.69 | 8.45 | -1.76 | -20.32 | 0.29 | 3.33 | NA | NA | NM | 108.19 | 7.69 | 112.34 | 44.24 | 1.28 | 5.51 | NM | ||||||||||||||||||||||||||||||||||||||||||||||||||||
RP® Financial, LC.
Exhibit IV-1B
Weekly Bank and Thrift Market Line—Part Two
Prices As of February 2, 2026
| Key Financial Ratios | Asset Quality Ratios | Pricing Ratios | Dividend Data (6) | |||||||||||||||||||||||||||||||||||||||||||||||||||||||||||||||||||
| Equity/ | Tang Equity/ | Reported Earnings | Core Earnings | NPAs/ | Rsvs/ | Price/ | Price/ | Price/ | Price/ | Price/ | Div/ | Dividend | Payout | |||||||||||||||||||||||||||||||||||||||||||||||||||||||||
| Assets(1) | Assets(1) | ROA(5) | ROE(5) | ROA(5) | ROE(5) | Assets | NPLs | Earnings | Book | Assets | Tang Book | Core Earnings | Share | Yield | Ratio (7) | |||||||||||||||||||||||||||||||||||||||||||||||||||||||
| (%) | (%) | (%) | (%) | (%) | (%) | (%) | (%) | (x) | (%) | (%) | (%) | (x) | ($) | (%) | (%) | |||||||||||||||||||||||||||||||||||||||||||||||||||||||
| Companies |
||||||||||||||||||||||||||||||||||||||||||||||||||||||||||||||||||||||
| MVBF |
MVB Financial Corp. | SE | 10.14 | 10.08 | 1.00 | 10.65 | -0.15 | -1.58 | 0.83 | 88.97 | 11.95 | 112.76 | 11.43 | 113.49 | NM | 0.68 | 2.31 | 27.64 | ||||||||||||||||||||||||||||||||||||||||||||||||||||
| NBHC |
National Bank Holdings Corporation | SW | 14.01 | NA | 1.11 | 8.08 | NA | NA | 0.27 | 350.90 | 14.25 | 110.77 | 15.52 | 151.71 | NA | 1.28 | 3.15 | 43.16 | ||||||||||||||||||||||||||||||||||||||||||||||||||||
| NKSH |
National Bankshares, Inc. | SE | 10.13 | 9.53 | 0.87 | 9.29 | 0.98 | 10.42 | NA | NM | 15.00 | 128.67 | 13.04 | 137.77 | 13.37 | 1.56 | 4.18 | 60.64 | ||||||||||||||||||||||||||||||||||||||||||||||||||||
| NBBK |
NB Bancorp, Inc. | NE | 12.26 | 11.81 | 0.92 | 6.63 | 1.18 | 8.48 | NA | 196.00 | 16.58 | 117.50 | 14.40 | 122.65 | 12.97 | 0.28 | 1.27 | 15.79 | ||||||||||||||||||||||||||||||||||||||||||||||||||||
| NBTB |
NBT Bancorp Inc. | MA | 11.85 | 8.95 | 1.11 | 9.75 | 1.27 | 11.18 | 0.28 | 309.47 | 13.64 | 125.03 | 14.82 | 171.14 | 11.90 | 1.48 | 3.26 | 43.54 | ||||||||||||||||||||||||||||||||||||||||||||||||||||
| NEWT |
NewtekOne, Inc. | SE | 14.48 | 14.03 | 2.78 | 17.22 | 1.69 | 10.47 | NA | NA | 6.17 | 110.24 | 14.28 | 115.05 | 10.41 | 0.76 | 5.65 | 26.15 | ||||||||||||||||||||||||||||||||||||||||||||||||||||
| NIC |
Nicolet Bankshares, Inc. | MW | 13.69 | NA | 1.68 | 12.58 | NA | NA | NA | NA | 15.19 | 182.71 | NA | 268.85 | NA | 1.28 | 0.86 | 15.95 | ||||||||||||||||||||||||||||||||||||||||||||||||||||
| NBN |
Northeast Bank | NE | 9.99 | NA | 2.06 | 17.60 | 2.06 | 17.57 | NA | NA | 11.49 | 206.21 | 20.60 | 198.71 | 11.51 | 0.04 | 0.03 | 0.48 | ||||||||||||||||||||||||||||||||||||||||||||||||||||
| NECB |
Northeast Community Bancorp, Inc. | MA | 17.04 | 17.04 | 2.21 | 13.12 | 2.19 | 12.99 | 0.00 | NM | 7.52 | 97.03 | 16.54 | 97.03 | 7.60 | 0.80 | 3.27 | 30.77 | ||||||||||||||||||||||||||||||||||||||||||||||||||||
| NTRS |
Northern Trust Corporation | MW | 7.32 | NA | 1.13 | 13.70 | 1.14 | 13.76 | 0.04 | 228.16 | 17.35 | 234.01 | 16.03 | 253.77 | 17.27 | 3.20 | 2.11 | 36.04 | ||||||||||||||||||||||||||||||||||||||||||||||||||||
| NPB |
Northpointe Bancshares, Inc. | MW | 8.10 | 8.08 | 1.33 | 14.00 | NA | NA | 0.83 | 18.53 | 8.42 | 112.66 | 8.76 | 112.98 | NA | 0.10 | 0.56 | 4.74 | ||||||||||||||||||||||||||||||||||||||||||||||||||||
| NRIM |
Northrim BanCorp, Inc. | WE | 9.92 | NA | 2.02 | 21.72 | 1.71 | 18.45 | 0.35 | 209.52 | 8.53 | 165.76 | 16.45 | 206.04 | 10.04 | 0.64 | 2.61 | 22.30 | ||||||||||||||||||||||||||||||||||||||||||||||||||||
| NWBI |
Northwest Bancshares, Inc. | MW | 11.27 | 8.64 | 0.82 | 7.27 | 1.07 | 9.44 | 0.64 | 140.01 | 14.17 | 100.78 | 11.36 | 135.47 | 10.91 | 0.80 | 6.13 | 86.96 | ||||||||||||||||||||||||||||||||||||||||||||||||||||
| NWFL |
Norwood Financial Corp. | MA | 9.99 | 8.88 | 1.17 | 12.22 | 1.21 | 12.67 | NA | NA | 10.45 | 120.67 | 12.05 | 137.32 | 10.07 | 1.28 | 4.07 | 41.53 | ||||||||||||||||||||||||||||||||||||||||||||||||||||
| NSTS |
NSTS Bancorp, Inc. | MW | 29.25 | 29.25 | -0.21 | -0.73 | -0.21 | -0.73 | 0.11 | 442.11 | NM | 83.09 | 24.31 | 83.09 | NM | NA | NA | NM | ||||||||||||||||||||||||||||||||||||||||||||||||||||
| OVLY |
Oak Valley Bancorp | WE | 10.28 | 10.13 | 1.23 | 12.60 | NA | NA | 0.23 | 269.91 | 11.22 | 130.32 | 13.40 | 132.42 | NA | 0.75 | 2.32 | 23.44 | ||||||||||||||||||||||||||||||||||||||||||||||||||||
| OCFC |
OceanFirst Financial Corp. | MA | 11.42 | 8.09 | 0.52 | 4.23 | NA | NA | 0.26 | 301.27 | 16.25 | 65.62 | 7.49 | 96.04 | NA | 0.80 | 4.21 | 68.38 | ||||||||||||||||||||||||||||||||||||||||||||||||||||
| OFG |
OFG Bancorp | MA | 11.15 | 10.47 | 1.70 | 15.29 | NA | NA | NA | NA | 8.89 | 126.75 | 14.13 | 135.96 | NA | 1.40 | 3.44 | 27.29 | ||||||||||||||||||||||||||||||||||||||||||||||||||||
| OVBC |
Ohio Valley Banc Corp. | MW | 10.76 | 10.34 | 1.02 | 9.73 | 1.21 | 11.58 | NA | NA | 12.54 | 114.86 | 12.36 | 120.02 | 10.54 | 0.92 | 2.22 | 27.79 | ||||||||||||||||||||||||||||||||||||||||||||||||||||
| ONB |
Old National Bancorp | MW | 11.77 | 8.07 | 1.02 | 8.79 | NA | NA | 0.73 | 109.26 | 13.92 | 117.64 | 13.50 | 181.66 | NA | 0.56 | 2.25 | 31.28 | ||||||||||||||||||||||||||||||||||||||||||||||||||||
| OSBC |
Old Second Bancorp, Inc. | MW | 12.99 | 11.02 | 1.27 | 10.28 | 1.51 | 12.22 | 0.74 | 150.78 | 12.49 | 118.87 | 15.44 | 143.31 | 10.51 | 0.28 | 1.38 | 16.05 | ||||||||||||||||||||||||||||||||||||||||||||||||||||
| OPBK |
OP Bancorp | WE | 8.60 | NA | 1.01 | 11.92 | NA | NA | 0.53 | 198.81 | 8.43 | 94.74 | 8.15 | 97.78 | NA | 0.48 | 3.31 | 27.91 | ||||||||||||||||||||||||||||||||||||||||||||||||||||
| OPHC |
OptimumBank Holdings, Inc. | SE | 10.97 | 10.97 | 1.64 | 14.83 | 1.64 | 14.83 | 0.31 | 354.24 | 6.85 | 46.77 | 5.05 | 46.77 | 6.85 | NA | NA | NM | ||||||||||||||||||||||||||||||||||||||||||||||||||||
| OBT |
Orange County Bancorp, Inc. | MA | 10.25 | 10.04 | 1.42 | 16.97 | 1.27 | 15.16 | 0.46 | 240.77 | 10.55 | 157.61 | 16.15 | 161.17 | 11.74 | 0.72 | 2.26 | 18.87 | ||||||||||||||||||||||||||||||||||||||||||||||||||||
| OBK |
Origin Bancorp, Inc. | SW | 12.82 | 11.34 | 0.77 | 6.24 | 0.90 | 7.30 | 0.84 | 119.21 | 18.41 | 109.69 | 14.06 | 126.08 | 15.75 | 0.60 | 1.36 | 25.00 | ||||||||||||||||||||||||||||||||||||||||||||||||||||
| ORRF |
Orrstown Financial Services, Inc. | MA | 10.67 | 8.90 | 1.49 | 14.76 | 1.67 | 16.54 | 0.51 | 170.10 | 8.96 | 123.53 | 13.18 | 151.04 | 8.00 | 1.20 | 3.20 | 26.32 | ||||||||||||||||||||||||||||||||||||||||||||||||||||
| PRK |
Park National Corporation | MW | 13.80 | 12.35 | 1.78 | 13.80 | 1.79 | 13.88 | 0.69 | 139.78 | 14.97 | 197.62 | 27.26 | 224.50 | 14.88 | 4.40 | 2.65 | 50.05 | ||||||||||||||||||||||||||||||||||||||||||||||||||||
| PKBK |
Parke Bancorp, Inc. | MA | 14.43 | 14.43 | 1.76 | 12.09 | 1.76 | 12.09 | 0.61 | 321.03 | 8.94 | 104.12 | NA | 104.12 | 8.94 | 0.72 | 2.55 | 22.78 | ||||||||||||||||||||||||||||||||||||||||||||||||||||
| PBHC |
Pathfinder Bancorp, Inc. | MA | 8.49 | 7.81 | -0.23 | -2.71 | -0.08 | -0.95 | 1.94 | 106.80 | NM | 69.95 | 5.94 | 76.54 | NM | 0.40 | 2.92 | NM | ||||||||||||||||||||||||||||||||||||||||||||||||||||
| CASH |
Pathward Financial, Inc. | MW | 11.29 | 7.50 | 2.53 | 23.87 | NA | NA | NA | 60.80 | 11.09 | 236.29 | 26.71 | 370.62 | NA | 0.20 | 0.22 | 2.44 | ||||||||||||||||||||||||||||||||||||||||||||||||||||
| PNBK |
Patriot National Bancorp, Inc. | NE | 9.99 | 9.93 | -2.06 | -50.11 | -2.01 | -49.01 | 2.73 | 27.67 | NM | 193.62 | 19.35 | 195.10 | NM | 0.00 | 0.00 | NM | ||||||||||||||||||||||||||||||||||||||||||||||||||||
| PCB |
PCB Bancorp | WE | 11.88 | NA | 1.15 | 9.93 | 1.16 | 10.03 | 0.24 | 422.01 | 8.90 | 101.82 | 10.17 | 104.17 | 8.81 | 0.88 | 3.83 | 31.78 | ||||||||||||||||||||||||||||||||||||||||||||||||||||
| PGC |
Peapack-Gladstone Financial Corporation | MA | 8.75 | 8.21 | 0.52 | 5.95 | 0.52 | 5.92 | 0.91 | 104.10 | 15.72 | 88.06 | 7.70 | 94.34 | 15.80 | 0.20 | 0.61 | 9.52 | ||||||||||||||||||||||||||||||||||||||||||||||||||||
| PEBO |
Peoples Bancorp Inc. | MW | 12.50 | 8.80 | 1.13 | 9.22 | NA | NA | 0.38 | 205.16 | 10.90 | 96.46 | 12.06 | 142.95 | NA | 1.64 | 5.03 | 54.85 | ||||||||||||||||||||||||||||||||||||||||||||||||||||
| PEBK |
Peoples Bancorp of North Carolina, Inc. | SE | 9.23 | 9.23 | 1.17 | 13.33 | 1.06 | 12.06 | 0.25 | 242.48 | 10.22 | 128.50 | 11.86 | 128.50 | 11.28 | 0.80 | 2.16 | 26.80 | ||||||||||||||||||||||||||||||||||||||||||||||||||||
| PFIS |
Peoples Financial Services Corp. | MA | 9.86 | 8.05 | 1.17 | 11.89 | 1.30 | 13.26 | NA | 361.31 | 9.16 | 103.57 | 10.22 | 129.38 | 8.21 | 2.50 | 4.64 | 42.13 | ||||||||||||||||||||||||||||||||||||||||||||||||||||
| PNFP |
Pinnacle Financial Partners, Inc. | SE | 12.21 | 9.25 | 1.18 | 9.58 | 1.21 | 9.87 | 0.25 | 331.09 | 12.16 | 111.64 | 13.26 | 154.02 | 11.79 | 2.00 | 2.04 | 15.12 | ||||||||||||||||||||||||||||||||||||||||||||||||||||
| PLBC |
Plumas Bancorp | WE | 11.66 | 10.25 | 1.52 | 13.64 | 1.62 | 14.52 | 0.68 | 132.28 | 11.44 | 138.50 | 16.15 | 160.17 | 10.75 | 1.32 | 2.54 | 27.09 | ||||||||||||||||||||||||||||||||||||||||||||||||||||
| PDLB |
Ponce Financial Group, Inc. | MA | 16.80 | 16.80 | 0.91 | 5.48 | 0.88 | 5.29 | NA | 84.13 | 14.13 | 129.24 | 13.64 | 129.24 | 14.66 | NA | NA | NM | ||||||||||||||||||||||||||||||||||||||||||||||||||||
| BPOP |
Popular, Inc. | MA | 8.29 | 7.32 | 1.11 | 11.56 | 1.11 | 11.54 | 0.72 | 162.15 | 11.11 | 144.26 | 11.93 | 165.38 | 11.14 | 3.00 | 2.19 | 23.58 | ||||||||||||||||||||||||||||||||||||||||||||||||||||
| PFBC |
Preferred Bank | WE | 10.39 | 10.38 | 1.84 | 17.35 | 1.84 | 17.35 | NA | NA | 8.41 | 135.03 | 14.02 | 135.09 | 8.41 | 3.20 | 3.66 | 29.30 | ||||||||||||||||||||||||||||||||||||||||||||||||||||
| FRST |
Primis Financial Corp. | SE | 10.45 | 8.33 | 1.51 | 15.27 | 0.26 | 2.68 | NA | NA | 5.66 | 82.34 | 8.60 | 105.71 | 25.46 | 0.40 | 2.84 | 16.06 | ||||||||||||||||||||||||||||||||||||||||||||||||||||
| BPRN |
Princeton Bancorp, Inc. | MA | 11.86 | 11.19 | 0.81 | 7.02 | 0.86 | 7.42 | NA | NA | 13.84 | 93.73 | 11.11 | 100.07 | 13.10 | 1.40 | 3.73 | 47.97 | ||||||||||||||||||||||||||||||||||||||||||||||||||||
| PB |
Prosperity Bancshares, Inc. | SW | 19.80 | 11.63 | 1.42 | 7.14 | 1.45 | 7.29 | NA | NA | 12.19 | 85.18 | 16.87 | 159.72 | 11.93 | 2.40 | 3.44 | 41.26 | ||||||||||||||||||||||||||||||||||||||||||||||||||||
| PROV |
Provident Financial Holdings, Inc. | WE | 10.38 | 10.38 | 0.54 | 5.08 | NA | NA | 0.08 | 569.09 | 16.30 | 81.21 | 8.43 | 81.21 | NA | 0.56 | 3.47 | 56.57 | ||||||||||||||||||||||||||||||||||||||||||||||||||||
| PFS |
Provident Financial Services, Inc. | MA | 11.34 | 8.48 | 1.19 | 10.71 | 1.19 | 10.67 | 0.32 | 235.61 | 10.18 | 104.65 | 11.87 | 144.56 | 10.22 | 0.96 | 4.23 | 43.05 | ||||||||||||||||||||||||||||||||||||||||||||||||||||
| QCRH |
QCR Holdings, Inc. | MW | 11.62 | 10.24 | 1.36 | 11.97 | 1.41 | 12.33 | 0.45 | 213.51 | 12.33 | 138.57 | 16.10 | 159.62 | 11.96 | 0.24 | 0.26 | 3.20 | ||||||||||||||||||||||||||||||||||||||||||||||||||||
| RBB |
RBB Bancorp | WE | 12.44 | NA | 0.78 | 6.21 | 0.69 | 5.43 | NA | NA | 11.66 | 69.55 | 8.65 | 82.66 | 13.33 | 0.64 | 3.00 | 34.97 | ||||||||||||||||||||||||||||||||||||||||||||||||||||
| RRBI |
Red River Bancshares, Inc. | SW | 10.90 | 10.86 | 1.33 | 12.58 | 1.32 | 12.49 | NA | NA | 13.70 | 157.40 | 17.15 | 158.06 | 13.80 | 0.60 | 0.69 | 8.46 | ||||||||||||||||||||||||||||||||||||||||||||||||||||
| RF |
Regions Financial Corporation | SE | 11.97 | 8.61 | 1.36 | 11.60 | 1.39 | 11.88 | 0.45 | 222.92 | 12.66 | 143.01 | 15.99 | 214.19 | 12.38 | 1.06 | 3.64 | 44.78 | ||||||||||||||||||||||||||||||||||||||||||||||||||||
| RNST |
Renasant Corporation | SE | 14.52 | 9.26 | 0.74 | 5.14 | 0.99 | 6.86 | 0.71 | 167.28 | 18.27 | 92.13 | 13.38 | 153.45 | 13.71 | 0.92 | 2.43 | 43.00 | ||||||||||||||||||||||||||||||||||||||||||||||||||||
| RBCA.A |
Republic Bancorp, Inc. | MW | 15.65 | 15.15 | 1.84 | 12.31 | NA | NA | 0.36 | 358.53 | 10.93 | 130.16 | 20.37 | 135.32 | NA | 1.98 | 2.70 | 27.50 | ||||||||||||||||||||||||||||||||||||||||||||||||||||
| RMBI |
Richmond Mutual Bancorporation, Inc. | MW | 9.55 | 9.55 | 0.76 | 8.57 | NA | NA | NA | 124.74 | 12.22 | 103.01 | 9.84 | 103.01 | NA | 0.60 | 4.20 | 51.28 | ||||||||||||||||||||||||||||||||||||||||||||||||||||
| RVSB |
Riverview Bancorp, Inc. | WE | 10.86 | 9.23 | 0.32 | 2.99 | NA | NA | NA | NA | 23.48 | 68.10 | 7.40 | 81.61 | NA | 0.08 | 1.48 | 34.78 | ||||||||||||||||||||||||||||||||||||||||||||||||||||
| STBA |
S&T Bancorp, Inc. | MA | 14.83 | 11.46 | 1.38 | 9.29 | 1.40 | 9.46 | NA | NA | 12.38 | 110.40 | 16.37 | 148.52 | 12.16 | 1.44 | 3.33 | 40.11 | ||||||||||||||||||||||||||||||||||||||||||||||||||||
| SBFG |
SB Financial Group, Inc. | MW | 9.14 | 7.40 | 0.93 | 10.38 | 0.98 | 10.95 | 0.30 | 351.91 | 10.28 | 99.43 | 9.09 | 125.11 | 9.75 | 0.62 | 2.75 | 27.85 | ||||||||||||||||||||||||||||||||||||||||||||||||||||
| SBCF |
Seacoast Banking Corporation of Florida | SE | 14.66 | 9.31 | 0.84 | 5.86 | 1.10 | NA | 0.37 | 248.33 | 21.13 | 123.36 | NA | 189.40 | 16.03 | 0.76 | 2.28 | 46.84 | ||||||||||||||||||||||||||||||||||||||||||||||||||||
| SFBS |
ServisFirst Bancshares, Inc. | SE | 10.44 | 10.37 | 1.56 | 16.05 | 1.63 | 16.78 | 0.96 | 101.91 | 16.67 | 249.02 | 25.99 | 250.87 | 15.92 | 1.52 | 1.80 | 27.37 | ||||||||||||||||||||||||||||||||||||||||||||||||||||
| SHBI |
Shore Bancshares, Inc. | MA | 9.42 | 8.06 | 0.98 | 10.52 | NA | NA | 0.69 | 147.24 | 10.91 | 110.01 | 10.37 | 130.59 | NA | 0.48 | 2.47 | 26.97 | ||||||||||||||||||||||||||||||||||||||||||||||||||||
| BSRR |
Sierra Bancorp | WE | 9.53 | 8.88 | 1.15 | 11.88 | 1.15 | 11.85 | 0.39 | 162.35 | 11.94 | 135.08 | 12.87 | 146.05 | 11.97 | 1.04 | 2.80 | 32.48 | ||||||||||||||||||||||||||||||||||||||||||||||||||||
| SFNC |
Simmons First National Corporation | SE | 13.93 | 8.71 | -1.55 | -11.45 | 0.98 | 7.26 | 0.51 | 200.71 | NM | 87.13 | 12.14 | 147.92 | 11.01 | 0.85 | 4.13 | NM | ||||||||||||||||||||||||||||||||||||||||||||||||||||
| SMBK |
SmartFinancial, Inc. | SE | 9.43 | 7.93 | 0.91 | 9.67 | 0.96 | 10.15 | 0.22 | 433.23 | 14.05 | 129.11 | 12.17 | 156.04 | 13.37 | 0.32 | 0.76 | 10.74 | ||||||||||||||||||||||||||||||||||||||||||||||||||||
| SFBC |
Sound Financial Bancorp, Inc. | WE | 10.02 | 9.95 | 0.67 | 6.71 | 0.67 | 6.72 | NA | NA | 15.89 | 103.31 | 10.35 | 104.04 | 15.88 | 0.84 | 1.91 | 28.16 | ||||||||||||||||||||||||||||||||||||||||||||||||||||
| SPFI |
South Plains Financial, Inc. | SW | 11.02 | 10.61 | 1.33 | 12.70 | 1.35 | 12.88 | NA | NA | 12.44 | 141.21 | 15.56 | 147.31 | 12.26 | 0.68 | 1.59 | 18.60 | ||||||||||||||||||||||||||||||||||||||||||||||||||||
| SFST |
Southern First Bancshares, Inc. | SE | 8.37 | 8.37 | 0.72 | 8.73 | 0.73 | 8.84 | 0.32 | 305.65 | 15.05 | 125.72 | 10.52 | 125.72 | 14.85 | NA | NA | NM | ||||||||||||||||||||||||||||||||||||||||||||||||||||
| SMBC |
Southern Missouri Bancorp, Inc. | MW | 11.14 | NA | 1.30 | 12.03 | 1.37 | 12.66 | 0.61 | 183.66 | 11.12 | 126.28 | 14.06 | 148.08 | 10.57 | 1.00 | 1.56 | 16.96 | ||||||||||||||||||||||||||||||||||||||||||||||||||||
| SBSI |
Southside Bancshares, Inc. | SW | 9.95 | 7.77 | 0.83 | 8.40 | NA | NA | 0.13 | 430.10 | 14.45 | 116.07 | 11.55 | 152.42 | NA | 1.44 | 4.35 | 62.88 | ||||||||||||||||||||||||||||||||||||||||||||||||||||
| SSB |
SouthState Bank Corporation | SE | 13.48 | 8.76 | 1.22 | 9.13 | 1.48 | 11.01 | 0.46 | 196.93 | 13.08 | 112.69 | 15.19 | 182.99 | 10.85 | 2.40 | 2.33 | 29.73 | ||||||||||||||||||||||||||||||||||||||||||||||||||||
| SRBK |
SR Bancorp, Inc. | MA | 16.49 | 14.54 | 0.39 | 2.24 | 0.38 | 2.15 | NA | NA | 32.40 | 76.83 | 12.67 | 89.18 | 33.55 | 0.20 | 1.16 | 37.74 | ||||||||||||||||||||||||||||||||||||||||||||||||||||
| STT |
State Street Corporation | NE | 7.61 | 5.25 | 0.86 | 10.88 | 0.94 | 11.88 | NA | NA | 14.10 | 152.38 | 10.21 | 243.61 | 12.84 | 3.36 | 2.53 | 34.04 | ||||||||||||||||||||||||||||||||||||||||||||||||||||
| SYBT |
Stock Yards Bancorp, Inc. | MW | 11.28 | 9.32 | 1.53 | 14.00 | 1.56 | 14.28 | 0.13 | 729.97 | 14.45 | 188.06 | 21.21 | 232.67 | 14.16 | 1.28 | 1.87 | 26.53 | ||||||||||||||||||||||||||||||||||||||||||||||||||||
| SSBI |
Summit State Bank | WE | 10.07 | NA | 0.66 | 6.93 | 0.66 | 6.94 | NA | NA | 13.60 | 91.97 | 9.26 | 96.08 | 13.58 | 0.00 | 0.00 | NM | ||||||||||||||||||||||||||||||||||||||||||||||||||||
| TCBI |
Texas Capital Bancshares, Inc. | SW | 11.51 | 11.51 | 1.04 | 9.27 | NA | NA | NA | NA | 15.09 | 136.13 | 14.52 | 136.19 | NA | NA | NA | NM | ||||||||||||||||||||||||||||||||||||||||||||||||||||
| TCBS |
Texas Community Bancshares, Inc. | SW | 12.18 | 12.17 | 0.57 | 5.38 | 0.59 | 5.55 | NA | 147.79 | 20.00 | 93.29 | 11.36 | 93.35 | 19.43 | 0.20 | 1.18 | 23.53 | ||||||||||||||||||||||||||||||||||||||||||||||||||||
| TBBK |
The Bancorp, Inc. | MA | 7.38 | 7.37 | 2.54 | 28.90 | 2.52 | 28.71 | 1.24 | 118.88 | 12.76 | 385.39 | 28.43 | 385.87 | 12.84 | NA | NA | NM | ||||||||||||||||||||||||||||||||||||||||||||||||||||
| BK |
The Bank of New York Mellon Corporation | MA | 9.47 | 5.55 | 1.28 | 12.80 | 1.27 | 12.87 | NA | NA | 16.43 | 212.01 | 17.92 | 420.84 | 16.52 | 2.12 | 1.74 | 27.84 | ||||||||||||||||||||||||||||||||||||||||||||||||||||
| FNLC |
The First Bancorp, Inc. | NE | 8.94 | 8.05 | 1.08 | 12.83 | 1.08 | 12.84 | NA | NA | 9.10 | 110.78 | 9.91 | 124.29 | 9.10 | 1.48 | 5.30 | 47.88 | ||||||||||||||||||||||||||||||||||||||||||||||||||||
| PNC |
The PNC Financial Services Group, Inc. | MA | 10.57 | 8.80 | 1.24 | 12.25 | 1.22 | 11.98 | 0.41 | 198.83 | 13.72 | 162.09 | 15.65 | 203.41 | 13.92 | 6.80 | 2.99 | 40.39 | ||||||||||||||||||||||||||||||||||||||||||||||||||||
| TCBX |
Third Coast Bancshares, Inc. | SW | 9.94 | 9.63 | 1.33 | 13.28 | 1.36 | 13.56 | 0.35 | 434.28 | 11.12 | 125.89 | 11.10 | 131.16 | 10.87 | NA | NA | NM | ||||||||||||||||||||||||||||||||||||||||||||||||||||
| TSBK |
Timberland Bancorp, Inc. | WE | 13.38 | 12.71 | 1.55 | 11.89 | NA | NA | 0.23 | 423.09 | 10.13 | 114.85 | 15.37 | 121.82 | NA | 1.16 | 2.97 | 28.24 | ||||||||||||||||||||||||||||||||||||||||||||||||||||
| TMP |
Tompkins Financial Corporation | MA | 10.83 | 10.07 | 1.96 | 20.61 | 0.95 | 10.00 | 0.55 | 120.67 | 7.22 | 124.66 | 13.50 | 135.14 | 14.87 | 2.68 | 3.30 | 22.78 | ||||||||||||||||||||||||||||||||||||||||||||||||||||
| TOWN |
TowneBank | SE | 12.34 | 9.15 | 0.93 | 7.55 | 1.22 | 9.98 | 0.07 | NM | 16.14 | 116.26 | 14.31 | 162.63 | 12.24 | 1.08 | 3.03 | 47.96 | ||||||||||||||||||||||||||||||||||||||||||||||||||||
| TCBK |
TriCo Bancshares | WE | 13.52 | 10.71 | 1.23 | 9.45 | 1.26 | 9.69 | NA | NA | 13.79 | 124.28 | 16.80 | 161.95 | 13.45 | 1.44 | 2.82 | 37.30 | ||||||||||||||||||||||||||||||||||||||||||||||||||||
| TFIN |
Triumph Financial, Inc. | SW | 14.76 | 9.01 | 0.40 | 2.76 | NA | NA | NA | NA | 68.84 | 169.66 | 24.01 | 308.25 | NA | NA | NA | NM | ||||||||||||||||||||||||||||||||||||||||||||||||||||
| TFC |
Truist Financial Corporation | SE | 11.91 | 8.85 | 0.99 | 8.21 | 1.07 | 8.93 | NA | NA | 13.79 | 110.30 | 12.25 | 158.70 | 12.60 | 2.08 | 3.95 | 54.45 | ||||||||||||||||||||||||||||||||||||||||||||||||||||
| TRST |
TrustCo Bank Corp NY | MA | 10.66 | 10.65 | 0.97 | 8.88 | 0.97 | 8.88 | 0.34 | 252.54 | 13.74 | 117.25 | 12.50 | 117.34 | 13.74 | 1.52 | 3.40 | 45.54 | ||||||||||||||||||||||||||||||||||||||||||||||||||||
| TRMK |
Trustmark Corporation | SE | 11.21 | 9.61 | 1.21 | 10.86 | 1.20 | 10.79 | 0.48 | 186.12 | 11.62 | 119.63 | 13.41 | 142.03 | 11.71 | 1.00 | 2.33 | 26.22 | ||||||||||||||||||||||||||||||||||||||||||||||||||||
| USB |
U.S. Bancorp | MW | 9.48 | 7.56 | 1.12 | 12.17 | 1.18 | 12.93 | 0.23 | 491.60 | 12.42 | 152.77 | 13.02 | 202.69 | 11.74 | 2.08 | 3.63 | 44.16 | ||||||||||||||||||||||||||||||||||||||||||||||||||||
| UMBF |
UMB Financial Corporation | MW | 10.53 | 7.58 | 1.06 | 10.19 | 1.31 | 12.60 | NA | 289.96 | 13.78 | 131.45 | 13.36 | 191.74 | 11.09 | 1.72 | 1.34 | 17.87 | ||||||||||||||||||||||||||||||||||||||||||||||||||||
| UNB |
Union Bankshares, Inc. | NE | NA | NA | 0.71 | NA | NA | NA | NA | NA | 10.23 | 146.65 | NA | 150.97 | NA | 1.44 | 5.79 | 59.26 | ||||||||||||||||||||||||||||||||||||||||||||||||||||
RP® Financial, LC.
| Exhibit IV-1B Weekly Bank and Thrift Market Line—Part Two Prices As of February 2, 2026 |
| Key Financial Ratios | Asset Quality Ratios | Pricing Ratios | Dividend Data (6) | |||||||||||||||||||||||||||||||||||||||||||||||||||||||||||||||||||
| Equity/ | Tang Equity/ | Reported Earnings | Core Earnings | NPAs/ | Rsvs/ | Price/ | Price/ | Price/ | Price/ | Price/ | Div/ | Dividend | Payout | |||||||||||||||||||||||||||||||||||||||||||||||||||||||||
| Assets(1) | Assets(1) | ROA(5) | ROE(5) | ROA(5) | ROE(5) | Assets | NPLs | Earnings | Book | Assets | Tang Book | Core Earnings | Share | Yield | Ratio (7) | |||||||||||||||||||||||||||||||||||||||||||||||||||||||
| (%) | (%) | (%) | (%) | (%) | (%) | (%) | (%) | (x) | (%) | (%) | (%) | (x) | ($) | (%) | (%) | |||||||||||||||||||||||||||||||||||||||||||||||||||||||
| Companies |
||||||||||||||||||||||||||||||||||||||||||||||||||||||||||||||||||||||
| UBCP |
United Bancorp, Inc. | MW | 7.67 | 7.60 | 0.91 | 12.18 | 0.91 | 12.19 | 0.66 | 176.57 | 10.77 | 125.45 | 9.62 | 126.77 | 10.76 | 0.76 | 5.43 | 70.77 | ||||||||||||||||||||||||||||||||||||||||||||||||||||
| UBSI |
United Bankshares, Inc. | SE | 16.33 | 10.90 | 1.41 | 8.63 | 1.43 | 8.71 | 0.31 | 308.33 | 13.17 | 109.62 | 17.90 | 174.89 | 13.05 | 1.52 | 3.53 | 45.57 | ||||||||||||||||||||||||||||||||||||||||||||||||||||
| UCB |
United Community Banks, Inc. | SE | 12.99 | NA | 1.17 | 9.18 | 1.23 | 9.65 | NA | NA | 13.35 | 115.97 | 15.07 | 162.27 | 12.68 | 1.00 | 2.86 | 37.40 | ||||||||||||||||||||||||||||||||||||||||||||||||||||
| UNTY |
Unity Bancorp, Inc. | MA | 11.65 | NA | 2.17 | 18.07 | 1.99 | 16.57 | NA | NA | 9.79 | 160.34 | 18.68 | 167.91 | 10.68 | 0.60 | 1.08 | 10.23 | ||||||||||||||||||||||||||||||||||||||||||||||||||||
| UVSP |
Univest Financial Corporation | MA | 11.18 | 9.27 | 1.11 | 9.90 | 1.10 | 9.76 | 0.45 | 641.53 | 10.98 | 102.61 | 11.47 | 126.38 | 11.14 | 0.88 | 2.56 | 28.12 | ||||||||||||||||||||||||||||||||||||||||||||||||||||
| USCB |
USCB Financial Holdings, Inc. | SE | 7.78 | 7.78 | 0.96 | 11.79 | 1.19 | 14.57 | NA | NA | 14.61 | 162.27 | 12.62 | 162.27 | 11.82 | 0.50 | 2.57 | 31.95 | ||||||||||||||||||||||||||||||||||||||||||||||||||||
| VLY |
Valley National Bancorp | MA | 12.17 | NA | 0.96 | 7.89 | 0.95 | 7.86 | 0.69 | 134.44 | 12.50 | 94.25 | 11.01 | 131.43 | 12.54 | 0.44 | 3.49 | 43.56 | ||||||||||||||||||||||||||||||||||||||||||||||||||||
| VABK |
Virginia National Bankshares Corporation | SE | 11.16 | 10.60 | 1.19 | 11.19 | 1.23 | 11.57 | 0.13 | 376.25 | 11.83 | 123.00 | 13.73 | 130.40 | 11.44 | 1.44 | 3.43 | 49.86 | ||||||||||||||||||||||||||||||||||||||||||||||||||||
| WAFD |
WaFd, Inc. | WE | 11.10 | 9.64 | 0.90 | 8.02 | 0.93 | 8.22 | 0.75 | 104.28 | 11.44 | 92.63 | 9.37 | 110.58 | 11.14 | 1.08 | 3.27 | 37.37 | ||||||||||||||||||||||||||||||||||||||||||||||||||||
| WASH |
Washington Trust Bancorp, Inc. | NE | 8.21 | 7.25 | 0.78 | 9.92 | 0.78 | 9.95 | 0.20 | 288.14 | 13.01 | 123.47 | 10.14 | 141.19 | 12.97 | 2.24 | 6.35 | 82.66 | ||||||||||||||||||||||||||||||||||||||||||||||||||||
| WSBF |
Waterstone Financial, Inc. | MW | 15.46 | NA | 1.19 | 7.66 | 1.19 | 7.66 | NA | NA | 12.68 | 98.58 | 15.24 | 100.78 | 12.68 | 0.60 | 3.20 | 40.54 | ||||||||||||||||||||||||||||||||||||||||||||||||||||
| WBS |
Webster Financial Corporation | NE | 11.29 | 7.77 | 1.23 | 10.70 | 1.27 | 10.98 | 0.60 | 143.69 | 11.19 | 115.55 | 12.70 | 177.41 | 10.89 | 1.60 | 2.42 | 27.12 | ||||||||||||||||||||||||||||||||||||||||||||||||||||
| WFC |
Wells Fargo & Company | WE | 8.52 | 7.38 | 1.08 | 11.64 | 1.05 | 11.49 | NA | 168.24 | 14.74 | 173.46 | 13.40 | 206.76 | 15.10 | 1.80 | 1.95 | 27.96 | ||||||||||||||||||||||||||||||||||||||||||||||||||||
| WSBC |
WesBanco, Inc. | SE | 14.56 | 8.89 | 0.86 | 5.96 | 1.17 | 8.09 | 0.33 | 238.85 | 16.15 | 90.85 | 12.59 | 165.97 | 11.59 | 1.52 | 4.22 | 66.82 | ||||||||||||||||||||||||||||||||||||||||||||||||||||
| WTBA |
West Bancorporation, Inc. | MW | 6.42 | 6.42 | 0.81 | 13.48 | 0.89 | 14.77 | 0.00 | NM | 13.30 | 162.68 | 10.45 | 162.68 | 12.14 | 1.00 | 3.92 | 52.08 | ||||||||||||||||||||||||||||||||||||||||||||||||||||
| WABC |
Westamerica Bancorporation | WE | 15.66 | 13.90 | 1.91 | 11.23 | 1.91 | 11.23 | NA | 785.14 | 11.32 | 134.92 | 21.13 | 155.14 | 11.32 | 1.84 | 3.60 | 40.71 | ||||||||||||||||||||||||||||||||||||||||||||||||||||
| WAL |
Western Alliance Bancorporation | WE | 8.56 | 7.92 | 1.12 | 13.33 | 1.05 | 12.91 | 0.69 | 92.20 | 10.27 | 133.41 | 10.65 | 146.32 | 10.98 | 1.68 | 1.87 | 17.87 | ||||||||||||||||||||||||||||||||||||||||||||||||||||
| WNEB |
Western New England Bancorp, Inc. | NE | 9.05 | 8.60 | 0.56 | 6.35 | 0.57 | 6.38 | 0.19 | 393.20 | 18.41 | 113.61 | 10.28 | 120.19 | 18.32 | 0.28 | 2.03 | 37.33 | ||||||||||||||||||||||||||||||||||||||||||||||||||||
| WTFC |
Wintrust Financial Corporation | MW | 10.20 | 9.06 | 1.23 | 12.00 | 1.25 | 12.22 | 0.26 | 227.59 | 13.13 | 146.73 | 14.18 | 168.87 | 12.89 | 2.20 | 1.47 | 17.98 | ||||||||||||||||||||||||||||||||||||||||||||||||||||
| WSFS |
WSFS Financial Corporation | MA | 12.80 | NA | 1.36 | 10.75 | 1.38 | 10.86 | 0.34 | 249.80 | 13.04 | 129.42 | 16.62 | 206.16 | 12.85 | 0.68 | 1.02 | 13.36 | ||||||||||||||||||||||||||||||||||||||||||||||||||||
| ZION |
Zions Bancorporation, National Association | SW | 8.07 | 6.93 | 1.00 | 13.63 | 0.95 | 12.93 | 0.36 | 215.24 | 10.15 | 126.59 | 10.13 | 149.52 | 10.70 | 1.80 | 2.95 | 29.62 | ||||||||||||||||||||||||||||||||||||||||||||||||||||
| MHCs |
||||||||||||||||||||||||||||||||||||||||||||||||||||||||||||||||||||||
| BSBK |
Bogota Financial Corp. | MA | 15.20 | 15.19 | 0.05 | 0.35 | 0.00 | 0.02 | 2.21 | 12.42 | 170.80 | 78.89 | 11.99 | 78.96 | NM | NA | NA | NM | ||||||||||||||||||||||||||||||||||||||||||||||||||||
| CLBK |
Columbia Financial, Inc. | MA | 10.53 | 9.57 | 0.48 | 4.63 | 0.49 | 4.73 | 0.34 | 176.84 | 34.73 | 158.66 | 16.71 | 176.55 | 33.97 | NA | NA | NM | ||||||||||||||||||||||||||||||||||||||||||||||||||||
| GCBC |
Greene County Bancorp, Inc. | MA | 8.21 | 8.21 | 1.22 | 15.33 | NA | NA | NA | NA | 11.16 | 157.43 | 12.92 | 157.43 | NA | 0.40 | 1.68 | 18.22 | ||||||||||||||||||||||||||||||||||||||||||||||||||||
| KFFB |
Kentucky First Federal Bancorp | MW | 13.31 | 13.31 | 0.14 | 1.12 | 0.14 | 1.12 | 0.84 | 70.44 | 75.17 | 74.77 | 9.95 | 74.77 | 75.17 | 0.00 | 0.00 | NM | ||||||||||||||||||||||||||||||||||||||||||||||||||||
| PBFS |
Pioneer Bancorp, Inc. | MA | 15.06 | NA | 0.99 | 6.54 | NA | NA | NA | NA | 17.14 | 113.60 | NA | 118.60 | NA | NA | NA | NM | ||||||||||||||||||||||||||||||||||||||||||||||||||||
| RBKB |
Rhinebeck Bancorp, Inc. | MA | 10.51 | 10.35 | 0.78 | 7.77 | 0.79 | 7.80 | NA | NA | 12.97 | 97.12 | 10.21 | 98.81 | 12.91 | NA | NA | NM | ||||||||||||||||||||||||||||||||||||||||||||||||||||
| TFSL |
TFS Financial Corporation | MW | 10.86 | 10.81 | 0.53 | 4.72 | 0.53 | 4.72 | 0.23 | 192.27 | 44.48 | 210.90 | NA | 211.99 | 44.48 | 1.13 | 7.94 | 353.13 | ||||||||||||||||||||||||||||||||||||||||||||||||||||
| WSBK |
Winchester Bancorp, Inc. | NE | 11.64 | 11.64 | 0.15 | 1.43 | 0.35 | 3.36 | NA | NA | NA | 89.62 | 10.43 | 89.62 | NA | NA | NA | NA | ||||||||||||||||||||||||||||||||||||||||||||||||||||
| Under Acquisition |
||||||||||||||||||||||||||||||||||||||||||||||||||||||||||||||||||||||
| BLFY |
Blue Foundry Bancorp | MA | 14.58 | 14.58 | -0.44 | -2.80 | -0.44 | -2.80 | 0.53 | 121.49 | NM | 88.55 | 12.91 | 88.58 | NM | NA | NA | NM | ||||||||||||||||||||||||||||||||||||||||||||||||||||
| FBIZ |
First Business Financial Services, Inc. | MW | 9.10 | NA | 1.26 | 14.45 | 1.25 | 14.40 | 1.07 | 81.81 | 9.91 | 136.23 | 12.04 | 146.22 | 9.94 | 1.36 | 2.31 | 25.25 | ||||||||||||||||||||||||||||||||||||||||||||||||||||
| FFWM |
First Foundation Inc. | SW | 7.67 | 7.65 | -1.27 | -15.26 | -1.30 | -15.63 | 0.37 | 249.11 | NM | 64.94 | 4.54 | 65.13 | NM | 0.00 | 0.00 | NM | ||||||||||||||||||||||||||||||||||||||||||||||||||||
| FSUN |
FirstSun Capital Bancorp | SW | 13.59 | 12.58 | 1.18 | 8.88 | NA | NA | NA | NA | 11.69 | 98.07 | 13.33 | 107.23 | NA | NA | NA | NM | ||||||||||||||||||||||||||||||||||||||||||||||||||||
| FFIC |
Flushing Financial Corporation | MA | 8.14 | 8.14 | 0.21 | 2.63 | 0.42 | 5.22 | 0.68 | 102.98 | 29.91 | 77.05 | 6.28 | 77.14 | 14.85 | 0.88 | 5.45 | 162.96 | ||||||||||||||||||||||||||||||||||||||||||||||||||||
| HTBK |
Heritage Commerce Corp | WE | 12.29 | NA | 0.86 | 6.86 | 1.02 | 8.13 | 0.04 | NM | 16.77 | 113.29 | 13.92 | 152.08 | 14.14 | 0.52 | 3.98 | 66.67 | ||||||||||||||||||||||||||||||||||||||||||||||||||||
| IROQ |
IF Bancorp, Inc. | MW | 10.52 | 10.52 | 0.59 | 6.31 | NA | NA | NA | NA | 17.01 | 104.38 | 10.98 | 104.38 | NA | 0.40 | 1.47 | 25.00 | ||||||||||||||||||||||||||||||||||||||||||||||||||||
| LNKB |
LINKBANCORP, Inc. | MA | 9.98 | 7.75 | 1.14 | 11.28 | 1.00 | 9.90 | NA | NA | 9.91 | 109.04 | 10.88 | 143.86 | 11.30 | 0.30 | 3.36 | 33.33 | ||||||||||||||||||||||||||||||||||||||||||||||||||||
| MBCN |
Middlefield Banc Corp. | MW | 11.33 | 9.44 | 1.11 | 9.89 | 1.11 | 9.82 | 1.51 | 76.95 | 12.89 | 121.42 | 13.75 | 148.78 | 12.98 | 0.84 | 2.50 | 32.18 | ||||||||||||||||||||||||||||||||||||||||||||||||||||
| MOFG |
MidWestOne Financial Group, Inc. | MW | 9.70 | 8.36 | 0.94 | 10.09 | 1.01 | 10.84 | 0.52 | 180.84 | 16.75 | 160.25 | 15.54 | 188.56 | 15.59 | 0.97 | 2.06 | 34.52 | ||||||||||||||||||||||||||||||||||||||||||||||||||||
| NFBK |
Northfield Bancorp, Inc. (Staten Island, NY) | MA | 11.99 | 11.99 | 0.01 | 0.11 | 0.59 | 4.66 | NA | 250.78 | NM | 83.54 | 10.02 | 83.54 | 16.51 | 0.52 | 3.77 | NM | ||||||||||||||||||||||||||||||||||||||||||||||||||||
| STEL |
Stellar Bancorp, Inc. | SW | 15.44 | 10.75 | 0.97 | 6.34 | NA | NA | NA | NA | 18.80 | 114.15 | 17.63 | 173.11 | NA | 0.60 | 1.60 | 28.64 | ||||||||||||||||||||||||||||||||||||||||||||||||||||
| UBFO |
United Security Bancshares | WE | 11.19 | 10.87 | 1.01 | 9.02 | NA | NA | 1.11 | 259.31 | 15.87 | 139.84 | 15.65 | 144.49 | NA | 0.48 | 4.32 | 68.57 | ||||||||||||||||||||||||||||||||||||||||||||||||||||
| (1) Average of High/Low or Bid/Ask price per share. (2) Or since offering price if converted of first listed in the past 52 weeks. Percent change figures are actual year-to-date and are not annualized. (3) EPS (earnings per share) is based on actual trailing 12 month data and is not shown on a pro forma basis. (4) Exludes intangibles (such as goodwill, value of core deposits, etc.). (5) ROA (return on assets) and ROE (return on equity) are indicated ratios based on trailing 12 month common earnings and average common equity and total assets balances. (6) Annualized based on last regular quarterly cash dividend announcement. (7) Indicated dividend as a percent of trailing 12 month earnings. (8) Excluded from averages due to actual or rumored acquisition activities or unusual operating characteristics. (9) For MHC institutions, market value reflects share price multiplied by public (non-MHC) shares.
Source: S&P Global Market Intelligence and RP® Financial, LC. calculations. The information provided in this table has been obtained from sources we believe are reliable, but we cannot guarantee the accuracy or completeness of such information.
Copyright(c) 2026 by RP® Financial, LC. |
EXHIBIT IV-2
Historical Stock Price Indices
Exhibit IV-2
Historical Stock Price Indices(1)
| Year/Qtr. Ended |
DJIA | S&P 500 | NASDAQ Composite |
S&P U.S. BMI Banks Index |
KBW NASDAQ Regional Bank Index |
|||||||||||||||||
| 2015: | Quarter 1 |
17776.1 | 2067.9 | 4900.9 | 102.0 | 79.9 | ||||||||||||||||
| Quarter 2 |
17619.5 | 2063.1 | 4986.9 | 109.1 | 87.5 | |||||||||||||||||
| Quarter 3 |
16284.7 | 1920.0 | 4620.2 | 100.1 | 81.2 | |||||||||||||||||
| Quarter 4 |
17425.0 | 2043.9 | 5007.4 | 105.4 | 82.0 | |||||||||||||||||
| 2016: | Quarter 1 |
17685.1 | 2059.7 | 4869.9 | 92.8 | 77.6 | ||||||||||||||||
| Quarter 2 |
17930.0 | 2098.9 | 4842.7 | 93.9 | 80.0 | |||||||||||||||||
| Quarter 3 |
18308.2 | 2168.3 | 5312.0 | 100.7 | 86.5 | |||||||||||||||||
| Quarter 4 |
19762.6 | 2238.8 | 5383.1 | 130.4 | 111.2 | |||||||||||||||||
| 2017: | Quarter 1 |
20663.2 | 2362.7 | 5911.7 | 131.2 | 106.7 | ||||||||||||||||
| Quarter 2 |
21349.6 | 2423.4 | 6140.4 | 134.9 | 106.6 | |||||||||||||||||
| Quarter 3 |
22405.1 | 2519.4 | 6496.0 | 140.4 | 109.0 | |||||||||||||||||
| Quarter 4 |
24719.2 | 2673 6 | 6903.4 | 151.0 | 110.9 | |||||||||||||||||
| 2018: | Quarter 1 |
24103.1 | 2640.9 | 7063.5 | 148.9 | 111.9 | ||||||||||||||||
| Quarter 2 |
24271.4 | 2718.4 | 7510.3 | 146.2 | 113.9 | |||||||||||||||||
| Quarter 3 |
26458.3 | 2914.0 | 8046.4 | 149.1 | 110.7 | |||||||||||||||||
| Quarter 4 |
23327.5 | 2506.9 | 6635.3 | 123.4 | 89.4 | |||||||||||||||||
| 2019: | Quarter 1 |
25928.7 | 2834.4 | 7729.3 | 133.9 | 97.1 | ||||||||||||||||
| Quarter 2 |
26600.0 | 2941.8 | 8006.2 | 142.2 | 100.2 | |||||||||||||||||
| Quarter 3 |
26916.8 | 2976.7 | 7999.3 | 145.3 | 98.8 | |||||||||||||||||
| Quarter 4 |
28538.4 | 3230.8 | 8972.6 | 164.6 | 107.6 | |||||||||||||||||
| 2020: | Quarter 1 |
21917.2 | 2584.6 | 7700.1 | 97.1 | 63.6 | ||||||||||||||||
| Quarter 2 |
25812.9 | 3100.3 | 10058.8 | 106.3 | 72.2 | |||||||||||||||||
| Quarter 3 |
27781.7 | 3363.0 | 11167.5 | 103.1 | 64.1 | |||||||||||||||||
| Quarter 4 |
30606.5 | 3756.1 | 12888.3 | 138.9 | 94.6 | |||||||||||||||||
| 2021: | Quarter 1 |
32981.6 | 3972.9 | 13246.9 | 171.3 | 121.9 | ||||||||||||||||
| Quarter 2 |
34502.5 | 4297.5 | 14504.0 | 176.0 | 119.4 | |||||||||||||||||
| Quarter 3 |
33843.9 | 4307.5 | 14448.6 | 182.7 | 122.5 | |||||||||||||||||
| Quarter 4 |
36338.3 | 4766.2 | 15645.0 | 184.0 | 126.0 | |||||||||||||||||
| 2022: | Quarter 1 |
34678.4 | 4530.4 | 14220.5 | 171.0 | 122.5 | ||||||||||||||||
| Quarter 2 |
30775.4 | 3785.4 | 11028.7 | 141.2 | 107.1 | |||||||||||||||||
| Quarter 3 |
28725.5 | 3585.6 | 10575.6 | 136.7 | 110.5 | |||||||||||||||||
| Quarter 4 |
33147.3 | 3839.5 | 10466.5 | 148.4 | 114.1 | |||||||||||||||||
| 2023: | Quarter 1 |
33274.2 | 4109.3 | 12221.9 | 128.0 | 92.9 | ||||||||||||||||
| Quarter 2 |
34407.6 | 4450.4 | 13787.9 | 130.4 | 86.7 | |||||||||||||||||
| Quarter 3 |
33507.5 | 4288.1 | 13219.3 | 128.0 | 87.9 | |||||||||||||||||
| Quarter 4 |
37689.5 | 4769.8 | 15011.4 | 156.2 | 109.5 | |||||||||||||||||
| 2024: | Quarter 1 |
39807.4 | 5254.4 | 16379.5 | 172.2 | 102.2 | ||||||||||||||||
| Quarter 2 |
39118.9 | 5460.5 | 17732.6 | 172.5 | 98.6 | |||||||||||||||||
| Quarter 3 |
42330.2 | 5762.5 | 18189.2 | 182.8 | 113.2 | |||||||||||||||||
| Quarter 4 |
42544.2 | 5881.6 | 19310.8 | 203.1 | 120.0 | |||||||||||||||||
| 2025: | Quarter 1 |
42001.8 | 5611.9 | 17299.3 | 198.4 | 112.6 | ||||||||||||||||
| Quarter 2 |
44094.8 | 6205.0 | 20369.7 | 222.9 | 116.5 | |||||||||||||||||
| Quarter 3 |
46397.9 | 6688.5 | 22660.0 | 241.0 | 121.7 | |||||||||||||||||
| Quarter 4 |
48063.3 | 6845.5 | 23242.0 | 254.1 | 124.0 | |||||||||||||||||
| As of February 2, 2026 | 49407.7 | 6976.4 | 23592.1 | 255.8 | 134.9 | |||||||||||||||||
| (1) | End of period data. |
Sources: S&P Global Market Intelligence and The Wall Street Journal.
EXHIBIT IV-3
Stock Indices as of February 2, 2026

Index Summary (Current Data)
Industry Banking
Geography All
| Index Name | Current Value | As Of | Day’s Change | Day’s Change (%) |
||||||||||||
| Banking Indexes |
||||||||||||||||
| S&P United States BMI Banks |
255.82 | 2/2/2026 | 3.52 | 1.40 | ||||||||||||
| KBW Nasdaq Bank Index |
170.48 | 2/2/2026 | 2.86 | 1.71 | ||||||||||||
| KBW Nasdaq Regional Bank Index |
134.86 | 2/2/2026 | 1.86 | 1.40 | ||||||||||||
| S&P 500 Bank |
609.91 | 2/2/2026 | 8.06 | 1.34 | ||||||||||||
| NASDAQ Bank |
4,906.04 | 2/2/2026 | 94.00 | 1.95 | ||||||||||||
| S&P 500 Commercial Banks |
871.36 | 2/2/2026 | 11.51 | 1.34 | ||||||||||||
| S&P 500 Diversified Banks |
1,155.05 | 2/2/2026 | 14.17 | 1.24 | ||||||||||||
| S&P 500 Regional Banks |
128.56 | 2/2/2026 | 2.92 | 2.33 | ||||||||||||
| Market Cap Indexes |
||||||||||||||||
| Dow Jones U.S. MicroCap Banks |
39,934.30 | 2/2/2026 | 976.02 | 2.51 | ||||||||||||
| S&P U.S. SmallCap Banks |
296.14 | 2/2/2026 | 5.30 | 1.82 | ||||||||||||
| S&P U.S. MidCap Banks |
721.47 | 2/2/2026 | 17.13 | 2.43 | ||||||||||||
| S&P U.S. LargeCap Banks |
741.15 | 2/2/2026 | 8.63 | 1.18 | ||||||||||||
| S&P United States Between USD1 Billion and USD5 Billion Banks (Industry Group) |
849.27 | 2/2/2026 | 14.81 | 1.77 | ||||||||||||
| S&P United States Over USD5 Billion Banks |
763.31 | 2/2/2026 | 10.02 | 1.33 | ||||||||||||
| S&P United States Between USD250 Million and USD1 Billion Banks (Industry Group) |
1,877.62 | 2/2/2026 | 49.92 | 2.73 | ||||||||||||
| S&P United States Under USD250 Million Banks (Industry Group) |
1,643.52 | 2/2/2026 | 36.05 | 2.24 | ||||||||||||
| Geographic Indexes |
||||||||||||||||
| S&P U.S. BMI Banks - Mid-Atlantic Region |
1,246.81 | 2/2/2026 | 11.12 | 0.90 | ||||||||||||
| S&P U.S. BMI Banks - Midwest Region |
836.58 | 2/2/2026 | 18.82 | 2.30 | ||||||||||||
| S&P U.S. BMI Banks - New England Region |
771.46 | 2/2/2026 | 17.47 | 2.32 | ||||||||||||
| S&P U.S. BMI Banks - Southeast Region |
631.72 | 2/2/2026 | 10.48 | 1.69 | ||||||||||||
| S&P U.S. BMI Banks - Southwest Region |
1,533.10 | 2/2/2026 | 24.59 | 1.63 | ||||||||||||
| S&P U.S. BMI Banks - Western Region |
1,976.35 | 2/2/2026 | 34.25 | 1.76 | ||||||||||||
| Broad Market Indexes |
||||||||||||||||
| DJIA |
49,407.66 | 2/2/2026 | 515.19 | 1.05 | ||||||||||||
| S&P 500 |
6,976.44 | 2/2/2026 | 37.41 | 0.54 | ||||||||||||
| S&P 400 Mid Cap |
3,467.47 | 2/2/2026 | 30.36 | 0.88 | ||||||||||||
| S&P 500 Financials |
896.91 | 2/2/2026 | 9.08 | 1.02 | ||||||||||||
| MSCI US IMI Financials |
3,218.47 | 2/2/2026 | 31.83 | 1.00 | ||||||||||||
| NASDAQ |
23,592.11 | 2/2/2026 | 130.29 | 0.56 | ||||||||||||
| NASDAQ Finl |
7,344.76 | 2/2/2026 | (9.04 | ) | (0.12 | ) | ||||||||||
| NYSE |
22,885.65 | 2/2/2026 | 166.33 | 0.73 | ||||||||||||
| Russell 1000 |
3,801.42 | 2/2/2026 | 20.18 | 0.53 | ||||||||||||
| Russell 2000 |
2,640.28 | 2/2/2026 | 26.54 | 1.02 | ||||||||||||
| Russell 3000 |
3,961.80 | 2/2/2026 | 21.88 | 0.56 | ||||||||||||
| S&P TSX Composite |
32,183.88 | 2/2/2026 | 260.36 | 0.82 | ||||||||||||
Intraday data is available for certain exchanges. In all cases, the data is at least 15 minutes delayed.
| * | -Intraday data is not currently available. Data is as of the previous close. |
| ** | -Non-publicly traded institutions and institutions outside of your current subscription are not included in custom indexes. Data is as of the previous close. |
Source: MSCI. MSCI makes no express or implied warranties or representations and shall have no liability whatsoever with respect to any MSCI data contained herein. The MSCI data may not be further redistributed or used as a basis for other indices or any securities or financial products.
EXHIBIT IV-4
New Jersey Thrift Acquisitions 2022 - Present
| Exhibit IV-4 New Jersey Bank and Thrift Acquisitions 2022-Present |
| |||||||||||||||||||||||||||||||||||||||||||||||||||||||||||||||||||||||||
| Target Financials at Announcement | Deal Terms and Pricing at Announcement | |||||||||||||||||||||||||||||||||||||||||||||||||||||||||||||||||||||||||
| Announce |
Complete Date |
Buyer Name | Target Name |
Total Assets ($000) |
E/A (%) |
TE/A (%) |
ROAA (%) |
ROAE (%) |
NPAs/ Assets (%) |
Rsrvs/ NPLs (%) |
Deal Value ($M) |
Value/ Share ($) |
P/B (%) | P/TB (%) |
P/E (x) |
P/A (%) |
Prem/ Cdeps (%) |
|||||||||||||||||||||||||||||||||||||||||||||||||||||||||
| 02/02/2026 |
Pending | Columbia Financial Inc. | NJ | Northfield Bancorp, Inc. | NJ | 5,754,010 | 11.99 | 11.99 | 0.01 | 0.11 | 0.26 | NA | 596.6 | 14.250 | 86.32 | 86.32 | NM | 10.37 | NA | |||||||||||||||||||||||||||||||||||||||||||||||||||||||
| 11/24/2025 |
Pending | Fulton Financial Corp. | PA | Blue Foundry Bancorp | NJ | 2,155,792 | 14.58 | 14.58 | -0.44 | -2.80 | 0.53 | 121.49 | 242.6 | 11.674 | 77.09 | 77.11 | NA | 11.25 | NA | |||||||||||||||||||||||||||||||||||||||||||||||||||||||
| 09/24/2025 |
Pending | Mid Penn Bancorp Inc. | PA | 1st Colonial Bancorp, Inc. | NJ | 877,064 | 9.42 | 9.42 | 1.02 | 10.90 | NA | NA | 99.1 | 20.030 | 116.39 | 116.39 | 11.65 | 11.30 | 2.40 | |||||||||||||||||||||||||||||||||||||||||||||||||||||||
| 05/23/2024 |
04/29/2025 | Ion Financial MHC | CT | NVE Bancorp, MHC | NJ | NA | NA | NA | NA | NA | NA | NA | NA | NA | NA | NA | NA | NA | NA | |||||||||||||||||||||||||||||||||||||||||||||||||||||||
| 01/18/2024 |
08/23/2024 | Princeton Bancorp | NJ | Cornerstone Financial Corporation | NJ | 321,175 | 8.42 | 8.42 | 0.08 | 0.93 | 0.14 | 676.94 | 17.9 | 8.160 | 75.44 | 75.44 | 68.99 | 5.58 | -2.30 | |||||||||||||||||||||||||||||||||||||||||||||||||||||||
| 09/27/2022 |
05/15/2024 | |
Provident Financial Services |
|
NJ | Lakeland Bancorp, Inc. | NJ | 10,374,178 | 10.51 | 8.01 | 0.97 | 9.38 | 0.24 | 271.54 | 1263.1 | 19.267 | 114.51 | 154.49 | 12.43 | 12.18 | NA | |||||||||||||||||||||||||||||||||||||||||||||||||||||
| 07/25/2022 |
09/19/2023 | SR Bancorp | NJ | Regal Bancorp, Inc. | NJ | 491,935 | 11.85 | 11.66 | 0.70 | 6.36 | 0.11 | NM | 69.5 | 23.000 | 141.35 | 144.54 | 22.46 | 14.13 | 6.28 | |||||||||||||||||||||||||||||||||||||||||||||||||||||||
| 12/20/2022 |
05/19/2023 | Mid Penn Bancorp Inc. | PA | Brunswick Bancorp | NJ | 381,631 | 11.29 | 11.29 | 1.08 | 9.23 | NA | NA | 53.9 | 18.254 | 120.31 | 120.31 | 13.13 | 14.12 | 5.39 | |||||||||||||||||||||||||||||||||||||||||||||||||||||||
| Average: | 2,907,969 | 11.15 | 10.77 | 0.49 | 4.87 | 0.26 | 356.66 | 104.49 | 110.66 | 25.73 | 11.28 | 2.94 | ||||||||||||||||||||||||||||||||||||||||||||||||||||||||||||||
| Median: | 877,064 | 11.29 | 11.29 | 0.70 | 6.36 | 0.24 | 271.54 | 114.51 | 116.39 | 13.13 | 11.30 | 3.90 | ||||||||||||||||||||||||||||||||||||||||||||||||||||||||||||||
| Source: S&P Global Market Intelligence. |
|
|||||||||||||||||||||||||||||||||||||||||||||||||||||||||||||||||||||||||
EXHIBIT IV-5
Columbia Financial, Inc.
Director and Senior Management Summary Resumes
Exhibit IV-5
Columbia Financial, Inc.
Director and Senior Management Summary Resumes
Upon the closing of the acquisition of Northfield Bancorp, the boards of directors of Columbia Financial, Inc. and Columbia Bank will be increased to thirteen members and four members of the existing board of directors of Northfield Bancorp will be appointed to fill the newly created vacancies at Columbia Financial, Inc. and Columbia Bank, one of whom will be Steven M. Klein, as of immediately prior to the closing of the merger (“legacy Northfield Bancorp directors”). Prior to the closing of the conversion and merger, the Nominating/Corporate Governance Committee of Columbia Financial, Inc. will recommend to the boards of directors of Columbia Financial, Inc. and Columbia Bank the legacy Northfield Bancorp directors to be appointed to the boards of directors of Columbia Financial, Inc. and Columbia Bank and their respective terms, all of whom must meet the eligibility criteria of Columbia Financial, Inc. and Columbia Bank to serve on such boards of directors. Mr. Klein will be an executive officer of Columbia Financial, Inc. and Columbia Bank upon the closing of the acquisition and therefore the board of directors has determined that he will not be independent per the listing standards of the Nasdaq Stock Market, Inc.
Information regarding the board of directors of Columbia Financial, Inc. is provided below. Unless otherwise stated, each director has held his or her current occupation for the last five years. The age indicated for each individual is as of December 31, 2025. There are no family relationships among the directors, nominees, or executive officers. The indicated period of service as a director includes service as a director of Columbia Financial, Inc., Columbia Financial and Columbia Bank.
The following directors have terms ending in 2027:
Dennis E. Gibney – Mr. Gibney serves as the First Senior Executive Vice President, Chief Banking Officer of Columbia Financial, Inc. and Columbia Bank. Mr. Gibney was appointed as Executive Vice President and Chief Financial Officer of Columbia Financial and Columbia Bank in 2014 and was subsequently designated as Senior Executive Vice President in May 2025. Mr. Gibney was appointed to the boards of directors of Columbia Financial, Inc. and Columbia Bank in 2026. Mr. Gibney has extensive experience in financial matters, strategic planning and mergers and acquisitions all of which affords the board of directors with valuable insight regarding the business and operations of Columbia Financial, Inc. and Columbia Bank. Age 52.
Michael Massood – Mr. Massood is President of Massood & Company, P.A., CPAs, a certified public accounting firm. As a certified public accountant, Mr. Massood provides the board of directors with critical experience regarding accounting and financial matters. Mr. Massood has served on the board of directors since 2003. Mr. Massood’s extensive experience in the local banking industry and involvement in business and civic organizations in the communities Columbia Bank serves affords the board of directors valuable insight regarding the business and operation of Columbia Bank. Age 72.
Elizabeth E. Randall – Ms. Randall recently completed 14 years as the Commissioner of the Bergen County Improvement Authority and also currently serves as a member of the audit committee of the New Jersey Municipal Excess Liability Insurance Fund. From 2004 to 2006, Ms. Randall served on the Bergen County Board of Chosen Freeholders. Prior to that, Ms. Randall served as the New Jersey Commissioner of Banking and Insurance. Ms. Randall also served as a member of the board of directors of the YWCA of Northern New Jersey. Ms. Randall has served on the board of directors since 2003. Ms. Randall’s service as an elected and appointed government official, as well as her prior bank regulatory experience, provides the board of directors with invaluable insight into the needs of the local communities that Columbia Bank serves. Age 72.
Exhibit IV-5 (continued)
Columbia Financial, Inc.
Director and Senior Management Summary Resumes
The following directors have terms ending in 2028:
Noel R. Holland – Mr. Holland was a partner in the law firm of Andersen & Holland, located in Midland Park, New Jersey, from January 1976 until his retirement in 2017. Mr. Holland’s expertise as a partner in a law firm, and his real estate transactional experience and involvement in business and civic organizations in the communities Columbia Bank serves, provide the board of directors with valuable insight. Mr. Holland has served on the board of directors since 1995. Mr. Holland’s years of providing legal counsel and operating a law office position him well to continue to serve as a director of a public company. Age 75.
James M. Kuiken – Mr. Kuiken has served as the Director of Operations of Roche Molecular Systems, Inc., a company that develops, manufactures and supplies diagnostic and blood screening test products, since April 2014. Prior to that time, Mr. Kuiken served in various other capacities at Roche Molecular Systems, Inc. Mr. Kuiken has served on the board of directors since 2020. Mr. Kuiken’s extensive experience with respect to operational matters at a large multinational corporation provides the board of directors with valuable insight into the operational and business needs of Columbia Financial and Columbia Bank. Age 55.
James H. Wainwright – Mr. Wainwright was appointed to the board of directors of Columbia Bank on October 5, 2024. Mr. Wainwright is the former president and chief executive officer of Freehold Bank and served as the chief financial officer from 2010 to 2013. Mr. Wainwright has over 30 years of senior executive management, financial operations, investment and asset/liability management, and regulatory experience for leading institutions in New Jersey. He has memberships with the following organization: New Jersey Banking Association, New Jersey Community Bankers Association, Downtown Freehold Association, NJ Bankers Mutual Savings Bank, Financial Managers Society, Northern New Jersey Bankers Association, and South Jersey Bankers Association. Mr. Wainwright was appointed to the board of directors of Columbia Financial, Inc. in 2026 and has served on the board of directors of Columbia Bank since 2024. Mr. Wainwright’s experience as a former chief executive officer of a financial institution and as a board member of Columbia Bank along with his knowledge of local communities provides the board of directors with valuable insights into the operational and business of Columbia Financial, Inc. and Columbia Bank. Mr. Wainwright holds a B.A. in Accounting and Business Administration with a concentration in Management. Age 64.
The following directors have terms ending in 2029:
Thomas J. Kemly – Mr. Kemly was appointed President and Chief Executive Officer of Columbia Bank in 2012 and has served as board member since 2006. He has since led Columbia Bank on a steady growth trajectory by spearheading organic growth, Columbia Financial, Inc.’s IPO and strategic acquisitions. With over 40 years of experience, Mr. Kemly has been an active and influential figure in banking. Most recently, Mr. Kemly was elected to the Federal Home Loan Bank of New York’s board of directors and was named to the Power 100 List by NJBIZ, a statewide business publication. Mr. Kemly’s extensive experience in the local banking industry and involvement in business and civic organizations in the communities Columbia Bank serves affords the board of directors valuable insight regarding the business and operation of Columbia Bank. Mr. Kemly’s knowledge of Columbia Financial’s and Columbia Bank’s business and history, combined with his success and strategic vision, position him well to continue to serve as our President and Chief Executive Officer. Age 67.
Lucy Sorrentini – Ms. Sorrentini is a Strategy Consultant and Certified Executive Coach and the Founder and CEO of Impact Consulting, LLC, a woman and minority-owned human capital and organizational development consulting firm headquartered in New York. Prior to starting her own firm, Ms. Sorrentini was a Member of the Global Human Resources Executive Team and Chief Diversity and Inclusion Officer at Booz Allen Hamilton. Ms. Sorrentini also serves as the Chair and Strategic Advisor of the New York Women’s Foundation’s Latina Philanthropy Circle, Girls Incorporated and the Acceleration Project. Ms. Sorrentini has served on the board of directors since 2020. Ms. Sorrentini’s extensive experience with respect to human capital strategy, and human resources, provides the board of directors with valuable insight into the operational and business needs of Columbia Financial and Columbia Bank. Age 61.
Exhibit IV-5 (continued)
Columbia Financial, Inc.
Director and Senior Management Summary Resumes
Robert Van Dyk – Mr. Van Dyk is the President and Chief Executive Officer of Van Dyk Health Care, a health care services company, since 1994 and the President and Chief Executive Officer of two other hospitals since 1980. He serves on many charitable and civic organizations, including colleges, universities, hospitals, religious organizations and foundations within the communities that Columbia Bank serves. In addition, Mr. Van Dyk has been actively involved in various organizations for the past 20 years, and he served as Chairman of the Board of two separate national health care organizations. Mr. Van Dyk has served on the board of directors since 2003. Mr. Van Dyk’s strong business background, as well as his experience and expertise with respect to regulated industries, provides the board of directors with invaluable insight into the needs of the local communities that Columbia Bank serves. Age 73.
Upon the closing of the merger, Steven M. Klein, the current chairman, chief executive officer and president will be appointed as Senior Executive Vice President and Chief Operating Officer of Columbia Financial, Inc. and Columbia Bank and will be appointed to the boards of directors of Columbia Financial, Inc. and Columbia Bank in the class of directors having a term ending in [•]. Information regarding Mr. Klein’s experience is set forth below.
Steven M. Klein—Mr. Klein is a licensed Certified Public Accountant, with strong leadership and analytical skills. Mr. Klein has over 30 years of experience in banking and financial reporting, including SEC reporting. Mr. Klein has served as the chief executive officer of Northfield Bancorp and Northfield Bank since 2017. Mr. Klein was a partner at KPMG LLP, Short Hills, New Jersey, in its Community Banking Practice where he worked from 1986 until 2005. Mr. Klein earned a Bachelor of Science degree in business and accounting from Montclair State University and is a Certified Public Accountant registered in the State of New Jersey, and a member of AICPA and New Jersey Society of Certified Public Accountants. Mr. Klein’s years of experience in banking and financial reporting and his involvement in the local communities in which Columbia Bank will operate following the merger will provide the board of directors with valuable insight into the needs of our combined local communities as well as with respect to financial and accounting matters. Age 60.
Senior Executive Officers of Columbia Financial, Inc. and Columbia Bank Who Are Not Also Directors
John Klimowich – Mr. Klimowich was appointed Executive Vice President and Chief Risk Officer of Columbia Financial and Columbia Bank in 2013 and was subsequently designated as a Senior Executive Vice President in 2024. Mr. Klimowich began working for Columbia Bank in 1985 and held various positions in the accounting department. Mr. Klimowich was promoted to Senior Vice President, Controller in March 2002 and served Columbia Bank in that capacity until his appointment as Executive Vice President and Chief Risk Officer in 2013. Mr. Klimowich holds a Bachelor’s degree in Economics from William Paterson University and an MBA in Accounting from Seton Hall University. Age 62.
Oliver E. Lewis, Jr. – Mr. Lewis was appointed Executive Vice President and Head of Commercial Banking of Columbia Financial and Columbia Bank in January 2021 and was subsequently designated as a Senior Executive Vice President in June 2024. Mr. Lewis began working for Columbia Bank in 2019 and served as Senior Vice President, Commercial Banking Market Manager until his appointment as Executive Vice President and Head of Commercial Banking. In this role, Mr. Lewis is responsible for the commercial banking division consisting of Columbia Bank’s commercial & industrial, SBA, middle market, commercial real estate and construction lending activities, treasury management sales and the business development department. Prior to joining Columbia Bank, Mr. Lewis served as a Market Executive at JPMorgan Chase and Treasury Services, Regional Sales Executive. Mr. Lewis holds a Bachelor’s degree in Aviation Administration from Embry-Riddle Aeronautical University and received an MBA from Rutgers University. Age 61.
Allyson Schlesinger was appointed Executive Vice President and Head of Consumer Banking of Columbia Financial and Columbia Bank in 2018 and was subsequently designated as a Senior Executive Vice President in June 2024. In this role, Ms. Schlesinger is responsible for the retail banking, retail lending, wealth management and marketing divisions of Columbia Bank. Ms. Schlesinger was previously with Citigroup, Inc. for 25 years, most recently as its Managing Director, U.S. Retail and Division Manager for Citigroup, Inc. in the New York City and New Jersey markets. Ms. Schlesinger holds a Bachelor’s degree from the University of Michigan. Age 54.
Exhibit IV-5 (continued)
Columbia Financial, Inc.
Director and Senior Management Summary Resumes
Manesh Prabhu was appointed Executive Vice President, Chief Information Officer of Columbia Financial and Columbia Bank in October 2022. In this role, Mr. Prabhu is responsible for Columbia Bank’s information systems and digital banking. Mr. Prabhu has over 20 years of experience at leading institutions including People’s United Bank N.A. Most recently, he held the title of Chief Technology Officer where he led the IT strategy and technology transformation for People’s United. Through his nearly 20-year tenure and senior leadership roles at People’s United, Mr. Prabhu led enterprise architecture, data architecture, IT governance, business intelligence, marketing analytics, and data quality with a heavy focus on digital transformation. Mr. Prabhu holds an MBA from Thiagarajar School of Management (TSM) – Madurai Kamaraj University in India and a Bachelor of Technology in Electrical & Electronics Engineering from Rajiv Gandhi Institute of Technology (RIT)—Mahatma Gandhi University in India. Age 51.
Mayra L. Rinaldi was appointed Executive Vice President, Corporate Governance and Culture of Columbia Financial and Columbia Bank in December 2022. In this role, Mrs. Rinaldi is responsible for overseeing the Corporate Governance, Executive Administration, Community Development and Corporate Facilities departments of Columbia Financial and Columbia Bank. She is also responsible for Columbia Financial’s and Columbia Bank’s regulatory and SEC compliance requirements, ESG strategy, as well as community support initiatives consisting of Team Columbia, Community Reinvestment Act (CRA) outreach and the Columbia Bank Foundation. Mrs. Rinaldi is also responsible for providing executive oversight and monitoring of Columbia Financial’s and Columbia Bank’s culture to ensure that it remains aligned with Columbia’s Creed of Shared Values, which is designed to ensure that all policies, products, and services, and actions throughout Columbia Financial and Bank allow team members to always act in the best interests of customers, coworkers, communities and stockholders. Mrs. Rinaldi has over 20 years of experience at Columbia Bank, having joined Columbia Bank in 2000 and serving in various roles since that time. Most recently, Mrs. Rinaldi has served as Columbia Bank’s Senior Vice President, Corporate Governance since 2014. Mrs. Rinaldi holds a Bachelor of Science degree in Finance from Kean University and is a graduate of the Stonier School of Banking. Age 42.
Thomas Splaine, Jr. was appointed Executive Vice President and Chief Financial Officer of Columbia Financial and Columbia Bank in January 2026 and, prior to that time, had served as First Senior Vice President and Chief Accounting Officer of Columbia Financial and Columbia Bank since February 2025. Mr. Splaine has over 35 years of experience in banking, finance and accounting, mergers and acquisitions, investor and regulatory relations, and strategic planning. Before joining Columbia Financial and Columbia Bank, Mr. Splaine previously served as Executive Vice President and Chief Financial Officer of Lakeland Bancorp, Inc. and Lakeland Bank and, before that, served as Senior Vice President and Chief Financial Officer of Investors Bancorp and Investors Bank. Prior to that, Mr. Splaine was a Senior Audit Manager at KPMG. Mr. Splaine holds a Master of Business Administration and a Bachelor of Science in Accounting from Rider University. Age 60.
Source: Columbia Financial’s prospectus.
EXHIBIT IV-6
Columbia Financial, Inc.
Pro Forma Regulatory Capital Ratios
Exhibit IV- 6
Columbia Financial, Inc.
Pro Forma Regulatory Capital Ratios
| Pro forma (giving effect to the offering and acquisition) at December 31, 2025 | ||||||||||||||||||||||||||||||||||||||||
| (Dollars in thousands) | Columbia Bank | Adjusted Minimum of Offering Range 142,375,000 Shares at $10.00 per share(2) |
Minimum of Offering Range 142,375,000 Shares at $10.00 per share(2) |
Midpoint of Offering Range 167,500,000 Shares at $10.00 per share(2) |
Maximum of Offering Range 192,625,000 Shares at $10.00 per share(2) |
|||||||||||||||||||||||||||||||||||
| Amount | Percent of Assets(1) |
Amount | Percent of Assets(2) |
Amount | Percent of Assets(2) |
Amount | Percent of Assets(2) |
Amount | Percent of Assets(2) |
|||||||||||||||||||||||||||||||
| Capital under generally accepted accounting principals |
$ | 1,102,652 | 10.01 | % | $ | 2,162,626 | 11.96 | % | $ | 2,373,361 | 12.97 | % | $ | 2,490,293 | 13.52 | % | $ | 2,620,287 | 14.12 | % | ||||||||||||||||||||
| Common equity Tier 1 risk- based capital |
$ | 1,058,518 | 13.20 | % | $ | 2,065,008 | 16.53 | % | $ | 2,275,743 | 18.15 | % | $ | 2,392,675 | 19.05 | % | $ | 2,508,622 | 19.91 | % | ||||||||||||||||||||
| Common equity Tier 1 risk- based requirement |
521,247 | 6.50 | 812,201 | 6.50 | 814,941 | 6.50 | 816,559 | 6.50 | 818,899 | 6.50 | ||||||||||||||||||||||||||||||
|
|
|
|
|
|
|
|
|
|
|
|
|
|
|
|
|
|
|
|
|
|||||||||||||||||||||
| Excess |
$ | 537,271 | 6.70 | % | $ | 1,252,807 | 10.03 | % | $ | 1,460,802 | 11.65 | % | $ | 1,576,116 | 12.55 | % | $ | 1,689,723 | 13.41 | % | ||||||||||||||||||||
|
|
|
|
|
|
|
|
|
|
|
|
|
|
|
|
|
|
|
|
|
|||||||||||||||||||||
| Tier 1 risk-based capital |
$ | 1,058,518 | 13.20 | % | $ | 2,065,008 | 16.53 | % | $ | 2,275,743 | 18.15 | % | $ | 2,392,675 | 19.05 | % | $ | 2,508,622 | 19.91 | % | ||||||||||||||||||||
| Tier 1 risk-based requirement |
641,534 | 8.00 | 999,632 | 8.00 | 1,003,004 | 8.00 | 1,004,995 | 8.00 | 1,007,876 | 8.00 | ||||||||||||||||||||||||||||||
|
|
|
|
|
|
|
|
|
|
|
|
|
|
|
|
|
|
|
|
|
|||||||||||||||||||||
| Excess |
$ | 416,984 | 5.20 | % | $ | 1,065,376 | 8.53 | % | $ | 1,272,739 | 10.15 | % | $ | 1,387,680 | 11.05 | % | $ | 1,500,747 | 11.91 | % | ||||||||||||||||||||
|
|
|
|
|
|
|
|
|
|
|
|
|
|
|
|
|
|
|
|
|
|||||||||||||||||||||
| Total risk-based capital |
$ | 1,129,573 | 14.09 | % | $ | 2,136,063 | 17.09 | % | $ | 2,346,798 | 18.72 | % | $ | 2,463,730 | 19.61 | % | $ | 2,579,677 | 20.48 | % | ||||||||||||||||||||
| Total risk-based requirement |
801,918 | 10.00 | 1,249,540 | 10.00 | 1,253,755 | 10.00 | 1,256,244 | 10.00 | 1,259,844 | 10.00 | ||||||||||||||||||||||||||||||
|
|
|
|
|
|
|
|
|
|
|
|
|
|
|
|
|
|
|
|
|
|||||||||||||||||||||
| Excess |
$ | 327,655 | 4.09 | % | $ | 886,523 | 7.09 | % | $ | 1,093,043 | 8.72 | % | $ | 1,207,486 | 9.61 | % | $ | 1,319,833 | 10.48 | % | ||||||||||||||||||||
|
|
|
|
|
|
|
|
|
|
|
|
|
|
|
|
|
|
|
|
|
|||||||||||||||||||||
| Tier 1 leverage capital |
$ | 1,058,518 | 9.67 | % | $ | 2,065,008 | 12.18 | % | $ | 2,275,743 | 13.26 | % | $ | 2,392,675 | 13.84 | % | $ | 2,508,622 | 14.41 | % | ||||||||||||||||||||
| Tier 1 leverage capital requirement |
547,536 | 5.00 | 847,364 | 5.00 | 857,901 | 5.00 | 864,124 | 5.00 | 870,299 | 5.00 | ||||||||||||||||||||||||||||||
|
|
|
|
|
|
|
|
|
|
|
|
|
|
|
|
|
|
|
|
|
|||||||||||||||||||||
| Excess |
$ | 510,982 | 4.67 | % | $ | 1,217,644 | 7.18 | % | $ | 1,417,842 | 8.26 | % | $ | 1,528,551 | 8.84 | % | $ | 1,638,324 | 9.41 | % | ||||||||||||||||||||
|
|
|
|
|
|
|
|
|
|
|
|
|
|
|
|
|
|
|
|
|
|||||||||||||||||||||
Source: Columbia Financial’s prospectus.
EXHIBIT IV-7
Columbia Financial, Inc.
Pro Forma Analysis Sheet
| EXHIBIT IV-7 PRO FORMA ANALYSIS SHEET Columbia Financial, Inc. Prices as of February 2, 2026 | ||||||||||||||||||||||
| Subject | Peer Group |
New Jersey | All Public | |||||||||||||||||||
| Valuation Midpoint |
Symbol | at Midpoint | Mean | Median | Mean | Median | Mean | Median | ||||||||||||||
| Price-earnings multiple |
= | P/E | 28.58x | 12.85x | 12.73x | 14.31x | 13.17x | 13.46x | 12.69x | |||||||||||||
| Price-core earnings multiple |
= | P/CE | 22.06x | 12.81x | 12.28x | 14.31x | 12.47x | 12.90x | 12.01x | |||||||||||||
| Price-book ratio |
= | P/B | 87.03% | 107.09% | 107.53% | 91.52% | 93.73% | 124.42% | 116.43% | |||||||||||||
| Price-tangible book ratio |
= | P/TB | 92.76% | 136.39% | 132.17% | 106.21% | 100.07% | 149.05% | 140.49% | |||||||||||||
| Price-assets ratio |
= | P/A | 15.02% | 12.04% | 11.67% | 10.26% | 10.75% | 13.88% | 12.89% | |||||||||||||
| Valuation Parameters |
||||||||||||||||||||
| Pre-Conversion Earnings (Y) (1)(2) |
$ | 62,886,000 | (12 Mths 12/25 | ) | ESOP Stock (% of Offering + Merger Shares Applied to Offering) (E) | 3.00 | % | |||||||||||||
| Pre-Conversion Core Earnings (YC) (1) |
$ | 90,895,000 | (120 Mths 12/25 | ) | Cost of ESOP Borrowings (S) | 0.00 | % | |||||||||||||
| Pre-Conversion Book Value (B) (1) |
$ | 1,567,325,000 | ESOP Amortization (T) | 25.00 | Years | |||||||||||||||
| Pre-Conv. Tang. Book Value (B) (1) |
$ | 1,376,399,000 | Stock Program (% of Offering + Merger Shares Applied to Offering (M) | 2.45 | % | |||||||||||||||
| Pre-Conversion Assets (A) (1) |
$ | 16,488,131,000 | Stock Programs Vesting (N) | 7.00 | Years | |||||||||||||||
| Reinvestment Rate (R) |
3.73 | % | Fixed Expenses | $ | 10,000,000 | |||||||||||||||
| Tax rate (TAX) |
27.00 | % | Variable Expenses (Blended Commission %) | 1.67 | % | |||||||||||||||
| After Tax Reinvest. Rate (R) |
2.72 | % | Percentage Sold (PCT) | 73.1036 | % | |||||||||||||||
| Est. Conversion Expenses (X) (2) |
2.31 | % | MHC Assets | $ | 0 | |||||||||||||||
| Insider Purchases |
$ | 2,500,000 | Options as (% of Offering + Merger Shares Applied to Offering) (O1) | 6.20 | % | |||||||||||||||
| Price/Share |
$ | 10.00 | Estimated Option Value (O2) | 32.00 | % | |||||||||||||||
| Foundation Cash Contribution (FC) |
$ | — | Option Vesting Period (O3) | 7.00 | Years | |||||||||||||||
| Foundation Stock Contribution (FS) |
$ | — | % of Options taxable (O4) | 25.00 | % | |||||||||||||||
| Foundation Tax Benefit (FT) |
$ | — |
| Calculation of Pro Forma Value After Conversion | ||||||||||||
| 1. V= | P/E * (Y - FC * R) | V= | $ | 2,709,270,170 | ||||||||
| 1 - P/E * PCT * ((1-X-E-M-FS)*R - (1-TAX)*(E/T) - (1-TAX)*(M/N)-(1-TAX*O4)*(O1*O2/O3))) | ||||||||||||
| 2. V= | P/Core E * (YC) | V= | $ | 2,709,270,170 | ||||||||
| 1 - P/Core E * PCT * ((1-X-E-M-FS)*R - (1-TAX)*(E/T) - (1-TAX)*(M/N)-(1-TAX*O4)*(O1*O2/O3))) | ||||||||||||
| 3. V= | P/B * (B-FC+FT) | V= | $ | 2,709,270,170 | ||||||||
| 1 - P/B * PCT * (1-X-E-M) | ||||||||||||
| 4. V= | P/TB * (B-FC+FT) | V= | $ | 2,709,270,170 | ||||||||
| 1 - P/TB * PCT * (1-X-E-M) | ||||||||||||
| 5. V= | P/A * (A-FC+FT) | V= | $ | 2,709,270,170 | ||||||||
| 1 - P/A * PCT * (1-X-E-M) | ||||||||||||
| Shares | ||||||||||||||||||||||||||||||||||||
| Conclusion |
2nd Step Offering Shares |
2nd Step Exchange Shares |
Full Conversion Shares |
Merger Shares Issued To Target |
Merger Shares Applied to Offering |
Total Market Capitalization Shares |
Exchange Ratio |
Merger Shares Pct. Of Total |
||||||||||||||||||||||||||||
| Maximum |
192,625,000 | 70,870,908 | 263,495,908 | 42,973,477 | 0 | 306,469,385 | 2.5340 | 14.02 | % | |||||||||||||||||||||||||||
| Midpoint |
167,500,000 | 61,626,877 | 229,126,877 | 41,800,140 | 0 | 270,927,017 | 2.2035 | 15.43 | % | |||||||||||||||||||||||||||
| Minimum |
142,375,000 | 52,382,845 | 194,757,845 | 41,800,140 | 0 | 236,557,985 | 1.8729 | 17.67 | % | |||||||||||||||||||||||||||
| Adusted Minimum(4) |
100,574,860 | 52,382,845 | 194,757,845 | 0 | 41,800,140 | 194,757,845 | 1.8729 | 21.46 | % | |||||||||||||||||||||||||||
| Market Value | ||||||||||||||||||||||||||||
| Conclusion |
2nd Step Offering Value | 2nd Step Exchange Shares Value |
Full Conversion Value |
Merger Shares Value |
Merger Shares Applied to Offering |
Total Market Capitalization Value |
||||||||||||||||||||||
| Maximum |
$1,926,250,000 | $ | 708,709,080 | $ | 2,634,959,080 | $ | 429,734,770 | 0 | $ | 3,064,693,850 | ||||||||||||||||||
| Midpoint |
$1,675,000,000 | $ | 616,268,770 | $ | 2,291,268,770 | $ | 418,001,400 | 0 | $ | 2,709,270,170 | ||||||||||||||||||
| Minimum |
$1,423,750,000 | $ | 523,828,450 | $ | 1,947,578,450 | $ | 418,001,400 | 0 | $ | 2,365,579,850 | ||||||||||||||||||
| Adjusted Minimum(4) |
$1,005,748,600 | $ | 523,828,450 | $ | 1,947,578,450 | $ | 0 | 418,001,400 | $ | 1,947,578,450 | ||||||||||||||||||
| (1) Historical Columbia Financial and Northfield Bancorp combined, including merger adjustments and $5.651 million after-tax impact of funding the merger. (2) Estimated offering expenses at midpoint of the offering. (4) If Columbia Financial does not receive orders for 142,375,000 shares ini the subscription and community offerings, up to 41,800,140 of the unsubscribed shares may be applied to the acquisition of Northfied Bancorp. At the adusted minimum, it is assumed that 41,800,140 of the unsubscribed sharese are applied to the merger of Northfield Bancorp and 100,574,860 shares are sold for cash. |
EXHIBIT IV-8
Columbia Financial, Inc.
Pro Forma Effect of Conversion Proceeds
Exhibit IV-8
PRO FORMA EFFECT OF CONVERSION PROCEEDS
Columbia Financial, Inc.
At the Minimum of the Range 1.
| 1. Fully Converted Value and Exchange Ratio |
||||||||
| Fully Converted Value |
$ | 2,365,579,850 | ||||||
| Exchange Ratio |
1.87295 | |||||||
| 2nd Step Offering Proceeds |
$ | 1,423,750,000 | ||||||
| Less: Estimated Offering Expenses |
36,311,000 | |||||||
|
|
|
|||||||
| 2nd Step Net Conversion Proceeds |
$ | 1,387,439,000 |
|
2. Estimated Additional Income from Conversion Proceeds |
||||
| Net Conversion Proceeds |
$ | 1,387,439,000 | ||
| Less: Cash Contribution to Foundation |
0 | |||
| Less: ESOP Stock Purchases (1) |
(42,712,500 | ) | ||
| Less: RRP Stock Purchases (2) |
(34,881,875 | ) | ||
|
|
|
|||
| Net Cash Proceeds |
$ | 1,309,844,625 | ||
| Estimated after-tax net incremental rate of return |
2.72 | % | ||
|
|
|
|||
| Earnings Increase |
$ | 35,665,759 | ||
| Less: Consolidated interest cost of ESOP borrowings |
0 | |||
| Less: Amortization of ESOP borrowings(3) |
(1,247,205 | ) | ||
| Less: RRP Vesting (3) |
(3,637,681 | ) | ||
| Less: Option Plan Vesting (4) |
(3,762,931 | ) | ||
|
|
|
|||
| Net Earnings Increase |
$ | 27,017,942 |
| 3. Pro Forma Earnings | Before Conversion(5) |
Net Earnings Increase |
After Conversion |
|||||||||
| 12 Months ended December 31, 2025 (reported) |
$ | 62,886,000 | $ | 27,017,942 | $ | 89,903,942 | ||||||
| 12 Months ended December 31, 2025 (core) |
$ | 90,895,000 | $ | 27,017,942 | $ | 117,912,942 | ||||||
| 4. Pro Forma Net Worth | Before Conversion(5) |
Net Cash Proceeds | Tax Benefit and Other |
After Conversion |
||||||||||||
| December 31, 2025 |
$ | 1,562,442,000 | $ | 1,778,199,750 | $ | 0 | $ | 3,340,641,750 | ||||||||
| December 31, 2025 (Tangible) |
$ | 1,371,516,000 | $ | 1,778,199,750 | $ | 0 | $ | 3,149,715,750 | ||||||||
| 5. Pro Forma Assets | Before Conversion(5) |
Net Cash Proceeds |
Tax Benefit and Other |
After Conversion |
||||||||||||
| December 31, 2025 |
$ | 16,488,131,000 | $ | 1,309,844,625 | $ | 0 | $ | 17,797,975,625 | ||||||||
| (1) | Includes ESOP purchases of 4.0% of the second step offering. |
| (2) | Includes RRP purchases of 2.45% of the second step offering. |
| (3) | ESOP amortized over 20 years, RRP amortized over 7 years, tax effected at: 27.00% |
| (4) | Option valuation based on Black-Scholes model, 7 year vesting, and assuming 25% of the options are taxable. |
| (5) | Adjusted to reflect consolidation and reinvestment of net MHC assets. |
Exhibit IV-8
PRO FORMA EFFECT OF CONVERSION PROCEEDS
Columbia Financial, Inc.
At the Midpoint of the Range
| 1. Fully Converted Value and Exchange Ratio |
||||
| Fully Converted Value |
$ | 2,709,270,170 | ||
| Exchange Ratio |
2.20347 | |||
| 2nd Step Offering Proceeds |
$ | 1,675,000,000 | ||
| Less: Estimated Offering Expenses |
38,622,500 | |||
|
|
|
|||
| 2nd Step Net Conversion Proceeds |
$ | 1,636,377,500 | ||
| 2. Estimated Additional Income from Conversion Proceeds |
||||
| Net Conversion Proceeds |
$ | 1,636,377,500 | ||
| Less: Cash Contribution to Foundation |
0 | |||
| Less: ESOP Stock Purchases (1) |
(50,250,000 | ) | ||
| Less: RRP Stock Purchases (2) |
(41,037,500 | ) | ||
|
|
|
|||
| Net Cash Proceeds |
$ | 1,545,090,000 | ||
| Estimated after-tax net incremental rate of return |
2.72 | % | ||
|
|
|
|||
| Earnings Increase |
$ | 42,071,256 | ||
| Less: Consolidated interest cost of ESOP borrowings |
0 | |||
| Less: Amortization of ESOP borrowings(3) |
(1,467,300 | ) | ||
| Less: RRP Vesting (3) |
(4,279,625 | ) | ||
| Less: Option Plan Vesting (4) |
(4,426,977 | ) | ||
|
|
|
|||
| Net Earnings Increase |
$ | 31,897,353 | ||
| 3. Pro Forma Earnings | Before Conversion(5) |
Net Earnings Increase |
After Conversion |
|||||||||
| 12 Months ended December 31, 2025 (reported) |
$ | 62,886,000 | $ | 31,897,353 | $ | 94,783,353 | ||||||
| 12 Months ended December 31, 2025 (core) |
$ | 90,895,000 | $ | 31,897,353 | $ | 122,792,353 | ||||||
| 4. Pro Forma Net Worth | Before Conversion (5) |
Net Cash Proceeds | Tax Benefit of Foundation |
After Conversion |
||||||||||||
| December 31, 2025 |
$ | 1,567,325,000 | $ | 1,545,090,000 | $ | 0 | $ | 3,112,415,000 | ||||||||
| December 31, 2025 (Tangible) |
$ | 1,376,399,000 | $ | 1,545,090,000 | $ | 0 | $ | 2,921,489,000 | ||||||||
| 5. Pro Forma Assets | Before Conversion (5) |
Net Cash Proceeds | Tax Benefit of Foundation |
After Conversion |
||||||||||||
| December 31, 2025 |
$ | 16,488,131,000 | $ | 1,545,090,000 | $ | 0 | $ | 18,033,221,000 | ||||||||
| (1) | Includes ESOP purchases of 4.0% of the second step offering. |
| (2) | Includes RRP purchases of 2.45% of the second step offering. |
| (3) | ESOP amortized over 20 years, RRP amortized over 7 years, tax effected at: 27.00% |
| (4) | Option valuation based on Black-Scholes model, 7 year vesting, and assuming 25% of the options are taxable. |
| (5) | Adjusted to reflect consolidation and reinvestment of net MHC assets. |
| Exhibit IV-8 | ||||
| PRO FORMA EFFECT OF CONVERSION PROCEEDS | ||||
| Columbia Financial, Inc. At the Maximum of the Range
| ||||
| 1. | Fully Converted Value and Exchange Ratio | |||||
| Fully Converted Value | $ | 3,064,693,850 | ||||
| Exchange Ratio | 2.53399 | |||||
| 2nd Step Offering Proceeds | $ | 1,926,250,000 | ||||
| Less: Estimated Offering Expenses | 43,069,625 | |||||
|
|
|
|||||
| 2nd Step Net Conversion Proceeds | $ | 1,883,180,375 | ||||
| 2. | Estimated Additional Income from Conversion Proceeds | |||||
| Net Conversion Proceeds |
$ | 1,883,180,375 | ||||
| Less: Cash Contribution to Foundation |
0 | |||||
| Less: ESOP Stock Purchases (1) |
(57,787,500 | ) | ||||
| Less: RRP Stock Purchases (2) |
(47,193,125 | ) | ||||
|
|
|
|||||
| Net Cash Proceeds | $ | 1,778,199,750 | ||||
| Estimated after-tax net incremental rate of return | 2.72 | % | ||||
|
|
|
|||||
| Earnings Increase | $ | 48,418,601 | ||||
| Less: Consolidated interest cost of ESOP borrowings |
0 | |||||
| Less: Amortization of ESOP borrowings(3) |
(1,687,395 | ) | ||||
| Less: RRP Vesting (3) |
(4,921,569 | ) | ||||
| Less: Option Plan Vesting (4) |
(5,091,024 | ) | ||||
|
|
|
|||||
| Net Earnings Increase | $ | 36,718,614 | ||||
| Net | ||||||||||||||||||
| Before | Earnings | After | ||||||||||||||||
| 3. | Pro Forma Earnings | Conversion(5) | Increase | Conversion | ||||||||||||||
| 12 Months ended December 31, 2025 (reported) |
|
$ | 62,749,000 | $ | 36,718,614 | $ | 99,467,614 | |||||||||||
| 12 Months ended December 31, 2025 (core) |
|
$ | 90,758,000 | $ | 36,718,614 | $ | 127,476,614 | |||||||||||
| 4. | Pro Forma Net Worth | Before Conversion (5) |
Net Cash Proceeds | Tax Benefit of Foundation |
After Conversion | |||||||||||||
| December 31, 2025 | $ | 1,576,489,000 | $ | 1,778,199,750 | $ | 0 | $ | 3,354,688,750 | ||||||||||
| December 31, 2025 (Tangible) | $ | 1,371,516,000 | $ | 1,778,199,750 | $ | 0 | $ | 3,149,715,750 | ||||||||||
| 5. | Pro Forma Assets | Before Conversion (5) |
Net Cash Proceeds | Tax Benefit of Foundation |
After Conversion | |||||||||||||
| December 31, 2025 | $ | 16,496,777,000 | $ | 1,778,199,750 | $ | 0 | $ | 18,274,976,750 | ||||||||||
| (1) Includes ESOP purchases of 4.0% of the second step offering. |
||||
| (2) Includes RRP purchases of 2.45% of the second step offering. |
||||
| (3) ESOP amortized over 20 years, RRP amortized over 7 years, tax effected at: |
27.00 | % | ||
| (4) Option valuation based on Black-Scholes model, 7 year vesting, and assuming 25% of the options are taxable. |
| |||
| (5) Adjusted to reflect consolidation and reinvestment of net MHC assets. |
||||
| Exhibit IV-8 | ||||||||||
| PRO FORMA EFFECT OF CONVERSION PROCEEDS | ||||||||||
| Columbia Financial, Inc. At the Adjusted Minimum of the Range | ||||||||||
| 1. | Fully Converted Value and Exchange Ratio | |||||
| Fully Converted Value |
$ | 1,947,578,450 | ||||
| Exchange Ratio |
1.87295 | |||||
| 2nd Step Offering Proceeds |
$ | 1,005,748,600 | ||||
| Less: Estimated Offering Expenses |
39,779,139 | |||||
|
|
|
|||||
| 2nd Step Net Conversion Proceeds | $ | 965,969,461 | ||||
| 2. | Estimated Additional Income from Conversion Proceeds | |||||
| Net Conversion Proceeds |
$ | 965,969,461 | ||||
| Less: Cash Contribution to Foundation |
0 | |||||
| Less: ESOP Stock Purchases (1) |
(42,712,500 | ) | ||||
| Less: RRP Stock Purchases (2) |
(34,881,875 | ) | ||||
|
|
|
|||||
| Net Cash Proceeds | $ | 888,375,086 | ||||
| Estimated after-tax net incremental rate of return | 2.72 | % | ||||
|
|
|
|||||
| Earnings Increase | $ | 24,189,565 | ||||
| Less: Consolidated interest cost of ESOP borrowings |
0 | |||||
| Less: Amortization of ESOP borrowings(3) |
(1,247,205 | ) | ||||
| Less: RRP Vesting (3) |
(3,637,681 | ) | ||||
| Less: Option Plan Vesting (4) |
(3,762,931 | ) | ||||
|
|
|
|||||
| Net Earnings Increase | $ | 15,541,748 | ||||
| Net | ||||||||||||||||||
| Before | Earnings | After | ||||||||||||||||
| 3. | Pro Forma Earnings | Conversion(5) | Increase | Conversion | ||||||||||||||
| 12 Months ended December 31, 2025 (reported) |
|
$ | 62,886,000 | $ | 15,541,748 | $ | 78,427,748 | |||||||||||
| 12 Months ended December 31, 2025 (core) |
|
$ | 90,895,000 | $ | 15,541,748 | $ | 106,436,748 | |||||||||||
| 4. | Pro Forma Net Worth | Before Conversion(5) |
Net Cash Proceeds |
Tax Benefit and Other |
After Conversion |
|||||||||||||
| December 31, 2025 | $ | 1,567,325,000 | $ | 888,375,086 | $ | 0 | $ | 2,455,700,086 | ||||||||||
| December 31, 2025 (Tangible) | $ | 1,376,399,000 | $ | 888,375,086 | $ | 0 | $ | 2,264,774,086 | ||||||||||
| 5. | Pro Forma Assets | Before Conversion(5) |
Net Cash Proceeds |
Tax Benefit and Other |
After Conversion |
|||||||||||||
| December 31, 2025 | $ | 16,488,131,000 | $ | 888,375,086 | $ | 0 | $ | 17,376,506,086 | ||||||||||
| (1) Includes ESOP purchases of 4.0% of the second step offering. |
||||
| (2) Includes RRP purchases of 2.45% of the second step offering. |
||||
| (3) ESOP amortized over 20 years, RRP amortized over 7 years, tax effected at: |
27.00 | % | ||
| (4) Option valuation based on Black-Scholes model, 7 year vesting, and assuming 25% of the options are taxable. |
| |||
| (5) Adjusted to reflect consolidation and reinvestment of net MHC assets. |
||||
EXHIBIT V-1
RP® Financial, LC.
Firm Qualifications Statement

FIRM QUALIFICATION STATEMENT
RP® Financial (“RP®) provides financial and management consulting, merger advisory and valuation services to the financial services industry nationwide. We offer a broad array of services, high quality and prompt service, hands-on involvement by principals and senior staff, careful structuring of strategic initiatives and sophisticated valuation and other analyses consistent with industry practices and regulatory requirements. Our staff maintains extensive background in financial and management consulting, valuation and investment banking. Our clients include commercial banks, thrifts, credit unions, mortgage companies, insurance companies and other financial services companies.
STRATEGIC PLANNING SERVICES
RP®’s strategic planning services are designed to provide effective feasible plans with quantifiable results. We analyze strategic options to enhance shareholder value, achieve regulatory approval or realize other objectives. Such services involve conducting situation analyses; establishing mission/vision statements, developing strategic goals and objectives; and identifying strategies to enhance franchise and/or market value, capital management, earnings enhancement, operational matters and organizational issues. Strategic recommendations typically focus on: capital formation and management, asset/liability targets, profitability, return on equity and stock pricing. Our proprietary financial simulation models provide the basis for evaluating the impact of various strategies and assessing their feasibility and compatibility with regulations.
MERGER ADVISORY SERVICES
RP®’s merger advisory services include targeting potential buyers and sellers, assessing acquisition merit, conducting due diligence, negotiating and structuring merger transactions, preparing merger business plans and financial simulations, rendering fairness opinions, preparing mark-to-market analyses, valuing intangible assets and supporting the implementation of post-acquisition strategies. Our merger advisory services involve transactions of financially healthy companies and failed bank deals. RP® is also expert in de novo charters and shelf charters. Through financial simulations, comprehensive data bases, valuation proficiency and regulatory familiarity, RP®’s merger advisory services center on enhancing shareholder returns.
VALUATION SERVICES
RP®’s extensive valuation practice includes bank and thrift mergers, thrift mutual-to-stock conversions, goodwill impairment, insurance company demutualizations, ESOPs, subsidiary companies, merger accounting and other purposes. We are highly experienced in performing appraisals which conform to regulatory guidelines and appraisal standards. RP® is the nation’s leading valuation firm for thrift mutual-to-stock conversions, with appraised values ranging up to $4 billion.
OTHER CONSULTING SERVICES
RP® offers other consulting services including evaluating the impact of regulatory changes (TARP, etc.), branching and diversification strategies, feasibility studies and special research. We assist banks/thrifts in preparing CRA plans and evaluating wealth management activities on a de novo or merger basis. Our other consulting services are facilitated by proprietary valuation and financial simulation models.
KEY PERSONNEL (Years of Relevant Experience & Contact Information)
| Ronald S. Riggins, Managing Director (45) | (703) 647-6543 | rriggins@rpfinancial.com | ||||||||||
| William E. Pommerening, Managing Director (41) | (703) 647-6546 | wpommerening@rpfinancial.com | ||||||||||
| Gregory E. Dunn, Director (42) | (703) 647-6548 | gdunn@rpfinancial.com | ||||||||||
| James P. Hennessey, Director (38) | (703) 647-6544 | jhennessey@rpfinancial.com | ||||||||||
| James J. Oren, Director (38) | (703) 647-6549 | joren@rpfinancial.com |
| Washington Headquarters | ||||
| 1311-A Dolley Madison Boulevard | Telephone: (703) 528-1700 | |||
| Suite 2A | Fax No.: (703) 528-1788 | |||
| McLean, VA 22101 | Toll-Free No.: (866) 723-0594 | |||
| www.rpfinancial.com | E-Mail: mail@rpfinancial.com |