Shareholder Report
|
12 Months Ended |
|
Dec. 31, 2025
USD ($)
Holding
|
|---|
| Shareholder Report [Line Items] |
|
| Document Type |
N-CSR
|
| Amendment Flag |
false
|
| Registrant Name |
Advisors' Inner Circle Fund III
|
| Entity Central Index Key |
0001593547
|
| Entity Investment Company Type |
N-1A
|
| Document Period End Date |
Dec. 31, 2025
|
| C000226875 |
|
| Shareholder Report [Line Items] |
|
| Fund Name |
ARGA Emerging Markets Value Fund
|
| Class Name |
Institutional Class
|
| Trading Symbol |
ARMIX
|
| Annual or Semi-Annual Statement [Text Block] |
Annual Shareholder Report
|
| Additional Information [Text Block] |
This annual shareholder report contains important information about Institutional Class Shares of the ARGA Emerging Markets Value Fund (the "Fund") for the period from January 1, 2025 to December 31, 2025. You can find additional information about the Fund at https://www.argainvest.com/arga-emerging-markets-value-fund/. You can also request this information by contacting us at 866-234-ARGA (866-234-2742).
|
| Additional Information Phone Number |
866-234-ARGA (866-234-2742)
|
| Additional Information Website |
https://www.argainvest.com/arga-emerging-markets-value-fund/
|
| Expenses [Text Block] |
What were the Fund costs for the last year?(based on a hypothetical $10,000 investment) Fund Name | Costs of a $10,000 investment | Costs paid as a percentage of a $10,000 investment |
|---|
ARGA Emerging Markets Value Fund, Institutional Class Shares | $101 | 0.82% |
|---|
|
| Expenses Paid, Amount |
$ 101
|
| Expense Ratio, Percent |
0.82%
|
| Factors Affecting Performance [Text Block] |
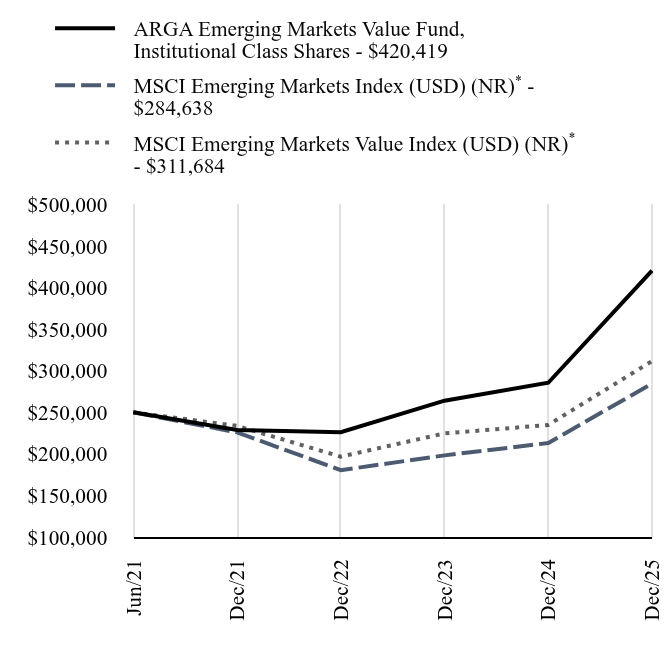
How did the Fund perform in the last year?The Fund outperformed the MSCI Emerging Markets Index (USD) (NR) in 2025. The Fund was up 47.21%, compared to a 33.57% rise in the MSCI Emerging Markets Index (USD) (NR) and a 32.74% increase in the MSCI Emerging Markets Value Index (USD) (NR). Key market drivers included a tech rally, AI optimism, strong earnings, eased tariff concerns and a weaker US dollar, partially offset by geopolitical uncertainty. The Fund’s outperformance reflected strong recoveries in the valuations of many Fund holdings. Per ARGA’s rigorous valuation approach, the Fund objective is to own deeply undervalued stocks with long-term upside. ARGA’s value style is based on the core belief that investment opportunity results from investor overreaction to company or macro stress, which creates price anomalies that value investors can exploit. As conditions normalize over time, stocks typically recover, as many did in 2025. Strong Fund performance was broad, with nine of eleven sectors and almost all regions positively contributing to results. Largest sector contributors were Financial Services and Technology. On a company basis, Brazilian banks appreciated on strong operating results due to stabilizing inflation and improving rate outlook. Korean financials benefitted from favorable rates and macro tailwinds. Semiconductor and other Technology holdings rose on rising AI data center demand and higher chip prices amid supply shortages. Valuation spreads in emerging markets remain wide, indicating future opportunity. Current price-to-book spreads between cheapest and most expensive quintiles well exceed historical averages. Historically, high spreads have signaled subsequent value outperformance. ARGA research confirms a wide variety of value opportunities across sectors and geographies, where temporary stress has depressed valuations particularly in select Financial Services, Materials and Chinese Consumer Discretionary companies. We believe these and other opportunities position the Fund well for long-term returns. |
| Performance Past Does Not Indicate Future [Text] |
Past performance is not indicative of future performance.
|
| Line Graph [Table Text Block] |
| ARGA Emerging Markets Value Fund, Institutional Class Shares | MSCI Emerging Markets Index (USD) (NR)Footnote Reference* | MSCI Emerging Markets Value Index (USD) (NR)Footnote Reference* |
|---|
Jun/21 | $250,000 | $250,000 | $250,000 |
|---|
Dec/21 | $228,865 | $225,873 | $233,718 |
|---|
Dec/22 | $226,136 | $180,492 | $196,723 |
|---|
Dec/23 | $263,995 | $198,231 | $224,683 |
|---|
Dec/24 | $285,592 | $213,106 | $234,807 |
|---|
Dec/25 | $420,419 | $284,638 | $311,684 |
|---|
|
| Average Annual Return [Table Text Block] |
Fund/Index Name | 1 Year | Annualized
Since
Inception |
|---|
ARGA Emerging Markets Value Fund, Institutional Class Shares | 47.21% | 12.02% |
|---|
MSCI Emerging Markets Index (USD) (NR)Footnote Reference* | 33.57% | 2.87% |
|---|
MSCI Emerging Markets Value Index (USD) (NR)Footnote Reference* | 32.74% | 4.93% |
|---|
|
| No Deduction of Taxes [Text Block] |
The table and graph presented do not reflect the deduction of taxes a shareholder would pay on Fund distributions or the redemption of Fund shares.
|
| AssetsNet |
$ 1,547,752,439
|
| Holdings Count | Holding |
65
|
| Advisory Fees Paid, Amount |
$ 8,297,127
|
| InvestmentCompanyPortfolioTurnover |
33.00%
|
| Additional Fund Statistics [Text Block] |
Key Fund Statistics as of December 31, 2025 | Total Net Assets | Number of Holdings | Total Advisory Fees Paid | Portfolio Turnover Rate |
|---|
| $1,547,752,439 | 65 | $8,297,127 | 33% |
|---|
|
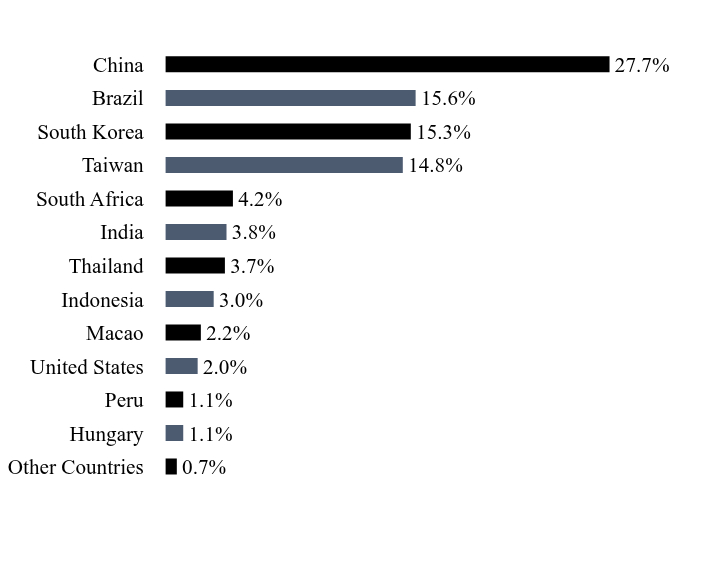
| Holdings [Text Block] |
Country WeightingsFootnote Reference*Value | Value |
|---|
Other Countries | 0.7% | Hungary | 1.1% | Peru | 1.1% | United States | 2.0% | Macao | 2.2% | Indonesia | 3.0% | Thailand | 3.7% | India | 3.8% | South Africa | 4.2% | Taiwan | 14.8% | South Korea | 15.3% | Brazil | 15.6% | China | 27.7% |
| Footnote | Description | Footnote* | Percentages are calculated based on total net assets. |
|
| Largest Holdings [Text Block] |
Holding Name | | | Percentage of
Total Net Assets |
|---|
Samsung Electronics | | | 5.5% | MediaTek | | | 3.0% | Yageo | | | 2.9% | Hengli Petrochemical, Cl A | | | 2.8% | Alibaba Group Holding | | | 2.8% | Ping An Insurance Group of China, Cl H | | | 2.7% | Hyundai Mobis | | | 2.5% | B3 - Brasil Bolsa Balcao | | | 2.5% | Taiwan Semiconductor Manufacturing | | | 2.4% | XP, Cl A | | | 2.4% |
|
| Material Fund Change [Text Block] |
There were no material changes during the reporting period. |
| Updated Prospectus Phone Number |
866-234-ARGA (866-234-2742)
|
| Updated Prospectus Web Address |
https://www.argainvest.com/arga-emerging-markets-value-fund/
|
| C000226877 |
|
| Shareholder Report [Line Items] |
|
| Fund Name |
ARGA International Value Fund
|
| Class Name |
Institutional Class Shares
|
| Trading Symbol |
ARVIX
|
| Annual or Semi-Annual Statement [Text Block] |
Annual Shareholder Report
|
| Additional Information [Text Block] |
This annual shareholder report contains important information about Institutional Class Shares of the ARGA International Value Fund (the "Fund") for the period from January 1, 2025 to December 31, 2025. You can find additional information about the Fund at https://www.argainvest.com/arga-international-value-fund/. You can also request this information by contacting us at 866-234-ARGA (866-234-2742).
|
| Additional Information Phone Number |
866-234-ARGA (866-234-2742)
|
| Additional Information Website |
https://www.argainvest.com/arga-international-value-fund/
|
| Expenses [Text Block] |
What were the Fund costs for the last year?(based on a hypothetical $10,000 investment) Fund Name | Costs of a $10,000 investment | Costs paid as a percentage of a $10,000 investment |
|---|
ARGA International Value Fund, Institutional Class Shares | $90 | 0.75% |
|---|
|
| Expenses Paid, Amount |
$ 90
|
| Expense Ratio, Percent |
0.75%
|
| Factors Affecting Performance [Text Block] |
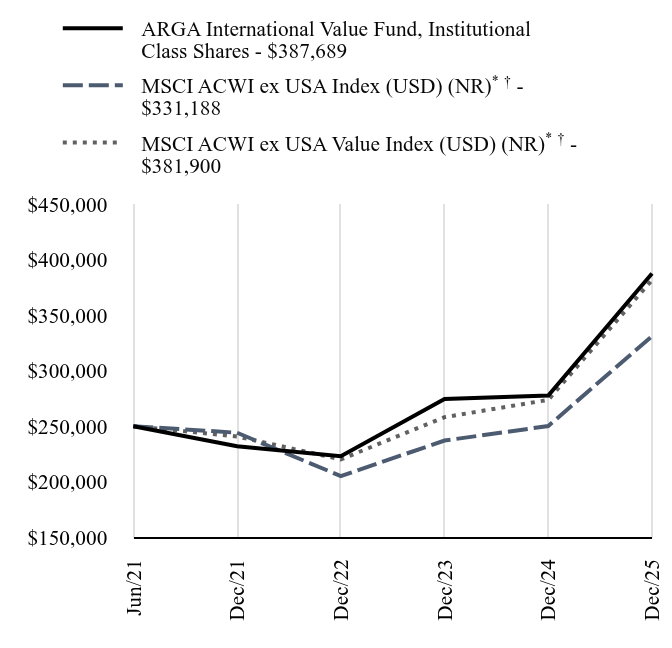
How did the Fund perform in the last year?The Fund outperformed the MSCI ACWI ex USA Index in 2025 (USD) (NR). The Fund was up 39.66%, compared to a 32.39% rise in the MSCI ACWI ex USA Index (USD) (NR) and a 39.50% increase in the MSCI ACWI ex USA Value Index (USD) (NR). Key market drivers included a tech rally, AI optimism, strong earnings, eased tariff concerns and a weaker US dollar, partially offset by geopolitical uncertainty. The Fund’s outperformance reflected strong recoveries in the valuations of many Fund holdings. Per ARGA’s rigorous valuation approach, the Fund objective is to own deeply undervalued stocks with long-term upside. ARGA’s value style is based on the core belief that investment opportunity results from investor overreaction to company or macro stress, which creates price anomalies that value investors can exploit. As conditions normalize over time, stocks typically recover, as many did in 2025. Strong Fund performance occurred across sectors and geographies. Leading sector contributors were Financial Services, Health Care and Materials, with minor offset from Industrials. On a company basis, 18 of 20 Financial Services holdings made positive contributions, led by Spanish and other European banks due to benign credit environment and good loan growth. Strong benefit occurred from a diversified global life science holding that rallied over litigation resolution. A Nordic-based mining holding advanced on solid earnings and rising metals prices. Partial offset came from an Industrials holding facing accounting issues, which appear overblown. Valuation spreads in international equity markets remain wide, indicating future opportunity. Current price-to-book spreads between cheapest and most expensive quintiles well exceed historical averages. Historically, high spreads have signaled subsequent value outperformance. ARGA research confirms a wide variety of value opportunities across sectors and geographies, where temporary stress has depressed valuations particularly in select Consumer Discretionary, Technology and Materials companies. We believe these and other opportunities position the Fund well for long-term returns. |
| Performance Past Does Not Indicate Future [Text] |
Past performance is not indicative of future performance.
|
| Line Graph [Table Text Block] |
| ARGA International Value Fund, Institutional Class Shares | MSCI ACWI ex USA Index (USD) (NR)Footnote Reference*Footnote Reference† | MSCI ACWI ex USA Value Index (USD) (NR)Footnote Reference*Footnote Reference† |
|---|
Jun/21 | $250,000 | $250,000 | $250,000 |
|---|
Dec/21 | $231,975 | $244,094 | $240,764 |
|---|
Dec/22 | $222,969 | $205,031 | $220,082 |
|---|
Dec/23 | $274,447 | $237,048 | $258,160 |
|---|
Dec/24 | $277,597 | $250,167 | $273,759 |
|---|
Dec/25 | $387,689 | $331,188 | $381,900 |
|---|
|
| Average Annual Return [Table Text Block] |
Fund/Index Name | 1 Year | Annualized
Since
Inception |
|---|
ARGA International Value Fund, Institutional Class Shares | 39.66% | 10.05% |
|---|
MSCI ACWI ex USA Index (USD) (NR)Footnote Reference*Footnote Reference† | 32.39% | 6.33% |
|---|
MSCI ACWI ex USA Value Index (USD) (NR)Footnote Reference*Footnote Reference† | 39.50% | 9.69% |
|---|
|
| No Deduction of Taxes [Text Block] |
The table and graph presented do not reflect the deduction of taxes a shareholder would pay on Fund distributions or the redemption of Fund shares.
|
| AssetsNet |
$ 123,353,406
|
| Holdings Count | Holding |
57
|
| Advisory Fees Paid, Amount |
$ 630,397
|
| InvestmentCompanyPortfolioTurnover |
58.00%
|
| Additional Fund Statistics [Text Block] |
Key Fund Statistics as of December 31, 2025 | Total Net Assets | Number of Holdings | Total Advisory Fees Paid | Portfolio Turnover Rate |
|---|
| $123,353,406 | 57 | $630,397 | 58% |
|---|
|
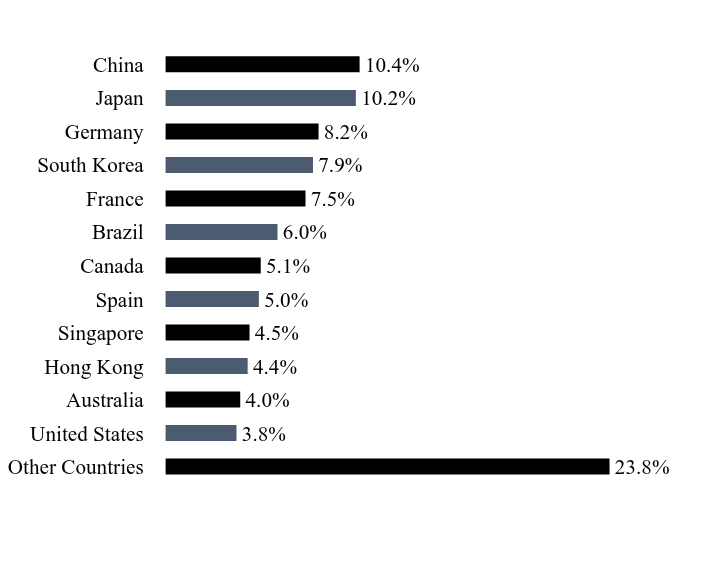
| Holdings [Text Block] |
Country WeightingsFootnote Reference*Value | Value |
|---|
Other Countries | 23.8% | United States | 3.8% | Australia | 4.0% | Hong Kong | 4.4% | Singapore | 4.5% | Spain | 5.0% | Canada | 5.1% | Brazil | 6.0% | France | 7.5% | South Korea | 7.9% | Germany | 8.2% | Japan | 10.2% | China | 10.4% |
| Footnote | Description | Footnote* | Percentages are calculated based on total net assets. |
|
| Largest Holdings [Text Block] |
Holding Name | | | Percentage of
Total Net Assets |
|---|
Nidec | | | 5.1% | Kering | | | 4.7% | Samsung Electronics | | | 4.6% | STMicroelectronics | | | 4.5% | Murata Manufacturing | | | 3.0% | Infineon Technologies | | | 3.0% | Nutrien | | | 2.9% | Banco Bilbao Vizcaya Argentaria | | | 2.8% | Las Vegas Sands | | | 2.8% | Nokia | | | 2.7% |
|
| Material Fund Change [Text Block] |
There were no material changes during the reporting period. |
| Updated Prospectus Phone Number |
866-234-ARGA (866-234-2742)
|
| Updated Prospectus Web Address |
https://www.argainvest.com/arga-international-value-fund/
|
| C000243045 |
|
| Shareholder Report [Line Items] |
|
| Fund Name |
ARGA Value Fund
|
| Class Name |
Institutional Class
|
| Trading Symbol |
ARUIX
|
| Annual or Semi-Annual Statement [Text Block] |
Annual Shareholder Report
|
| Additional Information [Text Block] |
This annual shareholder report contains important information about Institutional Class Shares of the ARGA Value Fund (the "Fund") for the period from January 1, 2025 to December 31, 2025. You can find additional information about the Fund at https://www.argainvest.com/arga-value-fund/. You can also request this information by contacting us at 866-234-ARGA (866-234-2742).
|
| Additional Information Phone Number |
866-234-ARGA (866-234-2742)
|
| Additional Information Website |
https://www.argainvest.com/arga-value-fund/
|
| Expenses [Text Block] |
What were the Fund costs for the last year?(based on a hypothetical $10,000 investment) Fund Name | Costs of a $10,000 investment | Costs paid as a percentage of a $10,000 investment |
|---|
ARGA Value Fund, Institutional Class Shares | $71 | 0.65% |
|---|
|
| Expenses Paid, Amount |
$ 71
|
| Expense Ratio, Percent |
0.65%
|
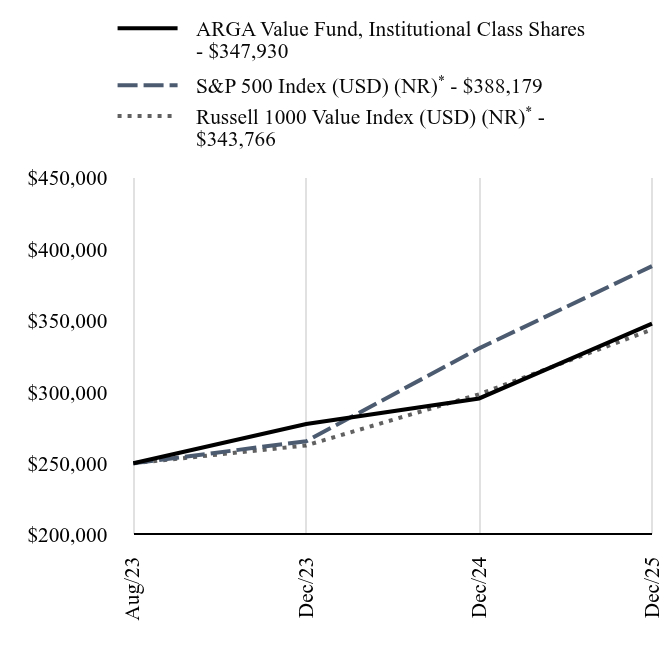
| Factors Affecting Performance [Text Block] |
How did the Fund perform in the last year?The Fund outperformed the Russell 1000 Value Index (USD) (NR) in 2025. The Fund was up 17.76%, compared to a 15.21% rise in the Russell 1000 Value Index (USD) (NR) and a 17.43% increase in the S&P 500 Index (USD) (NR). Key market drivers included AI growth, solid corporate earnings, rate cuts, partially offset by geopolitical and trade tensions. The Fund’s outperformance reflected strong recoveries in the valuations of many Fund holdings. Per ARGA’s rigorous valuation approach, the Fund objective is to own deeply undervalued stocks with long-term upside. ARGA’s value style is based on the core belief that investment opportunity results from investor overreaction to company or macro stress, which creates price anomalies that value investors can exploit. As conditions normalize over time, stocks typically recover, as many did in 2025. Strong Fund performance occurred across various sectors. Strength in Health Care, Financial Services and Consumer Discretionary more than offset drag from Communication Services, Energy and Industrials. Positive results were largely due to company specific factors. For example, a large US health service provider rose on improved margins and good results from its health insurance subsidiary. Several US banks advanced on robust earnings and strong capitalization. Other large company contributors included a global luxury brand holding and a US-based casino operator. Partial negative offset was due to falling oil prices and company specific factors. US valuation spreads remain wide, indicating future opportunity. Current price-to-book spreads between cheapest and most expensive quintiles well exceed historical averages. Historically, high spreads have signaled subsequent value outperformance. ARGA research confirms a wide variety of value opportunities across sectors, where temporary stress has depressed valuations particularly in select Consumer Discretionary, Technology and Health Care companies. We believe these and other opportunities position the Fund well for long-term returns. |
| Performance Past Does Not Indicate Future [Text] |
Past performance is not indicative of future performance.
|
| Line Graph [Table Text Block] |
| ARGA Value Fund, Institutional Class Shares | S&P 500 Index (USD) (NR)Footnote Reference* | Russell 1000 Value Index (USD) (NR)Footnote Reference* |
|---|
Aug/23 | $250,000 | $250,000 | $250,000 |
|---|
Dec/23 | $277,525 | $265,502 | $262,546 |
|---|
Dec/24 | $295,450 | $330,561 | $298,372 |
|---|
Dec/25 | $347,930 | $388,179 | $343,766 |
|---|
|
| Average Annual Return [Table Text Block] |
Fund/Index Name | 1 Year | Annualized
Since
Inception |
|---|
ARGA Value Fund, Institutional Class Shares | 17.76% | 15.19% |
|---|
S&P 500 Index (USD) (NR)Footnote Reference* | 17.43% | 20.72% |
|---|
Russell 1000 Value Index (USD) (NR)Footnote Reference* | 15.21% | 14.60% |
|---|
|
| No Deduction of Taxes [Text Block] |
The table and graph presented do not reflect the deduction of taxes a shareholder would pay on Fund distributions or the redemption of Fund shares.
|
| AssetsNet |
$ 6,418,114
|
| Holdings Count | Holding |
52
|
| Advisory Fees Paid, Amount |
$ 0
|
| InvestmentCompanyPortfolioTurnover |
88.00%
|
| Additional Fund Statistics [Text Block] |
Key Fund Statistics as of December 31, 2025 | Total Net Assets | Number of Holdings | Total Advisory Fees Paid | Portfolio Turnover Rate |
|---|
| $6,418,114 | 52 | $- | 88% |
|---|
|
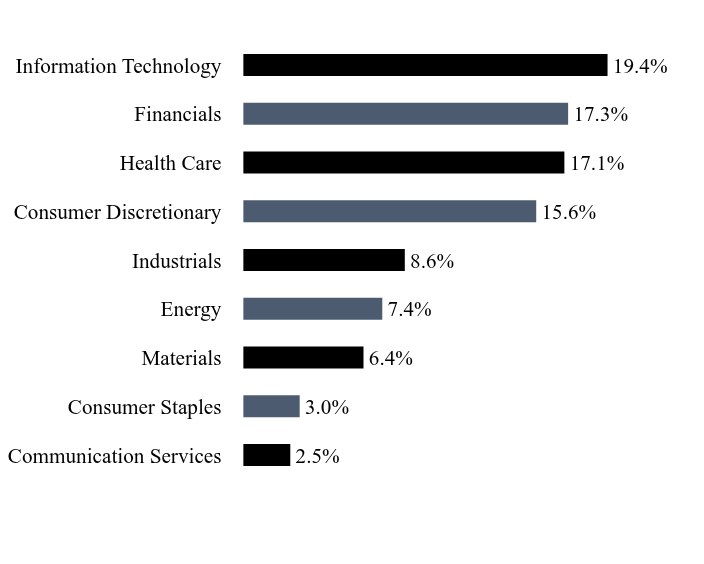
| Holdings [Text Block] |
Sector WeightingsFootnote Reference*Value | Value |
|---|
Communication Services | 2.5% | Consumer Staples | 3.0% | Materials | 6.4% | Energy | 7.4% | Industrials | 8.6% | Consumer Discretionary | 15.6% | Health Care | 17.1% | Financials | 17.3% | Information Technology | 19.4% |
| Footnote | Description | Footnote* | Percentages are calculated based on total net assets. |
|
| Largest Holdings [Text Block] |
Holding Name | | | Percentage of
Total Net Assets |
|---|
Elevance Health | | | 4.7% | Las Vegas Sands | | | 4.2% | Alaska Air Group | | | 4.0% | Humana | | | 3.5% | Patterson-UTI Energy | | | 3.0% | NXP Semiconductors | | | 2.9% | Micron Technology | | | 2.8% | Unum Group | | | 2.8% | Mohawk Industries | | | 2.8% | Accenture, Cl A | | | 2.7% |
|
| Material Fund Change [Text Block] |
There were no material changes during the reporting period. |
| Updated Prospectus Phone Number |
866-234-ARGA (866-234-2742)
|
| Updated Prospectus Web Address |
https://www.argainvest.com/arga-value-fund/
|