What were the Fund's costs for the period?
(based on a hypothetical $10,000 investment)
Fund name | Costs of a $10,000
investmentFootnote Reference(a) | Costs paid as a percentage of a
$10,000 investmentFootnote Reference(b) |
|---|---|---|
Pacific NoS Global EM Equity Active ETF | $83 | 0.75% |
(a) The Fund commenced operations during the reporting period. Expenses for a full reporting period would be higher than the amount shown.
(b) Annualized
How did the Fund perform last period?
GEME ended 2025 outperforming the MSCI EM Index by 9% on a total return basis. Performance was driven primarily by country allocation, notably underweights in India and overweights in Korea, alongside strong contributions from precious metals miners and select smaller markets such as Greece and Poland. These gains were partly offset by cautious positioning in Taiwan and weaker Latin American exposure. Korea remained a key driver, supported by a multi-year boom in memory production, improving corporate governance, and strong earnings linked to the AI hardware supply chain. Additional support came from increased exposure to South Africa amid falling capital costs and firm metals prices, while selective investments across South-East Asia and disciplined stock selection underpinned consistent performance through the year.
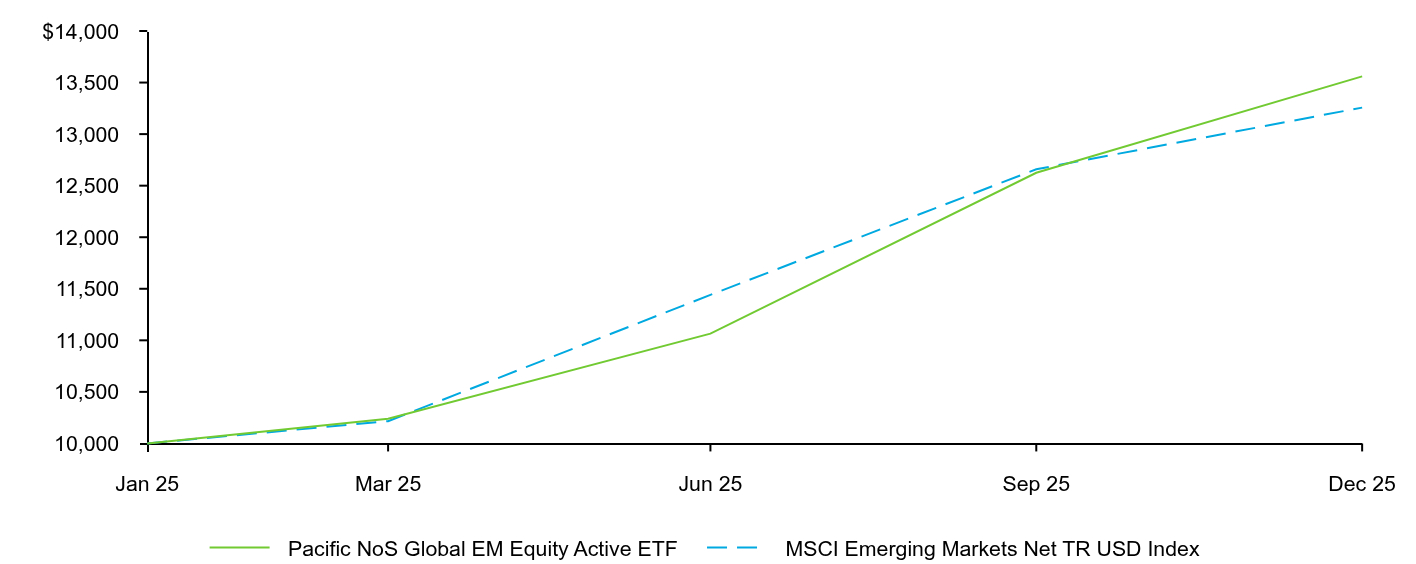
Pacific NoS Global EM Equity Active ETF | MSCI Emerging Markets Net TR USD Index | |
|---|---|---|
Jan 25 | $10,000 | $10,000 |
Mar 25 | $10,239 | $10,216 |
Jun 25 | $11,065 | $11,441 |
Sep 25 | $12,625 | $12,659 |
Dec 25 | $13,560 | $13,257 |
Since Fund
Inception (1/23/2025) | |
|---|---|
Pacific NoS Global EM Equity Active ETF | 35.67% |
MSCI Emerging Markets Net TR USD Index | 32.57% |
Fund Statistics
Net Assets........................................................................................................................................................................................................................................................................................................................................................................................................................................................................................................................................................................................................................................................................................................................................................................................................................................................................................................................................................................................................................................ | $74,366,754 |
|---|---|
Number of Portfolio Holdings........................................................................................................................................................................................................................................................................................................................................................................................................................................................................................................................................................................................................................................................................................................................................................................................................................................................................................................................................................................................................................................ | 56 |
Investment Advisory Fees........................................................................................................................................................................................................................................................................................................................................................................................................................................................................................................................................................................................................................................................................................................................................................................................................................................................................................................................................................................................................................................ | $327,995 |
Portfolio Turnover Rate........................................................................................................................................................................................................................................................................................................................................................................................................................................................................................................................................................................................................................................................................................................................................................................................................................................................................................................................................................................................................................................ | 80% |
Percentage of Net Assets | |
Information Technology........................................................................................................................................................................................................................................................................................................................................................................................................................................................................................................................................................................................................................................................................................................................................................................................................................................................................................................................................................................................................................................ | 23.5% |
Financials........................................................................................................................................................................................................................................................................................................................................................................................................................................................................................................................................................................................................................................................................................................................................................................................................................................................................................................................................................................................................................................ | 22.5% |
Industrials........................................................................................................................................................................................................................................................................................................................................................................................................................................................................................................................................................................................................................................................................................................................................................................................................................................................................................................................................................................................................................................ | 17.2% |
Consumer Discretionary........................................................................................................................................................................................................................................................................................................................................................................................................................................................................................................................................................................................................................................................................................................................................................................................................................................................................................................................................................................................................................................ | 17.0% |
Communication Services........................................................................................................................................................................................................................................................................................................................................................................................................................................................................................................................................................................................................................................................................................................................................................................................................................................................................................................................................................................................................................................ | 5.9% |
Materials........................................................................................................................................................................................................................................................................................................................................................................................................................................................................................................................................................................................................................................................................................................................................................................................................................................................................................................................................................................................................................................ | 4.7% |
Energy........................................................................................................................................................................................................................................................................................................................................................................................................................................................................................................................................................................................................................................................................................................................................................................................................................................................................................................................................................................................................................................ | 3.5% |
Consumer Staples........................................................................................................................................................................................................................................................................................................................................................................................................................................................................................................................................................................................................................................................................................................................................................................................................................................................................................................................................................................................................................................ | 2.5% |
Real Estate........................................................................................................................................................................................................................................................................................................................................................................................................................................................................................................................................................................................................................................................................................................................................................................................................................................................................................................................................................................................................................................ | 2.2% |
Material Fund Changes
On February 3, 2026, Pinnacle Investment Management announced that it had agreed to acquire the remaining equity interests in Pacific Asset Management that it did not already own. The transaction is expected to be completed in the first half of 2026.
The Fund has hired Tidal Investments as an additional sub-advisor to the Fund effective March 26, 2026.