Shareholder Report
|
12 Months Ended |
|
Dec. 31, 2025
USD ($)
Holding
|
|---|
| Shareholder Report [Line Items] |
|
| Document Type |
N-CSR
|
| Amendment Flag |
false
|
| Registrant Name |
Advisors' Inner Circle Fund III
|
| Entity Central Index Key |
0001593547
|
| Entity Investment Company Type |
N-1A
|
| Document Period End Date |
Dec. 31, 2025
|
| C000234546 |
|
| Shareholder Report [Line Items] |
|
| Fund Name |
FS Multi-Strategy Alternatives Fund
|
| Class Name |
Class A Shares
|
| Trading Symbol |
FSMMX
|
| Annual or Semi-Annual Statement [Text Block] |
Annual Shareholder Report
|
| Shareholder Report Annual or Semi-Annual |
annual shareholder report
|
| Additional Information [Text Block] |
You can find additional information about the Fund at https://www.futurestandard.com/investments/fs-multi-strategy-alternatives-fund/class-a. You can also request this information by contacting us at 877-924-4766.
|
| Additional Information Phone Number |
877-924-4766
|
| Additional Information Website |
https://www.futurestandard.com/investments/fs-multi-strategy-alternatives-fund/class-a
|
| Expenses [Text Block] |
What were the Fund costs for the last year?(based on a hypothetical $10,000 investment) Fund Name | Costs of a $10,000 investment | Costs paid as a percentage of a $10,000 investment |
|---|
FS Multi-Strategy Alternatives Fund, Class A Shares | $232 | 2.27% |
|---|
|
| Expenses Paid, Amount |
$ 232
|
| Expense Ratio, Percent |
2.27%
|
| Factors Affecting Performance [Text Block] |
How did the Fund perform in the last year?For the fiscal year ended December 31, 2025, the FS Multi-Strategy Alternatives Fund returned 4.06% (Class A). The BofA Merrill Lynch 3-Month U.S. Treasury Bill Index, the primary benchmark for the Fund, returned 4.18% during this time. Consistent with history, the Hedge Fund Managers and Direct Strategies were complementary as the managers drove the bulk of positive return contribution, typical during risk on markets, and the Direct Strategies were flat on the year. Our Long/Short Credit and Structured Credit managers delivered a modest positive carry and generated alpha by trading around sectors based on fundamental and technical relative value. Our Merger Arbitrage manager benefitted from a favorable regulatory environment that increased deal activity, despite risk arbitrage spreads being at historically average levels. Meanwhile the explosion of convertible bond issuance created a fruitful environment to identify undervalued securities and continually rotate the portfolio for our Convertible Arbitrage manager. On the Direct side, our Equity Thematic portfolio delivered meaningful positive performance as powerful secular drivers such as Artificial Intelligence and De-globalization & Reshoring led to interesting Long/Short opportunities to monetize these themes. Conversely, the whipsawing of assets across regions during the “Liberation Day” period led to acute losses within two of our strategies (Cross-Asset Trend-Following and Equity Vol Premia). Both exposures hit their “max loss” budget that informs their position sizing within our portfolio construction process. Through balanced return contribution, produced independent of beta and duration, FSMSX delivered another year as a consistent diversifying solution for investors in a world where options remain limited. We believe the risk/return for traditional betas in 2026 have without question become less attractive, increasing the appeal of alternative sources of return with distinct fundamentals/drivers. |
| Performance Past Does Not Indicate Future [Text] |
Past performance is not indicative of future performance.
|
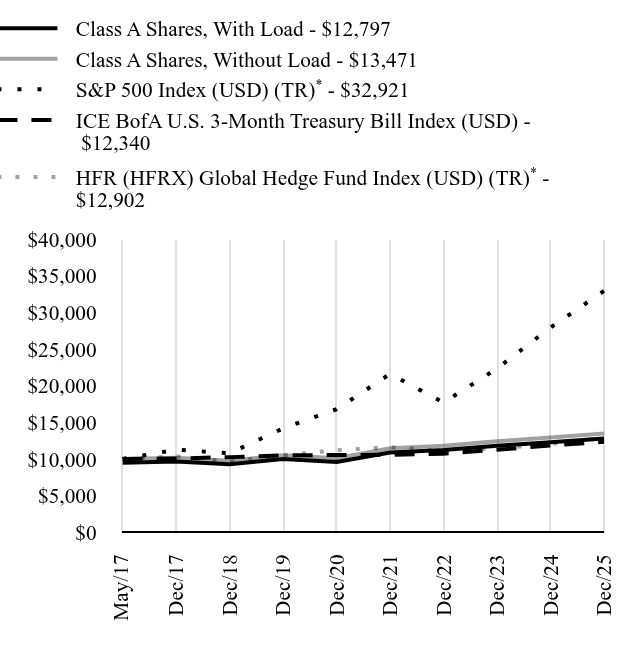
| Line Graph [Table Text Block] |
| Class A Shares, With Load | Class A Shares, Without Load | S&P 500 Index (USD) (TR)Footnote Reference* | ICE BofA U.S. 3-Month Treasury Bill Index (USD) | HFR (HFRX) Global Hedge Fund Index (USD) (TR)Footnote Reference* |
|---|
May/17 | $9,500 | $10,000 | $10,000 | $10,000 | $10,000 |
|---|
Dec/17 | $9,671 | $10,180 | $11,275 | $10,066 | $10,348 |
|---|
Dec/18 | $9,273 | $9,761 | $10,781 | $10,254 | $9,652 |
|---|
Dec/19 | $9,985 | $10,510 | $14,175 | $10,488 | $10,484 |
|---|
Dec/20 | $9,586 | $10,091 | $16,783 | $10,558 | $11,199 |
|---|
Dec/21 | $10,892 | $11,465 | $21,601 | $10,563 | $11,607 |
|---|
Dec/22 | $11,219 | $11,810 | $17,689 | $10,717 | $11,096 |
|---|
Dec/23 | $11,799 | $12,420 | $22,339 | $11,254 | $11,440 |
|---|
Dec/24 | $12,298 | $12,946 | $27,928 | $11,845 | $12,043 |
|---|
Dec/25 | $12,797 | $13,471 | $32,921 | $12,340 | $12,902 |
|---|
|
| Average Annual Return [Table Text Block] |
Fund/Index Name | 1 Year | 5 Years | Annualized
Since
Inception |
|---|
FS Multi-Strategy Alternatives Fund | | | |
|---|
Class A Shares, With Load | -1.12% | 4.88% | 2.89% |
|---|
Class A Shares, Without Load | 4.06% | 5.95% | 3.51% |
|---|
S&P 500 Index (USD) (TR)Footnote Reference* | 17.88% | 14.42% | 14.80% |
|---|
ICE BofA U.S. 3-Month Treasury Bill Index (USD) | 4.18% | 3.17% | 2.47% |
|---|
HFR (HFRX) Global Hedge Fund Index (USD) (TR)Footnote Reference* | 7.14% | 2.87% | 3.00% |
|---|
|
| No Deduction of Taxes [Text Block] |
The table and graph presented do not reflect the deduction of taxes a shareholder would pay on Fund distributions or the redemption of Fund shares.
|
| AssetsNet |
$ 1,627,418,000
|
| Holdings Count | Holding |
686
|
| Advisory Fees Paid, Amount |
$ 21,813
|
| InvestmentCompanyPortfolioTurnover |
636.00%
|
| Additional Fund Statistics [Text Block] |
Key Fund Statistics as of December 31, 2025 | Total Net Assets (000's) | Number of Holdings | Total Advisory Fees Paid (000's) | Portfolio Turnover Rate |
|---|
| $1,627,418 | 686 | $21,813 | 636% |
|---|
|
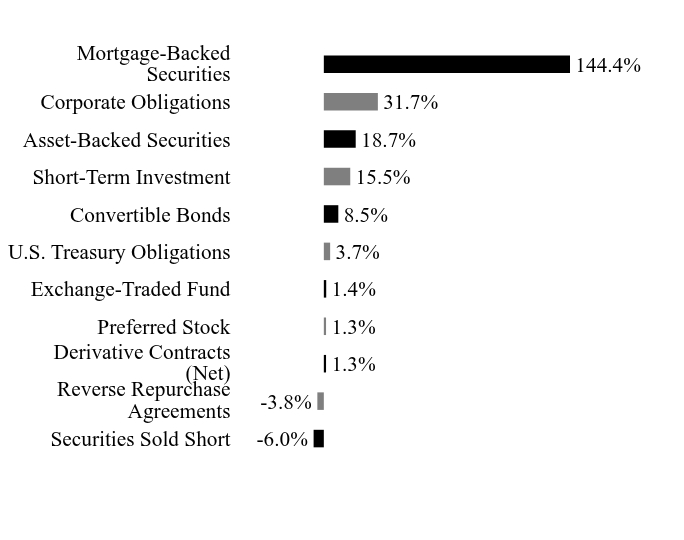
| Holdings [Text Block] |
Asset WeightingsFootnote Reference*Value | Value |
|---|
Securities Sold Short | -6.0% | Reverse Repurchase Agreements | -3.8% | Derivative Contracts (Net) | 1.3% | Preferred Stock | 1.3% | Exchange-Traded Fund | 1.4% | U.S. Treasury Obligations | 3.7% | Convertible Bonds | 8.5% | Short-Term Investment | 15.5% | Asset-Backed Securities | 18.7% | Corporate Obligations | 31.7% | Mortgage-Backed Securities | 144.4% |
| Footnote | Description | Footnote* | Percentages are calculated based on total net assets. |
|
| Largest Holdings [Text Block] |
Holding Name | | | Percentage of
Total Net AssetsFootnote Reference(A) |
|---|
FNMA, 5.50%, 1/15/2056 | | | 70.1% | FNMA or FHLMC, 5.00%, 1/15/2056 | | | 45.4% | Barclays Bank, 0.000%, 12/29/26 | | | 10.8% | Barclays Bank, 0.000%, 12/29/26 | | | 2.2% | Barclays Bank, 0.000%, 12/29/26 | | | 2.1% | U.S. Treasury Bills, 3.72%, 2/19/2026 | | | 1.5% | iShares Bitcoin Trust ETF | | | 1.4% | U.S. Treasury Bills, 3.83%, 1/22/2026 | | | 1.2% | GNMA, 4.50%, 1/20/2050, Cl IC | | | 0.9% | GNMA, 4.00%, 1/20/2051, Cl IB | | | 0.8% |
| Footnote | Description | Footnote(A) | Short-Term Investments are not shown in the top ten chart. |
|
| Material Fund Change [Text Block] |
There were no material changes during the reporting period. |
| C000234545 |
|
| Shareholder Report [Line Items] |
|
| Fund Name |
FS Multi-Strategy Alternatives Fund
|
| Class Name |
Class I Shares
|
| Trading Symbol |
FSMSX
|
| Annual or Semi-Annual Statement [Text Block] |
Annual Shareholder Report
|
| Shareholder Report Annual or Semi-Annual |
annual shareholder report
|
| Additional Information [Text Block] |
You can find additional information about the Fund at https://www.futurestandard.com/investments/fs-multi-strategy-alternatives-fund/class-i. You can also request this information by contacting us at 877-924-4766.
|
| Additional Information Phone Number |
877-924-4766
|
| Additional Information Website |
https://www.futurestandard.com/investments/fs-multi-strategy-alternatives-fund/class-i
|
| Expenses [Text Block] |
What were the Fund costs for the last year?(based on a hypothetical $10,000 investment) Fund Name | Costs of a $10,000 investment | Costs paid as a percentage of a $10,000 investment |
|---|
FS Multi-Strategy Alternatives Fund, Class I Shares | $206 | 2.02% |
|---|
|
| Expenses Paid, Amount |
$ 206
|
| Expense Ratio, Percent |
2.02%
|
| Factors Affecting Performance [Text Block] |
How did the Fund perform in the last year?For the fiscal year ended December 31, 2025, the FS Multi-Strategy Alternatives Fund returned 4.31% (Class I). The BofA Merrill Lynch 3-Month U.S. Treasury Bill Index, the primary benchmark for the Fund, returned 4.18% during this time. Consistent with history, the Hedge Fund Managers and Direct Strategies were complementary as the managers drove the bulk of positive return contribution, typical during risk on markets, and the Direct Strategies were flat on the year. Our Long/Short Credit and Structured Credit managers delivered a modest positive carry and generated alpha by trading around sectors based on fundamental and technical relative value. Our Merger Arbitrage manager benefitted from a favorable regulatory environment that increased deal activity, despite risk arbitrage spreads being at historically average levels. Meanwhile the explosion of convertible bond issuance created a fruitful environment to identify undervalued securities and continually rotate the portfolio for our Convertible Arbitrage manager. On the Direct side, our Equity Thematic portfolio delivered meaningful positive performance as powerful secular drivers such as Artificial Intelligence and De-globalization & Reshoring led to interesting Long/Short opportunities to monetize these themes. Conversely, the whipsawing of assets across regions during the “Liberation Day” period led to acute losses within two of our strategies (Cross-Asset Trend-Following and Equity Vol Premia). Both exposures hit their “max loss” budget that informs their position sizing within our portfolio construction process. Through balanced return contribution, produced independent of beta and duration, FSMSX delivered another year as a consistent diversifying solution for investors in a world where options remain limited. We believe the risk/return for traditional betas in 2026 have without question become less attractive, increasing the appeal of alternative sources of return with distinct fundamentals/drivers. |
| Performance Past Does Not Indicate Future [Text] |
Past performance is not indicative of future performance.
|
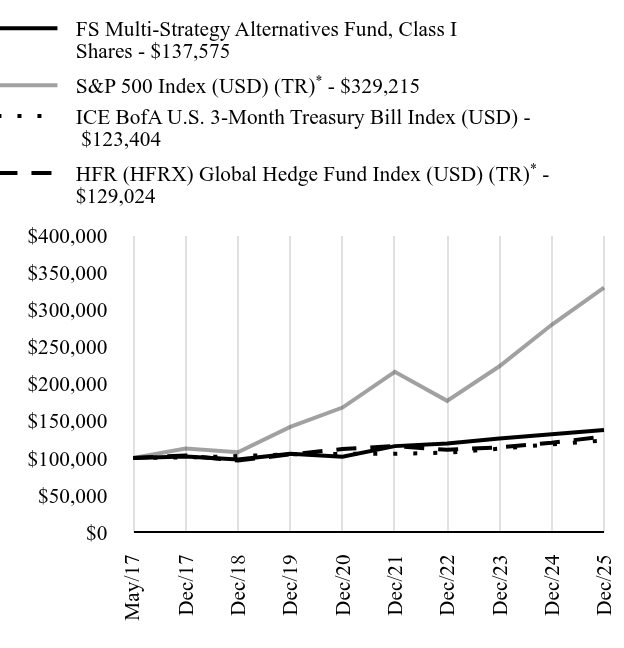
| Line Graph [Table Text Block] |
| FS Multi-Strategy Alternatives Fund, Class I Shares | S&P 500 Index (USD) (TR)Footnote Reference* | ICE BofA U.S. 3-Month Treasury Bill Index (USD) | HFR (HFRX) Global Hedge Fund Index (USD) (TR)Footnote Reference* |
|---|
May/17 | $100,000 | $100,000 | $100,000 | $100,000 |
|---|
Dec/17 | $101,900 | $112,751 | $100,656 | $103,478 |
|---|
Dec/18 | $98,010 | $107,807 | $102,543 | $96,523 |
|---|
Dec/19 | $105,625 | $141,752 | $104,881 | $104,844 |
|---|
Dec/20 | $101,766 | $167,833 | $105,581 | $111,986 |
|---|
Dec/21 | $115,974 | $216,010 | $105,633 | $116,074 |
|---|
Dec/22 | $119,637 | $176,889 | $107,170 | $110,960 |
|---|
Dec/23 | $126,146 | $223,388 | $112,545 | $114,404 |
|---|
Dec/24 | $131,884 | $279,280 | $118,455 | $120,428 |
|---|
Dec/25 | $137,575 | $329,215 | $123,404 | $129,024 |
|---|
|
| Average Annual Return [Table Text Block] |
Fund/Index Name | 1 Year | 5 Years | Annualized
Since
Inception |
|---|
FS Multi-Strategy Alternatives Fund, Class I Shares | 4.31% | 6.22% | 3.76% |
|---|
S&P 500 Index (USD) (TR)Footnote Reference* | 17.88% | 14.42% | 14.80% |
|---|
ICE BofA U.S. 3-Month Treasury Bill Index (USD) | 4.18% | 3.17% | 2.47% |
|---|
HFR (HFRX) Global Hedge Fund Index (USD) (TR)Footnote Reference* | 7.14% | 2.87% | 3.00% |
|---|
|
| No Deduction of Taxes [Text Block] |
The table and graph presented do not reflect the deduction of taxes a shareholder would pay on Fund distributions or the redemption of Fund shares.
|
| AssetsNet |
$ 1,627,418,000
|
| Holdings Count | Holding |
686
|
| Advisory Fees Paid, Amount |
$ 21,813
|
| InvestmentCompanyPortfolioTurnover |
636.00%
|
| Additional Fund Statistics [Text Block] |
Key Fund Statistics as of December 31, 2025 | Total Net Assets (000's) | Number of Holdings | Total Advisory Fees Paid (000's) | Portfolio Turnover Rate |
|---|
| $1,627,418 | 686 | $21,813 | 636% |
|---|
|
| Holdings [Text Block] |
Asset WeightingsFootnote Reference*Value | Value |
|---|
Securities Sold Short | -6.0% | Reverse Repurchase Agreements | -3.8% | Derivative Contracts (Net) | 1.3% | Preferred Stock | 1.3% | Exchange-Traded Fund | 1.4% | U.S. Treasury Obligations | 3.7% | Convertible Bonds | 8.5% | Short-Term Investment | 15.5% | Asset-Backed Securities | 18.7% | Corporate Obligations | 31.7% | Mortgage-Backed Securities | 144.4% |
| Footnote | Description | Footnote* | Percentages are calculated based on total net assets. |
|
| Largest Holdings [Text Block] |
Holding Name | | | Percentage of
Total Net AssetsFootnote Reference(A) |
|---|
FNMA, 5.50%, 1/15/2056 | | | 70.1% | FNMA or FHLMC, 5.00%, 1/15/2056 | | | 45.4% | Barclays Bank, 0.000%, 12/29/26 | | | 10.8% | Barclays Bank, 0.000%, 12/29/26 | | | 2.2% | Barclays Bank, 0.000%, 12/29/26 | | | 2.1% | U.S. Treasury Bills, 3.72%, 2/19/2026 | | | 1.5% | iShares Bitcoin Trust ETF | | | 1.4% | U.S. Treasury Bills, 3.83%, 1/22/2026 | | | 1.2% | GNMA, 4.50%, 1/20/2050, Cl IC | | | 0.9% | GNMA, 4.00%, 1/20/2051, Cl IB | | | 0.8% |
| Footnote | Description | Footnote(A) | Short-Term Investments are not shown in the top ten chart. |
|
| Material Fund Change [Text Block] |
There were no material changes during the reporting period. |