Shareholder Report
Dec. 31, 2025
USD ($)
Holding
Shareholder Report |
12 Months Ended | ||||||||||||||||||||||||||||||||||||||||||||
|---|---|---|---|---|---|---|---|---|---|---|---|---|---|---|---|---|---|---|---|---|---|---|---|---|---|---|---|---|---|---|---|---|---|---|---|---|---|---|---|---|---|---|---|---|---|
|
Dec. 31, 2025
USD ($)
Holding
| |||||||||||||||||||||||||||||||||||||||||||||
| Shareholder Report [Line Items] | |||||||||||||||||||||||||||||||||||||||||||||
| Document Type | N-CSR | ||||||||||||||||||||||||||||||||||||||||||||
| Amendment Flag | false | ||||||||||||||||||||||||||||||||||||||||||||
| Registrant Name | Advisors' Inner Circle Fund III | ||||||||||||||||||||||||||||||||||||||||||||
| Entity Central Index Key | 0001593547 | ||||||||||||||||||||||||||||||||||||||||||||
| Entity Investment Company Type | N-1A | ||||||||||||||||||||||||||||||||||||||||||||
| Document Period End Date | Dec. 31, 2025 | ||||||||||||||||||||||||||||||||||||||||||||
| C000226322 | |||||||||||||||||||||||||||||||||||||||||||||
| Shareholder Report [Line Items] | |||||||||||||||||||||||||||||||||||||||||||||
| Fund Name | Democracy International Fund | ||||||||||||||||||||||||||||||||||||||||||||
| Class Name | Democracy International Fund | ||||||||||||||||||||||||||||||||||||||||||||
| Trading Symbol | DMCY | ||||||||||||||||||||||||||||||||||||||||||||
| Security Exchange Name | NYSEArca | ||||||||||||||||||||||||||||||||||||||||||||
| Annual or Semi-Annual Statement [Text Block] | Annual Shareholder Report | ||||||||||||||||||||||||||||||||||||||||||||
| Additional Information [Text Block] | This annual shareholder report contains important information about the Democracy International Fund (the "Fund") for the period from January 1, 2025 to December 31, 2025. You can find additional information about the Fund at https://www.democracyinvestments.com/fund. You can also request this information by contacting us at 1-877-776-3629. | ||||||||||||||||||||||||||||||||||||||||||||
| Additional Information Phone Number | 1-877-776-3629 | ||||||||||||||||||||||||||||||||||||||||||||
| Additional Information Website | https://www.democracyinvestments.com/fund | ||||||||||||||||||||||||||||||||||||||||||||
| Expenses [Text Block] | What were the Fund costs for the last year?(based on a hypothetical $10,000 investment)
|
||||||||||||||||||||||||||||||||||||||||||||
| Expenses Paid, Amount | $ 175 | ||||||||||||||||||||||||||||||||||||||||||||
| Expense Ratio, Percent | 1.53% | ||||||||||||||||||||||||||||||||||||||||||||
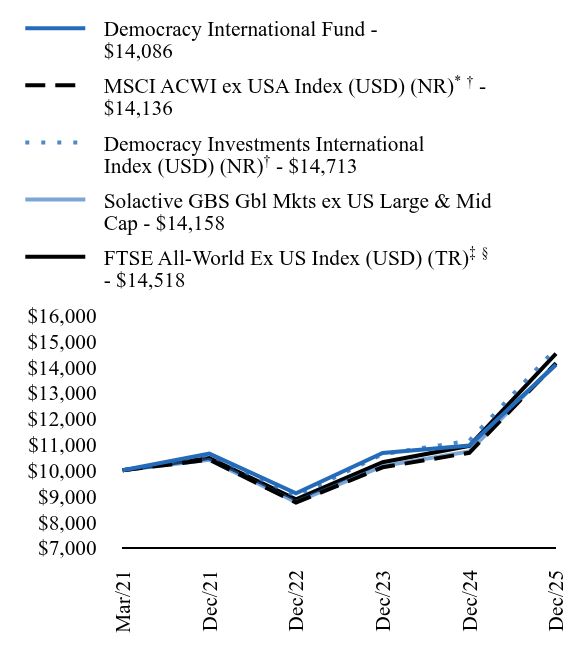
| Factors Affecting Performance [Text Block] | How did the Fund perform in the last year?The Fund seeks to track the total return performance, before fees and expenses, of the Democracy Investments International Index. During the fiscal year ended December 31, 2025, the Fund delivered strong performance amid a favorable environment for international equities outside the U.S.
Key factors that materially affected the Fund's performance in 2025 included: • Robust global equity markets, particularly in developed and emerging international regions, driven by economic recovery, moderating inflation, and supportive monetary policies in key markets like Europe, Japan, and parts of Asia. • Strong contributions from allocations to higher-democracy-scoring countries and regions (e.g., Pacific developed markets via holdings like Vanguard FTSE Pacific ETF, Japan via iShares MSCI Japan ETF, and emerging markets with democratic tilts), which benefited from solid corporate earnings growth, technology sector strength (e.g., exposure to companies like ASML), and resilient consumer and financial sectors. • The Fund's democracy-weighted methodology provided a slight edge in periods where democratic nations outperformed authoritarian counterparts, aligning with broader market trends favoring stable governance environments amid geopolitical uncertainties. • Partial offsets from underweights in certain authoritarian-leaning emerging markets, which experienced volatility but were limited in impact due to the index's design. Overall, international developed and emerging equities posted solid gains in 2025, with the Fund's calendar-year total return (NAV basis) of approximately 28.52% reflecting effective tracking of the Index and capturing upside from global growth themes. Performance (as of December 31, 2025, based on NAV) The table below shows the Fund's average annual total returns for periods ended December 31, 2025. Returns reflect reinvestment of dividends and capital gains distributions, net of fees. • 1-Year: 28.52% (calendar year 2025 return) • 3-Year: Approximately 16.06% (annualized, incorporating prior years' data) • Since Inception (March 31, 2021): Approximately 42.42% cumulative (or annualized equivalent based on period length) • (Note: 5-Year and 10-Year periods are not fully applicable due to the Fund's inception in 2021; longer-term returns would be 0.00% in standard tables until those periods complete.)
For comparison, the Fund's performance closely tracked its benchmark, the Democracy Investments International Index, with minor variations due to fees (net expense ratio 0.50%) and representative sampling. It performed in line with or slightly ahead of the broader Foreign Large Blend category average in 2025 (category ~30.40% for the year). |
||||||||||||||||||||||||||||||||||||||||||||
| Performance Past Does Not Indicate Future [Text] | Past performance is not indicative of future performance. | ||||||||||||||||||||||||||||||||||||||||||||
| Line Graph [Table Text Block] |
|
||||||||||||||||||||||||||||||||||||||||||||
| Average Annual Return [Table Text Block] |
|
||||||||||||||||||||||||||||||||||||||||||||
| No Deduction of Taxes [Text Block] | The table and graph presented do not reflect the deduction of taxes a shareholder would pay on Fund distributions or the redemption of Fund shares. | ||||||||||||||||||||||||||||||||||||||||||||
| AssetsNet | $ 10,747,431 | ||||||||||||||||||||||||||||||||||||||||||||
| Holdings Count | Holding | 197 | ||||||||||||||||||||||||||||||||||||||||||||
| Advisory Fees Paid, Amount | $ 36,916 | ||||||||||||||||||||||||||||||||||||||||||||
| InvestmentCompanyPortfolioTurnover | 0.00% | ||||||||||||||||||||||||||||||||||||||||||||
| Additional Fund Statistics [Text Block] | Key Fund Statistics as of December 31, 2025
|
||||||||||||||||||||||||||||||||||||||||||||
| Holdings [Text Block] | Asset/Country WeightingsFootnote Reference*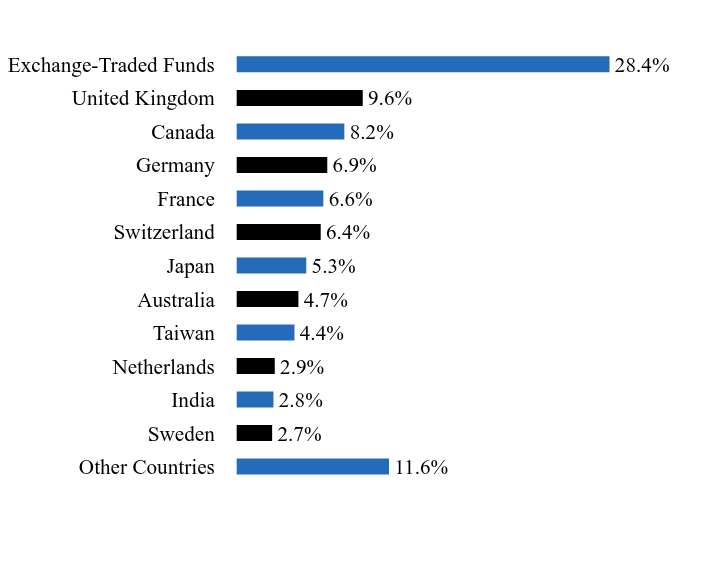
|
||||||||||||||||||||||||||||||||||||||||||||
| Largest Holdings [Text Block] | Top Ten Holdings
|
||||||||||||||||||||||||||||||||||||||||||||
| Material Fund Change [Text Block] | Material Fund ChangesOn January 26, 2026, the Board of Trustees of The Advisors' Inner Circle Fund III, at the recommendation of Democracy Investment Management LLC (the "Adviser") approved a plan of liquidation providing for the liquidation of the Fund's assets and distribution of the net proceeds pro rata to the Fund's shareholders. In connection therewith, the Fund closed to investment from new and existing shareholders effective immediately. The Fund ceased operations and liquidated on February 23, 2026. |
||||||||||||||||||||||||||||||||||||||||||||
| Updated Prospectus Phone Number | 1-877-776-3629 | ||||||||||||||||||||||||||||||||||||||||||||
| Updated Prospectus Web Address | https://www.democracyinvestments.com/fund |
| X | ||||||||||
- Definition Boolean flag that is true when the XBRL content amends previously-filed or accepted submission. No definition available.
|
| X | ||||||||||
- Definition For the EDGAR submission types of Form 8-K: the date of the report, the date of the earliest event reported; for the EDGAR submission types of Form N-1A: the filing date; for all other submission types: the end of the reporting or transition period. The format of the date is YYYY-MM-DD. No definition available.
|
| X | ||||||||||
- Definition The type of document being provided (such as 10-K, 10-Q, 485BPOS, etc). The document type is limited to the same value as the supporting SEC submission type, or the word 'Other'. No definition available.
|
| X | ||||||||||
- Definition A unique 10-digit SEC-issued value to identify entities that have filed disclosures with the SEC. It is commonly abbreviated as CIK. Reference 1: http://www.xbrl.org/2003/role/presentationRef
|
| X | ||||||||||
- Definition One of: N-1A (Mutual Fund), N-1 (Open-End Separate Account with No Variable Annuities), N-2 (Closed-End Investment Company), N-3 (Separate Account Registered as Open-End Management Investment Company), N-4 (Variable Annuity UIT Separate Account), N-5 (Small Business Investment Company), N-6 (Variable Life UIT Separate Account), S-1 or S-3 (Face Amount Certificate Company), S-6 (UIT, Non-Insurance Product). Reference 1: http://www.xbrl.org/2003/role/presentationRef
|
| X | ||||||||||
- Definition The exact name of the entity filing the report as specified in its charter, which is required by forms filed with the SEC. Reference 1: http://www.xbrl.org/2003/role/presentationRef
|
| X | ||||||||||
- Definition Name of the Exchange on which a security is registered. Reference 1: http://www.xbrl.org/2003/role/presentationRef
|
| X | ||||||||||
- Definition Trading symbol of an instrument as listed on an exchange. No definition available.
|
| X | ||||||||||
- References Reference 1: http://www.xbrl.org/2003/role/presentationRef
|
| X | ||||||||||
- References Reference 1: http://www.xbrl.org/2003/role/presentationRef
|
| X | ||||||||||
- References Reference 1: http://www.xbrl.org/2003/role/presentationRef
|
| X | ||||||||||
- References Reference 1: http://www.xbrl.org/2003/role/presentationRef
|
| X | ||||||||||
- References Reference 1: http://www.xbrl.org/2003/role/presentationRef
|
| X | ||||||||||
- References Reference 1: http://www.xbrl.org/2003/role/presentationRef
|
| X | ||||||||||
- References Reference 1: http://www.xbrl.org/2003/role/presentationRef
|
| X | ||||||||||
- References Reference 1: http://www.xbrl.org/2003/role/presentationRef
|
| X | ||||||||||
- References Reference 1: http://www.xbrl.org/2003/role/presentationRef
|
| X | ||||||||||
- References Reference 1: http://www.xbrl.org/2003/role/presentationRef
|
| X | ||||||||||
- References Reference 1: http://www.xbrl.org/2003/role/presentationRef
|
| X | ||||||||||
- References Reference 1: http://www.xbrl.org/2003/role/presentationRef
|
| X | ||||||||||
- References Reference 1: http://www.xbrl.org/2003/role/presentationRef
|
| X | ||||||||||
- References Reference 1: http://www.xbrl.org/2003/role/presentationRef
|
| X | ||||||||||
- References Reference 1: http://www.xbrl.org/2003/role/presentationRef
|
| X | ||||||||||
- References Reference 1: http://www.xbrl.org/2003/role/presentationRef
|
| X | ||||||||||
- References Reference 1: http://www.xbrl.org/2003/role/presentationRef
|
| X | ||||||||||
- References Reference 1: http://www.xbrl.org/2003/role/presentationRef
|
| X | ||||||||||
- References Reference 1: http://www.xbrl.org/2003/role/presentationRef
|
| X | ||||||||||
- References Reference 1: http://www.xbrl.org/2003/role/presentationRef
|
| X | ||||||||||
- References Reference 1: http://www.xbrl.org/2003/role/presentationRef
|
| X | ||||||||||
- References Reference 1: http://www.xbrl.org/2003/role/presentationRef
|
| X | ||||||||||
- References Reference 1: http://www.xbrl.org/2003/role/presentationRef
|
| X | ||||||||||
- Definition Amount of net assets (liabilities). Reference 1: http://fasb.org/us-gaap/role/ref/legacyRef
|
| X | ||||||||||
- Definition Percentage of lesser of purchase or sale of portfolio securities to average value of portfolio securities owned. Reference 1: http://www.xbrl.org/2009/role/commonPracticeRef
|
| X | ||||||||||
- Details
|