Shareholder Report
Dec. 31, 2025
USD ($)
$ / shares
WHAT WERE THE FUND COSTS FOR THE PAST YEAR? (based on a hypothetical $10,000 investment)
|
Class Name
|
Costs of a $10,000 investment
|
Costs paid as a percentage of a $10,000 investment
|
|
Investor Class
|
$103
|
0.95%
|
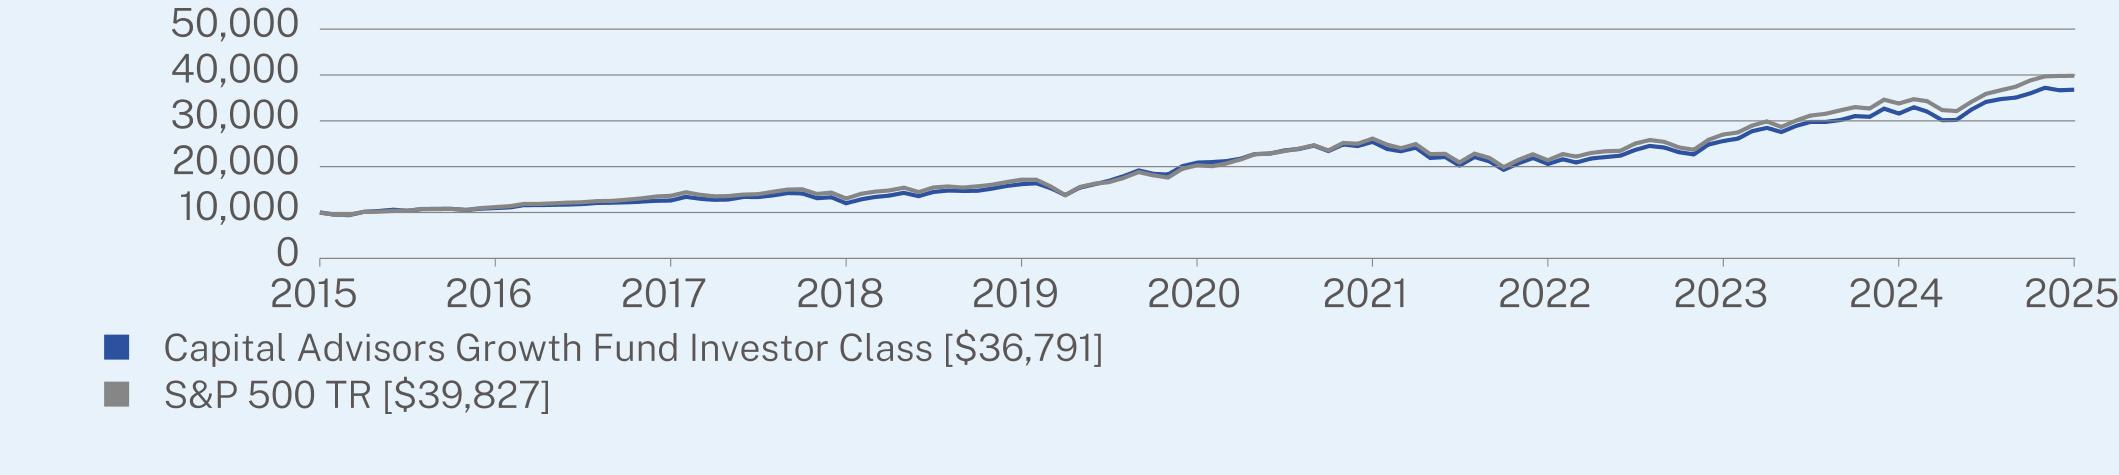
HOW DID THE FUND PERFORM LAST YEAR AND WHAT AFFECTED ITS PERFORMANCE?
For the 12-month period ended December 31, 2025, the Fund underperformed its benchmark, the S&P 500* Index.
WHAT FACTORS INFLUENCED PERFORMANCE
The Fund continued to benefit from its exposure to leading innovators across artificial intelligence, automation, and other enabling technologies, which remained key drivers of equity market returns over the period. Market leadership was again highly concentrated, with the largest platform-scale companies exerting outsized influence on broad index performance. Several of the Fund’s top contributors—such as GE Vernova, Applied Materials, and Alphabet—performed well due to strengthening demand for AI-related infrastructure and ongoing recovery in platform ecosystems. Growth-oriented equities generally outperformed Value, though with a narrower margin than in recent years, reflecting shifting macro expectations and sector rotations. The managers maintained a balanced approach by pairing innovation-driven positions with diversified exposures to unrelated opportunities, especially given elevated market concentration and intermittent volatility. The Fund continues to hold a cash reserve to balance risk and serve as dry powder when meaningful market drawdowns present attractive buying opportunities. The Fund held a slight lead over the S&P 500 benchmark through October 31, 2025, but fell behind in the remaining two months of the 2025 calendar year, largely given underperformance of certain Software-related positions (e.g., Microsoft, Amazon, and Palo Alto Networks).
|
Top Contributors
|
|
|
↑
|
Alphabet, Inc.
|
|
↑
|
NVIDIA Corp.
|
|
↑
|
JPMorgan Chase & Co.
|
|
↑
|
GE Vernova, Inc.
|
|
↑
|
Applied Materials, Inc.
|
|
Top Detractors
|
|
|
↓
|
Accenture, PLC
|
|
↓
|
UnitedHeath Group, Inc.
|
|
↓
|
Proctor & Gamble Co.
|
|
↓
|
Thermo Fisher Scientific, Inc.
|
|
↓
|
Honeywell International, Inc.
|
ANNUAL AVERAGE TOTAL RETURN (%)
|
|
1 Year
|
5 Year
|
10 Year
|
|
Investor Class
|
16.49
|
11.99
|
13.91
|
|
S&P 500 TR
|
17.88
|
14.42
|
14.82
|
Visit https://www.capadvfunds.com/pages/how-to-invest for more recent performance information.
KEY FUND STATISTICS (as of December 31, 2025)
|
Net Assets
|
$160,205,496
|
|
Number of Holdings
|
37
|
|
Net Advisory Fee
|
$1,009,190
|
|
Portfolio Turnover
|
15%
|
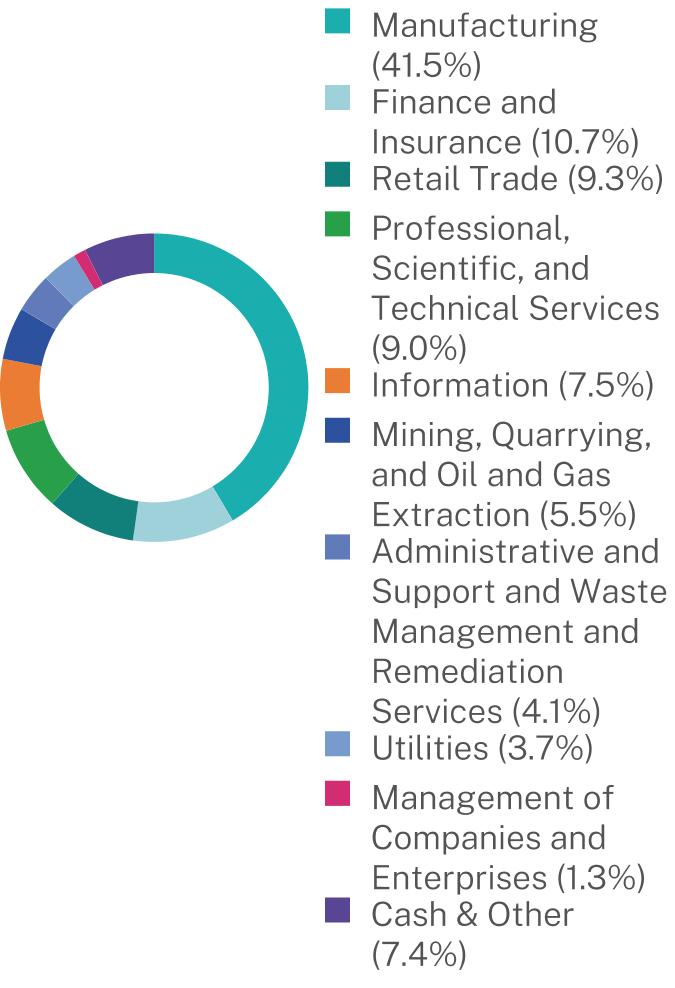
WHAT DID THE FUND INVEST IN? (as of December 31, 2025)*
Sector Breakdown (%)
|
Top 10 Issuers
|
(%)
|
|
NVIDIA Corp.
|
7.6%
|
|
First American Government Obligations Fund
|
7.4%
|
|
Microsoft Corp.
|
6.6%
|
|
Alphabet, Inc.
|
6.4%
|
|
Amazon.com, Inc.
|
5.8%
|
|
JPMorgan Chase & Co.
|
5.7%
|
|
Apple, Inc.
|
5.7%
|
|
Applied Materials, Inc.
|
3.6%
|
|
Intuitive Surgical, Inc.
|
2.7%
|
|
Honeywell International, Inc.
|
2.4%
|
| [1] |
|