Shareholder Report
Dec. 31, 2025
USD ($)
Holding
What were the Fund costs for the last year ?
(based on a hypothetical $10,000 investment)
| Class name | Costs of a $10,000 investment |
Costs paid as a percentage of a $10,000 investment |
| $99(a) | 0.93%(a) |
| Excludes fees and expenses incurred indirectly as a result of investments in underlying funds. |
How did the Fund perform last year ?
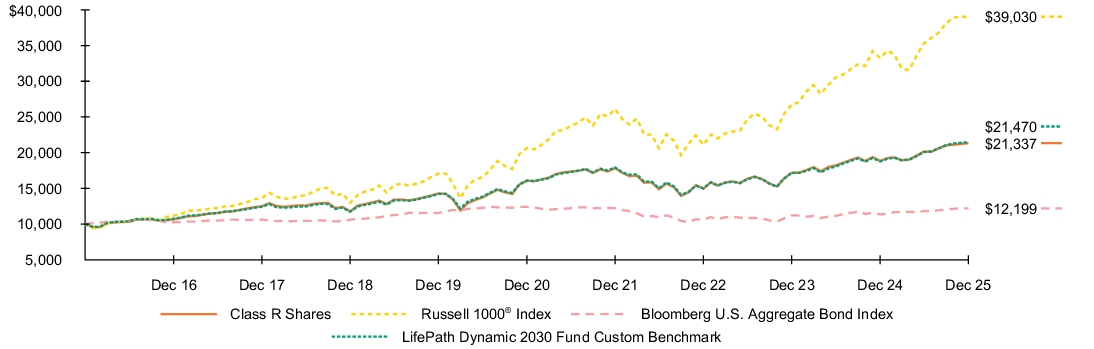
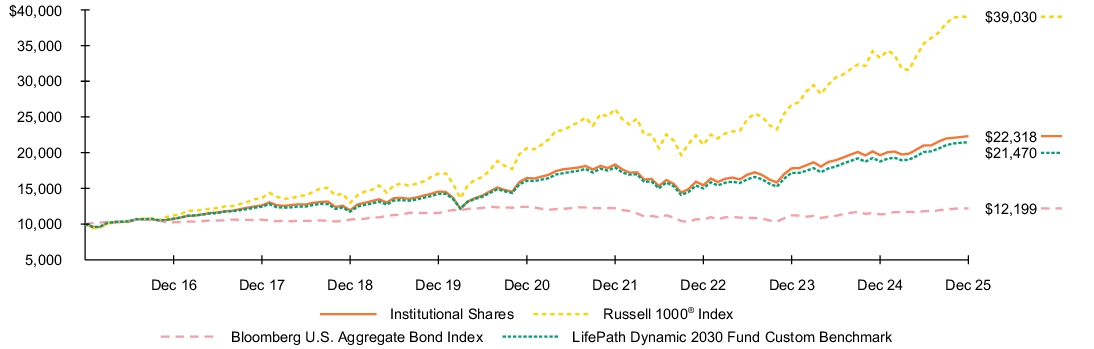
- For the reporting period ended December 31, 2025, the Fund’s Class R Shares returned 13.17%.
- For the same period, the Fund’s benchmark, the Russell 1000® Index returned 17.37% and the Bloomberg U.S. Aggregate Bond Index returned 7.30%. The LifePath Dynamic 2030 Fund Custom Benchmark returned 14.33%.
What contributed to performance?
U.S. equities were the top contributor to absolute performance in the funds furthest from retirement, followed by international equities, BlackRock Tactical Opportunities Fund (a liquid macro strategy), investment-grade bonds, and U.S. real estate investment trusts (REITs).
U.S. equities were the top contributor in the funds at and near retirement, followed by investment-grade bonds, international equities, U.S. Treasury Inflation Protected Securities (TIPS), global infrastructure stocks, and BlackRock Tactical Opportunities Fund.
The funds used derivatives, including financial futures, swaps, and foreign currency transactions, as a means to hedge and/or take outright views on equities, interest rates, credit risk, and/or currencies. The use of derivatives as opposed to physical securities did not have a material impact on performance.
What detracted from performance?
Currency positioning was the primary detractor from performance in the funds furthest from retirement.
In the vintages at and near retirement, currency pair trades were the primary detractor.
The views expressed reflect the opinions of BlackRock as of the date of this report and are subject to change based on changes in market, economic or other conditions. These views are not intended to be a forecast of future events and are no guarantee of future results.
Fund performance
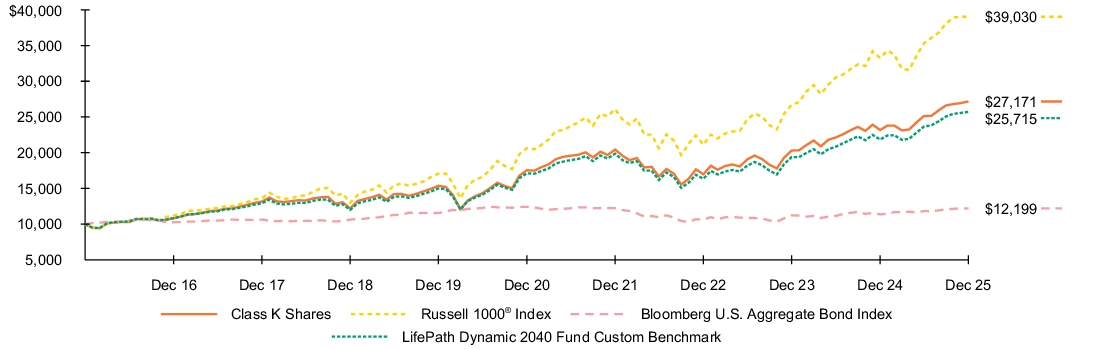
Cumulative performance: January 1, 2016 through December 31, 2025
Initial investment of $10,000
See “Average annual total returns” for additional information on fund performance.
| Average annual total returns | ||||||
| 1 Year | 5 Years | 10 Years | ||||
| 13.17 | % | 5.81 | % | 7.87 | % | |
| 17.37 | 13.59 | 14.59 | ||||
| 7.30 | (0.36 | ) | 2.01 | |||
| 14.33 | 5.95 | 7.94 |
The Fund compares its performance to that of a customized weighted index (the “LifePath Dynamic 2030 Fund Custom Benchmark”) comprised of the Bloomberg U.S. Intermediate Credit Bond Index, Bloomberg U.S. Intermediate Government Bond Index, Bloomberg U.S. Long Credit Bond Index, Bloomberg U.S. Long Government Bond Index, Bloomberg U.S. Securitized: MBS, ABS and CMBS Index, FTSE Nareit All Equity REIT Index, ICE® U.S. Treasury 0-5 Year Inflation Linked Bond Index, MSCI ACWI ex USA IMI Index (Net), Russell 1000® Index, Russell 2000® Index and S&P Global Infrastructure IndexTM (Net), which are representative of the asset classes in which the Fund invests. The weightings of the indices in the LifePath Dynamic 2030 Fund Custom Benchmark are adjusted periodically to reflect the investment adviser’s evaluation and adjustment of the Fund’s asset allocation strategy.
| Key Fund statistics | |
| $539,904,136 | |
| 39 | |
| $525,171 | |
| 19% |
What did the Fund invest in?
(as of December 31, 2025)
| Portfolio composition | ||
| Asset Type(a) | Percent of Net Assets |
|
| 55.5 | % | |
| 35.1 | ||
| 10.1 | ||
| (0.7 | ) | |
| Ten largest holdings | ||
| Security(b) | Percent of Net Assets |
|
| 30.4 | % | |
| 23.2 | ||
| 10.0 | ||
| 8.2 | ||
| 5.4 | ||
| 5.0 | ||
| 3.7 | ||
| 1.6 | ||
| 1.5 | ||
| 1.4 | ||
| The portfolio composition above is calculated using a methodology different than that disclosed in the Fund's prospectus. |
| Excludes short-term securities. |
| Ten largest holdings | ||
| Security(b) | Percent of Net Assets |
|
| 30.4 | % | |
| 23.2 | ||
| 10.0 | ||
| 8.2 | ||
| 5.4 | ||
| 5.0 | ||
| 3.7 | ||
| 1.6 | ||
| 1.5 | ||
| 1.4 | ||
What were the Fund costs for the last year ?
(based on a hypothetical $10,000 investment)
| Class name | Costs of a $10,000 investment |
Costs paid as a percentage of a $10,000 investment |
| $25(a) | 0.23%(a) |
| Excludes fees and expenses incurred indirectly as a result of investments in underlying funds. |
How did the Fund perform last year ?
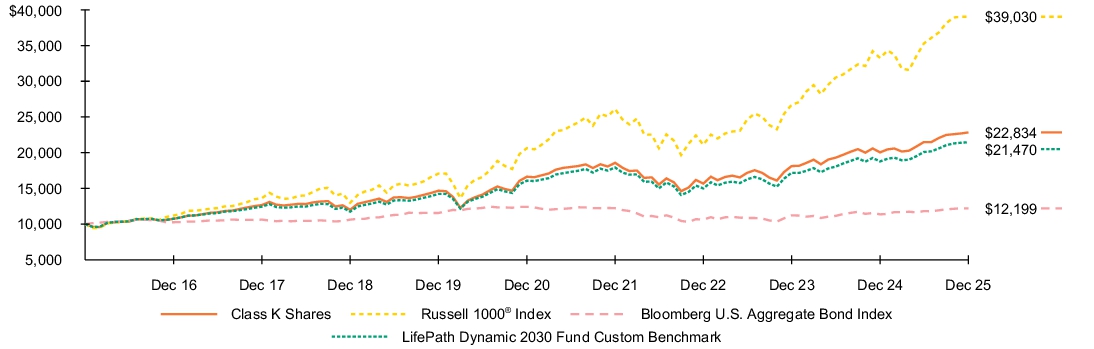
- For the reporting period ended December 31, 2025, the Fund’s Class K Shares returned 13.92%.
- For the same period, the Fund’s benchmark, the Russell 1000® Index returned 17.37% and the Bloomberg U.S. Aggregate Bond Index returned 7.30%. The LifePath Dynamic 2030 Fund Custom Benchmark returned 14.33%.
What contributed to performance?
U.S. equities were the top contributor to absolute performance in the funds furthest from retirement, followed by international equities, BlackRock Tactical Opportunities Fund (a liquid macro strategy), investment-grade bonds, and U.S. real estate investment trusts (REITs).
U.S. equities were the top contributor in the funds at and near retirement, followed by investment-grade bonds, international equities, U.S. Treasury Inflation Protected Securities (TIPS), global infrastructure stocks, and BlackRock Tactical Opportunities Fund.
The funds used derivatives, including financial futures, swaps, and foreign currency transactions, as a means to hedge and/or take outright views on equities, interest rates, credit risk, and/or currencies. The use of derivatives as opposed to physical securities did not have a material impact on performance.
What detracted from performance?
Currency positioning was the primary detractor from performance in the funds furthest from retirement.
In the vintages at and near retirement, currency pair trades were the primary detractor.
The views expressed reflect the opinions of BlackRock as of the date of this report and are subject to change based on changes in market, economic or other conditions. These views are not intended to be a forecast of future events and are no guarantee of future results.
Fund performance
Cumulative performance: January 1, 2016 through December 31, 2025
Initial investment of $10,000
See “Average annual total returns” for additional information on fund performance.
| Average annual total returns | ||||||
| 1 Year | 5 Years | 10 Years | ||||
| 13.92 | % | 6.54 | % | 8.61 | % | |
| 17.37 | 13.59 | 14.59 | ||||
| 7.30 | (0.36 | ) | 2.01 | |||
| 14.33 | 5.95 | 7.94 |
The Fund compares its performance to that of a customized weighted index (the “LifePath Dynamic 2030 Fund Custom Benchmark”) comprised of the Bloomberg U.S. Intermediate Credit Bond Index, Bloomberg U.S. Intermediate Government Bond Index, Bloomberg U.S. Long Credit Bond Index, Bloomberg U.S. Long Government Bond Index, Bloomberg U.S. Securitized: MBS, ABS and CMBS Index, FTSE Nareit All Equity REIT Index, ICE® U.S. Treasury 0-5 Year Inflation Linked Bond Index, MSCI ACWI ex USA IMI Index (Net), Russell 1000® Index, Russell 2000® Index and S&P Global Infrastructure IndexTM (Net), which are representative of the asset classes in which the Fund invests. The weightings of the indices in the LifePath Dynamic 2030 Fund Custom Benchmark are adjusted periodically to reflect the investment adviser’s evaluation and adjustment of the Fund’s asset allocation strategy.
| Key Fund statistics | |
| $539,904,136 | |
| 39 | |
| $525,171 | |
| 19% |
What did the Fund invest in?
(as of December 31, 2025)
| Portfolio composition | ||
| Asset Type(a) | Percent of Net Assets |
|
| 55.5 | % | |
| 35.1 | ||
| 10.1 | ||
| (0.7 | ) | |
| Ten largest holdings | ||
| Security(b) | Percent of Net Assets |
|
| 30.4 | % | |
| 23.2 | ||
| 10.0 | ||
| 8.2 | ||
| 5.4 | ||
| 5.0 | ||
| 3.7 | ||
| 1.6 | ||
| 1.5 | ||
| 1.4 | ||
| The portfolio composition above is calculated using a methodology different than that disclosed in the Fund's prospectus. |
| Excludes short-term securities. |
| Ten largest holdings | ||
| Security(b) | Percent of Net Assets |
|
| 30.4 | % | |
| 23.2 | ||
| 10.0 | ||
| 8.2 | ||
| 5.4 | ||
| 5.0 | ||
| 3.7 | ||
| 1.6 | ||
| 1.5 | ||
| 1.4 | ||
What were the Fund costs for the last year ?
(based on a hypothetical $10,000 investment)
| Class name | Costs of a $10,000 investment |
Costs paid as a percentage of a $10,000 investment |
| $157(a) | 1.48%(a) |
| Excludes fees and expenses incurred indirectly as a result of investments in underlying funds. |
How did the Fund perform last year ?
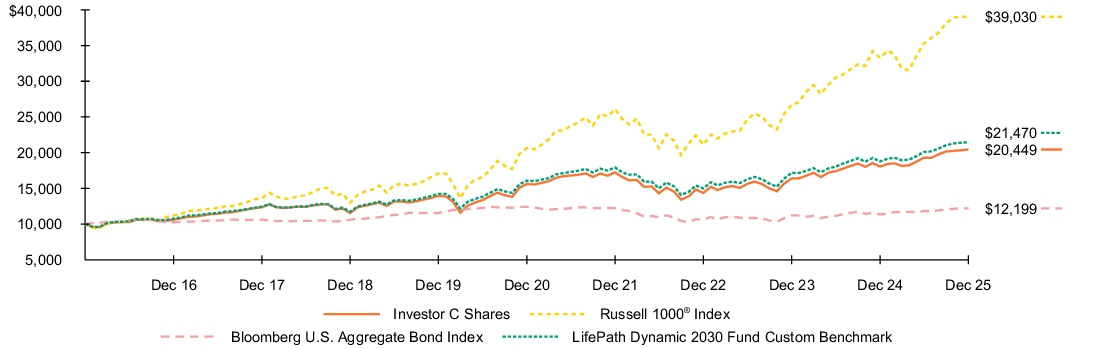
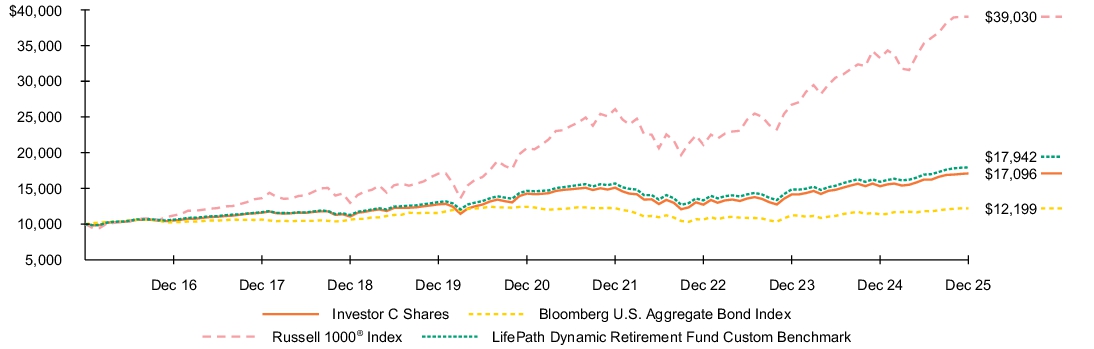
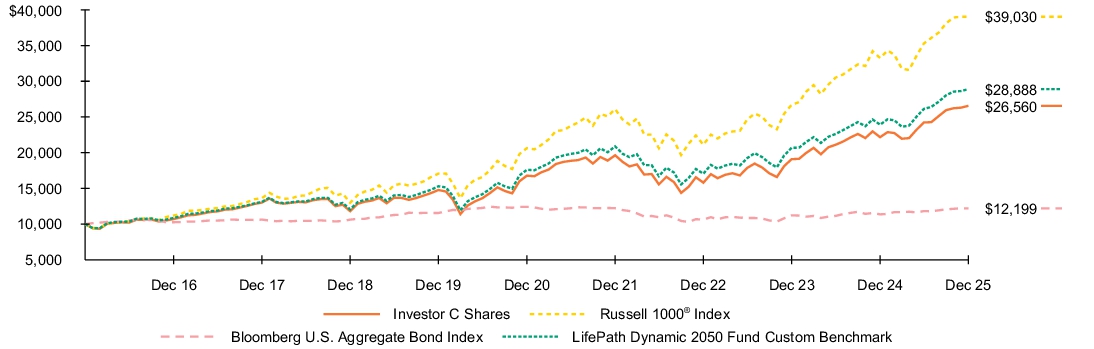
- For the reporting period ended December 31, 2025, the Fund’s Investor C Shares returned 12.51%.
- For the same period, the Fund’s benchmark, the Russell 1000® Index returned 17.37% and the Bloomberg U.S. Aggregate Bond Index returned 7.30%. The LifePath Dynamic 2030 Fund Custom Benchmark returned 14.33%.
What contributed to performance?
U.S. equities were the top contributor to absolute performance in the funds furthest from retirement, followed by international equities, BlackRock Tactical Opportunities Fund (a liquid macro strategy), investment-grade bonds, and U.S. real estate investment trusts (REITs).
U.S. equities were the top contributor in the funds at and near retirement, followed by investment-grade bonds, international equities, U.S. Treasury Inflation Protected Securities (TIPS), global infrastructure stocks, and BlackRock Tactical Opportunities Fund.
The funds used derivatives, including financial futures, swaps, and foreign currency transactions, as a means to hedge and/or take outright views on equities, interest rates, credit risk, and/or currencies. The use of derivatives as opposed to physical securities did not have a material impact on performance.
What detracted from performance?
Currency positioning was the primary detractor from performance in the funds furthest from retirement.
In the vintages at and near retirement, currency pair trades were the primary detractor.
The views expressed reflect the opinions of BlackRock as of the date of this report and are subject to change based on changes in market, economic or other conditions. These views are not intended to be a forecast of future events and are no guarantee of future results.
Fund performance
Cumulative performance: January 1, 2016 through December 31, 2025
Initial investment of $10,000
See “Average annual total returns” for additional information on fund performance.
| Average annual total returns | ||||||
| 1 Year | 5 Years | 10 Years | ||||
| 12.51 | % | 5.22 | % | 7.42 | % | |
| 11.51 | 5.22 | 7.42 | ||||
| 17.37 | 13.59 | 14.59 | ||||
| 7.30 | (0.36 | ) | 2.01 | |||
| 14.33 | 5.95 | 7.94 |
The Fund compares its performance to that of a customized weighted index (the “LifePath Dynamic 2030 Fund Custom Benchmark”) comprised of the Bloomberg U.S. Intermediate Credit Bond Index, Bloomberg U.S. Intermediate Government Bond Index, Bloomberg U.S. Long Credit Bond Index, Bloomberg U.S. Long Government Bond Index, Bloomberg U.S. Securitized: MBS, ABS and CMBS Index, FTSE Nareit All Equity REIT Index, ICE® U.S. Treasury 0-5 Year Inflation Linked Bond Index, MSCI ACWI ex USA IMI Index (Net), Russell 1000® Index, Russell 2000® Index and S&P Global Infrastructure IndexTM (Net), which are representative of the asset classes in which the Fund invests. The weightings of the indices in the LifePath Dynamic 2030 Fund Custom Benchmark are adjusted periodically to reflect the investment adviser’s evaluation and adjustment of the Fund’s asset allocation strategy.
| Key Fund statistics | |
| $539,904,136 | |
| 39 | |
| $525,171 | |
| 19% |
What did the Fund invest in?
(as of December 31, 2025)
| Portfolio composition | ||
| Asset Type(a) | Percent of Net Assets |
|
| 55.5 | % | |
| 35.1 | ||
| 10.1 | ||
| (0.7 | ) | |
| Ten largest holdings | ||
| Security(b) | Percent of Net Assets |
|
| 30.4 | % | |
| 23.2 | ||
| 10.0 | ||
| 8.2 | ||
| 5.4 | ||
| 5.0 | ||
| 3.7 | ||
| 1.6 | ||
| 1.5 | ||
| 1.4 | ||
| The portfolio composition above is calculated using a methodology different than that disclosed in the Fund's prospectus. |
| Excludes short-term securities. |
| Ten largest holdings | ||
| Security(b) | Percent of Net Assets |
|
| 30.4 | % | |
| 23.2 | ||
| 10.0 | ||
| 8.2 | ||
| 5.4 | ||
| 5.0 | ||
| 3.7 | ||
| 1.6 | ||
| 1.5 | ||
| 1.4 | ||
What were the Fund costs for the last year ?
(based on a hypothetical $10,000 investment)
| Class name | Costs of a $10,000 investment |
Costs paid as a percentage of a $10,000 investment |
| $78(a) | 0.73%(a) |
| Excludes fees and expenses incurred indirectly as a result of investments in underlying funds. |
How did the Fund perform last year ?
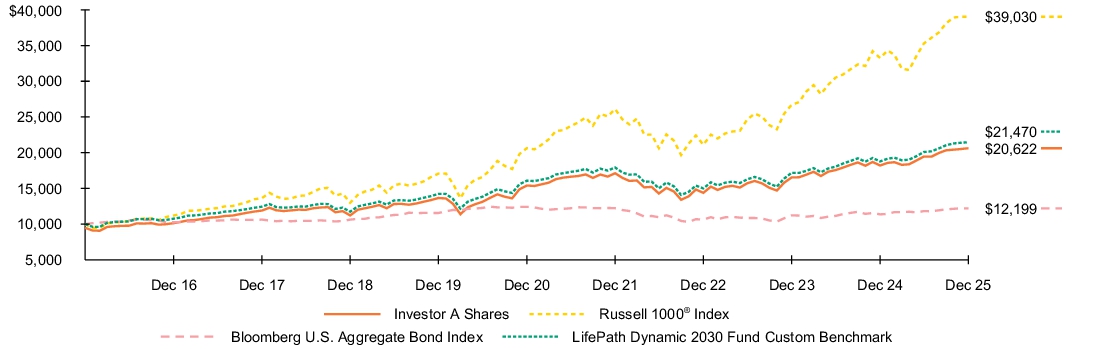
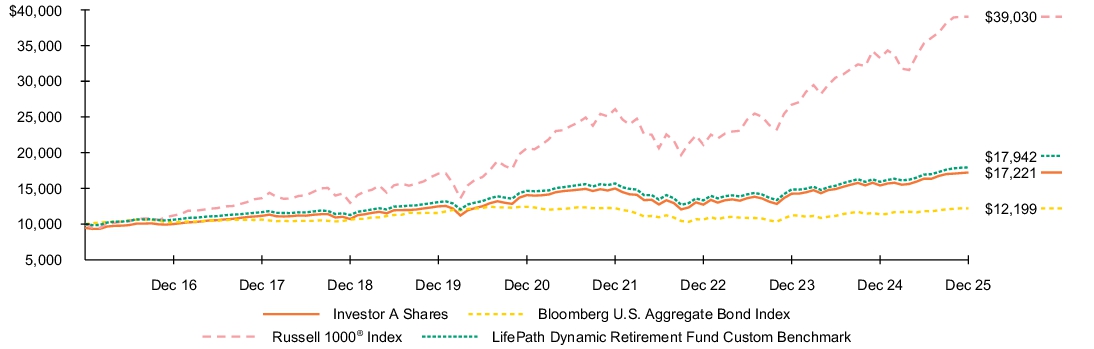
- For the reporting period ended December 31, 2025, the Fund’s Investor A Shares returned 13.27%.
- For the same period, the Fund’s benchmark, the Russell 1000® Index returned 17.37% and the Bloomberg U.S. Aggregate Bond Index returned 7.30%. The LifePath Dynamic 2030 Fund Custom Benchmark returned 14.33%.
What contributed to performance?
U.S. equities were the top contributor to absolute performance in the funds furthest from retirement, followed by international equities, BlackRock Tactical Opportunities Fund (a liquid macro strategy), investment-grade bonds, and U.S. real estate investment trusts (REITs).
U.S. equities were the top contributor in the funds at and near retirement, followed by investment-grade bonds, international equities, U.S. Treasury Inflation Protected Securities (TIPS), global infrastructure stocks, and BlackRock Tactical Opportunities Fund.
The funds used derivatives, including financial futures, swaps, and foreign currency transactions, as a means to hedge and/or take outright views on equities, interest rates, credit risk, and/or currencies. The use of derivatives as opposed to physical securities did not have a material impact on performance.
What detracted from performance?
Currency positioning was the primary detractor from performance in the funds furthest from retirement.
In the vintages at and near retirement, currency pair trades were the primary detractor.
The views expressed reflect the opinions of BlackRock as of the date of this report and are subject to change based on changes in market, economic or other conditions. These views are not intended to be a forecast of future events and are no guarantee of future results.
Fund performance
Cumulative performance: January 1, 2016 through December 31, 2025
Initial investment of $10,000
See “Average annual total returns” for additional information on fund performance.
| Average annual total returns | ||||||
| 1 Year | 5 Years | 10 Years | ||||
| 13.27 | % | 6.01 | % | 8.09 | % | |
| 7.32 | 4.87 | 7.51 | ||||
| 17.37 | 13.59 | 14.59 | ||||
| 7.30 | (0.36 | ) | 2.01 | |||
| 14.33 | 5.95 | 7.94 |
The Fund compares its performance to that of a customized weighted index (the “LifePath Dynamic 2030 Fund Custom Benchmark”) comprised of the Bloomberg U.S. Intermediate Credit Bond Index, Bloomberg U.S. Intermediate Government Bond Index, Bloomberg U.S. Long Credit Bond Index, Bloomberg U.S. Long Government Bond Index, Bloomberg U.S. Securitized: MBS, ABS and CMBS Index, FTSE Nareit All Equity REIT Index, ICE® U.S. Treasury 0-5 Year Inflation Linked Bond Index, MSCI ACWI ex USA IMI Index (Net), Russell 1000® Index, Russell 2000® Index and S&P Global Infrastructure IndexTM (Net), which are representative of the asset classes in which the Fund invests. The weightings of the indices in the LifePath Dynamic 2030 Fund Custom Benchmark are adjusted periodically to reflect the investment adviser’s evaluation and adjustment of the Fund’s asset allocation strategy.
| Key Fund statistics | |
| $539,904,136 | |
| 39 | |
| $525,171 | |
| 19% |
What did the Fund invest in?
(as of December 31, 2025)
| Portfolio composition | ||
| Asset Type(a) | Percent of Net Assets |
|
| 55.5 | % | |
| 35.1 | ||
| 10.1 | ||
| (0.7 | ) | |
| Ten largest holdings | ||
| Security(b) | Percent of Net Assets |
|
| 30.4 | % | |
| 23.2 | ||
| 10.0 | ||
| 8.2 | ||
| 5.4 | ||
| 5.0 | ||
| 3.7 | ||
| 1.6 | ||
| 1.5 | ||
| 1.4 | ||
| The portfolio composition above is calculated using a methodology different than that disclosed in the Fund's prospectus. |
| Excludes short-term securities. |
| Ten largest holdings | ||
| Security(b) | Percent of Net Assets |
|
| 30.4 | % | |
| 23.2 | ||
| 10.0 | ||
| 8.2 | ||
| 5.4 | ||
| 5.0 | ||
| 3.7 | ||
| 1.6 | ||
| 1.5 | ||
| 1.4 | ||
What were the Fund costs for the last year ?
(based on a hypothetical $10,000 investment)
| Class name | Costs of a $10,000 investment |
Costs paid as a percentage of a $10,000 investment |
| $51(a) | 0.48%(a) |
| Excludes fees and expenses incurred indirectly as a result of investments in underlying funds. |
How did the Fund perform last year ?
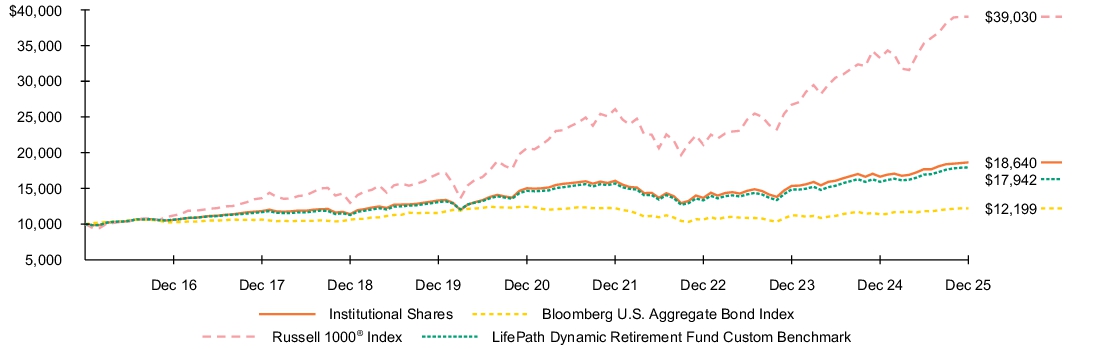
- For the reporting period ended December 31, 2025, the Fund’s Institutional Shares returned 13.60%.
- For the same period, the Fund’s benchmark, the Russell 1000® Index returned 17.37% and the Bloomberg U.S. Aggregate Bond Index returned 7.30%. The LifePath Dynamic 2030 Fund Custom Benchmark returned 14.33%.
What contributed to performance?
U.S. equities were the top contributor to absolute performance in the funds furthest from retirement, followed by international equities, BlackRock Tactical Opportunities Fund (a liquid macro strategy), investment-grade bonds, and U.S. real estate investment trusts (REITs).
U.S. equities were the top contributor in the funds at and near retirement, followed by investment-grade bonds, international equities, U.S. Treasury Inflation Protected Securities (TIPS), global infrastructure stocks, and BlackRock Tactical Opportunities Fund.
The funds used derivatives, including financial futures, swaps, and foreign currency transactions, as a means to hedge and/or take outright views on equities, interest rates, credit risk, and/or currencies. The use of derivatives as opposed to physical securities did not have a material impact on performance.
What detracted from performance?
Currency positioning was the primary detractor from performance in the funds furthest from retirement.
In the vintages at and near retirement, currency pair trades were the primary detractor.
The views expressed reflect the opinions of BlackRock as of the date of this report and are subject to change based on changes in market, economic or other conditions. These views are not intended to be a forecast of future events and are no guarantee of future results.
Fund performance
Cumulative performance: January 1, 2016 through December 31, 2025
Initial investment of $10,000
See “Average annual total returns” for additional information on fund performance.
| Average annual total returns | ||||||
| 1 Year | 5 Years | 10 Years | ||||
| 13.60 | % | 6.28 | % | 8.36 | % | |
| 17.37 | 13.59 | 14.59 | ||||
| 7.30 | (0.36 | ) | 2.01 | |||
| 14.33 | 5.95 | 7.94 |
The Fund compares its performance to that of a customized weighted index (the “LifePath Dynamic 2030 Fund Custom Benchmark”) comprised of the Bloomberg U.S. Intermediate Credit Bond Index, Bloomberg U.S. Intermediate Government Bond Index, Bloomberg U.S. Long Credit Bond Index, Bloomberg U.S. Long Government Bond Index, Bloomberg U.S. Securitized: MBS, ABS and CMBS Index, FTSE Nareit All Equity REIT Index, ICE® U.S. Treasury 0-5 Year Inflation Linked Bond Index, MSCI ACWI ex USA IMI Index (Net), Russell 1000® Index, Russell 2000® Index and S&P Global Infrastructure IndexTM (Net), which are representative of the asset classes in which the Fund invests. The weightings of the indices in the LifePath Dynamic 2030 Fund Custom Benchmark are adjusted periodically to reflect the investment adviser’s evaluation and adjustment of the Fund’s asset allocation strategy.
| Key Fund statistics | |
| $539,904,136 | |
| 39 | |
| $525,171 | |
| 19% |
What did the Fund invest in?
(as of December 31, 2025)
| Portfolio composition | ||
| Asset Type(a) | Percent of Net Assets |
|
| 55.5 | % | |
| 35.1 | ||
| 10.1 | ||
| (0.7 | ) | |
| Ten largest holdings | ||
| Security(b) | Percent of Net Assets |
|
| 30.4 | % | |
| 23.2 | ||
| 10.0 | ||
| 8.2 | ||
| 5.4 | ||
| 5.0 | ||
| 3.7 | ||
| 1.6 | ||
| 1.5 | ||
| 1.4 | ||
| The portfolio composition above is calculated using a methodology different than that disclosed in the Fund's prospectus. |
| Excludes short-term securities. |
| Ten largest holdings | ||
| Security(b) | Percent of Net Assets |
|
| 30.4 | % | |
| 23.2 | ||
| 10.0 | ||
| 8.2 | ||
| 5.4 | ||
| 5.0 | ||
| 3.7 | ||
| 1.6 | ||
| 1.5 | ||
| 1.4 | ||
What were the Fund costs for the last year ?
(based on a hypothetical $10,000 investment)
| Class name | Costs of a $10,000 investment |
Costs paid as a percentage of a $10,000 investment |
| $51(a) | 0.47%(a) |
| Excludes fees and expenses incurred indirectly as a result of investments in underlying funds. |
How did the Fund perform last year ?
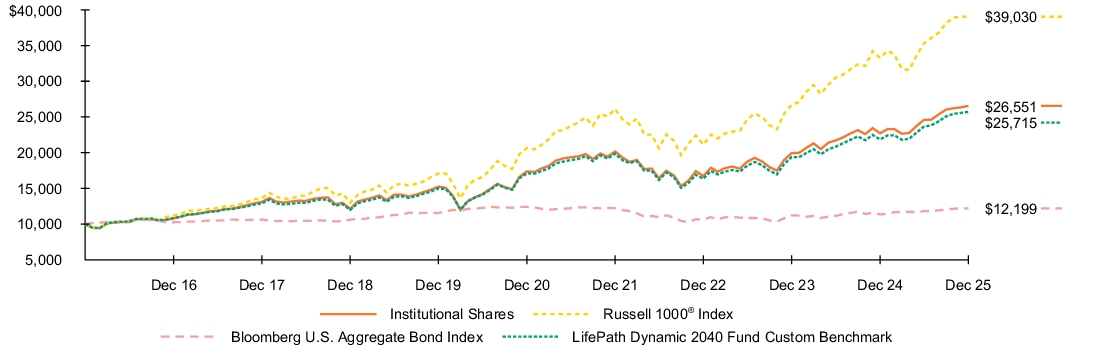
- For the reporting period ended December 31, 2025, the Fund’s Institutional Shares returned 16.88%.
- For the same period, the Fund’s benchmark, the Russell 1000® Index returned 17.37% and the Bloomberg U.S. Aggregate Bond Index returned 7.30%. The LifePath Dynamic 2040 Fund Custom Benchmark returned 17.67%.
What contributed to performance?
U.S. equities were the top contributor to absolute performance in the funds furthest from retirement, followed by international equities, BlackRock Tactical Opportunities Fund (a liquid macro strategy), investment-grade bonds, and U.S. real estate investment trusts (REITs).
U.S. equities were the top contributor in the funds at and near retirement, followed by investment-grade bonds, international equities, U.S. Treasury Inflation Protected Securities (TIPS), global infrastructure stocks, and BlackRock Tactical Opportunities Fund.
The funds used derivatives, including financial futures, swaps, and foreign currency transactions, as a means to hedge and/or take outright views on equities, interest rates, credit risk, and/or currencies. The use of derivatives as opposed to physical securities did not have a material impact on performance.
What detracted from performance?
Currency positioning was the primary detractor from performance in the funds furthest from retirement.
In the vintages at and near retirement, currency pair trades were the primary detractor.
The views expressed reflect the opinions of BlackRock as of the date of this report and are subject to change based on changes in market, economic or other conditions. These views are not intended to be a forecast of future events and are no guarantee of future results.
Fund performance
Cumulative performance: January 1, 2016 through December 31, 2025
Initial investment of $10,000
See “Average annual total returns” for additional information on fund performance.
| Average annual total returns | ||||||
| 1 Year | 5 Years | 10 Years | ||||
| 16.88 | % | 8.84 | % | 10.26 | % | |
| 17.37 | 13.59 | 14.59 | ||||
| 7.30 | (0.36 | ) | 2.01 | |||
| 17.67 | 8.48 | 9.91 |
The Fund compares its performance to that of a customized weighted index (the “LifePath Dynamic 2040 Fund Custom Benchmark”) comprised of the Bloomberg U.S. Intermediate Credit Bond Index, Bloomberg U.S. Intermediate Government Bond Index, Bloomberg U.S. Long Credit Bond Index, Bloomberg U.S. Long Government Bond Index, Bloomberg U.S. Securitized: MBS, ABS and CMBS Index, FTSE Nareit All Equity REIT Index, ICE® U.S. Treasury 0-5 Year Inflation Linked Bond Index, MSCI ACWI ex USA IMI Index (Net), Russell 1000® Index, Russell 2000® Index and S&P Global Infrastructure IndexTM (Net), which are representative of the asset classes in which the Fund invests. The weightings of the indices in the LifePath Dynamic 2040 Fund Custom Benchmark are adjusted periodically to reflect the investment adviser’s evaluation and adjustment of the Fund’s asset allocation strategy.
| Key Fund statistics | |
| $561,532,960 | |
| 36 | |
| $369,204 | |
| 16% |
What did the Fund invest in?
(as of December 31, 2025)
| Portfolio composition | ||
| Asset Type(a) | Percent of Net Assets |
|
| 73.0 | % | |
| 19.8 | ||
| 10.8 | ||
| (3.6 | ) | |
| Ten largest holdings | ||
| Security(b) | Percent of Net Assets |
|
| 37.9 | % | |
| 15.2 | ||
| 15.2 | ||
| 7.6 | ||
| 4.8 | ||
| 4.4 | ||
| 2.9 | ||
| 2.2 | ||
| 1.9 | ||
| 0.5 | ||
| The portfolio composition above is calculated using a methodology different than that disclosed in the Fund's prospectus. |
| Excludes short-term securities. |
| Ten largest holdings | ||
| Security(b) | Percent of Net Assets |
|
| 37.9 | % | |
| 15.2 | ||
| 15.2 | ||
| 7.6 | ||
| 4.8 | ||
| 4.4 | ||
| 2.9 | ||
| 2.2 | ||
| 1.9 | ||
| 0.5 | ||
What were the Fund costs for the last year ?
(based on a hypothetical $10,000 investment)
| Class name | Costs of a $10,000 investment |
Costs paid as a percentage of a $10,000 investment |
| $78(a) | 0.72%(a) |
| Excludes fees and expenses incurred indirectly as a result of investments in underlying funds. |
How did the Fund perform last year ?
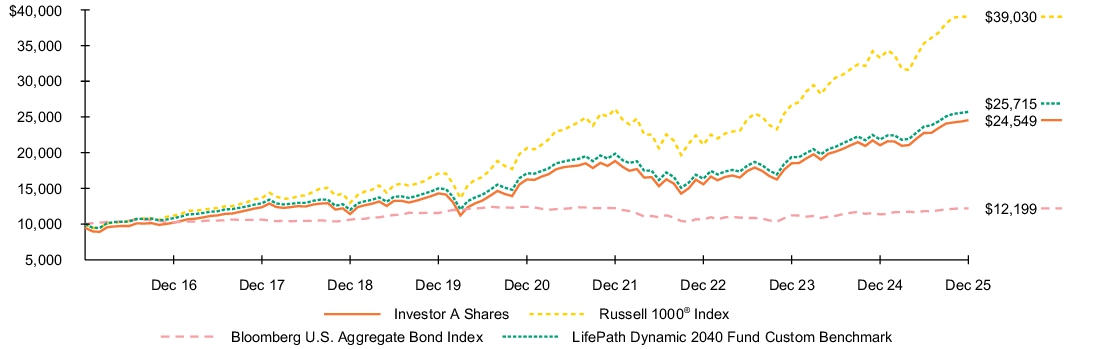
- For the reporting period ended December 31, 2025, the Fund’s Investor A Shares returned 16.67%.
- For the same period, the Fund’s benchmark, the Russell 1000® Index returned 17.37% and the Bloomberg U.S. Aggregate Bond Index returned 7.30%. The LifePath Dynamic 2040 Fund Custom Benchmark returned 17.67%.
What contributed to performance?
U.S. equities were the top contributor to absolute performance in the funds furthest from retirement, followed by international equities, BlackRock Tactical Opportunities Fund (a liquid macro strategy), investment-grade bonds, and U.S. real estate investment trusts (REITs).
U.S. equities were the top contributor in the funds at and near retirement, followed by investment-grade bonds, international equities, U.S. Treasury Inflation Protected Securities (TIPS), global infrastructure stocks, and BlackRock Tactical Opportunities Fund.
The funds used derivatives, including financial futures, swaps, and foreign currency transactions, as a means to hedge and/or take outright views on equities, interest rates, credit risk, and/or currencies. The use of derivatives as opposed to physical securities did not have a material impact on performance.
What detracted from performance?
Currency positioning was the primary detractor from performance in the funds furthest from retirement.
In the vintages at and near retirement, currency pair trades were the primary detractor.
The views expressed reflect the opinions of BlackRock as of the date of this report and are subject to change based on changes in market, economic or other conditions. These views are not intended to be a forecast of future events and are no guarantee of future results.
Fund performance
Cumulative performance: January 1, 2016 through December 31, 2025
Initial investment of $10,000
See “Average annual total returns” for additional information on fund performance.
| Average annual total returns | ||||||
| 1 Year | 5 Years | 10 Years | ||||
| 16.67 | % | 8.59 | % | 9.99 | % | |
| 10.55 | 7.42 | 9.40 | ||||
| 17.37 | 13.59 | 14.59 | ||||
| 7.30 | (0.36 | ) | 2.01 | |||
| 17.67 | 8.48 | 9.91 |
The Fund compares its performance to that of a customized weighted index (the “LifePath Dynamic 2040 Fund Custom Benchmark”) comprised of the Bloomberg U.S. Intermediate Credit Bond Index, Bloomberg U.S. Intermediate Government Bond Index, Bloomberg U.S. Long Credit Bond Index, Bloomberg U.S. Long Government Bond Index, Bloomberg U.S. Securitized: MBS, ABS and CMBS Index, FTSE Nareit All Equity REIT Index, ICE® U.S. Treasury 0-5 Year Inflation Linked Bond Index, MSCI ACWI ex USA IMI Index (Net), Russell 1000® Index, Russell 2000® Index and S&P Global Infrastructure IndexTM (Net), which are representative of the asset classes in which the Fund invests. The weightings of the indices in the LifePath Dynamic 2040 Fund Custom Benchmark are adjusted periodically to reflect the investment adviser’s evaluation and adjustment of the Fund’s asset allocation strategy.
| Key Fund statistics | |
| $561,532,960 | |
| 36 | |
| $369,204 | |
| 16% |
What did the Fund invest in?
(as of December 31, 2025)
| Portfolio composition | ||
| Asset Type(a) | Percent of Net Assets |
|
| 73.0 | % | |
| 19.8 | ||
| 10.8 | ||
| (3.6 | ) | |
| Ten largest holdings | ||
| Security(b) | Percent of Net Assets |
|
| 37.9 | % | |
| 15.2 | ||
| 15.2 | ||
| 7.6 | ||
| 4.8 | ||
| 4.4 | ||
| 2.9 | ||
| 2.2 | ||
| 1.9 | ||
| 0.5 | ||
| The portfolio composition above is calculated using a methodology different than that disclosed in the Fund's prospectus. |
| Excludes short-term securities. |
| Ten largest holdings | ||
| Security(b) | Percent of Net Assets |
|
| 37.9 | % | |
| 15.2 | ||
| 15.2 | ||
| 7.6 | ||
| 4.8 | ||
| 4.4 | ||
| 2.9 | ||
| 2.2 | ||
| 1.9 | ||
| 0.5 | ||
What were the Fund costs for the last year ?
(based on a hypothetical $10,000 investment)
| Class name | Costs of a $10,000 investment |
Costs paid as a percentage of a $10,000 investment |
| $159(a) | 1.47%(a) |
| Excludes fees and expenses incurred indirectly as a result of investments in underlying funds. |
How did the Fund perform last year ?
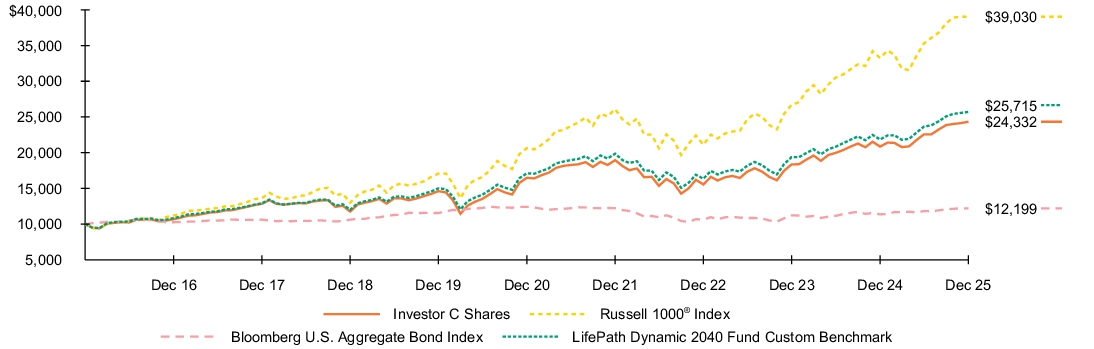
- For the reporting period ended December 31, 2025, the Fund’s Investor C Shares returned 15.70%.
- For the same period, the Fund’s benchmark, the Russell 1000® Index returned 17.37% and the Bloomberg U.S. Aggregate Bond Index returned 7.30%. The LifePath Dynamic 2040 Fund Custom Benchmark returned 17.67%.
What contributed to performance?
U.S. equities were the top contributor to absolute performance in the funds furthest from retirement, followed by international equities, BlackRock Tactical Opportunities Fund (a liquid macro strategy), investment-grade bonds, and U.S. real estate investment trusts (REITs).
U.S. equities were the top contributor in the funds at and near retirement, followed by investment-grade bonds, international equities, U.S. Treasury Inflation Protected Securities (TIPS), global infrastructure stocks, and BlackRock Tactical Opportunities Fund.
The funds used derivatives, including financial futures, swaps, and foreign currency transactions, as a means to hedge and/or take outright views on equities, interest rates, credit risk, and/or currencies. The use of derivatives as opposed to physical securities did not have a material impact on performance.
What detracted from performance?
Currency positioning was the primary detractor from performance in the funds furthest from retirement.
In the vintages at and near retirement, currency pair trades were the primary detractor.
The views expressed reflect the opinions of BlackRock as of the date of this report and are subject to change based on changes in market, economic or other conditions. These views are not intended to be a forecast of future events and are no guarantee of future results.
Fund performance
Cumulative performance: January 1, 2016 through December 31, 2025
Initial investment of $10,000
See “Average annual total returns” for additional information on fund performance.
| Average annual total returns | ||||||
| 1 Year | 5 Years | 10 Years | ||||
| 15.70 | % | 7.77 | % | 9.30 | % | |
| 14.70 | 7.77 | 9.30 | ||||
| 17.37 | 13.59 | 14.59 | ||||
| 7.30 | (0.36 | ) | 2.01 | |||
| 17.67 | 8.48 | 9.91 |
The Fund compares its performance to that of a customized weighted index (the “LifePath Dynamic 2040 Fund Custom Benchmark”) comprised of the Bloomberg U.S. Intermediate Credit Bond Index, Bloomberg U.S. Intermediate Government Bond Index, Bloomberg U.S. Long Credit Bond Index, Bloomberg U.S. Long Government Bond Index, Bloomberg U.S. Securitized: MBS, ABS and CMBS Index, FTSE Nareit All Equity REIT Index, ICE® U.S. Treasury 0-5 Year Inflation Linked Bond Index, MSCI ACWI ex USA IMI Index (Net), Russell 1000® Index, Russell 2000® Index and S&P Global Infrastructure IndexTM (Net), which are representative of the asset classes in which the Fund invests. The weightings of the indices in the LifePath Dynamic 2040 Fund Custom Benchmark are adjusted periodically to reflect the investment adviser’s evaluation and adjustment of the Fund’s asset allocation strategy.
| Key Fund statistics | |
| $561,532,960 | |
| 36 | |
| $369,204 | |
| 16% |
What did the Fund invest in?
(as of December 31, 2025)
| Portfolio composition | ||
| Asset Type(a) | Percent of Net Assets |
|
| 73.0 | % | |
| 19.8 | ||
| 10.8 | ||
| (3.6 | ) | |
| Ten largest holdings | ||
| Security(b) | Percent of Net Assets |
|
| 37.9 | % | |
| 15.2 | ||
| 15.2 | ||
| 7.6 | ||
| 4.8 | ||
| 4.4 | ||
| 2.9 | ||
| 2.2 | ||
| 1.9 | ||
| 0.5 | ||
| The portfolio composition above is calculated using a methodology different than that disclosed in the Fund's prospectus. |
| Excludes short-term securities. |
| Ten largest holdings | ||
| Security(b) | Percent of Net Assets |
|
| 37.9 | % | |
| 15.2 | ||
| 15.2 | ||
| 7.6 | ||
| 4.8 | ||
| 4.4 | ||
| 2.9 | ||
| 2.2 | ||
| 1.9 | ||
| 0.5 | ||
What were the Fund costs for the last year ?
(based on a hypothetical $10,000 investment)
| Class name | Costs of a $10,000 investment |
Costs paid as a percentage of a $10,000 investment |
| $24(a) | 0.22%(a) |
| Excludes fees and expenses incurred indirectly as a result of investments in underlying funds. |
How did the Fund perform last year ?
- For the reporting period ended December 31, 2025, the Fund’s Class K Shares returned 17.23%.
- For the same period, the Fund’s benchmark, the Russell 1000® Index returned 17.37% and the Bloomberg U.S. Aggregate Bond Index returned 7.30%. The LifePath Dynamic 2040 Fund Custom Benchmark returned 17.67%.
What contributed to performance?
U.S. equities were the top contributor to absolute performance in the funds furthest from retirement, followed by international equities, BlackRock Tactical Opportunities Fund (a liquid macro strategy), investment-grade bonds, and U.S. real estate investment trusts (REITs).
U.S. equities were the top contributor in the funds at and near retirement, followed by investment-grade bonds, international equities, U.S. Treasury Inflation Protected Securities (TIPS), global infrastructure stocks, and BlackRock Tactical Opportunities Fund.
The funds used derivatives, including financial futures, swaps, and foreign currency transactions, as a means to hedge and/or take outright views on equities, interest rates, credit risk, and/or currencies. The use of derivatives as opposed to physical securities did not have a material impact on performance.
What detracted from performance?
Currency positioning was the primary detractor from performance in the funds furthest from retirement.
In the vintages at and near retirement, currency pair trades were the primary detractor.
The views expressed reflect the opinions of BlackRock as of the date of this report and are subject to change based on changes in market, economic or other conditions. These views are not intended to be a forecast of future events and are no guarantee of future results.
Fund performance
Cumulative performance: January 1, 2016 through December 31, 2025
Initial investment of $10,000
See “Average annual total returns” for additional information on fund performance.
| Average annual total returns | ||||||
| 1 Year | 5 Years | 10 Years | ||||
| 17.23 | % | 9.13 | % | 10.51 | % | |
| 17.37 | 13.59 | 14.59 | ||||
| 7.30 | (0.36 | ) | 2.01 | |||
| 17.67 | 8.48 | 9.91 |
The Fund compares its performance to that of a customized weighted index (the “LifePath Dynamic 2040 Fund Custom Benchmark”) comprised of the Bloomberg U.S. Intermediate Credit Bond Index, Bloomberg U.S. Intermediate Government Bond Index, Bloomberg U.S. Long Credit Bond Index, Bloomberg U.S. Long Government Bond Index, Bloomberg U.S. Securitized: MBS, ABS and CMBS Index, FTSE Nareit All Equity REIT Index, ICE® U.S. Treasury 0-5 Year Inflation Linked Bond Index, MSCI ACWI ex USA IMI Index (Net), Russell 1000® Index, Russell 2000® Index and S&P Global Infrastructure IndexTM (Net), which are representative of the asset classes in which the Fund invests. The weightings of the indices in the LifePath Dynamic 2040 Fund Custom Benchmark are adjusted periodically to reflect the investment adviser’s evaluation and adjustment of the Fund’s asset allocation strategy.
| Key Fund statistics | |
| $561,532,960 | |
| 36 | |
| $369,204 | |
| 16% |
What did the Fund invest in?
(as of December 31, 2025)
| Portfolio composition | ||
| Asset Type(a) | Percent of Net Assets |
|
| 73.0 | % | |
| 19.8 | ||
| 10.8 | ||
| (3.6 | ) | |
| Ten largest holdings | ||
| Security(b) | Percent of Net Assets |
|
| 37.9 | % | |
| 15.2 | ||
| 15.2 | ||
| 7.6 | ||
| 4.8 | ||
| 4.4 | ||
| 2.9 | ||
| 2.2 | ||
| 1.9 | ||
| 0.5 | ||
| The portfolio composition above is calculated using a methodology different than that disclosed in the Fund's prospectus. |
| Excludes short-term securities. |
| Ten largest holdings | ||
| Security(b) | Percent of Net Assets |
|
| 37.9 | % | |
| 15.2 | ||
| 15.2 | ||
| 7.6 | ||
| 4.8 | ||
| 4.4 | ||
| 2.9 | ||
| 2.2 | ||
| 1.9 | ||
| 0.5 | ||
What were the Fund costs for the last year ?
(based on a hypothetical $10,000 investment)
| Class name | Costs of a $10,000 investment |
Costs paid as a percentage of a $10,000 investment |
| $100(a) | 0.92%(a) |
| Excludes fees and expenses incurred indirectly as a result of investments in underlying funds. |
How did the Fund perform last year ?
- For the reporting period ended December 31, 2025, the Fund’s Class R Shares returned 16.41%.
- For the same period, the Fund’s benchmark, the Russell 1000® Index returned 17.37% and the Bloomberg U.S. Aggregate Bond Index returned 7.30%. The LifePath Dynamic 2040 Fund Custom Benchmark returned 17.67%.
What contributed to performance?
U.S. equities were the top contributor to absolute performance in the funds furthest from retirement, followed by international equities, BlackRock Tactical Opportunities Fund (a liquid macro strategy), investment-grade bonds, and U.S. real estate investment trusts (REITs).
U.S. equities were the top contributor in the funds at and near retirement, followed by investment-grade bonds, international equities, U.S. Treasury Inflation Protected Securities (TIPS), global infrastructure stocks, and BlackRock Tactical Opportunities Fund.
The funds used derivatives, including financial futures, swaps, and foreign currency transactions, as a means to hedge and/or take outright views on equities, interest rates, credit risk, and/or currencies. The use of derivatives as opposed to physical securities did not have a material impact on performance.
What detracted from performance?
Currency positioning was the primary detractor from performance in the funds furthest from retirement.
In the vintages at and near retirement, currency pair trades were the primary detractor.
The views expressed reflect the opinions of BlackRock as of the date of this report and are subject to change based on changes in market, economic or other conditions. These views are not intended to be a forecast of future events and are no guarantee of future results.
Fund performance
Cumulative performance: January 1, 2016 through December 31, 2025
Initial investment of $10,000
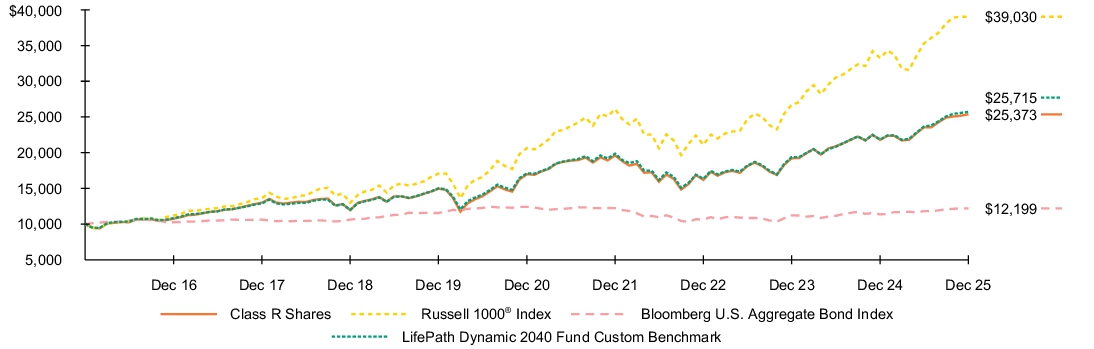
See “Average annual total returns” for additional information on fund performance.
| Average annual total returns | ||||||
| 1 Year | 5 Years | 10 Years | ||||
| 16.41 | % | 8.36 | % | 9.76 | % | |
| 17.37 | 13.59 | 14.59 | ||||
| 7.30 | (0.36 | ) | 2.01 | |||
| 17.67 | 8.48 | 9.91 |
The Fund compares its performance to that of a customized weighted index (the “LifePath Dynamic 2040 Fund Custom Benchmark”) comprised of the Bloomberg U.S. Intermediate Credit Bond Index, Bloomberg U.S. Intermediate Government Bond Index, Bloomberg U.S. Long Credit Bond Index, Bloomberg U.S. Long Government Bond Index, Bloomberg U.S. Securitized: MBS, ABS and CMBS Index, FTSE Nareit All Equity REIT Index, ICE® U.S. Treasury 0-5 Year Inflation Linked Bond Index, MSCI ACWI ex USA IMI Index (Net), Russell 1000® Index, Russell 2000® Index and S&P Global Infrastructure IndexTM (Net), which are representative of the asset classes in which the Fund invests. The weightings of the indices in the LifePath Dynamic 2040 Fund Custom Benchmark are adjusted periodically to reflect the investment adviser’s evaluation and adjustment of the Fund’s asset allocation strategy.
| Key Fund statistics | |
| $561,532,960 | |
| 36 | |
| $369,204 | |
| 16% |
What did the Fund invest in?
(as of December 31, 2025)
| Portfolio composition | ||
| Asset Type(a) | Percent of Net Assets |
|
| 73.0 | % | |
| 19.8 | ||
| 10.8 | ||
| (3.6 | ) | |
| Ten largest holdings | ||
| Security(b) | Percent of Net Assets |
|
| 37.9 | % | |
| 15.2 | ||
| 15.2 | ||
| 7.6 | ||
| 4.8 | ||
| 4.4 | ||
| 2.9 | ||
| 2.2 | ||
| 1.9 | ||
| 0.5 | ||
| The portfolio composition above is calculated using a methodology different than that disclosed in the Fund's prospectus. |
| Excludes short-term securities. |
| Ten largest holdings | ||
| Security(b) | Percent of Net Assets |
|
| 37.9 | % | |
| 15.2 | ||
| 15.2 | ||
| 7.6 | ||
| 4.8 | ||
| 4.4 | ||
| 2.9 | ||
| 2.2 | ||
| 1.9 | ||
| 0.5 | ||
What were the Fund costs for the last year ?
(based on a hypothetical $10,000 investment)
| Class name | Costs of a $10,000 investment |
Costs paid as a percentage of a $10,000 investment |
| $97(a) | 0.92%(a) |
| Excludes fees and expenses incurred indirectly as a result of investments in underlying funds. |
How did the Fund perform last year ?
- For the reporting period ended December 31, 2025, the Fund’s Class R Shares returned 11.51%.
- For the same period, the Fund’s benchmark, the Bloomberg U.S. Aggregate Bond Index returned 7.30% and the Russell 1000® Index returned 17.37%. The LifePath Dynamic Retirement Fund Custom Benchmark returned 12.68%.
What contributed to performance?
U.S. equities were the top contributor to absolute performance in the funds furthest from retirement, followed by international equities, BlackRock Tactical Opportunities Fund (a liquid macro strategy), investment-grade bonds, and U.S. real estate investment trusts (REITs).
U.S. equities were the top contributor in the funds at and near retirement, followed by investment-grade bonds, international equities, U.S. Treasury Inflation Protected Securities (TIPS), global infrastructure stocks, and BlackRock Tactical Opportunities Fund.
The funds used derivatives, including financial futures, swaps, and foreign currency transactions, as a means to hedge and/or take outright views on equities, interest rates, credit risk, and/or currencies. The use of derivatives as opposed to physical securities did not have a material impact on performance.
What detracted from performance?
Currency positioning was the primary detractor from performance in the funds furthest from retirement.
In the vintages at and near retirement, currency pair trades were the primary detractor.
The views expressed reflect the opinions of BlackRock as of the date of this report and are subject to change based on changes in market, economic or other conditions. These views are not intended to be a forecast of future events and are no guarantee of future results.
Fund performance
Cumulative performance: January 1, 2016 through December 31, 2025
Initial investment of $10,000
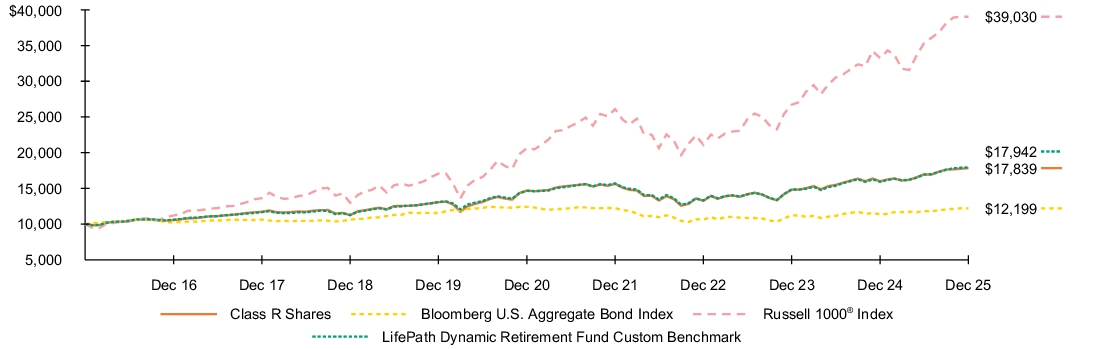
See “Average annual total returns” for additional information on fund performance.
| Average annual total returns | ||||||
| 1 Year | 5 Years | 10 Years | ||||
| 11.51 | % | 3.95 | % | 5.96 | % | |
| 7.30 | (0.36 | ) | 2.01 | |||
| 17.37 | 13.59 | 14.59 | ||||
| 12.68 | 4.13 | 6.02 |
The Fund compares its performance to that of a customized weighted index (the “LifePath Dynamic Retirement Fund Custom Benchmark”) comprised of the Bloomberg U.S. Intermediate Credit Bond Index, Bloomberg U.S. Intermediate Government Bond Index, Bloomberg U.S. Long Credit Bond Index, Bloomberg U.S. Long Government Bond Index, Bloomberg U.S. Securitized: MBS, ABS and CMBS Index, FTSE Nareit All Equity REIT Index, ICE® U.S. Treasury 0-5 Year Inflation Linked Bond Index, MSCI ACWI ex USA IMI Index (Net), Russell 1000® Index, Russell 2000® Index and S&P Global Infrastructure IndexTM (Net), which are representative of the asset classes in which the Fund invests. The weightings of the indices in the LifePath Dynamic Retirement Fund Custom Benchmark are adjusted periodically to reflect the investment adviser’s evaluation and adjustment of the Fund’s asset allocation strategy.
| Key Fund statistics | |
| $502,351,704 | |
| 36 | |
| $576,258 | |
| 17% |
What did the Fund invest in?
(as of December 31, 2025)
| Portfolio composition | ||
| Asset Type(a) | Percent of Net Assets |
|
| 50.1 | % | |
| 43.9 | ||
| 6.5 | ||
| (0.5 | ) | |
| Ten largest holdings | ||
| Security(b) | Percent of Net Assets |
|
| 40.5 | % | |
| 24.2 | ||
| 9.6 | ||
| 7.4 | ||
| 4.9 | ||
| 3.9 | ||
| 1.8 | ||
| 1.2 | ||
| 0.2 | ||
| 0.2 | ||
| The portfolio composition above is calculated using a methodology different than that disclosed in the Fund's prospectus. |
| Excludes short-term securities. |
| Ten largest holdings | ||
| Security(b) | Percent of Net Assets |
|
| 40.5 | % | |
| 24.2 | ||
| 9.6 | ||
| 7.4 | ||
| 4.9 | ||
| 3.9 | ||
| 1.8 | ||
| 1.2 | ||
| 0.2 | ||
| 0.2 | ||
What were the Fund costs for the last year ?
(based on a hypothetical $10,000 investment)
| Class name | Costs of a $10,000 investment |
Costs paid as a percentage of a $10,000 investment |
| $23(a) | 0.22%(a) |
| Excludes fees and expenses incurred indirectly as a result of investments in underlying funds. |
How did the Fund perform last year ?
- For the reporting period ended December 31, 2025, the Fund’s Class K Shares returned 12.24%.
- For the same period, the Fund’s benchmark, the Bloomberg U.S. Aggregate Bond Index returned 7.30% and the Russell 1000® Index returned 17.37%. The LifePath Dynamic Retirement Fund Custom Benchmark returned 12.68%.
What contributed to performance?
U.S. equities were the top contributor to absolute performance in the funds furthest from retirement, followed by international equities, BlackRock Tactical Opportunities Fund (a liquid macro strategy), investment-grade bonds, and U.S. real estate investment trusts (REITs).
U.S. equities were the top contributor in the funds at and near retirement, followed by investment-grade bonds, international equities, U.S. Treasury Inflation Protected Securities (TIPS), global infrastructure stocks, and BlackRock Tactical Opportunities Fund.
The funds used derivatives, including financial futures, swaps, and foreign currency transactions, as a means to hedge and/or take outright views on equities, interest rates, credit risk, and/or currencies. The use of derivatives as opposed to physical securities did not have a material impact on performance.
What detracted from performance?
Currency positioning was the primary detractor from performance in the funds furthest from retirement.
In the vintages at and near retirement, currency pair trades were the primary detractor.
The views expressed reflect the opinions of BlackRock as of the date of this report and are subject to change based on changes in market, economic or other conditions. These views are not intended to be a forecast of future events and are no guarantee of future results.
Fund performance
Cumulative performance: January 1, 2016 through December 31, 2025
Initial investment of $10,000
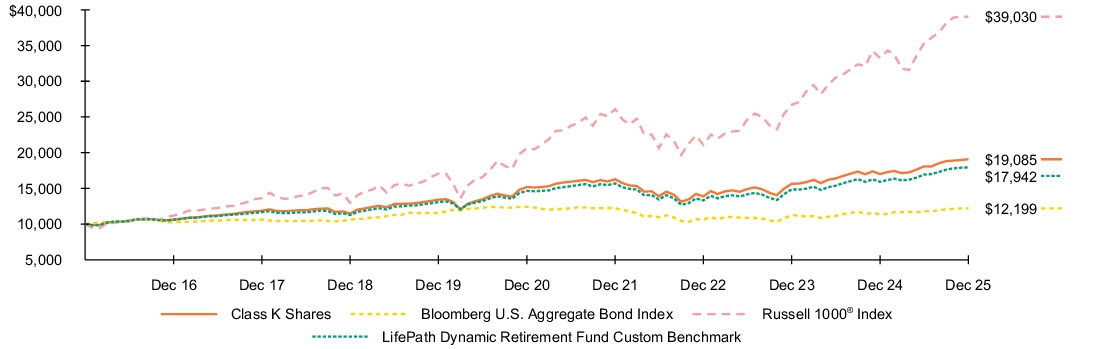
See “Average annual total returns” for additional information on fund performance.
| Average annual total returns | ||||||
| 1 Year | 5 Years | 10 Years | ||||
| 12.24 | % | 4.67 | % | 6.68 | % | |
| 7.30 | (0.36 | ) | 2.01 | |||
| 17.37 | 13.59 | 14.59 | ||||
| 12.68 | 4.13 | 6.02 |
The Fund compares its performance to that of a customized weighted index (the “LifePath Dynamic Retirement Fund Custom Benchmark”) comprised of the Bloomberg U.S. Intermediate Credit Bond Index, Bloomberg U.S. Intermediate Government Bond Index, Bloomberg U.S. Long Credit Bond Index, Bloomberg U.S. Long Government Bond Index, Bloomberg U.S. Securitized: MBS, ABS and CMBS Index, FTSE Nareit All Equity REIT Index, ICE® U.S. Treasury 0-5 Year Inflation Linked Bond Index, MSCI ACWI ex USA IMI Index (Net), Russell 1000® Index, Russell 2000® Index and S&P Global Infrastructure IndexTM (Net), which are representative of the asset classes in which the Fund invests. The weightings of the indices in the LifePath Dynamic Retirement Fund Custom Benchmark are adjusted periodically to reflect the investment adviser’s evaluation and adjustment of the Fund’s asset allocation strategy.
| Key Fund statistics | |
| $502,351,704 | |
| 36 | |
| $576,258 | |
| 17% |
What did the Fund invest in?
(as of December 31, 2025)
| Portfolio composition | ||
| Asset Type(a) | Percent of Net Assets |
|
| 50.1 | % | |
| 43.9 | ||
| 6.5 | ||
| (0.5 | ) | |
| Ten largest holdings | ||
| Security(b) | Percent of Net Assets |
|
| 40.5 | % | |
| 24.2 | ||
| 9.6 | ||
| 7.4 | ||
| 4.9 | ||
| 3.9 | ||
| 1.8 | ||
| 1.2 | ||
| 0.2 | ||
| 0.2 | ||
| The portfolio composition above is calculated using a methodology different than that disclosed in the Fund's prospectus. |
| Excludes short-term securities. |
| Ten largest holdings | ||
| Security(b) | Percent of Net Assets |
|
| 40.5 | % | |
| 24.2 | ||
| 9.6 | ||
| 7.4 | ||
| 4.9 | ||
| 3.9 | ||
| 1.8 | ||
| 1.2 | ||
| 0.2 | ||
| 0.2 | ||
What were the Fund costs for the last year ?
(based on a hypothetical $10,000 investment)
| Class name | Costs of a $10,000 investment |
Costs paid as a percentage of a $10,000 investment |
| $155(a) | 1.47%(a) |
| Excludes fees and expenses incurred indirectly as a result of investments in underlying funds. |
How did the Fund perform last year ?
- For the reporting period ended December 31, 2025, the Fund’s Investor C Shares returned 10.88%.
- For the same period, the Fund’s benchmark, the Bloomberg U.S. Aggregate Bond Index returned 7.30% and the Russell 1000® Index returned 17.37%. The LifePath Dynamic Retirement Fund Custom Benchmark returned 12.68%.
What contributed to performance?
U.S. equities were the top contributor to absolute performance in the funds furthest from retirement, followed by international equities, BlackRock Tactical Opportunities Fund (a liquid macro strategy), investment-grade bonds, and U.S. real estate investment trusts (REITs).
U.S. equities were the top contributor in the funds at and near retirement, followed by investment-grade bonds, international equities, U.S. Treasury Inflation Protected Securities (TIPS), global infrastructure stocks, and BlackRock Tactical Opportunities Fund.
The funds used derivatives, including financial futures, swaps, and foreign currency transactions, as a means to hedge and/or take outright views on equities, interest rates, credit risk, and/or currencies. The use of derivatives as opposed to physical securities did not have a material impact on performance.
What detracted from performance?
Currency positioning was the primary detractor from performance in the funds furthest from retirement.
In the vintages at and near retirement, currency pair trades were the primary detractor.
The views expressed reflect the opinions of BlackRock as of the date of this report and are subject to change based on changes in market, economic or other conditions. These views are not intended to be a forecast of future events and are no guarantee of future results.
Fund performance
Cumulative performance: January 1, 2016 through December 31, 2025
Initial investment of $10,000
See “Average annual total returns” for additional information on fund performance.
| Average annual total returns | ||||||
| 1 Year | 5 Years | 10 Years | ||||
| 10.88 | % | 3.37 | % | 5.51 | % | |
| 9.88 | 3.37 | 5.51 | ||||
| 7.30 | (0.36 | ) | 2.01 | |||
| 17.37 | 13.59 | 14.59 | ||||
| 12.68 | 4.13 | 6.02 |
The Fund compares its performance to that of a customized weighted index (the “LifePath Dynamic Retirement Fund Custom Benchmark”) comprised of the Bloomberg U.S. Intermediate Credit Bond Index, Bloomberg U.S. Intermediate Government Bond Index, Bloomberg U.S. Long Credit Bond Index, Bloomberg U.S. Long Government Bond Index, Bloomberg U.S. Securitized: MBS, ABS and CMBS Index, FTSE Nareit All Equity REIT Index, ICE® U.S. Treasury 0-5 Year Inflation Linked Bond Index, MSCI ACWI ex USA IMI Index (Net), Russell 1000® Index, Russell 2000® Index and S&P Global Infrastructure IndexTM (Net), which are representative of the asset classes in which the Fund invests. The weightings of the indices in the LifePath Dynamic Retirement Fund Custom Benchmark are adjusted periodically to reflect the investment adviser’s evaluation and adjustment of the Fund’s asset allocation strategy.
| Key Fund statistics | |
| $502,351,704 | |
| 36 | |
| $576,258 | |
| 17% |
What did the Fund invest in?
(as of December 31, 2025)
| Portfolio composition | ||
| Asset Type(a) | Percent of Net Assets |
|
| 50.1 | % | |
| 43.9 | ||
| 6.5 | ||
| (0.5 | ) | |
| Ten largest holdings | ||
| Security(b) | Percent of Net Assets |
|
| 40.5 | % | |
| 24.2 | ||
| 9.6 | ||
| 7.4 | ||
| 4.9 | ||
| 3.9 | ||
| 1.8 | ||
| 1.2 | ||
| 0.2 | ||
| 0.2 | ||
| The portfolio composition above is calculated using a methodology different than that disclosed in the Fund's prospectus. |
| Excludes short-term securities. |
| Ten largest holdings | ||
| Security(b) | Percent of Net Assets |
|
| 40.5 | % | |
| 24.2 | ||
| 9.6 | ||
| 7.4 | ||
| 4.9 | ||
| 3.9 | ||
| 1.8 | ||
| 1.2 | ||
| 0.2 | ||
| 0.2 | ||
What were the Fund costs for the last year ?
(based on a hypothetical $10,000 investment)
| Class name | Costs of a $10,000 investment |
Costs paid as a percentage of a $10,000 investment |
| $76(a) | 0.72%(a) |
| Excludes fees and expenses incurred indirectly as a result of investments in underlying funds. |
How did the Fund perform last year ?
- For the reporting period ended December 31, 2025, the Fund’s Investor A Shares returned 11.74%.
- For the same period, the Fund’s benchmark, the Bloomberg U.S. Aggregate Bond Index returned 7.30% and the Russell 1000® Index returned 17.37%. The LifePath Dynamic Retirement Fund Custom Benchmark returned 12.68%.
What contributed to performance?
U.S. equities were the top contributor to absolute performance in the funds furthest from retirement, followed by international equities, BlackRock Tactical Opportunities Fund (a liquid macro strategy), investment-grade bonds, and U.S. real estate investment trusts (REITs).
U.S. equities were the top contributor in the funds at and near retirement, followed by investment-grade bonds, international equities, U.S. Treasury Inflation Protected Securities (TIPS), global infrastructure stocks, and BlackRock Tactical Opportunities Fund.
The funds used derivatives, including financial futures, swaps, and foreign currency transactions, as a means to hedge and/or take outright views on equities, interest rates, credit risk, and/or currencies. The use of derivatives as opposed to physical securities did not have a material impact on performance.
What detracted from performance?
Currency positioning was the primary detractor from performance in the funds furthest from retirement.
In the vintages at and near retirement, currency pair trades were the primary detractor.
The views expressed reflect the opinions of BlackRock as of the date of this report and are subject to change based on changes in market, economic or other conditions. These views are not intended to be a forecast of future events and are no guarantee of future results.
Fund performance
Cumulative performance: January 1, 2016 through December 31, 2025
Initial investment of $10,000
See “Average annual total returns” for additional information on fund performance.
| Average annual total returns | ||||||
| 1 Year | 5 Years | 10 Years | ||||
| 11.74 | % | 4.14 | % | 6.16 | % | |
| 5.87 | 3.03 | 5.59 | ||||
| 7.30 | (0.36 | ) | 2.01 | |||
| 17.37 | 13.59 | 14.59 | ||||
| 12.68 | 4.13 | 6.02 |
The Fund compares its performance to that of a customized weighted index (the “LifePath Dynamic Retirement Fund Custom Benchmark”) comprised of the Bloomberg U.S. Intermediate Credit Bond Index, Bloomberg U.S. Intermediate Government Bond Index, Bloomberg U.S. Long Credit Bond Index, Bloomberg U.S. Long Government Bond Index, Bloomberg U.S. Securitized: MBS, ABS and CMBS Index, FTSE Nareit All Equity REIT Index, ICE® U.S. Treasury 0-5 Year Inflation Linked Bond Index, MSCI ACWI ex USA IMI Index (Net), Russell 1000® Index, Russell 2000® Index and S&P Global Infrastructure IndexTM (Net), which are representative of the asset classes in which the Fund invests. The weightings of the indices in the LifePath Dynamic Retirement Fund Custom Benchmark are adjusted periodically to reflect the investment adviser’s evaluation and adjustment of the Fund’s asset allocation strategy.
| Key Fund statistics | |
| $502,351,704 | |
| 36 | |
| $576,258 | |
| 17% |
What did the Fund invest in?
(as of December 31, 2025)
| Portfolio composition | ||
| Asset Type(a) | Percent of Net Assets |
|
| 50.1 | % | |
| 43.9 | ||
| 6.5 | ||
| (0.5 | ) | |
| Ten largest holdings | ||
| Security(b) | Percent of Net Assets |
|
| 40.5 | % | |
| 24.2 | ||
| 9.6 | ||
| 7.4 | ||
| 4.9 | ||
| 3.9 | ||
| 1.8 | ||
| 1.2 | ||
| 0.2 | ||
| 0.2 | ||
| The portfolio composition above is calculated using a methodology different than that disclosed in the Fund's prospectus. |
| Excludes short-term securities. |
| Ten largest holdings | ||
| Security(b) | Percent of Net Assets |
|
| 40.5 | % | |
| 24.2 | ||
| 9.6 | ||
| 7.4 | ||
| 4.9 | ||
| 3.9 | ||
| 1.8 | ||
| 1.2 | ||
| 0.2 | ||
| 0.2 | ||
What were the Fund costs for the last year ?
(based on a hypothetical $10,000 investment)
| Class name | Costs of a $10,000 investment |
Costs paid as a percentage of a $10,000 investment |
| $50(a) | 0.47%(a) |
| Excludes fees and expenses incurred indirectly as a result of investments in underlying funds. |
How did the Fund perform last year ?
- For the reporting period ended December 31, 2025, the Fund’s Institutional Shares returned 12.01%.
- For the same period, the Fund’s benchmark, the Bloomberg U.S. Aggregate Bond Index returned 7.30% and the Russell 1000® Index returned 17.37%. The LifePath Dynamic Retirement Fund Custom Benchmark returned 12.68%.
What contributed to performance?
U.S. equities were the top contributor to absolute performance in the funds furthest from retirement, followed by international equities, BlackRock Tactical Opportunities Fund (a liquid macro strategy), investment-grade bonds, and U.S. real estate investment trusts (REITs).
U.S. equities were the top contributor in the funds at and near retirement, followed by investment-grade bonds, international equities, U.S. Treasury Inflation Protected Securities (TIPS), global infrastructure stocks, and BlackRock Tactical Opportunities Fund.
The funds used derivatives, including financial futures, swaps, and foreign currency transactions, as a means to hedge and/or take outright views on equities, interest rates, credit risk, and/or currencies. The use of derivatives as opposed to physical securities did not have a material impact on performance.
What detracted from performance?
Currency positioning was the primary detractor from performance in the funds furthest from retirement.
In the vintages at and near retirement, currency pair trades were the primary detractor.
The views expressed reflect the opinions of BlackRock as of the date of this report and are subject to change based on changes in market, economic or other conditions. These views are not intended to be a forecast of future events and are no guarantee of future results.
Fund performance
Cumulative performance: January 1, 2016 through December 31, 2025
Initial investment of $10,000
See “Average annual total returns” for additional information on fund performance.
| Average annual total returns | ||||||
| 1 Year | 5 Years | 10 Years | ||||
| 12.01 | % | 4.40 | % | 6.43 | % | |
| 7.30 | (0.36 | ) | 2.01 | |||
| 17.37 | 13.59 | 14.59 | ||||
| 12.68 | 4.13 | 6.02 |
The Fund compares its performance to that of a customized weighted index (the “LifePath Dynamic Retirement Fund Custom Benchmark”) comprised of the Bloomberg U.S. Intermediate Credit Bond Index, Bloomberg U.S. Intermediate Government Bond Index, Bloomberg U.S. Long Credit Bond Index, Bloomberg U.S. Long Government Bond Index, Bloomberg U.S. Securitized: MBS, ABS and CMBS Index, FTSE Nareit All Equity REIT Index, ICE® U.S. Treasury 0-5 Year Inflation Linked Bond Index, MSCI ACWI ex USA IMI Index (Net), Russell 1000® Index, Russell 2000® Index and S&P Global Infrastructure IndexTM (Net), which are representative of the asset classes in which the Fund invests. The weightings of the indices in the LifePath Dynamic Retirement Fund Custom Benchmark are adjusted periodically to reflect the investment adviser’s evaluation and adjustment of the Fund’s asset allocation strategy.
| Key Fund statistics | |
| $502,351,704 | |
| 36 | |
| $576,258 | |
| 17% |
What did the Fund invest in?
(as of December 31, 2025)
| Portfolio composition | ||
| Asset Type(a) | Percent of Net Assets |
|
| 50.1 | % | |
| 43.9 | ||
| 6.5 | ||
| (0.5 | ) | |
| Ten largest holdings | ||
| Security(b) | Percent of Net Assets |
|
| 40.5 | % | |
| 24.2 | ||
| 9.6 | ||
| 7.4 | ||
| 4.9 | ||
| 3.9 | ||
| 1.8 | ||
| 1.2 | ||
| 0.2 | ||
| 0.2 | ||
| The portfolio composition above is calculated using a methodology different than that disclosed in the Fund's prospectus. |
| Excludes short-term securities. |
| Ten largest holdings | ||
| Security(b) | Percent of Net Assets |
|
| 40.5 | % | |
| 24.2 | ||
| 9.6 | ||
| 7.4 | ||
| 4.9 | ||
| 3.9 | ||
| 1.8 | ||
| 1.2 | ||
| 0.2 | ||
| 0.2 | ||
What were the Fund costs for the last year ?
(based on a hypothetical $10,000 investment)
| Class name | Costs of a $10,000 investment |
Costs paid as a percentage of a $10,000 investment |
| $55(a) | 0.50%(a) |
| Excludes fees and expenses incurred indirectly as a result of investments in underlying funds. |
How did the Fund perform last year ?
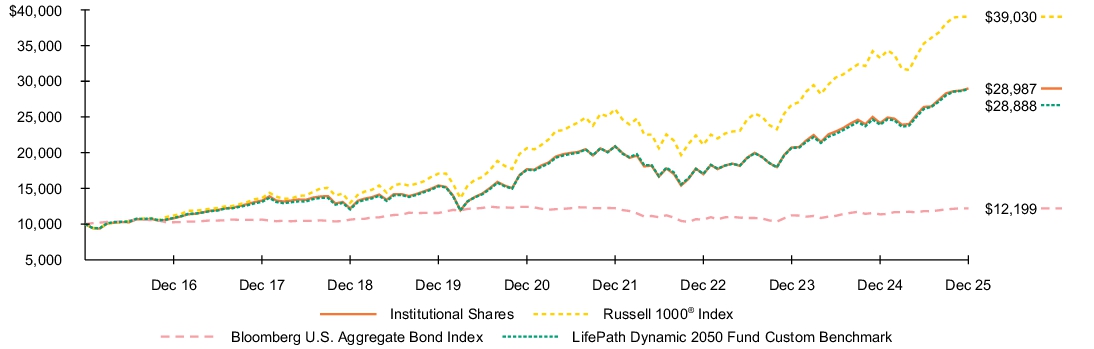
- For the reporting period ended December 31, 2025, the Fund’s Institutional Shares returned 20.05%.
- For the same period, the Fund’s benchmark, the Russell 1000® Index returned 17.37% and the Bloomberg U.S. Aggregate Bond Index returned 7.30%. The LifePath Dynamic 2050 Fund Custom Benchmark returned 20.74%.
What contributed to performance?
U.S. equities were the top contributor to absolute performance in the funds furthest from retirement, followed by international equities, BlackRock Tactical Opportunities Fund (a liquid macro strategy), investment-grade bonds, and U.S. real estate investment trusts (REITs).
U.S. equities were the top contributor in the funds at and near retirement, followed by investment-grade bonds, international equities, U.S. Treasury Inflation Protected Securities (TIPS), global infrastructure stocks, and BlackRock Tactical Opportunities Fund.
The funds used derivatives, including financial futures, swaps, and foreign currency transactions, as a means to hedge and/or take outright views on equities, interest rates, credit risk, and/or currencies. The use of derivatives as opposed to physical securities did not have a material impact on performance.
What detracted from performance?
Currency positioning was the primary detractor from performance in the funds furthest from retirement.
In the vintages at and near retirement, currency pair trades were the primary detractor.
The views expressed reflect the opinions of BlackRock as of the date of this report and are subject to change based on changes in market, economic or other conditions. These views are not intended to be a forecast of future events and are no guarantee of future results.
Fund performance
Cumulative performance: January 1, 2016 through December 31, 2025
Initial investment of $10,000
See “Average annual total returns” for additional information on fund performance.
| Average annual total returns | ||||||
| 1 Year | 5 Years | 10 Years | ||||
| 20.05 | % | 10.38 | % | 11.23 | % | |
| 17.37 | 13.59 | 14.59 | ||||
| 7.30 | (0.36 | ) | 2.01 | |||
| 20.74 | 10.41 | 11.19 |
The Fund compares its performance to that of a customized weighted index (the “LifePath Dynamic 2050 Fund Custom Benchmark”) comprised of the Bloomberg U.S. Intermediate Credit Bond Index, Bloomberg U.S. Intermediate Government Bond Index, Bloomberg U.S. Long Credit Bond Index, Bloomberg U.S. Long Government Bond Index, Bloomberg U.S. Securitized: MBS, ABS and CMBS Index, FTSE Nareit All Equity REIT Index, ICE® U.S. Treasury 0-5 Year Inflation Linked Bond Index, MSCI ACWI ex USA IMI Index (Net), Russell 1000® Index, Russell 2000® Index and S&P Global Infrastructure IndexTM (Net), which are representative of the asset classes in which the Fund invests. The weightings of the indices in the LifePath Dynamic 2050 Fund Custom Benchmark are adjusted periodically to reflect the investment adviser’s evaluation and adjustment of the Fund’s asset allocation strategy.
| Key Fund statistics | |
| $425,407,630 | |
| 31 | |
| $307,816 | |
| 23% |
What did the Fund invest in?
(as of December 31, 2025)
| Portfolio composition | ||
| Asset Type(a) | Percent of Net Assets |
|
| 86.0 | % | |
| 17.4 | ||
| 7.0 | ||
| (10.4 | ) | |
| Ten largest holdings | ||
| Security(b) | Percent of Net Assets |
|
| 45.0 | % | |
| 15.1 | ||
| 10.2 | ||
| 6.0 | ||
| 4.8 | ||
| 3.6 | ||
| 3.3 | ||
| 2.3 | ||
| 2.1 | ||
| 0.6 | ||
| The portfolio composition above is calculated using a methodology different than that disclosed in the Fund's prospectus. |
| Excludes short-term securities. |
| Ten largest holdings | ||
| Security(b) | Percent of Net Assets |
|
| 45.0 | % | |
| 15.1 | ||
| 10.2 | ||
| 6.0 | ||
| 4.8 | ||
| 3.6 | ||
| 3.3 | ||
| 2.3 | ||
| 2.1 | ||
| 0.6 | ||
What were the Fund costs for the last year ?
(based on a hypothetical $10,000 investment)
| Class name | Costs of a $10,000 investment |
Costs paid as a percentage of a $10,000 investment |
| $82(a) | 0.75%(a) |
| Excludes fees and expenses incurred indirectly as a result of investments in underlying funds. |
How did the Fund perform last year ?
- For the reporting period ended December 31, 2025, the Fund’s Investor A Shares returned 19.79%.
- For the same period, the Fund’s benchmark, the Russell 1000® Index returned 17.37% and the Bloomberg U.S. Aggregate Bond Index returned 7.30%. The LifePath Dynamic 2050 Fund Custom Benchmark returned 20.74%.
What contributed to performance?
U.S. equities were the top contributor to absolute performance in the funds furthest from retirement, followed by international equities, BlackRock Tactical Opportunities Fund (a liquid macro strategy), investment-grade bonds, and U.S. real estate investment trusts (REITs).
U.S. equities were the top contributor in the funds at and near retirement, followed by investment-grade bonds, international equities, U.S. Treasury Inflation Protected Securities (TIPS), global infrastructure stocks, and BlackRock Tactical Opportunities Fund.
The funds used derivatives, including financial futures, swaps, and foreign currency transactions, as a means to hedge and/or take outright views on equities, interest rates, credit risk, and/or currencies. The use of derivatives as opposed to physical securities did not have a material impact on performance.
What detracted from performance?
Currency positioning was the primary detractor from performance in the funds furthest from retirement.
In the vintages at and near retirement, currency pair trades were the primary detractor.
The views expressed reflect the opinions of BlackRock as of the date of this report and are subject to change based on changes in market, economic or other conditions. These views are not intended to be a forecast of future events and are no guarantee of future results.
Fund performance
Cumulative performance: January 1, 2016 through December 31, 2025
Initial investment of $10,000

See “Average annual total returns” for additional information on fund performance.
| Average annual total returns | ||||||
| 1 Year | 5 Years | 10 Years | ||||
| 19.79 | % | 10.11 | % | 10.95 | % | |
| 13.50 | 8.93 | 10.36 | ||||
| 17.37 | 13.59 | 14.59 | ||||
| 7.30 | (0.36 | ) | 2.01 | |||
| 20.74 | 10.41 | 11.19 |
The Fund compares its performance to that of a customized weighted index (the “LifePath Dynamic 2050 Fund Custom Benchmark”) comprised of the Bloomberg U.S. Intermediate Credit Bond Index, Bloomberg U.S. Intermediate Government Bond Index, Bloomberg U.S. Long Credit Bond Index, Bloomberg U.S. Long Government Bond Index, Bloomberg U.S. Securitized: MBS, ABS and CMBS Index, FTSE Nareit All Equity REIT Index, ICE® U.S. Treasury 0-5 Year Inflation Linked Bond Index, MSCI ACWI ex USA IMI Index (Net), Russell 1000® Index, Russell 2000® Index and S&P Global Infrastructure IndexTM (Net), which are representative of the asset classes in which the Fund invests. The weightings of the indices in the LifePath Dynamic 2050 Fund Custom Benchmark are adjusted periodically to reflect the investment adviser’s evaluation and adjustment of the Fund’s asset allocation strategy.
| Key Fund statistics | |
| $425,407,630 | |
| 31 | |
| $307,816 | |
| 23% |
What did the Fund invest in?
(as of December 31, 2025)
| Portfolio composition | ||
| Asset Type(a) | Percent of Net Assets |
|
| 86.0 | % | |
| 17.4 | ||
| 7.0 | ||
| (10.4 | ) | |
| Ten largest holdings | ||
| Security(b) | Percent of Net Assets |
|
| 45.0 | % | |
| 15.1 | ||
| 10.2 | ||
| 6.0 | ||
| 4.8 | ||
| 3.6 | ||
| 3.3 | ||
| 2.3 | ||
| 2.1 | ||
| 0.6 | ||
| The portfolio composition above is calculated using a methodology different than that disclosed in the Fund's prospectus. |
| Excludes short-term securities. |
| Ten largest holdings | ||
| Security(b) | Percent of Net Assets |
|
| 45.0 | % | |
| 15.1 | ||
| 10.2 | ||
| 6.0 | ||
| 4.8 | ||
| 3.6 | ||
| 3.3 | ||
| 2.3 | ||
| 2.1 | ||
| 0.6 | ||
What were the Fund costs for the last year ?
(based on a hypothetical $10,000 investment)
| Class name | Costs of a $10,000 investment |
Costs paid as a percentage of a $10,000 investment |
| $164(a) | 1.50%(a) |
| Excludes fees and expenses incurred indirectly as a result of investments in underlying funds. |
How did the Fund perform last year ?
- For the reporting period ended December 31, 2025, the Fund’s Investor C Shares returned 18.85%.
- For the same period, the Fund’s benchmark, the Russell 1000® Index returned 17.37% and the Bloomberg U.S. Aggregate Bond Index returned 7.30%. The LifePath Dynamic 2050 Fund Custom Benchmark returned 20.74%.
What contributed to performance?
U.S. equities were the top contributor to absolute performance in the funds furthest from retirement, followed by international equities, BlackRock Tactical Opportunities Fund (a liquid macro strategy), investment-grade bonds, and U.S. real estate investment trusts (REITs).
U.S. equities were the top contributor in the funds at and near retirement, followed by investment-grade bonds, international equities, U.S. Treasury Inflation Protected Securities (TIPS), global infrastructure stocks, and BlackRock Tactical Opportunities Fund.
The funds used derivatives, including financial futures, swaps, and foreign currency transactions, as a means to hedge and/or take outright views on equities, interest rates, credit risk, and/or currencies. The use of derivatives as opposed to physical securities did not have a material impact on performance.
What detracted from performance?
Currency positioning was the primary detractor from performance in the funds furthest from retirement.
In the vintages at and near retirement, currency pair trades were the primary detractor.
The views expressed reflect the opinions of BlackRock as of the date of this report and are subject to change based on changes in market, economic or other conditions. These views are not intended to be a forecast of future events and are no guarantee of future results.
Fund performance
Cumulative performance: January 1, 2016 through December 31, 2025
Initial investment of $10,000
See “Average annual total returns” for additional information on fund performance.
| Average annual total returns | ||||||
| 1 Year | 5 Years | 10 Years | ||||
| 18.85 | % | 9.29 | % | 10.26 | % | |
| 17.85 | 9.29 | 10.26 | ||||
| 17.37 | 13.59 | 14.59 | ||||
| 7.30 | (0.36 | ) | 2.01 | |||
| 20.74 | 10.41 | 11.19 |
The Fund compares its performance to that of a customized weighted index (the “LifePath Dynamic 2050 Fund Custom Benchmark”) comprised of the Bloomberg U.S. Intermediate Credit Bond Index, Bloomberg U.S. Intermediate Government Bond Index, Bloomberg U.S. Long Credit Bond Index, Bloomberg U.S. Long Government Bond Index, Bloomberg U.S. Securitized: MBS, ABS and CMBS Index, FTSE Nareit All Equity REIT Index, ICE® U.S. Treasury 0-5 Year Inflation Linked Bond Index, MSCI ACWI ex USA IMI Index (Net), Russell 1000® Index, Russell 2000® Index and S&P Global Infrastructure IndexTM (Net), which are representative of the asset classes in which the Fund invests. The weightings of the indices in the LifePath Dynamic 2050 Fund Custom Benchmark are adjusted periodically to reflect the investment adviser’s evaluation and adjustment of the Fund’s asset allocation strategy.
| Key Fund statistics | |
| $425,407,630 | |
| 31 | |
| $307,816 | |
| 23% |
What did the Fund invest in?
(as of December 31, 2025)
| Portfolio composition | ||
| Asset Type(a) | Percent of Net Assets |
|
| 86.0 | % | |
| 17.4 | ||
| 7.0 | ||
| (10.4 | ) | |
| Ten largest holdings | ||
| Security(b) | Percent of Net Assets |
|
| 45.0 | % | |
| 15.1 | ||
| 10.2 | ||
| 6.0 | ||
| 4.8 | ||
| 3.6 | ||
| 3.3 | ||
| 2.3 | ||
| 2.1 | ||
| 0.6 | ||
| The portfolio composition above is calculated using a methodology different than that disclosed in the Fund's prospectus. |
| Excludes short-term securities. |
| Ten largest holdings | ||
| Security(b) | Percent of Net Assets |
|
| 45.0 | % | |
| 15.1 | ||
| 10.2 | ||
| 6.0 | ||
| 4.8 | ||
| 3.6 | ||
| 3.3 | ||
| 2.3 | ||
| 2.1 | ||
| 0.6 | ||
What were the Fund costs for the last year ?
(based on a hypothetical $10,000 investment)
| Class name | Costs of a $10,000 investment |
Costs paid as a percentage of a $10,000 investment |
| $28(a) | 0.25%(a) |
| Excludes fees and expenses incurred indirectly as a result of investments in underlying funds. |
How did the Fund perform last year ?
- For the reporting period ended December 31, 2025, the Fund’s Class K Shares returned 20.37%.
- For the same period, the Fund’s benchmark, the Russell 1000® Index returned 17.37% and the Bloomberg U.S. Aggregate Bond Index returned 7.30%. The LifePath Dynamic 2050 Fund Custom Benchmark returned 20.74%.
What contributed to performance?
U.S. equities were the top contributor to absolute performance in the funds furthest from retirement, followed by international equities, BlackRock Tactical Opportunities Fund (a liquid macro strategy), investment-grade bonds, and U.S. real estate investment trusts (REITs).
U.S. equities were the top contributor in the funds at and near retirement, followed by investment-grade bonds, international equities, U.S. Treasury Inflation Protected Securities (TIPS), global infrastructure stocks, and BlackRock Tactical Opportunities Fund.
The funds used derivatives, including financial futures, swaps, and foreign currency transactions, as a means to hedge and/or take outright views on equities, interest rates, credit risk, and/or currencies. The use of derivatives as opposed to physical securities did not have a material impact on performance.
What detracted from performance?
Currency positioning was the primary detractor from performance in the funds furthest from retirement.
In the vintages at and near retirement, currency pair trades were the primary detractor.
The views expressed reflect the opinions of BlackRock as of the date of this report and are subject to change based on changes in market, economic or other conditions. These views are not intended to be a forecast of future events and are no guarantee of future results.
Fund performance
Cumulative performance: January 1, 2016 through December 31, 2025
Initial investment of $10,000
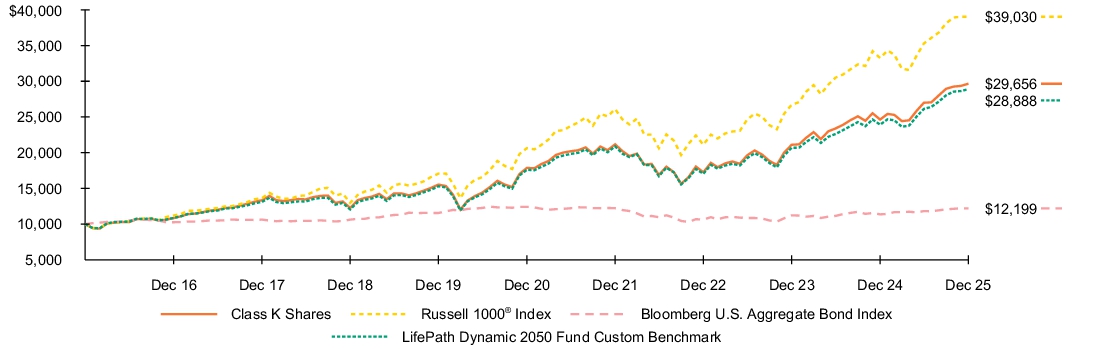
See “Average annual total returns” for additional information on fund performance.
| Average annual total returns | ||||||
| 1 Year | 5 Years | 10 Years | ||||
| 20.37 | % | 10.66 | % | 11.48 | % | |
| 17.37 | 13.59 | 14.59 | ||||
| 7.30 | (0.36 | ) | 2.01 | |||
| 20.74 | 10.41 | 11.19 |
The Fund compares its performance to that of a customized weighted index (the “LifePath Dynamic 2050 Fund Custom Benchmark”) comprised of the Bloomberg U.S. Intermediate Credit Bond Index, Bloomberg U.S. Intermediate Government Bond Index, Bloomberg U.S. Long Credit Bond Index, Bloomberg U.S. Long Government Bond Index, Bloomberg U.S. Securitized: MBS, ABS and CMBS Index, FTSE Nareit All Equity REIT Index, ICE® U.S. Treasury 0-5 Year Inflation Linked Bond Index, MSCI ACWI ex USA IMI Index (Net), Russell 1000® Index, Russell 2000® Index and S&P Global Infrastructure IndexTM (Net), which are representative of the asset classes in which the Fund invests. The weightings of the indices in the LifePath Dynamic 2050 Fund Custom Benchmark are adjusted periodically to reflect the investment adviser’s evaluation and adjustment of the Fund’s asset allocation strategy.
| Key Fund statistics | |
| $425,407,630 | |
| 31 | |
| $307,816 | |
| 23% |
What did the Fund invest in?
(as of December 31, 2025)
| Portfolio composition | ||
| Asset Type(a) | Percent of Net Assets |
|
| 86.0 | % | |
| 17.4 | ||
| 7.0 | ||
| (10.4 | ) | |
| Ten largest holdings | ||
| Security(b) | Percent of Net Assets |
|
| 45.0 | % | |
| 15.1 | ||
| 10.2 | ||
| 6.0 | ||
| 4.8 | ||
| 3.6 | ||
| 3.3 | ||
| 2.3 | ||
| 2.1 | ||
| 0.6 | ||
| The portfolio composition above is calculated using a methodology different than that disclosed in the Fund's prospectus. |
| Excludes short-term securities. |
| Ten largest holdings | ||
| Security(b) | Percent of Net Assets |
|
| 45.0 | % | |
| 15.1 | ||
| 10.2 | ||
| 6.0 | ||
| 4.8 | ||
| 3.6 | ||
| 3.3 | ||
| 2.3 | ||
| 2.1 | ||
| 0.6 | ||
What were the Fund costs for the last year ?
(based on a hypothetical $10,000 investment)
| Class name | Costs of a $10,000 investment |
Costs paid as a percentage of a $10,000 investment |
| $104(a) | 0.95%(a) |
| Excludes fees and expenses incurred indirectly as a result of investments in underlying funds. |
How did the Fund perform last year ?
- For the reporting period ended December 31, 2025, the Fund’s Class R Shares returned 19.53%.
- For the same period, the Fund’s benchmark, the Russell 1000® Index returned 17.37% and the Bloomberg U.S. Aggregate Bond Index returned 7.30%. The LifePath Dynamic 2050 Fund Custom Benchmark returned 20.74%.
What contributed to performance?
U.S. equities were the top contributor to absolute performance in the funds furthest from retirement, followed by international equities, BlackRock Tactical Opportunities Fund (a liquid macro strategy), investment-grade bonds, and U.S. real estate investment trusts (REITs).
U.S. equities were the top contributor in the funds at and near retirement, followed by investment-grade bonds, international equities, U.S. Treasury Inflation Protected Securities (TIPS), global infrastructure stocks, and BlackRock Tactical Opportunities Fund.
The funds used derivatives, including financial futures, swaps, and foreign currency transactions, as a means to hedge and/or take outright views on equities, interest rates, credit risk, and/or currencies. The use of derivatives as opposed to physical securities did not have a material impact on performance.
What detracted from performance?
Currency positioning was the primary detractor from performance in the funds furthest from retirement.
In the vintages at and near retirement, currency pair trades were the primary detractor.
The views expressed reflect the opinions of BlackRock as of the date of this report and are subject to change based on changes in market, economic or other conditions. These views are not intended to be a forecast of future events and are no guarantee of future results.
Fund performance
Cumulative performance: January 1, 2016 through December 31, 2025
Initial investment of $10,000
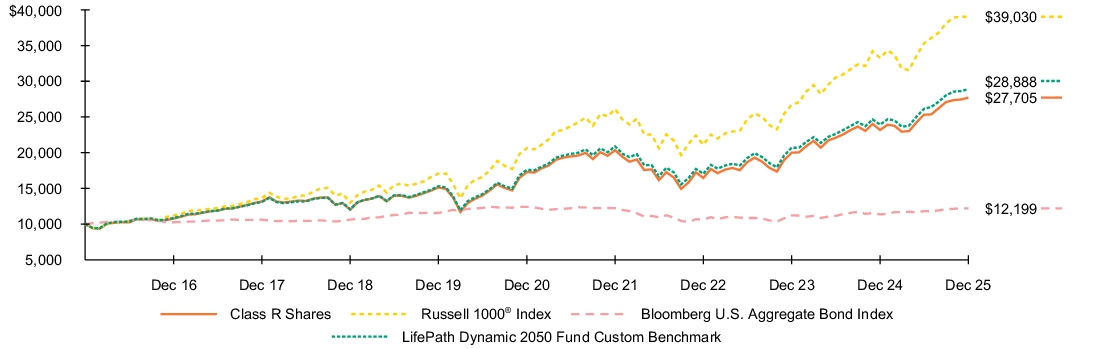
See “Average annual total returns” for additional information on fund performance.
| Average annual total returns | ||||||
| 1 Year | 5 Years | 10 Years | ||||
| 19.53 | % | 9.89 | % | 10.73 | % | |
| 17.37 | 13.59 | 14.59 | ||||
| 7.30 | (0.36 | ) | 2.01 | |||
| 20.74 | 10.41 | 11.19 |
The Fund compares its performance to that of a customized weighted index (the “LifePath Dynamic 2050 Fund Custom Benchmark”) comprised of the Bloomberg U.S. Intermediate Credit Bond Index, Bloomberg U.S. Intermediate Government Bond Index, Bloomberg U.S. Long Credit Bond Index, Bloomberg U.S. Long Government Bond Index, Bloomberg U.S. Securitized: MBS, ABS and CMBS Index, FTSE Nareit All Equity REIT Index, ICE® U.S. Treasury 0-5 Year Inflation Linked Bond Index, MSCI ACWI ex USA IMI Index (Net), Russell 1000® Index, Russell 2000® Index and S&P Global Infrastructure IndexTM (Net), which are representative of the asset classes in which the Fund invests. The weightings of the indices in the LifePath Dynamic 2050 Fund Custom Benchmark are adjusted periodically to reflect the investment adviser’s evaluation and adjustment of the Fund’s asset allocation strategy.
| Key Fund statistics | |
| $425,407,630 | |
| 31 | |
| $307,816 | |
| 23% |
What did the Fund invest in?
(as of December 31, 2025)
| Portfolio composition | ||
| Asset Type(a) | Percent of Net Assets |
|
| 86.0 | % | |
| 17.4 | ||
| 7.0 | ||
| (10.4 | ) | |
| Ten largest holdings | ||
| Security(b) | Percent of Net Assets |
|
| 45.0 | % | |
| 15.1 | ||
| 10.2 | ||
| 6.0 | ||
| 4.8 | ||
| 3.6 | ||
| 3.3 | ||
| 2.3 | ||
| 2.1 | ||
| 0.6 | ||
| The portfolio composition above is calculated using a methodology different than that disclosed in the Fund's prospectus. |
| Excludes short-term securities. |
| Ten largest holdings | ||
| Security(b) | Percent of Net Assets |
|
| 45.0 | % | |
| 15.1 | ||
| 10.2 | ||
| 6.0 | ||
| 4.8 | ||
| 3.6 | ||
| 3.3 | ||
| 2.3 | ||
| 2.1 | ||
| 0.6 | ||
What were the Fund costs for the last year ?
(based on a hypothetical $10,000 investment)
| Class name | Costs of a $10,000 investment |
Costs paid as a percentage of a $10,000 investment |
| $100(a) | 0.93%(a) |
| Excludes fees and expenses incurred indirectly as a result of investments in underlying funds. |
How did the Fund perform last year ?
- For the reporting period ended December 31, 2025, the Fund’s Class R Shares returned 14.76%.
- For the same period, the Fund’s benchmark, the Russell 1000® Index returned 17.37% and the Bloomberg U.S. Aggregate Bond Index returned 7.30%. The LifePath Dynamic 2035 Fund Custom Benchmark returned 16.08%.
What contributed to performance?
U.S. equities were the top contributor to absolute performance in the funds furthest from retirement, followed by international equities, BlackRock Tactical Opportunities Fund (a liquid macro strategy), investment-grade bonds, and U.S. real estate investment trusts (REITs).
U.S. equities were the top contributor in the funds at and near retirement, followed by investment-grade bonds, international equities, U.S. Treasury Inflation Protected Securities (TIPS), global infrastructure stocks, and BlackRock Tactical Opportunities Fund.
The funds used derivatives, including financial futures, swaps, and foreign currency transactions, as a means to hedge and/or take outright views on equities, interest rates, credit risk, and/or currencies. The use of derivatives as opposed to physical securities did not have a material impact on performance.
What detracted from performance?
Currency positioning was the primary detractor from performance in the funds furthest from retirement.
In the vintages at and near retirement, currency pair trades were the primary detractor.
The views expressed reflect the opinions of BlackRock as of the date of this report and are subject to change based on changes in market, economic or other conditions. These views are not intended to be a forecast of future events and are no guarantee of future results.
Fund performance
Cumulative performance: January 1, 2016 through December 31, 2025
Initial investment of $10,000
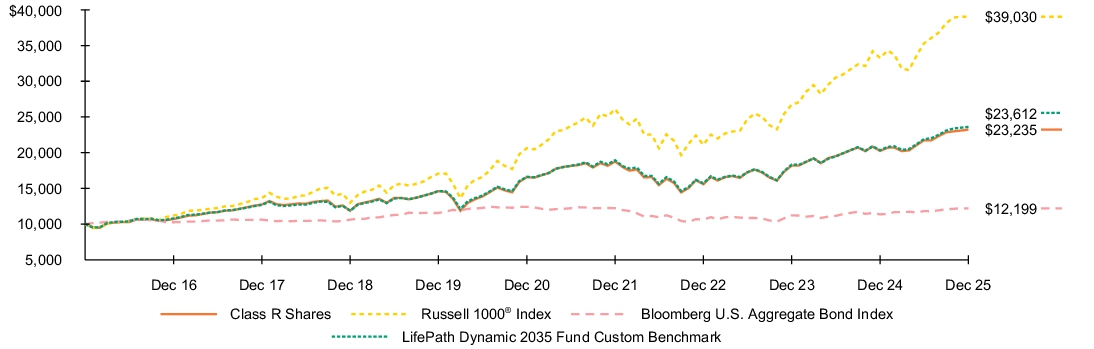
See “Average annual total returns” for additional information on fund performance.
| Average annual total returns | ||||||
| 1 Year | 5 Years | 10 Years | ||||
| 14.76 | % | 6.99 | % | 8.80 | % | |
| 17.37 | 13.59 | 14.59 | ||||
| 7.30 | (0.36 | ) | 2.01 | |||
| 16.08 | 7.27 | 8.97 |
The Fund compares its performance to that of a customized weighted index (the “LifePath Dynamic 2035 Fund Custom Benchmark”) comprised of the Bloomberg U.S. Intermediate Credit Bond Index, Bloomberg U.S. Intermediate Government Bond Index, Bloomberg U.S. Long Credit Bond Index, Bloomberg U.S. Long Government Bond Index, Bloomberg U.S. Securitized: MBS, ABS and CMBS Index, FTSE Nareit All Equity REIT Index, ICE® U.S. Treasury 0-5 Year Inflation Linked Bond Index, MSCI ACWI ex USA IMI Index (Net), Russell 1000® Index, Russell 2000® Index and S&P Global Infrastructure IndexTM (Net), which are representative of the asset classes in which the Fund invests. The weightings of the indices in the LifePath Dynamic 2035 Fund Custom Benchmark are adjusted periodically to reflect the investment adviser’s evaluation and adjustment of the Fund’s asset allocation strategy.
| Key Fund statistics | |
| $458,660,348 | |
| 38 | |
| $354,699 | |
| 13% |
What did the Fund invest in?
(as of December 31, 2025)
| Portfolio composition | ||
| Asset Type(a) | Percent of Net Assets |
|
| 65.2 | % | |
| 25.5 | ||
| 13.8 | ||
| (4.5 | ) | |
| Ten largest holdings | ||
| Security(b) | Percent of Net Assets |
|
| 35.3 | % | |
| 20.5 | ||
| 12.3 | ||
| 6.4 | ||
| 4.9 | ||
| 4.6 | ||
| 2.0 | ||
| 1.9 | ||
| 1.7 | ||
| 0.6 | ||
| The portfolio composition above is calculated using a methodology different than that disclosed in the Fund's prospectus. |
| Excludes short-term securities. |
| Ten largest holdings | ||
| Security(b) | Percent of Net Assets |
|
| 35.3 | % | |
| 20.5 | ||
| 12.3 | ||
| 6.4 | ||
| 4.9 | ||
| 4.6 | ||
| 2.0 | ||
| 1.9 | ||
| 1.7 | ||
| 0.6 | ||
What were the Fund costs for the last year ?
(based on a hypothetical $10,000 investment)
| Class name | Costs of a $10,000 investment |
Costs paid as a percentage of a $10,000 investment |
| $25(a) | 0.23%(a) |
| Excludes fees and expenses incurred indirectly as a result of investments in underlying funds. |
How did the Fund perform last year ?
- For the reporting period ended December 31, 2025, the Fund’s Class K Shares returned 15.57%.
- For the same period, the Fund’s benchmark, the Russell 1000® Index returned 17.37% and the Bloomberg U.S. Aggregate Bond Index returned 7.30%. The LifePath Dynamic 2035 Fund Custom Benchmark returned 16.08%.
What contributed to performance?
U.S. equities were the top contributor to absolute performance in the funds furthest from retirement, followed by international equities, BlackRock Tactical Opportunities Fund (a liquid macro strategy), investment-grade bonds, and U.S. real estate investment trusts (REITs).
U.S. equities were the top contributor in the funds at and near retirement, followed by investment-grade bonds, international equities, U.S. Treasury Inflation Protected Securities (TIPS), global infrastructure stocks, and BlackRock Tactical Opportunities Fund.
The funds used derivatives, including financial futures, swaps, and foreign currency transactions, as a means to hedge and/or take outright views on equities, interest rates, credit risk, and/or currencies. The use of derivatives as opposed to physical securities did not have a material impact on performance.
What detracted from performance?
Currency positioning was the primary detractor from performance in the funds furthest from retirement.
In the vintages at and near retirement, currency pair trades were the primary detractor.
The views expressed reflect the opinions of BlackRock as of the date of this report and are subject to change based on changes in market, economic or other conditions. These views are not intended to be a forecast of future events and are no guarantee of future results.
Fund performance
Cumulative performance: January 1, 2016 through December 31, 2025
Initial investment of $10,000
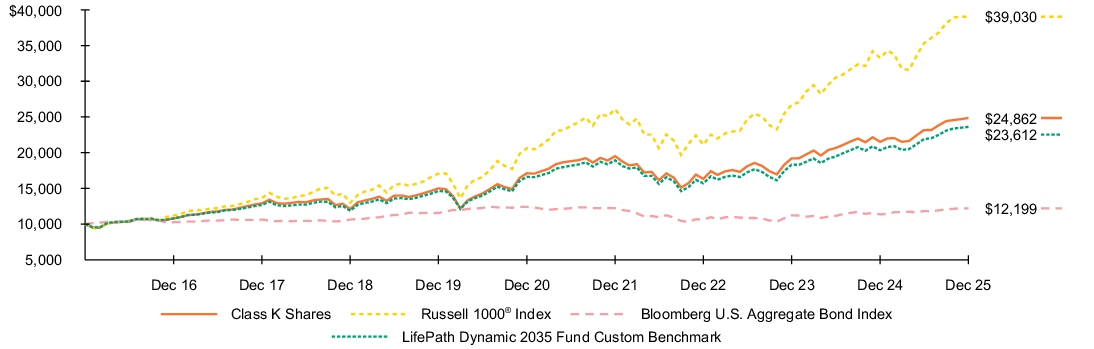
See “Average annual total returns” for additional information on fund performance.
| Average annual total returns | ||||||
| 1 Year | 5 Years | 10 Years | ||||
| 15.57 | % | 7.74 | % | 9.54 | % | |
| 17.37 | 13.59 | 14.59 | ||||
| 7.30 | (0.36 | ) | 2.01 | |||
| 16.08 | 7.27 | 8.97 |
The Fund compares its performance to that of a customized weighted index (the “LifePath Dynamic 2035 Fund Custom Benchmark”) comprised of the Bloomberg U.S. Intermediate Credit Bond Index, Bloomberg U.S. Intermediate Government Bond Index, Bloomberg U.S. Long Credit Bond Index, Bloomberg U.S. Long Government Bond Index, Bloomberg U.S. Securitized: MBS, ABS and CMBS Index, FTSE Nareit All Equity REIT Index, ICE® U.S. Treasury 0-5 Year Inflation Linked Bond Index, MSCI ACWI ex USA IMI Index (Net), Russell 1000® Index, Russell 2000® Index and S&P Global Infrastructure IndexTM (Net), which are representative of the asset classes in which the Fund invests. The weightings of the indices in the LifePath Dynamic 2035 Fund Custom Benchmark are adjusted periodically to reflect the investment adviser’s evaluation and adjustment of the Fund’s asset allocation strategy.
| Key Fund statistics | |
| $458,660,348 | |
| 38 | |
| $354,699 | |
| 13% |
What did the Fund invest in?
(as of December 31, 2025)
| Portfolio composition | ||
| Asset Type(a) | Percent of Net Assets |
|
| 65.2 | % | |
| 25.5 | ||
| 13.8 | ||
| (4.5 | ) | |
| Ten largest holdings | ||
| Security(b) | Percent of Net Assets |
|
| 35.3 | % | |
| 20.5 | ||
| 12.3 | ||
| 6.4 | ||
| 4.9 | ||
| 4.6 | ||
| 2.0 | ||
| 1.9 | ||
| 1.7 | ||
| 0.6 | ||
| The portfolio composition above is calculated using a methodology different than that disclosed in the Fund's prospectus. |
| Excludes short-term securities. |
| Ten largest holdings | ||
| Security(b) | Percent of Net Assets |
|
| 35.3 | % | |
| 20.5 | ||
| 12.3 | ||
| 6.4 | ||
| 4.9 | ||
| 4.6 | ||
| 2.0 | ||
| 1.9 | ||
| 1.7 | ||
| 0.6 | ||
What were the Fund costs for the last year ?
(based on a hypothetical $10,000 investment)
| Class name | Costs of a $10,000 investment |
Costs paid as a percentage of a $10,000 investment |
| $158(a) | 1.48%(a) |
| Excludes fees and expenses incurred indirectly as a result of investments in underlying funds. |
How did the Fund perform last year ?
- For the reporting period ended December 31, 2025, the Fund’s Investor C Shares returned 14.10%.
- For the same period, the Fund’s benchmark, the Russell 1000® Index returned 17.37% and the Bloomberg U.S. Aggregate Bond Index returned 7.30%. The LifePath Dynamic 2035 Fund Custom Benchmark returned 16.08%.
What contributed to performance?
U.S. equities were the top contributor to absolute performance in the funds furthest from retirement, followed by international equities, BlackRock Tactical Opportunities Fund (a liquid macro strategy), investment-grade bonds, and U.S. real estate investment trusts (REITs).
U.S. equities were the top contributor in the funds at and near retirement, followed by investment-grade bonds, international equities, U.S. Treasury Inflation Protected Securities (TIPS), global infrastructure stocks, and BlackRock Tactical Opportunities Fund.
The funds used derivatives, including financial futures, swaps, and foreign currency transactions, as a means to hedge and/or take outright views on equities, interest rates, credit risk, and/or currencies. The use of derivatives as opposed to physical securities did not have a material impact on performance.
What detracted from performance?
Currency positioning was the primary detractor from performance in the funds furthest from retirement.
In the vintages at and near retirement, currency pair trades were the primary detractor.
The views expressed reflect the opinions of BlackRock as of the date of this report and are subject to change based on changes in market, economic or other conditions. These views are not intended to be a forecast of future events and are no guarantee of future results.
Fund performance
Cumulative performance: January 1, 2016 through December 31, 2025
Initial investment of $10,000
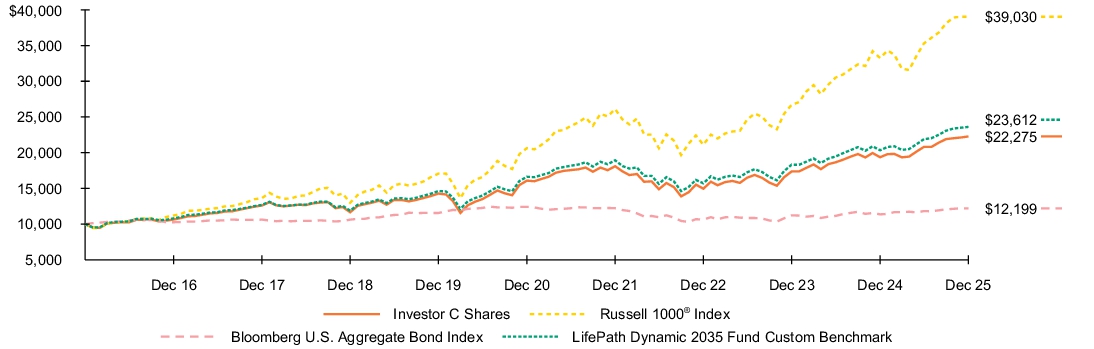
See “Average annual total returns” for additional information on fund performance.
| Average annual total returns | ||||||
| 1 Year | 5 Years | 10 Years | ||||
| 14.10 | % | 6.40 | % | 8.34 | % | |
| 13.10 | 6.40 | 8.34 | ||||
| 17.37 | 13.59 | 14.59 | ||||
| 7.30 | (0.36 | ) | 2.01 | |||
| 16.08 | 7.27 | 8.97 |
The Fund compares its performance to that of a customized weighted index (the “LifePath Dynamic 2035 Fund Custom Benchmark”) comprised of the Bloomberg U.S. Intermediate Credit Bond Index, Bloomberg U.S. Intermediate Government Bond Index, Bloomberg U.S. Long Credit Bond Index, Bloomberg U.S. Long Government Bond Index, Bloomberg U.S. Securitized: MBS, ABS and CMBS Index, FTSE Nareit All Equity REIT Index, ICE® U.S. Treasury 0-5 Year Inflation Linked Bond Index, MSCI ACWI ex USA IMI Index (Net), Russell 1000® Index, Russell 2000® Index and S&P Global Infrastructure IndexTM (Net), which are representative of the asset classes in which the Fund invests. The weightings of the indices in the LifePath Dynamic 2035 Fund Custom Benchmark are adjusted periodically to reflect the investment adviser’s evaluation and adjustment of the Fund’s asset allocation strategy.
| Key Fund statistics | |
| $458,660,348 | |
| 38 | |
| $354,699 | |
| 13% |
What did the Fund invest in?
(as of December 31, 2025)
| Portfolio composition | ||
| Asset Type(a) | Percent of Net Assets |
|
| 65.2 | % | |
| 25.5 | ||
| 13.8 | ||
| (4.5 | ) | |
| Ten largest holdings | ||
| Security(b) | Percent of Net Assets |
|
| 35.3 | % | |
| 20.5 | ||
| 12.3 | ||
| 6.4 | ||
| 4.9 | ||
| 4.6 | ||
| 2.0 | ||
| 1.9 | ||
| 1.7 | ||
| 0.6 | ||
| The portfolio composition above is calculated using a methodology different than that disclosed in the Fund's prospectus. |
| Excludes short-term securities. |
| Ten largest holdings | ||
| Security(b) | Percent of Net Assets |
|
| 35.3 | % | |
| 20.5 | ||
| 12.3 | ||
| 6.4 | ||
| 4.9 | ||
| 4.6 | ||
| 2.0 | ||
| 1.9 | ||
| 1.7 | ||
| 0.6 | ||
What were the Fund costs for the last year ?
(based on a hypothetical $10,000 investment)
| Class name | Costs of a $10,000 investment |
Costs paid as a percentage of a $10,000 investment |
| $78(a) | 0.73%(a) |
| Excludes fees and expenses incurred indirectly as a result of investments in underlying funds. |
How did the Fund perform last year ?
- For the reporting period ended December 31, 2025, the Fund’s Investor A Shares returned 15.04%.
- For the same period, the Fund’s benchmark, the Russell 1000® Index returned 17.37% and the Bloomberg U.S. Aggregate Bond Index returned 7.30%. The LifePath Dynamic 2035 Fund Custom Benchmark returned 16.08%.
What contributed to performance?
U.S. equities were the top contributor to absolute performance in the funds furthest from retirement, followed by international equities, BlackRock Tactical Opportunities Fund (a liquid macro strategy), investment-grade bonds, and U.S. real estate investment trusts (REITs).
U.S. equities were the top contributor in the funds at and near retirement, followed by investment-grade bonds, international equities, U.S. Treasury Inflation Protected Securities (TIPS), global infrastructure stocks, and BlackRock Tactical Opportunities Fund.
The funds used derivatives, including financial futures, swaps, and foreign currency transactions, as a means to hedge and/or take outright views on equities, interest rates, credit risk, and/or currencies. The use of derivatives as opposed to physical securities did not have a material impact on performance.
What detracted from performance?
Currency positioning was the primary detractor from performance in the funds furthest from retirement.
In the vintages at and near retirement, currency pair trades were the primary detractor.
The views expressed reflect the opinions of BlackRock as of the date of this report and are subject to change based on changes in market, economic or other conditions. These views are not intended to be a forecast of future events and are no guarantee of future results.
Fund performance
Cumulative performance: January 1, 2016 through December 31, 2025
Initial investment of $10,000
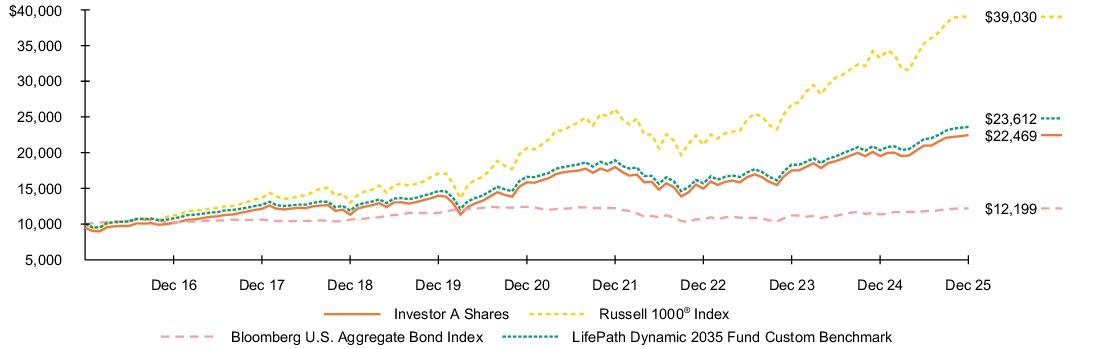
See “Average annual total returns” for additional information on fund performance.
| Average annual total returns | ||||||
| 1 Year | 5 Years | 10 Years | ||||
| 15.04 | % | 7.21 | % | 9.02 | % | |
| 9.00 | 6.06 | 8.43 | ||||
| 17.37 | 13.59 | 14.59 | ||||
| 7.30 | (0.36 | ) | 2.01 | |||
| 16.08 | 7.27 | 8.97 |
The Fund compares its performance to that of a customized weighted index (the “LifePath Dynamic 2035 Fund Custom Benchmark”) comprised of the Bloomberg U.S. Intermediate Credit Bond Index, Bloomberg U.S. Intermediate Government Bond Index, Bloomberg U.S. Long Credit Bond Index, Bloomberg U.S. Long Government Bond Index, Bloomberg U.S. Securitized: MBS, ABS and CMBS Index, FTSE Nareit All Equity REIT Index, ICE® U.S. Treasury 0-5 Year Inflation Linked Bond Index, MSCI ACWI ex USA IMI Index (Net), Russell 1000® Index, Russell 2000® Index and S&P Global Infrastructure IndexTM (Net), which are representative of the asset classes in which the Fund invests. The weightings of the indices in the LifePath Dynamic 2035 Fund Custom Benchmark are adjusted periodically to reflect the investment adviser’s evaluation and adjustment of the Fund’s asset allocation strategy.
| Key Fund statistics | |
| $458,660,348 | |
| 38 | |
| $354,699 | |
| 13% |
What did the Fund invest in?
(as of December 31, 2025)
| Portfolio composition | ||
| Asset Type(a) | Percent of Net Assets |
|
| 65.2 | % | |
| 25.5 | ||
| 13.8 | ||
| (4.5 | ) | |
| Ten largest holdings | ||
| Security(b) | Percent of Net Assets |
|
| 35.3 | % | |
| 20.5 | ||
| 12.3 | ||
| 6.4 | ||
| 4.9 | ||
| 4.6 | ||
| 2.0 | ||
| 1.9 | ||
| 1.7 | ||
| 0.6 | ||
| The portfolio composition above is calculated using a methodology different than that disclosed in the Fund's prospectus. |
| Excludes short-term securities. |
| Ten largest holdings | ||
| Security(b) | Percent of Net Assets |
|
| 35.3 | % | |
| 20.5 | ||
| 12.3 | ||
| 6.4 | ||
| 4.9 | ||
| 4.6 | ||
| 2.0 | ||
| 1.9 | ||
| 1.7 | ||
| 0.6 | ||
What were the Fund costs for the last year ?
(based on a hypothetical $10,000 investment)
| Class name | Costs of a $10,000 investment |
Costs paid as a percentage of a $10,000 investment |
| $52(a) | 0.48%(a) |
| Excludes fees and expenses incurred indirectly as a result of investments in underlying funds. |
How did the Fund perform last year ?
- For the reporting period ended December 31, 2025, the Fund’s Institutional Shares returned 15.28%.
- For the same period, the Fund’s benchmark, the Russell 1000® Index returned 17.37% and the Bloomberg U.S. Aggregate Bond Index returned 7.30%. The LifePath Dynamic 2035 Fund Custom Benchmark returned 16.08%.
What contributed to performance?
U.S. equities were the top contributor to absolute performance in the funds furthest from retirement, followed by international equities, BlackRock Tactical Opportunities Fund (a liquid macro strategy), investment-grade bonds, and U.S. real estate investment trusts (REITs).
U.S. equities were the top contributor in the funds at and near retirement, followed by investment-grade bonds, international equities, U.S. Treasury Inflation Protected Securities (TIPS), global infrastructure stocks, and BlackRock Tactical Opportunities Fund.
The funds used derivatives, including financial futures, swaps, and foreign currency transactions, as a means to hedge and/or take outright views on equities, interest rates, credit risk, and/or currencies. The use of derivatives as opposed to physical securities did not have a material impact on performance.
What detracted from performance?
Currency positioning was the primary detractor from performance in the funds furthest from retirement.
In the vintages at and near retirement, currency pair trades were the primary detractor.
The views expressed reflect the opinions of BlackRock as of the date of this report and are subject to change based on changes in market, economic or other conditions. These views are not intended to be a forecast of future events and are no guarantee of future results.
Fund performance
Cumulative performance: January 1, 2016 through December 31, 2025
Initial investment of $10,000
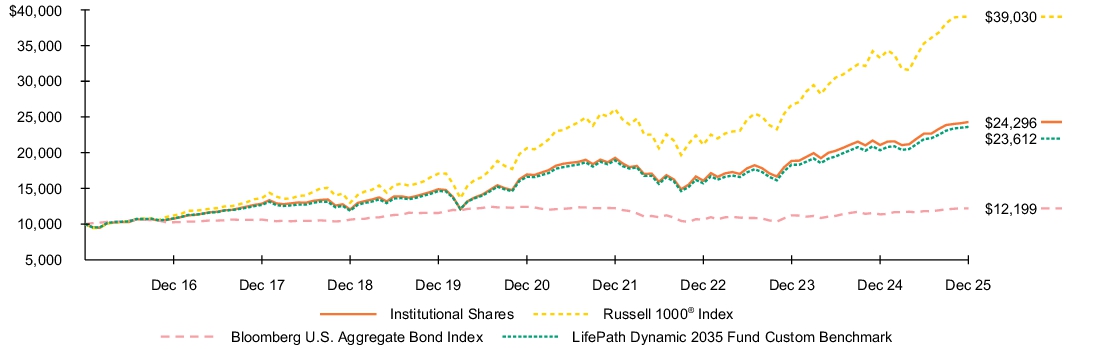
See “Average annual total returns” for additional information on fund performance.
| Average annual total returns | ||||||
| 1 Year | 5 Years | 10 Years | ||||
| 15.28 | % | 7.47 | % | 9.28 | % | |
| 17.37 | 13.59 | 14.59 | ||||
| 7.30 | (0.36 | ) | 2.01 | |||
| 16.08 | 7.27 | 8.97 |
The Fund compares its performance to that of a customized weighted index (the “LifePath Dynamic 2035 Fund Custom Benchmark”) comprised of the Bloomberg U.S. Intermediate Credit Bond Index, Bloomberg U.S. Intermediate Government Bond Index, Bloomberg U.S. Long Credit Bond Index, Bloomberg U.S. Long Government Bond Index, Bloomberg U.S. Securitized: MBS, ABS and CMBS Index, FTSE Nareit All Equity REIT Index, ICE® U.S. Treasury 0-5 Year Inflation Linked Bond Index, MSCI ACWI ex USA IMI Index (Net), Russell 1000® Index, Russell 2000® Index and S&P Global Infrastructure IndexTM (Net), which are representative of the asset classes in which the Fund invests. The weightings of the indices in the LifePath Dynamic 2035 Fund Custom Benchmark are adjusted periodically to reflect the investment adviser’s evaluation and adjustment of the Fund’s asset allocation strategy.
| Key Fund statistics | |
| $458,660,348 | |
| 38 | |
| $354,699 | |
| 13% |
What did the Fund invest in?
(as of December 31, 2025)
| Portfolio composition | ||
| Asset Type(a) | Percent of Net Assets |
|
| 65.2 | % | |
| 25.5 | ||
| 13.8 | ||
| (4.5 | ) | |
| Ten largest holdings | ||
| Security(b) | Percent of Net Assets |
|
| 35.3 | % | |
| 20.5 | ||
| 12.3 | ||
| 6.4 | ||
| 4.9 | ||
| 4.6 | ||
| 2.0 | ||
| 1.9 | ||
| 1.7 | ||
| 0.6 | ||
| The portfolio composition above is calculated using a methodology different than that disclosed in the Fund's prospectus. |
| Excludes short-term securities. |
| Ten largest holdings | ||
| Security(b) | Percent of Net Assets |
|
| 35.3 | % | |
| 20.5 | ||
| 12.3 | ||
| 6.4 | ||
| 4.9 | ||
| 4.6 | ||
| 2.0 | ||
| 1.9 | ||
| 1.7 | ||
| 0.6 | ||
What were the Fund costs for the last year ?
(based on a hypothetical $10,000 investment)
| Class name | Costs of a $10,000 investment |
Costs paid as a percentage of a $10,000 investment |
| $52(a) | 0.48%(a) |
| Excludes fees and expenses incurred indirectly as a result of investments in underlying funds. |
How did the Fund perform last year ?
- For the reporting period ended December 31, 2025, the Fund’s Institutional Shares returned 18.47%.
- For the same period, the Fund’s benchmark, the Russell 1000® Index returned 17.37% and the Bloomberg U.S. Aggregate Bond Index returned 7.30%. The LifePath Dynamic 2045 Fund Custom Benchmark returned 19.15%.
What contributed to performance?
U.S. equities were the top contributor to absolute performance in the funds furthest from retirement, followed by international equities, BlackRock Tactical Opportunities Fund (a liquid macro strategy), investment-grade bonds, and U.S. real estate investment trusts (REITs).
U.S. equities were the top contributor in the funds at and near retirement, followed by investment-grade bonds, international equities, U.S. Treasury Inflation Protected Securities (TIPS), global infrastructure stocks, and BlackRock Tactical Opportunities Fund.
The funds used derivatives, including financial futures, swaps, and foreign currency transactions, as a means to hedge and/or take outright views on equities, interest rates, credit risk, and/or currencies. The use of derivatives as opposed to physical securities did not have a material impact on performance.
What detracted from performance?
Currency positioning was the primary detractor from performance in the funds furthest from retirement.
In the vintages at and near retirement, currency pair trades were the primary detractor.
The views expressed reflect the opinions of BlackRock as of the date of this report and are subject to change based on changes in market, economic or other conditions. These views are not intended to be a forecast of future events and are no guarantee of future results.
Fund performance
Cumulative performance: January 1, 2016 through December 31, 2025
Initial investment of $10,000
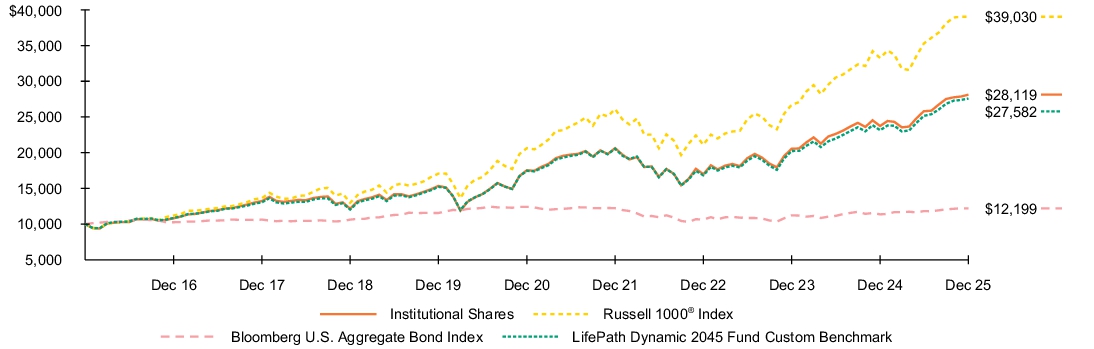
See “Average annual total returns” for additional information on fund performance.
| Average annual total returns | ||||||
| 1 Year | 5 Years | 10 Years | ||||
| 18.47 | % | 9.90 | % | 10.89 | % | |
| 17.37 | 13.59 | 14.59 | ||||
| 7.30 | (0.36 | ) | 2.01 | |||
| 19.15 | 9.58 | 10.68 |
The Fund compares its performance to that of a customized weighted index (the “LifePath Dynamic 2045 Fund Custom Benchmark”) comprised of the Bloomberg U.S. Intermediate Credit Bond Index, Bloomberg U.S. Intermediate Government Bond Index, Bloomberg U.S. Long Credit Bond Index, Bloomberg U.S. Long Government Bond Index, Bloomberg U.S. Securitized: MBS, ABS and CMBS Index, FTSE Nareit All Equity REIT Index, ICE® U.S. Treasury 0-5 Year Inflation Linked Bond Index, MSCI ACWI ex USA IMI Index (Net), Russell 1000® Index, Russell 2000® Index and S&P Global Infrastructure IndexTM (Net), which are representative of the asset classes in which the Fund invests. The weightings of the indices in the LifePath Dynamic 2045 Fund Custom Benchmark are adjusted periodically to reflect the investment adviser’s evaluation and adjustment of the Fund’s asset allocation strategy.
| Key Fund statistics | |
| $390,804,021 | |
| 33 | |
| $250,292 | |
| 21% |
What did the Fund invest in?
(as of December 31, 2025)
| Portfolio composition | ||
| Asset Type(a) | Percent of Net Assets |
|
| 78.4 | % | |
| 16.3 | ||
| 12.6 | ||
| (7.3 | ) | |
| Ten largest holdings | ||
| Security(b) | Percent of Net Assets |
|
| 40.3 | % | |
| 14.8 | ||
| 8.9 | ||
| 8.4 | ||
| 4.9 | ||
| 4.3 | ||
| 3.3 | ||
| 3.0 | ||
| 2.1 | ||
| 0.6 | ||
| The portfolio composition above is calculated using a methodology different than that disclosed in the Fund's prospectus. |
| Excludes short-term securities. |
| Ten largest holdings | ||
| Security(b) | Percent of Net Assets |
|
| 40.3 | % | |
| 14.8 | ||
| 8.9 | ||
| 8.4 | ||
| 4.9 | ||
| 4.3 | ||
| 3.3 | ||
| 3.0 | ||
| 2.1 | ||
| 0.6 | ||
What were the Fund costs for the last year ?
(based on a hypothetical $10,000 investment)
| Class name | Costs of a $10,000 investment |
Costs paid as a percentage of a $10,000 investment |
| $80(a) | 0.73%(a) |
| Excludes fees and expenses incurred indirectly as a result of investments in underlying funds. |
How did the Fund perform last year ?
- For the reporting period ended December 31, 2025, the Fund’s Investor A Shares returned 18.13%.
- For the same period, the Fund’s benchmark, the Russell 1000® Index returned 17.37% and the Bloomberg U.S. Aggregate Bond Index returned 7.30%. The LifePath Dynamic 2045 Fund Custom Benchmark returned 19.15%.
What contributed to performance?
U.S. equities were the top contributor to absolute performance in the funds furthest from retirement, followed by international equities, BlackRock Tactical Opportunities Fund (a liquid macro strategy), investment-grade bonds, and U.S. real estate investment trusts (REITs).
U.S. equities were the top contributor in the funds at and near retirement, followed by investment-grade bonds, international equities, U.S. Treasury Inflation Protected Securities (TIPS), global infrastructure stocks, and BlackRock Tactical Opportunities Fund.
The funds used derivatives, including financial futures, swaps, and foreign currency transactions, as a means to hedge and/or take outright views on equities, interest rates, credit risk, and/or currencies. The use of derivatives as opposed to physical securities did not have a material impact on performance.
What detracted from performance?
Currency positioning was the primary detractor from performance in the funds furthest from retirement.
In the vintages at and near retirement, currency pair trades were the primary detractor.
The views expressed reflect the opinions of BlackRock as of the date of this report and are subject to change based on changes in market, economic or other conditions. These views are not intended to be a forecast of future events and are no guarantee of future results.
Fund performance
Cumulative performance: January 1, 2016 through December 31, 2025
Initial investment of $10,000
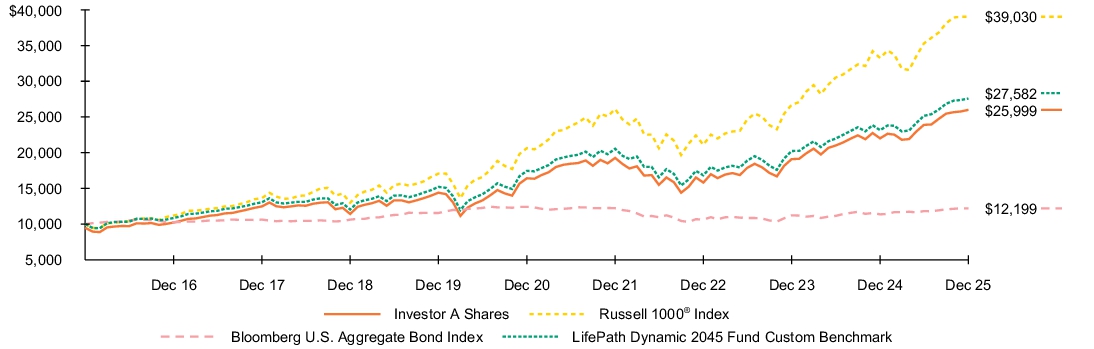
See “Average annual total returns” for additional information on fund performance.
| Average annual total returns | ||||||
| 1 Year | 5 Years | 10 Years | ||||
| 18.13 | % | 9.63 | % | 10.62 | % | |
| 11.93 | 8.45 | 10.03 | ||||
| 17.37 | 13.59 | 14.59 | ||||
| 7.30 | (0.36 | ) | 2.01 | |||
| 19.15 | 9.58 | 10.68 |
The Fund compares its performance to that of a customized weighted index (the “LifePath Dynamic 2045 Fund Custom Benchmark”) comprised of the Bloomberg U.S. Intermediate Credit Bond Index, Bloomberg U.S. Intermediate Government Bond Index, Bloomberg U.S. Long Credit Bond Index, Bloomberg U.S. Long Government Bond Index, Bloomberg U.S. Securitized: MBS, ABS and CMBS Index, FTSE Nareit All Equity REIT Index, ICE® U.S. Treasury 0-5 Year Inflation Linked Bond Index, MSCI ACWI ex USA IMI Index (Net), Russell 1000® Index, Russell 2000® Index and S&P Global Infrastructure IndexTM (Net), which are representative of the asset classes in which the Fund invests. The weightings of the indices in the LifePath Dynamic 2045 Fund Custom Benchmark are adjusted periodically to reflect the investment adviser’s evaluation and adjustment of the Fund’s asset allocation strategy.
| Key Fund statistics | |
| $390,804,021 | |
| 33 | |
| $250,292 | |
| 21% |
What did the Fund invest in?
(as of December 31, 2025)
| Portfolio composition | ||
| Asset Type(a) | Percent of Net Assets |
|
| 78.4 | % | |
| 16.3 | ||
| 12.6 | ||
| (7.3 | ) | |
| Ten largest holdings | ||
| Security(b) | Percent of Net Assets |
|
| 40.3 | % | |
| 14.8 | ||
| 8.9 | ||
| 8.4 | ||
| 4.9 | ||
| 4.3 | ||
| 3.3 | ||
| 3.0 | ||
| 2.1 | ||
| 0.6 | ||
| The portfolio composition above is calculated using a methodology different than that disclosed in the Fund's prospectus. |
| Excludes short-term securities. |
| Ten largest holdings | ||
| Security(b) | Percent of Net Assets |
|
| 40.3 | % | |
| 14.8 | ||
| 8.9 | ||
| 8.4 | ||
| 4.9 | ||
| 4.3 | ||
| 3.3 | ||
| 3.0 | ||
| 2.1 | ||
| 0.6 | ||
What were the Fund costs for the last year ?
(based on a hypothetical $10,000 investment)
| Class name | Costs of a $10,000 investment |
Costs paid as a percentage of a $10,000 investment |
| $161(a) | 1.48%(a) |
| Excludes fees and expenses incurred indirectly as a result of investments in underlying funds. |
How did the Fund perform last year ?
- For the reporting period ended December 31, 2025, the Fund’s Investor C Shares returned 17.26%.
- For the same period, the Fund’s benchmark, the Russell 1000® Index returned 17.37% and the Bloomberg U.S. Aggregate Bond Index returned 7.30%. The LifePath Dynamic 2045 Fund Custom Benchmark returned 19.15%.
What contributed to performance?
U.S. equities were the top contributor to absolute performance in the funds furthest from retirement, followed by international equities, BlackRock Tactical Opportunities Fund (a liquid macro strategy), investment-grade bonds, and U.S. real estate investment trusts (REITs).
U.S. equities were the top contributor in the funds at and near retirement, followed by investment-grade bonds, international equities, U.S. Treasury Inflation Protected Securities (TIPS), global infrastructure stocks, and BlackRock Tactical Opportunities Fund.
The funds used derivatives, including financial futures, swaps, and foreign currency transactions, as a means to hedge and/or take outright views on equities, interest rates, credit risk, and/or currencies. The use of derivatives as opposed to physical securities did not have a material impact on performance.
What detracted from performance?
Currency positioning was the primary detractor from performance in the funds furthest from retirement.
In the vintages at and near retirement, currency pair trades were the primary detractor.
The views expressed reflect the opinions of BlackRock as of the date of this report and are subject to change based on changes in market, economic or other conditions. These views are not intended to be a forecast of future events and are no guarantee of future results.
Fund performance
Cumulative performance: January 1, 2016 through December 31, 2025
Initial investment of $10,000
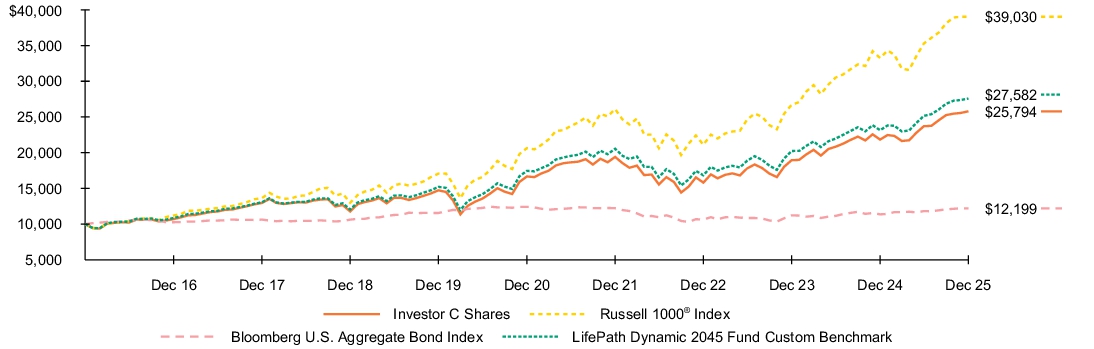
See “Average annual total returns” for additional information on fund performance.
| Average annual total returns | ||||||
| 1 Year | 5 Years | 10 Years | ||||
| 17.26 | % | 8.80 | % | 9.94 | % | |
| 16.26 | 8.80 | 9.94 | ||||
| 17.37 | 13.59 | 14.59 | ||||
| 7.30 | (0.36 | ) | 2.01 | |||
| 19.15 | 9.58 | 10.68 |
The Fund compares its performance to that of a customized weighted index (the “LifePath Dynamic 2045 Fund Custom Benchmark”) comprised of the Bloomberg U.S. Intermediate Credit Bond Index, Bloomberg U.S. Intermediate Government Bond Index, Bloomberg U.S. Long Credit Bond Index, Bloomberg U.S. Long Government Bond Index, Bloomberg U.S. Securitized: MBS, ABS and CMBS Index, FTSE Nareit All Equity REIT Index, ICE® U.S. Treasury 0-5 Year Inflation Linked Bond Index, MSCI ACWI ex USA IMI Index (Net), Russell 1000® Index, Russell 2000® Index and S&P Global Infrastructure IndexTM (Net), which are representative of the asset classes in which the Fund invests. The weightings of the indices in the LifePath Dynamic 2045 Fund Custom Benchmark are adjusted periodically to reflect the investment adviser’s evaluation and adjustment of the Fund’s asset allocation strategy.
| Key Fund statistics | |
| $390,804,021 | |
| 33 | |
| $250,292 | |
| 21% |
What did the Fund invest in?
(as of December 31, 2025)
| Portfolio composition | ||
| Asset Type(a) | Percent of Net Assets |
|
| 78.4 | % | |
| 16.3 | ||
| 12.6 | ||
| (7.3 | ) | |
| Ten largest holdings | ||
| Security(b) | Percent of Net Assets |
|
| 40.3 | % | |
| 14.8 | ||
| 8.9 | ||
| 8.4 | ||
| 4.9 | ||
| 4.3 | ||
| 3.3 | ||
| 3.0 | ||
| 2.1 | ||
| 0.6 | ||
| The portfolio composition above is calculated using a methodology different than that disclosed in the Fund's prospectus. |
| Excludes short-term securities. |
| Ten largest holdings | ||
| Security(b) | Percent of Net Assets |
|
| 40.3 | % | |
| 14.8 | ||
| 8.9 | ||
| 8.4 | ||
| 4.9 | ||
| 4.3 | ||
| 3.3 | ||
| 3.0 | ||
| 2.1 | ||
| 0.6 | ||
What were the Fund costs for the last year ?
(based on a hypothetical $10,000 investment)
| Class name | Costs of a $10,000 investment |
Costs paid as a percentage of a $10,000 investment |
| $25(a) | 0.23%(a) |
| Excludes fees and expenses incurred indirectly as a result of investments in underlying funds. |
How did the Fund perform last year ?
- For the reporting period ended December 31, 2025, the Fund’s Class K Shares returned 18.70%.
- For the same period, the Fund’s benchmark, the Russell 1000® Index returned 17.37% and the Bloomberg U.S. Aggregate Bond Index returned 7.30%. The LifePath Dynamic 2045 Fund Custom Benchmark returned 19.15%.
What contributed to performance?
U.S. equities were the top contributor to absolute performance in the funds furthest from retirement, followed by international equities, BlackRock Tactical Opportunities Fund (a liquid macro strategy), investment-grade bonds, and U.S. real estate investment trusts (REITs).
U.S. equities were the top contributor in the funds at and near retirement, followed by investment-grade bonds, international equities, U.S. Treasury Inflation Protected Securities (TIPS), global infrastructure stocks, and BlackRock Tactical Opportunities Fund.
The funds used derivatives, including financial futures, swaps, and foreign currency transactions, as a means to hedge and/or take outright views on equities, interest rates, credit risk, and/or currencies. The use of derivatives as opposed to physical securities did not have a material impact on performance.
What detracted from performance?
Currency positioning was the primary detractor from performance in the funds furthest from retirement.
In the vintages at and near retirement, currency pair trades were the primary detractor.
The views expressed reflect the opinions of BlackRock as of the date of this report and are subject to change based on changes in market, economic or other conditions. These views are not intended to be a forecast of future events and are no guarantee of future results.
Fund performance
Cumulative performance: January 1, 2016 through December 31, 2025
Initial investment of $10,000
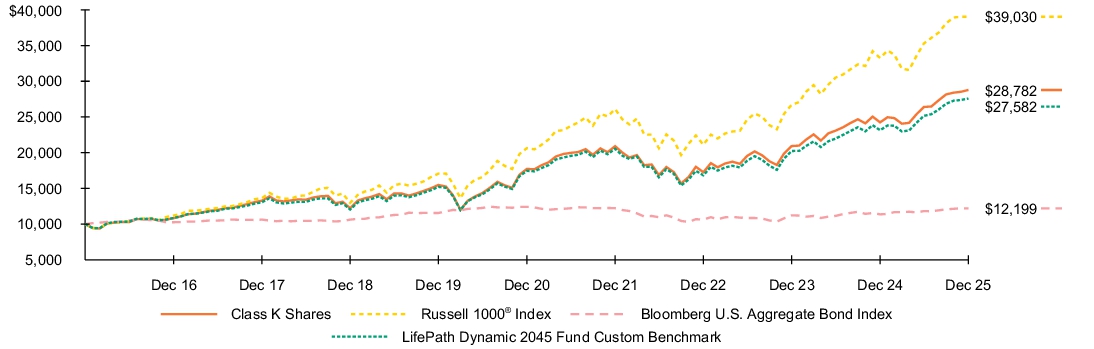
See “Average annual total returns” for additional information on fund performance.
| Average annual total returns | ||||||
| 1 Year | 5 Years | 10 Years | ||||
| 18.70 | % | 10.17 | % | 11.15 | % | |
| 17.37 | 13.59 | 14.59 | ||||
| 7.30 | (0.36 | ) | 2.01 | |||
| 19.15 | 9.58 | 10.68 |
The Fund compares its performance to that of a customized weighted index (the “LifePath Dynamic 2045 Fund Custom Benchmark”) comprised of the Bloomberg U.S. Intermediate Credit Bond Index, Bloomberg U.S. Intermediate Government Bond Index, Bloomberg U.S. Long Credit Bond Index, Bloomberg U.S. Long Government Bond Index, Bloomberg U.S. Securitized: MBS, ABS and CMBS Index, FTSE Nareit All Equity REIT Index, ICE® U.S. Treasury 0-5 Year Inflation Linked Bond Index, MSCI ACWI ex USA IMI Index (Net), Russell 1000® Index, Russell 2000® Index and S&P Global Infrastructure IndexTM (Net), which are representative of the asset classes in which the Fund invests. The weightings of the indices in the LifePath Dynamic 2045 Fund Custom Benchmark are adjusted periodically to reflect the investment adviser’s evaluation and adjustment of the Fund’s asset allocation strategy.
| Key Fund statistics | |
| $390,804,021 | |
| 33 | |
| $250,292 | |
| 21% |
What did the Fund invest in?
(as of December 31, 2025)
| Portfolio composition | ||
| Asset Type(a) | Percent of Net Assets |
|
| 78.4 | % | |
| 16.3 | ||
| 12.6 | ||
| (7.3 | ) | |
| Ten largest holdings | ||
| Security(b) | Percent of Net Assets |
|
| 40.3 | % | |
| 14.8 | ||
| 8.9 | ||
| 8.4 | ||
| 4.9 | ||
| 4.3 | ||
| 3.3 | ||
| 3.0 | ||
| 2.1 | ||
| 0.6 | ||
| The portfolio composition above is calculated using a methodology different than that disclosed in the Fund's prospectus. |
| Excludes short-term securities. |
| Ten largest holdings | ||
| Security(b) | Percent of Net Assets |
|
| 40.3 | % | |
| 14.8 | ||
| 8.9 | ||
| 8.4 | ||
| 4.9 | ||
| 4.3 | ||
| 3.3 | ||
| 3.0 | ||
| 2.1 | ||
| 0.6 | ||
What were the Fund costs for the last year ?
(based on a hypothetical $10,000 investment)
| Class name | Costs of a $10,000 investment |
Costs paid as a percentage of a $10,000 investment |
| $101(a) | 0.93%(a) |
| Excludes fees and expenses incurred indirectly as a result of investments in underlying funds. |
How did the Fund perform last year ?
- For the reporting period ended December 31, 2025, the Fund’s Class R Shares returned 17.87%.
- For the same period, the Fund’s benchmark, the Russell 1000® Index returned 17.37% and the Bloomberg U.S. Aggregate Bond Index returned 7.30%. The LifePath Dynamic 2045 Fund Custom Benchmark returned 19.15%.
What contributed to performance?
U.S. equities were the top contributor to absolute performance in the funds furthest from retirement, followed by international equities, BlackRock Tactical Opportunities Fund (a liquid macro strategy), investment-grade bonds, and U.S. real estate investment trusts (REITs).
U.S. equities were the top contributor in the funds at and near retirement, followed by investment-grade bonds, international equities, U.S. Treasury Inflation Protected Securities (TIPS), global infrastructure stocks, and BlackRock Tactical Opportunities Fund.
The funds used derivatives, including financial futures, swaps, and foreign currency transactions, as a means to hedge and/or take outright views on equities, interest rates, credit risk, and/or currencies. The use of derivatives as opposed to physical securities did not have a material impact on performance.
What detracted from performance?
Currency positioning was the primary detractor from performance in the funds furthest from retirement.
In the vintages at and near retirement, currency pair trades were the primary detractor.
The views expressed reflect the opinions of BlackRock as of the date of this report and are subject to change based on changes in market, economic or other conditions. These views are not intended to be a forecast of future events and are no guarantee of future results.
Fund performance
Cumulative performance: January 1, 2016 through December 31, 2025
Initial investment of $10,000
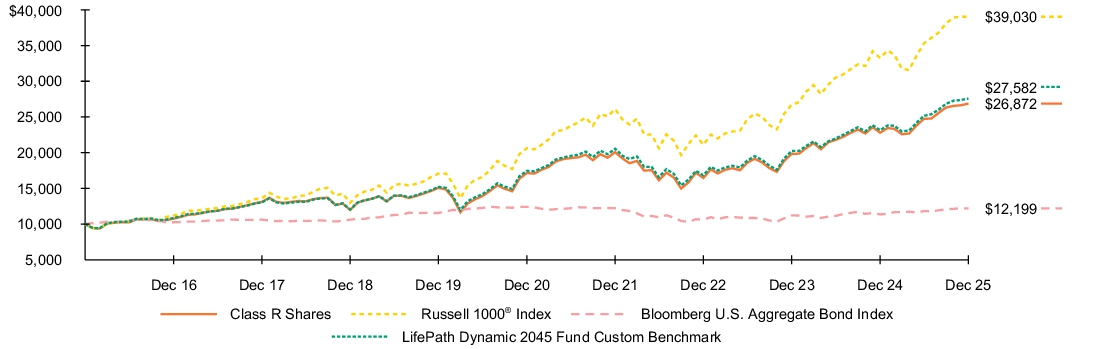
See “Average annual total returns” for additional information on fund performance.
| Average annual total returns | ||||||
| 1 Year | 5 Years | 10 Years | ||||
| 17.87 | % | 9.40 | % | 10.39 | % | |
| 17.37 | 13.59 | 14.59 | ||||
| 7.30 | (0.36 | ) | 2.01 | |||
| 19.15 | 9.58 | 10.68 |
The Fund compares its performance to that of a customized weighted index (the “LifePath Dynamic 2045 Fund Custom Benchmark”) comprised of the Bloomberg U.S. Intermediate Credit Bond Index, Bloomberg U.S. Intermediate Government Bond Index, Bloomberg U.S. Long Credit Bond Index, Bloomberg U.S. Long Government Bond Index, Bloomberg U.S. Securitized: MBS, ABS and CMBS Index, FTSE Nareit All Equity REIT Index, ICE® U.S. Treasury 0-5 Year Inflation Linked Bond Index, MSCI ACWI ex USA IMI Index (Net), Russell 1000® Index, Russell 2000® Index and S&P Global Infrastructure IndexTM (Net), which are representative of the asset classes in which the Fund invests. The weightings of the indices in the LifePath Dynamic 2045 Fund Custom Benchmark are adjusted periodically to reflect the investment adviser’s evaluation and adjustment of the Fund’s asset allocation strategy.
| Key Fund statistics | |
| $390,804,021 | |
| 33 | |
| $250,292 | |
| 21% |
What did the Fund invest in?
(as of December 31, 2025)
| Portfolio composition | ||
| Asset Type(a) | Percent of Net Assets |
|
| 78.4 | % | |
| 16.3 | ||
| 12.6 | ||
| (7.3 | ) | |
| Ten largest holdings | ||
| Security(b) | Percent of Net Assets |
|
| 40.3 | % | |
| 14.8 | ||
| 8.9 | ||
| 8.4 | ||
| 4.9 | ||
| 4.3 | ||
| 3.3 | ||
| 3.0 | ||
| 2.1 | ||
| 0.6 | ||
| The portfolio composition above is calculated using a methodology different than that disclosed in the Fund's prospectus. |
| Excludes short-term securities. |
| Ten largest holdings | ||
| Security(b) | Percent of Net Assets |
|
| 40.3 | % | |
| 14.8 | ||
| 8.9 | ||
| 8.4 | ||
| 4.9 | ||
| 4.3 | ||
| 3.3 | ||
| 3.0 | ||
| 2.1 | ||
| 0.6 | ||
What were the Fund costs for the last year ?
(based on a hypothetical $10,000 investment)
| Class name | Costs of a $10,000 investment |
Costs paid as a percentage of a $10,000 investment |
| $106(a) | 0.96%(a) |
| Excludes fees and expenses incurred indirectly as a result of investments in underlying funds. |
How did the Fund perform last year ?
- For the reporting period ended December 31, 2025, the Fund’s Class R Shares returned 20.39%.
- For the same period, the Fund’s benchmark, the Russell 1000® Index returned 17.37% and the Bloomberg U.S. Aggregate Bond Index returned 7.30%. The LifePath Dynamic 2055 Fund Custom Benchmark returned 21.59%.
What contributed to performance?
U.S. equities were the top contributor to absolute performance in the funds furthest from retirement, followed by international equities, BlackRock Tactical Opportunities Fund (a liquid macro strategy), investment-grade bonds, and U.S. real estate investment trusts (REITs).
U.S. equities were the top contributor in the funds at and near retirement, followed by investment-grade bonds, international equities, U.S. Treasury Inflation Protected Securities (TIPS), global infrastructure stocks, and BlackRock Tactical Opportunities Fund.
The funds used derivatives, including financial futures, swaps, and foreign currency transactions, as a means to hedge and/or take outright views on equities, interest rates, credit risk, and/or currencies. The use of derivatives as opposed to physical securities did not have a material impact on performance.
What detracted from performance?
Currency positioning was the primary detractor from performance in the funds furthest from retirement.
In the vintages at and near retirement, currency pair trades were the primary detractor.
The views expressed reflect the opinions of BlackRock as of the date of this report and are subject to change based on changes in market, economic or other conditions. These views are not intended to be a forecast of future events and are no guarantee of future results.
Fund performance
Cumulative performance: January 1, 2016 through December 31, 2025
Initial investment of $10,000
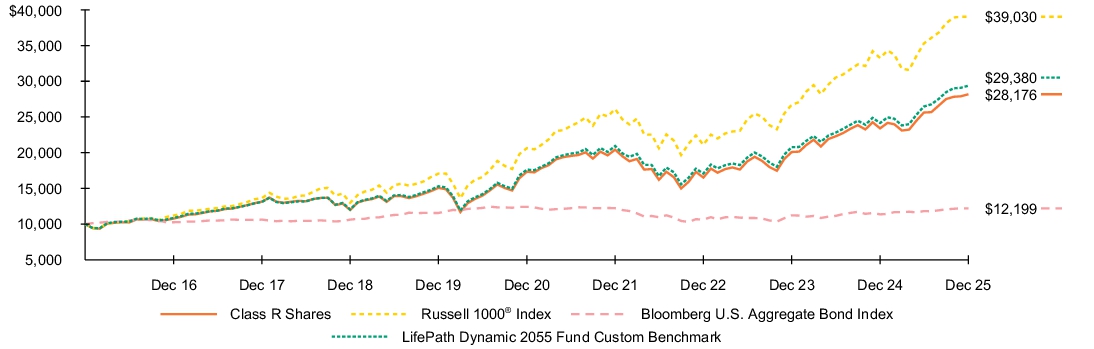
See “Average annual total returns” for additional information on fund performance.
| Average annual total returns | ||||||
| 1 Year | 5 Years | 10 Years | ||||
| 20.39 | % | 10.21 | % | 10.91 | % | |
| 17.37 | 13.59 | 14.59 | ||||
| 7.30 | (0.36 | ) | 2.01 | |||
| 21.59 | 10.76 | 11.38 |
The Fund compares its performance to that of a customized weighted index (the “LifePath Dynamic 2055 Fund Custom Benchmark”) comprised of the Bloomberg U.S. Intermediate Credit Bond Index, Bloomberg U.S. Intermediate Government Bond Index, Bloomberg U.S. Long Credit Bond Index, Bloomberg U.S. Long Government Bond Index, Bloomberg U.S. Securitized: MBS, ABS and CMBS Index, FTSE Nareit All Equity REIT Index, ICE® U.S. Treasury 0-5 Year Inflation Linked Bond Index, MSCI ACWI ex USA IMI Index (Net), Russell 1000® Index, Russell 2000® Index and S&P Global Infrastructure IndexTM (Net), which are representative of the asset classes in which the Fund invests. The weightings of the indices in the LifePath Dynamic 2055 Fund Custom Benchmark are adjusted periodically to reflect the investment adviser’s evaluation and adjustment of the Fund’s asset allocation strategy.
| Key Fund statistics | |
| $319,348,756 | |
| 32 | |
| $240,304 | |
| 21% |
What did the Fund invest in?
(as of December 31, 2025)
| Portfolio composition | ||
| Asset Type(a) | Percent of Net Assets |
|
| 92.2 | % | |
| 12.0 | ||
| 2.9 | ||
| (7.1 | ) | |
| Ten largest holdings | ||
| Security(b) | Percent of Net Assets |
|
| 49.7 | % | |
| 15.0 | ||
| 10.6 | ||
| 7.4 | ||
| 4.9 | ||
| 2.3 | ||
| 1.5 | ||
| 1.4 | ||
| 0.8 | ||
| 0.8 | ||
| The portfolio composition above is calculated using a methodology different than that disclosed in the Fund's prospectus. |
| Excludes short-term securities. |
| Ten largest holdings | ||
| Security(b) | Percent of Net Assets |
|
| 49.7 | % | |
| 15.0 | ||
| 10.6 | ||
| 7.4 | ||
| 4.9 | ||
| 2.3 | ||
| 1.5 | ||
| 1.4 | ||
| 0.8 | ||
| 0.8 | ||
What were the Fund costs for the last year ?
(based on a hypothetical $10,000 investment)
| Class name | Costs of a $10,000 investment |
Costs paid as a percentage of a $10,000 investment |
| $29(a) | 0.26%(a) |
| Excludes fees and expenses incurred indirectly as a result of investments in underlying funds. |
How did the Fund perform last year ?
- For the reporting period ended December 31, 2025, the Fund’s Class K Shares returned 21.21%.
- For the same period, the Fund’s benchmark, the Russell 1000® Index returned 17.37% and the Bloomberg U.S. Aggregate Bond Index returned 7.30%. The LifePath Dynamic 2055 Fund Custom Benchmark returned 21.59%.
What contributed to performance?
U.S. equities were the top contributor to absolute performance in the funds furthest from retirement, followed by international equities, BlackRock Tactical Opportunities Fund (a liquid macro strategy), investment-grade bonds, and U.S. real estate investment trusts (REITs).
U.S. equities were the top contributor in the funds at and near retirement, followed by investment-grade bonds, international equities, U.S. Treasury Inflation Protected Securities (TIPS), global infrastructure stocks, and BlackRock Tactical Opportunities Fund.
The funds used derivatives, including financial futures, swaps, and foreign currency transactions, as a means to hedge and/or take outright views on equities, interest rates, credit risk, and/or currencies. The use of derivatives as opposed to physical securities did not have a material impact on performance.
What detracted from performance?
Currency positioning was the primary detractor from performance in the funds furthest from retirement.
In the vintages at and near retirement, currency pair trades were the primary detractor.
The views expressed reflect the opinions of BlackRock as of the date of this report and are subject to change based on changes in market, economic or other conditions. These views are not intended to be a forecast of future events and are no guarantee of future results.
Fund performance
Cumulative performance: January 1, 2016 through December 31, 2025
Initial investment of $10,000
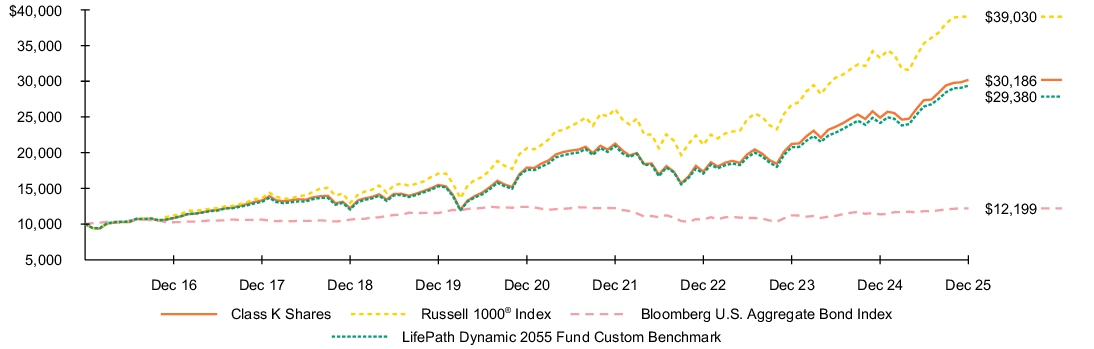
See “Average annual total returns” for additional information on fund performance.
| Average annual total returns | ||||||
| 1 Year | 5 Years | 10 Years | ||||
| 21.21 | % | 10.99 | % | 11.68 | % | |
| 17.37 | 13.59 | 14.59 | ||||
| 7.30 | (0.36 | ) | 2.01 | |||
| 21.59 | 10.76 | 11.38 |
The Fund compares its performance to that of a customized weighted index (the “LifePath Dynamic 2055 Fund Custom Benchmark”) comprised of the Bloomberg U.S. Intermediate Credit Bond Index, Bloomberg U.S. Intermediate Government Bond Index, Bloomberg U.S. Long Credit Bond Index, Bloomberg U.S. Long Government Bond Index, Bloomberg U.S. Securitized: MBS, ABS and CMBS Index, FTSE Nareit All Equity REIT Index, ICE® U.S. Treasury 0-5 Year Inflation Linked Bond Index, MSCI ACWI ex USA IMI Index (Net), Russell 1000® Index, Russell 2000® Index and S&P Global Infrastructure IndexTM (Net), which are representative of the asset classes in which the Fund invests. The weightings of the indices in the LifePath Dynamic 2055 Fund Custom Benchmark are adjusted periodically to reflect the investment adviser’s evaluation and adjustment of the Fund’s asset allocation strategy.
| Key Fund statistics | |
| $319,348,756 | |
| 32 | |
| $240,304 | |
| 21% |
What did the Fund invest in?
(as of December 31, 2025)
| Portfolio composition | ||
| Asset Type(a) | Percent of Net Assets |
|
| 92.2 | % | |
| 12.0 | ||
| 2.9 | ||
| (7.1 | ) | |
| Ten largest holdings | ||
| Security(b) | Percent of Net Assets |
|
| 49.7 | % | |
| 15.0 | ||
| 10.6 | ||
| 7.4 | ||
| 4.9 | ||
| 2.3 | ||
| 1.5 | ||
| 1.4 | ||
| 0.8 | ||
| 0.8 | ||
| The portfolio composition above is calculated using a methodology different than that disclosed in the Fund's prospectus. |
| Excludes short-term securities. |
| Ten largest holdings | ||
| Security(b) | Percent of Net Assets |
|
| 49.7 | % | |
| 15.0 | ||
| 10.6 | ||
| 7.4 | ||
| 4.9 | ||
| 2.3 | ||
| 1.5 | ||
| 1.4 | ||
| 0.8 | ||
| 0.8 | ||
What were the Fund costs for the last year ?
(based on a hypothetical $10,000 investment)
| Class name | Costs of a $10,000 investment |
Costs paid as a percentage of a $10,000 investment |
| $166(a) | 1.51%(a) |
| Excludes fees and expenses incurred indirectly as a result of investments in underlying funds. |
How did the Fund perform last year ?
- For the reporting period ended December 31, 2025, the Fund’s Investor C Shares returned 19.73%.
- For the same period, the Fund’s benchmark, the Russell 1000® Index returned 17.37% and the Bloomberg U.S. Aggregate Bond Index returned 7.30%. The LifePath Dynamic 2055 Fund Custom Benchmark returned 21.59%.
What contributed to performance?
U.S. equities were the top contributor to absolute performance in the funds furthest from retirement, followed by international equities, BlackRock Tactical Opportunities Fund (a liquid macro strategy), investment-grade bonds, and U.S. real estate investment trusts (REITs).
U.S. equities were the top contributor in the funds at and near retirement, followed by investment-grade bonds, international equities, U.S. Treasury Inflation Protected Securities (TIPS), global infrastructure stocks, and BlackRock Tactical Opportunities Fund.
The funds used derivatives, including financial futures, swaps, and foreign currency transactions, as a means to hedge and/or take outright views on equities, interest rates, credit risk, and/or currencies. The use of derivatives as opposed to physical securities did not have a material impact on performance.
What detracted from performance?
Currency positioning was the primary detractor from performance in the funds furthest from retirement.
In the vintages at and near retirement, currency pair trades were the primary detractor.
The views expressed reflect the opinions of BlackRock as of the date of this report and are subject to change based on changes in market, economic or other conditions. These views are not intended to be a forecast of future events and are no guarantee of future results.
Fund performance
Cumulative performance: January 1, 2016 through December 31, 2025
Initial investment of $10,000
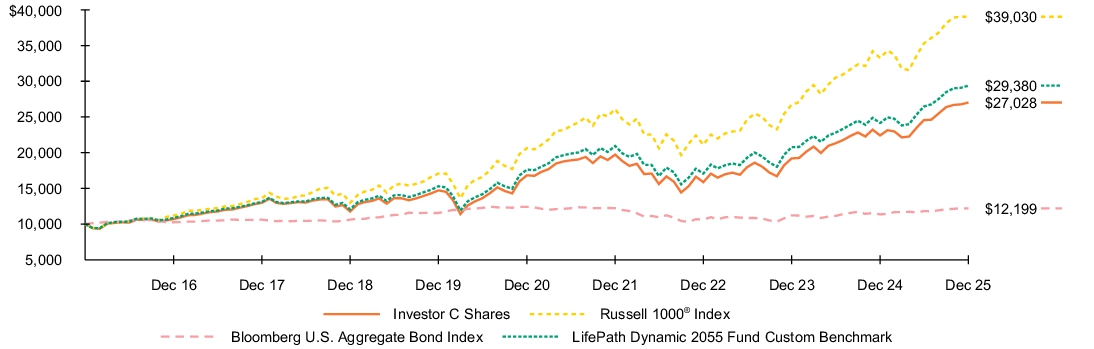
See “Average annual total returns” for additional information on fund performance.
| Average annual total returns | ||||||
| 1 Year | 5 Years | 10 Years | ||||
| 19.73 | % | 9.60 | % | 10.45 | % | |
| 18.73 | 9.60 | 10.45 | ||||
| 17.37 | 13.59 | 14.59 | ||||
| 7.30 | (0.36 | ) | 2.01 | |||
| 21.59 | 10.76 | 11.38 |
The Fund compares its performance to that of a customized weighted index (the “LifePath Dynamic 2055 Fund Custom Benchmark”) comprised of the Bloomberg U.S. Intermediate Credit Bond Index, Bloomberg U.S. Intermediate Government Bond Index, Bloomberg U.S. Long Credit Bond Index, Bloomberg U.S. Long Government Bond Index, Bloomberg U.S. Securitized: MBS, ABS and CMBS Index, FTSE Nareit All Equity REIT Index, ICE® U.S. Treasury 0-5 Year Inflation Linked Bond Index, MSCI ACWI ex USA IMI Index (Net), Russell 1000® Index, Russell 2000® Index and S&P Global Infrastructure IndexTM (Net), which are representative of the asset classes in which the Fund invests. The weightings of the indices in the LifePath Dynamic 2055 Fund Custom Benchmark are adjusted periodically to reflect the investment adviser’s evaluation and adjustment of the Fund’s asset allocation strategy.
| Key Fund statistics | |
| $319,348,756 | |
| 32 | |
| $240,304 | |
| 21% |
What did the Fund invest in?
(as of December 31, 2025)
| Portfolio composition | ||
| Asset Type(a) | Percent of Net Assets |
|
| 92.2 | % | |
| 12.0 | ||
| 2.9 | ||
| (7.1 | ) | |
| Ten largest holdings | ||
| Security(b) | Percent of Net Assets |
|
| 49.7 | % | |
| 15.0 | ||
| 10.6 | ||
| 7.4 | ||
| 4.9 | ||
| 2.3 | ||
| 1.5 | ||
| 1.4 | ||
| 0.8 | ||
| 0.8 | ||
| The portfolio composition above is calculated using a methodology different than that disclosed in the Fund's prospectus. |
| Excludes short-term securities. |
| Ten largest holdings | ||
| Security(b) | Percent of Net Assets |
|
| 49.7 | % | |
| 15.0 | ||
| 10.6 | ||
| 7.4 | ||
| 4.9 | ||
| 2.3 | ||
| 1.5 | ||
| 1.4 | ||
| 0.8 | ||
| 0.8 | ||
What were the Fund costs for the last year ?
(based on a hypothetical $10,000 investment)
| Class name | Costs of a $10,000 investment |
Costs paid as a percentage of a $10,000 investment |
| $84(a) | 0.76%(a) |
| Excludes fees and expenses incurred indirectly as a result of investments in underlying funds. |
How did the Fund perform last year ?
- For the reporting period ended December 31, 2025, the Fund’s Investor A Shares returned 20.58%.
- For the same period, the Fund’s benchmark, the Russell 1000® Index returned 17.37% and the Bloomberg U.S. Aggregate Bond Index returned 7.30%. The LifePath Dynamic 2055 Fund Custom Benchmark returned 21.59%.
What contributed to performance?
U.S. equities were the top contributor to absolute performance in the funds furthest from retirement, followed by international equities, BlackRock Tactical Opportunities Fund (a liquid macro strategy), investment-grade bonds, and U.S. real estate investment trusts (REITs).
U.S. equities were the top contributor in the funds at and near retirement, followed by investment-grade bonds, international equities, U.S. Treasury Inflation Protected Securities (TIPS), global infrastructure stocks, and BlackRock Tactical Opportunities Fund.
The funds used derivatives, including financial futures, swaps, and foreign currency transactions, as a means to hedge and/or take outright views on equities, interest rates, credit risk, and/or currencies. The use of derivatives as opposed to physical securities did not have a material impact on performance.
What detracted from performance?
Currency positioning was the primary detractor from performance in the funds furthest from retirement.
In the vintages at and near retirement, currency pair trades were the primary detractor.
The views expressed reflect the opinions of BlackRock as of the date of this report and are subject to change based on changes in market, economic or other conditions. These views are not intended to be a forecast of future events and are no guarantee of future results.
Fund performance
Cumulative performance: January 1, 2016 through December 31, 2025
Initial investment of $10,000
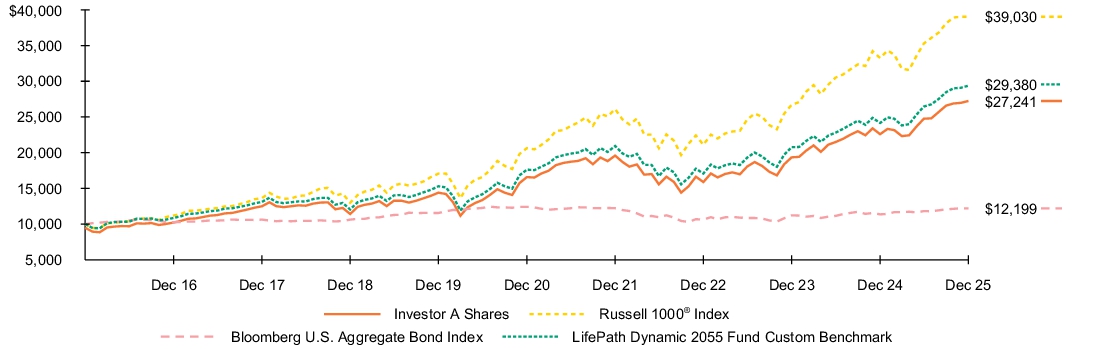
See “Average annual total returns” for additional information on fund performance.
| Average annual total returns | ||||||
| 1 Year | 5 Years | 10 Years | ||||
| 20.58 | % | 10.43 | % | 11.14 | % | |
| 14.25 | 9.25 | 10.54 | ||||
| 17.37 | 13.59 | 14.59 | ||||
| 7.30 | (0.36 | ) | 2.01 | |||
| 21.59 | 10.76 | 11.38 |
The Fund compares its performance to that of a customized weighted index (the “LifePath Dynamic 2055 Fund Custom Benchmark”) comprised of the Bloomberg U.S. Intermediate Credit Bond Index, Bloomberg U.S. Intermediate Government Bond Index, Bloomberg U.S. Long Credit Bond Index, Bloomberg U.S. Long Government Bond Index, Bloomberg U.S. Securitized: MBS, ABS and CMBS Index, FTSE Nareit All Equity REIT Index, ICE® U.S. Treasury 0-5 Year Inflation Linked Bond Index, MSCI ACWI ex USA IMI Index (Net), Russell 1000® Index, Russell 2000® Index and S&P Global Infrastructure IndexTM (Net), which are representative of the asset classes in which the Fund invests. The weightings of the indices in the LifePath Dynamic 2055 Fund Custom Benchmark are adjusted periodically to reflect the investment adviser’s evaluation and adjustment of the Fund’s asset allocation strategy.
| Key Fund statistics | |
| $319,348,756 | |
| 32 | |
| $240,304 | |
| 21% |
What did the Fund invest in?
(as of December 31, 2025)
| Portfolio composition | ||
| Asset Type(a) | Percent of Net Assets |
|
| 92.2 | % | |
| 12.0 | ||
| 2.9 | ||
| (7.1 | ) | |
| Ten largest holdings | ||
| Security(b) | Percent of Net Assets |
|
| 49.7 | % | |
| 15.0 | ||
| 10.6 | ||
| 7.4 | ||
| 4.9 | ||
| 2.3 | ||
| 1.5 | ||
| 1.4 | ||
| 0.8 | ||
| 0.8 | ||
| The portfolio composition above is calculated using a methodology different than that disclosed in the Fund's prospectus. |
| Excludes short-term securities. |
| Ten largest holdings | ||
| Security(b) | Percent of Net Assets |
|
| 49.7 | % | |
| 15.0 | ||
| 10.6 | ||
| 7.4 | ||
| 4.9 | ||
| 2.3 | ||
| 1.5 | ||
| 1.4 | ||
| 0.8 | ||
| 0.8 | ||
What were the Fund costs for the last year ?
(based on a hypothetical $10,000 investment)
| Class name | Costs of a $10,000 investment |
Costs paid as a percentage of a $10,000 investment |
| $56(a) | 0.51%(a) |
| Excludes fees and expenses incurred indirectly as a result of investments in underlying funds. |
How did the Fund perform last year ?
- For the reporting period ended December 31, 2025, the Fund’s Institutional Shares returned 20.92%.
- For the same period, the Fund’s benchmark, the Russell 1000® Index returned 17.37% and the Bloomberg U.S. Aggregate Bond Index returned 7.30%. The LifePath Dynamic 2055 Fund Custom Benchmark returned 21.59%.
What contributed to performance?
U.S. equities were the top contributor to absolute performance in the funds furthest from retirement, followed by international equities, BlackRock Tactical Opportunities Fund (a liquid macro strategy), investment-grade bonds, and U.S. real estate investment trusts (REITs).
U.S. equities were the top contributor in the funds at and near retirement, followed by investment-grade bonds, international equities, U.S. Treasury Inflation Protected Securities (TIPS), global infrastructure stocks, and BlackRock Tactical Opportunities Fund.
The funds used derivatives, including financial futures, swaps, and foreign currency transactions, as a means to hedge and/or take outright views on equities, interest rates, credit risk, and/or currencies. The use of derivatives as opposed to physical securities did not have a material impact on performance.
What detracted from performance?
Currency positioning was the primary detractor from performance in the funds furthest from retirement.
In the vintages at and near retirement, currency pair trades were the primary detractor.
The views expressed reflect the opinions of BlackRock as of the date of this report and are subject to change based on changes in market, economic or other conditions. These views are not intended to be a forecast of future events and are no guarantee of future results.
Fund performance
Cumulative performance: January 1, 2016 through December 31, 2025
Initial investment of $10,000
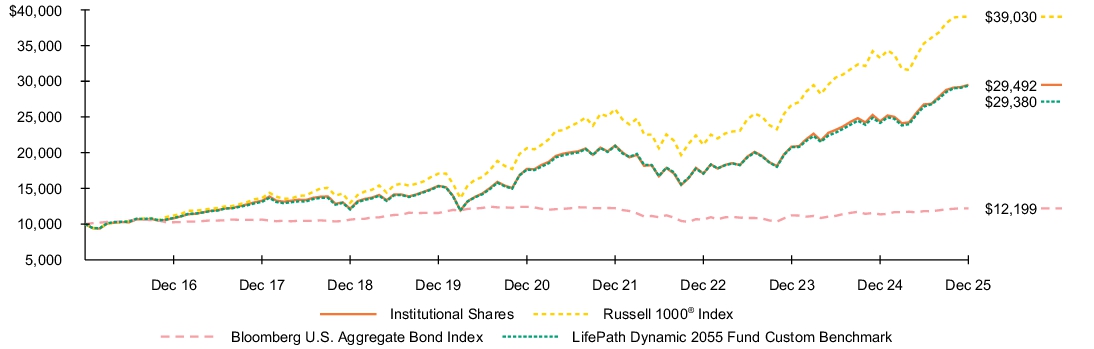
See “Average annual total returns” for additional information on fund performance.
| Average annual total returns | ||||||
| 1 Year | 5 Years | 10 Years | ||||
| 20.92 | % | 10.71 | % | 11.42 | % | |
| 17.37 | 13.59 | 14.59 | ||||
| 7.30 | (0.36 | ) | 2.01 | |||
| 21.59 | 10.76 | 11.38 |
The Fund compares its performance to that of a customized weighted index (the “LifePath Dynamic 2055 Fund Custom Benchmark”) comprised of the Bloomberg U.S. Intermediate Credit Bond Index, Bloomberg U.S. Intermediate Government Bond Index, Bloomberg U.S. Long Credit Bond Index, Bloomberg U.S. Long Government Bond Index, Bloomberg U.S. Securitized: MBS, ABS and CMBS Index, FTSE Nareit All Equity REIT Index, ICE® U.S. Treasury 0-5 Year Inflation Linked Bond Index, MSCI ACWI ex USA IMI Index (Net), Russell 1000® Index, Russell 2000® Index and S&P Global Infrastructure IndexTM (Net), which are representative of the asset classes in which the Fund invests. The weightings of the indices in the LifePath Dynamic 2055 Fund Custom Benchmark are adjusted periodically to reflect the investment adviser’s evaluation and adjustment of the Fund’s asset allocation strategy.
| Key Fund statistics | |
| $319,348,756 | |
| 32 | |
| $240,304 | |
| 21% |
What did the Fund invest in?
(as of December 31, 2025)
| Portfolio composition | ||
| Asset Type(a) | Percent of Net Assets |
|
| 92.2 | % | |
| 12.0 | ||
| 2.9 | ||
| (7.1 | ) | |
| Ten largest holdings | ||
| Security(b) | Percent of Net Assets |
|
| 49.7 | % | |
| 15.0 | ||
| 10.6 | ||
| 7.4 | ||
| 4.9 | ||
| 2.3 | ||
| 1.5 | ||
| 1.4 | ||
| 0.8 | ||
| 0.8 | ||
| The portfolio composition above is calculated using a methodology different than that disclosed in the Fund's prospectus. |
| Excludes short-term securities. |
| Ten largest holdings | ||
| Security(b) | Percent of Net Assets |
|
| 49.7 | % | |
| 15.0 | ||
| 10.6 | ||
| 7.4 | ||
| 4.9 | ||
| 2.3 | ||
| 1.5 | ||
| 1.4 | ||
| 0.8 | ||
| 0.8 | ||
What were the Fund costs for the last year ?
(based on a hypothetical $10,000 investment)
| Class name | Costs of a $10,000 investment |
Costs paid as a percentage of a $10,000 investment |
| $55(a) | 0.50%(a) |
| Excludes fees and expenses incurred indirectly as a result of investments in underlying funds. |
How did the Fund perform last year ?
- For the reporting period ended December 31, 2025, the Fund’s Institutional Shares returned 21.08%.
- For the same period, the Fund’s benchmark, the Russell 1000® Index returned 17.37% and the Bloomberg U.S. Aggregate Bond Index returned 7.30%. The LifePath Dynamic 2060 Fund Custom Benchmark returned 21.74%.
What contributed to performance?
U.S. equities were the top contributor to absolute performance in the funds furthest from retirement, followed by international equities, BlackRock Tactical Opportunities Fund (a liquid macro strategy), investment-grade bonds, and U.S. real estate investment trusts (REITs).
U.S. equities were the top contributor in the funds at and near retirement, followed by investment-grade bonds, international equities, U.S. Treasury Inflation Protected Securities (TIPS), global infrastructure stocks, and BlackRock Tactical Opportunities Fund.
The funds used derivatives, including financial futures, swaps, and foreign currency transactions, as a means to hedge and/or take outright views on equities, interest rates, credit risk, and/or currencies. The use of derivatives as opposed to physical securities did not have a material impact on performance.
What detracted from performance?
Currency positioning was the primary detractor from performance in the funds furthest from retirement.
In the vintages at and near retirement, currency pair trades were the primary detractor.
The views expressed reflect the opinions of BlackRock as of the date of this report and are subject to change based on changes in market, economic or other conditions. These views are not intended to be a forecast of future events and are no guarantee of future results.
Fund performance
Cumulative performance: May 31, 2017 through December 31, 2025
Initial investment of $10,000
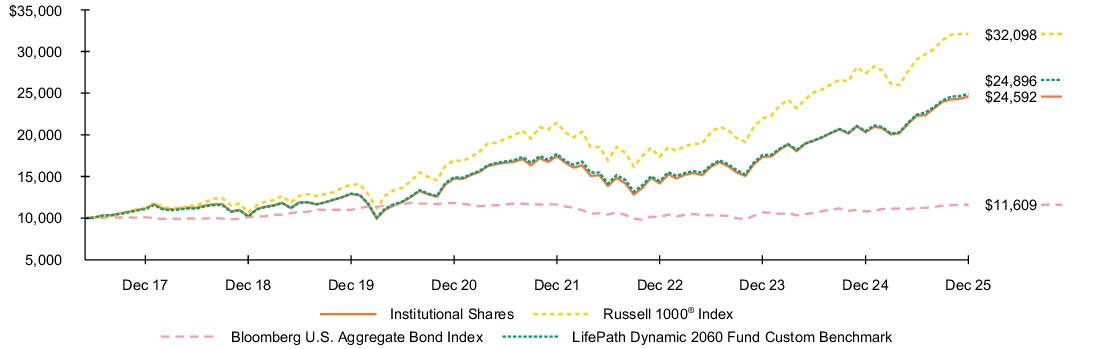
See “Average annual total returns” for additional information on fund performance.
| Average annual total returns | ||||||
| 1 Year | 5 Years | Since Fund Inception |
||||
| 21.08 | % | 10.75 | % | 11.05 | % | |
| 17.37 | 13.59 | 14.55 | ||||
| 7.30 | (0.36 | ) | 1.75 | |||
| 21.74 | 10.80 | 11.21 |
The Fund compares its performance to that of a customized weighted index (the “LifePath Dynamic 2060 Fund Custom Benchmark”) comprised of the Bloomberg U.S. Intermediate Credit Bond Index, Bloomberg U.S. Intermediate Government Bond Index, Bloomberg U.S. Long Credit Bond Index, Bloomberg U.S. Long Government Bond Index, Bloomberg U.S. Securitized: MBS, ABS and CMBS Index, FTSE Nareit All Equity REIT Index, ICE® U.S. Treasury 0-5 Year Inflation Linked Bond Index, MSCI ACWI ex USA IMI Index (Net), Russell 1000® Index, Russell 2000® Index and S&P Global Infrastructure IndexTM (Net), which are representative of the asset classes in which the Fund invests. The weightings of the indices in the LifePath Dynamic 2060 Fund Custom Benchmark are adjusted periodically to reflect the investment adviser’s evaluation and adjustment of the Fund’s asset allocation strategy.
| Key Fund statistics | |
| $167,909,187 | |
| 33 | |
| $115,348 | |
| 20% |
What did the Fund invest in?
(as of December 31, 2025)
| Portfolio composition | ||
| Asset Type(a) | Percent of Net Assets |
|
| 91.6 | % | |
| 11.2 | ||
| 1.8 | ||
| (4.6 | ) | |
| Ten largest holdings | ||
| Security(b) | Percent of Net Assets |
|
| 49.0 | % | |
| 14.7 | ||
| 10.0 | ||
| 7.2 | ||
| 4.8 | ||
| 2.3 | ||
| 2.1 | ||
| 0.9 | ||
| 0.9 | ||
| 0.8 | ||
| The portfolio composition above is calculated using a methodology different than that disclosed in the Fund's prospectus. |
| Excludes short-term securities. |
| Ten largest holdings | ||
| Security(b) | Percent of Net Assets |
|
| 49.0 | % | |
| 14.7 | ||
| 10.0 | ||
| 7.2 | ||
| 4.8 | ||
| 2.3 | ||
| 2.1 | ||
| 0.9 | ||
| 0.9 | ||
| 0.8 | ||
What were the Fund costs for the last year ?
(based on a hypothetical $10,000 investment)
| Class name | Costs of a $10,000 investment |
Costs paid as a percentage of a $10,000 investment |
| $83(a) | 0.75%(a) |
| Excludes fees and expenses incurred indirectly as a result of investments in underlying funds. |
How did the Fund perform last year ?
- For the reporting period ended December 31, 2025, the Fund’s Investor A Shares returned 20.79%.
- For the same period, the Fund’s benchmark, the Russell 1000® Index returned 17.37% and the Bloomberg U.S. Aggregate Bond Index returned 7.30%. The LifePath Dynamic 2060 Fund Custom Benchmark returned 21.74%.
What contributed to performance?
U.S. equities were the top contributor to absolute performance in the funds furthest from retirement, followed by international equities, BlackRock Tactical Opportunities Fund (a liquid macro strategy), investment-grade bonds, and U.S. real estate investment trusts (REITs).
U.S. equities were the top contributor in the funds at and near retirement, followed by investment-grade bonds, international equities, U.S. Treasury Inflation Protected Securities (TIPS), global infrastructure stocks, and BlackRock Tactical Opportunities Fund.
The funds used derivatives, including financial futures, swaps, and foreign currency transactions, as a means to hedge and/or take outright views on equities, interest rates, credit risk, and/or currencies. The use of derivatives as opposed to physical securities did not have a material impact on performance.
What detracted from performance?
Currency positioning was the primary detractor from performance in the funds furthest from retirement.
In the vintages at and near retirement, currency pair trades were the primary detractor.
The views expressed reflect the opinions of BlackRock as of the date of this report and are subject to change based on changes in market, economic or other conditions. These views are not intended to be a forecast of future events and are no guarantee of future results.
Fund performance
Cumulative performance: May 31, 2017 through December 31, 2025
Initial investment of $10,000
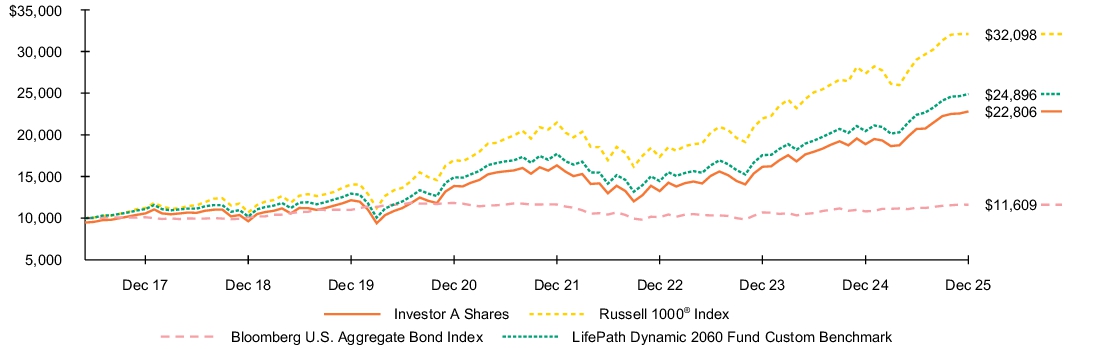
See “Average annual total returns” for additional information on fund performance.
| Average annual total returns | ||||||
| 1 Year | 5 Years | Since Fund Inception |
||||
| 20.79 | % | 10.48 | % | 10.77 | % | |
| 14.44 | 9.29 | 10.07 | ||||
| 17.37 | 13.59 | 14.55 | ||||
| 7.30 | (0.36 | ) | 1.75 | |||
| 21.74 | 10.80 | 11.21 |
The Fund compares its performance to that of a customized weighted index (the “LifePath Dynamic 2060 Fund Custom Benchmark”) comprised of the Bloomberg U.S. Intermediate Credit Bond Index, Bloomberg U.S. Intermediate Government Bond Index, Bloomberg U.S. Long Credit Bond Index, Bloomberg U.S. Long Government Bond Index, Bloomberg U.S. Securitized: MBS, ABS and CMBS Index, FTSE Nareit All Equity REIT Index, ICE® U.S. Treasury 0-5 Year Inflation Linked Bond Index, MSCI ACWI ex USA IMI Index (Net), Russell 1000® Index, Russell 2000® Index and S&P Global Infrastructure IndexTM (Net), which are representative of the asset classes in which the Fund invests. The weightings of the indices in the LifePath Dynamic 2060 Fund Custom Benchmark are adjusted periodically to reflect the investment adviser’s evaluation and adjustment of the Fund’s asset allocation strategy.
| Key Fund statistics | |
| $167,909,187 | |
| 33 | |
| $115,348 | |
| 20% |
What did the Fund invest in?
(as of December 31, 2025)
| Portfolio composition | ||
| Asset Type(a) | Percent of Net Assets |
|
| 91.6 | % | |
| 11.2 | ||
| 1.8 | ||
| (4.6 | ) | |
| Ten largest holdings | ||
| Security(b) | Percent of Net Assets |
|
| 49.0 | % | |
| 14.7 | ||
| 10.0 | ||
| 7.2 | ||
| 4.8 | ||
| 2.3 | ||
| 2.1 | ||
| 0.9 | ||
| 0.9 | ||
| 0.8 | ||
| The portfolio composition above is calculated using a methodology different than that disclosed in the Fund's prospectus. |
| Excludes short-term securities. |
| Ten largest holdings | ||
| Security(b) | Percent of Net Assets |
|
| 49.0 | % | |
| 14.7 | ||
| 10.0 | ||
| 7.2 | ||
| 4.8 | ||
| 2.3 | ||
| 2.1 | ||
| 0.9 | ||
| 0.9 | ||
| 0.8 | ||
What were the Fund costs for the last year ?
(based on a hypothetical $10,000 investment)
| Class name | Costs of a $10,000 investment |
Costs paid as a percentage of a $10,000 investment |
| $166(a) | 1.51%(a) |
| Excludes fees and expenses incurred indirectly as a result of investments in underlying funds. |
How did the Fund perform last year ?
- For the reporting period ended December 31, 2025, the Fund’s Investor C Shares returned 19.90%.
- For the same period, the Fund’s benchmark, the Russell 1000® Index returned 17.37% and the Bloomberg U.S. Aggregate Bond Index returned 7.30%. The LifePath Dynamic 2060 Fund Custom Benchmark returned 21.74%.
What contributed to performance?
U.S. equities were the top contributor to absolute performance in the funds furthest from retirement, followed by international equities, BlackRock Tactical Opportunities Fund (a liquid macro strategy), investment-grade bonds, and U.S. real estate investment trusts (REITs).
U.S. equities were the top contributor in the funds at and near retirement, followed by investment-grade bonds, international equities, U.S. Treasury Inflation Protected Securities (TIPS), global infrastructure stocks, and BlackRock Tactical Opportunities Fund.
The funds used derivatives, including financial futures, swaps, and foreign currency transactions, as a means to hedge and/or take outright views on equities, interest rates, credit risk, and/or currencies. The use of derivatives as opposed to physical securities did not have a material impact on performance.
What detracted from performance?
Currency positioning was the primary detractor from performance in the funds furthest from retirement.
In the vintages at and near retirement, currency pair trades were the primary detractor.
The views expressed reflect the opinions of BlackRock as of the date of this report and are subject to change based on changes in market, economic or other conditions. These views are not intended to be a forecast of future events and are no guarantee of future results.
Fund performance
Cumulative performance: May 31, 2017 through December 31, 2025
Initial investment of $10,000
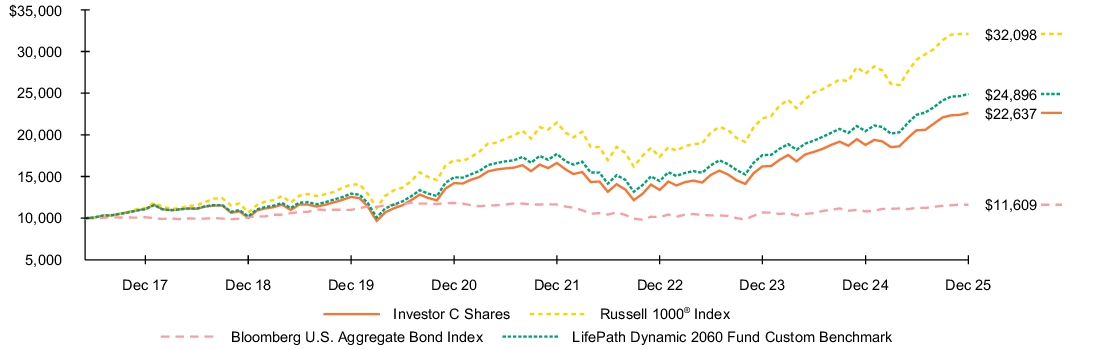
See “Average annual total returns” for additional information on fund performance.
| Average annual total returns | ||||||
| 1 Year | 5 Years | Since Fund Inception |
||||
| 19.90 | % | 9.65 | % | 9.98 | % | |
| 18.90 | 9.65 | 9.98 | ||||
| 17.37 | 13.59 | 14.55 | ||||
| 7.30 | (0.36 | ) | 1.75 | |||
| 21.74 | 10.80 | 11.21 |
The Fund compares its performance to that of a customized weighted index (the “LifePath Dynamic 2060 Fund Custom Benchmark”) comprised of the Bloomberg U.S. Intermediate Credit Bond Index, Bloomberg U.S. Intermediate Government Bond Index, Bloomberg U.S. Long Credit Bond Index, Bloomberg U.S. Long Government Bond Index, Bloomberg U.S. Securitized: MBS, ABS and CMBS Index, FTSE Nareit All Equity REIT Index, ICE® U.S. Treasury 0-5 Year Inflation Linked Bond Index, MSCI ACWI ex USA IMI Index (Net), Russell 1000® Index, Russell 2000® Index and S&P Global Infrastructure IndexTM (Net), which are representative of the asset classes in which the Fund invests. The weightings of the indices in the LifePath Dynamic 2060 Fund Custom Benchmark are adjusted periodically to reflect the investment adviser’s evaluation and adjustment of the Fund’s asset allocation strategy.
| Key Fund statistics | |
| $167,909,187 | |
| 33 | |
| $115,348 | |
| 20% |
What did the Fund invest in?
(as of December 31, 2025)
| Portfolio composition | ||
| Asset Type(a) | Percent of Net Assets |
|
| 91.6 | % | |
| 11.2 | ||
| 1.8 | ||
| (4.6 | ) | |
| Ten largest holdings | ||
| Security(b) | Percent of Net Assets |
|
| 49.0 | % | |
| 14.7 | ||
| 10.0 | ||
| 7.2 | ||
| 4.8 | ||
| 2.3 | ||
| 2.1 | ||
| 0.9 | ||
| 0.9 | ||
| 0.8 | ||
| The portfolio composition above is calculated using a methodology different than that disclosed in the Fund's prospectus. |
| Excludes short-term securities. |
| Ten largest holdings | ||
| Security(b) | Percent of Net Assets |
|
| 49.0 | % | |
| 14.7 | ||
| 10.0 | ||
| 7.2 | ||
| 4.8 | ||
| 2.3 | ||
| 2.1 | ||
| 0.9 | ||
| 0.9 | ||
| 0.8 | ||
What were the Fund costs for the last year ?
(based on a hypothetical $10,000 investment)
| Class name | Costs of a $10,000 investment |
Costs paid as a percentage of a $10,000 investment |
| $28(a) | 0.25%(a) |
| Excludes fees and expenses incurred indirectly as a result of investments in underlying funds. |
How did the Fund perform last year ?
- For the reporting period ended December 31, 2025, the Fund’s Class K Shares returned 21.41%.
- For the same period, the Fund’s benchmark, the Russell 1000® Index returned 17.37% and the Bloomberg U.S. Aggregate Bond Index returned 7.30%. The LifePath Dynamic 2060 Fund Custom Benchmark returned 21.74%.
What contributed to performance?
U.S. equities were the top contributor to absolute performance in the funds furthest from retirement, followed by international equities, BlackRock Tactical Opportunities Fund (a liquid macro strategy), investment-grade bonds, and U.S. real estate investment trusts (REITs).
U.S. equities were the top contributor in the funds at and near retirement, followed by investment-grade bonds, international equities, U.S. Treasury Inflation Protected Securities (TIPS), global infrastructure stocks, and BlackRock Tactical Opportunities Fund.
The funds used derivatives, including financial futures, swaps, and foreign currency transactions, as a means to hedge and/or take outright views on equities, interest rates, credit risk, and/or currencies. The use of derivatives as opposed to physical securities did not have a material impact on performance.
What detracted from performance?
Currency positioning was the primary detractor from performance in the funds furthest from retirement.
In the vintages at and near retirement, currency pair trades were the primary detractor.
The views expressed reflect the opinions of BlackRock as of the date of this report and are subject to change based on changes in market, economic or other conditions. These views are not intended to be a forecast of future events and are no guarantee of future results.
Fund performance
Cumulative performance: May 31, 2017 through December 31, 2025
Initial investment of $10,000
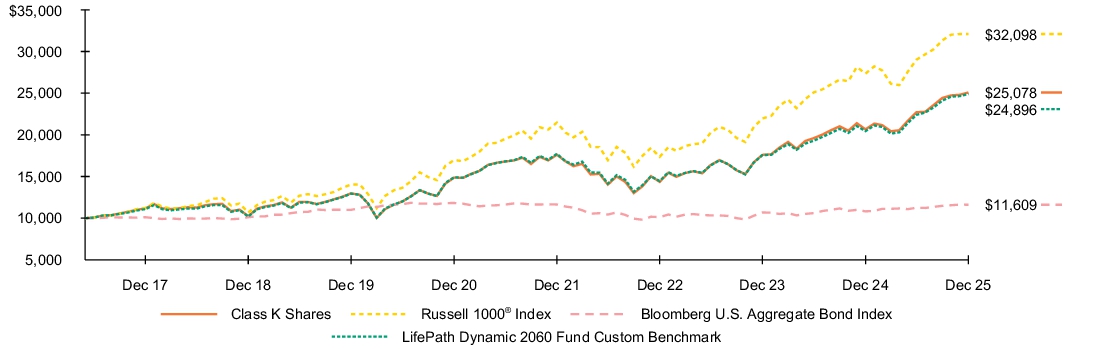
See “Average annual total returns” for additional information on fund performance.
| Average annual total returns | ||||||
| 1 Year | 5 Years | Since Fund Inception |
||||
| 21.41 | % | 11.02 | % | 11.30 | % | |
| 17.37 | 13.59 | 14.55 | ||||
| 7.30 | (0.36 | ) | 1.75 | |||
| 21.74 | 10.80 | 11.21 |
The Fund compares its performance to that of a customized weighted index (the “LifePath Dynamic 2060 Fund Custom Benchmark”) comprised of the Bloomberg U.S. Intermediate Credit Bond Index, Bloomberg U.S. Intermediate Government Bond Index, Bloomberg U.S. Long Credit Bond Index, Bloomberg U.S. Long Government Bond Index, Bloomberg U.S. Securitized: MBS, ABS and CMBS Index, FTSE Nareit All Equity REIT Index, ICE® U.S. Treasury 0-5 Year Inflation Linked Bond Index, MSCI ACWI ex USA IMI Index (Net), Russell 1000® Index, Russell 2000® Index and S&P Global Infrastructure IndexTM (Net), which are representative of the asset classes in which the Fund invests. The weightings of the indices in the LifePath Dynamic 2060 Fund Custom Benchmark are adjusted periodically to reflect the investment adviser’s evaluation and adjustment of the Fund’s asset allocation strategy.
| Key Fund statistics | |
| $167,909,187 | |
| 33 | |
| $115,348 | |
| 20% |
What did the Fund invest in?
(as of December 31, 2025)
| Portfolio composition | ||
| Asset Type(a) | Percent of Net Assets |
|
| 91.6 | % | |
| 11.2 | ||
| 1.8 | ||
| (4.6 | ) | |
| Ten largest holdings | ||
| Security(b) | Percent of Net Assets |
|
| 49.0 | % | |
| 14.7 | ||
| 10.0 | ||
| 7.2 | ||
| 4.8 | ||
| 2.3 | ||
| 2.1 | ||
| 0.9 | ||
| 0.9 | ||
| 0.8 | ||
| The portfolio composition above is calculated using a methodology different than that disclosed in the Fund's prospectus. |
| Excludes short-term securities. |
| Ten largest holdings | ||
| Security(b) | Percent of Net Assets |
|
| 49.0 | % | |
| 14.7 | ||
| 10.0 | ||
| 7.2 | ||
| 4.8 | ||
| 2.3 | ||
| 2.1 | ||
| 0.9 | ||
| 0.9 | ||
| 0.8 | ||
What were the Fund costs for the last year ?
(based on a hypothetical $10,000 investment)
| Class name | Costs of a $10,000 investment |
Costs paid as a percentage of a $10,000 investment |
| $105(a) | 0.95%(a) |
| Excludes fees and expenses incurred indirectly as a result of investments in underlying funds. |
How did the Fund perform last year ?
- For the reporting period ended December 31, 2025, the Fund’s Class R Shares returned 20.53%.
- For the same period, the Fund’s benchmark, the Russell 1000® Index returned 17.37% and the Bloomberg U.S. Aggregate Bond Index returned 7.30%. The LifePath Dynamic 2060 Fund Custom Benchmark returned 21.74%.
What contributed to performance?
U.S. equities were the top contributor to absolute performance in the funds furthest from retirement, followed by international equities, BlackRock Tactical Opportunities Fund (a liquid macro strategy), investment-grade bonds, and U.S. real estate investment trusts (REITs).
U.S. equities were the top contributor in the funds at and near retirement, followed by investment-grade bonds, international equities, U.S. Treasury Inflation Protected Securities (TIPS), global infrastructure stocks, and BlackRock Tactical Opportunities Fund.
The funds used derivatives, including financial futures, swaps, and foreign currency transactions, as a means to hedge and/or take outright views on equities, interest rates, credit risk, and/or currencies. The use of derivatives as opposed to physical securities did not have a material impact on performance.
What detracted from performance?
Currency positioning was the primary detractor from performance in the funds furthest from retirement.
In the vintages at and near retirement, currency pair trades were the primary detractor.
The views expressed reflect the opinions of BlackRock as of the date of this report and are subject to change based on changes in market, economic or other conditions. These views are not intended to be a forecast of future events and are no guarantee of future results.
Fund performance
Cumulative performance: May 31, 2017 through December 31, 2025
Initial investment of $10,000
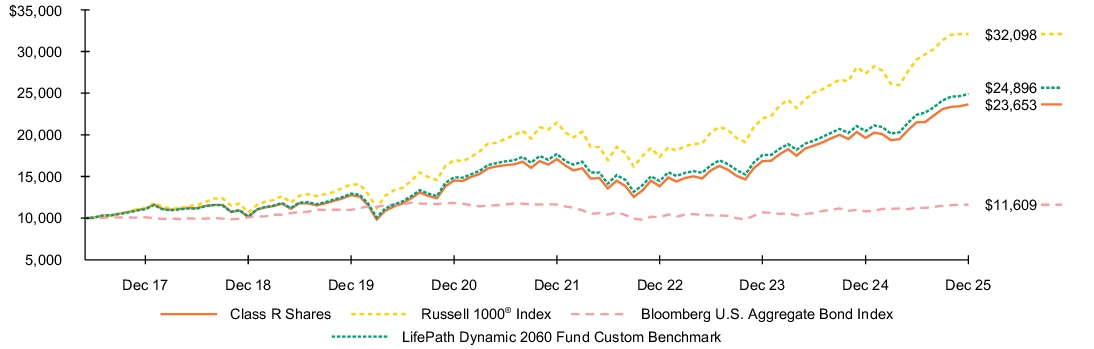
See “Average annual total returns” for additional information on fund performance.
| Average annual total returns | ||||||
| 1 Year | 5 Years | Since Fund Inception |
||||
| 20.53 | % | 10.25 | % | 10.54 | % | |
| 17.37 | 13.59 | 14.55 | ||||
| 7.30 | (0.36 | ) | 1.75 | |||
| 21.74 | 10.80 | 11.21 |
The Fund compares its performance to that of a customized weighted index (the “LifePath Dynamic 2060 Fund Custom Benchmark”) comprised of the Bloomberg U.S. Intermediate Credit Bond Index, Bloomberg U.S. Intermediate Government Bond Index, Bloomberg U.S. Long Credit Bond Index, Bloomberg U.S. Long Government Bond Index, Bloomberg U.S. Securitized: MBS, ABS and CMBS Index, FTSE Nareit All Equity REIT Index, ICE® U.S. Treasury 0-5 Year Inflation Linked Bond Index, MSCI ACWI ex USA IMI Index (Net), Russell 1000® Index, Russell 2000® Index and S&P Global Infrastructure IndexTM (Net), which are representative of the asset classes in which the Fund invests. The weightings of the indices in the LifePath Dynamic 2060 Fund Custom Benchmark are adjusted periodically to reflect the investment adviser’s evaluation and adjustment of the Fund’s asset allocation strategy.
| Key Fund statistics | |
| $167,909,187 | |
| 33 | |
| $115,348 | |
| 20% |
What did the Fund invest in?
(as of December 31, 2025)
| Portfolio composition | ||
| Asset Type(a) | Percent of Net Assets |
|
| 91.6 | % | |
| 11.2 | ||
| 1.8 | ||
| (4.6 | ) | |
| Ten largest holdings | ||
| Security(b) | Percent of Net Assets |
|
| 49.0 | % | |
| 14.7 | ||
| 10.0 | ||
| 7.2 | ||
| 4.8 | ||
| 2.3 | ||
| 2.1 | ||
| 0.9 | ||
| 0.9 | ||
| 0.8 | ||
| The portfolio composition above is calculated using a methodology different than that disclosed in the Fund's prospectus. |
| Excludes short-term securities. |
| Ten largest holdings | ||
| Security(b) | Percent of Net Assets |
|
| 49.0 | % | |
| 14.7 | ||
| 10.0 | ||
| 7.2 | ||
| 4.8 | ||
| 2.3 | ||
| 2.1 | ||
| 0.9 | ||
| 0.9 | ||
| 0.8 | ||
What were the Fund costs for the last year ?
(based on a hypothetical $10,000 investment)
| Class name | Costs of a $10,000 investment |
Costs paid as a percentage of a $10,000 investment |
| $105(a) | 0.95%(a) |
| Excludes fees and expenses incurred indirectly as a result of investments in underlying funds. |
How did the Fund perform last year ?
- For the reporting period ended December 31, 2025, the Fund’s Class R Shares returned 20.44%.
- For the same period, the Fund’s benchmark, the Russell 1000® Index returned 17.37% and the Bloomberg U.S. Aggregate Bond Index returned 7.30%. The LifePath Dynamic 2065 Fund Custom Benchmark returned 21.74%.
What contributed to performance?
U.S. equities were the top contributor to absolute performance in the funds furthest from retirement, followed by international equities, BlackRock Tactical Opportunities Fund (a liquid macro strategy), investment-grade bonds, and U.S. real estate investment trusts (REITs).
U.S. equities were the top contributor in the funds at and near retirement, followed by investment-grade bonds, international equities, U.S. Treasury Inflation Protected Securities (TIPS), global infrastructure stocks, and BlackRock Tactical Opportunities Fund.
The funds used derivatives, including financial futures, swaps, and foreign currency transactions, as a means to hedge and/or take outright views on equities, interest rates, credit risk, and/or currencies. The use of derivatives as opposed to physical securities did not have a material impact on performance.
What detracted from performance?
Currency positioning was the primary detractor from performance in the funds furthest from retirement.
In the vintages at and near retirement, currency pair trades were the primary detractor.
The views expressed reflect the opinions of BlackRock as of the date of this report and are subject to change based on changes in market, economic or other conditions. These views are not intended to be a forecast of future events and are no guarantee of future results.
Fund performance
Cumulative performance: October 30, 2019 through December 31, 2025
Initial investment of $10,000
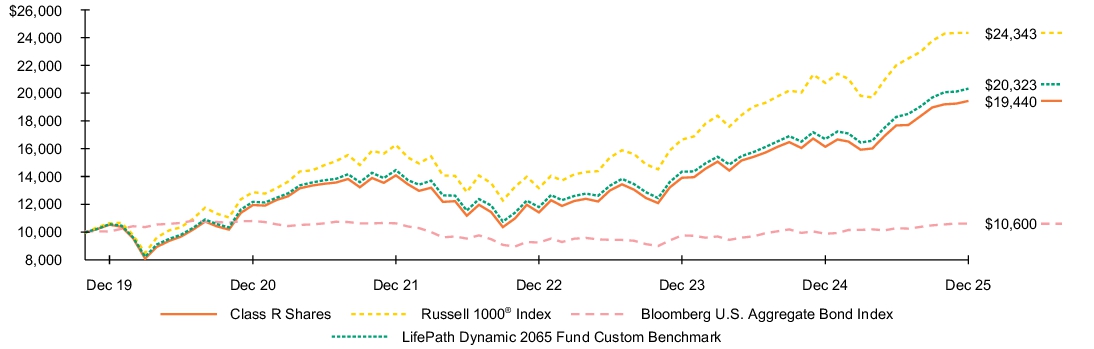
See “Average annual total returns” for additional information on fund performance.
| Average annual total returns | ||||||
| 1 Year | 5 Years | Since Fund Inception |
||||
| 20.44 | % | 10.23 | % | 11.37 | % | |
| 17.37 | 13.59 | 15.52 | ||||
| 7.30 | (0.36 | ) | 0.95 | |||
| 21.74 | 10.79 | 12.19 |
The Fund compares its performance to that of a customized weighted index (the “LifePath Dynamic 2065 Fund Custom Benchmark”) comprised of the Bloomberg U.S. Intermediate Credit Bond Index, Bloomberg U.S. Intermediate Government Bond Index, Bloomberg U.S. Long Credit Bond Index, Bloomberg U.S. Long Government Bond Index, Bloomberg U.S. Securitized: MBS, ABS and CMBS Index, FTSE Nareit All Equity REIT Index, ICE® U.S. Treasury 0-5 Year Inflation Linked Bond Index, MSCI ACWI ex USA IMI Index (Net), Russell 1000® Index, Russell 2000® Index and S&P Global Infrastructure IndexTM (Net), which are representative of the asset classes in which the Fund invests. The weightings of the indices in the LifePath Dynamic 2065 Fund Custom Benchmark are adjusted periodically to reflect the investment adviser’s evaluation and adjustment of the Fund’s asset allocation strategy.
| Key Fund statistics | |
| $83,509,512 | |
| 36 | |
| $54,038 | |
| 21% |
What did the Fund invest in?
(as of December 31, 2025)
| Portfolio composition | ||
| Asset Type(a) | Percent of Net Assets |
|
| 87.4 | % | |
| 14.8 | ||
| 1.6 | ||
| (3.8 | ) | |
| Ten largest holdings | ||
| Security(b) | Percent of Net Assets |
|
| 46.5 | % | |
| 14.0 | ||
| 9.7 | ||
| 7.0 | ||
| 4.5 | ||
| 2.3 | ||
| 2.1 | ||
| 1.0 | ||
| 0.8 | ||
| 0.7 | ||
| The portfolio composition above is calculated using a methodology different than that disclosed in the Fund's prospectus. |
| Excludes short-term securities. |
| Ten largest holdings | ||
| Security(b) | Percent of Net Assets |
|
| 46.5 | % | |
| 14.0 | ||
| 9.7 | ||
| 7.0 | ||
| 4.5 | ||
| 2.3 | ||
| 2.1 | ||
| 1.0 | ||
| 0.8 | ||
| 0.7 | ||
What were the Fund costs for the last year ?
(based on a hypothetical $10,000 investment)
| Class name | Costs of a $10,000 investment |
Costs paid as a percentage of a $10,000 investment |
| $28(a) | 0.25%(a) |
| Excludes fees and expenses incurred indirectly as a result of investments in underlying funds. |
How did the Fund perform last year ?
- For the reporting period ended December 31, 2025, the Fund’s Class K Shares returned 21.39%.
- For the same period, the Fund’s benchmark, the Russell 1000® Index returned 17.37% and the Bloomberg U.S. Aggregate Bond Index returned 7.30%. The LifePath Dynamic 2065 Fund Custom Benchmark returned 21.74%.
What contributed to performance?
U.S. equities were the top contributor to absolute performance in the funds furthest from retirement, followed by international equities, BlackRock Tactical Opportunities Fund (a liquid macro strategy), investment-grade bonds, and U.S. real estate investment trusts (REITs).
U.S. equities were the top contributor in the funds at and near retirement, followed by investment-grade bonds, international equities, U.S. Treasury Inflation Protected Securities (TIPS), global infrastructure stocks, and BlackRock Tactical Opportunities Fund.
The funds used derivatives, including financial futures, swaps, and foreign currency transactions, as a means to hedge and/or take outright views on equities, interest rates, credit risk, and/or currencies. The use of derivatives as opposed to physical securities did not have a material impact on performance.
What detracted from performance?
Currency positioning was the primary detractor from performance in the funds furthest from retirement.
In the vintages at and near retirement, currency pair trades were the primary detractor.
The views expressed reflect the opinions of BlackRock as of the date of this report and are subject to change based on changes in market, economic or other conditions. These views are not intended to be a forecast of future events and are no guarantee of future results.
Fund performance
Cumulative performance: October 30, 2019 through December 31, 2025
Initial investment of $10,000
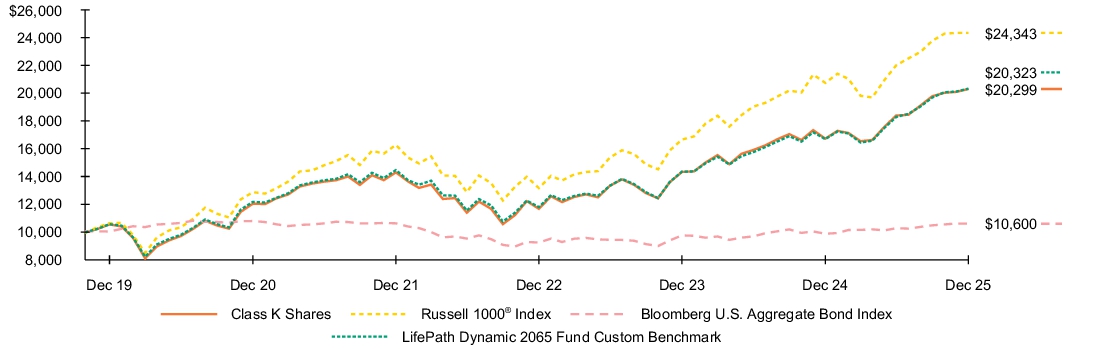
See “Average annual total returns” for additional information on fund performance.
| Average annual total returns | ||||||
| 1 Year | 5 Years | Since Fund Inception |
||||
| 21.39 | % | 11.01 | % | 12.15 | % | |
| 17.37 | 13.59 | 15.52 | ||||
| 7.30 | (0.36 | ) | 0.95 | |||
| 21.74 | 10.79 | 12.19 |
The Fund compares its performance to that of a customized weighted index (the “LifePath Dynamic 2065 Fund Custom Benchmark”) comprised of the Bloomberg U.S. Intermediate Credit Bond Index, Bloomberg U.S. Intermediate Government Bond Index, Bloomberg U.S. Long Credit Bond Index, Bloomberg U.S. Long Government Bond Index, Bloomberg U.S. Securitized: MBS, ABS and CMBS Index, FTSE Nareit All Equity REIT Index, ICE® U.S. Treasury 0-5 Year Inflation Linked Bond Index, MSCI ACWI ex USA IMI Index (Net), Russell 1000® Index, Russell 2000® Index and S&P Global Infrastructure IndexTM (Net), which are representative of the asset classes in which the Fund invests. The weightings of the indices in the LifePath Dynamic 2065 Fund Custom Benchmark are adjusted periodically to reflect the investment adviser’s evaluation and adjustment of the Fund’s asset allocation strategy.
| Key Fund statistics | |
| $83,509,512 | |
| 36 | |
| $54,038 | |
| 21% |
What did the Fund invest in?
(as of December 31, 2025)
| Portfolio composition | ||
| Asset Type(a) | Percent of Net Assets |
|
| 87.4 | % | |
| 14.8 | ||
| 1.6 | ||
| (3.8 | ) | |
| Ten largest holdings | ||
| Security(b) | Percent of Net Assets |
|
| 46.5 | % | |
| 14.0 | ||
| 9.7 | ||
| 7.0 | ||
| 4.5 | ||
| 2.3 | ||
| 2.1 | ||
| 1.0 | ||
| 0.8 | ||
| 0.7 | ||
| The portfolio composition above is calculated using a methodology different than that disclosed in the Fund's prospectus. |
| Excludes short-term securities. |
| Ten largest holdings | ||
| Security(b) | Percent of Net Assets |
|
| 46.5 | % | |
| 14.0 | ||
| 9.7 | ||
| 7.0 | ||
| 4.5 | ||
| 2.3 | ||
| 2.1 | ||
| 1.0 | ||
| 0.8 | ||
| 0.7 | ||
What were the Fund costs for the last year ?
(based on a hypothetical $10,000 investment)
| Class name | Costs of a $10,000 investment |
Costs paid as a percentage of a $10,000 investment |
| $166(a) | 1.51%(a) |
| Excludes fees and expenses incurred indirectly as a result of investments in underlying funds. |
How did the Fund perform last year ?
- For the reporting period ended December 31, 2025, the Fund’s Investor C Shares returned 19.76%.
- For the same period, the Fund’s benchmark, the Russell 1000® Index returned 17.37% and the Bloomberg U.S. Aggregate Bond Index returned 7.30%. The LifePath Dynamic 2065 Fund Custom Benchmark returned 21.74%.
What contributed to performance?
U.S. equities were the top contributor to absolute performance in the funds furthest from retirement, followed by international equities, BlackRock Tactical Opportunities Fund (a liquid macro strategy), investment-grade bonds, and U.S. real estate investment trusts (REITs).
U.S. equities were the top contributor in the funds at and near retirement, followed by investment-grade bonds, international equities, U.S. Treasury Inflation Protected Securities (TIPS), global infrastructure stocks, and BlackRock Tactical Opportunities Fund.
The funds used derivatives, including financial futures, swaps, and foreign currency transactions, as a means to hedge and/or take outright views on equities, interest rates, credit risk, and/or currencies. The use of derivatives as opposed to physical securities did not have a material impact on performance.
What detracted from performance?
Currency positioning was the primary detractor from performance in the funds furthest from retirement.
In the vintages at and near retirement, currency pair trades were the primary detractor.
The views expressed reflect the opinions of BlackRock as of the date of this report and are subject to change based on changes in market, economic or other conditions. These views are not intended to be a forecast of future events and are no guarantee of future results.
Fund performance
Cumulative performance: October 30, 2019 through December 31, 2025
Initial investment of $10,000
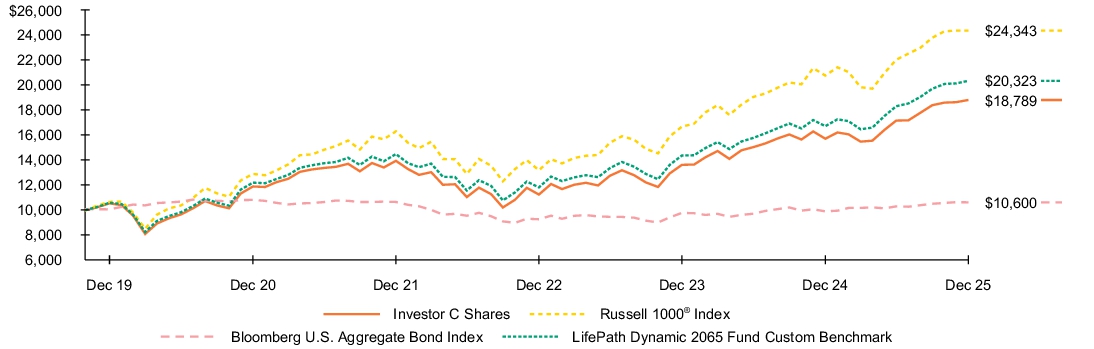
See “Average annual total returns” for additional information on fund performance.
| Average annual total returns | ||||||
| 1 Year | 5 Years | Since Fund Inception |
||||
| 19.76 | % | 9.63 | % | 10.76 | % | |
| 18.76 | 9.63 | 10.76 | ||||
| 17.37 | 13.59 | 15.52 | ||||
| 7.30 | (0.36 | ) | 0.95 | |||
| 21.74 | 10.79 | 12.19 |
The Fund compares its performance to that of a customized weighted index (the “LifePath Dynamic 2065 Fund Custom Benchmark”) comprised of the Bloomberg U.S. Intermediate Credit Bond Index, Bloomberg U.S. Intermediate Government Bond Index, Bloomberg U.S. Long Credit Bond Index, Bloomberg U.S. Long Government Bond Index, Bloomberg U.S. Securitized: MBS, ABS and CMBS Index, FTSE Nareit All Equity REIT Index, ICE® U.S. Treasury 0-5 Year Inflation Linked Bond Index, MSCI ACWI ex USA IMI Index (Net), Russell 1000® Index, Russell 2000® Index and S&P Global Infrastructure IndexTM (Net), which are representative of the asset classes in which the Fund invests. The weightings of the indices in the LifePath Dynamic 2065 Fund Custom Benchmark are adjusted periodically to reflect the investment adviser’s evaluation and adjustment of the Fund’s asset allocation strategy.
| Key Fund statistics | |
| $83,509,512 | |
| 36 | |
| $54,038 | |
| 21% |
What did the Fund invest in?
(as of December 31, 2025)
| Portfolio composition | ||
| Asset Type(a) | Percent of Net Assets |
|
| 87.4 | % | |
| 14.8 | ||
| 1.6 | ||
| (3.8 | ) | |
| Ten largest holdings | ||
| Security(b) | Percent of Net Assets |
|
| 46.5 | % | |
| 14.0 | ||
| 9.7 | ||
| 7.0 | ||
| 4.5 | ||
| 2.3 | ||
| 2.1 | ||
| 1.0 | ||
| 0.8 | ||
| 0.7 | ||
| The portfolio composition above is calculated using a methodology different than that disclosed in the Fund's prospectus. |
| Excludes short-term securities. |
| Ten largest holdings | ||
| Security(b) | Percent of Net Assets |
|
| 46.5 | % | |
| 14.0 | ||
| 9.7 | ||
| 7.0 | ||
| 4.5 | ||
| 2.3 | ||
| 2.1 | ||
| 1.0 | ||
| 0.8 | ||
| 0.7 | ||
What were the Fund costs for the last year ?
(based on a hypothetical $10,000 investment)
| Class name | Costs of a $10,000 investment |
Costs paid as a percentage of a $10,000 investment |
| $83(a) | 0.75%(a) |
| Excludes fees and expenses incurred indirectly as a result of investments in underlying funds. |
How did the Fund perform last year ?
- For the reporting period ended December 31, 2025, the Fund’s Investor A Shares returned 20.66%.
- For the same period, the Fund’s benchmark, the Russell 1000® Index returned 17.37% and the Bloomberg U.S. Aggregate Bond Index returned 7.30%. The LifePath Dynamic 2065 Fund Custom Benchmark returned 21.74%.
What contributed to performance?
U.S. equities were the top contributor to absolute performance in the funds furthest from retirement, followed by international equities, BlackRock Tactical Opportunities Fund (a liquid macro strategy), investment-grade bonds, and U.S. real estate investment trusts (REITs).
U.S. equities were the top contributor in the funds at and near retirement, followed by investment-grade bonds, international equities, U.S. Treasury Inflation Protected Securities (TIPS), global infrastructure stocks, and BlackRock Tactical Opportunities Fund.
The funds used derivatives, including financial futures, swaps, and foreign currency transactions, as a means to hedge and/or take outright views on equities, interest rates, credit risk, and/or currencies. The use of derivatives as opposed to physical securities did not have a material impact on performance.
What detracted from performance?
Currency positioning was the primary detractor from performance in the funds furthest from retirement.
In the vintages at and near retirement, currency pair trades were the primary detractor.
The views expressed reflect the opinions of BlackRock as of the date of this report and are subject to change based on changes in market, economic or other conditions. These views are not intended to be a forecast of future events and are no guarantee of future results.
Fund performance
Cumulative performance: October 30, 2019 through December 31, 2025
Initial investment of $10,000
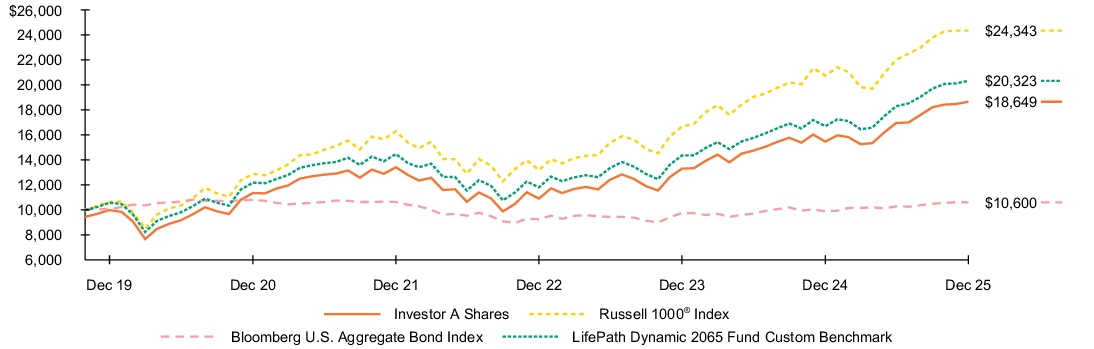
See “Average annual total returns” for additional information on fund performance.
| Average annual total returns | ||||||
| 1 Year | 5 Years | Since Fund Inception |
||||
| 20.66 | % | 10.45 | % | 11.59 | % | |
| 14.32 | 9.26 | 10.62 | ||||
| 17.37 | 13.59 | 15.52 | ||||
| 7.30 | (0.36 | ) | 0.95 | |||
| 21.74 | 10.79 | 12.19 |
The Fund compares its performance to that of a customized weighted index (the “LifePath Dynamic 2065 Fund Custom Benchmark”) comprised of the Bloomberg U.S. Intermediate Credit Bond Index, Bloomberg U.S. Intermediate Government Bond Index, Bloomberg U.S. Long Credit Bond Index, Bloomberg U.S. Long Government Bond Index, Bloomberg U.S. Securitized: MBS, ABS and CMBS Index, FTSE Nareit All Equity REIT Index, ICE® U.S. Treasury 0-5 Year Inflation Linked Bond Index, MSCI ACWI ex USA IMI Index (Net), Russell 1000® Index, Russell 2000® Index and S&P Global Infrastructure IndexTM (Net), which are representative of the asset classes in which the Fund invests. The weightings of the indices in the LifePath Dynamic 2065 Fund Custom Benchmark are adjusted periodically to reflect the investment adviser’s evaluation and adjustment of the Fund’s asset allocation strategy.
| Key Fund statistics | |
| $83,509,512 | |
| 36 | |
| $54,038 | |
| 21% |
What did the Fund invest in?
(as of December 31, 2025)
| Portfolio composition | ||
| Asset Type(a) | Percent of Net Assets |
|
| 87.4 | % | |
| 14.8 | ||
| 1.6 | ||
| (3.8 | ) | |
| Ten largest holdings | ||
| Security(b) | Percent of Net Assets |
|
| 46.5 | % | |
| 14.0 | ||
| 9.7 | ||
| 7.0 | ||
| 4.5 | ||
| 2.3 | ||
| 2.1 | ||
| 1.0 | ||
| 0.8 | ||
| 0.7 | ||
| The portfolio composition above is calculated using a methodology different than that disclosed in the Fund's prospectus. |
| Excludes short-term securities. |
| Ten largest holdings | ||
| Security(b) | Percent of Net Assets |
|
| 46.5 | % | |
| 14.0 | ||
| 9.7 | ||
| 7.0 | ||
| 4.5 | ||
| 2.3 | ||
| 2.1 | ||
| 1.0 | ||
| 0.8 | ||
| 0.7 | ||
What were the Fund costs for the last year ?
(based on a hypothetical $10,000 investment)
| Class name | Costs of a $10,000 investment |
Costs paid as a percentage of a $10,000 investment |
| $55(a) | 0.50%(a) |
| Excludes fees and expenses incurred indirectly as a result of investments in underlying funds. |
How did the Fund perform last year ?
- For the reporting period ended December 31, 2025, the Fund’s Institutional Shares returned 21.02%.
- For the same period, the Fund’s benchmark, the Russell 1000® Index returned 17.37% and the Bloomberg U.S. Aggregate Bond Index returned 7.30%. The LifePath Dynamic 2065 Fund Custom Benchmark returned 21.74%.
What contributed to performance?
U.S. equities were the top contributor to absolute performance in the funds furthest from retirement, followed by international equities, BlackRock Tactical Opportunities Fund (a liquid macro strategy), investment-grade bonds, and U.S. real estate investment trusts (REITs).
U.S. equities were the top contributor in the funds at and near retirement, followed by investment-grade bonds, international equities, U.S. Treasury Inflation Protected Securities (TIPS), global infrastructure stocks, and BlackRock Tactical Opportunities Fund.
The funds used derivatives, including financial futures, swaps, and foreign currency transactions, as a means to hedge and/or take outright views on equities, interest rates, credit risk, and/or currencies. The use of derivatives as opposed to physical securities did not have a material impact on performance.
What detracted from performance?
Currency positioning was the primary detractor from performance in the funds furthest from retirement.
In the vintages at and near retirement, currency pair trades were the primary detractor.
The views expressed reflect the opinions of BlackRock as of the date of this report and are subject to change based on changes in market, economic or other conditions. These views are not intended to be a forecast of future events and are no guarantee of future results.
Fund performance
Cumulative performance: October 30, 2019 through December 31, 2025
Initial investment of $10,000
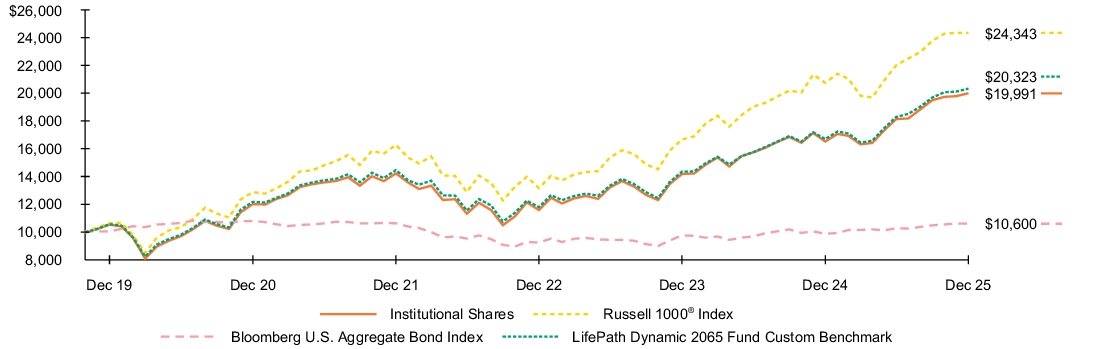
See “Average annual total returns” for additional information on fund performance.
| Average annual total returns | ||||||
| 1 Year | 5 Years | Since Fund Inception |
||||
| 21.02 | % | 10.73 | % | 11.88 | % | |
| 17.37 | 13.59 | 15.52 | ||||
| 7.30 | (0.36 | ) | 0.95 | |||
| 21.74 | 10.79 | 12.19 |
The Fund compares its performance to that of a customized weighted index (the “LifePath Dynamic 2065 Fund Custom Benchmark”) comprised of the Bloomberg U.S. Intermediate Credit Bond Index, Bloomberg U.S. Intermediate Government Bond Index, Bloomberg U.S. Long Credit Bond Index, Bloomberg U.S. Long Government Bond Index, Bloomberg U.S. Securitized: MBS, ABS and CMBS Index, FTSE Nareit All Equity REIT Index, ICE® U.S. Treasury 0-5 Year Inflation Linked Bond Index, MSCI ACWI ex USA IMI Index (Net), Russell 1000® Index, Russell 2000® Index and S&P Global Infrastructure IndexTM (Net), which are representative of the asset classes in which the Fund invests. The weightings of the indices in the LifePath Dynamic 2065 Fund Custom Benchmark are adjusted periodically to reflect the investment adviser’s evaluation and adjustment of the Fund’s asset allocation strategy.
| Key Fund statistics | |
| $83,509,512 | |
| 36 | |
| $54,038 | |
| 21% |
What did the Fund invest in?
(as of December 31, 2025)
| Portfolio composition | ||
| Asset Type(a) | Percent of Net Assets |
|
| 87.4 | % | |
| 14.8 | ||
| 1.6 | ||
| (3.8 | ) | |
| Ten largest holdings | ||
| Security(b) | Percent of Net Assets |
|
| 46.5 | % | |
| 14.0 | ||
| 9.7 | ||
| 7.0 | ||
| 4.5 | ||
| 2.3 | ||
| 2.1 | ||
| 1.0 | ||
| 0.8 | ||
| 0.7 | ||
| The portfolio composition above is calculated using a methodology different than that disclosed in the Fund's prospectus. |
| Excludes short-term securities. |
| Ten largest holdings | ||
| Security(b) | Percent of Net Assets |
|
| 46.5 | % | |
| 14.0 | ||
| 9.7 | ||
| 7.0 | ||
| 4.5 | ||
| 2.3 | ||
| 2.1 | ||
| 1.0 | ||
| 0.8 | ||
| 0.7 | ||
What were the Fund costs for the last year ?
(based on a hypothetical $10,000 investment)
| Class name | Costs of a $10,000 investment |
Costs paid as a percentage of a $10,000 investment |
| $55(a) | 0.50%(a) |
| Excludes fees and expenses incurred indirectly as a result of investments in underlying funds. |
How did the Fund perform last year ?
- For the reporting period ended December 31, 2025, the Fund’s Institutional Shares returned 20.98%.
- For the same period, the Fund’s benchmark, the Russell 1000® Index returned 17.37% and the Bloomberg U.S. Aggregate Bond Index returned 7.30%. The LifePath Dynamic 2070 Fund Custom Benchmark returned 21.74%.
What contributed to performance?
U.S. equities were the top contributor to absolute performance in the funds furthest from retirement, followed by international equities, BlackRock Tactical Opportunities Fund (a liquid macro strategy), investment-grade bonds, and U.S. real estate investment trusts (REITs).
U.S. equities were the top contributor in the funds at and near retirement, followed by investment-grade bonds, international equities, U.S. Treasury Inflation Protected Securities (TIPS), global infrastructure stocks, and BlackRock Tactical Opportunities Fund.
The funds used derivatives, including financial futures, swaps, and foreign currency transactions, as a means to hedge and/or take outright views on equities, interest rates, credit risk, and/or currencies. The use of derivatives as opposed to physical securities did not have a material impact on performance.
What detracted from performance?
Currency positioning was the primary detractor from performance in the funds furthest from retirement.
In the vintages at and near retirement, currency pair trades were the primary detractor.
The views expressed reflect the opinions of BlackRock as of the date of this report and are subject to change based on changes in market, economic or other conditions. These views are not intended to be a forecast of future events and are no guarantee of future results.
Fund performance
Cumulative performance: September 24, 2024 through December 31, 2025
Initial investment of $10,000
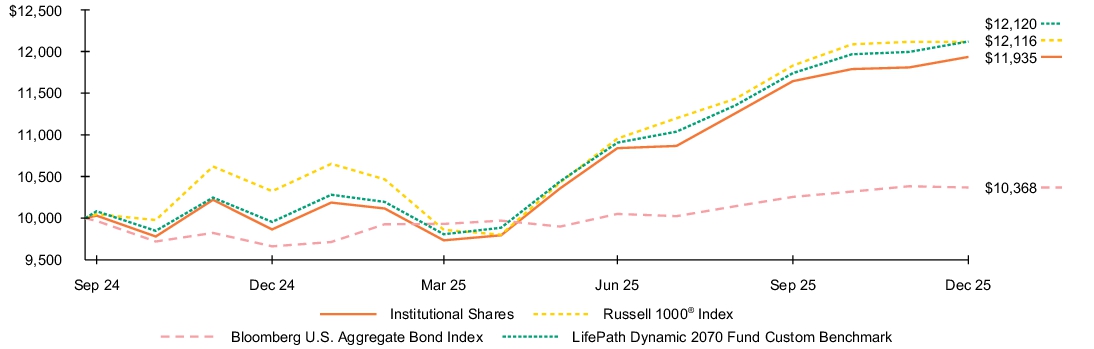
See “Average annual total returns” for additional information on fund performance.
| Average annual total returns | ||||
| 1 Year | Since Fund Inception |
|||
| 20.98 | % | 19.35 | % | |
| 17.37 | 16.36 | |||
| 7.30 | 2.89 | |||
| 21.74 | 16.39 |
The Fund compares its performance to that of a customized weighted index (the “LifePath Dynamic 2070 Fund Custom Benchmark”) comprised of the Bloomberg U.S. Intermediate Credit Bond Index, Bloomberg U.S. Intermediate Government Bond Index, Bloomberg U.S. Long Credit Bond Index, Bloomberg U.S. Long Government Bond Index, Bloomberg U.S. Securitized: MBS, ABS and CMBS Index, FTSE Nareit All Equity REIT Index, ICE® U.S. Treasury 0-5 Year Inflation Linked Bond Index, MSCI ACWI ex USA IMI Index (Net), Russell 1000® Index, Russell 2000® Index and S&P Global Infrastructure IndexTM (Net), which are representative of the asset classes in which the Fund invests. The weightings of the indices in the LifePath Dynamic 2070 Fund Custom Benchmark are adjusted periodically to reflect the investment adviser’s evaluation and adjustment of the Fund’s asset allocation strategy.
| Key Fund statistics | |
| $6,076,678 | |
| 32 | |
| $3,519 | |
| 41% |
What did the Fund invest in?
(as of December 31, 2025)
| Portfolio composition | ||
| Asset Type(a) | Percent of Net Assets |
|
| 97.4 | % | |
| 14.1 | ||
| 1.3 | ||
| (12.8 | ) | |
| Ten largest holdings | ||
| Security(b) | Percent of Net Assets |
|
| 50.0 | % | |
| 12.8 | ||
| 11.6 | ||
| 6.3 | ||
| 4.1 | ||
| 3.3 | ||
| 3.0 | ||
| 2.4 | ||
| 1.8 | ||
| 1.8 | ||
| The portfolio composition above is calculated using a methodology different than that disclosed in the Fund's prospectus. |
| Excludes short-term securities. |
| Ten largest holdings | ||
| Security(b) | Percent of Net Assets |
|
| 50.0 | % | |
| 12.8 | ||
| 11.6 | ||
| 6.3 | ||
| 4.1 | ||
| 3.3 | ||
| 3.0 | ||
| 2.4 | ||
| 1.8 | ||
| 1.8 | ||
What were the Fund costs for the last year ?
(based on a hypothetical $10,000 investment)
| Class name | Costs of a $10,000 investment |
Costs paid as a percentage of a $10,000 investment |
| $83(a) | 0.75%(a) |
| Excludes fees and expenses incurred indirectly as a result of investments in underlying funds. |
How did the Fund perform last year ?
- For the reporting period ended December 31, 2025, the Fund’s Investor A Shares returned 20.73%.
- For the same period, the Fund’s benchmark, the Russell 1000® Index returned 17.37% and the Bloomberg U.S. Aggregate Bond Index returned 7.30%. The LifePath Dynamic 2070 Fund Custom Benchmark returned 21.74%.
What contributed to performance?
U.S. equities were the top contributor to absolute performance in the funds furthest from retirement, followed by international equities, BlackRock Tactical Opportunities Fund (a liquid macro strategy), investment-grade bonds, and U.S. real estate investment trusts (REITs).
U.S. equities were the top contributor in the funds at and near retirement, followed by investment-grade bonds, international equities, U.S. Treasury Inflation Protected Securities (TIPS), global infrastructure stocks, and BlackRock Tactical Opportunities Fund.
The funds used derivatives, including financial futures, swaps, and foreign currency transactions, as a means to hedge and/or take outright views on equities, interest rates, credit risk, and/or currencies. The use of derivatives as opposed to physical securities did not have a material impact on performance.
What detracted from performance?
Currency positioning was the primary detractor from performance in the funds furthest from retirement.
In the vintages at and near retirement, currency pair trades were the primary detractor.
The views expressed reflect the opinions of BlackRock as of the date of this report and are subject to change based on changes in market, economic or other conditions. These views are not intended to be a forecast of future events and are no guarantee of future results.
Fund performance
Cumulative performance: September 24, 2024 through December 31, 2025
Initial investment of $10,000
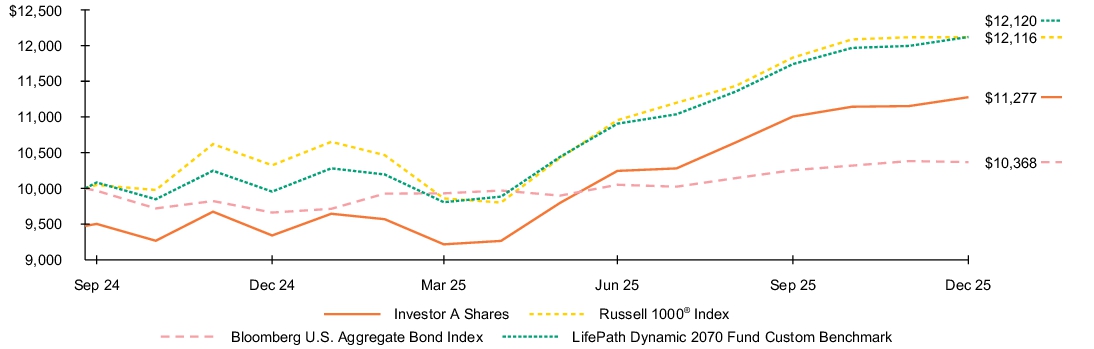
See “Average annual total returns” for additional information on fund performance.
| Average annual total returns | ||||
| 1 Year | Since Fund Inception |
|||
| 20.73 | % | 19.02 | % | |
| 14.39 | 12.77 | |||
| 17.37 | 16.36 | |||
| 7.30 | 2.89 | |||
| 21.74 | 16.39 |
The Fund compares its performance to that of a customized weighted index (the “LifePath Dynamic 2070 Fund Custom Benchmark”) comprised of the Bloomberg U.S. Intermediate Credit Bond Index, Bloomberg U.S. Intermediate Government Bond Index, Bloomberg U.S. Long Credit Bond Index, Bloomberg U.S. Long Government Bond Index, Bloomberg U.S. Securitized: MBS, ABS and CMBS Index, FTSE Nareit All Equity REIT Index, ICE® U.S. Treasury 0-5 Year Inflation Linked Bond Index, MSCI ACWI ex USA IMI Index (Net), Russell 1000® Index, Russell 2000® Index and S&P Global Infrastructure IndexTM (Net), which are representative of the asset classes in which the Fund invests. The weightings of the indices in the LifePath Dynamic 2070 Fund Custom Benchmark are adjusted periodically to reflect the investment adviser’s evaluation and adjustment of the Fund’s asset allocation strategy.
| Key Fund statistics | |
| $6,076,678 | |
| 32 | |
| $3,519 | |
| 41% |
What did the Fund invest in?
(as of December 31, 2025)
| Portfolio composition | ||
| Asset Type(a) | Percent of Net Assets |
|
| 97.4 | % | |
| 14.1 | ||
| 1.3 | ||
| (12.8 | ) | |
| Ten largest holdings | ||
| Security(b) | Percent of Net Assets |
|
| 50.0 | % | |
| 12.8 | ||
| 11.6 | ||
| 6.3 | ||
| 4.1 | ||
| 3.3 | ||
| 3.0 | ||
| 2.4 | ||
| 1.8 | ||
| 1.8 | ||
| The portfolio composition above is calculated using a methodology different than that disclosed in the Fund's prospectus. |
| Excludes short-term securities. |
| Ten largest holdings | ||
| Security(b) | Percent of Net Assets |
|
| 50.0 | % | |
| 12.8 | ||
| 11.6 | ||
| 6.3 | ||
| 4.1 | ||
| 3.3 | ||
| 3.0 | ||
| 2.4 | ||
| 1.8 | ||
| 1.8 | ||
What were the Fund costs for the last year ?
(based on a hypothetical $10,000 investment)
| Class name | Costs of a $10,000 investment |
Costs paid as a percentage of a $10,000 investment |
| $165(a) | 1.50%(a) |
| Excludes fees and expenses incurred indirectly as a result of investments in underlying funds. |
How did the Fund perform last year ?
- For the reporting period ended December 31, 2025, the Fund’s Investor C Shares returned 19.84%.
- For the same period, the Fund’s benchmark, the Russell 1000® Index returned 17.37% and the Bloomberg U.S. Aggregate Bond Index returned 7.30%. The LifePath Dynamic 2070 Fund Custom Benchmark returned 21.74%.
What contributed to performance?
U.S. equities were the top contributor to absolute performance in the funds furthest from retirement, followed by international equities, BlackRock Tactical Opportunities Fund (a liquid macro strategy), investment-grade bonds, and U.S. real estate investment trusts (REITs).
U.S. equities were the top contributor in the funds at and near retirement, followed by investment-grade bonds, international equities, U.S. Treasury Inflation Protected Securities (TIPS), global infrastructure stocks, and BlackRock Tactical Opportunities Fund.
The funds used derivatives, including financial futures, swaps, and foreign currency transactions, as a means to hedge and/or take outright views on equities, interest rates, credit risk, and/or currencies. The use of derivatives as opposed to physical securities did not have a material impact on performance.
What detracted from performance?
Currency positioning was the primary detractor from performance in the funds furthest from retirement.
In the vintages at and near retirement, currency pair trades were the primary detractor.
The views expressed reflect the opinions of BlackRock as of the date of this report and are subject to change based on changes in market, economic or other conditions. These views are not intended to be a forecast of future events and are no guarantee of future results.
Fund performance
Cumulative performance: September 24, 2024 through December 31, 2025
Initial investment of $10,000
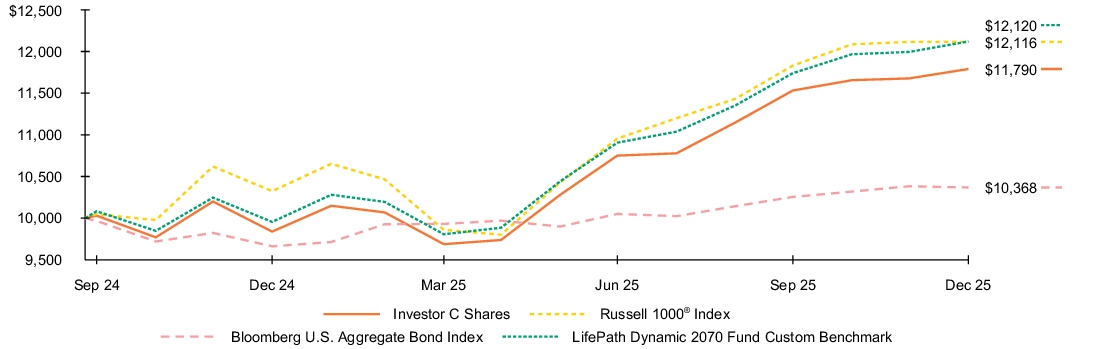
See “Average annual total returns” for additional information on fund performance.
| Average annual total returns | ||||
| 1 Year | Since Fund Inception |
|||
| 19.84 | % | 17.90 | % | |
| 18.84 | 17.90 | |||
| 17.37 | 16.36 | |||
| 7.30 | 2.89 | |||
| 21.74 | 16.39 |
The Fund compares its performance to that of a customized weighted index (the “LifePath Dynamic 2070 Fund Custom Benchmark”) comprised of the Bloomberg U.S. Intermediate Credit Bond Index, Bloomberg U.S. Intermediate Government Bond Index, Bloomberg U.S. Long Credit Bond Index, Bloomberg U.S. Long Government Bond Index, Bloomberg U.S. Securitized: MBS, ABS and CMBS Index, FTSE Nareit All Equity REIT Index, ICE® U.S. Treasury 0-5 Year Inflation Linked Bond Index, MSCI ACWI ex USA IMI Index (Net), Russell 1000® Index, Russell 2000® Index and S&P Global Infrastructure IndexTM (Net), which are representative of the asset classes in which the Fund invests. The weightings of the indices in the LifePath Dynamic 2070 Fund Custom Benchmark are adjusted periodically to reflect the investment adviser’s evaluation and adjustment of the Fund’s asset allocation strategy.
| Key Fund statistics | |
| $6,076,678 | |
| 32 | |
| $3,519 | |
| 41% |
What did the Fund invest in?
(as of December 31, 2025)
| Portfolio composition | ||
| Asset Type(a) | Percent of Net Assets |
|
| 97.4 | % | |
| 14.1 | ||
| 1.3 | ||
| (12.8 | ) | |
| Ten largest holdings | ||
| Security(b) | Percent of Net Assets |
|
| 50.0 | % | |
| 12.8 | ||
| 11.6 | ||
| 6.3 | ||
| 4.1 | ||
| 3.3 | ||
| 3.0 | ||
| 2.4 | ||
| 1.8 | ||
| 1.8 | ||
| The portfolio composition above is calculated using a methodology different than that disclosed in the Fund's prospectus. |
| Excludes short-term securities. |
| Ten largest holdings | ||
| Security(b) | Percent of Net Assets |
|
| 50.0 | % | |
| 12.8 | ||
| 11.6 | ||
| 6.3 | ||
| 4.1 | ||
| 3.3 | ||
| 3.0 | ||
| 2.4 | ||
| 1.8 | ||
| 1.8 | ||
What were the Fund costs for the last year ?
(based on a hypothetical $10,000 investment)
| Class name | Costs of a $10,000 investment |
Costs paid as a percentage of a $10,000 investment |
| $28(a) | 0.25%(a) |
| Excludes fees and expenses incurred indirectly as a result of investments in underlying funds. |
How did the Fund perform last year ?
- For the reporting period ended December 31, 2025, the Fund’s Class K Shares returned 21.26%.
- For the same period, the Fund’s benchmark, the Russell 1000® Index returned 17.37% and the Bloomberg U.S. Aggregate Bond Index returned 7.30%. The LifePath Dynamic 2070 Fund Custom Benchmark returned 21.74%.
What contributed to performance?
U.S. equities were the top contributor to absolute performance in the funds furthest from retirement, followed by international equities, BlackRock Tactical Opportunities Fund (a liquid macro strategy), investment-grade bonds, and U.S. real estate investment trusts (REITs).
U.S. equities were the top contributor in the funds at and near retirement, followed by investment-grade bonds, international equities, U.S. Treasury Inflation Protected Securities (TIPS), global infrastructure stocks, and BlackRock Tactical Opportunities Fund.
The funds used derivatives, including financial futures, swaps, and foreign currency transactions, as a means to hedge and/or take outright views on equities, interest rates, credit risk, and/or currencies. The use of derivatives as opposed to physical securities did not have a material impact on performance.
What detracted from performance?
Currency positioning was the primary detractor from performance in the funds furthest from retirement.
In the vintages at and near retirement, currency pair trades were the primary detractor.
The views expressed reflect the opinions of BlackRock as of the date of this report and are subject to change based on changes in market, economic or other conditions. These views are not intended to be a forecast of future events and are no guarantee of future results.
Fund performance
Cumulative performance: September 24, 2024 through December 31, 2025
Initial investment of $10,000
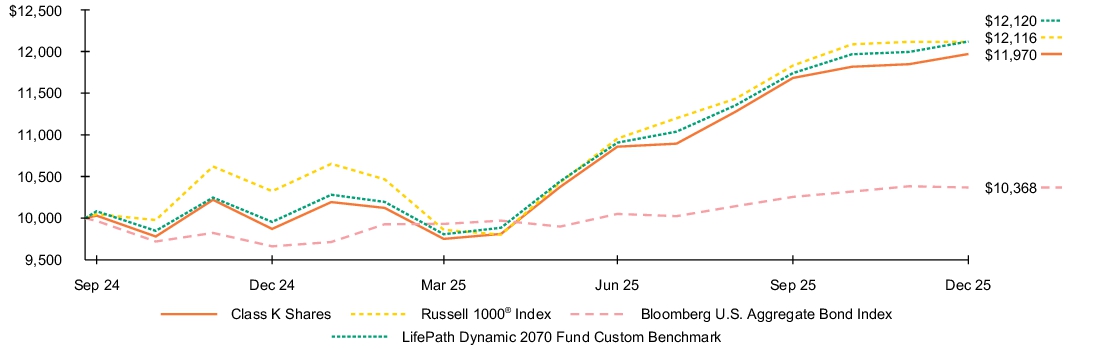
See “Average annual total returns” for additional information on fund performance.
| Average annual total returns | ||||
| 1 Year | Since Fund Inception |
|||
| 21.26 | % | 19.70 | % | |
| 17.37 | 16.36 | |||
| 7.30 | 2.89 | |||
| 21.74 | 16.39 |
The Fund compares its performance to that of a customized weighted index (the “LifePath Dynamic 2070 Fund Custom Benchmark”) comprised of the Bloomberg U.S. Intermediate Credit Bond Index, Bloomberg U.S. Intermediate Government Bond Index, Bloomberg U.S. Long Credit Bond Index, Bloomberg U.S. Long Government Bond Index, Bloomberg U.S. Securitized: MBS, ABS and CMBS Index, FTSE Nareit All Equity REIT Index, ICE® U.S. Treasury 0-5 Year Inflation Linked Bond Index, MSCI ACWI ex USA IMI Index (Net), Russell 1000® Index, Russell 2000® Index and S&P Global Infrastructure IndexTM (Net), which are representative of the asset classes in which the Fund invests. The weightings of the indices in the LifePath Dynamic 2070 Fund Custom Benchmark are adjusted periodically to reflect the investment adviser’s evaluation and adjustment of the Fund’s asset allocation strategy.
| Key Fund statistics | |
| $6,076,678 | |
| 32 | |
| $3,519 | |
| 41% |
What did the Fund invest in?
(as of December 31, 2025)
| Portfolio composition | ||
| Asset Type(a) | Percent of Net Assets |
|
| 97.4 | % | |
| 14.1 | ||
| 1.3 | ||
| (12.8 | ) | |
| Ten largest holdings | ||
| Security(b) | Percent of Net Assets |
|
| 50.0 | % | |
| 12.8 | ||
| 11.6 | ||
| 6.3 | ||
| 4.1 | ||
| 3.3 | ||
| 3.0 | ||
| 2.4 | ||
| 1.8 | ||
| 1.8 | ||
| The portfolio composition above is calculated using a methodology different than that disclosed in the Fund's prospectus. |
| Excludes short-term securities. |
| Ten largest holdings | ||
| Security(b) | Percent of Net Assets |
|
| 50.0 | % | |
| 12.8 | ||
| 11.6 | ||
| 6.3 | ||
| 4.1 | ||
| 3.3 | ||
| 3.0 | ||
| 2.4 | ||
| 1.8 | ||
| 1.8 | ||
What were the Fund costs for the last year ?
(based on a hypothetical $10,000 investment)
| Class name | Costs of a $10,000 investment |
Costs paid as a percentage of a $10,000 investment |
| $105(a) | 0.95%(a) |
| Excludes fees and expenses incurred indirectly as a result of investments in underlying funds. |
How did the Fund perform last year ?
- For the reporting period ended December 31, 2025, the Fund’s Class R Shares returned 20.45%.
- For the same period, the Fund’s benchmark, the Russell 1000® Index returned 17.37% and the Bloomberg U.S. Aggregate Bond Index returned 7.30%. The LifePath Dynamic 2070 Fund Custom Benchmark returned 21.74%.
What contributed to performance?
U.S. equities were the top contributor to absolute performance in the funds furthest from retirement, followed by international equities, BlackRock Tactical Opportunities Fund (a liquid macro strategy), investment-grade bonds, and U.S. real estate investment trusts (REITs).
U.S. equities were the top contributor in the funds at and near retirement, followed by investment-grade bonds, international equities, U.S. Treasury Inflation Protected Securities (TIPS), global infrastructure stocks, and BlackRock Tactical Opportunities Fund.
The funds used derivatives, including financial futures, swaps, and foreign currency transactions, as a means to hedge and/or take outright views on equities, interest rates, credit risk, and/or currencies. The use of derivatives as opposed to physical securities did not have a material impact on performance.
What detracted from performance?
Currency positioning was the primary detractor from performance in the funds furthest from retirement.
In the vintages at and near retirement, currency pair trades were the primary detractor.
The views expressed reflect the opinions of BlackRock as of the date of this report and are subject to change based on changes in market, economic or other conditions. These views are not intended to be a forecast of future events and are no guarantee of future results.
Fund performance
Cumulative performance: September 24, 2024 through December 31, 2025
Initial investment of $10,000
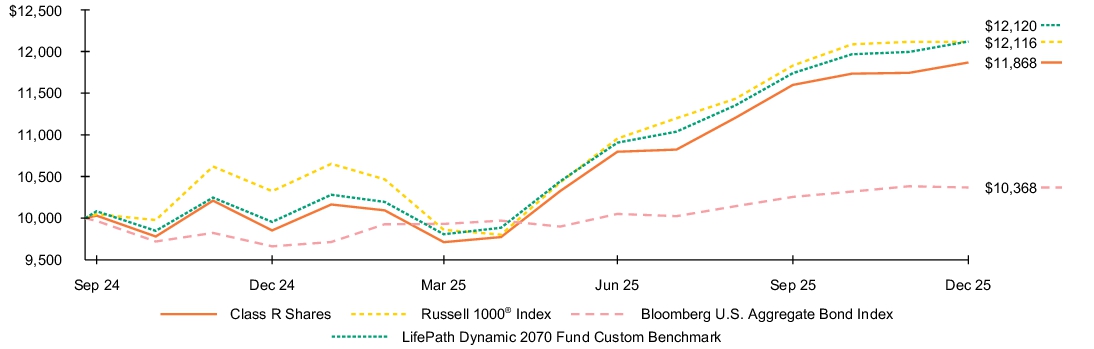
See “Average annual total returns” for additional information on fund performance.
| Average annual total returns | ||||
| 1 Year | Since Fund Inception |
|||
| 20.45 | % | 18.68 | % | |
| 17.37 | 16.36 | |||
| 7.30 | 2.89 | |||
| 21.74 | 16.39 |
The Fund compares its performance to that of a customized weighted index (the “LifePath Dynamic 2070 Fund Custom Benchmark”) comprised of the Bloomberg U.S. Intermediate Credit Bond Index, Bloomberg U.S. Intermediate Government Bond Index, Bloomberg U.S. Long Credit Bond Index, Bloomberg U.S. Long Government Bond Index, Bloomberg U.S. Securitized: MBS, ABS and CMBS Index, FTSE Nareit All Equity REIT Index, ICE® U.S. Treasury 0-5 Year Inflation Linked Bond Index, MSCI ACWI ex USA IMI Index (Net), Russell 1000® Index, Russell 2000® Index and S&P Global Infrastructure IndexTM (Net), which are representative of the asset classes in which the Fund invests. The weightings of the indices in the LifePath Dynamic 2070 Fund Custom Benchmark are adjusted periodically to reflect the investment adviser’s evaluation and adjustment of the Fund’s asset allocation strategy.
| Key Fund statistics | |
| $6,076,678 | |
| 32 | |
| $3,519 | |
| 41% |
What did the Fund invest in?
(as of December 31, 2025)
| Portfolio composition | ||
| Asset Type(a) | Percent of Net Assets |
|
| 97.4 | % | |
| 14.1 | ||
| 1.3 | ||
| (12.8 | ) | |
| Ten largest holdings | ||
| Security(b) | Percent of Net Assets |
|
| 50.0 | % | |
| 12.8 | ||
| 11.6 | ||
| 6.3 | ||
| 4.1 | ||
| 3.3 | ||
| 3.0 | ||
| 2.4 | ||
| 1.8 | ||
| 1.8 | ||
| The portfolio composition above is calculated using a methodology different than that disclosed in the Fund's prospectus. |
| Excludes short-term securities. |
| Ten largest holdings | ||
| Security(b) | Percent of Net Assets |
|
| 50.0 | % | |
| 12.8 | ||
| 11.6 | ||
| 6.3 | ||
| 4.1 | ||
| 3.3 | ||
| 3.0 | ||
| 2.4 | ||
| 1.8 | ||
| 1.8 | ||
| [1] | Excludes fees and expenses incurred indirectly as a result of investments in underlying funds. |
| [2] | Excludes fees and expenses incurred indirectly as a result of investments in underlying funds. |
| [3] | Excludes fees and expenses incurred indirectly as a result of investments in underlying funds. |
| [4] | Excludes fees and expenses incurred indirectly as a result of investments in underlying funds. |
| [5] | Excludes fees and expenses incurred indirectly as a result of investments in underlying funds. |
| [6] | Excludes fees and expenses incurred indirectly as a result of investments in underlying funds. |
| [7] | Excludes fees and expenses incurred indirectly as a result of investments in underlying funds. |
| [8] | Excludes fees and expenses incurred indirectly as a result of investments in underlying funds. |
| [9] | Excludes fees and expenses incurred indirectly as a result of investments in underlying funds. |
| [10] | Excludes fees and expenses incurred indirectly as a result of investments in underlying funds. |
| [11] | Excludes fees and expenses incurred indirectly as a result of investments in underlying funds. |
| [12] | Excludes fees and expenses incurred indirectly as a result of investments in underlying funds. |
| [13] | Excludes fees and expenses incurred indirectly as a result of investments in underlying funds. |
| [14] | Excludes fees and expenses incurred indirectly as a result of investments in underlying funds. |
| [15] | Excludes fees and expenses incurred indirectly as a result of investments in underlying funds. |
| [16] | Excludes fees and expenses incurred indirectly as a result of investments in underlying funds. |
| [17] | Excludes fees and expenses incurred indirectly as a result of investments in underlying funds. |
| [18] | Excludes fees and expenses incurred indirectly as a result of investments in underlying funds. |
| [19] | Excludes fees and expenses incurred indirectly as a result of investments in underlying funds. |
| [20] | Excludes fees and expenses incurred indirectly as a result of investments in underlying funds. |
| [21] | Excludes fees and expenses incurred indirectly as a result of investments in underlying funds. |
| [22] | Excludes fees and expenses incurred indirectly as a result of investments in underlying funds. |
| [23] | Excludes fees and expenses incurred indirectly as a result of investments in underlying funds. |
| [24] | Excludes fees and expenses incurred indirectly as a result of investments in underlying funds. |
| [25] | Excludes fees and expenses incurred indirectly as a result of investments in underlying funds. |
| [26] | Excludes fees and expenses incurred indirectly as a result of investments in underlying funds. |
| [27] | Excludes fees and expenses incurred indirectly as a result of investments in underlying funds. |
| [28] | Excludes fees and expenses incurred indirectly as a result of investments in underlying funds. |
| [29] | Excludes fees and expenses incurred indirectly as a result of investments in underlying funds. |
| [30] | Excludes fees and expenses incurred indirectly as a result of investments in underlying funds. |
| [31] | Excludes fees and expenses incurred indirectly as a result of investments in underlying funds. |
| [32] | Excludes fees and expenses incurred indirectly as a result of investments in underlying funds. |
| [33] | Excludes fees and expenses incurred indirectly as a result of investments in underlying funds. |
| [34] | Excludes fees and expenses incurred indirectly as a result of investments in underlying funds. |
| [35] | Excludes fees and expenses incurred indirectly as a result of investments in underlying funds. |
| [36] | Excludes fees and expenses incurred indirectly as a result of investments in underlying funds. |
| [37] | Excludes fees and expenses incurred indirectly as a result of investments in underlying funds. |
| [38] | Excludes fees and expenses incurred indirectly as a result of investments in underlying funds. |
| [39] | Excludes fees and expenses incurred indirectly as a result of investments in underlying funds. |
| [40] | Excludes fees and expenses incurred indirectly as a result of investments in underlying funds. |
| [41] | Excludes fees and expenses incurred indirectly as a result of investments in underlying funds. |
| [42] | Excludes fees and expenses incurred indirectly as a result of investments in underlying funds. |
| [43] | Excludes fees and expenses incurred indirectly as a result of investments in underlying funds. |
| [44] | Excludes fees and expenses incurred indirectly as a result of investments in underlying funds. |
| [45] | Excludes fees and expenses incurred indirectly as a result of investments in underlying funds. |
| [46] | Excludes fees and expenses incurred indirectly as a result of investments in underlying funds. |
| [47] | Excludes fees and expenses incurred indirectly as a result of investments in underlying funds. |
| [48] | Excludes fees and expenses incurred indirectly as a result of investments in underlying funds. |
| [49] | Excludes fees and expenses incurred indirectly as a result of investments in underlying funds. |
| [50] | Excludes fees and expenses incurred indirectly as a result of investments in underlying funds. |