Exhibit 99.1
|

Annual Report 2025
March 5, 2026

Exhibit 99.1
|
Annual Report 2025
March 5, 2026
Page 1 |
Thomson Reuters Annual Report 2025 |

Information in this annual report is provided as of March 4, 2026 unless otherwise indicated.
Certain statements in this annual report are forward-looking. These forward-looking statements are based on certain assumptions and reflect our current expectations. As a result, forward-looking statements are subject to a number of risks and uncertainties that could cause actual results or events to differ materially from current expectations. Some of the factors that could cause actual results to differ materially from current expectations are discussed in the “Risk Factors” section of this annual report as well as in materials that we from time to time file with, or furnish to, the Canadian securities regulatory authorities and the U.S. Securities and Exchange Commission. There is no assurance that any forward-looking statements will materialize. You are cautioned not to place undue reliance on forward-looking statements, which reflect expectations only as of the date of this annual report. Except as may be required by applicable law, we disclaim any intention or obligation to update or revise any forward-looking statements.
The following terms in this annual report have the following meanings, unless otherwise indicated:
Term |
|
Definition |
AI |
|
Artificial intelligence |
“Big 3” segments |
|
Our combined Legal Professionals, Corporates and Tax, Audit & Accounting Professionals segments |
bp |
|
Basis points – one basis point is equal to 1/100th of 1%,“100bp” is equivalent to 1% |
C$ |
|
Canadian dollars |
constant currency |
|
A non-IFRS measure derived by applying the same foreign currency exchange rates to the financial results of the current and equivalent prior-year period |
EBITDA |
|
Earnings before interest, tax, depreciation and amortization |
EPS |
|
Earnings per share |
IASB |
|
International Accounting Standards Board |
IFRS |
|
International Financial Reporting Standards |
LSEG |
|
London Stock Exchange Group plc |
ML |
|
Machine learning |
n/a |
|
Not applicable |
n/m |
|
Not meaningful |
Nasdaq |
|
The Nasdaq Stock Market LLC |
organic or organically |
|
A non-IFRS measure that represents changes in revenues of our existing businesses at constant currency. The metric excludes the distortive impacts of acquisitions and dispositions from not owning the business in both comparable periods |
SEC |
|
U.S. Securities and Exchange Commission |
TSX |
|
Toronto Stock Exchange |
Woodbridge |
|
The Woodbridge Company Limited, our principal and controlling shareholder |
$ and US$ |
|
U.S. dollars |
Non-IFRS financial measures are defined and reconciled to the most directly comparable measure in the “Management’s Discussion and Analysis” section of this annual report. See Appendix A of the Management’s Discussion and Analysis for a description of our non-IFRS financial measures, including an explanation of why we believe they are useful measures of our performance. See Appendices B and C of the Management’s Discussion and Analysis for reconciliations of our non-IFRS financial measures to the most directly comparable IFRS measures. Non-IFRS measures do not have standardized meanings prescribed by IFRS and therefore are unlikely to be comparable to the calculation of similar measures used by other companies and should not be viewed as alternatives to measures of financial performance calculated in accordance with IFRS.
For information regarding our disclosure requirements under applicable Canadian and U.S. laws and regulations, please see the “Cross Reference Tables” section of this annual report.
Information contained on our website or any other websites identified in this annual report is not part of this annual report. All website addresses listed in this annual report are intended to be inactive, textual references only. The Thomson Reuters logo and our other trademarks, trade names and service names mentioned in this annual report are the property of Thomson Reuters.
Front cover photo credit: REUTERS/Karen Toro; Page 11 photo credit: REUTERS/Evelyn Hockstein; and Page 17 photo credit: REUTERS/Navesh Chitrakar
Thomson Reuters Annual Report 2025 |
|

|
2 |
|
|
2 |
|
|
5 |
|
|
5 |
|
|
6 |
|
|
7 |
|
|
8 |
|
|
8 |
|
Key Products |
|
9 |
|
11 |
|
|
11 |
|
|
11 |
|
|
11 |
|
|
12 |
|
|
12 |
|
|
13 |
|
|
13 |
|
|
13 |
|
|
14 |
|
|
15 |
|
|
18 |
|
|
19 |
|
|
33 |
|
|
96 |
|
|
160 |
|
|
160 |
|
|
163 |
|
|
166 |
|
|
167 |
|
|
168 |
|
|
168 |
|
|
169 |
|
Presiding Directors at Meetings of Non-Management and Independent Directors |
|
170 |
|
170 |
|
|
170 |
|
|
171 |
|
|
171 |
|
|
172 |
|
|
172 |
|
|
174 |
|
|
174 |
|
|
175 |
|
|
178 |
|
Interests of Experts |
|
179 |
|
179 |
|
|
181 |
|
Annual Information Form (Form 51-102F2) Cross Reference Table |
|
181 |
|
182 |
Thomson Reuters Annual Report 2025 |
|
Business
Overview
Who We Are and What We Do
Thomson Reuters powers business-critical professions with AI they can trust in the moments that matter. We unite unparalleled expertise, proprietary content, and seamless workflows to help our customers move with speed, think with clarity, and lead with confidence. Across our products, we combine highly specialized software and insights to empower professionals with the data, intelligence and solutions needed to make informed decisions, and to help institutions in their pursuit of justice, truth and transparency. Reuters, part of Thomson Reuters, is a world leading provider of trusted journalism and news. Thomson Reuters shares are listed on the Toronto Stock Exchange and the Nasdaq (symbol: TRI). Our website is thomsonreuters.com.
We are organized as five reportable segments, reflecting how our products and services are managed and offered to target customers.
|
Legal Professionals Serves law firms and governments with research and workflow products powered by AI-enabled technology, focusing on intuitive legal research and integrated legal workflow solutions that combine content, tools and analytics. |
|
|
|
Corporates Serves corporations, ranging from small businesses to multinational organizations, including the seven largest global accounting firms, with our full suite of content-driven products, powered by AI-enabled technology and integrated compliance workflow solutions to help them achieve their business outcomes. |
|
|
|
Tax, Audit & Accounting Professionals Serves tax, audit and accounting firms (other than the seven largest, which are served by our Corporates segment) with research and workflow products powered by AI-enabled technology. |
|
|
|
Reuters Supplies business, financial and global news and data to the world’s media organizations, professionals and news consumers through Reuters News Agency, Reuters.com, Reuters Events, Thomson Reuters products and to financial firms exclusively via LSEG products. |
|
|
|
Global Print Provides legal and tax information primarily in print format to customers around the world and provides commercial printing services to a wide range of book publishers. |
Our businesses are supported by a corporate center that manages our commercial and technology operations, including those around our sales capabilities, digital customer experience, and product and content development, as well as our global facilities. Costs relating to these activities are allocated to our business segments. We also report “Corporate costs”, which includes expenses for certain centrally managed functions such as finance, legal, human resources and the executive office. These costs are not allocated to the segments and are included in consolidated adjusted EBITDA.
Page 2 |
Thomson Reuters Annual Report 2025 |
Our Business Model and Key Operating Characteristics
We derive a significant portion of our revenues from selling information and software solutions, mostly on a recurring subscription basis. Our professional-grade solutions are built on comprehensive proprietary content and deep domain expertise with software, embedded AI capabilities and automation tools. We believe our workflow solutions make our customers more productive by streamlining how they operate, enabling them to focus on higher value activities. Many of our customers use our solutions deeply integrated into their workflows, which has led to strong customer retention. We believe that our customers trust us because of our decades serving high-stakes workflows, where accuracy and reliability are non-negotiable, our enterprise-grade security and governance built for regulated environments, and our deep understanding of their businesses and industries. They rely on our services for navigating a rapidly changing and increasingly complex digital and global landscape. Over the years, our business model has proven to be capital efficient and cash flow generative, and it has enabled us to maintain leading and scalable positions in our chosen market segments.
Some of our key business and operating characteristics are:
Attractive Industry |
Balanced and Diversified Leadership |
Attractive Business Model |
Strong Competitive Positioning |
Disciplined Financial Policies |
• Currently our “Big 3” segments operate in an estimated $31 billion market expected to grow between 8% and 11% over the next 5 years • Legal, Tax & Risk markets are prime for content-driven innovation |
• A leader in our "Big 3" and Reuters segments • Resilient businesses, historically stable, through periods of macroeconomic uncertainty • Approximately 450,000 customers; largest customer is approximately 5% of revenues* |
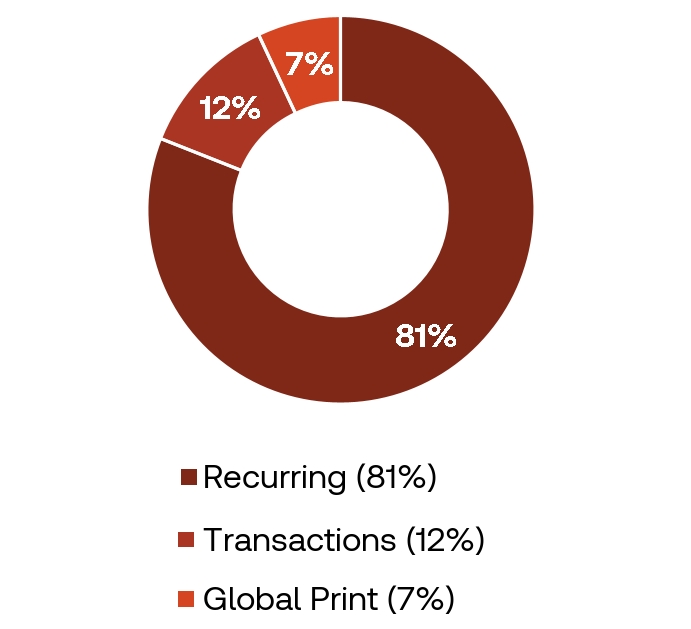
• 81% of revenues were recurring in 2025 • Fixed cost model supports operating leverage as we grow • Strong and consistent cash generation capabilities
|
• Proprietary content plus data and human expertise combined with AI and ML are key differentiators • Products deeply embedded in customers’ daily workflows • 92% retention rate in 2025
|
• Focused and incentivized on organic revenue growth and free cash flow growth • Balance investing in business and returning capital to shareholders • Committed to maintaining investment grade rating with stable capital structure • Significant potential capital capacity affords optionality
|
* The news agreement with the Data & Analytics business of LSEG.
Thomson Reuters Annual Report 2025 |
Page 3 |
Our Strategy and Key Priorities
We strive to be the leading content-driven technology company that empowers professionals to navigate complex legal, tax, audit, accounting, compliance, government, corporate and media environments. We do this through professional-grade solutions specifically designed for high-stakes work, leveraging the depth and breadth of our proprietary content, which is meticulously curated and continually enhanced by thousands of subject matter experts and legal editors.
Because our data and insights are built on this uniquely curated intellectual capital, our content reflects a high level of quality and expertise that supports our customers’ professional needs, underpinned by enterprise-grade security and governance. This strong foundation enables us to be positioned to combine next-generation AI technologies with our existing strengths to serve customers in new and differentiated ways centered on four core pillars that guide our strategies:
The rapid pace of AI innovation continues to drive significant transformation across the industries we serve, reinforcing the importance of our strategy and our priorities for 2026:
Page 4 |
Thomson Reuters Annual Report 2025 |
Three-Year History
Customer Segments
Our business is a customer-focused structure organized in five reportable customer segments: Legal Professionals, Corporates, Tax, Audit & Accounting Professionals, Reuters and Global Print. This structure allows us to focus on the customer so we can partner with them to solve challenges that they face in their businesses. For additional information about the financial results of our customer segments, please see the “Management’s Discussion and Analysis” section of this annual report.
Legal Professionals
Our Legal Professionals segment delivers professional-grade, agentic AI-enabled solutions for customers across law firms, courts and government. Our next generation AI solution, CoCounsel Legal, with Deep Research grounded in Westlaw and Practical Law, is purpose-built to deliver rigorous, end-to-end legal research results and workflow automation.
Today, legal professionals are navigating a period of significant transformation. Regulation and compliance requirements continue to grow in complexity, increasing the operational burden on legal teams. At the same time, corporate legal departments are becoming more sophisticated and cost-conscious purchasers of legal services, prompting law firms to focus on delivering measurable value through improved processes and the latest technology. Meanwhile, new associates are demonstrating a strong appetite for solutions that enable them to work effectively and sustainably, and legal career pathways are set to evolve as AI adoption grows.
Against this backdrop, it is critical that the legal profession is equipped with AI solutions that deliver defensible results, safeguard confidential data, and operate inside professional and regulatory frameworks. Thomson Reuters is well positioned to meet this need through our unparalleled legal content: 1.9 billion documents in the Westlaw database from over 3,500 authoritative sources, enhanced by 1,500 attorney editors who create 1.6 million editorial updates per year.
We are also building our first vertical-specific legal Large Language Model (LLM) which will be trained on our content, data and expertise. This includes our legal-specific data with validation frameworks such as the West Key Number System, our proprietary taxonomy of the law, and KeyCite with 1.4 billion citation relationships, providing AI outputs that meet professional standards.
Thomson Reuters Annual Report 2025 |
Page 5 |
We will continue to scale our agentic AI capabilities, combining proprietary legal content, deep domain expertise, and professional-grade AI to help legal teams work with greater speed, precision, and confidence, supported by robust privacy commitments.
In addition to law firms, we also serve government customers, including federal, state, and local organizations, with solutions that support mission-critical workflows where security, reliability, and accuracy are essential. This includes helping courts run more efficiently and productively and helping government organizations undertake risk management and tackle fraud.
We also serve legal professionals across Europe, Asia-Pacific, Latin America, and the Middle East with solutions that combine global platform capabilities with jurisdiction-specific content, local expertise and AI-enabled workflows tailored to regional legal frameworks.
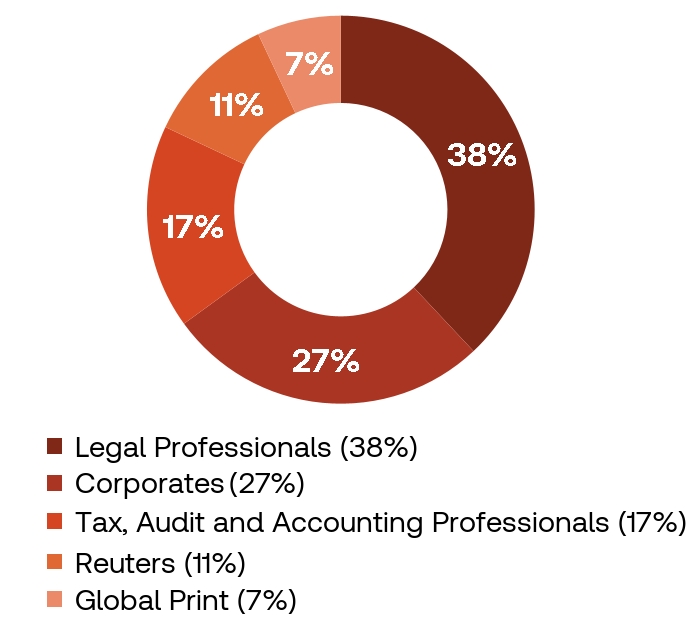
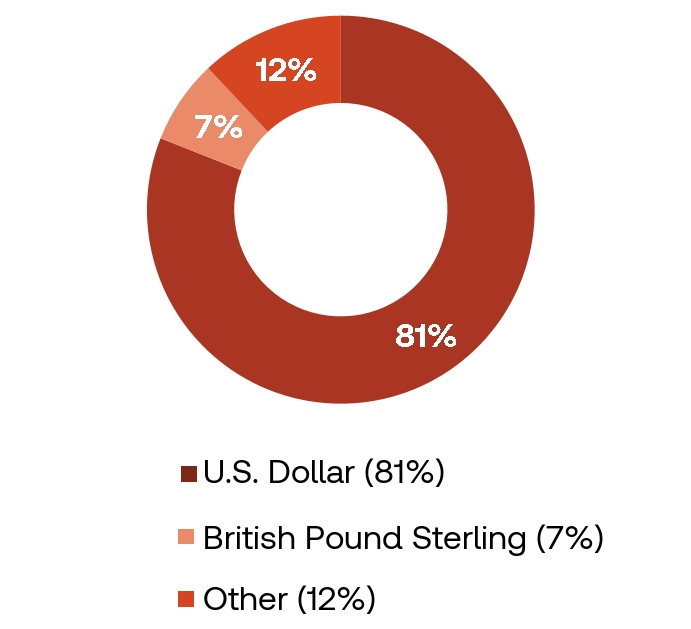
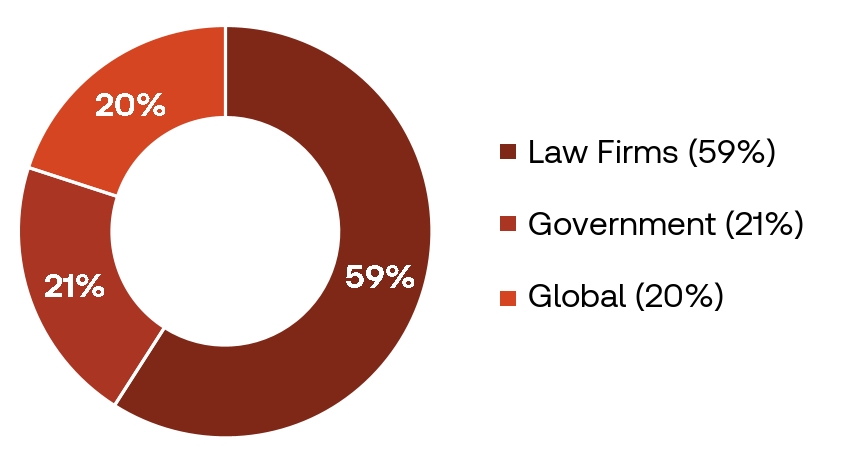
The following provides a summary of Legal Professionals’ 2025 revenues by type of customer.
Legal Professionals’ primary global competitors are LexisNexis (which is owned by RELX Group) and Wolters Kluwer. Legal Professionals also competes with other companies that provide legal and regulatory information, legal workflow and drafting software providers, and with AI-enabled software companies that support legal professionals.
Corporates
Our Corporates segment serves a range of customers, from small businesses to multinational organizations, including the seven largest global accounting firms, with our full suite of content-driven products, powered by leading-edge technologies, including AI, and integrated compliance workflow solutions to help them achieve their business outcomes.
Our Corporates customers operate in an environment of sustained regulatory change, evolving technology, expanding reporting obligations and heightened expectations for speed, productivity and precision. Evolving compliance requirements—such as Environmental, Social and Governance reporting, sanctions and tariffs, and enhanced "know your counterparty" practices, are increasing the volume and complexity of compliance and risk decisions. At the same time, compliance teams across tax, trade, legal and risk are being asked to do more with constrained resources, as tax departments face greater demands for efficiency and productivity and many general counsels navigate growing regulatory complexity. Digital mandates, including global minimum tax developments and the continued rollout of e-invoicing and other continuous transaction control regimes, are accelerating the shift toward cloud-based, data-driven compliance and workflow transformation.
We believe these dynamics create the opportunity for Thomson Reuters to serve as a trusted partner for Corporates customers by helping them navigate regulatory complexity, improve operational efficiency and manage risk with greater confidence. Our strategy is built around Thomson Reuters ONESOURCE+, which unifies tax, trade, legal and risk functions through an intelligent compliance network. We combine proprietary content and domain expertise with AI-driven workflow software and analytics, including CoCounsel AI and agentic technology, that are embedded in customers' day-to-day processes. Our approach focuses on embedding AI in workflows, connecting data across compliance functions and delivering intelligent automation to help customers drive efficiency, reduce risk and cost and unlock growth for businesses.
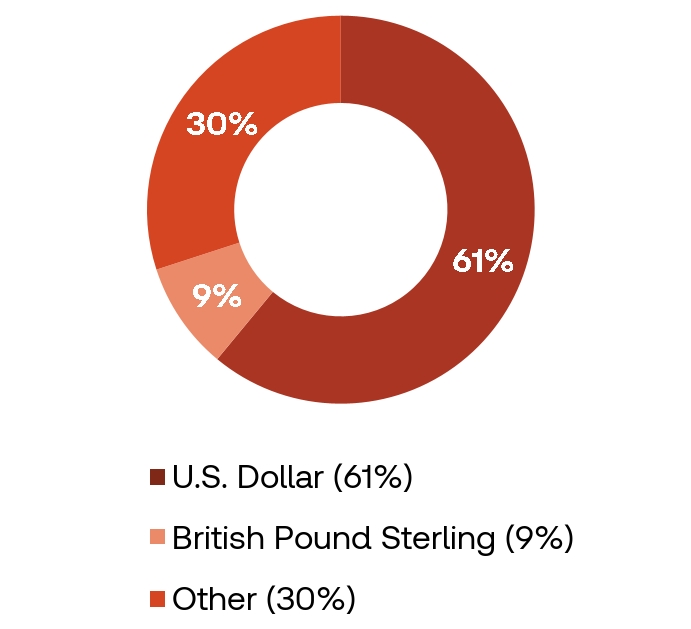
The following provides a summary of Corporates’ 2025 revenues by type of customer.
Page 6 |
Thomson Reuters Annual Report 2025 |
Corporates’ primary global competitors include LexisNexis, Wolters Kluwer and Bloomberg. Corporates also competes with focused software providers such as Avalara, Mitratech, Vertex and Sovos and at times with large technology companies, enterprise resource planning software solution companies, and highly focused and venture capital-backed startups. While the largest global accounting firms are significant customers of Thomson Reuters, they can also be competitors.
Tax, Audit & Accounting Professionals
Our Tax, Audit & Accounting Professionals segment serves tax, audit and accounting professionals with AI-powered research and workflow solutions. We introduced agentic AI into our core offerings, which use advanced reasoning models paired with an AI assistant that orchestrates complex work, backed by Checkpoint’s comprehensive proprietary content and deep domain expertise from our tax editors and subject matter experts. Our customers range from sole practitioners to the largest global firms providing tax compliance, audit, advisory and accounting services.
The profession faces an unprecedented talent shortage, which defines the strategic imperative for our business. The pipeline of qualified professionals has contracted sharply, with fewer graduates pursuing accounting certification even as demand intensifies. Simultaneously, regulatory complexity continues to increase as tax codes grow, cross-jurisdictional requirements expand and audit standards tighten. Meanwhile, client expectations have moved beyond compliance focused tasks to include higher-value advisory services. These converging pressures require firms to deliver more with constrained resources while maintaining high quality and accuracy. Our solutions address this imperative by streamlining the end-to-end process, from research and compliance to workflow automation and client advisory.
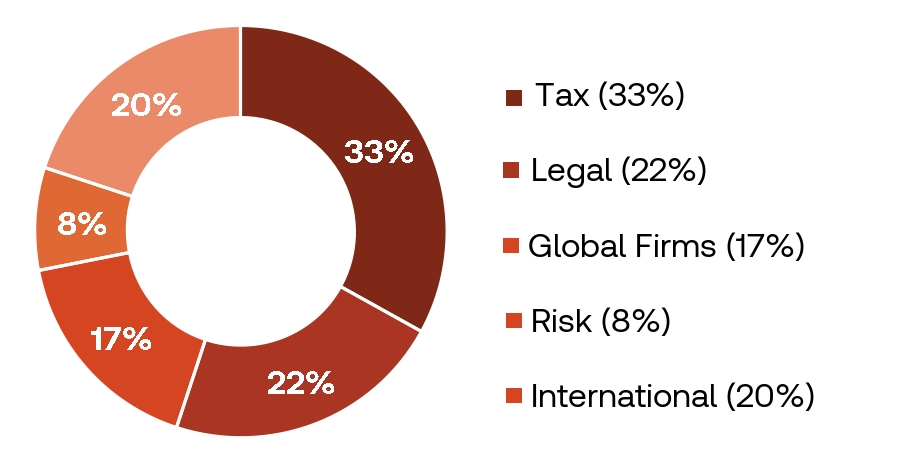
The following provides a summary of Tax, Audit & Accounting Professionals’ 2025 revenues by type of customer.
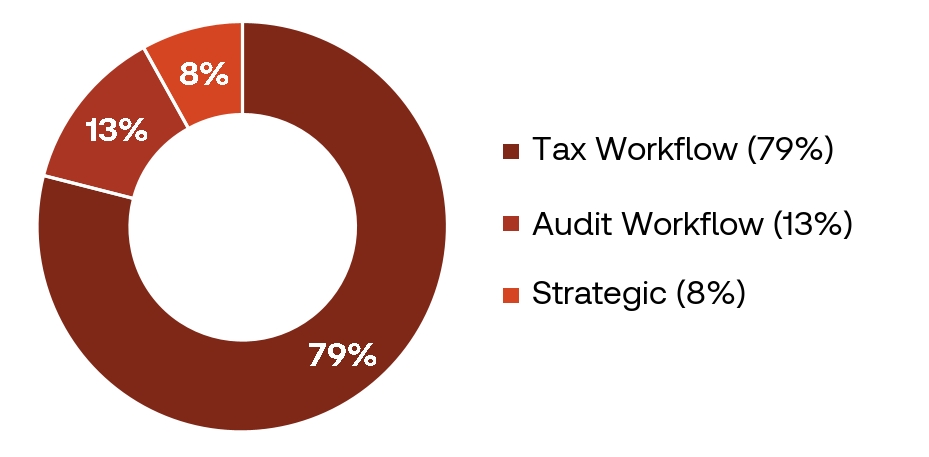
Strategic customers represent the largest firms across Tax and Audit workflows.
Tax Workflow
We provide end-to end workflows to streamline the entirety of the tax lifecycle, from client onboarding and data gathering through document processing, tax planning, and filing. Strategic acquisitions, including Materia, SafeSend and Additive, have expanded our platform capabilities. In 2025, we launched CoCounsel for Tax and Audit, Ready to Review and Ready to Advise. Ready to Review introduced agentic tools that automate and enhance tax research and return preparation workflows. Ready to Advise, our AI-enabled tax planning solution built on the CoCounsel platform, leverages authoritative Checkpoint content and deep tax expertise to analyze client data and identify tailored planning strategies, ranked by relevance and potential impact. It delivers step-by-step guidance backed by authoritative knowledge and integrated workflow tools, enabling firms to scale advisory services efficiently and generate incremental revenue.
Audit Workflow
We provide audit firms with a suite of cloud-based tools designed to streamline engagement workflows, enhance accuracy, and elevate client service through AI-enabled automation. Our newest solutions include CoCounsel Audit, Audit Intelligence Analyze, and Audit Intelligence Test. Audit Intelligence Analyze uses AI to accelerate transaction analysis, identify items for review, optimize sample selection, and direct attention toward higher-risk areas. Audit Intelligence Test reduces manual effort during testing by automating the matching of selected samples to supporting evidence, validating collected amounts, and maintaining documentation within the workflow.
Tax, Audit & Accounting Professionals' competitors include Wolters Kluwer's CCH business, Bloomberg Industry Group, Intuit, Drake Software, and CaseWare, as well as emerging technology startups serving the profession.
Thomson Reuters Annual Report 2025 |
Page 7 |
Reuters
Reuters is a leading provider of trusted news, insight and analysis. Founded in 1851, it brings together world-class journalism, industry expertise and cutting-edge technology with unparalleled speed, reliability and accuracy to enable people to make better decisions. Reuters is committed to the Thomson Reuters Trust Principles, including that of independence, integrity and freedom from bias, and is an essential source of business, financial and world news delivered to financial firms exclusively via LSEG products, to the world’s media organizations, and to professionals via industry events and Reuters.com. In 2025, Reuters delivered approximately 3.6 million unique news stories, 829,000 pictures and images and 142,000 video stories and numerous industry events.
For more information on the Thomson Reuters Trust Principles, please see the “Additional Information – Material Contracts – Thomson Reuters Trust Principles and Thomson Reuters Founders Share Company” section of this annual report.
Reuters’ primary global competitors include Bloomberg, the Associated Press, Agence France-Presse and Getty.
Global Print
Global Print is a leading provider of information, primarily in print format, to legal and tax professionals, government (including federal, state and local government lawyers and judges), law schools and corporations. Global Print also leverages its capabilities through offering commercial printing services to a wide range of book publishers including those in trade, government, associations, faith-based organizations, universities and children’s books. The business serves customers primarily in the United States, Canada and the United Kingdom. Global Print’s primary global competitors are LexisNexis and Wolters Kluwer.
Page 8 |
Thomson Reuters Annual Report 2025 |
Key Products
Our customer-focused structure enables us to have broader conversations with our customers, with a more cohesive go-to-market approach. We believe that this focus will create opportunities to deepen relationships with customers on more of our products and services across their organizations, increase sales to existing customers, improve retention and attract new customers. The following table provides information about our key products and target customers.
Product |
Description |
Legal Professionals |
Corporates |
Tax, Audit & Accounting Professionals |
Audit Intelligence (Analyze and Test) |
AI-powered solution that automates transaction analysis and substantive testing, identifying high-risk transactions, selecting samples, and validating them against bank and source documents to improve audit efficiency and quality.
|
|
|
|
Checkpoint Checkpoint Edge
|
Integrated tax, audit and accounting research solution that delivers news, editorial insights, advisory tools and authoritative content. |
|
|
|
CLEAR CLEAR Risk Inform CLEAR ID Confirm CLEAR Adverse Media Sanctions PeopleMap |
US-based public records platform providing risk, fraud, and investigative solutions to authorized businesses and government agencies limited to legally permissible purposes including investigating crimes and locating victims, performing due diligence and preparing for litigation and detecting fraud and mitigating risk. |
|
|
|
Cloud Audit Suite |
End-to-end solution providing accuracy and efficiency throughout the audit process through a suite of tools including: engagement management and trial balance capabilities, guided assurance with assisted decision making, online confirmations and embedded disclosure examples. |
|
|
|
CoCounsel Legal |
Next-generation agentic AI platform that brings together legal research, essential workflow automation, intelligent document search and drafting, and AI-powered legal assistance within one unified solution including CoCounsel, CoCounsel Drafting, Westlaw and Practical Law. |
|
|
|
CoCounsel for Legal |
Generative AI platform built for legal professionals, leveraging proprietary content and trained by domain experts. Enables more efficient research, document review, deposition preparation, correspondence drafting, contract analysis and policy compliance with a growing library of skills. |
|
|
|
CoCounsel for Tax & Audit
|
Generative AI platform for intelligent tax and accounting automation using large language models with tax and accounting content. Provides AI-powered document analysis, data extraction, research assistance, and content generation through a natural language interface for tax and accounting questions. |
|
|
|
Thomson Reuters Annual Report 2025 |
Page 9 |
Dominio |
Complete, fully integrated suite for Brazilian accounting firms, automating routine operations including tax calculations, payroll and generation of electronic files for eSocial, EFD and ECD. Integrates with Brazilian government systems ensuring compliance at municipal, state, and federal levels, with a client portal and firm management tools. |
|
|
|
ONESOURCE
Direct Tax |
Global cloud-based tax and trade solutions managing direct and indirect tax compliance, indirect tax determination, statutory reporting, trust taxation, tax information reporting, tax planning, trade compliance, trade operations, trade special programs, trade regulatory content and overall data and process management. |
|
|
|
Practical Law Practical Law Connect Practical Law Dynamic Tool Set |
Legal know-how, current awareness and workflow tools with embedded guidance from expert practitioners. |
|
|
|
Ready to Advise |
Provides step-by-step guidance supporting authoritative knowledge and workflow tools that enable CPA firms to take a scalable approach to tax advisory services, generating incremental revenue for their businesses. |
|
|
|
Ready to Review |
Automates the creation of the first draft of a tax return, extracting and mapping data, running that data through our tax engines and diagnosing and resolving errors. |
|
|
|
UltraTax & CS Professional Suite |
Scalable, integrated suite of desktop and online software applications that encompass key aspects of a professional accounting firm’s operations, from collecting client data and preparing and filing tax returns to the overall management of the accounting practice. |
|
|
|
Westlaw, Westlaw Edge Westlaw Advantage |
Westlaw is our primary online legal research delivery platform. Westlaw offers authoritative content, powerful search functionality and research organization, team collaboration features and navigation tools to find and share specific points of law and search for analytical commentary. |
|
|
|
Page 10 |
Thomson Reuters Annual Report 2025 |

Additional Business Information
Corporate Center
Our corporate center seeks to foster a group-wide approach to management while allowing our business segments sufficient operational flexibility to serve their customers effectively. Our corporate center centrally manages our Operations & Technology group, our commercial operations and certain functions such as finance, legal and human resources.
The Role of Thomson Reuters Enterprise Centre
The Thomson Reuters Enterprise Centre in Switzerland has a pivotal role in our business operations and strategic initiatives. Key decisions on company-wide strategy and global commercial policies are led by a senior Executive Leadership team in Switzerland representing multiple functions across Strategy, Product, Operations & Technology, Engineering, Labs, Legal, Risk & Compliance and Finance. This strengthens our speed of innovation, collaboration and direction setting across our global business.
Operations & Technology
Our Operations & Technology group consolidates essential corporate functions into a cohesive team, encompassing product engineering, technology delivery and service, data and analytics, AI innovation, digital transformation, customer service, procurement, real estate, collections and content operations. This unified approach provides a strong foundation for accelerating our scale and growth strategies, allowing us to focus resources effectively on key priorities. In 2026, we will continue to advance our products and service through AI innovation.
Thomson Reuters Annual Report 2025 |
Page 11 |
We aim to deliver AI enhancements across our product suite, enabling the agility and speed that our customers demand, while simultaneously improving margin through AI-driven process optimization.
Our commitment to transformation ensures our content, products and services evolve to meet customer needs, while we continue to focus on securing customer data and global systems as part of our ongoing security program enhancements.
Innovation, Research and Development
Innovation remains a cornerstone of our strategy and a key driver of competitive advantage. In 2025, we advanced our commitment to applied research and technology development through Thomson Reuters Labs—our dedicated research and innovation arm. Building on the momentum from 2024, we expanded the Labs’ capabilities and deepened its integration with product engineering, accelerating delivery of AI-powered solutions across our portfolio.
For over three decades, Thomson Reuters Labs has been at the forefront of emerging technologies in high-stakes professional domains. In 2025, Labs delivered new AI capabilities across Westlaw, Practical Law, CoCounsel for Legal, CoCounsel for Tax, CLEAR, ONESOURCE+ and Reuters. These innovations enable legal professionals to perform complex, multi‑step research and analyze large volumes of litigation documents in a fraction of the time previously required. For tax and accounting, Labs developed solutions that automate return preparation and help firms surface and deliver personalized advisory strategies at scale. The organization continues to advance the state of the art in professional‑grade AI through active engagement with the global research community, participating in nearly 30 AI conferences and contributing around 70 articles, patents, workshops, and peer‑reviewed publications.
In addition to organic development, we strengthened our innovation pipeline through strategic acquisitions. These investments brought in specialized capabilities in areas such as workflow automation, advanced legal research and AI-driven analytics, enabling us to accelerate product development and deliver integrated solutions faster. By combining these new technologies with our trusted content and human expertise, we are creating a more connected ecosystem that supports professionals across tax, legal, compliance and risk domains.
As we progress toward our ambition to become the world’s leading content-driven technology company, innovation is not just a function—it is a mindset. By combining cutting-edge technology with human expertise, we continue to redefine how trusted answers are delivered in an ever-changing world.
Go to Market
In 2025, we continued to modernize and unify our go-to-market model to reflect how professionals evaluate, buy, and adopt technology today. Our approach combines direct sales, digital commerce, partner channels and proactive customer success motions, supported by expanding AI capabilities and a more integrated global commercial organization.
We primarily sell our products and services directly to our customers through our sales team. We enhanced coordination across go-to-market, marketing, customer success and partnerships to deliver a more consistent and connected customer experience. Teams leveraged AI-powered insights and improved revenue insight technology to better identify opportunities, prioritize accounts, and support cross-portfolio selling. This enabled more integrated conversations around our solutions, reflecting customers’ increasing preference for connected capabilities rather than point products.
In addition, we sell some of our products and services online directly to customers. In 2025, we expanded our digital commerce capabilities, offering more of our solutions online and scaling guided self-serve pathways. Customers could trial, purchase and manage products more easily through enhanced onboarding flows, improved in-product support and AI-driven recommendations that helped accelerate adoption and value realization. These investments broadened our reach across smaller firms and emerging customer segments while also reducing acquisition and servicing costs.
Partnerships remained a strategic growth driver. We expanded our relationships across system integrators, resellers, referral partners and technology providers, opening new routes to market and accelerating our reach across
geographies and customer segments. New partner programs supported joint solutions, co-marketing initiatives and Application Program Interface (API)-based integrations.
APIs allow our software platforms to connect with those of other companies, providing customers with data and access to the services of both companies. We continued to advance our API capabilities as customers increasingly looked to integrate Thomson Reuters content and AI into their existing technology stacks. Enhanced APIs across our portfolio improved interoperability with third-party platforms, expanded workflow automation and opened new opportunities for embedded use cases. This ecosystem approach supports customers' end-to-end processes and creates more flexible deployment models for our solutions. As our capabilities related to APIs continue to grow, it will further enable our ability to provide more robust solutions in collaboration with our partners to solve our customers’ business challenges.
In 2025, we expanded and formalized our customer success organization to create a scalable, proactive engagement
Page 12 |
Thomson Reuters Annual Report 2025 |
model focused on adoption, value realization and long-term outcomes. Standardized playbooks, digital success programs and data‑driven health insights enabled us to support customers more efficiently and consistently. This work lays the foundation for continued improvements in retention, net revenue retention and cross-portfolio expansion.
Our 2025 go-to-market progress strengthened our commercial foundation and improved how we serve customers across their lifecycle. With enhanced digital buying experiences, a deeper partner ecosystem, expanded API connectivity and a unified customer success model, we continue to evolve our go-to-market approach to meet the needs of modern professionals and support sustained growth in 2026 and beyond.
Intellectual Property
Our products and services primarily consist of information and original content distributed across multiple platforms. We protect these offerings and their underlying content through a comprehensive intellectual property (IP) portfolio. Our IP strategy relies on four key elements: patents and trade secrets that safeguard our innovative content creation and delivery methods; trademarks that protect our brand identity; and copyrights that secure our proprietary content, databases and software source code. We believe our current IP holdings adequately support our business operations.
To strengthen our IP position, we employ both technical and commercial safeguards within our content distribution systems. We actively expand our patent portfolio through global patent applications and acquisitions of patent-holding companies. Our online presence is protected through registered domain names, while our trademarks and copyrights are maintained through strategic registrations and active enforcement against potential infringers. Corporate acquisitions further enhance our IP assets, typically adding trademarks, copyrights, patents, and web domains to our portfolio.
We continuously assess how emerging AI regulations and concepts intersect with intellectual property law to protect our technology, source code, and content. For additional details on IP‑related risks, please refer to the "Risk Factors" section of this annual report.
Acquisitions and Dispositions
Acquisitions – Acquired businesses can strengthen our offerings and enable us to extend our platform with new capabilities that we believe will provide opportunities to expand our positions, better serve our customers and supplement our organic revenue growth. Generally, the businesses that we acquire initially have lower margins than our existing businesses, largely reflecting their stage of development and the costs of integration.
In January 2025, we acquired SafeSend, a United States-based cloud-native provider of technology for tax and accounting professionals. SafeSend automates the ‘last‑mile’ of the tax return, including assembly, review, taxpayer e‑signature and delivery. In July 2025, we acquired TimeBase, a leading provider of Australian legislative information, offering a comprehensive platform for legal professionals to find, search, track and understand legislation. In August 2025, we acquired the commercial and licensing operations of Imagn Images, a US-based sports photography agency. In September 2025, we acquired Additive AI, a San Francisco‑based startup, founded in 2023, that uses cutting‑edge AI to automate tax document processing for tax and accounting professionals. More recently, in February 2026, we acquired Noetica, Inc., a New York-based AI-native start-up that transforms transaction-deal data into structured market intelligence for deal professionals.
We expect that acquisitions will continue to play an important role in our strategy going forward and we expect to continue to make acquisitions from time to time that we believe will strengthen our positions in key growth segments. See the “Liquidity and Capital Resources” section of the "Management’s Discussion and Analysis" for additional information about our capital strategy.
Dispositions – As part of our continuing strategy to optimize our portfolio of businesses and ensure that we are investing in parts of our business that offer the greatest opportunities to achieve growth and returns, we have sold a number of non-core businesses and product lines during the last several years which were not compatible with our strategy.
For more information on acquisitions and dispositions that we made in the last two years, please see the “Management’s Discussion and Analysis” section of this annual report.
Thomson Reuters Venture Fund
During 2025, Thomson Reuters Ventures deepened its commitment to investing in AI‑powered innovation that helps professionals operate more productively and with greater insight. Beyond investing, Thomson Reuters Ventures stayed active in the ecosystem through programming that convenes founders, investors and partners to discuss the evolving AI‑driven startup and professional landscape. Thomson Reuters Ventures prioritizes companies building practical solutions that align with Thomson Reuters customers' needs to reduce friction in core workflows and deliver faster, complementary trusted outcomes.
Thomson Reuters Annual Report 2025 |
Page 13 |
Human Capital Management
Employees
The following table sets forth information on the approximate number of employees by region and unit as of December 31, 2025.
By Region |
|
|
|
Americas |
|
14,400 |
|
Asia Pacific |
|
8,600 |
|
Europe, Middle East and Africa (EMEA) |
|
4,100 |
|
By Unit |
|
|
|
Legal Professionals |
|
800 |
|
Corporates |
|
2,100 |
|
Tax, Audit & Accounting Professionals |
|
800 |
|
Global Print |
|
800 |
|
Government |
|
600 |
|
Reuters |
|
3,700 |
|
Product & Editorial |
|
3,600 |
|
Operations & Technology |
|
9,400 |
|
Corporate Center (Enabling Functions) |
|
1,400 |
|
Commercial Functions(1) |
|
1,200 |
|
Other(2) |
|
2,700 |
|
Thomson Reuters |
|
27,100 |
|
We believe that we generally have good relations with our employees, unions and works councils, although we have had disputes from time to time with the various unions that represent some of our employees. Our senior management team is committed to maintaining good relations with our employees, unions and works councils.
Overview
Our human capital practices and initiatives are designed to attract, develop and retain talented employees across our global business. At Thomson Reuters, our global team fuels innovation through their curiosity and ambition. We foster a values-driven culture that attracts top talent, empowers our people to grow and lets them do the work that matters most. We aim to ensure employees feel valued, have meaningful opportunities to develop and are empowered to succeed. Our priorities span key areas including compensation and benefits, culture and engagement, talent acquisition, learning and development and inclusion and belonging.
We are continuing to build talent for the future by integrating AI into day-to-day work, strengthening business acumen and deepening knowledge of our evolving product portfolio and customers. In 2025, we launched refreshed values to support how we work and guide our decisions and behaviors for how we deliver for our customers and colleagues.
We remain committed to career development through Grow My Way, an initiative that supports continuous skill building and enables leaders to deploy talent effectively as business needs change. As our AI capabilities mature, we are shifting from measuring AI tool adoption alone to capturing the operational and business impacts enabled, such as improved cycle times, quality, customer outcomes and productivity.
Supporting and developing people leaders remains a priority. In 2025, we focused on building skills around critical conversations and leading through ambiguity. We will continue broadening people leader development through the introduction of Leading at TR, with upskilling focus areas around setting clear goals, delivering quality feedback, improving empowerment and decision making and leading change. This leadership program is designed to strengthen leadership effectiveness at all levels, accelerate performance and reinforce a culture of accountability, collaboration and results.
Page 14 |
Thomson Reuters Annual Report 2025 |
Our investments in learning, career development and AI are reflected in employee feedback. In our most recent organizational health survey, scores related to learning and innovation increased and remain top quartile, with:
We voluntarily publish a range of human capital metrics in our securities filings and on our website, including our Social Impact & ESG Report. Certain metrics are not publicly disclosed due to competitive considerations. We expect human capital management to remain an important focus area for management and the Board of Directors, supporting strong stewardship of the organization, advancing societal objectives and contributing to our strategic advantage in the marketplace.
For additional information on our human capital management practices, please see the “Environmental, Social and Governance (ESG)” section below.
Environmental, Social and Governance (ESG)
Our company is dedicated to serving institutions and businesses that keep the wheels of commerce turning, uphold justice and taxation systems, fight fraud, support law enforcement and report on world events with impartiality, as an important source of unbiased news globally. We pursue ESG initiatives because they contribute to value creation for our customers, employees, shareholders and other stakeholders. The Board and its committees oversee different ESG-related areas that are of the greatest importance to the organization and our stakeholders to achieve our long-term strategic objectives. Ultimately, though, our ESG-related initiatives require employees who take on responsibility for them and are empowered to achieve them.
Our ESG-related workstreams include sustainability, inclusion and belonging, community relations and volunteerism. ESG factors are considered in our Enterprise Risk Management (ERM) processes. Our financial support of the Thomson Reuters Foundation also contributes to our ongoing ESG efforts.
We post a Social Impact & ESG Report annually on our website, www.thomsonreuters.com/social-impact-report, which summarizes our strategy, includes stories of progress and tracks performance, tying our efforts to our business strategy and commercial expertise. We encourage you to review the Social Impact & ESG Report to gain a better understanding of our accomplishments and practices in these areas. |
We believe in the power of collaboration with the international business community, so we are signatories of the United Nations Global Compact (UNGC), a non-binding United Nations (U.N.) pact to encourage businesses and firms worldwide to adopt sustainable and socially responsible policies. We are also aligned with the United Nations Guiding Principles on Business and Human Rights (UNGPs), which augment our longstanding commitment to the UNGC, the U.N. Declaration on Human Rights and other international standards.
In 2025, we updated our ESG double materiality assessment to ensure the continued alignment of our ESG initiatives with our business strategy and to comply with new global regulations. This assessment enables us to identify and prioritize the ESG issues that are most likely to impact our business and stakeholders in the short and long-term, and establishes a robust foundation for our ongoing sustainability reporting and management processes. In 2025, we also completed our second company-wide human rights impact assessment (HRIA) of our global operations, products and services. This assessment examined potential impacts across stakeholder groups and helped us to identify salient human rights risks which were then mapped against the expectations of the UNGPs and which now inform our human rights strategy and roadmap. Our commitment to respecting human rights throughout our operations will continue to guide our work and the recommendations from this comprehensive ESG assessment will continue to help us identify, assess and proactively respond to salient and material risks across our enterprise. Finally, in March 2023, we released our human rights policy, which informs our colleagues, customers, shareholders and those in the communities where we operate and do business, of our commitment and approach to human rights.
Our 2025 Social Impact & ESG Report, which we anticipate publishing later in 2026, will contain more information about our ESG strategy and results and will be available on our website at thomsonreuters.com.
Environmental Practices
We aim to continue to reduce our environmental impact globally. We continue to source renewable energy for 100% of our operations. We have achieved this largely by purchasing renewable energy credits to match our electricity use. We are also working closely with our suppliers to drive lower emissions within our supply chain. We will continue to measure and manage our own emissions and environmental impacts and continue to find ways to further assess, monitor and improve our carbon footprint.
Thomson Reuters Annual Report 2025 |
Page 15 |
Social Practices
Our values and culture
At Thomson Reuters, our team is committed to solving big challenges for our customers and supporting skill building for colleagues to thrive in an AI-enabled future. In 2025, we introduced new company values that are rooted in our purpose to Inform the Way Forward and the Thomson Reuters Trust Principles. These values elevate us to a higher standard of customer excellence, product innovation, teamwork and success.

Inclusion and Belonging
As a global company with employees located around the world, inclusion and belonging are core to our purpose and values, fostering an inclusive workplace where people with varied backgrounds, perspectives and experiences can grow and thrive. We believe this gives us access to the broadest talent pool, leads to better decision making and fosters greater innovation.
Health and Wellbeing
Our people remain our greatest asset and we are steadfast in our commitment to fostering a supportive and empowering workplace environment. We offer employee benefit plans, tools, resources and workplace practices that promote mental, physical, financial and social wellbeing.
Central to our employee experience is a strong focus on mental health and wellbeing. Our Mindful Leadership Training is a key component of our Managing at TR program, ensuring that all new managers are equipped to lead effectively. Additionally, we offer global resources such as employee assistance programs, meditation apps and mindfulness discussions, highlighted during our May and October Mental Health campaigns.
Thomson Reuters upholds its commitment to flexibility through our hybrid working policy and the “Flex My Way” initiative. These global flexible workplace policies enable employees to balance family and customer needs effectively. With offerings like Bereavement Leave, Caregiver Paid Time Off, Sabbatical Leave, Parental Leave, Work From Anywhere policy and local paid and unpaid time off policies, we ensure our employees can take the time they need, when they need it. Together, these efforts underline our unwavering dedication to cultivating a physically, mentally, financially and socially healthy workplace for all.
Community and Social Impact
Thomson Reuters annually provides 16 hours of paid volunteer time off (VTO) to every employee and provides an additional 20 hours of paid VTO to a subset of employees with law degrees to provide legal pro bono aid to not-for-profit organizations.
In 2025, our employees logged a total of approximately 63,000 volunteer hours, including over 10,000 hours in total pro bono support to not-for-profit organizations around the world. In addition to VTO, Thomson Reuters offers a global Corporate Match program to match eligible employee donations as well as a Volunteer Rewards Program in which an employee earns corporate funding for reaching 20 hours of volunteering. In 2025, donations by our employees together with our corporate matching and rewards donations totaled approximately $2.2 million to over 1,900 not-for-profits in 26 countries.
Page 16 |
Thomson Reuters Annual Report 2025 |

Finally, we provide some of our products and services free of charge to various not-for-profit organizations to support their initiatives, including access to our Westlaw, Practical Law, HighQ and CoCounsel products. For example, since 2010, Thomson Reuters has made our CLEAR product available to the National Center for Missing and Exploited Children. Additionally, through our AI for Justice legal aid initiative, not-for-profit legal organizations can utilize CoCounsel, our premier AI-powered legal assistant.
The Thomson Reuters Foundation
The Thomson Reuters Foundation works to bolster the resilience of independent media, strengthen access to the law and promote responsible business practices. It leverages its unique combination of media and legal expertise, together with data intelligence, to inform, connect and empower professionals and civil society to strengthen free, fair and informed societies. It delivers its work through capacity-building programs, legal support, research, news, data-driven products and events, including its flagship annual forum, the Trust Conference.
Additional information on the Foundation can be found at www.trust.org.
Governance Practices
Our Board and its committees oversee ESG initiatives. The Corporate Governance Committee of the board of directors evaluates our ESG strategy and progress and is updated regularly by our management. We remain committed to our values and ethics through our governance practices, which include our Code of Business Conduct and Ethics.
Thomson Reuters Annual Report 2025 |
Page 17 |
Properties and Facilities
We own and lease office space and facilities around the world to support our businesses. We believe that our properties are in good condition and are adequate and suitable for our present purposes. The following table provides summary information about our principal properties as of December 31, 2025.
Facility |
|
Owned/Leased |
|
Principal Use |
|
|
|
|
|
|
|
|
|
|
|
|
|
610 Opperman Drive, |
|
Owned |
|
Global Print operating facility |
|
|
|
|
|
|
|
|
|
|
|
|
|
2900 Ames Crossing Rd. |
|
Subleased |
|
Legal Professionals operating facility |
|
|
|
|
|
|
|
|
|
|
|
|
|
6300 Interfirst Drive, |
|
Owned |
|
Tax, Audit & Accounting Professionals operating facility |
|
|
|
|
|
|
|
|
|
|
|
|
|
Knowledge Court, |
|
Leased |
|
Thomson Reuters shared services center |
|
|
|
|
|
|
|
|
|
|
|
|
|
5 Canada Square, |
|
Subleased |
|
Legal Professionals, Tax, Audit & Accounting Professionals and |
|
|
|
|
|
|
|
|
|
|
|
|
|
Hyderabad, Bldg. 11 Madhapur, Hyderabad, India |
|
Leased |
|
Global shared service center |
|
|
|
|
|
|
|
|
|
|
|
|
|
19 Duncan Street Toronto, Ontario, Canada |
|
Leased |
|
Thomson Reuters headquarters |
|
|
|
|
|
|
|
|
|
|
|
|
|
Reforma Cuarzo |
|
Leased |
|
Global shared service center |
|
|
|
|
|
|
|
|
|
|
|
|
|
6160 Warren Parkway |
|
Leased |
|
Tax, Audit & Accounting Professionals and Corporates operating facility |
|
|
|
|
|
|
|
|
|
|
|
|
|
3 Times Square, New York, New York, United States |
|
Owned/leased(1) |
|
Reuters, Legal Professionals and Corporates operating facility |
|
|
|
|
|
|
|
|
|
|
|
|
|
Landis & Gyr 3, Zug, Switzerland |
|
Leased |
|
Enterprise Centre |
|
|
|
|
|
|
|
|
|
|
|
|
|
Page 18 |
Thomson Reuters Annual Report 2025 |
Risk Factors
The risks and uncertainties below represent the risks that our management believes could be material. If any of the events or developments discussed below actually occurs, our business, financial condition or results of operations could be adversely affected. Other factors not presently known to us or that we presently believe are not material could also affect our future business and operations. The risks below are organized by categories and are not necessarily listed in the order of priority to our company.
Risk Category |
Page |
19 |
|
23 |
|
25 |
|
27 |
|
30 |
|
32 |
Strategic Risks
We operate in highly competitive markets and may be adversely affected by this competition.
The markets for our information, software, services and news are highly competitive and are subject to rapid technological changes and evolving customer demands and needs, including, as an example, the ongoing transformation brought on by the development and use of AI and the capabilities it offers across the spectrum of how businesses operate. Our customers increasingly look to us for solutions to help them adapt, improve efficiency and demonstrate value through leveraging technology to deliver a differentiated work product. If we fail to compete effectively and with speed to market, we may not retain key customers and our revenues, profitability and cash flows could be adversely affected.
We face more competition from fast-moving and agile competitors as AI continues to be integrated into the markets in which we compete. The rapid advancements in coding tools may enable new and existing competitors to create competing offerings rapidly, or they may incorporate AI into their products and solutions sooner and more successfully than we do, resulting in greater, faster and more effective adoption by customers, which could impair our ability to compete effectively and adversely affect our business, financial condition and results of operations. If we are not able to provide products, services and solutions that compete effectively, we could experience reduced sales and our business could be adversely affected. Our established, principal competitors have substantial resources, with recognized brands, technological expertise and market experience. With the acceleration of AI technologies there is a risk of our deep domain expertise and content-driven technology focus being undermined by competitors who evolve to provide comparable information and services to our customer base. Our business may be adversely impacted by risks such as the following:
Thomson Reuters Annual Report 2025 |
Page 19 |
We may be adversely affected by uncertainty, downturns and changes in the markets that we serve, particularly in the legal, tax, audit and accounting industries.
We operate in a dynamic external environment that is rapidly shifting due to innovations in technology, evolving global regulation and information proliferation. Uncertainty, downturns and changes that impact our business can also arise as a result of conditions in global financial markets, changes in macroeconomic factors, changes in laws and regulations, trade policy uncertainty, political conditions and election outcomes, political and social unrest, wars and conflicts, terrorist acts, cyber-attacks, economic and regulatory sanctions, natural disasters and public health crises and other factors over which we have no control.
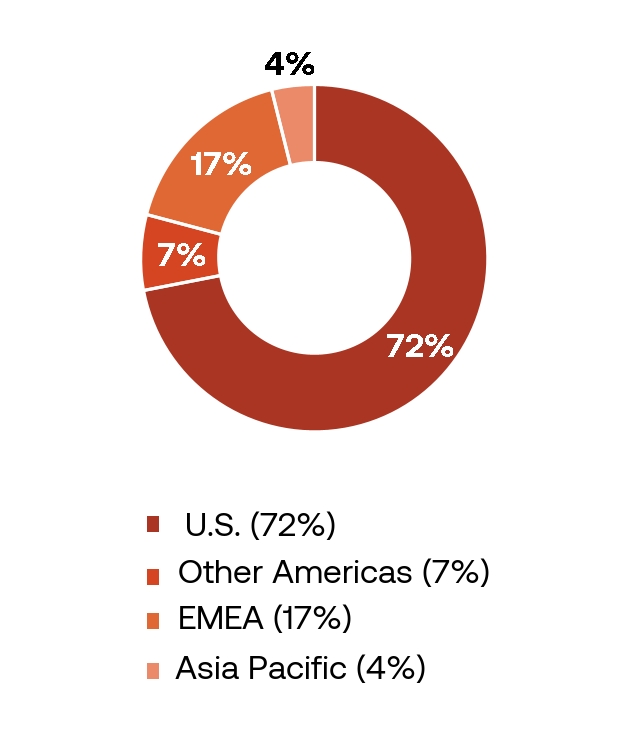
Our performance depends on the financial health and strength of our customers, which in turn is primarily dependent on the general economy in the United States (72% of our 2025 revenues) and secondarily on the general economies in the U.K., Canada, Brazil and other economies of Europe, Asia Pacific and Latin America. The global economy continues to experience substantial disruption and uncertainty due to persisting geopolitical tensions, ongoing protectionism measures (including the imposition of new tariffs, as well as related retaliatory measures), weaker global demand, an evolving interest rate and inflationary backdrop, supply chain disruptions, labour shortages and other events. These factors may create unprecedented economic conditions, including the possibility of an economic recession that may last substantially longer than expected and create stress on economic growth and market volatility. These conditions could lead to limited business opportunities for our customers, creating significant cost pressures for some of them, which could lead to lower demand for our products and services. We are unable to predict the extent of impact or duration of any such economic conditions, or their ultimate impact on demand for our products and services. In 2025, we derived 82% of our revenues from our Legal Professionals, Corporates and Tax, Audit & Accounting Professionals businesses. Global uncertainty and changing economic conditions can impact these industries.
The profitability of our products and services relies on our customers’ demand for and usage of our products and services. While we endeavour to accurately predict these trends, with the impact of changing technology on our customers’ business models, it has become difficult to accurately predict our customers’ demand for our products and services. Cost-cutting, reduced spending or reduced activity by customers may decrease demand for and usage of some of our products and services. This could adversely affect our business, financial condition and results of operations by reducing our revenues, which could in turn reduce the profitability of some of our products and services. Some of our customers may also slow down decision-making or delay planned renewals or implementations because of economic conditions and rapidly changing technology such as AI, which may disrupt historical spending patterns.
Page 20 |
Thomson Reuters Annual Report 2025 |
Trends in the industries we serve may change the way our customers operate and thus may impact our business. We have noted the following trends:
We may not be successful in our AI initiatives, and AI may expose us to certain risks, which could adversely affect our business, reputation, or financial condition and results of operations.
We are making significant investments in AI-based initiatives, including generative and agentic AI. As with other investments, there are significant risks involved in the development and application of AI and there can be no assurance that the usage of AI will enhance our products or services, meet the needs and expectations of our customers, or be beneficial to our business, including our efficiency or profitability.
The development of AI technologies is complex and evolving and there are technical challenges associated with achieving desired levels of accuracy, efficiency and reliability. AI algorithms, models and data may have limitations, including inherent human biases, errors, or inability to handle certain data types or scenarios. Failure of our AI technologies to produce accurate results may have a negative impact on our reputation and adversely affect our business and we may be subject to legal and regulatory scrutiny and increased litigation. Given that the development, adoption and use of AI technologies remains fast-paced, it is not possible to predict all the risks related to the use of AI and the impact they may have on the company.
If we are unable to keep pace with rapid technological developments to provide new products, services, applications and functionalities to meet our customers’ needs, attract new customers and retain existing ones, expand into new geographic markets and identify areas of higher growth, our ability to generate revenues or achieve higher levels of revenue growth in the future may be adversely affected.
Our growth strategy involves enhancing our current products and developing innovative new products, product features, and services in a timely and cost-effective manner to meet our customers’ needs. This includes anticipating and responding to industry trends and technological changes, expanding into new geographic markets and maintaining a strong position in the sectors that we serve.
Technologies such as AI, ML, data synthesis and user-generated capabilities have created the need to adapt rapidly to the shifting landscape and to generate insights from these technologies to increase the value that our solutions and services bring to our customers. While we are focused on these changes to the technological landscape, if we fail to adapt, or do not adapt quickly enough, our business, financial condition and results of operations could be adversely impacted.
We continue to focus on driving growth through more collaboration and stronger relationships with both established and emerging companies and incubators. We are also continuing to increase our focus on partnerships and APIs. Some of these initiatives combine another company’s technology, data or other capabilities with our products and services. These initiatives involve a number of risks, including the risk that the expected synergies will not be realized, that they may require substantial expenditures and take considerable time and that the expected results may ultimately not be achieved, that a new initiative may conflict or detract from our existing businesses, or that security measures may not be adequate or could adversely impact our brand and reputation. In addition, our ability to adopt new services and develop new technologies may be inhibited by industry-wide standards, new laws and regulations, resistance to change from our customers, limitations in technological ability or third parties’ IP rights. While we believe
Thomson Reuters Annual Report 2025 |
Page 21 |
these initiatives will be attractive to our customers, allow us to innovate more quickly and build sales channels in segments that we could not have reached as quickly on our own, we are unable to provide any assurances that these initiatives will increase our revenue growth.
Over the last few years, we have made significant investments designed to improve and enhance the functionality and performance of several of our key products, such as Westlaw, CoCounsel, HighQ, Legal Tracker, CLEAR, Checkpoint Edge, Practical Law, ONESOURCE and SurePrep. We have also successfully migrated customers from legacy offerings to our current propositions and continued to enhance the reliability and resiliency of the technology infrastructure that we use to deliver products and services. However, if our customers’ adoption rates for existing and new products and services are lower than our expectations, our revenues may be lower and our results of operations may be adversely affected.
We may be unable to derive fully the anticipated benefits from our existing or future acquisitions, dispositions, or other strategic transactions, including joint ventures and investments.
While we are focused on growing our businesses organically, acquisitions and other strategic transactions remain an important part of our growth strategy to expand and enhance our products, services and customer base and to enter new geographic areas.
In 2025, we acquired SafeSend, a United States-based cloud-native provider of technology for tax and accounting professionals. We also acquired Additive AI, a San Francisco-based startup, founded in 2023, which uses cutting-edge AI to automate tax document processing for tax and accounting professionals, as well as TimeBase, a leading provider of Australian legislative information, offering a comprehensive platform for legal professionals to find, search, track and understand legislation. Lastly, we acquired the commercial and licensing operations of Imagn Images, a US-based sports photography agency.
In the future, we may not be able to successfully identify attractive acquisitions or other strategic transaction opportunities or make acquisitions or other strategic transactions on terms that are satisfactory to our company from a commercial perspective. In addition, competition for acquisitions in the industries in which we operate during recent years has escalated and may increase the price of acquisitions or other strategic transactions, which could cause us to refrain from making certain acquisitions. Our ability to execute on opportunities may also be affected by factors beyond our control, including without limitation, commercial or regulatory changes that may subject us to increased regulatory scrutiny from competition and antitrust authorities in connection with acquisitions and other strategic transactions. Achieving the expected returns and synergies from existing and future acquisitions or other strategic transactions will depend in part upon our ability to integrate the products and services, technology, administrative functions and personnel of these businesses into our segments in an efficient and effective manner. We cannot guarantee that we will be able to do so, or that our acquired businesses, joint ventures or investments will perform at anticipated levels or that we will be able to obtain these synergies. Management resources may also be diverted from operating our existing businesses to certain acquisition and other strategic transaction integration challenges. If we are unable to successfully integrate acquired businesses and other strategic transactions, as applicable, our anticipated revenues and profits may be lower. Our profit margins may also be lower, or diluted, following the acquisition of, or strategic transactions involving, companies whose profit margins are less than those of our existing businesses. Certain acquisitions may initially incur losses which would reduce our earnings per share in certain periods.
We have also historically decided from time to time to dispose of assets or businesses that are no longer aligned with strategic objectives or our current business portfolio. These transactions may involve challenges and risks. There can be no assurance that future divestitures will occur, or if a transaction does occur, there can be no assurance as to the potential value created by the transaction. The process of exploring strategic alternatives or selling a business could also negatively impact customer decision-making and cause uncertainty and negatively impact our ability to attract, retain and motivate key employees. Any failures or delays in completing divestitures, including separation activities, could have an adverse effect on our business, financial condition and results of operations and on our ability to execute our strategy. Although we have established procedures and processes to mitigate these risks, there is no assurance that those procedures and processes will be effective or that these transactions will be successful. In addition, we expend costs and management resources to complete divestitures and manage post-closing arrangements. Completed divestitures may also result in continued financial involvement in the divested business, such as through guarantees, indemnifications, transition services arrangements or other financial arrangements, following the transaction.
Our brands and reputation are important company assets and are key to our ability to remain a trusted source of information and news.
The integrity of our brands and reputation is key to our ability to remain a trusted source of information and news and to attract and retain customers. Negative publicity regarding our company or actual, alleged or perceived issues regarding one of our products or services could harm our relationship with customers.
Page 22 |
Thomson Reuters Annual Report 2025 |
Failure to protect our brands or a failure by our company to uphold the Thomson Reuters Trust Principles may also adversely impact our credibility as a trusted supplier of content and may have a negative impact on our information and news business.
There is a focus from some stakeholders on corporate responsibility, specifically relating to ESG initiatives and corporate sustainability reporting. We pursue ESG initiatives because they contribute to value creation for our customers, employees, shareholders and other stakeholders. In 2025, we completed our second ESG double materiality assessment to comply with new global regulations. We have set a number of targets related to these initiatives and identified and prioritized ESG issues, risks and opportunities. Standards for tracking and reporting ESG matters continue to evolve and we may not be able to implement new and changing standards in ways that meet the expectations of all of our stakeholders. If we fail to satisfy the expectations of investors, customers, vendors, employees, regulators and other stakeholders related to our ESG performance and in our corporate sustainability reporting or our ESG initiatives are not executed as planned, it could adversely affect our reputation, business, share price, financial condition or results of operations. Due to the shifting legal and policy landscape, as well as changing stakeholder expectations, our reputation also may be harmed by negative perceptions that our customers, employees and other stakeholders may have about our action or inaction on social, ethical, or political issues.
Social and ethical issues relating to the use of new and evolving technologies, such as AI, in our products and services could adversely affect our business, financial condition or results of operations.
Many of our products and services use new and evolving technologies, such as AI. These often present social and ethical risks and challenges that could affect their adoption and therefore our business. For example, the use of AI in our products may give rise to risks related to harmful content, inaccuracy, misinformation, bias, discrimination, IP infringement or misappropriation, defamation, data privacy and cybersecurity, among others. We may not have insight into, or control over, the practices of third parties who utilize AI technologies. As such, we cannot guarantee that third parties will not use AI technologies for improper purposes. If we enable or offer AI solutions, or enter into partnerships with third parties or engage third party vendors in respect of AI technologies, that result in any of the foregoing or otherwise draw controversy due to their perceived or actual impact on society, we may experience brand or reputational harm, competitive harm or legal liability and regulatory scrutiny.
Evolving government regulation related to AI use and ethics, or requirements from third-party groups, such as local bar associations or tax licensing boards, may also increase the burden and cost of research and development in this area and failure to properly remediate AI usage or ethics issues may cause public confidence in AI to be undermined, which could slow adoption of AI in our products and services. The rapid evolution of AI will require the application of resources to develop, test and maintain our products and services to help ensure that AI is implemented ethically in order to minimize unintended, harmful impacts. If we do not maintain ethical and transparent policies and procedures related to AI, this could result in reputational harm and legal liability, which could adversely affect our business, financial condition or results of operations.
Technology and Data Risks
We and our third-party providers face risks related to cybersecurity threats and incidents that could adversely affect our reputation, business, results of operations, and financial condition.
In connection with our business, we rely extensively on our own and third-party information technology systems and infrastructure to provide our products and services and operate our business. Further, we rely on our own and third-party content and other data and information published as part of our products and services. Our company has been subject to and is increasingly likely to continue to be the target of, cyber-attacks and incidents that could negatively impact our systems, information and data. Cyber-threats and cyber-attacks vary in technique and sources, are persistent, frequently change and are increasingly becoming more sophisticated and targeted. Especially with the use of emerging technologies, such as advanced forms of AI, cyber-attacks and incidents have become increasingly more difficult to detect and prevent. The occurrence of these attacks and incidents may also increase due to the increased reliance on information technology, growing number of integrations and network connections with third-party services, customers, or partners, remote access from hybrid and remote workers, heightened geopolitical tensions and the prominence of our Reuters business.
While we and third-party information services that we use have information security programs and security measures in place designed to protect our information technology systems and infrastructure, these programs and these measures may not prevent all material breaches caused by cyber-attacks and incidents, including without limitation:
Thomson Reuters Annual Report 2025 |
Page 23 |
As a third-party supplier, we are sometimes provided with a trusted connection to a customer’s information technology systems and infrastructure. If malicious parties compromise our information technology systems and infrastructure, including without limitation embedding malicious hardware, components or software, they could gain access to our or our customers’ systems and information. In addition, if a customer experiences a cybersecurity incident or cyber-attack it could result in a compromise or breach of our own information technology systems and infrastructure, which could adversely affect our company’s reputation, business, results of operations and financial condition even if we were not responsible for the breach. In addition to cyber-attacks on and incidents related to our third-party providers’ information technology systems and infrastructure, our outsourcing of certain functions requires us to sometimes grant network access to third parties. If our third-party providers do not maintain adequate security measures, do not require their sub-contractors to maintain adequate security measures or do not perform as anticipated and in accordance with contractual requirements, it could adversely affect our company’s reputation, business, results of operations and financial condition even if we were not responsible for the incident.
We collect, store, use, transmit and otherwise process information and data, including without limitation public records, IP, proprietary business information, product content and personal data pertaining to our company, our employees and contractors, our customers and their clients, our providers and other individuals. A number of our customers, their clients and providers, our providers and third-party business partners and our employees and contractors also entrust us with storing and securing their own data and information. Our businesses also include certain subscription-based screening products which we sell to institutional customers and governments to enable them to satisfy various regulatory obligations.
Any cyber-attacks on or incidents involving our own and third-party information technology systems and infrastructure that process this information and data have in the past resulted in and could in the future result in, the unauthorized access to, loss, manipulation, destruction of, or disclosure of personal and business information. None of these attacks and incidents that have impacted our company to-date have resulted in a material adverse impact for our business. We seek to mitigate these risks through our ability to detect, escalate and respond to known and potential risks through our Enterprise Security Incident Management processes; however, any cyber-attacks on or incidents involving our own and third-party information technology systems and infrastructure could potentially result in additional costs to our company to enhance security or to respond to occurrences, loss of trust and harm to our brand, loss of sales and an inability to gain new ones, violations of contracts leading to contract terminations and litigation, violations of privacy or other laws leading to penalties, fines, regulatory action or litigation, harm to our brand and reputation and otherwise adversely impact our business, financial condition and results of operations. While we maintain what we believe is sufficient insurance coverage that may (subject to certain policy terms and conditions
Page 24 |
Thomson Reuters Annual Report 2025 |
including self-insured deductibles) cover certain aspects of third-party security and cyber-risks and business interruption, our insurance coverage may not always cover all costs or losses and it does not extend to any reputational damage or costs incurred to improve systems as a result of these types of incidents.
We rely heavily on our cloud providers and local data center providers as well as key software-as-a-service (SaaS) providers to provide services from sales to billing; any impacts from these providers could adversely affect our ability to serve our customers and could negatively impact our revenues, ability to retain customers and reputation.
Most of our products and services are delivered electronically and our customers depend on our ability to receive, store, process, transmit and otherwise rapidly handle very substantial quantities of data and transactions on computer-based networks. Our customers also depend on the continued capacity, reliability and security of our cloud and third-party infrastructure, data centres, networks, telecommunications and other electronic delivery systems, including online access. Our employees also depend on these systems for our internal use. Rapidly evolving technology may require us to further rely on third party partners and vendors to provide and support our services, which can add costs and risks and impact margins. If we fail to anticipate or misjudge customers’ rapidly changing needs and expectations or adapt to emerging technological trends, our business, financial condition and results of operations could suffer.
Substantially all of our offerings are SaaS or cloud-based that provide customers with online access. We are dependent on third-party service providers to maintain the cloud infrastructure that we use to operate our business. If these third-party service providers fail, consolidate, stop providing certain services or implement cost-cutting efforts, our business could be adversely affected.
Any significant failure, compromise, cybersecurity incident, data privacy breach, disruptive cyber-attack, or interruption of our systems or a third-party service provider’s, including operational service disruptions, sabotage, break-ins, war, terrorist activities, human error, misuse of AI, AI systems failures, natural disaster, power or coding loss and computer viruses, could cause our or a third-party service provider’s systems to operate slowly or could interrupt service for periods of time. The frequency and intensity of weather events related to climate change are also increasing, which could increase the likelihood and severity of such disasters as well as related damage and business interruptions if any of our or our key third-party service providers’ facilities or systems are affected. While we and our key third-party service providers have disaster recovery and business continuity plans that utilize industry standards and best practices, including back-up facilities for primary data centers, a testing program and staff training, the systems are not always fully redundant and disaster recovery and business continuity plans may not always be sufficient or effective. To the extent that our telecommunications, information technology systems, cloud-based service providers or other networks are managed or hosted by third parties, we would need to coordinate with these third parties to resolve any issues. In the past, when we have experienced slow operation of our systems or service interruptions, some of our products, services, websites, information or data have been unavailable for a limited period of time, but none of these occurrences have been material to our business to date. Disruptions and outages to our products could have a negative effect on our revenues, ability to retain customers and reputation.
Our ability to effectively use the Internet may also be impaired due to infrastructure failures, service outages at third-party internet service providers or increased government regulation. In addition, we are facing significant increases in our use of power and data storage. We may experience shortage of capacity and increased costs associated with such usage. These events may affect our ability to store, process and transmit data and services to our customers.
Further, our ability to continue to develop and effectively deploy AI technologies is dependent on access to specific third-party equipment and other infrastructure, such as processing hardware and network capacity, which we cannot control the availability of, especially in a highly competitive environment. This reliance on third parties creates additional risks such as data loss, product outages, price fluctuations and other challenges inherent in working with third parties.
Operational Risks
If we do not continue to attract, engage and retain the right management, key employees and skills to the organization, we may not be able to execute our global strategies and businesses.
The completion and execution of our strategies depends on our ability to continue to attract and retain high quality and talented management and employee base across all of our businesses and global locations and to foster employee engagement at all levels in the company. We compete with many businesses that are seeking skilled individuals, particularly those with experience in technology, cybersecurity, data science, AI and ML and product management. More recently, with the rapid increase and the use of and investment in AI by a number of companies, the market for skilled personnel in AI in particular is very competitive. Some of the companies we compete with in this space for experienced personnel have greater resources than we have and may offer more lucrative compensation packages than we offer or provide such other incentives that we may not be able to offer. We have experienced and we expect to continue to experience significant competition in hiring and retaining such employees. Our ability to execute on our AI strategy will be adversely affected if we are unable to retain, hire and engage highly skilled employees in this space. Competition for sales professionals in our Legal Professionals, Corporates and Tax, Audit &
Thomson Reuters Annual Report 2025 |
Page 25 |
Accounting Professionals segments can also be intense as other companies seek to enhance their positions in our market segments.
If we are unable to continue to identify or be successful in attracting, motivating and retaining the appropriate qualified personnel for our businesses and to continue to enhance our inclusive and engaging culture, it could adversely affect our ability to execute our strategies.
If we are unable to successfully adapt to organizational changes and other strategic initiatives, our reputation, business, financial condition and results of operations could be impacted.
The transformation of our workforce due to the impact of AI is expected to become an important driver of future productivity, but only if we adopt and integrate new technologies in an effective and responsible manner. Our ability to successfully manage organizational changes and upskill our talent, including from the changes from the impact of AI, is important for our future business success. In particular, our reputation and results of operations could be harmed if employee morale, engagement or productivity decline as a result of organizational changes.
Furthermore, we may not realize all of the cost savings, incremental revenue and synergies that we expect to achieve from our strategic initiatives due to a variety of factors, including, but not limited to, unexpected operational or technological challenges, higher than expected costs or expenses, delays in the anticipated timing of activities and other unexpected costs associated with operating our business. If we are unable to achieve the cost savings, incremental revenue or synergies that we expect to achieve from our strategic initiatives, it could adversely affect our profitability and related margins.
Our ability to realize our go-to-market strategies and any change to those strategies relies on our people and underlying processes and systems. We regularly monitor our team capacity and supporting systems and processes, to drive effectiveness and align with customer preferences.
Operating globally involves challenges that we may not be able to meet and that may adversely affect our ability to grow.
As part of our globalization efforts, we operate regional teams and shared resource operational centers, particularly in emerging markets, that work across our segments to combine local expertise with global capabilities to address specific customer needs. We sometimes modify existing products and services for local markets, but we also develop products and services specifically for local markets.
We believe that there are advantages to operating globally, including a proportionately reduced exposure to the market developments of a single country or region. However, there are certain risks inherent in doing business globally which may adversely affect our business and ability to grow. These risks include:
Page 26 |
Thomson Reuters Annual Report 2025 |
Adverse developments in any of these areas could cause our actual results to differ materially from expected results. Challenges associated with operating globally may increase for our company as we continue to expand into geographic areas that we believe present the highest growth opportunities. We may also be required or may decide to cease or modify operations in a particular country as a result of a risk described above, which could adversely affect our business, financial condition and results of operations.
We are dependent on third parties for data, information and other services.
We obtain significant data and information through licensing arrangements with content providers, some of which may be viewed as competitors. Some providers may seek to increase fees for providing their proprietary content or services and others may not offer our company an opportunity to renew existing agreements. We also depend on public sources for certain data and information.
In addition, we rely on third-party service providers for telecommunications and other services that we have outsourced, such as certain human resources administrative functions, facilities management, IT services and accounts payable and receivable. Any failure by the third-party service providers we work with to comply with applicable laws, regulations, or agreements, could result in formal investigations or enforcement actions, fines, litigation, claims or negative publicity and could result in significant liability and otherwise have an adverse effect on our reputation and business.
If we are unable to maintain or renegotiate commercially acceptable arrangements with these content or service providers or find substitutes or alternative sources of equivalent content or service, our business could be adversely affected. Our revenues and margins could also be reduced if some of our competitors obtained exclusive rights to provide or distribute certain types of data or information that was viewed as critical by our customers.
Legal, Regulatory and Intellectual Property Risks
We are subject to a significant number of laws and may incur fines, penalties, litigation, and other losses for violating these laws. We may be adversely affected by changes in legislation and regulation, which may also impact how we provide products and services and how we collect and use information and data.
We are subject to a broad and evolving array of laws and regulations, including those governing privacy, data protection, AI, anti-money laundering (AML), economic sanctions, trade controls, accessibility and other compliance areas. Legislative and regulatory changes that impact our company and legislative and regulatory changes that impact our customers’ industries also impact how we provide products and services to our customers. While regulatory developments may create opportunities for new services—particularly for our Legal Professionals, Corporate, and Tax, Audit & Accounting Professionals segments—certain changes could also reduce demand for existing products or services.
There has been a rapid increase in the use of and the investment in AI by many companies and organizations which has resulted in a significant focus by regulators on the use of AI. Although several jurisdictions around the globe have already proposed or enacted laws governing AI (e.g. EU AI Act and individual U.S. state AI laws), there is still uncertainty in the legal regulatory regime relating to AI. The uncertain and fragmented regulatory landscape for AI may require significant investment to adapt our products and practices to comply with evolving legal requirements, the scope of which remains unclear. Future legislation may make it harder for us to conduct our business using AI, lead to regulatory fines or penalties for non-compliance, require us to change our product offerings or business practices, prevent or limit our use of AI or impact our ability to provide insights from data and use certain data to develop our products. If our use of AI is restricted in the future, our business may be less efficient, or we may be at a competitive disadvantage. Any of these factors could adversely affect our business, financial condition and results of operations. In addition, the evolving AI regulatory environment could affect our customers’ desire to use products with AI due to the unknown nature of the risks associated with such use, may increase our liability related to the use of AI products by our customers that are beyond our control and result in an increase in our research and development costs to tailor our products and solutions to comply with legal requirements across different jurisdictions related to customer use.
Additionally, in the ordinary course of business, we collect, store, use and transmit certain types of information and data that are subject to an increasing number of different laws and regulations. In particular, the data security, data protection and privacy laws and regulations that we are subject to often vary by jurisdiction and include, as two examples and without limitation, the General Data Protection Regulation (GDPR) in the E.U. and various U.S. state and federal laws and regulations. Proposed and existing legislation in other countries and regions around the world related to privacy, data security, data protection and other related areas may also impact how we provide products and services and how we collect and use information.
Thomson Reuters Annual Report 2025 |
Page 27 |
Some of these laws and regulations require us to collect affirmative opt-in consent and/or include a right for individuals to opt out or object to having their data shared with third parties and/or a right to be informed about what data about them is being shared, among other things. The viability and perceived value of some of our risk and fraud and screening products could be adversely impacted through the requirements of these laws and regulations and the exercise of these rights. Some of these laws and regulations, along with industry changes (such as the industry elimination of third-party cookies), could adversely impact our collection and use of certain information and our digital advertising revenue.
We are also subject to data localization laws in certain countries, which require us to store and process certain types of data within a particular country. We are also subject to various data transfer restrictions that either limit our ability to transfer, or require us to guarantee a certain level of protection when transferring data from one country to another. The regulatory landscape in various countries where we operate continues to evolve and sometimes includes strict local rules regarding the use (or restrictions on use) of encryption technologies as well as broad governmental rights related to Internet monitoring and regulation of Internet transmissions.
These laws and regulations are continuously evolving and complying with applicable laws and regulations involves significant costs and time. Existing, new and proposed legislation, regulations and regulatory guidance, including changes in the manner in which such legislation and regulations are interpreted by courts, may also:
Governmental action (including laws or economic or political policies that restrict the use of specific companies, equipment or services, including those deemed to be sensitive to national interests) can also create some legal uncertainties. It is difficult to predict in what form laws and regulations will be adopted, changed or repealed, how they will be construed by the relevant courts, or the extent to which any changes might adversely affect us.
Although we have implemented policies and procedures that are designed to ensure compliance with applicable laws, rules and regulations, we could be subject to civil or criminal fines and penalties and other enforcement actions, litigation or other claims, reputational damage and loss in revenue (e.g., from contracts terminated for non-compliance), which, either individually or in the aggregate, could have a material adverse effect on our business, operations and financial condition. See “Contingencies – Lawsuits and Legal Claims” in the “Management’s Discussion and Analysis” section of this annual report.
Our IP rights are valuable and external factors threaten to diminish their value, which in turn may adversely affect our business, financial condition and results of operations.
Thomson Reuters' products and services incorporate advanced technologies built on our proprietary content and are delivered through a variety of media. To safeguard our proprietary content, know-how, and technology, we rely in part on agreements with customers, employees, consultants, advisors, suppliers, and other third parties. We also protect our rights through patents, trademarks, copyrights, and other IP protections covering our content, products and services, and brand, as well as through technical and commercial safeguards embedded in our delivery channels. Despite these measures, third parties may still copy, infringe upon, or otherwise benefit from our proprietary rights. In addition, we operate in certain countries where legal protections for IP may be uncertain or ineffective. While we believe we have taken appropriate steps to protect our IP, we cannot guarantee that infringement will not occur. If we are unable to protect these rights, our financial conditions and results of operations could be adversely affected.
The IP of an acquired business may also be an important component of the value that we agree to pay for such a business. However, such acquisitions are subject to the risks that the acquired business may not own the scope of IP that we believe we are acquiring, that the IP is dependent upon open-source licenses or other licenses from third parties, or that the acquired business infringes the IP rights of others. If we are not able to successfully integrate acquired businesses’ IP rights, our financial condition and results of operations may be adversely affected.
Page 28 |
Thomson Reuters Annual Report 2025 |
With the increasing maturity of AI technology, some of our competitors may also be able to develop new products or services that are similar to ours without infringing our IP rights, which could adversely affect our financial condition and results of operations. While our proprietary content is often the differentiator that allows us to provide a superior product, uncertainty exists in the scope of IP protection offered under copyright law as authorities and courts in crucial jurisdictions begin to grapple with the application of copyright law to generative AI, which could result in an inability to rely on traditional copyright to adequately protect our content and source code. In addition, AI-generated content's copyrightability also presents a complex issue that varies across jurisdictions, where the concept of "authorship" often requires human creativity, which raises questions about whether AI-generated works meet this standard. The lack of a unified approach to AI-generated content creates challenges for global copyright harmonization. As our content teams work to adopt AI into their business processes, we will need to balance the priority of copyrightability and consider mitigation tactics, such as human modification to establish copyright or reliance on contractual terms that limit licenses uses.
Additionally, if unauthorized disclosure of our source code occurs through security breach, cyber-attack or otherwise, we would lose future trade secret protection for that source code. Such loss could make it easier for third parties to compete with our products by utilizing our content or copying functionality, which could cause us to lose customers and could adversely affect our revenue and operating margins. If we cannot protect our IP against unauthorized copying, use, or other misappropriation, our business could be harmed. In addition, other companies may have (or in the future may obtain) patents or other proprietary rights that would prevent, limit, or interfere with our ability to make, use, or sell our own AI products.
Tax matters, including changes to tax laws, regulations and treaties, could impact our effective tax rate and our results of operations.
We operate in many countries and our earnings are subject to taxation in multiple jurisdictions at varying rates. We seek to organize our affairs in a tax efficient manner, taking account of the jurisdictions in which we operate. In 2025, our effective tax rate was lower than the Canadian corporate income tax rate due largely to lower tax rates and differing tax rules applicable to certain of our operating and financing subsidiaries outside Canada. Our effective tax rate has fluctuated in the past and is likely to fluctuate in the future, reflecting the mix of taxing jurisdictions in which pre-tax profits and losses are recognized. Our effective tax rate and our cash tax cost in the future will depend on the laws of numerous countries and the provisions of multiple income tax treaties between various countries in which we operate. Our effective tax rate and our tax cost could also be adversely affected by changes, possibly with retroactive effect, in tax laws and regulations, international treaties and tax accounting standards and/or uncertainty over their application and interpretation.
One relatively recent change in tax law is the enactment of a global minimum tax regime (“Pillar Two” of the ongoing international tax reform initiative sponsored by the Organization for Economic Co-operation and Development (OECD) in a number of jurisdictions, including Canada, the U.K., the E.U. and Switzerland, beginning in 2024. Pillar Two generally imposes an alternative minimum tax of 15% on adjusted book income. The OECD and national tax administrations continue to develop further guidance on how Pillar Two’s provisions will be applied or otherwise administered, which may be different from our interpretation. Furthermore, certain aspects of Pillar Two could be modified in the future. Due to potential volatility in differences between book and taxable income, the impact of Pillar Two is difficult to predict and may adversely affect our financial condition and results of operations.
Various tax-related legislative initiatives have been proposed or are being discussed that if enacted, could adversely affect our tax positions and/or our tax liabilities. For instance, many countries have enacted or are considering digital service taxes, which could subject Thomson Reuters to tax in additional jurisdictions or to increased taxes in jurisdictions in which it already has a taxable presence.
We are subject to regular audits, examinations and reviews by tax authorities in Canada, the U.K., the U.S. and other jurisdictions during the ordinary course of business. While we believe the positions that we take on our tax filings are sustainable and supported by the weight of law, certain positions taken have been or may be challenged by the applicable tax authorities. We may be required in some instances to pay additional taxes to a tax authority while contesting a matter through available administrative or judicial remedies. We regularly assess the likely outcomes of these audits to determine the adequacy of our tax provision. However, our judgments may not be sustained and the amounts ultimately paid could be different from the amounts previously recorded. If any such challenge results in an adverse outcome, including unforeseen tax-related liabilities, this could negatively affect our financial condition and results of operations for the period at issue and on an ongoing basis. Many governments in jurisdictions where we operate are facing budget deficits and challenges and, as a result, may look to increase their tax revenues through increased audit activity and tax reform.
We operate in a litigious environment which may adversely affect our business, financial condition and results of operations.
We are from time to time involved in and may in the future become involved in legal actions and claims arising in the ordinary course of business, including employment and labor matters, customer and commercial matters, privacy and data protection matters, defamation matters, tax matters, antitrust matters, unfair business practices matters and IP
Thomson Reuters Annual Report 2025 |
Page 29 |
infringement matters. The outcome of all of the matters against our company is subject to future resolution, including uncertainties of litigation. Litigation outcomes are difficult to predict with certainty due to various factors, including but not limited to: the preliminary nature of some claims; uncertain damage theories and demands; an incomplete factual record; uncertainty concerning legal theories and procedures and their resolution by the courts, at both trial and appellate levels; and the unpredictable nature of opposing parties.
Regardless of the merits of legal actions and claims, such matters can be expensive, time consuming or harmful to our reputation and in recognition of these considerations, we may seek to settle such matters. While we maintain insurance for certain potential liabilities, such insurance does not cover all types and amounts of potential liabilities and is subject to various exclusions as well as caps on amounts recoverable. Due to the inherent uncertainty in the litigation process, the resolution of any particular legal proceeding could result in changes to our products and business practices and could have a material adverse effect on our financial position and results of operations.
We are significantly dependent on technology and the rights related to it. From time to time, we have been sued by other parties for allegedly violating their patents, copyrights or other forms of IP. Our company and other companies have experienced alleged claims from third parties whose sole or primary business is to monetize IP. If an infringement suit against our company is successful, to be able to continue selling a particular product or service, we may be required to compensate the party bringing the suit either by paying a lump sum or ongoing license fees. This type of compensation could be significant, in addition to legal fees and other costs that we would incur defending such a claim.
We might also be prevented by a court from continuing to provide an affected product or service and may be caused to alter our business practices. We may also be required to defend or indemnify any customers who have been sued for allegedly infringing a third party’s patent or copyright in connection with using one of our products or services. Responding to IP claims, regardless of the validity, can be costly and time consuming and may have a material adverse effect on our business and reputation as well as our financial performance, financial condition and cash flows.
Antitrust/competition-related claims or investigations could result in changes to how we do business and could be costly.
We are subject to applicable antitrust and competition laws and regulations in the countries where we have operations. These laws and regulations seek to prevent and prohibit anti-competitive activity. From time to time, we may be subject to antitrust/competition-related claims and investigations. Following such a claim or investigation, we may be required to change the way that we offer a particular product or service and if we are found to have violated antitrust or competition laws or regulations, we may be subject to fines or penalties. Any antitrust or competition-related claim or investigation could be costly for our company in terms of time and expense and could have an adverse effect on our financial condition and results of operations.
Financial Risks
We generate a significant percentage of our revenues from recurring, subscription-based arrangements, and our ability to maintain existing revenues and generate higher revenues is dependent in part on maintaining a high renewal rate.
In 2025, 81% of our revenues were derived from subscriptions or similar contractual arrangements, which result in recurring revenues. In the short to medium term, our revenues are supported by a relatively fixed cost base that is generally not impacted by fluctuations in revenues. Because a high proportion of our revenues is recurring, we believe that our revenue patterns are generally more stable compared to other business models that primarily involve the sale of products in discrete or one-off arrangements. However, there is often a lag in realizing the impact of current sales or cancellations in our reported revenues, as we recognize revenues over the term of the arrangement. Because of this lag effect, our revenues are typically slower to decline when economic conditions deteriorate but are also often slower to return to growth when economic activity improves, as compared to other businesses that are not subscription-based. Our transactions revenues (12% of our 2025 revenues), which include volume-based fees related to online searches and tax filings, fees from software licenses with no future obligations, professional fees from service and consulting arrangements and advertising and sponsorship revenues in our Reuters Professional business fluctuate based on the condition of the economic environment.
Our subscription and similar contractual arrangements typically have terms ranging from one to five years, which most customers renew at the end of each term. Renewal dates are spread over the course of the year. Many of our customer agreements have automatic renewal provisions, but customers are often able to terminate these types of agreements prior to automatic renewal of a new term by providing appropriate notice to us within a specified time period. In order to maintain existing revenues and to generate higher revenues, we are dependent on a significant number of our customers to renew their arrangements with us. Our revenues could also be lower if a significant number of our customers renewed their arrangements with us, but reduced the amount of their spending.
Page 30 |
Thomson Reuters Annual Report 2025 |
Our government business contractual arrangements are typically cancellable at will by the customer, which presents the risk that government contracts may be terminated without notice or cause. In addition, government contracts may be subject to government policy changes, audits, reviews and efficiency initiatives that could adversely affect the demand for our products and services by government customers. These risks of the government business could impact our revenues and reputation.
Currency and interest rate fluctuations and volatility in global markets may have a significant impact on our reported revenues and earnings.
Our financial statements are expressed in U.S. dollars and are, therefore, subject to movements in exchange rates on the translation of the financial information of businesses whose functional currencies are not U.S. dollars. We recognize revenues and incur expenses in many currencies and are thereby exposed to the impact of fluctuations in various foreign currency exchange rates. We monitor the financial stability of the foreign countries in which we operate. Volatility and uncertainty in global markets in the future could adversely affect our results.
Exchange rate movements in our foreign currency exposures may cause fluctuations in our consolidated financial statements. If our operations outside of the U.S. expand, we would expect this exposure to grow. We monitor foreign currency exposures on a regular basis and some of our largest foreign currency exposures are currently to the British pound sterling, the Mexican Peso, the Brazilian real, the Indian rupee and the Swiss Franc. We have historically, and may in the future, hedge some of our foreign currency exposure if we believe that it may be material to our financial condition and results of operations.
We may issue non-U.S. dollar-denominated debt in the future and would expect to hedge any such debt into U.S. dollars, as has been our practice.
In addition, an increase in interest rates from current levels could adversely affect our results in future periods.
Our credit ratings may be downgraded, which may impede our access to the debt markets or raise our borrowing rates.
Our access to financing depends on, among other things, suitable market conditions and the maintenance of suitable long-term credit ratings. Our credit ratings may be adversely affected by various factors, including increased debt levels, decreased earnings, declines in customer demands, increased competition, a further deterioration in general economic and business conditions and adverse publicity. Any downgrades in our credit ratings may impede our access to the debt markets or raise our borrowing rates. For additional information on our current credit ratings, please see the “Additional Information – Ratings of Debt Securities” section of this annual report.
We have significant funding obligations for pension arrangements that are affected by factors outside of our control.
We have significant funding obligations for various pension arrangements that are affected by factors outside of our control, including market factors and changes in legislation. In the past, we have contributed to our pension plans to pre-fund certain obligations. We may be required or we may opt to make additional contributions to some pension plans in the future and the amounts of any such contributions may be material.
Valuations of obligations for material plans are determined by independent actuaries and require assumptions in respect of expected mortality, inflation and medical cost trends, along with the discount rates used to measure obligations. These assumptions are reviewed annually. While we believe that these assumptions are appropriate given current economic conditions, significant differences in actual experience or significant changes in assumptions may materially affect our valuations of pension obligations and related future expenses. In addition, the performance of the markets within which we hold our pension assets (primarily equity and fixed income markets), which may be influenced by general economic conditions, including interest rates, inflation and currency exchange rates, may impact the funding level of our funded plans and required contributions.
We may be required to take future impairment charges that would reduce our reported assets and earnings.
Goodwill and other identifiable intangible assets comprise a substantial portion of our total assets. We are required under IFRS to test our goodwill and identifiable intangible assets with indefinite lives for impairment on an annual basis. We also are required by IFRS to perform an interim or periodic review of our goodwill and all identifiable intangible assets if events or changes in circumstances indicate that impairment may have occurred. Impairment testing requires our company to make significant estimates about our future performance and cash flows, as well as other assumptions. Economic, legal, regulatory, competitive, contractual and other factors as well as changes in our company’s share price and market capitalization may affect these assumptions. If our testing indicates that impairment has occurred relative to current fair values, we may be required to record an impairment charge in the period the determination is made. Recognition of an impairment would reduce our reported assets and earnings.
Thomson Reuters Annual Report 2025 |
Page 31 |
Corporate Structure Risks
Woodbridge controls our company and is in a position to affect our governance and operations.
Woodbridge and its affiliates beneficially owned approximately 70% of our common shares as of March 2, 2026. For so long as Woodbridge maintains its controlling interest in our company, it will generally be able to approve matters submitted to a majority vote of our shareholders without the consent of other shareholders, including, among other things, the election of our Board. In addition, Woodbridge may be able to exercise a controlling influence over our business and affairs, the selection of our senior management, the acquisition or disposition of our assets, our access to capital markets, the payment of dividends and any change of control of our company, such as a merger or take-over. The effect of this control may be to limit the price that investors are willing to pay for our shares. In addition, a sale of shares by Woodbridge or the perception of the market that a sale may occur may adversely affect the market price of our shares. For additional information, please see the “Governance – Woodbridge” section of this annual report.
Thomson Reuters Founders Share Company holds a Thomson Reuters Founders Share in our company and may be in a position to affect our governance and management.
Thomson Reuters Founders Share Company was established to safeguard the Thomson Reuters Trust Principles, including that of integrity, independence and freedom from bias in the gathering and dissemination of information and news. The Thomson Reuters Founders Share Company holds a Thomson Reuters Founders Share in our company. The interest of the Thomson Reuters Founders Share Company in safeguarding the Trust Principles may conflict with our other business objectives, impose additional costs or burdens on us or otherwise affect our management and governance. In addition, the Founders Share enables the Thomson Reuters Founders Share Company to exercise extraordinary voting power to safeguard the Trust Principles and to thwart those whose holdings of voting shares of Thomson Reuters threaten the Trust Principles. As a result, the Thomson Reuters Founders Share Company may prevent a change of control (including by way of a take-over bid or similar transaction) of our company in the future. We have agreed not to effect a sale (or similar transactions) of Reuters to an unrelated third-party or to effect or permit material acquisitions by, or material dispositions from, Reuters unless we have received Thomson Reuters Founders Share Company’s prior written consent. The effect of the rights of the Thomson Reuters Founders Share Company may be to limit the price that investors are willing to pay for our shares. For additional information, please see the “Additional Information – Material Contracts” section of this annual report.
Page 32 |
Thomson Reuters Annual Report 2025 |

This management’s discussion and analysis is designed to provide you with a narrative explanation through the eyes of our management of how we performed in the last two years, as well as information about our financial condition and future prospects. As this management’s discussion and analysis is intended to supplement and complement our financial statements, we recommend that you read this in conjunction with our 2025 and 2024 annual consolidated financial statements. This management's discussion and analysis contains forward-looking statements, which are subject to risks and uncertainties that could cause our actual results to differ materially from the forward-looking statements. Forward-looking statements include, but are not limited to, our 2026 outlook and our expectations related to general economic conditions and market trends and their anticipated effects on our business segments. For additional information related to forward-looking statements, material assumptions and material risks associated with them, please see the “Outlook” and “Additional Information - Cautionary Note Concerning Factors That May Affect Future Results” sections of this management’s discussion and analysis. This management’s discussion and analysis is dated as of March 4, 2026, unless otherwise indicated.
We have organized our management’s discussion and analysis in the following key sections:
Unless otherwise indicated or the context otherwise requires, references in this discussion to “we,” “our,” “us”, the “Company” and “Thomson Reuters” are to Thomson Reuters Corporation and our subsidiaries.
Basis of Presentation
We prepare our consolidated financial statements in U.S. dollars and in accordance with International Financial Reporting Standards (IFRS), as issued by the International Accounting Standards Board (IASB).
Other than EPS, we report our results in millions of U.S. dollars, but we compute percentage changes and margins using whole dollars to be more precise. As a result, percentages and margins calculated from reported amounts may differ from those presented, and growth components may not total due to rounding.
In the fourth quarter of 2025, we changed the names of our Tax & Accounting Professionals segment to Tax, Audit & Accounting Professionals and our Reuters News segment to Reuters to reflect the broader scope of the activities in each of the respective segments. These name changes did not change the segment's composition or the measurement of the segment's results as previously or currently reported.
Use of Non-IFRS Financial Measures
In this management’s discussion and analysis, we discuss our results on an IFRS and non-IFRS basis. We use non-IFRS financial measures, which include ratios that incorporate one or more non-IFRS financial measures, as supplemental indicators of our operating performance and financial position as well as for internal planning purposes, our management incentive programs and our business outlook. We believe non-IFRS financial measures provide additional insight into our performance. Non-IFRS measures do not have standardized meanings prescribed by IFRS and therefore are unlikely to be comparable to the calculation of similar measures used by other companies, and should not be viewed as alternatives to measures of financial performance calculated in accordance with IFRS.
Page 33 |
Thomson Reuters Annual Report 2025 |
See Appendix A of this management’s discussion and analysis for a description of our non-IFRS financial measures, including an explanation of why we believe they are useful measures of our performance. Refer to Appendices B and D for reconciliations of our non-IFRS financial measures to the most directly comparable IFRS measures.
Our Company
Thomson Reuters (TSX/Nasdaq: TRI) powers business-critical professions with AI they can trust in the moments that matter. We unite unparalleled expertise, proprietary content, and seamless workflows to help our customers move with speed, think with clarity, and lead with confidence. Across our products, we combine highly specialized software and insights to empower professionals with the data, intelligence, and solutions needed to make informed decisions, and to help institutions in their pursuit of justice, truth and transparency. Reuters, part of Thomson Reuters, is a world leading provider of trusted journalism and news. For more information, visit thomsonreuters.com.
We are organized as five reportable segments, reflecting how our products and services are managed and offered to target customers as described below.
|
Legal Professionals Serves law firms and governments with research and workflow products powered by AI-enabled technology, focusing on intuitive legal research and integrated legal workflow solutions that combine content, tools and analytics.
|
2025 Revenues
|
|
Corporates Serves corporations, ranging from small businesses to multinational organizations, including the seven largest global accounting firms, with our full suite of content-driven products, powered by AI-enabled technology and integrated compliance workflow solutions to help them achieve their business outcomes.
|
|
|
Tax, Audit & Accounting Professionals Serves tax, audit and accounting firms (other than the seven largest, which are served by our Corporates segment) with research and workflow products powered by AI-enabled technology.
|
|
|
Reuters Supplies business, financial and global news and data to the world’s media organizations, professionals and news consumers through Reuters News Agency, Reuters.com, Reuters Events, Thomson Reuters products and to financial firms exclusively via LSEG products.
|
|
|
Global Print Provides legal and tax information primarily in print format to customers around the world and provides commercial printing services to a wide range of book publishers. |
We refer to our Legal Professionals, Corporates and Tax, Audit & Accounting Professionals segments, on a combined basis, as our “Big 3” segments.
Our businesses are supported by a corporate center that manages our commercial and technology operations, including those around our sales capabilities, digital customer experience, and product and content development, as well as our global facilities. Costs relating to these activities are allocated to our business segments. We also report “Corporate costs”, which includes expenses for certain centrally managed functions such as finance, legal, human resources and the executive office. These costs are not allocated to the segments and are included in consolidated adjusted EBITDA.
Page 34 |
Thomson Reuters Annual Report 2025 |
Our Business Model and Key Operating Characteristics
We derive a significant portion of our revenues from selling information and software solutions, mostly on a recurring subscription basis. Our professional-grade solutions are built on comprehensive proprietary content and deep domain expertise with software, embedded AI capabilities and automation tools. We believe our workflow solutions make our customers more productive by streamlining how they operate, enabling them to focus on higher value activities. Many of our customers use our solutions deeply integrated into their workflows, which has led to strong customer retention. We believe that our customers trust us because of our decades serving high-stakes workflows, where accuracy and reliability are non-negotiable, our enterprise-grade security and governance built for regulated environments, and our deep understanding of their businesses and industries. They rely on our services for navigating a rapidly changing and increasingly complex digital and global landscape. Over the years, our business model has proven to be capital efficient and cash flow generative, and it has enabled us to maintain leading and scalable positions in our chosen market segments.
Some of our key business and operating characteristics are:
Attractive Industry |
Balanced and Diversified Leadership |
Attractive Business Model |
Strong Competitive Positioning |
Disciplined Financial Policies |
• Currently our “Big 3” segments operate in an estimated $31 billion market expected to grow between 8% and 11% over the next 5 years • Legal, Tax & Risk markets are prime for content-driven innovation |
• A leader in our "Big 3" and Reuters segments • Resilient businesses, historically stable, through periods of macroeconomic uncertainty • Approximately 450,000 customers; largest customer is approximately 5% of revenues* |
• 81% of revenues were recurring in 2025 • Fixed cost model supports operating leverage as we grow • Strong and consistent cash generation capabilities |
• Proprietary content plus data and human expertise combined with AI and ML are key differentiators • Products deeply embedded in customers’ daily workflows • 92% retention rate in 2025 |
• Focused and incentivized on organic revenue growth and free cash flow growth • Balance investing in business and returning capital to shareholders • Committed to maintaining investment grade rating with stable capital structure • Significant potential capital capacity affords optionality |
* The news agreement with the Data & Analytics business of LSEG.
|
|
Revenues by type Recurring revenues primarily consist of fees to access products or services over time, such as Westlaw, Practical Law, CoCounsel and many of our tax compliance products. Our products are generally provided under subscription arrangements that have terms ranging from one to five years, which most customers renew at the end of each term. Because most of our revenues are recurring, we believe that our revenue patterns are generally more stable compared to other businesses that primarily sell products in discrete or one-off arrangements. However, as we generally recognize recurring revenues ratably over the contract term, there is a lag in realizing the impact of current sales or cancellations in our reported revenues. As a result, our revenues are typically slower to decline when economic conditions worsen, but slower to return to growth when economic activity improves, compared to other businesses that are not subscription-based. Transactions revenues include volume-based fees, such as fees related to tax filings and certain audit documentation services. We also charge fees for software licenses and professional fees for service and consulting arrangements. Transactions revenues are recognized primarily at a point in time and, based on their type, can fluctuate significantly from period to period. Our transactional revenue streams include our Confirmation, SafeSend and SurePrep products. |
Thomson Reuters Annual Report 2025 |
Page 35 |
|
|
Global Print revenues largely consist of fees for content that is delivered primarily in traditional paper format. We also earn fees from printing materials for third-party publishers. We expect that Global Print revenues will continue to decline each year, as customers continue to migrate to online products. Print revenues are recognized at the point of shipment or, if sold under a subscription arrangement, ratably over the contract term. |
|
|
|
|
Revenues by geography In 2025, 72% of our revenues were U.S.-based. We also operate regional teams outside of the U.S., including in emerging markets, where we serve regional customers by either modifying existing products and services for their needs or developing specific products for the local market. Changes in foreign currency exchange rates relative to our business outside the U.S. may cause variation in our revenue performance from period to period. In 2025, however, changes in foreign exchange rates had no impact on our revenue growth compared to the prior year. |
|
|
|
Operating Expenses Most of our expenses are fixed in the short-to-medium term. As a result, when our revenues increase, we become more profitable and our adjusted EBITDA margin increases, reflecting higher operating leverage. Likewise, when our revenues decline, we become less profitable and our adjusted EBITDA margin decreases. However, the full impact of incremental revenues is not always reflected in our profitability as we reinvest in our business. In 2025, staff costs, which are largely comprised of salaries, performance bonuses, commissions, benefits and share-based compensation, comprised 58% of our total expenses. Of our 2025 expenses, 61% were denominated in U.S. dollars with the balance denominated in currencies other than the U.S. dollar. In 2025, changes in foreign exchange rates did not have a significant impact on our expenses compared to the prior year. |
Financial Highlights and Accomplishments
2025 marked another year of solid revenue momentum driven by strong growth in recurring and transactions revenues. Revenues increased 3% in total and in constant currency and 7% on an organic basis, compared to the prior year. Revenues for our “Big 3” segments increased 4% in total and in constant currency, and 9% on an organic basis. Our revenue performance met the targets set out in our full-year 2025 outlook, which was last updated in August and reaffirmed in November 2025.
Operating profit increased 1%, primarily driven by the net impact of higher revenues and operating expenses, partly offset by higher amortization of software. Adjusted EBITDA, which excludes amortization of software, as well as other adjustments, increased 6% compared to the prior year. Our total company adjusted EBITDA margin was 39.2% and the "Big 3" segments adjusted EBITDA margin was 43.6%, compared to 38.2% and 42.1% in the prior year, respectively. The increases in adjusted EBITDA margin were driven by higher operating leverage. Our total company and "Big 3" segments adjusted EBITDA margins both met the targets within our updated 2025 outlook.
Our capital capacity and liquidity remain a key asset to support further acquisitions and returns to shareholders. In 2025, we generated net cash from operating activities of over $2.6 billion and achieved our updated 2025 outlook with over $1.9 billion of free cash flow. We spent $0.8 billion on acquisitions, completed a $1.0 billion share repurchase program, returned $1.0 billion in dividends to common shareholders, and repaid our C$1.4 billion (U.S. $999 million) 2.239% notes upon maturity.
Page 36 |
Thomson Reuters Annual Report 2025 |
In February 2026, we announced:
See "Subsequent Events" section of this management's discussion and analysis for further details of the above transactions.
Actual Performance vs. 2025 Updated Outlook
The table below compares our actual performance (before currency) to our updated full-year 2025 outlook. We met nearly all the metrics within our updated 2025 outlook, except for net interest expense, which was higher than our forecast primarily due to the pace of our share repurchase program that reduced cash balances faster than forecasted and declines in interest rates that led to lower interest income. Our updated 2025 outlook included non-IFRS financial measures, assumed constant currency rates relative to 2024, and included the impact of closed acquisitions and dispositions.
Total Thomson Reuters |
|
2025 Updated Outlook |
|
2025 Actual Performance (Before currency)(1) |
|
Revenue growth Organic revenue growth(2) |
|
3.0 - 3.5%(3) 7.0 - 7.5% |
|
3.0%(3) 7.0% |
ü ü |
Adjusted EBITDA margin(2) |
|
~39% |
|
39.1% |
ü |
Corporate costs |
|
$120 - $130 million |
|
$117 million |
ü |
Free cash flow(2) |
|
~$1.9 billion |
|
$1.95 billion |
ü |
Accrued capital expenditures as a percentage of revenues(2) |
|
~8% |
|
8.2% |
ü |
Depreciation and amortization of software Depreciation and amortization of internally developed software Amortization of acquired software |
|
$825 - $835 million $625- $635 million ~$200 million |
|
$827 million $626 million $201 million |
ü ü ü |
Net interest expense |
|
~$130 million |
|
$143 million |
× |
Effective tax rate on adjusted earnings(2) |
|
~19% |
|
18.5% |
ü |
“Big 3” Segments(2) |
|
2025 Updated Outlook |
|
2025 Actual Performance (Before currency)(1) |
|
Revenue growth Organic revenue growth |
|
~4%(3) ~9% |
|
3.9%(3) 9.0% |
ü ü |
Adjusted EBITDA margin |
|
~43% |
|
43.5% |
ü |
Legend |
|
|
|
|
|
ü- Achieved or exceeded updated outlook. |
|
|
|
|
|
× - Did not meet updated outlook. |
|
|
|
|
|
2026 Outlook
On February 5, 2026, we announced our 2026 outlook, which targets both total and organic revenue growth between 7.5% and 8.0%, including approximately 9.5% for the "Big 3" segments, and total company adjusted EBITDA margin expansion of approximately 100bp from the 39.2% reported in 2025. Refer to the “Outlook” section of this management’s discussion and analysis for additional information.
Thomson Reuters Annual Report 2025 |
Page 37 |
Acquisitions and Dispositions
Acquisitions. Acquired businesses can strengthen our offerings and enable us to extend our platform with new capabilities that we believe will provide opportunities to expand our positions, better serve our customers and supplement our organic revenue growth. Generally, the businesses that we acquire initially have lower margins than our existing businesses, largely reflecting their stage of development and the costs of integration. In 2025, we spent $843 million on acquisitions in aggregate. Acquisitions during the year included:
In 2024, we spent $1,006 million on acquisitions in aggregate, including $384 million to acquire the remaining portion of Pagero from minority shareholders. Acquisitions during the year included:
In addition, Thomson Reuters Ventures was launched in 2021 with the authority to invest up to $100 million to support companies that are building innovations to allow professionals to operate more productively and with greater insights. In February 2025, we announced that we committed $150 million to a second fund. We have invested $111 million since inception under both funds.
We expect that acquisitions and our Thomson Reuters Ventures Fund activities will continue to play an important role in our strategy, and we may make tactical acquisitions from time to time that we believe will strengthen our positions in key growth segments.
Dispositions. To ensure we are investing in parts of our business that offer the greatest opportunities to achieve growth and returns, we may sell businesses or investments from time to time. In 2025, we sold our remaining minority equity interest in the Elite business. In 2024, we sold our FindLaw business, an online legal directory and provider of website creation and hosting services, law firm marketing solutions, and peer rating services. We also sold certain other non-core businesses and investments.
In 2024, we also sold all of our remaining 16.0 million shares of LSEG that we indirectly owned through our direct investment in York Parent Limited and its subsidiaries (YPL) for $1,854 million of gross proceeds, which included $24 million received from the settlement of foreign exchange contracts.
Page 38 |
Thomson Reuters Annual Report 2025 |
The section below contains non-IFRS measures where indicated. Refer to Appendices A and B of this management’s discussion and analysis for additional information and reconciliations of our non-IFRS financial measures to the most directly comparable IFRS financial measures.
Consolidated Results
|
|
Year ended December 31, |
|
||||||
|
|
|
|
|
|
|
|
|
|
|
|
|
|
|
|
Change |
|
||
|
|
|
|
|
|
|
|||
|
|
|
|
|
|
|
|
|
|
(millions of U.S. dollars, except per share amounts and |
|
2025 |
|
2024 |
|
Total |
|
Constant |
|
|
|
|
|
|
|
|
|
|
|
IFRS Financial Measures |
|
|
|
|
|
|
|
|
|
Revenues |
|
7,476 |
|
7,258 |
|
3% |
|
|
|
Operating profit |
|
2,132 |
|
2,109 |
|
1% |
|
|
|
Diluted EPS |
|
$3.33 |
|
$4.89 |
|
(32%) |
|
|
|
Non-IFRS Financial Measures |
|
|
|
|
|
|
|
|
|
Revenue growth in constant currency |
|
|
|
|
|
|
|
3% |
|
Organic revenue growth |
|
|
|
|
|
|
|
7% |
|
Adjusted EBITDA |
|
2,936 |
|
2,779 |
|
6% |
|
5% |
|
Adjusted EBITDA margin |
|
39.2% |
|
38.2% |
|
100bp |
|
80bp |
|
Adjusted EBITDA less accrued capital expenditures |
|
2,320 |
|
2,170 |
|
7% |
|
|
|
Adjusted EBITDA less accrued capital expenditures margin |
|
31.0% |
|
29.9% |
|
110bp |
|
|
|
Adjusted EPS |
|
$3.92 |
|
$3.77 |
|
4% |
|
4% |
|
“Big 3” Segments |
|
|
|
|
|
|
|
|
|
Revenues |
|
6,157 |
|
5,931 |
|
4% |
|
4% |
|
Organic revenue growth |
|
|
|
|
|
|
|
9% |
|
Adjusted EBITDA |
|
2,695 |
|
2,500 |
|
8% |
|
7% |
|
Adjusted EBITDA margin |
|
43.6% |
|
42.1% |
|
150bp |
|
130bp |
|
Revenues
|
Year ended December 31, |
|
||||||
|
|
|
Change |
|
||||
(millions of U.S. dollars) |
2025 |
2024 |
Total |
|
Constant |
|
Organic |
|
Recurring revenues |
6,084 |
5,882 |
3% |
|
3% |
|
9% |
|
Transactions revenues |
902 |
857 |
5% |
|
5% |
|
4% |
|
Global Print revenues |
490 |
519 |
(6%) |
|
(5%) |
|
(5%) |
|
Revenues |
7,476 |
7,258 |
3% |
|
3% |
|
7% |
|
Revenues increased 3% on a total and constant currency basis, reflecting 3% growth in recurring revenues (81% of total revenues) and 5% growth in transactions revenues, partly offset by a decline in Global Print. Total company revenue growth was negatively impacted by 4% from net acquisitions and disposals. Foreign currency had no impact on revenue growth. On an organic basis, revenues increased 7%, reflecting 9% growth in recurring revenues, 4% growth in transactions revenues and a 5% decline in Global Print.
Revenues from the “Big 3” segments (82% of total revenues) increased 4% on a total and constant currency basis. On an organic basis, revenues increased 9%, driven by 9% growth in both recurring and transactions revenues.
Operating profit, adjusted EBITDA and adjusted EBITDA less accrued capital expenditures
Operating profit increased 1% primarily driven by the net impact of higher revenues and operating expenses, partly offset by higher amortization of software.
Adjusted EBITDA, which excludes amortization of software, as well as other adjustments, increased 6%, which reflected an 8% increase in the “Big 3” segments, partly offset by an 11% decline in Reuters and a 2% decline in Global Print. The related margin increased to 39.2% from 38.2% in the prior year, primarily due to higher operating leverage. Foreign currency contributed 20bp to the year-over-year change in adjusted EBITDA margin.
Adjusted EBITDA less accrued capital expenditures and the related margin increased due to higher adjusted EBITDA, which was partly offset by slightly higher accrued capital expenditures.
Thomson Reuters Annual Report 2025 |
Page 39 |
Operating expenses
|
|
Year ended December 31, |
|
||||||
|
|
|
|
|
|
|
|
||
|
|
|
|
|
|
Change |
|
||
|
|
|
|
|
|
|
|||
|
|
|
|
|
|
|
|||
(millions of U.S. dollars) |
|
2025 |
|
2024 |
|
Total |
|
Constant Currency |
|
|
|
|
|
|
|
|
|
|
|
Operating expenses |
|
4,578 |
|
4,471 |
|
2% |
|
2% |
|
Remove fair value adjustments(1) |
|
(18) |
|
17 |
|
|
|
|
|
Operating expenses excluding fair value adjustments |
|
4,560 |
|
4,488 |
|
2% |
|
2% |
|
Operating expenses, excluding fair value adjustments, increased in total and on a constant currency basis, primarily due to higher compensation-related and technology costs in our business, partially offset by lower costs due to the impact of net disposals, mainly related to FindLaw.
Depreciation and amortization
|
|
Year ended December 31, |
|
||||
(millions of U.S. dollars) |
|
2025 |
|
2024 |
|
Change |
|
Depreciation |
|
111 |
|
113 |
|
(2%) |
|
Amortization of software |
|
|
|
|
|
|
|
Internally developed |
|
515 |
|
471 |
|
9% |
|
Acquisition related |
|
206 |
|
147 |
|
40% |
|
Total amortization of software |
|
721 |
|
618 |
|
17% |
|
Amortization of other identifiable intangible assets |
|
98 |
|
91 |
|
7% |
|
Other operating gains, net
|
|
Year ended December 31, |
|
||
(millions of U.S. dollars) |
|
2025 |
|
2024 |
|
Other operating gains, net |
|
164 |
|
144 |
|
In 2025, other operating gains, net, primarily reflected a gain of $161 million on the sale of our remaining interest in the Elite business, an equity method investment.
In 2024, other operating gains, net, reflected $196 million of gains from the sales of FindLaw and certain other non-core businesses, partly offset by an impairment of an equity method investment due to a decline in the value of its commercial real estate holding, acquisition-related deal costs, costs related to a legal provision, and other items.
Net interest expense
|
|
Year ended December 31, |
|
||||
(millions of U.S. dollars) |
|
2025 |
|
2024 |
|
Change |
|
Net interest expense |
|
143 |
|
125 |
|
14% |
|
Net interest expense increased primarily due to lower interest income resulting from lower cash balances due to our share repurchases, maturity of debt, acquisitions and lower interest rates. These items more than offset the favorable impact from the repayment of various borrowings with cash on hand. We repaid our C$1.4 billion (U.S. $999 million) 2.239% notes in May 2025 and our $242 million, 3.85% notes in 2024.
Page 40 |
Thomson Reuters Annual Report 2025 |
Other finance (costs) income
|
|
Year ended December 31, |
|
||
(millions of U.S. dollars) |
|
2025 |
|
2024 |
|
Other finance (costs) income |
|
(55) |
|
45 |
|
Other finance (costs) income primarily included net foreign exchange losses in 2025 and net foreign exchange gains in 2024 on intercompany funding arrangements. In both years, the net foreign exchange losses or gains primarily related to the weakening or strengthening of the U.S. dollar on Canadian dollar denominated arrangements, respectively. Refer to the “Risk Management” section of this management’s discussion and analysis for a discussion on how we manage and mitigate our foreign currency risks.
Share of post-tax (losses) earnings in equity method investments
|
|
Year ended December 31, |
|
||
(millions of U.S. dollars) |
|
2025 |
|
2024 |
|
YPL |
|
- |
|
68 |
|
Other equity method investments |
|
(28) |
|
(28) |
|
Share of post-tax (losses) earnings in equity method investments |
|
(28) |
|
40 |
|
In 2025, share of post-tax losses in equity method investments primarily related to a commercial real estate holding. In 2024, share of post-tax earnings in equity method investments reflected our investment in YPL, partially offset by losses related to a commercial real estate holding.
In 2024, we sold our remaining 16.0 million LSEG shares that we had indirectly owned through YPL. We accounted for the investment in LSEG shares held by YPL at fair value, based on the share price of LSEG. As the investment in LSEG was denominated in British pounds sterling, we entered into a series of foreign exchange contracts to mitigate currency risk on our investment. Our share of post-tax earnings (losses) in our YPL investment was comprised of the following items:
|
|
Year ended December 31, |
|
||
(millions of U.S. dollars) |
|
|
|
2024 |
|
Decrease in LSEG share price |
|
|
|
(86) |
|
Foreign exchange losses on LSEG shares |
|
|
|
(3) |
|
Dividend income |
|
|
|
6 |
|
Gain from call options |
|
|
|
22 |
|
Historical excluded equity adjustment(1) |
|
|
|
129 |
|
YPL – Share of post-tax earnings in equity method investments |
|
|
|
68 |
|
Tax expense (benefit)
|
|
Year ended December 31, |
|
||
(millions of U.S. dollars) |
|
2025 |
|
2024 |
|
Tax expense (benefit) |
|
423 |
|
(123) |
|
In 2025, our effective income tax rate on earnings from continuing operations was 22.2%. Tax expense was $423 million and included $72 million of tax charges related to the transfer of certain technology assets between our company's wholly owned subsidiaries to consolidate the ownership and management of these assets. We also recorded $40 million of tax expense related to the gain on sale of our minority stake in Elite.
In 2024, the net tax benefit of $123 million was due to a $468 million benefit from the recognition of a deferred tax asset relating to tax legislation enacted in Canada. The legislation reduced our ability to deduct interest expense against our Canadian taxable income, thereby increasing Canadian taxable profits such that we now expect to utilize tax loss carryforwards and other tax attributes, which we had not previously recognized as a deferred tax asset. Additionally in 2024, the tax benefit was partly offset by $54 million of tax expense related to the gain on sale of the FindLaw business.
Thomson Reuters Annual Report 2025 |
Page 41 |
In January 2024, we began recording tax expense associated with the “Pillar Two model rules” as published by the Organization for Economic Cooperation and Development and enacted by key jurisdictions in which we operate. These rules are designed to ensure large multinational enterprises within the scope of the rules pay a minimum level of tax in each jurisdiction where they operate. In general, the “Pillar Two model rules” apply a system of top-up taxes to bring the enterprise’s effective tax rate in each jurisdiction to a minimum of 15%. The application of the "Pillar Two model rules" did not have a significant impact on our tax expense (benefit) for the years ended December 31, 2025 and 2024.
Additionally, the tax benefit or expense in each year reflected the mix of taxing jurisdictions in which pre-tax profits and losses were recognized. The comparability of our tax expense (benefit) was impacted by various transactions and accounting adjustments during each year. The following table sets forth certain components within income tax expense (benefit) that impact comparability from year to year:
|
|
Year ended December 31, |
|
||
(millions of U.S. dollars) |
|
2025 |
|
2024 |
|
Expense (benefit) |
|
|
|
|
|
Tax items impacting comparability: |
|
|
|
|
|
Transfer of certain technology assets(1) |
|
63 |
|
- |
|
Recognition of deferred tax asset(2) |
|
- |
|
(468) |
|
Discrete changes to uncertain tax positions(3) |
|
- |
|
(15) |
|
Corporate tax laws and rates(4) |
|
15 |
|
7 |
|
Deferred tax adjustments(5) |
|
(21) |
|
(2) |
|
Subtotal |
|
57 |
|
(478) |
|
Tax related to: |
|
|
|
|
|
Amortization of acquired software |
|
(46) |
|
(33) |
|
Amortization of other identifiable intangible assets |
|
(23) |
|
(22) |
|
Other operating gains, net |
|
43 |
|
56 |
|
Other finance (costs) income |
|
(2) |
|
(19) |
|
Share of post-tax (losses) earnings in equity method investments |
|
(2) |
|
7 |
|
Other items |
|
(5) |
|
2 |
|
Subtotal |
|
(35) |
|
(9) |
|
Total |
|
22 |
|
(487) |
|
The items described above impact the comparability of our tax expense for each year, therefore, we remove them from our calculation of adjusted earnings, along with the pre-tax items to which they relate. The computation of our adjusted tax expense is set forth below:
|
|
Year ended December 31, |
|
||
(millions of U.S. dollars) |
|
2025 |
|
2024 |
|
Tax expense (benefit) |
|
423 |
|
(123) |
|
Remove: Items from above impacting comparability |
|
(22) |
|
487 |
|
Total tax expense on adjusted earnings |
|
401 |
|
364 |
|
Our 2025 effective tax rate on adjusted earnings was 18.5% (2024 - 17.6%). On an adjusted earnings basis, our effective income tax rates in both years were lower than the Canadian corporate income tax rate of 26.5%. The difference is primarily attributable to lower tax rates and differing tax rules applicable to certain of our operating and financing subsidiaries outside of Canada. As a global company, our income taxes depend on the laws of numerous countries and the provisions of multiple income tax conventions between various countries in which we operate.
Page 42 |
Thomson Reuters Annual Report 2025 |
Because of the requirements of income tax accounting under IFRS, income tax expense can differ significantly from taxes paid in any reporting period. We paid income taxes from net earnings on our worldwide business as follows:
|
|
Year ended December 31, |
|
||
(millions of U.S. dollars) |
|
2025 |
|
2024 |
|
Operating activities – continuing operations |
|
275 |
|
234 |
|
Investing activities |
|
62 |
|
317 |
|
Total income taxes paid |
|
337 |
|
551 |
|
Our effective tax rate and our cash tax cost in the future will depend on the laws of numerous countries and the provisions of multiple income tax conventions between various countries in which we operate. Our effective tax rate will be dependent upon tax laws and conventions remaining unchanged or favorable to our company, as well as the geographic mix of our profits. See the “Liquidity and Capital Resources – Contingencies” section of this management’s discussion and analysis for further discussion of income tax liabilities.
On July 4, 2025, the U.S. enacted tax reform legislation as part of the One Big Beautiful Bill Act (OBBBA). The OBBBA leaves the U.S. corporate tax rate unchanged at 21%. In addition, the OBBBA extends or revises key provisions of the Tax Cuts and Jobs Act enacted in 2017, which were set to expire or change at the end of 2025. The tax reforms of the OBBBA did not have a material impact on our consolidated financial statements.
Results of Discontinued Operations
Earnings from discontinued operations, net of tax, included the following:
|
|
Year ended December 31, |
|
||
(millions of U.S. dollars) |
|
2025 |
|
2024 |
|
Earnings from discontinued operations, net of tax |
|
19 |
|
15 |
|
In both years, earnings from discontinued operations, net of tax, were primarily comprised of earnings arising on a receivable balance from LSEG relating to a tax indemnity. The earnings were due to changes in foreign exchange and interest rates. The 2024 period also included benefits from the release of reserves that are no longer required due to settlements of tax disputes.
Net earnings and diluted EPS
|
|
Year ended December 31, |
|
||||||
|
|
|
|
|
|
|
|||
|
|
|
|
|
|
Change |
|
||
|
|
|
|
|
|
|
|||
|
|
|
|
|
|
|
|
|
|
(millions of U.S. dollars, except per share amounts) |
|
2025 |
|
2024 |
|
Total |
|
Constant Currency |
|
|
|
|
|
|
|
|
|
|
|
IFRS Financial Measures |
|
|
|
|
|
|
|
|
|
Net earnings |
|
1,502 |
|
2,207 |
|
(32%) |
|
|
|
Diluted EPS |
|
$3.33 |
|
$4.89 |
|
(32%) |
|
|
|
Non- IFRS Financial Measures |
|
|
|
|
|
|
|
|
|
Adjusted earnings |
|
1,762 |
|
1,701 |
|
4% |
|
|
|
Adjusted EPS |
|
$3.92 |
|
$3.77 |
|
4% |
|
4% |
|
Net earnings and diluted EPS decreased primarily because the prior year included a $468 million or $1.04 per share non-cash tax benefit related to tax legislation enacted in Canada.
Adjusted earnings and adjusted EPS, which excludes the non-cash tax benefit, as well as other adjustments, increased primarily due to higher adjusted EBITDA, partly offset by higher amortization of internally developed software, income tax expense and interest expense.
Thomson Reuters Annual Report 2025 |
Page 43 |
Segment Results
The following is a discussion of our five reportable segments and our Corporate costs. We assess revenue growth for each segment, as well as the businesses within each segment on a total, constant currency and an organic basis. See Appendix A of this management’s discussion and analysis for additional information on our non-IFRS financial measures.
Legal Professionals
|
|
Year ended December 31, |
|
||||||||
|
|
|
|
|
|
|
|
|
|
|
|
|
|
|
|
|
|
Change |
|
||||
|
|
|
|
|
|
|
|
||||
(millions of U.S. dollars, except margins) |
|
2025 |
|
2024 |
|
Total |
|
Constant |
|
Organic |
|
|
|
|
|
|
|
|
|
|
|
|
|
|
|
|
|
|
|
|
|
|
|
|
|
Recurring revenues |
|
2,789 |
|
2,828 |
|
(1%) |
|
(1%) |
|
9% |
|
Transactions revenues |
|
79 |
|
94 |
|
(16%) |
|
(17%) |
|
4% |
|
Revenues |
|
2,868 |
|
2,922 |
|
(2%) |
|
(2%) |
|
8% |
|
Segment adjusted EBITDA |
|
1,356 |
|
1,302 |
|
4% |
|
3% |
|
|
|
Segment adjusted EBITDA margin |
|
47.3% |
|
44.6% |
|
270bp |
|
250bp |
|
|
|
|
|
|
|
|
|
|
|
|
|
|
|
Revenues on a total and constant currency basis decreased due to the disposal of FindLaw in December 2024, which negatively impacted recurring and transactions revenue growth. On an organic basis, revenues increased 8% driven by 9% growth in recurring revenues (97% of the Legal Professionals segment revenues) led by Westlaw, CoCounsel, and Practical Law. Transactions revenues increased 4% organically.
Segment adjusted EBITDA increased 4% and the related margin increased 270bp to 47.3% reflecting higher operating leverage as well as the disposal of the lower margin FindLaw business in the prior year. Foreign currency benefited the year-over-year change in segment adjusted EBITDA margin by 20bp.
Corporates
|
|
Year ended December 31, |
|
||||||||
|
|
|
|
|
|
|
|
|
|
|
|
|
|
|
|
|
|
Change |
|
||||
|
|
|
|
|
|
|
|||||
(millions of U.S. dollars, except margins) |
|
2025 |
|
2024 |
|
Total |
|
Constant |
|
Organic |
|
|
|
|
|
|
|
|
|
|
|
|
|
Recurring revenues |
|
1,670 |
|
1,543 |
|
8% |
|
8% |
|
9% |
|
|
|
|
|
|
|
|
|
|
|
|
|
Transactions revenues |
|
317 |
|
301 |
|
5% |
|
5% |
|
5% |
|
|
|
|
|
|
|
|
|
|
|
|
|
Revenues |
|
1,987 |
|
1,844 |
|
8% |
|
7% |
|
9% |
|
|
|
|
|
|
|
|
|
|
|
|
|
Segment adjusted EBITDA |
|
716 |
|
671 |
|
7% |
|
6% |
|
|
|
|
|
|
|
|
|
|
|
|
|
|
|
Segment adjusted EBITDA margin |
|
36.0% |
|
36.3% |
|
(30)bp |
|
(30)bp |
|
|
|
|
|
|
|
|
|
|
|
|
|
|
|
Revenues increased on a total and constant currency basis despite a negative impact from the sale of certain non-core businesses within recurring revenues. On an organic basis, revenues increased 9% driven by 9% growth in recurring revenues (84% of the Corporates segment revenues) led by Indirect Tax, Direct Tax, Pagero, Practical Law and the segment’s international businesses. Transactions revenues increased 5% on an organic basis driven by Pagero, Indirect Tax, Confirmation, Global Trade and the segment's international businesses.
Segment adjusted EBITDA increased 7% driven by higher revenues. The related margin declined by 30bp to 36.0%. Foreign currency had no impact on the year-over-year change in segment adjusted EBITDA margin.
Tax, Audit & Accounting Professionals
|
|
Year ended December 31, |
|
||||||||
|
|
|
|
|
|
|
|
|
|
|
|
|
|
|
|
|
|
Change |
|
||||
|
|
|
|
|
|
|
|||||
(millions of U.S. dollars, except margins) |
|
2025 |
|
2024 |
|
Total |
|
Constant |
|
Organic |
|
|
|
|
|
|
|
|
|
|
|
|
|
Recurring revenues |
|
937 |
|
867 |
|
8% |
|
10% |
|
10% |
|
|
|
|
|
|
|
|
|
|
|
|
|
Transactions revenues |
|
365 |
|
298 |
|
22% |
|
23% |
|
12% |
|
|
|
|
|
|
|
|
|
|
|
|
|
Revenues |
|
1,302 |
|
1,165 |
|
12% |
|
13% |
|
11% |
|
|
|
|
|
|
|
|
|
|
|
|
|
Segment adjusted EBITDA |
|
623 |
|
527 |
|
18% |
|
19% |
|
|
|
|
|
|
|
|
|
|
|
|
|
|
|
Segment adjusted EBITDA margin |
|
47.1% |
|
45.2% |
|
190bp |
|
150bp |
|
|
|
|
|
|
|
|
|
|
|
|
|
|
|
Page 44 |
Thomson Reuters Annual Report 2025 |
Revenues increased on a total and constant currency basis, both of which included the acquisition impact of SafeSend within transactions revenues. On an organic basis, revenues increased 11% due to 10% growth in recurring revenues (72% of the Tax, Audit & Accounting Professionals segment revenues) and 12% growth in transactions revenues. Recurring organic revenue growth was driven by the segment’s Latin America business and its tax and audit products, including UltraTax and CoCounsel. Transactions organic revenue growth was driven primarily by SafeSend, UltraTax, Confirmation, SurePrep and the segment's international businesses.
Segment adjusted EBITDA increased 18% and the related margin increased 190bp to 47.1%. The increase reflected operating leverage on higher revenues. Foreign currency benefited the year-over-year change in segment adjusted EBITDA margin by 40bp.
Reuters
|
|
Year ended December 31, |
|
||||||||
|
|
|
|
|
|
|
|
|
|
|
|
|
|
|
|
|
|
Change |
|
||||
(millions of U.S. dollars, except margins) |
|
2025 |
|
2024 |
|
Total |
|
Constant |
|
Organic |
|
|
|
|
|
|
|
|
|
|
|
|
|
Recurring revenues |
|
712 |
|
668 |
|
7% |
|
6% |
|
5% |
|
Transactions revenues |
|
141 |
|
164 |
|
(14%) |
|
(15%) |
|
(16%) |
|
Revenues |
|
853 |
|
832 |
|
3% |
|
2% |
|
1% |
|
Segment adjusted EBITDA |
|
174 |
|
196 |
|
(11%) |
|
(11%) |
|
|
|
Segment adjusted EBITDA margin |
|
20.4% |
|
23.6% |
|
(320)bp |
|
(290)bp |
|
|
|
Revenues increased on a total, constant currency, and organic basis primarily due to higher recurring Professional and Agency revenues and a contractual price increase from our news agreement with the Data & Analytics business of LSEG, partly offset by lower generative AI related transactional content licensing revenue.
Reuters and the Data & Analytics business of LSEG have an agreement pursuant to which Reuters supplies news and information services to LSEG through October 1, 2048. In 2025, Reuters recorded revenues of $398 million under this agreement, which represents the current minimum annual value. However, these revenues may increase in the future as the contract requires adjustments related to changes in the consumer price index and foreign exchange rates. In 2024, Reuters recorded $384 million under this agreement.
Segment adjusted EBITDA decreased 11% and the related margin decreased 320bp to 20.4% due to lower transactions revenues and higher investments. Foreign currency had a 30bp negative impact on the year-over-year change in segment adjusted EBITDA margin.
Global Print
|
|
Year ended December 31, |
|
||||||||
|
|
|
|
|
|
|
|
|
|
|
|
|
|
|
|
|
|
Change |
|
||||
(millions of U.S. dollars, except margins) |
|
2025 |
|
2024 |
|
Total |
|
Constant |
|
Organic |
|
|
|
|
|
|
|
|
|
|
|
|
|
Revenues |
|
490 |
|
519 |
|
(6%) |
|
(5%) |
|
(5%) |
|
Segment adjusted EBITDA |
|
185 |
|
188 |
|
(2%) |
|
(2%) |
|
|
|
Segment adjusted EBITDA margin |
|
37.7% |
|
36.2% |
|
150bp |
|
120bp |
|
|
|
Revenues decreased in total, in constant currency, and on an organic basis. The revenue decline was primarily due to lower shipment volumes and the impact of the migration of customers from Global Print to Westlaw.
Segment adjusted EBITDA declined 2%, however the related margin increased 150bp to 37.7% primarily due to lower costs which more than offset the impact from lower revenues. Foreign currency benefited the year-over-year change in segment adjusted EBITDA margin by 30bp.
Corporate costs
|
|
Year ended December 31, |
|
||
|
|
|
|
|
|
(millions of U.S. dollars) |
|
2025 |
|
2024 |
|
|
|
|
|
|
|
Corporate costs |
|
118 |
|
105 |
|
Corporate costs increased primarily due to a corporate charge that is not expected to repeat.
Thomson Reuters Annual Report 2025 |
Page 45 |
Our revenues and operating profit on a consolidated basis do not tend to be significantly impacted by seasonality as we record a large portion of our revenues ratably over the contract term and our costs are generally incurred evenly throughout the year. However, at the segment level, revenues on a consecutive quarter basis can be impacted by seasonality, most notably in our Tax, Audit & Accounting Professionals business, where revenues tend to be concentrated in the first and fourth quarters.
Consolidated Results
|
|
Three months ended December 31, |
|
||||||
|
|
|
|
|
|
Change |
|
||
(millions of U.S. dollars, except per share amounts and margins) |
|
2025 |
|
2024 |
|
Total |
|
Constant |
|
|
|
|
|
|
|
|
|
|
|
IFRS Financial Measures |
|
|
|
|
|
|
|
|
|
Revenues |
|
2,009 |
|
1,909 |
|
5% |
|
|
|
Operating profit |
|
540 |
|
722 |
|
(25%) |
|
|
|
Net earnings |
|
332 |
|
587 |
|
(43%) |
|
|
|
Diluted EPS |
|
$0.74 |
|
$1.30 |
|
(43%) |
|
|
|
Net cash provided by operating activities |
|
756 |
|
564 |
|
35% |
|
|
|
Net cash used in investing activities |
|
(205) |
|
(69) |
|
211% |
|
|
|
Net cash used in financing activities |
|
(658) |
|
(252) |
|
160% |
|
|
|
Non-IFRS Financial Measures(1) |
|
|
|
|
|
|
|
|
|
Revenue growth in constant currency |
|
|
|
|
|
|
|
5% |
|
Organic revenue growth |
|
|
|
|
|
|
|
7% |
|
Adjusted EBITDA |
|
777 |
|
718 |
|
8% |
|
8% |
|
Adjusted EBITDA margin |
|
38.7% |
|
37.6% |
|
110bp |
|
140bp |
|
Adjusted EBITDA less accrued capital expenditures |
|
621 |
|
546 |
|
14% |
|
|
|
Adjusted EBITDA less accrued capital expenditures margin |
|
31.0% |
|
28.6% |
|
240bp |
|
|
|
Adjusted earnings |
|
479 |
|
454 |
|
6% |
|
|
|
Adjusted EPS |
|
$1.07 |
|
$1.01 |
|
6% |
|
7% |
|
Free cash flow |
|
581 |
|
425 |
|
38% |
|
|
|
“Big 3” Segments |
|
|
|
|
|
|
|
|
|
Revenues |
|
1,648 |
|
1,553 |
|
6% |
|
5% |
|
Organic revenue growth |
|
|
|
|
|
|
|
9% |
|
Adjusted EBITDA |
|
709 |
|
648 |
|
9% |
|
9% |
|
Adjusted EBITDA margin |
|
43.0% |
|
41.7% |
|
130bp |
|
150bp |
|
Page 46 |
Thomson Reuters Annual Report 2025 |
Revenues
Revenues increased 5% on a total and constant currency basis. In total, revenue growth reflected 6% growth in recurring revenues (84% of total revenues in the quarter), 11% growth in transactions revenues and a 6% decline in Global Print. Total company revenue growth was negatively impacted by 3% from net acquisitions and disposals. Foreign currency had a slightly positive impact on revenue growth. On an organic basis, revenues increased 7%, reflecting 9% growth in recurring revenues, 8% growth in transactions revenues and a 6% decline in Global Print.
Revenues from the “Big 3” segments (82% of total revenues) increased 6% in total and 5% in constant currency. On an organic basis, revenues increased 9%, driven by 9% growth in recurring revenues and 8% growth in transactions revenues.
Operating profit, adjusted EBITDA and adjusted EBITDA less accrued capital expenditures
Operating profit decreased 25% primarily due to other operating gains in the prior-year period substantially related to the sale of FindLaw, as well as higher amortization of software in the current period. These items more than offset the net impact of higher revenues and operating expenses.
Adjusted EBITDA, which excludes other operating gains, amortization of software, as well as other adjustments, increased 8%, which reflected a 9% increase in the “Big 3” segments and a 7% increase in Reuters, partly offset by a 2% decline in Global Print. The related margin increased to 38.7% from 37.6% in the prior-year period, primarily due to higher operating leverage. Foreign currency negatively impacted the year-over-year change in adjusted EBITDA margin by 30bp.
Adjusted EBITDA less accrued capital expenditures and the related margin increased due to higher adjusted EBITDA and lower accrued capital expenditures.
Net earnings and diluted EPS, and adjusted earnings and adjusted EPS
Net earnings and diluted EPS decreased primarily due to lower operating profit. Additionally, the prior-year period also included currency benefits reflected in other finance costs or income.
Adjusted earnings and adjusted EPS, which excludes other operating gains, other finance costs or income, as well as other adjustments, increased primarily due to higher adjusted EBITDA, partly offset by higher amortization of internally developed software and interest expense.
Net cash provided by operating activities
Net cash provided by operating activities increased as higher cash benefits from the net impact of higher revenues and operating expenses and certain component changes in working capital were partly offset by higher income tax payments.
Net cash used in investing activities
In 2025, net cash used in investing activities primarily reflected capital expenditures of $158 million, acquisition spend of $20 million and $29 million of tax payments in connection with disposals of businesses and investments.
In 2024, net cash used in investing activities primarily reflected capital expenditures of $161 million and acquisition spend of $130 million, primarily related to the purchase of Materia, and $115 million of taxes paid on the sales of LSEG shares. These cash outflows were partly offset by $297 million in proceeds from the sale of FindLaw and other non-core businesses and $40 million of cash flows from other investing activities, which included proceeds from the sale of real estate.
Net cash used in financing activities
In 2025, net cash used in financing activities primarily reflected dividend payments to our common shareholders of $256 million, share repurchases of $330 million and net payments under our commercial paper program of $49 million.
In 2024, net cash used in financing activities primarily included dividend payments to our common shareholders of $236 million.
Free cash flow
Free cash flow increased as higher net cash provided by operating activities was partly offset by lower cash flows from other investing activities, which included a cash flow benefit in the prior-year period.
Thomson Reuters Annual Report 2025 |
Page 47 |
Segment Results
|
|
Three months ended December 31, |
|
||||||||
|
|
|
|
|
|
|
|
|
|
|
|
|
|
|
|
|
|
|
|
Change |
|
||
(millions of U.S. dollars, except margins) |
|
2025 |
|
2024 |
|
Total |
|
Constant |
|
Organic(1) |
|
|
|
|
|
|
|
|
|
|
|
|
|
Revenues |
|
|
|
|
|
|
|
|
|
|
|
Legal Professionals |
|
738 |
|
729 |
|
1% |
|
1% |
|
9% |
|
Corporates |
|
496 |
|
458 |
|
8% |
|
7% |
|
9% |
|
Tax, Audit & Accounting Professionals |
|
414 |
|
366 |
|
13% |
|
13% |
|
11% |
|
“Big 3” Segments Combined(1) |
|
1,648 |
|
1,553 |
|
6% |
|
5% |
|
9% |
|
Reuters |
|
232 |
|
218 |
|
7% |
|
6% |
|
5% |
|
Global Print |
|
136 |
|
144 |
|
(6%) |
|
(6%) |
|
(6%) |
|
Eliminations/ Rounding |
|
(7) |
|
(6) |
|
|
|
|
|
|
|
Revenues |
|
2,009 |
|
1,909 |
|
5% |
|
5% |
|
7% |
|
Adjusted EBITDA(1) |
|
|
|
|
|
|
|
|
|
|
|
Legal Professionals |
|
327 |
|
299 |
|
9% |
|
9% |
|
|
|
Corporates |
|
160 |
|
153 |
|
4% |
|
4% |
|
|
|
Tax, Audit & Accounting Professionals |
|
222 |
|
196 |
|
14% |
|
13% |
|
|
|
“Big 3” Segments Combined |
|
709 |
|
648 |
|
9% |
|
9% |
|
|
|
Reuters |
|
48 |
|
45 |
|
7% |
|
12% |
|
|
|
Global Print |
|
54 |
|
55 |
|
(2%) |
|
(2%) |
|
|
|
Corporate costs |
|
(34) |
|
(30) |
|
n/a |
|
n/a |
|
|
|
Adjusted EBITDA |
|
777 |
|
718 |
|
8% |
|
8% |
|
|
|
Adjusted EBITDA margin(1) |
|
|
|
|
|
|
|
|
|
|
|
Legal Professionals |
|
44.3% |
|
41.0% |
|
330bp |
|
350bp |
|
|
|
Corporates |
|
32.2% |
|
33.5% |
|
(130)bp |
|
(70)bp |
|
|
|
Tax, Audit & Accounting Professionals |
|
53.6% |
|
53.4% |
|
20bp |
|
- |
|
|
|
“Big 3” Segments Combined |
|
43.0% |
|
41.7% |
|
130bp |
|
150bp |
|
|
|
Reuters |
|
21.0% |
|
20.8% |
|
20bp |
|
140bp |
|
|
|
Global Print |
|
39.6% |
|
38.2% |
|
140bp |
|
160bp |
|
|
|
Adjusted EBITDA margin |
|
38.7% |
|
37.6% |
|
110bp |
|
140bp |
|
|
|
Page 48 |
Thomson Reuters Annual Report 2025 |
Legal Professionals
Revenues increased on a total and constant currency basis despite a negative impact from the disposal of FindLaw in the prior-year period. On an organic basis, revenues increased 9% due to 8% growth in recurring revenues (97% of the Legal Professionals segment in the quarter) primarily driven by Westlaw, CoCounsel and Practical Law. Transactions revenues increased 28% organically.
Segment adjusted EBITDA increased 9% and the related margin increased 330bp to 44.3% reflecting higher operating leverage as well as the disposal of the lower margin FindLaw business in the prior-year period. Foreign currency negatively impacted the year-over-year change in segment adjusted EBITDA margin by 20bp.
Corporates
Revenues increased on a total and constant currency basis despite a negative impact from the sale of certain non-core businesses. On an organic basis, revenues increased 9% due to 9% growth in recurring revenues (88% of the Corporates segment in the quarter) primarily driven by Indirect Tax, Direct Tax, Westlaw, Practical Law, Pagero and the segment's international businesses. Transactions revenues increased 7% organically primarily driven by Indirect Tax, Global Trade and the segment's international businesses.
Segment adjusted EBITDA increased 4% and the related margin decreased 130bp to 32.2%. Foreign currency negatively impacted the year-over-year change in segment adjusted EBITDA margin by 60bp.
Tax, Audit & Accounting Professionals
Revenues increased on a total and constant currency basis, which included the acquisition impact of SafeSend. On an organic basis, revenues increased 11% due to 12% growth in recurring revenues (86% of the Tax, Audit & Accounting Professionals segment in the quarter) primarily driven by UltraTax, CoCounsel, and the segment's Latin America business. Transactions revenues increased 3% organically primarily driven by SafeSend and the segment's international businesses.
Segment adjusted EBITDA increased 14% and the related margin increased 20bp to 53.6%. Foreign currency benefited the year-over-year change in segment adjusted EBITDA margin by 20bp.
The Tax, Audit & Accounting Professionals segment is the company’s most seasonal business with approximately 60% of full-year revenues typically generated in the first and fourth quarters. As a result, the margin performance of this segment has been generally higher in the first and fourth quarters as costs are typically incurred in a more linear fashion throughout the year.
Reuters
Revenues increased in total and in constant currency. On an organic basis revenues increased 5%, primarily due to higher generative AI related transactional content licensing revenue in the Agency business, as well as a contractual price increase from our news agreement with the Data & Analytics business of LSEG.
Segment adjusted EBITDA increased 7% and the related margin increased 20bp to 21.0%. Foreign currency negatively impacted the year-over-year change in segment adjusted EBITDA margin by 120bp.
Global Print
Revenues decreased in total, constant currency, and on an organic basis. The revenue decline was driven by lower shipment volumes.
Segment adjusted EBITDA decreased 2%, but the related margin increased 140bp to 39.6%. The margin increase reflected lower costs, which more than offset the impact of lower revenues. Foreign currency negatively impacted the year-over-year change in segment adjusted EBITDA margin by 20bp.
Corporate costs
Corporate costs were $34 million compared to $30 million in the prior-year period.
Thomson Reuters Annual Report 2025 |
Page 49 |
Capital Strategy
We have historically maintained a disciplined capital strategy that balances growth, long-term financial leverage, credit ratings and returns to shareholders. We are focused on having the investment capacity to drive revenue growth, both organically and through acquisitions, while also maintaining our long-term financial leverage and credit ratings and continuing to provide returns to shareholders. Our principal sources of liquidity are cash and cash equivalents and cash provided by operating activities. From time to time, we also issue commercial paper, issue debt securities and borrow under our credit facility. Our principal uses of cash are for debt repayments, debt servicing costs, dividend payments, capital expenditures, share repurchases and acquisitions.
In 2025, we spent over $0.8 billion on acquisitions, primarily for SafeSend and Additive. We repaid our C$1.4 billion (U.S. $999 million) 2.239% notes upon maturity with cash on hand, and completed a $1.0 billion share repurchase program under a new NCIB that was approved by the TSX.
Our capital strategy approach has provided us with a strong capital structure and liquidity position which enables us to pursue organic and inorganic opportunities in key growth segments and drive shareholder returns. Our disciplined approach and highly recurring cash generative business model have allowed us to weather economic volatility in recent years caused by macroeconomic and geopolitical factors, while continuing to invest in our business.
We expect that the operating leverage of our business will increase our free cash flow if we increase revenues as contemplated by our outlook. We continue to target: (i) a leverage ratio of 2.5x net debt to adjusted EBITDA (ii) a payout of 50% to 60% of our expected free cash flow as dividends to our shareholders (iii) a return of at least 75% of our annual free cash flow to our shareholders in the form of dividends and share repurchases; and (iv) a return on invested capital (ROIC) that is double or more of our weighted-average cost of capital over time. In 2025, we returned $2.0 billion to shareholders in the form of dividends and share repurchases, representing over 100% of our 2025 full year free cash flow. Additionally, in February 2026, we also announced the following:
See "Subsequent Events" section of this management's discussion and analysis for further details of the above transactions.
As of December 31, 2025, we had $0.5 billion of cash and cash equivalents, and a net debt to adjusted EBITDA leverage ratio of 0.6:1, below our target leverage ratio of 2.5:1. As calculated under our credit facility covenant, our net debt to EBITDA leverage ratio as of December 31, 2025 was 0.6:1, which is also below the maximum leverage ratio allowed under the credit facility of 4.5:1. Our next scheduled debt repayment is in May 2026, when our $500 million 3.35% notes are due to mature.
We believe that our existing sources of liquidity will be sufficient to fund our expected cash requirements in the normal course of business for the next 12 months.
Certain information above in this section is forward-looking and should be read in conjunction with the section entitled “Additional Information - Cautionary Note Concerning Factors That May Affect Future Results”.
Page 50 |
Thomson Reuters Annual Report 2025 |
Cash Flow
Summary of Consolidated Statement of Cash Flow
|
|
|
|
|
|
|
|
|
|
Year ended December 31, |
|||||
|
|
|
|
|
|
|
|
|
|
|
|
|
|
|
|
(millions of U.S. dollars) |
|
2025 |
|
2024 |
|
$ Change |
|
|
|
|
|
|
|
|
|
|
|
|
|
|
|
|
|
Net cash provided by operating activities |
|
2,651 |
|
2,457 |
|
194 |
|
Net cash (used in) provided by investing activities |
|
(1,284) |
|
680 |
|
(1,964) |
|
Net cash used in financing activities |
|
(2,828) |
|
(2,459) |
|
(369) |
|
Translation adjustments |
|
4 |
|
(8) |
|
12 |
|
(Decrease) increase in cash and cash equivalents |
|
(1,457) |
|
670 |
|
(2,127) |
|
Cash and cash equivalents at beginning of period |
|
1,968 |
|
1,298 |
|
670 |
|
Cash and cash equivalents at end of period |
|
511 |
|
1,968 |
|
(1,457) |
|
Non-IFRS Financial Measure(1): |
|
|
|
|
|
|
|
Free cash flow |
|
1,950 |
|
1,828 |
|
122 |
|
|
|
|
|
|
|
|
|
Operating activities. Net cash provided by operating activities increased by $194 million as higher cash benefits from the net impact of higher revenues and operating expenses and certain component changes in working capital were partly offset by higher income tax payments.
Investing activities. In 2025, net cash used in investing activities of $1,284 million primarily included $634 million of capital expenditures and $843 million of acquisition spend, which included SafeSend in January 2025 and Additive in September 2025. These outflows were partly offset by $254 million in proceeds related to disposals of businesses and investments, predominately from the sale of our remaining minority equity interest in the Elite business.
In 2024, net cash provided by investing activities of $680 million included $1,854 million of gross proceeds from the sale of 16.0 million LSEG shares, including $24 million related to the settlement of foreign exchange contracts, $326 million of proceeds from the sale of businesses and investments primarily related to our FindLaw business, and $46 million of cash flows from other investing activities, which reflected proceeds from the sale of certain real estate. These inflows more than offset $317 million of tax payments, primarily associated with the LSEG share sales, capital expenditures of $607 million and acquisition spend of $622 million, primarily related to the purchase of Pagero, Materia and World Business Media (The Insurer). We spent an additional $384 million to acquire the remaining portion of Pagero from minority shareholders, which is reflected in financing activities below.
Financing activities. In 2025, net cash used in financing activities of $2,828 million included $1,000 million of share repurchases, $1,035 million of dividend payments to our common shareholders and the repayment of our C$1.4 billion (U.S. $999 million) 2.239% notes upon maturity. These outflows were partly offset by $290 million of net borrowings under our commercial paper program.
In 2024, net cash used in financing activities of $2,459 million included debt repayments of $290 million, which included $48 million for the repayment of Pagero’s outstanding debt, $139 million of net payments under our commercial paper program, $944 million of dividend payments to our common shareholders, $639 million of share repurchases and $384 million for the purchase of shares from Pagero’s minority shareholders.
Refer to the “Commercial paper program”, “Long-term debt”, “Dividends” and “Share repurchases– NCIB” subsections below for additional information.
Cash and cash equivalents. Cash and cash equivalents as of December 31, 2025 were lower by $1.5 billion compared to December 31, 2024 primarily due to the repayment of our C$1.4 billion (U.S. $999 million) 2.239% notes upon maturity and the acquisition of SafeSend.
Of total cash and cash equivalents, $140 million and $115 million as of December 31, 2025 and 2024, respectively, were held in subsidiaries which have regulatory restrictions, contractual restrictions or operate in countries where exchange controls and other legal restrictions apply and were therefore not available for general use by our company.
Free cash flow. Free cash flow increased by $122 million as higher net cash provided by operating activities was partly offset by higher capital expenditures and lower cash flows from other investing activities.
Additional information about our debt and credit arrangements, dividends and share repurchases is as follows:
Thomson Reuters Annual Report 2025 |
Page 51 |
We guarantee borrowings by our subsidiaries under the credit facility. We must also maintain a ratio of net debt as defined in the credit agreement (total debt plus hedging agreements, less cash and cash equivalents) as of the last day of each fiscal quarter to EBITDA as defined in the credit agreement (earnings before interest, income taxes, depreciation and amortization and other modifications described in the credit agreement) for the last four quarters ended of not more than 4.5:1. If we complete an acquisition with a purchase price of over $500 million, we may elect, subject to notification, to temporarily increase the ratio of net debt to EBITDA to 5.0:1 at the end of the quarter within which the transaction closed and for each of the three immediately following fiscal quarters. At the end of that period, the ratio would revert to 4.5:1. As of December 31, 2025, we complied with this covenant as our ratio of net debt to EBITDA, as calculated under the terms of our syndicated credit facility, was 0.6:1.
In March 2025, we completed a debt exchange to optimize our company’s capital structure and to align indebtedness to revenue generation. Holders of U.S. dollar denominated notes originally issued by Thomson Reuters Corporation (TRC), the “Old Notes”, were offered the option to receive notes issued by TR Finance LLC (TR Finance), an indirect 100% owned U.S. subsidiary of TRC, the “New Notes”. The results of the exchange are as follows:
Series of notes |
|
|
Principal amount New Notes issued by TR Finance |
Principal amount remaining Old Notes of TRC |
Principal amount outstanding notes |
3.35% Notes due 2026 |
|
|
441 |
59 |
500 |
5.85% Notes due 2040 |
|
|
453 |
47 |
500 |
4.50% Notes due 2043 |
|
|
84 |
35 |
119 |
5.65% Notes due 2043 |
|
|
337 |
13 |
350 |
5.50% Debentures due 2035 |
|
|
373 |
27 |
400 |
Total |
|
|
1,688 |
181 |
1,869 |
The New Notes issued by TR Finance have the same interest rate, interest payment dates and maturity date as the applicable series of Old Notes. The New Notes are fully and unconditionally guaranteed as to payment of principal and interest by TRC as well as West Publishing Corporation, Thomson Reuters Applications Inc. and Thomson Reuters (Tax & Accounting) Inc., each of which is an indirect 100% owned U.S. subsidiary of TRC. The three U.S. subsidiary guarantors also guarantee the remaining Old Notes by TRC on the same basis that TRC and the three U.S. subsidiary guarantors guarantee the TR Finance notes.
The exchange was not a debt extinguishment. Accordingly, the transaction did not result in a derecognition of the existing indebtedness. In 2025, we paid $4 million in solicitation fees to noteholders who participated in the exchange offers. This amount was included in “Other finance (costs) income” within the consolidated income statement. In addition, $8 million of transaction costs were reflected as a reduction in the carrying value of “Long-term indebtedness” within the consolidated statement of financial position. Cash payments for costs and fees of the exchange are reported in “Other financing activities” within the consolidated statement of cash flow.
Page 52 |
Thomson Reuters Annual Report 2025 |
In March 2025, in connection with the above debt exchange, we filed a new base shelf prospectus pursuant to which TRC and TR Finance may issue unsecured debt securities in an aggregate amount of up to $3.0 billion from time to time through April 2027. Any debt securities issued by TR Finance will be fully and unconditionally guaranteed on an unsecured basis by TRC and the three U.S. subsidiary guarantors described above, which are also indirect 100%-owned and consolidated subsidiaries of TRC. Any debt securities issued by TRC will also be guaranteed by the three U.S. subsidiary guarantors on the same basis as the TR Finance debt securities described above. Except for TR Finance and the subsidiary guarantors, none of TRC’s other subsidiaries have guaranteed or would otherwise become obligated with respect to any issued TR Finance or TRC debt securities. Neither TRC nor TR Finance has issued any debt securities under the prospectus. Please refer to Appendix H of this management’s discussion and analysis for condensed consolidating financial information of the Company, including TR Finance and the subsidiary guarantors.
In addition, we have credit support agreements with our counterparties under which one party may call on the other party to post cash collateral when the market value of the swaps exceeds specific thresholds, thus limiting credit exposure. We posted $7 million of cash collateral as of December 31, 2025, for the fixed-to-floating interest rate swaps, which was reflected as a financing activity in the consolidated statement of cash flow.
In November 2025, Moody's changed our outlook from stable to positive. Additionally, in September 2025, Fitch upgraded our long-term debt to a rating of A- from a rating of BBB+ and, in May 2025, S&P Global Ratings upgraded our long-term debt to a rating of A- from a rating of BBB+.
The following table sets forth the credit ratings from rating agencies in respect of TRC and TR Finance's outstanding securities as of the date of this management’s discussion and analysis:
|
|
|
|
Moody's |
|
S&P Global Ratings |
|
Fitch |
Long-term debt |
|
|
|
Baa1 |
|
A- |
|
A- |
Commercial paper |
|
|
|
P-2 |
|
A-2 |
|
F1 |
Trend/Outlook |
|
|
|
Positive |
|
Stable |
|
Stable |
These credit ratings are not recommendations to purchase, hold, or sell securities and do not address the market price or suitability of a specific security for a particular investor. Credit ratings may not reflect the potential impact of all risks on the value of securities. We cannot ensure that our credit ratings will not be lowered in the future or that rating agencies will not issue adverse commentaries regarding our securities.
Details of dividends declared per common share and dividends paid on common shares are as follows:
|
|
|
|
|
|
|
|
Year ended December 31, |
|
||
|
|
|
|
|
|
|
|
|
|
|
|
(millions of U.S. dollars, except per share amounts) |
|
2025 |
|
2024 |
|
|
|
|
|
|
|
|
|
|
|
|
|
Dividends declared per common share |
|
$2.38 |
|
$2.16 |
|
|
|
$— |
|
|
|
Dividends declared |
|
1,069 |
|
973 |
|
Dividends reinvested |
|
(34) |
|
(29) |
|
Dividends paid |
|
1,035 |
|
944 |
|
|
|
2,070 |
|
|
|
Thomson Reuters Annual Report 2025 |
Page 53 |
In February 2026, we announced a 10% or $0.24 per share increase in the annualized dividend rate to $2.62 per common share (beginning with the common share dividend that we plan to pay in March 2026). See the “Subsequent Events” section of this management’s discussion and analysis for additional information.
In February 2026, we announced our plan to repurchase up to $600 million of our common shares. See Subsequent Events" section of this management's discussion and analysis for further details of the above transactions.
In August 2025, we announced our intention to repurchase up to $1.0 billion of our common shares. We completed this program in late October 2025, purchasing 6.0 million common shares.
Prior to the 2025 share repurchase program, we also completed a $1.0 billion share repurchase program between November 2023 and May 2024 which resulted in the repurchase of 6.7 million common shares, including 4.1 million common shares repurchased in 2024.
We may repurchase common shares in open market transactions on the TSX, Nasdaq and/or other exchanges and alternative trading systems, if eligible, or by such other means as may be permitted by the TSX and/or Nasdaq or under applicable law, including private agreement purchases or share purchase program agreement purchases if we receive, if applicable, an issuer bid exemption order in the future from applicable securities regulatory authorities in Canada for such purchases. The price that we will pay for common shares in open market transactions will be the market price at the time of purchase or such other price as may be permitted by the TSX.
Details of share repurchases are as follows:
|
|
|
|
|
|
|
|
Year ended December 31, |
|
||
|
|
|
|
|
|
|
|
|
|
|
|
|
|
2025 |
|
2024 |
|
|
|
|
|
|
|
Share repurchases (millions of U.S. dollars) |
|
1,000 |
|
639 |
|
Shares repurchased (number in millions) |
|
6.0 |
|
4.1 |
|
Share repurchases – average price per share |
|
$166.05 |
|
$156.92 |
|
|
|
|
|
|
|
Decisions regarding any future repurchases will depend on certain factors, such as market conditions, share price and other opportunities to invest capital for growth. We may elect to suspend or discontinue share repurchases at any time, in accordance with applicable laws. From time to time when we do not possess material nonpublic information about ourselves or our securities, we may enter into a pre-defined plan with our broker to allow for the repurchase of shares at times when we ordinarily would not be active in the market due to our own internal trading blackout periods, insider trading rules or otherwise. Any such plans entered into with our broker will be adopted in accordance with applicable Canadian securities laws and the requirements of Rule 10b5-1 under the U.S. Securities Exchange Act of 1934, as amended.
Financial Position
Our net assets, defined as total assets less total liabilities were $11.9 billion, largely unchanged from $12.0 billion as of December 31, 2024.
As of December 31, 2025, our current liabilities exceeded our current assets by $1.2 billion primarily because our current liabilities included $1.3 billion of deferred revenue. We also had $0.8 billion of current indebtedness.
Deferred revenue arises from the sale of subscription-based products and services that many customers pay for in advance. The cash received from these advance payments is used to currently fund the operating, investing and financing activities of our business. However, for accounting purposes, these advance payments must be deferred and recognized over the term of the subscription. As such, we may reflect a negative working capital position in our consolidated statement of financial position. In the ordinary course of business, deferred revenue does not represent a cash obligation, but rather an obligation to perform services or deliver products, and therefore when we are in that situation, we do not believe it is indicative of a liquidity issue, but rather an outcome of the required accounting for our business model.
With respect to current indebtedness, $0.5 billion relates to term debt, which is due in May 2026, and $0.3 billion relates to outstanding commercial paper. We believe we can refinance these amounts at any time, given our credit facility and access to long-term debt markets, both of which are supported by our strong investment grade credit ratings. Additionally, our principal sources of liquidity, which are cash and cash equivalents and cash provided by operating activities, could be used to repay a portion of the amounts outstanding.
Page 54 |
Thomson Reuters Annual Report 2025 |
Net debt and leverage ratio of net debt to adjusted EBITDA
|
|
|
|
|
|
|
|
December 31, |
|
||
|
|
|
|
|
|
|
|
|
|
|
|
(millions of U.S. dollars) |
|
2025 |
|
2024 |
|
|
|
|
|
|
|
Net debt(1) |
|
1,896 |
|
1,156 |
|
Leverage ratio of net debt to adjusted EBITDA: |
|
|
|
|
|
Adjusted EBITDA(1) |
|
2,936 |
|
2,779 |
|
Net debt/adjusted EBITDA(1) |
|
0.6:1 |
|
0.4:1 |
|
|
|
|
|
|
|
For additional information about our liquidity, we provide our leverage ratio of net debt to adjusted EBITDA. Our leverage ratio of net debt to adjusted EBITDA was below our target leverage ratio of 2.5:1. Net debt increased due to the decrease in cash and cash equivalents (refer to the “Cash Flow” section of this management’s discussion and analysis for additional information). As of December 31, 2025, our total debt position (excluding the associated unamortized transaction costs and premiums or discounts) was $2.2 billion.
The maturity dates for our term debt are well balanced with no significant concentration in any one year. As of December 31, 2025, the average maturity of our term debt was approximately 10 years at a weighted-average interest rate of slightly over 5%, including the impact of interest rate swaps. Our next scheduled debt repayment is in May 2026, when our $500 million 3.35% notes are due to mature.
The following table illustrates our expected term debt maturities as of December 31, 2025.
Financial Risk Management
Our global operations expose us to a variety of financial risks including market risk (primarily currency risk and interest rate risk), credit risk and liquidity risk. The section entitled “Financial Risk Management” in note 20 of our 2025 annual consolidated financial statements provides a discussion of the material financial risks we believe we are exposed to and our approach to mitigating the potential adverse effects on our financial performance. Under the oversight of our Chief Financial Officer, our centralized corporate treasury group is responsible for our financial risk management strategy and execution and operates under strict guidelines and internal control processes. We strive to minimize the potential adverse economic effects associated with financial risks on our financial performance and to ensure we have sufficient liquidity to fund our operations, reinvest in our business, pay dividends and service our debt obligations.
We mitigate the risk of loss on the trade accounts receivable balances we have with our customers through active monitoring and credit policies, including aging analyses, automated dunning, and cancellation of services. Additionally, we have a broad and diversified customer base with no significant exposure to any single customer. We also monitor the financial strength of financial institutions with which we have banking and other commercial relationships, including those that hold our cash and cash equivalents, and those which are counterparties to derivative financial instruments and other arrangements.
Approximately 46% of our cash and cash equivalents as of December 31, 2025 were held by subsidiaries outside the U.S. We have historically accessed such funds in a tax efficient manner to meet our liquidity requirements and due to our legal entity structure, we continue to expect to have access.
Thomson Reuters Annual Report 2025 |
Page 55 |
Most of our business is conducted in U.S. dollars. However, 19% of our 2025 revenues and 39% of our 2025 operating expenses were denominated in currencies other than the U.S. dollar, the most significant of which is the British pound sterling with the balance spread over several currencies, including the Canadian dollar, the Euro, the Brazilian real and the Indian rupee. Changes in foreign exchange rates typically impact the growth in our expenses more than our revenues, because a higher percentage of our expenses are denominated in foreign currency. In 2025, foreign currency was not a significant factor on the total year-over-year change in our revenues or operating expenses.
The following charts outline the currency profile of our revenues and operating expenses included in our calculation of adjusted EBITDA for 2025:
Revenues |
|
Operating Expenses |
|
|
|
Off-Balance Sheet Arrangements, Commitments and Contractual Obligations
The following table summarizes our contractual obligations and off-balance sheet commitments:
|
|
|
|
|
|
|
|
|
|
|
|
|
|
|
|
(millions of U.S. dollars) |
|
2026 |
|
2027 |
|
2028 |
|
2029 |
|
2030 |
|
Thereafter |
|
Total |
|
|
|
|
|
|
|
|
|
|
|
|
|
|
|
|
|
Commercial paper |
|
295 |
|
- |
|
- |
|
- |
|
- |
|
- |
|
295 |
|
Notes/debentures(1) |
|
500 |
|
- |
|
- |
|
- |
|
- |
|
1,369 |
|
1,869 |
|
Interest payable(1) |
|
84 |
|
76 |
|
76 |
|
76 |
|
76 |
|
715 |
|
1,103 |
|
Debt-related hedges outflows(2) |
|
25 |
|
20 |
|
20 |
|
21 |
|
22 |
|
325 |
|
433 |
|
Debt-related hedges inflows(1) |
|
(26) |
|
(22) |
|
(22) |
|
(22) |
|
(22) |
|
(288) |
|
(402) |
|
Lease obligations(3) |
|
71 |
|
61 |
|
45 |
|
37 |
|
33 |
|
132 |
|
379 |
|
Unconditional purchase obligations |
|
524 |
|
456 |
|
365 |
|
321 |
|
296 |
|
- |
|
1,962 |
|
Defined benefit obligations |
|
33 |
|
- |
|
- |
|
- |
|
- |
|
- |
|
33 |
|
Total |
|
1,506 |
|
591 |
|
484 |
|
433 |
|
405 |
|
2,253 |
|
5,672 |
|
|
|
|
|
|
|
|
|
|
|
|
|
|
|
|
|
We provide further information about certain of our obligations below:
Page 56 |
Thomson Reuters Annual Report 2025 |
The amount and timing of any future required contributions to pension plans could differ significantly from our estimates as of December 31, 2025. We cannot estimate contributions beyond 2026 because they depend on future economic conditions, plan performance and potential future government legislation. For certain plans, the trustees have the right to call for special valuations, which could subsequently result in us having to make an unexpected contribution. Additionally, from time to time, we may elect to make voluntary contributions to improve the funded status of the plans.
Other than as described above, we do not engage in off-balance sheet financing arrangements and we do not have any interests in unconsolidated special-purpose or structured finance entities.
Contingencies
Lawsuits and Legal Claims
We are engaged in various legal proceedings, claims, audits and investigations that have arisen in the ordinary course of business. These matters include, but are not limited to, employment matters, commercial matters, privacy and data protection matters, defamation matters and intellectual property infringement matters. The outcome of all the matters against us is subject to future resolution, including uncertainties of litigation. Litigation outcomes are difficult to predict with certainty due to various factors, including but not limited to: the preliminary nature of some claims; uncertain damage theories and demands; an incomplete factual record; uncertainty concerning legal theories and procedures and their resolution by the courts, at both trial and appellate levels; and the unpredictable nature of opposing parties. Based on information currently known to us and after consultation with outside legal counsel, management believes that the ultimate resolution of any such matters, individually or in the aggregate, will not have a material adverse impact on our financial condition taken as a whole.
Uncertain Tax Positions
We are subject to taxation in numerous jurisdictions and we are routinely under audit by many different taxing authorities in the ordinary course of business. There are many transactions and calculations during the course of business for which the ultimate tax determination is uncertain, as taxing authorities may challenge some of our positions and propose adjustments or changes to our tax filings.
As a result, we maintain provisions for uncertain tax positions that we believe appropriately reflect our risk. These provisions are made using our best estimates of the amount expected to be paid based on a qualitative assessment of all relevant factors. When appropriate, we perform an expected value calculation to determine our provisions. We review the adequacy of these provisions at the end of each reporting period and adjust them based on changing facts and circumstances. Due to the uncertainty associated with tax audits, it is possible that at some future date, liabilities resulting from such audits or related litigation could vary significantly from our provisions. However, based on currently enacted legislation, information currently known to us and after consultation with outside tax advisors, management believes that the ultimate resolution of any such matters, individually or in the aggregate, will not have a material adverse impact on our financial condition taken as a whole.
Prior to December 31, 2023, we paid $430 million of tax as required under notices of assessment issued by the U.K. tax authority, HM Revenue & Customs (HMRC), under the Diverted Profits Tax (DPT) regime that collectively related to the 2015, 2016, 2017 and 2018 taxation years of certain of our current and former U.K. affiliates. We do not believe these current and former U.K. affiliates fall within the scope of the DPT regime. Because we believe our position is supported by the weight of law, we intend to vigorously defend our position and will continue contesting these assessments through all available administrative and judicial remedies. As the assessments largely relate to businesses that we have sold, the majority are subject to indemnity arrangements under which we have been required to pay additional taxes to HMRC or the indemnity counterparty.
We do not believe that the resolution of these matters will have a material adverse effect on our financial condition taken as a whole. Payments made by us are not a reflection of our view on the merits of the case. As we expect to receive refunds of substantially all of the amounts paid pursuant to these notices of assessment, we have recorded substantially all of these payments as non-current receivables from HMRC or the indemnity counterparty, in our financial statements.
Thomson Reuters Annual Report 2025 |
Page 57 |
Guarantees
We have an investment in 3XSQ Associates, an entity jointly owned by a subsidiary of our company and Rudin Times Square Associates LLC (Rudin), that owns and operates the 3 Times Square office building (the building) in New York, New York. In May 2025, 3XSQ Associates extended the maturity of its 3-year term loan facility from June 2025 for an additional 2 years to June 2027 and reduced the facility to $385 million from $415 million. The facility was obtained in 2022 to refinance existing debt, fund the building’s redevelopment, and cover interest and operating costs during the redevelopment period. The building is pledged as loan collateral. We and Rudin each guarantee 50% of (i) certain principal loan amounts and (ii) interest and operating costs. We and Rudin also jointly and severally guarantee (i) completion of commenced works and (ii) lender losses arising from disallowed acts, environmental or otherwise. To minimize economic exposure to 50% for the joint and several obligations, we and a parent entity of Rudin entered into a cross-indemnification arrangement. We believe the value of the building is expected to be sufficient to cover obligations that could arise from the guarantees. The guarantees do not impact our ability to borrow funds under our $2.0 billion syndicated credit facility or the related covenant calculation.
For additional information, please see the “Risk Factors” section of this annual report, which contains further information on risks related to legal and tax matters.
The information in this section is forward-looking and should be read in conjunction with the section entitled “Additional Information - Cautionary Note Concerning Factors That May Affect Future Results”.
Trends
Technology and societal forces continue to drive the digital transformation of the legal, tax, audit, accounting, and risk & fraud ecosystems in which we operate. Our customers – professionals in law firms, accounting firms, government agencies and corporations – must continually improve efficiency and demonstrate the value of their service to their clients.
We are positioned to capitalize on three powerful secular trends that reinforce the strength of our positioning:
Together, these dynamics create a virtuous cycle where regulatory and compliance complexity drives content demand, while AI capabilities transform that content into higher-value solutions that deepen customer relationships and expand addressable market opportunity.
While the pace of technology adoption varies, the overall trend towards cloud and AI-enabled automation is consistent across our “Big 3” customer segments. The following forces are driving changes in our customer segments:
Page 58 |
Thomson Reuters Annual Report 2025 |
Relative to our Reuters business, the media sector continues to transform, with the traditional news agency market under pressure due to audiences’ shift to digital and streaming services. Traditional news content has found new uses in the licensing of content for AI foundation models, and the industry is exploring new means of consuming news through various AI agents. In the Professional sector, digital advertising and sponsorships revenues will continue to be exposed to discretionary spend shifts over the business cycle.
We continue to expect revenue declines in our Global Print business as customers migrate to online delivery, which has been compounded by the influence of the virtual and hybrid work environment.
The opportunity created by technology in the professional markets we serve continues to attract significant capital and entrepreneurial talent, creating a highly competitive environment. The increasing opportunities created by AI have elevated the competitive environment. Our traditional competitors are investing to provide new value to customers, as well as acquiring businesses to add new capabilities. More narrowly focused technology companies, including private companies often funded by private equity or start-ups funded by venture capital, are all investing heavily to pursue growth opportunities in our market segments. Large horizontal business systems vendors as well as some smaller vendors provide similar solutions to certain of our offerings. Professional service firms such as the Global 7 accounting firms, who have traditionally been our customers as well as our go-to-market partners, are developing their own competitive technology solutions. Start-ups continue to produce attractive innovations using the latest technologies. In the global news market segment, audiences are fragmenting across platforms while news consumption is shifting to on demand, social, and mobile formats, with emerging news consumption via AI agents. While competition continues to be intense and dynamic, we believe that our strengths, high quality content, deep domain expertise, technology expertise and strong customer relationships will allow us to continue to serve the needs of our customers.
Priorities
We strive to be the leading content-driven technology company that empowers professionals to navigate complex legal, tax, audit, accounting, compliance, government, corporate and media environments.
In 2025, we continued to build on our strong foundations, preserving, scaling, and further strengthening our unique position in the market. The rapid pace of AI innovation continues to drive significant transformation across the industries we serve, reinforcing the importance of our strategy and our priorities for 2026:
Thomson Reuters Annual Report 2025 |
Page 59 |
Financial Outlook
The following table sets forth our full-year 2026 outlook and our full-year 2025 actual results, which include non-IFRS financial measures. Our outlook assumes constant currency rates relative to 2025 and does not factor in the impact of any future acquisitions or dispositions. We believe this type of guidance provides useful insight into the anticipated performance of our business.
We continue to operate in an uncertain macroeconomic environment, reflecting ongoing geopolitical risk, uneven economic growth and an evolving interest rate and inflationary backdrop. Any worsening of the global economic or business environment, among other factors, could impact our ability to achieve our outlook.
|
|
|
|
|
Total Thomson Reuters |
|
2025 Actual |
|
2026 Outlook |
|
|
|
|
|
Revenue growth Organic revenue growth(1) |
|
3%(2) 7% |
|
7.5 - 8.0% 7.5 - 8.0% |
Adjusted EBITDA margin(1) |
|
39.2% |
|
+100bps vs 2025 |
Corporate costs |
|
$118 million |
|
$115 - $125 million |
Free cash flow(1) |
|
$1.95 billion |
|
~$2.1 billion |
Accrued capital expenditures as a percentage of revenues(1) |
|
8.2% |
|
~8.0% |
Depreciation and amortization of software Depreciation and amortization of internally developed software Amortization of acquired software |
|
$832 million $626 million $206 million |
|
$890 - $910 million $680 - $690 million $210 - $220 million |
Net interest expense |
|
$143 million |
|
$150 - $160 million |
Effective tax rate on adjusted earnings(1) |
|
18.5% |
|
~19.0% |
“Big 3” Segments(1) |
|
2025 Actual |
|
2026 Outlook |
Revenue growth Organic revenue growth |
|
4%(2) 9% |
|
~9.5% ~9.5% |
Adjusted EBITDA margin |
|
43.6% |
|
+100bps vs 2025 |
We expect our first-quarter 2026 organic revenue growth to be approximately 7% and our adjusted EBITDA margin to be approximately 42%.
Page 60 |
Thomson Reuters Annual Report 2025 |
The following table summarizes our material assumptions and risks that may cause actual performance to differ from our expectations underlying our 2026 financial outlook.
Revenues |
|
|
Material assumptions |
|
Material risks |
• Uncertain macroeconomic and geopolitical conditions will continue to disrupt the economy and cause periods of volatility • Continued need for trusted products and services that help customers navigate evolving and complex legal, tax, audit, accounting, regulatory, geopolitical and commercial changes, developments and environments, and for cloud-based digital tools that drive productivity • Continued ability to deliver innovative products that meet evolving customer demands • Acquisition of new customers through expanded and improved digital platforms, simplification of the product portfolio and through other sales initiatives • Improvement in customer retention through commercial simplification efforts and customer service improvements |
|
• Ongoing geopolitical and macroeconomic uncertainty continue to impact the global economy. The severity and duration of this uncertainty could lead to lower demand for our products and services (beyond our assumption that these disruptions will cause periods of volatility) • Uncertainty in the legal regulatory regime relating to AI. Enacted and potential future legislation may make it harder for us to conduct business using AI, lead to regulatory fines or penalties, require us to change product offerings or business practices, or prevent or limit our use of AI • Demand for our products and services could be reduced by changes in customer buying patterns, or our inability to execute on key product design or customer support initiatives • Competitive pricing actions and product innovation could impact our revenues • Our sales, commercial simplification and product design initiatives may be insufficient to retain customers or generate new sales |
Adjusted EBITDA margin |
|
|
Material assumptions |
|
Material risks |
• Our ability to achieve revenue growth targets • Business mix continues to shift to higher-growth product offerings • Integration expenses associated with recent acquisitions will reduce margins |
|
• Same as the risks above related to the revenue outlook • Higher than expected inflation may lead to greater than anticipated increase in labor costs, third-party supplier costs and costs of print materials • Acquisition and disposal activity may dilute adjusted EBITDA margin |
Free Cash Flow |
|
|
Material assumptions |
|
Material risks |
• Our ability to achieve our revenue and adjusted EBITDA margin targets • Accrued capital expenditures expected to approximate 8.0% of revenues in 2026 |
|
• Same as the risks above related to the revenue and adjusted EBITDA margin outlook • A weaker macroeconomic environment could negatively impact working capital performance, including the ability of our customers to pay us • Capital expenditures may be higher than currently expected • The timing and amount of tax payments to governments may differ from our expectations |
Thomson Reuters Annual Report 2025 |
Page 61 |
Effective tax rate on adjusted earnings |
|
|
Material assumptions |
|
Material risks |
• Our ability to achieve our adjusted EBITDA target • The mix of taxing jurisdictions where we recognized pre-tax profit or losses in 2025 does not significantly change in 2026 • Minimal changes in currently enacted tax laws and treaties within the jurisdictions where we operate • No significant charges or benefits from the finalization of prior tax years • Depreciation and amortization of internally developed software of $680 - $690 million in 2026 • Net interest expense of $150 - $160 million in 2026 |
|
• Same as the risks above related to adjusted EBITDA • A material change in the geographical mix of our pre-tax profits and losses • A material change in current tax laws or treaties to which we are subject, and did not expect • Resolution of tax audits may cause material changes to assessments of uncertain tax positions compared to current estimates • Depreciation and amortization of internally developed software as well as net interest expense may be significantly higher or lower than expected |
Our outlook contains various non-IFRS financial measures. We believe that providing reconciliations of forward-looking non-IFRS financial measures in our outlook would be potentially misleading and not practical due to the difficulty of projecting items that are not reflective of ongoing operations in any future period. The magnitude of these items may be significant. Consequently, for purposes of our outlook only, we are unable to reconcile these measures to the most comparable IFRS measures because we cannot predict, with reasonable certainty, the impact of changes in foreign exchange rates which impact (i) the translation of our results reported at average foreign currency rates for the year and (ii) other finance income or expense related to intercompany financing arrangements. Additionally, we cannot reasonably predict the occurrence or amount of other operating gains and losses, which generally arise from business transactions we do not currently anticipate.
As of March 2, 2026, our principal shareholder, Woodbridge (together with its affiliates), beneficially owned approximately 70% of our common shares.
Transactions with Woodbridge
From time to time, in the normal course of business, we enter into transactions with Woodbridge and certain of its affiliates. These transactions involve providing and receiving product and service offerings and are not material to our results of operations or financial condition either individually or in the aggregate.
Transactions with YPL
In 2024, we received $1.8 billion of dividends from YPL related to the sale of our indirectly owned LSEG shares. See the “Executive Summary – Acquisitions and Dispositions” section of this management’s discussion and analysis for additional information.
Transactions with 3XSQ Associates
In 2025, we made an $18 million in-kind contribution representing the fair value of guarantees provided in connection with a $385 million loan facility obtained by 3XSQ Associates (see the "Guarantees" section of this management’s discussion and analysis for additional information). In each of 2025 and 2024, we also contributed $10 million in cash pursuant to a capital call.
Additionally, in October 2025, we amended our lease agreement with 3XSQ Associates for additional office space in the 3 Times Square building in New York, New York and extended the lease term to May 2036 for a total commitment of $46 million. In each of 2025 and 2024, we paid $4 million of rent to 3XSQ Associates.
Transactions with other associates
From time to time, we enter into transactions with other associates. These transactions typically involve providing or receiving services in the normal course of business and are not material to our company’s results of operations or financial condition either individually or in the aggregate.
Page 62 |
Thomson Reuters Annual Report 2025 |
Compensation of key management personnel
Key management personnel compensation, including directors, are as follows:
|
|
|
|||
|
|
Year ended December 31, |
|
||
(millions of U.S. dollars) |
|
2025 |
|
2024 |
|
Salaries and other benefits |
|
23 |
|
25 |
|
Share-based payments |
|
24 |
|
19 |
|
Total compensation |
|
47 |
|
44 |
|
Key management personnel are comprised of our company’s directors and executive officers.
2026 Dividends
In February 2026, we announced a 10% or $0.24 per share increase in the annualized dividend to $2.62 per common share, which was approved by our board of directors. A quarterly dividend of $0.655 per share will be paid on March 10, 2026 to shareholders of record as of February 17, 2026.
Share Repurchases and Return of Capital
In February 2026, we announced that we plan to repurchase up to $600 million of our common shares under an amended NCIB that has been approved by the TSX. The amended NCIB was effective on February 27, 2026 and will increase the maximum number of common shares that may be repurchased by an additional 6 million. Under the amended NCIB, up to 16 million common shares may be repurchased between August 19, 2025 and August 18, 2026, of which 6.0 million common shares were repurchased in 2025 (see the "Liquidity and Capital Resources - Share repurchases - NCIB" section of this management’s discussion and analysis for additional information). The completion of this program will depend on certain factors such as market conditions, share price and other opportunities to invest capital for growth.
In February 2026, we also announced that we plan to return $605 million to shareholders through a return of capital transaction from the gross proceeds derived from the May 2024 sales of LSEG shares. The return of capital will consist of a special cash distribution of approximately $1.36 in cash per participating share, followed by a share consolidation, or “reverse stock split”, which will reduce the number of common shares on a basis that is proportional to the special cash distribution. To that end, the share consolidation ratio will be based on the volume weighted average trading price of the common shares on the Nasdaq for the five trading days immediately prior to the transactions becoming effective. The return of capital and share consolidation transactions will require shareholder approval and the approval of the Ontario Superior Court of Justice (Commercial List). If shareholder and court approval are obtained, we expect to effect the proposed transactions in early May 2026.
Acquisition
In February 2026, we acquired Noetica, Inc., a New York-based AI-native start-up that transforms transaction-deal data into structured market intelligence for deal professionals. This business will be primarily reported in the Legal Professionals segment. We are in the process of allocating the purchase consideration to the assets and liabilities assumed for accounting purposes.
IAS 21, The Effect of Changes in Foreign Exchange Rates
In August 2023, the IASB issued amendments to IAS 21, which provide guidance on the determination of an exchange rate to translate transactions and financial statements denominated or presented in a currency that is not exchangeable into another currency. The amendments were effective for reporting periods beginning January 1, 2025 and did not have a material impact on the Company’s financial statements.
Thomson Reuters Annual Report 2025 |
Page 63 |
Accounting pronouncements effective in future periods
IFRS 18, Presentation and Disclosure in Financial Statements and associated amendments to IAS 7, Statement of Cash Flows
In April 2024, the IASB issued IFRS 18 and amendments to IAS 7. IFRS 18 will replace IAS 1, Presentation of Financial Statements. Both IFRS 18 and amendments to IAS 7 are effective for reporting periods beginning January 1, 2027.
IFRS 18 will change the presentation of our financial statements and add new disclosure requirements. Specifically, the new standard requires:
The amendments to IAS 7 were issued to align the presentation of the statement of cash flows, as prepared under
the indirect method, to the changes prescribed to the income statement under IFRS 18.
Both IFRS 18 and the amendments to IAS 7 are presentation and disclosure related and do not impact the measurement of our results of operations, financial condition, or cash flows. We are assessing the impact of these pronouncements on our disclosures.
Amendments to IFRS 9 and IFRS 7, Amendments to the Classification and Measurement of Financial Instruments
In May 2024, the IASB issued amendments to IFRS 9, Financial Instruments and IFRS 7, Financial Instruments: Disclosures. The amendments introduce:
The amendments are effective for reporting periods beginning on January 1, 2026. We have concluded that there will be no material impact from the adoption of these amendments on our financial statements or disclosures.
Other pronouncements issued by the IASB and International Financial Reporting Interpretations Committee (IFRIC) are not applicable or consequential to our company.
The preparation of financial statements requires management to make estimates and judgments about the future. Estimates and judgments are continually evaluated and are based on historical experience and other factors, including expectations of future events that are believed to be reasonable under the circumstances. Refer to Appendix E of this management’s discussion and analysis for additional information on our critical accounting estimates and judgments.
Page 64 |
Thomson Reuters Annual Report 2025 |
Disclosure Controls and Procedures
Our Chief Executive Officer and Chief Financial Officer, after evaluating the effectiveness of our disclosure controls and procedures (as defined in applicable U.S. and Canadian securities law) as of the end of the period covered by this management’s discussion and analysis, have concluded that our disclosure controls and procedures were effective to ensure that all information that we are required to disclose in reports that we file or furnish under the U.S. Securities Exchange Act and applicable Canadian securities law is (i) recorded, processed, summarized and reported within the time periods specified in the rules and forms of the SEC and Canadian securities regulatory authorities and (ii) accumulated and communicated to our management, including our Chief Executive Officer and Chief Financial Officer, to allow timely decisions regarding required disclosure.
Internal Control Over Financial Reporting
Our management is responsible for establishing and maintaining adequate internal control over financial reporting to provide reasonable assurance regarding the reliability of financial reporting and the preparation of financial statements for external purposes in accordance with IFRS.
There was no change in our internal control over financial reporting during 2025 that materially affected, or is reasonably likely to materially affect, our internal control over financial reporting.
Our management assessed the effectiveness of our internal control over financial reporting as of December 31, 2025 and based on that assessment determined that our internal control over financial reporting was effective. Refer to our 2025 annual consolidated financial statements for our management’s report on internal control over financial reporting.
Share Capital
As of March 2, 2026, we had outstanding 444,765,643 common shares, 6,000,000 Series II preference shares, 1,184,092 stock options and a total of 1,467,690 time-based restricted share units and performance restricted share units. We have also issued a Thomson Reuters Founders Share which enables Thomson Reuters Founders Share Company to exercise extraordinary voting power to safeguard the Thomson Reuters Trust Principles.
Public Securities Filings and Regulatory Announcements
You may access other information about our company, including our 2025 annual report (which contains information required in an annual information form) and our other disclosure documents, reports, statements or other information that we file with the Canadian securities regulatory authorities through SEDAR+ at sedarplus.ca and in the United States with the SEC at sec.gov.
Cautionary Note Concerning Factors That May Affect Future Results
Certain statements in this management’s discussion and analysis are forward-looking, including, but not limited to, our 2026 business outlook, the Company's expectations regarding the return of capital transaction and share repurchases, the company’s expectations regarding defined benefit plan contributions, the Company's expectations regarding the impact of tax legislation in Canada and its discussion of anticipated trends, as well as statements regarding the Company’s intentions to target a leverage ratio of 2.5x net debt to adjusted EBITDA, a dividend payout ratio of between 50% to 60% of its free cash flow, to return at least 75% of free cash flow annually in the form of dividends and share repurchases, as well as its target to earn a return on invested capital (ROIC) that is double or more of its weighted-average cost of capital over time, the Company’s expectations regarding refunds on amounts paid to HMRC, and other expectations regarding the Company’s strategic priorities, initiatives, opportunities and with regard to its liquidity and capital resources, including its ability to refinance its current debt obligations and statements about the estimated future growth of the market segments in which Thomson Reuters’ businesses operates. The words “will”, “expect”, “believe”, “target” “estimate”, “could”, “should”, “intend”, “predict”, “project” and similar expressions identify forward-looking statements. While we believe that we have a reasonable basis for making forward-looking statements in this management’s discussion and analysis, they are not a guarantee of future performance or outcomes or that any other events described in any forward-looking statement will materialize. Forward-looking statements are subject to a number of risks, uncertainties and assumptions that could cause actual results or events to differ materially from current expectations. Many of these risks, uncertainties and assumptions are beyond our company’s control and the effects of them can be difficult to predict. In particular, the full extent of the impact of macroeconomic and geopolitical environment on the Company’s business, operations and financial results will depend on numerous evolving factors that we may not be able to accurately predict.
Thomson Reuters Annual Report 2025 |
Page 65 |
Some of the material risk factors that could cause actual results or events to differ materially from those expressed in or implied by forward-looking statements in this management’s discussion and analysis include, but are not limited to, actions of competitors; uncertainty, downturns and changes in the markets that the Company serves; failure of AI initiatives to enhance products or meet customer expectations; failure to keep pace with technological developments to provide new products, services, applications and functionalities to meet customers’ needs, attract new customers and retain existing ones, or expand into new geographic markets and identify areas of higher growth; failure to derive fully the anticipated benefits from existing or future acquisitions, dispositions or other strategic investments, including joint ventures and investments; failure to protect the brands and reputation of Thomson Reuters; social and ethical issues from the use of new and evolving technologies in our products and services; risks related to cybersecurity threats and incidents for us and our third-party providers; dependency on cloud providers, local data centers, software-as-a-service providers and other third parties for services; failure to attract, engage and retain the right management, key employees and skills to the organization; failure to adapt to organizational changes and effectively implement strategic initiatives; failure to meet the challenges involved in operating globally, including risks associated with persisting geopolitical tensions and ongoing protectionism measures (including the potential imposition of new tariffs as well as related retaliatory measures); dependency on third parties for data, information and other services; changes to law and regulations related to privacy, data security, data protection, the use of AI, and other areas; inadequate protection of intellectual property rights; tax matters, including changes to tax laws, regulations and treaties; threat of legal actions and claims; risk of antitrust/competition-related claims or investigations; failure to maintain a high renewal rate for recurring, subscription-based services; fluctuations in foreign currency exchange and interest rates; downgrading of credit ratings and adverse conditions in the credit markets; the effect of factors outside of the control of Thomson Reuters on funding obligations in respect of pension and post-retirement benefit arrangements; impairment of goodwill and other identifiable intangible assets; actions or potential actions that could be taken by the Company’s principal shareholder (Woodbridge); and the ability of Thomson Reuters Founders Share Company to affect the Company’s governance and management. Additional factors are discussed in the “Risk Factors” and “Financial Outlook” sections of the 2025 annual report and in materials that we from time to time file with, or furnish to, the Canadian securities regulatory authorities and the U.S. Securities and Exchange Commission.
Our company's 2026 business outlook is based on information currently available to the Company and is based on various external and internal assumptions made by the Company in light of its experience and perception of historical trends, current conditions and expected future developments, as well as other factors that the Company believes are appropriate under the circumstances.
Our company has provided a 2026 business outlook for the purpose of presenting information about current expectations for the period presented. This information may not be appropriate for other purposes. You are cautioned not to place undue reliance on forward-looking statements which reflect expectations only as of the date of this management’s discussion and analysis.
Except as may be required by applicable law, Thomson Reuters disclaims any obligation to update or revise any forward-looking statements.
Page 66 |
Thomson Reuters Annual Report 2025 |
Non-IFRS Financial Measures
We use non-IFRS financial measures, which include ratios that incorporate one or more non-IFRS financial measures, as supplemental indicators of our operating performance and financial position as well as for internal planning purposes, our management incentive programs and our business outlook. These measures do not have any standardized meaning prescribed by IFRS and therefore are unlikely to be comparable to the calculation of similar measures used by other companies. We modified our definition of net debt to account for interest rate swap arrangements entered into during the third quarter of 2025. The change did not have a material impact on our calculation of net debt.
The following table sets forth our non-IFRS financial measures including an explanation of why we believe they are useful measures of our performance. Reconciliations to the most directly comparable IFRS measure are reflected in Appendices B and D of this management’s discussion and analysis.
How We Define It |
|
Why We Use It and Why It Is Useful to Investors |
|
Most Directly Comparable IFRS Measure |
Adjusted EBITDA and the related margin |
||||
Represents earnings or losses from continuing operations before tax expense or benefit, net interest expense, other finance costs or income, depreciation, amortization of software and other identifiable intangible assets, our share of post-tax earnings or losses in equity method investments, other operating gains and losses, certain asset impairment charges and fair value adjustments, including those related to acquired deferred revenue. The related margin is adjusted EBITDA expressed as a percentage of revenues. For purposes of this calculation, revenues are before fair value adjustments to acquired deferred revenue. |
|
Provides a consistent basis to evaluate operating profitability and performance trends by excluding items that we do not consider to be controllable activities for this purpose. Also represents a measure commonly reported and widely used by investors as a valuation metric, as well as to assess our ability to incur and service debt. |
|
Earnings from continuing operations |
|
|
|
|
|
Adjusted EBITDA less accrued capital expenditures and the related margin |
||||
Represents adjusted EBITDA less accrued capital expenditures, where accrued capital expenditures include amounts that remain unpaid at the reporting date. The related margin is adjusted EBITDA less accrued capital expenditures expressed as a percentage of revenues. For purposes of this calculation, revenues are before fair value adjustments to acquired deferred revenue. |
|
Provides a basis for evaluating the operating profitability and capital intensity of a business in a single measure. This measure captures investments regardless of whether they are expensed or capitalized, and reflects the basis on which management measures capital spending. |
|
Earnings from continuing operations |
|
|
|
|
|
Accrued capital expenditures as a percentage of revenues |
||||
Accrued capital expenditures expressed as a percentage of revenues. For purposes of this calculation, revenues are before fair value adjustments to acquired deferred revenue. |
|
Reflects the basis on how we manage capital expenditures for internal planning purposes. |
|
Capital expenditures |
|
|
|
|
|
Thomson Reuters Annual Report 2025 |
Page 67 |
How We Define It |
|
Why We Use It and Why It Is Useful to Investors |
|
Most Directly Comparable IFRS Measure |
Adjusted earnings and adjusted EPS |
||||
Net earnings or loss including dividends declared on preference shares but excluding the post-tax impacts of fair value adjustments, including those related to acquired deferred revenue, amortization of acquired intangible assets (attributable to other identifiable intangible assets and acquired software), other operating gains and losses, certain asset impairment charges, other finance costs or income, our share of post-tax earnings or losses in equity method investments, discontinued operations and other items affecting comparability. Acquired intangible assets contribute to the generation of revenues from acquired companies, which are included in our computation of adjusted earnings. The post-tax amount of each item is excluded from adjusted earnings based on the specific tax rules and tax rates associated with the nature and jurisdiction of each item. Adjusted EPS is calculated from adjusted earnings using diluted weighted-average shares and does not represent actual earnings or loss per share attributable to shareholders. |
|
Provides a more comparable basis to analyze earnings. These measures are commonly used by shareholders to measure performance. |
|
Net earnings and diluted EPS |
|
|
|
|
|
Effective tax rate on adjusted earnings |
||||
Adjusted tax expense divided by pre-tax adjusted earnings. Adjusted tax expense is computed as income tax expense or benefit plus or minus the income tax impacts of all items impacting adjusted earnings (as described above), and other tax items impacting comparability. |
|
Provides a basis to analyze the effective tax rate associated with adjusted earnings. |
|
Tax (expense) benefit |
|
|
|
|
|
In interim periods, we also make an adjustment to reflect income taxes based on the estimated full-year effective tax rate. Earnings or losses for interim periods under IFRS reflect income taxes based on the estimated effective tax rates of each of the jurisdictions in which we operate. The non-IFRS adjustment reallocates estimated full-year income taxes between interim periods but has no effect on full-year income taxes. |
|
Our effective tax rate computed in accordance with IFRS may be more volatile by quarter because the geographical mix of pre-tax profits and losses in interim periods may be different from that for the full year. Therefore, we believe that using the expected full-year effective tax rate provides more comparability among interim periods. |
|
|
|
|
|
|
|
Page 68 |
Thomson Reuters Annual Report 2025 |
How We Define It |
|
Why We Use It and Why It Is Useful to Investors |
|
Most Directly Comparable IFRS Measure |
Net debt and leverage ratio of net debt to adjusted EBITDA |
||||
Net debt: Total debt, plus related hedging instruments and collateral balances, along with lease liabilities, excluding unamortized transaction costs and any premiums or discounts on debt, minus cash and cash equivalents. We exclude specific hedging components to reflect the net cash outflow upon debt maturity.
|
|
Provides a commonly used measure of a company’s leverage. Given that we hedge some of our debt to manage risk, we include hedging instruments as we believe it provides a better measure of the total obligation associated with our outstanding debt. Since we plan to hold our debt and related hedges until maturity, the net debt calculation is adjusted to reflect the net cash outflow at maturity, after deducting cash and cash equivalents. |
|
Total debt (current indebtedness plus long-term indebtedness)
|
|
|
|
|
|
Net debt to adjusted EBITDA: Net debt is divided by adjusted EBITDA for the previous twelve-month period ending with the current fiscal quarter. |
|
Provides a commonly used measure of a company’s ability to pay its debt. Our non-IFRS measure is aligned with the calculation of our internal target leverage ratio and is more conservative than the maximum ratio allowed under the contractual covenants in our credit facility. |
|
For adjusted EBITDA, refer to the definition above for the most directly comparable IFRS measure
|
|
|
|
|
|
Free cash flow |
||||
Net cash provided by operating activities and other investing activities, less capital expenditures, payments of lease principal and dividends paid on our preference shares. |
|
Helps assess our ability, over the long term, to create value for our shareholders as it represents cash available to repay debt, pay common dividends and fund share repurchases and acquisitions. |
|
Net cash provided by operating activities |
|
|
|
|
|
Return on invested capital (ROIC) |
||||
Adjusted operating profit (operating profit excluding amortization of acquired intangible assets attributable to other identifiable intangible assets and acquired software, other operating gains and losses, and fair value adjustments) less net taxes paid expressed as a percentage of the average invested capital during the period. |
|
Provides a measure of how efficiently we allocate resources to profitable activities and is indicative of our ability to create value for our shareholders. |
|
IFRS does not require a measure comparable to ROIC. Refer to our calculation of ROIC in Appendix D for a reconciliation of the components in the calculation to the most directly comparable IFRS measure. |
|
|
|
|
|
Thomson Reuters Annual Report 2025 |
Page 69 |
How We Define It
|
|
Why We Use It and Why It Is Useful to Investors |
|
Most Directly Comparable IFRS Measure |
Changes before the impact of foreign currency or at constant currency |
||||
Applicable measures where changes are reported before the impact of foreign currency or at constant currency IFRS Measures: • Revenues • Operating expenses Non-IFRS Measures and ratios: • Adjusted EBITDA and adjusted EBITDA margin • Adjusted EPS
Our reporting currency is the U.S. dollar. However, we conduct activities in currencies other than the U.S. dollar. We measure our performance before the impact of foreign currency (or at constant currency or excluding the effects of currency), which is determined by converting the current and equivalent prior period’s local currency results using the same foreign currency exchange rate. |
|
Provides better comparability of business trends from period to period. |
|
For each non-IFRS measure and ratio, refer to the definitions above for the most directly comparable IFRS measure. |
Changes in revenues computed on an organic basis |
||||
Represent changes in revenues of our existing businesses at constant currency. The metric excludes the distortive impacts of acquisitions and dispositions from not owning the business in both comparable periods. • For acquisitions, we calculate organic growth as though we had owned the acquired business in both periods. We compare revenues for the acquired business for the period we owned the business to the same prior-year period revenues for that business, when we did not own it. • For dispositions, we calculate organic growth only for the time we owned the business in the current period, compared to the same period in the prior year. |
|
Provides further insight into the performance of our existing businesses by excluding distortive impacts and serves as a better measure of our ability to grow our business over the long term. |
|
Revenues |
|
|
|
|
|
“Big 3” segments |
||||
Our combined Legal Professionals, Corporates and Tax, Audit & Accounting Professionals segments. All measures reported for the “Big 3” segments are non-IFRS financial measures. |
|
The “Big 3” segments comprise approximately 80% of revenues and represent the core of our business information service product offerings. |
|
Revenues Earnings from continuing operations |
|
|
|
|
|
Page 70 |
Thomson Reuters Annual Report 2025 |
Appendix B
This appendix provides reconciliations of certain non-IFRS financial measures to the most directly comparable IFRS measures.
Rounding
Other than EPS, we report our results in millions of U.S. dollars, but we compute percentage changes and margins using whole dollars to be more precise. As a result, percentages and margins calculated from reported amounts may differ from those presented, and growth components may not total due to rounding.
Reconciliation of Earnings From Continuing Operations to Adjusted EBITDA and Adjusted EBITDA Less Accrued Capital Expenditures
|
Three months ended December 31, |
Year ended December 31, |
|
||||
(millions of U.S. dollars, except margins) |
|
2025 |
2024 |
2025 |
|
2024 |
|
Earnings from continuing operations |
|
333 |
607 |
1,483 |
|
2,192 |
|
Adjustments to remove: |
|
|
|
|
|
|
|
Tax expense (benefit) |
|
158 |
135 |
423 |
|
(123) |
|
Other finance costs (income) |
|
4 |
(53) |
55 |
|
(45) |
|
Net interest expense |
|
40 |
28 |
143 |
|
125 |
|
Amortization of other identifiable intangible |
|
25 |
22 |
98 |
|
91 |
|
Amortization of software |
|
187 |
160 |
721 |
|
618 |
|
Depreciation |
|
28 |
26 |
111 |
|
113 |
|
EBITDA |
|
775 |
925 |
3,034 |
|
2,971 |
|
Adjustments to remove: |
|
|
|
|
|
|
|
Share of post-tax losses (earnings) in equity |
|
5 |
5 |
28 |
|
(40) |
|
Other operating gains, net |
|
(2) |
(204) |
(164) |
|
(144) |
|
Fair value adjustments(1) |
|
(1) |
(8) |
38 |
|
(8) |
|
Adjusted EBITDA |
|
777 |
718 |
2,936 |
|
2,779 |
|
Deduct: Accrued capital expenditures |
|
(156) |
(172) |
(616) |
|
(609) |
|
Adjusted EBITDA less accrued capital |
|
621 |
546 |
2,320 |
|
2,170 |
|
Adjusted EBITDA margin |
|
38.7% |
37.6% |
39.2% |
|
38.2% |
|
Adjusted EBITDA less accrued capital |
|
31.0% |
28.6% |
31.0% |
|
29.9% |
|
Reconciliation of Capital Expenditures to Accrued Capital Expenditures
|
Three months ended December 31, |
Year ended December 31, |
|
|||
(millions of U.S. dollars) |
|
2025 |
2024 |
2025 |
2024 |
|
Capital expenditures |
|
158 |
161 |
634 |
607 |
|
Remove: IFRS adjustment to cash basis |
|
(2) |
11 |
(18) |
2 |
|
Accrued capital expenditures |
|
156 |
172 |
616 |
609 |
|
Accrued capital expenditures as a percentage of |
|
n/a |
n/a |
8.2% |
8.4% |
|
|
|
|
|
|
|
|
Thomson Reuters Annual Report 2025 |
Page 71 |
Reconciliation of Net Earnings to Adjusted Earnings and Adjusted EPS
|
Three months ended December 31, |
Year ended December 31, |
|
|||
(millions of U.S. dollars, except per share amounts and |
2025 |
2024 |
2025 |
2024 |
|
|
Net earnings |
|
332 |
587 |
1,502 |
2,207 |
|
Adjustments to remove: |
|
|
|
|
|
|
Fair value adjustments(1) |
|
(1) |
(8) |
38 |
(8) |
|
Amortization of acquired software |
|
53 |
38 |
206 |
147 |
|
Amortization of other identifiable intangible assets |
|
25 |
22 |
98 |
91 |
|
Other operating gains, net |
|
(2) |
(204) |
(164) |
(144) |
|
Other finance costs (income) |
|
4 |
(53) |
55 |
(45) |
|
Share of post-tax losses (earnings) in equity |
|
5 |
5 |
28 |
(40) |
|
Tax on above items(2) |
|
(5) |
36 |
(35) |
(9) |
|
Tax items impacting comparability(2) |
|
66 |
5 |
57 |
(478) |
|
Loss (earnings) from discontinued operations, net |
|
1 |
20 |
(19) |
(15) |
|
Interim period effective tax rate normalization(2) |
|
2 |
7 |
- |
- |
|
Dividends declared on preference shares |
|
(1) |
(1) |
(4) |
(5) |
|
|
|
|
|
|
|
|
|
|
|
|
|
|
|
Adjusted earnings(3) |
|
479 |
454 |
1,762 |
1,701 |
|
Adjusted EPS(3) |
|
$1.07 |
$1.01 |
$3.92 |
$3.77 |
|
|
|
|
|
|
|
|
|
|
|
|
|
|
|
Diluted weighted-average common shares |
|
445.6 |
450.6 |
449.5 |
451.2 |
|
|
|
|
|
|
|
|
Reconciliation of Full-year Effective Tax Rate on Adjusted Earnings
|
|
Year ended December 31, |
|
||
(millions of U.S. dollars, except percentages) |
|
2025 |
|
2024 |
|
Adjusted earnings |
|
1,762 |
|
1,701 |
|
Plus: Dividends declared on preference shares |
|
4 |
|
5 |
|
Plus: Tax expense on adjusted earnings |
|
401 |
|
364 |
|
|
|
|
|
|
|
|
|
|
|
|
|
Pre-tax adjusted earnings |
|
2,167 |
|
2,070 |
|
|
|
|
|
|
|
|
|
|
|
|
|
IFRS tax expense |
|
423 |
|
(123) |
|
Remove tax related to: |
|
|
|
|
|
Amortization of acquired software |
|
46 |
|
33 |
|
Amortization of other identifiable intangible assets |
|
23 |
|
22 |
|
Share of post-tax losses (earnings) in equity method investments |
|
2 |
|
(7) |
|
Other finance (costs) income |
|
2 |
|
19 |
|
Other operating gains, net |
|
(43) |
|
(56) |
|
Other items |
|
5 |
|
(2) |
|
|
|
|
|
|
|
|
|
|
|
|
|
Subtotal - Remove tax benefit on pre-tax items removed from adjusted earnings |
|
35 |
|
9 |
|
Remove: Tax items impacting comparability |
|
(57) |
|
478 |
|
|
|
|
|
|
|
|
|
|
|
|
|
Total - Remove all items impacting comparability |
|
(22) |
|
487 |
|
|
|
|
|
|
|
|
|
|
|
|
|
Tax expense on adjusted earnings |
|
401 |
|
364 |
|
Effective tax rate on adjusted earnings |
|
18.5% |
|
17.6% |
|
|
|
|
|
|
|
Page 72 |
Thomson Reuters Annual Report 2025 |
Reconciliation of Net Cash Provided by Operating Activities to Free Cash Flow
|
Three months ended December 31, |
Year ended December 31, |
|
|||
(millions of U.S. dollars) |
|
2025 |
2024 |
2025 |
2024 |
|
Net cash provided by operating activities |
|
756 |
564 |
2,651 |
2,457 |
|
Capital expenditures |
|
(158) |
(161) |
(634) |
(607) |
|
Other investing activities |
|
- |
40 |
1 |
46 |
|
Payments of lease principal |
|
(16) |
(17) |
(64) |
(63) |
|
Dividends paid on preference shares |
|
(1) |
(1) |
(4) |
(5) |
|
|
|
|
|
|
|
|
|
|
|
|
|
|
|
Free cash flow |
|
581 |
425 |
1,950 |
1,828 |
|
|
|
|
|
|
|
|
Reconciliation of Net debt and Leverage Ratio of Net Debt to Adjusted EBITDA
|
|
December 31, |
|
||
(millions of U.S. dollars) |
|
2025 |
|
2024 |
|
Current indebtedness |
|
795 |
|
973 |
|
Long-term indebtedness |
|
1,328 |
|
1,847 |
|
|
|
|
|
|
|
|
|
|
|
|
|
Total debt |
|
2,123 |
|
2,820 |
|
Swaps |
|
16 |
|
21 |
|
|
|
|
|
|
|
|
|
|
|
|
|
Total debt after swaps |
|
2,139 |
|
2,841 |
|
Remove fair value adjustments for hedges |
|
(2) |
|
5 |
|
|
|
|
|
|
|
|
|
|
|
|
|
Total debt after hedging arrangements |
|
2,137 |
|
2,846 |
|
Collateral assets |
|
(7) |
|
- |
|
Remove transaction costs, premiums or discounts, included in the carrying value of debt |
|
28 |
|
22 |
|
Add: Lease liabilities (current and non-current) |
|
249 |
|
256 |
|
Less: Cash and cash equivalents |
|
(511) |
|
(1,968) |
|
|
|
|
|
|
|
|
|
|
|
|
|
Net debt |
|
1,896 |
|
1,156 |
|
|
|
|
|
|
|
|
|
|
|
|
|
Leverage ratio of net debt to adjusted EBITDA |
|
|
|
|
|
Adjusted EBITDA |
|
2,936 |
|
2,779 |
|
Net debt/adjusted EBITDA |
|
0.6:1 |
|
0.4:1 |
|
|
|
|
|
|
|
Thomson Reuters Annual Report 2025 |
Page 73 |
Reconciliation of Changes in Revenues to Changes in Revenues Excluding the Effects of Foreign Currency (Constant Currency) as well as Acquisitions/Disposals (Organic Basis)
|
Three months ended December 31, |
||||||
|
|
|
Change |
||||
(millions of U.S. dollars) |
2025 |
2024 |
Total |
Foreign Currency |
Subtotal Constant Currency |
Acquisitions/ |
Organic |
Revenues |
|
|
|
|
|
|
|
Legal Professionals |
738 |
729 |
1% |
- |
1% |
(8%) |
9% |
Corporates |
496 |
458 |
8% |
1% |
7% |
(2%) |
9% |
Tax, Audit & Accounting Professionals |
414 |
366 |
13% |
- |
13% |
2% |
11% |
|
|
|
|
|
|
|
|
|
|
|
|
|
|
|
|
"Big 3" Segments Combined |
1,648 |
1,553 |
6% |
1% |
5% |
(4%) |
9% |
Reuters |
232 |
218 |
7% |
1% |
6% |
1% |
5% |
Global Print |
136 |
144 |
(6%) |
- |
(6%) |
- |
(6%) |
Eliminations/Rounding |
(7) |
(6) |
|
|
|
|
|
|
|
|
|
|
|
|
|
|
|
|
|
|
|
|
|
Total Revenues |
2,009 |
1,909 |
5% |
1% |
5% |
(3%) |
7% |
|
|
|
|
|
|
|
|
|
|
|
|
|
|
|
|
Recurring Revenues |
|
|
|
|
|
|
|
Legal Professionals |
716 |
707 |
1% |
- |
1% |
(7%) |
8% |
Corporates |
434 |
401 |
8% |
1% |
7% |
(2%) |
9% |
Tax, Audit & Accounting Professionals |
357 |
319 |
12% |
- |
12% |
- |
12% |
|
|
|
|
|
|
|
|
|
|
|
|
|
|
|
|
"Big 3" Segments Combined |
1,507 |
1,427 |
6% |
1% |
5% |
(4%) |
9% |
Reuters |
183 |
173 |
6% |
1% |
5% |
1% |
4% |
Eliminations/Rounding |
(7) |
(6) |
|
|
|
|
|
|
|
|
|
|
|
|
|
|
|
|
|
|
|
|
|
Total Recurring Revenues |
1,683 |
1,594 |
6% |
1% |
5% |
(4%) |
9% |
|
|
|
|
|
|
|
|
|
|
|
|
|
|
|
|
Transactions Revenues |
|
|
|
|
|
|
|
Legal Professionals |
22 |
22 |
- |
(1%) |
- |
(28%) |
28% |
Corporates |
62 |
57 |
9% |
2% |
7% |
- |
7% |
Tax, Audit & Accounting Professionals |
57 |
47 |
20% |
1% |
19% |
16% |
3% |
|
|
|
|
|
|
|
|
|
|
|
|
|
|
|
|
"Big 3" Segments Combined |
141 |
126 |
11% |
1% |
10% |
2% |
8% |
Reuters |
49 |
45 |
10% |
1% |
9% |
2% |
8% |
|
|
|
|
|
|
|
|
|
|
|
|
|
|
|
|
Total Transactions Revenues |
190 |
171 |
11% |
1% |
10% |
2% |
8% |
|
|
|
|
|
|
|
|
Page 74 |
Thomson Reuters Annual Report 2025 |
|
Year ended December 31, |
||||||
|
|
|
|
|
|
|
|
|
|
|
Change |
||||
|
|
|
|
|
Subtotal |
|
|
|
|
|
|
Foreign |
Constant |
Acquisitions/ |
|
(millions of U.S. dollars) |
2025 |
2024 |
Total |
Currency |
Currency |
Divestitures |
Organic |
Revenues |
|
|
|
|
|
|
|
Legal Professionals |
2,868 |
2,922 |
(2%) |
- |
(2%) |
(10%) |
8% |
Corporates |
1,987 |
1,844 |
8% |
- |
7% |
(1%) |
9% |
Tax, Audit & Accounting Professionals |
1,302 |
1,165 |
12% |
(1%) |
13% |
3% |
11% |
"Big 3" Segments Combined |
6,157 |
5,931 |
4% |
- |
4% |
(5%) |
9% |
Reuters |
853 |
832 |
3% |
1% |
2% |
1% |
1% |
Global Print |
490 |
519 |
(6%) |
- |
(5%) |
- |
(5%) |
Eliminations/Rounding |
(24) |
(24) |
|
|
|
|
|
Total Revenues |
7,476 |
7,258 |
3% |
- |
3% |
(4%) |
7% |
Recurring Revenues |
|
|
|
|
|
|
|
Legal Professionals |
2,789 |
2,828 |
(1%) |
- |
(1%) |
(10%) |
9% |
Corporates |
1,670 |
1,543 |
8% |
- |
8% |
(2%) |
9% |
Tax, Audit & Accounting Professionals |
937 |
867 |
8% |
(2%) |
10% |
(0%) |
10% |
"Big 3" Segments Combined |
5,396 |
5,238 |
3% |
- |
3% |
(6%) |
9% |
Reuters |
712 |
668 |
7% |
1% |
6% |
1% |
5% |
Eliminations/Rounding |
(24) |
(24) |
|
|
|
|
|
Total Recurring Revenues |
6,084 |
5,882 |
3% |
- |
3% |
(5%) |
9% |
Transactions Revenues |
|
|
|
|
|
|
|
Legal Professionals |
79 |
94 |
(16%) |
1% |
(17%) |
(21%) |
4% |
Corporates |
317 |
301 |
5% |
- |
5% |
- |
5% |
Tax, Audit & Accounting Professionals |
365 |
298 |
22% |
- |
23% |
10% |
12% |
"Big 3" Segments Combined |
761 |
693 |
10% |
- |
10% |
1% |
9% |
Reuters |
141 |
164 |
(14%) |
1% |
(15%) |
- |
(16%) |
Total Transactions Revenues |
902 |
857 |
5% |
- |
5% |
1% |
4% |
Thomson Reuters Annual Report 2025 |
Page 75 |
Reconciliation of Changes in Adjusted EBITDA and the Related Margin, Consolidated Operating Expenses and Adjusted EPS, Excluding the Effects of Foreign Currency
|
Three months ended December 31, |
|
|||||||||
|
|
|
|
|
Change |
|
|||||
(millions of U.S. dollars, except margins and per share |
|
2025 |
|
2024 |
|
Total |
|
Foreign |
|
Constant |
|
Adjusted EBITDA |
|
|
|
|
|
|
|
|
|
|
|
Legal Professionals |
|
327 |
|
299 |
|
9% |
|
- |
|
9% |
|
Corporates |
|
160 |
|
153 |
|
4% |
|
- |
|
4% |
|
Tax, Audit & Accounting Professionals |
|
222 |
|
196 |
|
14% |
|
1% |
|
13% |
|
"Big 3" Segments Combined |
|
709 |
|
648 |
|
9% |
|
- |
|
9% |
|
Reuters |
|
48 |
|
45 |
|
7% |
|
(5%) |
|
12% |
|
Global Print |
|
54 |
|
55 |
|
(2%) |
|
- |
|
(2%) |
|
Corporate costs |
|
(34) |
|
(30) |
|
n/a |
|
n/a |
|
n/a |
|
Total Adjusted EBITDA |
|
777 |
|
718 |
|
8% |
|
- |
|
8% |
|
Adjusted EBITDA Margin |
|
|
|
|
|
|
|
|
|
|
|
Legal Professionals |
|
44.3% |
|
41.0% |
|
330bp |
|
(20)bp |
|
350bp |
|
Corporates |
|
32.2% |
|
33.5% |
|
(130)bp |
|
(60)bp |
|
(70)bp |
|
Tax, Audit & Accounting Professionals |
|
53.6% |
|
53.4% |
|
20bp |
|
20bp |
|
- |
|
"Big 3" Segments Combined |
|
43.0% |
|
41.7% |
|
130bp |
|
(20)bp |
|
150bp |
|
Reuters |
|
21.0% |
|
20.8% |
|
20bp |
|
(120)bp |
|
140bp |
|
Global Print |
|
39.6% |
|
38.2% |
|
140bp |
|
(20)bp |
|
160bp |
|
Total Adjusted EBITDA Margin |
|
38.7% |
|
37.6% |
|
110bp |
|
(30)bp |
|
140bp |
|
Operating expenses |
|
1,231 |
|
1,183 |
|
4% |
|
2% |
|
2% |
|
Adjusted EPS |
|
$1.07 |
|
$1.01 |
|
6% |
|
(1%) |
|
7% |
|
|
|
Year ended December 31, |
|
||||||||
|
|
|
|
|
|
Change |
|
||||
(millions of U.S. dollars, except margins and per share |
|
2025 |
|
2024 |
|
Total |
|
Foreign |
|
Constant |
|
Adjusted EBITDA |
|
|
|
|
|
|
|
|
|
|
|
Legal Professionals |
|
1,356 |
|
1,302 |
|
4% |
|
1% |
|
3% |
|
Corporates |
|
716 |
|
671 |
|
7% |
|
- |
|
6% |
|
Tax, Audit & Accounting Professionals |
|
623 |
|
527 |
|
18% |
|
- |
|
19% |
|
"Big 3" Segments Combined |
|
2,695 |
|
2,500 |
|
8% |
|
- |
|
7% |
|
Reuters |
|
174 |
|
196 |
|
(11%) |
|
(1%) |
|
(11%) |
|
Global Print |
|
185 |
|
188 |
|
(2%) |
|
1% |
|
(2%) |
|
Corporate costs |
|
(118) |
|
(105) |
|
n/a |
|
n/a |
|
n/a |
|
Total Adjusted EBITDA |
|
2,936 |
|
2,779 |
|
6% |
|
- |
|
5% |
|
Adjusted EBITDA Margin |
|
|
|
|
|
|
|
|
|
|
|
Legal Professionals |
|
47.3% |
|
44.6% |
|
270bp |
|
20bp |
|
250bp |
|
Corporates |
|
36.0% |
|
36.3% |
|
(30)bp |
|
- |
|
(30)bp |
|
Tax, Audit & Accounting Professionals |
|
47.1% |
|
45.2% |
|
190bp |
|
40bp |
|
150bp |
|
"Big 3" Segments Combined |
|
43.6% |
|
42.1% |
|
150bp |
|
20bp |
|
130bp |
|
Reuters |
|
20.4% |
|
23.6% |
|
(320)bp |
|
(30)bp |
|
(290)bp |
|
Global Print |
|
37.7% |
|
36.2% |
|
150bp |
|
30bp |
|
120bp |
|
Total Adjusted EBITDA Margin |
|
39.2% |
|
38.2% |
|
100bp |
|
20bp |
|
80bp |
|
Operating expenses |
|
4,578 |
|
4,471 |
|
2% |
|
- |
|
2% |
|
Adjusted EPS |
|
$3.92 |
|
$3.77 |
|
4% |
|
- |
|
4% |
|
Page 76 |
Thomson Reuters Annual Report 2025 |
Reconciliation of Adjusted EBITDA Margin
To compute segment and consolidated adjusted EBITDA margin, we exclude fair value adjustments related to acquired deferred revenue from our IFRS revenues. The chart below reconciles IFRS revenues to revenues used in the calculation of adjusted EBITDA margin, which excludes fair value adjustments related to acquired deferred revenue.
(millions of U.S. dollars, except margins) |
IFRS |
|
Remove fair |
|
Revenues |
|
Adjusted |
|
Adjusted |
Three months ended December 31, 2025 |
|
|
|
|
|
|
|
|
|
Legal Professionals |
738 |
|
- |
|
738 |
|
327 |
|
44.3% |
Corporates |
496 |
|
- |
|
496 |
|
160 |
|
32.2% |
Tax, Audit & Accounting Professionals |
414 |
|
- |
|
414 |
|
222 |
|
53.6% |
"Big 3" Segments Combined |
1,648 |
|
- |
|
1,648 |
|
709 |
|
43.0% |
Reuters |
232 |
|
- |
|
232 |
|
48 |
|
21.0% |
Global Print |
136 |
|
- |
|
136 |
|
54 |
|
39.6% |
Eliminations/Rounding |
(7) |
|
- |
|
(7) |
|
– |
|
n/a |
Corporate costs |
– |
|
- |
|
– |
|
(34) |
|
n/a |
Consolidated totals |
2,009 |
|
- |
|
2,009 |
|
777 |
|
38.7% |
|
|
|
|
|
|
|
|
|
|
|
|
|
|
|
|
|
|
|
|
Year ended December 31, 2025 |
|
|
|
|
|
|
|
|
|
Legal Professionals |
2,868 |
|
- |
|
2,868 |
|
1,356 |
|
47.3% |
Corporates |
1,987 |
|
- |
|
1,987 |
|
716 |
|
36.0% |
Tax, Audit & Accounting Professionals |
1,302 |
|
20 |
|
1,322 |
|
623 |
|
47.1% |
"Big 3" Segments Combined |
6,157 |
|
20 |
|
6,177 |
|
2,695 |
|
43.6% |
Reuters |
853 |
|
- |
|
853 |
|
174 |
|
20.4% |
Global Print |
490 |
|
- |
|
490 |
|
185 |
|
37.7% |
Eliminations/Rounding |
(24) |
|
- |
|
(24) |
|
- |
|
n/a |
Corporate costs |
- |
|
- |
|
- |
|
(118) |
|
n/a |
Consolidated totals |
7,476 |
|
20 |
|
7,496 |
|
2,936 |
|
39.2% |
|
|
|
|
|
|
|
|
|
|
Three months ended December 31, 2024 |
|
|
|
|
|
|
|
|
|
Legal Professionals |
729 |
|
- |
|
729 |
|
299 |
|
41.0% |
Corporates |
458 |
|
1 |
|
459 |
|
153 |
|
33.5% |
Tax, Audit & Accounting Professionals |
366 |
|
- |
|
366 |
|
196 |
|
53.4% |
"Big 3" Segments Combined |
1,553 |
|
1 |
|
1,554 |
|
648 |
|
41.7% |
Reuters |
218 |
|
- |
|
218 |
|
45 |
|
20.8% |
Global Print |
144 |
|
- |
|
144 |
|
55 |
|
38.2% |
Eliminations/Rounding |
(6) |
|
- |
|
(6) |
|
- |
|
n/a |
Corporate costs |
- |
|
- |
|
- |
|
(30) |
|
n/a |
Consolidated totals |
1,909 |
|
1 |
|
1,910 |
|
718 |
|
37.6% |
|
|
|
|
|
|
|
|
|
|
Year ended December 31, 2024 |
|
|
|
|
|
|
|
|
|
Legal Professionals |
2,922 |
|
1 |
|
2,923 |
|
1,302 |
|
44.6% |
Corporates |
1,844 |
|
6 |
|
1,850 |
|
671 |
|
36.3% |
Tax, Audit & Accounting Professionals |
1,165 |
|
- |
|
1,165 |
|
527 |
|
45.2% |
"Big 3" Segments Combined |
5,931 |
|
7 |
|
5,938 |
|
2,500 |
|
42.1% |
Reuters |
832 |
|
2 |
|
834 |
|
196 |
|
23.6% |
Global Print |
519 |
|
- |
|
519 |
|
188 |
|
36.2% |
Eliminations/Rounding |
(24) |
|
- |
|
(24) |
|
- |
|
n/a |
Corporate costs |
- |
|
- |
|
- |
|
(105) |
|
n/a |
Consolidated totals |
7,258 |
|
9 |
|
7,267 |
|
2,779 |
|
38.2% |
Thomson Reuters Annual Report 2025 |
Page 77 |
Supplemental Financial Information (unaudited)
To reflect how we will manage our segments prospectively, we made a change to our segment reporting effective January 1, 2026. The supplemental schedules below provide revenues, adjusted EBITDA and the related margin as reported and as revised to reflect the transfer of certain customers and their related revenues and expenses among our Legal Professionals, Corporates and Tax, Audit & Accounting Professionals segments. The supplemental financial information below provides revised 2025 and 2024 full-year and 2025 quarterly business segment information on the same basis that we will report for 2026. These changes impact the financial results of our segments, but do not change our consolidated financial results.
|
Year ended December 31, 2025 |
|
Year ended December 31, 2024 |
||||
(millions of U.S. dollars, except for |
As Reported |
Adjustments |
As Revised |
|
As Reported |
Adjustments |
As Revised |
Revenues |
|
|
|
|
|
|
|
Legal Professionals |
2,868 |
(25) |
2,843 |
|
2,922 |
(20) |
2,902 |
Corporates |
1,987 |
36 |
2,023 |
|
1,844 |
31 |
1,875 |
Tax, Audit & Accounting Professionals |
1,302 |
(11) |
1,291 |
|
1,165 |
(11) |
1,154 |
“Big 3” Segments Combined |
6,157 |
- |
6,157 |
|
5,931 |
- |
5,931 |
Reuters |
853 |
- |
853 |
|
832 |
- |
832 |
Global Print |
490 |
- |
490 |
|
519 |
- |
519 |
Eliminations /Rounding |
(24) |
- |
(24) |
|
(24) |
- |
(24) |
Total Revenues |
7,476 |
- |
7,476 |
|
7,258 |
- |
7,258 |
|
|
|
|
|
|
|
|
Adjusted EBITDA |
|
|
|
|
|
|
|
Legal Professionals |
1,356 |
(2) |
1,354 |
|
1,302 |
1 |
1,303 |
Corporates |
716 |
11 |
727 |
|
671 |
7 |
678 |
Tax, Audit & Accounting Professionals |
623 |
(9) |
614 |
|
527 |
(8) |
519 |
“Big 3” Segments Combined |
2,695 |
- |
2,695 |
|
2,500 |
- |
2,500 |
Reuters |
174 |
- |
174 |
|
196 |
- |
196 |
Global Print |
185 |
- |
185 |
|
188 |
- |
188 |
Corporate costs |
(118) |
- |
(118) |
|
(105) |
- |
(105) |
Total Adjusted EBITDA |
2,936 |
- |
2,936 |
|
2,779 |
- |
2,779 |
|
|
|
|
|
|
|
|
Adjusted EBITDA Margin |
|
|
|
|
|
|
|
Legal Professionals |
47.3% |
0.3% |
47.6% |
|
44.6% |
0.3% |
44.9% |
Corporates |
36.0% |
(0.1%) |
35.9% |
|
36.3% |
(0.2%) |
36.1% |
Tax, Audit & Accounting Professionals |
47.1% |
(0.2%) |
46.9% |
|
45.2% |
(0.3%) |
44.9% |
“Big 3” Segments Combined |
43.6% |
- |
43.6% |
|
42.1% |
- |
42.1% |
Reuters |
20.4% |
- |
20.4% |
|
23.6% |
- |
23.6% |
Global Print |
37.7% |
- |
37.7% |
|
36.2% |
- |
36.2% |
Total Adjusted EBITDA Margin |
39.2% |
- |
39.2% |
|
38.2% |
- |
38.2% |
Reconciliations of revised adjusted EBITDA and the related margin non-IFRS measures to the most directly comparable IFRS measure are included in this appendix C.
Page 78 |
Thomson Reuters Annual Report 2025 |
|
2025 |
|||
(millions of U.S. dollars) |
First Quarter |
Second Quarter |
Third Quarter |
Fourth Quarter |
Revenues |
|
|
|
|
Legal Professionals |
688 |
704 |
721 |
730 |
Corporates |
548 |
480 |
489 |
506 |
Tax, Audit & Accounting Professionals |
358 |
274 |
247 |
412 |
“Big 3” Segments Combined |
1,594 |
1,458 |
1,457 |
1,648 |
Reuters |
196 |
218 |
207 |
232 |
Global Print |
116 |
114 |
124 |
136 |
Eliminations /Rounding |
(6) |
(5) |
(6) |
(7) |
Total Revenues |
1,900 |
1,785 |
1,782 |
2,009 |
|
|
|
|
|
Adjusted EBITDA |
|
|
|
|
Legal Professionals |
336 |
339 |
353 |
326 |
Corporates |
215 |
172 |
177 |
163 |
Tax, Audit & Accounting Professionals |
208 |
110 |
76 |
220 |
“Big 3” Segments Combined |
759 |
621 |
606 |
709 |
Reuters |
39 |
45 |
42 |
48 |
Global Print |
44 |
41 |
46 |
54 |
Corporate costs |
(33) |
(29) |
(22) |
(34) |
Total Adjusted EBITDA |
809 |
678 |
672 |
777 |
|
|
|
|
|
Adjusted EBITDA Margin |
|
|
|
|
Legal Professionals |
48.7% |
48.1% |
49.0% |
44.7% |
Corporates |
39.3% |
35.7% |
36.3% |
32.2% |
Tax, Audit & Accounting Professionals |
56.6% |
38.9% |
30.6% |
53.4% |
“Big 3” Segments Combined |
47.3% |
42.3% |
41.7% |
43.0% |
Reuters |
20.0% |
20.8% |
19.9% |
21.0% |
Global Print |
37.8% |
36.0% |
37.1% |
39.6% |
Total Adjusted EBITDA Margin |
42.3% |
37.8% |
37.7% |
38.7% |
|
2025 |
2024 |
||||
(millions of U.S. dollars) |
First |
Second |
Third |
Fourth |
Year ending December 31, |
Year ending December 31, |
Earnings from continuing operations |
425 |
297 |
428 |
333 |
1,483 |
2,192 |
Adjustments to remove: |
|
|
|
|
|
|
Tax expense (benefit) |
92 |
52 |
121 |
158 |
423 |
(123) |
Other finance costs (income) |
10 |
48 |
(7) |
4 |
55 |
(45) |
Net interest expense |
30 |
35 |
38 |
40 |
143 |
125 |
Amortization of other identifiable |
25 |
24 |
24 |
25 |
98 |
91 |
Amortization of software |
174 |
178 |
182 |
187 |
721 |
618 |
Depreciation |
27 |
28 |
28 |
28 |
111 |
113 |
EBITDA |
783 |
662 |
814 |
775 |
3,034 |
2,971 |
Adjustments to remove: |
|
|
|
|
|
|
Share of post-tax losses (gains) in |
6 |
4 |
13 |
5 |
28 |
(40) |
Other operating losses (gains), net |
3 |
(5) |
(160) |
(2) |
(164) |
(144) |
Fair value adjustments(1) |
17 |
17 |
5 |
(1) |
38 |
(8) |
Adjusted EBITDA |
809 |
678 |
672 |
777 |
2,936 |
2,779 |
Thomson Reuters Annual Report 2025 |
Page 79 |
(millions of U.S. dollars, except margins) |
Revised IFRS |
Remove fair |
Revised revenues |
Revised Adjusted |
Revised Adjusted |
Year ended December 31, 2025 |
|
|
|
|
|
Legal Professionals |
2,843 |
- |
2,843 |
1,354 |
47.6% |
Corporates |
2,023 |
- |
2,023 |
727 |
35.9% |
Tax, Audit & Accounting Professionals |
1,291 |
20 |
1,311 |
614 |
46.9% |
"Big 3" Segments Combined |
6,157 |
20 |
6,177 |
2,695 |
43.6% |
Reuters |
853 |
- |
853 |
174 |
20.4% |
Global Print |
490 |
- |
490 |
185 |
37.7% |
Eliminations/Rounding |
(24) |
- |
(24) |
- |
n/a |
Corporate costs |
- |
- |
- |
(118) |
n/a |
Consolidated totals |
7,476 |
20 |
7,496 |
2,936 |
39.2% |
|
|
|
|
|
|
Year ended December 31, 2024 |
|
|
|
|
|
Legal Professionals |
2,902 |
1 |
2,903 |
1,303 |
44.9% |
Corporates |
1,875 |
6 |
1,881 |
678 |
36.1% |
Tax, Audit & Accounting Professionals |
1,154 |
- |
1,154 |
519 |
44.9% |
"Big 3" Segments Combined |
5,931 |
7 |
5,938 |
2,500 |
42.1% |
Reuters |
832 |
2 |
834 |
196 |
23.6% |
Global Print |
519 |
- |
519 |
188 |
36.2% |
Eliminations/Rounding |
(24) |
- |
(24) |
- |
n/a |
Corporate costs |
- |
- |
- |
(105) |
n/a |
Consolidated totals |
7,258 |
9 |
7,267 |
2,779 |
38.2% |
Page 80 |
Thomson Reuters Annual Report 2025 |
(millions of U.S. dollars, except margins) |
Revised IFRS |
Remove fair |
Revised Revenues |
Revised Adjusted |
Revised Adjusted |
Three months ended December 31, 2025 |
|
|
|
|
|
Legal Professionals |
730 |
- |
730 |
326 |
44.7% |
Corporates |
506 |
- |
506 |
163 |
32.2% |
Tax, Audit & Accounting Professionals |
412 |
- |
412 |
220 |
53.4% |
"Big 3" Segments Combined |
1,648 |
- |
1,648 |
709 |
43.0% |
Reuters |
232 |
- |
232 |
48 |
21.0% |
Global Print |
136 |
- |
136 |
54 |
39.6% |
Eliminations/Rounding |
(7) |
- |
(7) |
- |
n/a |
Corporate costs |
- |
- |
- |
(34) |
n/a |
Consolidated totals |
2,009 |
- |
2,009 |
777 |
38.7% |
|
|
|
|
|
|
Three months ended September 30, 2025 |
|
|
|
|
|
Legal Professionals |
721 |
- |
721 |
353 |
49.0% |
Corporates |
489 |
- |
489 |
177 |
36.3% |
Tax, Audit & Accounting Professionals |
247 |
- |
247 |
76 |
30.6% |
"Big 3" Segments Combined |
1,457 |
- |
1,457 |
606 |
41.7% |
Reuters |
207 |
- |
207 |
42 |
19.9% |
Global Print |
124 |
- |
124 |
46 |
37.1% |
Eliminations/Rounding |
(6) |
- |
(6) |
- |
n/a |
Corporate costs |
- |
- |
- |
(22) |
n/a |
Consolidated totals |
1,782 |
- |
1,782 |
672 |
37.7% |
|
|
|
|
|
|
Three months ended June 30, 2025 |
|
|
|
|
|
Legal Professionals |
704 |
- |
704 |
339 |
48.1% |
Corporates |
480 |
- |
480 |
172 |
35.7% |
Tax, Audit & Accounting Professionals |
274 |
10 |
284 |
110 |
38.9% |
"Big 3" Segments Combined |
1,458 |
10 |
1,468 |
621 |
42.3% |
Reuters |
218 |
- |
218 |
45 |
20.8% |
Global Print |
114 |
- |
114 |
41 |
36.0% |
Eliminations/Rounding |
(5) |
- |
(5) |
- |
n/a |
Corporate costs |
- |
- |
- |
(29) |
n/a |
Consolidated totals |
1,785 |
10 |
1,795 |
678 |
37.8% |
|
|
|
|
|
|
Three months ended March 31, 2025 |
|
|
|
|
|
Legal Professionals |
688 |
- |
688 |
336 |
48.7% |
Corporates |
548 |
- |
548 |
215 |
39.3% |
Tax, Audit & Accounting Professionals |
358 |
10 |
368 |
208 |
56.6% |
"Big 3" Segments Combined |
1,594 |
10 |
1,604 |
759 |
47.3% |
Reuters |
196 |
- |
196 |
39 |
20.0% |
Global Print |
116 |
- |
116 |
44 |
37.8% |
Eliminations/Rounding |
(6) |
- |
(6) |
- |
n/a |
Corporate costs |
- |
- |
- |
(33) |
n/a |
Consolidated totals |
1,900 |
10 |
1,910 |
809 |
42.3% |
|
|
|
|
|
|
Thomson Reuters Annual Report 2025 |
Page 81 |
Calculation of Return on Invested Capital (ROIC)
We calculate ROIC as adjusted operating profit after net taxes paid expressed as a percentage of the average invested capital during the period. Invested capital represents our net operating assets that contribute to, or arise from, our post-tax adjusted operating profit.
The following table provides the calculation of our ROIC for 2025 and 2024.
|
|
|
|
|
|
|
|
For the years ended and as of December 31, |
|
||
|
|
|
|
|
|
|
|
|
|
|
|
(millions of U.S. dollars) |
|
2025 |
|
2024 |
|
|
|
|
|
|
|
|
|
|
|
|
|
Calculation of adjusted operating profit after taxes |
|
|
|
|
|
Operating profit |
|
2,132 |
|
2,109 |
|
Adjustments to remove: |
|
|
|
|
|
Amortization of acquired software |
|
206 |
|
147 |
|
Amortization of other identifiable intangible assets |
|
98 |
|
91 |
|
Fair value adjustments |
|
38 |
|
(8) |
|
Other operating gains, net |
|
(164) |
|
(144) |
|
|
|
|
|
|
|
|
|
|
|
|
|
Adjusted operating profit – continuing operations |
|
2,310 |
|
2,195 |
|
Net cash taxes paid on continuing operations |
|
(275) |
|
(234) |
|
|
|
|
|
|
|
|
|
|
|
|
|
Post-tax adjusted operating profit - continuing operations |
|
2,035 |
|
1,961 |
|
Post-tax adjusted operating loss - discontinued operations(1) |
|
(4) |
|
(4) |
|
|
|
|
|
|
|
|
|
|
|
|
|
Consolidated post-tax adjusted operating profit |
|
2,031 |
|
1,957 |
|
|
|
|
|
|
|
|
|
|
|
|
|
Calculation of invested capital |
|
|
|
|
|
Trade and other receivables |
|
1,143 |
|
1,087 |
|
Prepaid expenses and other current assets |
|
480 |
|
400 |
|
Property and equipment, net |
|
361 |
|
386 |
|
Software (excludes accumulated amortization of acquired software)(2) |
|
2,271 |
|
1,857 |
|
Other identifiable intangible assets (excludes accumulated amortization) |
|
6,063 |
|
5,957 |
|
Goodwill(3) |
|
6,770 |
|
6,195 |
|
Payables, accruals and provisions |
|
(1,090) |
|
(1,091) |
|
Current tax liabilities |
|
(224) |
|
(197) |
|
Deferred revenue |
|
(1,251) |
|
(1,062) |
|
|
|
|
|
|
|
|
|
|
|
|
|
Total invested capital(4) |
|
14,523 |
|
13,532 |
|
|
|
|
|
|
|
|
|
|
|
|
|
Average invested capital |
|
14,028 |
|
13,151 |
|
Return on invested capital |
|
14.5% |
|
14.9% |
|
|
|
|
|
|
|
ROIC decreased to 14.5% in 2025 from 14.9% in 2024 primarily due to the impact from acquisitions.
We measure our ROIC to assess, over the long term, our ability to create value for our shareholders. Our goal is to increase this return over the long term by using our capital to invest in areas with high returns and realizing operating efficiencies to further enhance our profitability.
Page 82 |
Thomson Reuters Annual Report 2025 |
Critical Accounting Estimates and Judgments
The preparation of financial statements requires management to make estimates and judgments about the future. Estimates and judgments are continually evaluated and are based on historical experience and other factors, including expectations of future events that are believed to be reasonable under the circumstances. Accounting estimates will, by definition, seldom equal the actual results.
We continue to operate in an uncertain macroeconomic environment, reflecting ongoing geopolitical risk, uneven economic growth, and an evolving interest rate and inflationary backdrop, among other factors. While we are closely monitoring these conditions to assess potential impacts on our businesses, some of management’s estimates and judgments may be more variable and may change materially in the future due to the significant uncertainty created by these circumstances.
The following discussion sets forth management’s:
Critical accounting estimates and assumptions
Software
Software represented $1,645 million of total assets in the consolidated statement of financial position as of December 31, 2025, and included internally developed software as well as software acquired in business combinations.
Most expenditures for internally developed software relate to product development and enhancements. Management exercises judgment in determining the development activities that meet capitalization criteria. Software acquired through business combinations is recorded at fair value, which is estimated at the acquisition date, based on, among other factors, cash flow projections from the use or sale of the asset, the weighted-average cost of capital and the remaining useful life, all of which require judgment.
For all software, management must estimate the expected period of benefit over which amounts recognized as assets should be amortized. The basis of these estimates includes the timing of technological obsolescence, economic and competitive pressures, historical experience and internal business plans for the use of the software. Due to rapidly changing technology and the uncertainty of the software development process itself, future results could be affected if management’s current assessment differs from actual performance.
Other identifiable intangible assets and goodwill
Other identifiable intangible assets and goodwill represented $3,102 million and $7,913 million, respectively, of total assets in the consolidated statement of financial position as of December 31, 2025. Other identifiable intangible assets and goodwill arise out of business combinations. Business combinations are accounted for under the acquisition method of accounting, which requires us to identify and attribute values to the intangible assets acquired based on their estimated fair value as well as to estimate their useful lives. These determinations involve significant estimates and assumptions regarding cash flow projections, economic risk and weighted-average cost of capital. The excess of acquisition cost over the fair value of identifiable net assets acquired is recorded as goodwill.
Subsequent to acquisition, we test other identifiable intangible assets and goodwill for impairment as required. The outcome of these tests is highly dependent on our latest estimates and assumptions regarding cash flow projections, economic risk and weighted-average cost of capital. Specifically, cash flow projections could be impacted by deterioration in macroeconomic conditions, including potential impacts of regulation on customers, changes in customer buying patterns or competitive pressures. Our assumption of perpetual growth could be impacted by changes in long-term outlooks for global inflation. Additionally, the discount rate, tax rate and EBITDA multiples used in various impairment tests are based on those for comparable companies, which are driven by market conditions and prevailing tax laws.
If future events or results differ adversely from the estimates and assumptions made at acquisition or as part of subsequent impairment tests, we could record increased amortization or impairment charges in the future.
Thomson Reuters Annual Report 2025 |
Page 83 |
We performed our annual goodwill impairment test as of October 1, 2025. No goodwill impairment was recorded as the estimated fair value less costs of disposal of each cash-generating unit (CGU) exceeded their carrying values by a substantial amount. We performed the test for each CGU to which goodwill was allocated and monitored by management at the date of the test. The valuation techniques, significant assumptions and sensitivities applied in the goodwill impairment test are described below.
As allowed under IAS 36, Impairment of Assets, we did not re-estimate the recoverable value of these CGUs for the 2025 impairment test but rather carried forward the recoverable value from 2023 because management concluded that no events or changes in circumstances indicated that the carrying value of these CGUs might not be recoverable. The valuation techniques, significant assumptions and sensitivities described below relate to the recoverable values determined in the 2023 impairment test.
Valuation Techniques
The selection and application of valuation techniques and the determination of significant assumptions requires judgment. An impairment of goodwill occurs when the recoverable amount of a CGU is below the carrying value of the CGU. The recoverable amount is the higher of a CGU’s fair value less costs of disposal or its value in use. As with previous impairment tests, the recoverable value of each CGU was based on fair value less costs of disposal, using a weighted average of the income approach and market approach. IFRS 13, Fair Value Measurement, defines fair value as a market-based measurement rather than an entity-specific measurement. Therefore, the fair value of the CGU must be measured using the assumptions that market participants would use rather than those related specifically to us. To calculate market participant assumptions, publicly available data was gathered from companies operating in businesses similar to each CGU, which includes key competitors. As certain inputs to the valuation are not based on observable market data, the recoverable value of each CGU is categorized in Level 3 of the fair value measurement hierarchy.
Income approach
The income approach is predicated upon the value of the future cash flows that a business will generate. We used the discounted cash flow (DCF) method, which involves projecting cash flows and converting them into a present value equivalent through discounting. The discounting process uses a rate of return that is commensurate with the risk associated with the business and the time value of money. This approach requires assumptions about revenue growth rates, operating margins, capital expenditures, tax rates and discount rates.
Market approach
The market approach assumes that companies operating in the same industry will share similar characteristics and that company values will correlate to those characteristics. Therefore, a comparison of a CGU to similar companies whose financial information is publicly available may provide a reasonable basis to estimate fair value. Under the market approach, fair value is calculated based on EBITDA multiples of benchmark companies comparable to the businesses in each CGU. Data for the benchmark companies was obtained from publicly available information.
Significant Assumptions
Weighting of Valuation Techniques
We weighted the results of the two valuation techniques noted above, consistently applied to each CGU, as follows: 60% income approach/40% market approach. We believe that given volatility in capital markets, it is appropriate to apply a heavier weighting to the income approach.
Cash Flow Projections
Cash flow projections were based on our internal forecasts. We projected cash flows for a period of three years and applied a perpetual growth rate thereafter, as prescribed by IAS 36. To project cash flows for the three-year period, we considered growth in revenues and costs as well as capital expenditures. In preparing our projections, we considered experience, economic trends such as GDP growth and inflation as well as industry and market trends. The projections also considered the expected impact from efficiency initiatives, new product launches, customer retention, as well as the maturity of the markets in which each business operates.
Page 84 |
Thomson Reuters Annual Report 2025 |
Discount Rate
We assumed a discount rate to calculate the present value of our projected cash flows. The discount rate represented a weighted-average cost of capital (WACC) for comparable companies operating in similar industries as the applicable CGU, based on publicly available information. The WACC is an estimate of the overall required rate of return on an investment for both debt and equity owners and serves as the basis for developing an appropriate discount rate. Determination of the WACC requires separate analysis of the cost of equity and the cost of debt. The cost of equity reflects the long-term risk-free interest rate associated with U.S. Treasury bonds and considers a risk premium based on an assessment of risks related to the projected cash flows of each CGU.
Lower discount rates were applied to CGUs whose cash flows are expected to be less volatile due to factors such as the maturity of the market they serve and their market position. Higher discount rates were applied to CGUs whose cash flows are expected to be more volatile due to competition or participation in less stable geographic markets.
Tax Rate
The tax rates applied to the projections were based on effective tax rates of comparable companies operating in similar industries as the applicable CGU, based on publicly available information or statutory tax rates. Tax assumptions are sensitive to changes in tax laws and the jurisdictions in which profits are earned.
The key assumptions used in performing the impairment test, by CGU, are presented below:
Cash-Generating Unit |
|
Perpetual growth rate(1) |
|
Discount rate |
|
Tax rate |
|
|
|
|
|
|
|
|
|
Legal Professionals |
|
2.5% |
|
11.0% |
|
26.6% |
|
Corporates |
|
2.5% |
|
11.0% |
|
26.8% |
|
Tax, Audit & Accounting Professionals |
|
3.0% |
|
11.5% |
|
27.6% |
|
Reuters |
|
2.5% |
|
13.0% |
|
25.0% |
|
Global Print |
|
(5.5%) |
|
11.5% |
|
26.8% |
|
|
|
|
|
|
|
|
|
Results and Sensitivities
As the fair value for each CGU exceeded its carrying value by a substantial amount, the sensitivity analysis demonstrated that no reasonably possible change in the perpetual growth rate, discount rate or income tax assumptions would cause the carrying amounts of any CGU to exceed its recoverable amount.
Employee future benefits
We sponsor defined benefit plans providing pension and other post-employment benefits to covered employees. Our most significant defined benefit plans no longer accrue benefits to active employees. The determination of benefit costs associated with employee future benefits requires assumptions such as the discount rate, which is used to measure benefit plan obligations and the net interest income (expense) on the net benefit plan assets (obligations). Other significant assumptions include expected mortality and the expected rate of increase with respect to certain future pension payments. For retiree medical benefits in the U.S., we provide a fixed subsidy to plan participants that may be used to purchase healthcare insurance on the individual marketplace. This plan design eliminates the need for management to estimate healthcare cost inflation trends and claims frequency.
Because the determination of the cost and obligations associated with employee future benefits requires the use of various assumptions, there is measurement uncertainty inherent in the actuarial valuation process. Actual results will differ from results which are estimated based on assumptions.
Discount rate
The discount rate was based on current market interest rates of high-quality, fixed-rate debt securities adjusted to reflect the duration of expected future cash outflows for pension benefit payments. To estimate the discount rate, we used a hypothetical yield curve that represented yields on high quality zero-coupon bonds with durations that mirrored the expected payment stream of the benefit obligation. For the Thomson Reuters Group Pension Plan (TRGP) and The Thomson Corporation PLC Pension Scheme (TTC) plans combined, a 0.25% increase or decrease in the discount rate would have decreased or increased the defined benefit obligation by approximately $65 million as of December 31, 2025.
Thomson Reuters Annual Report 2025 |
Page 85 |
Rates of inflation and pension payments
The rate of inflation, which impacts increases in eligible U.K. pension payments, was determined by reference to consumer and retail price indices. For the TTC plan, a 0.25% increase or decrease in the rate of increase in pension payments would have increased or decreased the defined benefit obligation by approximately $11 million as of December 31, 2025.
Mortality assumptions
The mortality assumptions used to assess the defined benefit obligation as of December 31, 2025 are based on the following:
For the TRGP and the TTC plans combined, an increase in life expectancy of one year across all age groups would have increased the defined benefit obligation by approximately $53 million as of December 31, 2025.
Income taxes
We compute an income tax provision in each of the jurisdictions in which we operate. These income tax provisions include amounts that are based upon our estimates and assumptions regarding prices and values used to record intercompany transactions. Actual amounts of income tax expense only become final upon filing and acceptance of the tax return by the relevant authorities, which occurs after the issuance of the financial statements.
Additionally, estimation of income taxes includes evaluating the recoverability of deferred tax assets based on an assessment of the ability to use the underlying future tax deductions before they expire against future taxable income. The assessment is based upon existing tax laws and estimates of future taxable income. To the extent estimates differ from the final tax return, earnings would be affected in a subsequent period.
In interim periods, the income tax provision is based on estimates of full-year earnings by jurisdiction. The average annual effective income tax rates are re-estimated at each interim reporting date. To the extent that forecasts differ from actual results, adjustments are recorded in subsequent periods.
We have deferred tax assets in connection with the intercompany transfer of certain operations. The determination of these assets requires management to make significant estimates and assumptions about the fair value of the related operations. Critical estimates include, but are not limited to, internal revenue and expense forecasts and discount rates, while critical assumptions include those regarding macroeconomic conditions and prevailing tax laws. The discount rates used in the income method to reduce expected future cash flows to present value are derived from a weighted-average cost of capital analysis and are adjusted to reflect the inherent risks related to the cash flow. Although we believe our assumptions and estimates are reasonable and appropriate, they are based in part on historical experience and are inherently uncertain. Unanticipated events and circumstances may occur that could differ adversely from our assumptions and estimates, which could require the Company to reduce its deferred tax assets in future periods.
Our 2025 effective income tax rate on earnings from continuing operations was 22.2%. A 1% increase in the effective income tax rate would have increased 2025 income tax expense and decreased earnings from continuing operations by approximately $19 million. Our 2024 effective income tax rate on earnings from continuing operations was not meaningful due to the impact of the $468 million tax benefit discussed in the “Tax expense (benefit)” section within the “Results of Operations” section of this management’s discussion and analysis.
Page 86 |
Thomson Reuters Annual Report 2025 |
Critical judgments in applying accounting policies
Revenue recognition
To determine the appropriate revenue recognition for our products and services, management must assess whether multiple products and services in customer contracts are distinct performance obligations that should be accounted for separately, or whether they must be accounted for together. In making the determination, management considers, for example, whether we regularly sell a product or service separately, or whether the products or services are highly interrelated. Management must also determine the standalone selling price (SSP) for each distinct performance obligation. We typically have more than one SSP for individual products and services due to the stratification of our offerings by customer. As a result, management determines the SSP taking into consideration market conditions and other factors, including the value of our contracts, the product or service sold, the customer’s market, geographic location and the number and types of users in each contract. Finally, management must also estimate the period over which to amortize assets arising from incremental costs of obtaining a contract. As management estimates that this period corresponds to the period over which a customer benefits from existing technology in the underlying product or service, this judgment is closely linked with the determination of software amortization periods.
Uncertain tax positions
We are subject to taxation in numerous jurisdictions and we are routinely under audit by many different taxing authorities in the ordinary course of business. There are many transactions and calculations in the course of business for which the ultimate tax determination is uncertain, as taxing authorities may challenge some of our positions and propose adjustments or changes to our tax filings. As a result, we maintain provisions for uncertain tax positions that we believe appropriately reflect our risk. These provisions are made using our best estimates of the amount expected to be paid based on a qualitative assessment of all relevant factors. When appropriate, we perform an expected value calculation to determine our provisions. We review the adequacy of these provisions at the end of each reporting period and adjust them based on changing facts and circumstances. Due to the uncertainty associated with tax audits, it is possible that at some future date, liabilities resulting from such audits or related litigation could vary significantly from our provisions. Where the outcome of these tax-related matters is different from the amounts that were initially recorded, such differences will affect the tax provisions in the period in which such determination is made. As of December 31, 2025, we have recorded an aggregate provision of $303 million for uncertain tax positions (excluding interest) within our current and deferred tax accounts as appropriate, in the consolidated statement of financial position.
Deferred Tax Assets
Deferred tax assets are recognized to the extent it is probable that taxable profits will be available against which the deductible temporary differences can be utilized, and are reduced to the extent that it is not probable that sufficient taxable profits will be available to allow all or part of the asset to be recovered. In evaluating deferred tax assets, management must make judgments to assess the future taxable profits and likely outcomes of unresolved tax audits associated with the relevant jurisdictions. As of December 31, 2025, we had deferred tax assets of $1,806 million and unrecognized deferred tax assets of $654 million. See note 24 of our 2025 annual consolidated financial statements.
Thomson Reuters Annual Report 2025 |
Page 87 |
Selected Annual Information
The following table summarizes selected annual information for 2025, 2024 and 2023.
|
For the years ended and as of December 31, |
|
|||||
(millions of U.S. dollars, except per share amounts) |
|
2025 |
|
2024 |
|
2023 |
|
IFRS Consolidated Income Statement Data |
|
|
|
|
|
|
|
Revenues |
|
7,476 |
|
7,258 |
|
6,794 |
|
Operating profit |
|
2,132 |
|
2,109 |
|
2,332 |
|
Earnings from continuing operations |
|
1,483 |
|
2,192 |
|
2,646 |
|
Earnings from discontinued operations, net of tax |
|
19 |
|
15 |
|
49 |
|
Net earnings |
|
1,502 |
|
2,207 |
|
2,695 |
|
Earnings attributable to common shareholders |
|
1,502 |
|
2,210 |
|
2,695 |
|
Loss attributable to non-controlling interests |
|
- |
|
(3) |
|
– |
|
Basic earnings per share from continuing operations |
|
$3.29 |
|
$4.86 |
|
$5.70 |
|
Basic earnings per share from discontinued operations |
|
$0.05 |
|
$0.03 |
|
$0.11 |
|
Basic earnings per share |
|
$3.34 |
|
$4.89 |
|
$5.81 |
|
Diluted earnings per share from continuing operations |
|
$3.29 |
|
$4.85 |
|
$5.69 |
|
Diluted earnings per share from discontinued operations |
|
$0.04 |
|
$0.04 |
|
$0.11 |
|
Diluted earnings per share |
|
$3.33 |
|
$4.89 |
|
$5.80 |
|
IFRS Consolidated Statement of Financial Position Data: |
|
|
|
|
|
|
|
Total assets |
|
17,940 |
|
18,437 |
|
18,684 |
|
Total long-term financial liabilities(1) |
|
1,538 |
|
2,079 |
|
3,142 |
|
Dividend Data: |
|
|
|
|
|
|
|
Dividends per Thomson Reuters Corporation common share (US$) |
|
$2.38 |
|
$2.16 |
|
$1.96 |
|
Dividends per Thomson Reuters Corporation Series II preference share (C$) |
|
C$0.86 |
|
C$1.19 |
|
C$1.21 |
|
Revenues increased over the three-year period due to growth in recurring and transactions revenues, including acquisitions. These revenue increases were partially offset by the loss of revenues from disposals, primarily FindLaw in December 2024 and Elite June 2023. As most of our business is conducted in U.S. dollars, foreign currency had a minimal impact on our revenues over the three-year period.
Operating profit in each consecutive year reflected net impact of higher revenues and operating expenses, partially offset by higher amortization of software. In 2023, operating profit included higher other operating gains due to the gain on sale of a majority stake in Elite.
Earnings from continuing operations in 2024 reflected a $468 million tax benefit from the recognition of a deferred tax asset relating to tax legislation enacted in Canada, and 2023 included a significant increase in the value of our previously-held investment in LSEG, net of changes in the value of related foreign exchange contracts.
Earnings from discontinued operations, net of tax in all years were primarily comprised of gains arising on a receivable balance from LSEG relating to a tax indemnity. The gains were primarily due to changes in foreign exchange and interest rates.
Total assets decreased in 2025 compared to 2024 primarily due to lower cash and cash equivalents from the repayment of our C$1.4 billion (U.S. $999 million) 2.239% notes upon maturity. Total assets in 2024 did not significantly change compared to 2023.
Total long-term financial liabilities decreased each consecutive year due to the 2025 reclassification of our $500 million 3.35% notes due to mature in May of 2026 from long-term to current financial liabilities, and the reclassification of our C$1.4 billion (U.S. dollar $999 million) 2.239% notes from long-term to current financial liabilities in 2024. The 2.239% notes were repaid in May 2025 upon maturity.
Page 88 |
Thomson Reuters Annual Report 2025 |
Quarterly Information (unaudited)
The following table presents a summary of our consolidated operating results for the eight most recent quarters.
|
Quarters ended |
|||||||
|
|
|
|
|
|
|
|
|
(millions of U.S. dollars, except per share |
December 31, 2025 |
September 30, 2025 |
June 30, 2025 |
March 31, 2025 |
December 31, 2024 |
September 30, 2024 |
June 30, 2024 |
March 31, 2024 |
|
|
|
|
|
|
|
|
|
Revenues |
2,009 |
1,782 |
1,785 |
1,900 |
1,909 |
1,724 |
1,740 |
1,885 |
|
|
|
|
|
|
|
|
|
Operating profit |
540 |
593 |
436 |
563 |
722 |
415 |
415 |
557 |
|
|
|
|
|
|
|
|
|
Earnings from continuing operations |
333 |
428 |
297 |
425 |
607 |
277 |
844 |
464 |
|
|
|
|
|
|
|
|
|
(Loss) earnings from discontinued |
(1) |
(5) |
16 |
9 |
(20) |
24 |
(3) |
14 |
|
|
|
|
|
|
|
|
|
Net earnings |
332 |
423 |
313 |
434 |
587 |
301 |
841 |
478 |
|
|
|
|
|
|
|
|
|
Earnings (loss) attributable to |
|
|
|
|
|
|
|
|
|
|
|
|
|
|
|
|
|
Common shareholders |
332 |
423 |
313 |
434 |
587 |
301 |
841 |
481 |
|
|
|
|
|
|
|
|
|
Non-controlling interests |
- |
- |
- |
- |
- |
- |
- |
(3) |
|
|
|
|
|
|
|
|
|
Basic earnings (loss) per share |
|
|
|
|
|
|
|
|
|
|
|
|
|
|
|
|
|
From continuing operations |
$0.75 |
$0.95 |
$0.66 |
$0.94 |
$1.35 |
$0.61 |
$1.87 |
$1.03 |
|
|
|
|
|
|
|
|
|
From discontinued operations |
(0.01) |
(0.01) |
0.03 |
0.02 |
(0.05) |
0.06 |
(0.01) |
0.03 |
|
|
|
|
|
|
|
|
|
|
$0.74 |
$0.94 |
$0.69 |
$0.96 |
$1.30 |
$0.67 |
$1.86 |
$1.06 |
|
|
|
|
|
|
|
|
|
Diluted earnings (loss) per share |
|
|
|
|
|
|
|
|
|
|
|
|
|
|
|
|
|
From continuing operations |
$0.75 |
$0.95 |
$0.66 |
$0.94 |
$1.34 |
$0.61 |
$1.87 |
$1.03 |
|
|
|
|
|
|
|
|
|
From discontinued operations |
(0.01) |
(0.01) |
0.03 |
0.02 |
(0.04) |
0.06 |
(0.01) |
0.03 |
|
|
|
|
|
|
|
|
|
|
$0.74 |
$0.94 |
$0.69 |
$0.96 |
$1.30 |
$0.67 |
$1.86 |
$1.06 |
|
|
|
|
|
|
|
|
|
Revenues – Our company revenues do not tend to be significantly impacted by seasonality as we record a large portion of our revenues ratably over a contract term. However, at the segment level, revenues on a consecutive quarter basis can be impacted by seasonality, most notably in our Tax, Audit & Accounting Professionals business, where revenues tend to be concentrated in the first and fourth quarters. As most of our business is conducted in U.S. dollars, foreign currency had a minimal impact on our revenues. Our first-quarter 2025 and fourth quarter 2024 revenues reflected growth in recurring revenues and the remaining comparable quarters reflected growth in both recurring and transactions revenues, including acquisitions. These revenue increases were partly offset by disposals, primarily FindLaw in December 2024.
Operating profit – Our operating profit does not tend to be significantly impacted by seasonality. As most of our operating expenses are fixed over the short-to-medium term, we generally become more profitable when our revenues increase. When our revenues decline, we generally become less profitable. The increase in operating profit in third quarter of 2025 reflected an other operating gain on the sale of our remaining minority equity interest in the Elite business and the fourth quarter of 2024 reflected the gains on sales of FindLaw and other non-core businesses.
Net earnings – Net earnings in the third quarter of 2025 reflected a gain on sale of our remaining equity interest in Elite, and the fourth quarter of 2024 included a gain on sale of FindLaw. The second quarter of 2024 included a $468 million tax benefit from the recognition of a deferred tax asset relating to tax legislation enacted in Canada.
Thomson Reuters Annual Report 2025 |
Page 89 |
Subsidiary Issuer and Guarantor Supplemental Financial Information
The following tables set forth consolidating summary financial information in connection with the full and unconditional guarantee by Thomson Reuters Corporation and three U.S. subsidiary guarantors, which are also indirect 100%-owned and consolidated subsidiaries of Thomson Reuters Corporation (referred to as the Subsidiary Guarantors), of any debt securities issued by TR Finance LLC (referred to as the Subsidiary Issuer) under a trust indenture dated as of March 20, 2025, entered into between Thomson Reuters Corporation, TR Finance LLC, the Subsidiary Guarantors, Computershare Trust Company of Canada and Deutsche Bank Trust Company Americas, and the full and unconditional guarantee by the Subsidiary Guarantors of certain outstanding debt securities issued by Thomson Reuters Corporation under a second amended and restated trust indenture dated as of March 20, 2025, entered into between Thomson Reuters Corporation, the Subsidiary Guarantors, Computershare Trust Company of Canada and Deutsche Bank Trust Company Americas, and any debt securities issued by Thomson Reuters Corporation under a trust indenture to be entered into between Thomson Reuters Corporation, the Subsidiary Guarantors, Computershare Trust Company of Canada and Deutsche Bank Trust Company Americas in connection with any future offering of debt securities issued by Thomson Reuters Corporation and guaranteed by the Subsidiary Guarantors. Guarantees by the Subsidiary Guarantors may be subject to customary release provisions in connection with a merger, consolidation or sale of assets.
TR Finance LLC is an indirect 100%-owned subsidiary of Thomson Reuters Corporation. TR Finance LLC is a financing vehicle for Thomson Reuters Corporation and its consolidated subsidiaries. TR Finance LLC has no independent operations, other than raising debt for use by Thomson Reuters, hedging such debt when appropriate and on-lending funds to companies in the Thomson Reuters group. In connection with each issuance of debt securities by TR Finance LLC to date, TR Finance LLC has loaned the proceeds thereof to, and in connection with each future issuance of debt securities by TR Finance LLC, TR Finance LLC expects that the proceeds thereof will be loaned to the Subsidiary Guarantors, and/or U.S. affiliates that are direct or indirect shareholders of the Subsidiary Guarantors. TR Finance LLC expects to be able to pay interest, premiums, operating expenses and to meet its debt obligations using interest income from the affiliate loans and will be further supported by guarantees provided by the Subsidiary Guarantors and Thomson Reuters Corporation. The ability of TR Finance LLC to pay interest, premiums, operating expenses and to meet its debt obligations depends upon the ability of the Subsidiary Guarantors and/or such other U.S. affiliates to pay interest and meet debt obligations under the affiliate loans and upon the credit support of the Subsidiary Guarantors and Thomson Reuters Corporation. See the “Liquidity and Capital Resources” section of this management’s discussion and analysis for additional information.
The tables below contain condensed consolidating financial information for the following:
The Subsidiary Guarantors referred to above are comprised of the following indirect 100%-owned and consolidated subsidiaries of Thomson Reuters Corporation:
Thomson Reuters Corporation accounts for its investments in subsidiaries using the equity method for purposes of the condensed consolidating financial information. Where subsidiaries are members of a consolidated tax filing group, Thomson Reuters Corporation allocates income tax expense pursuant to the tax sharing agreement among the members of the group, including application of the percentage method whereby members of the consolidated group are reimbursed for losses when they occur, regardless of the ability to use such losses on a standalone basis. We believe that this allocation is a systematic, rational approach for allocation of income tax balances. Adjustments necessary to consolidate the Parent, Subsidiary Guarantors and Non-Guarantor Subsidiaries are reflected in the “Eliminations” column.
Page 90 |
Thomson Reuters Annual Report 2025 |
This basis of presentation is not intended to present the financial position of Thomson Reuters Corporation and the results of its operations for any purpose other than to comply with the specific requirements for subsidiary issuer and guarantor reporting and should be read in conjunction with our consolidated financial statements for the year ended December 31, 2025 and 2024, as well as this management’s discussion and analysis, which are included in this annual report.
The following condensed consolidating financial information is provided in compliance with the requirements of Section 13.4 of National Instrument 51-102 - Continuous Disclosure Obligations providing for an exemption for certain credit support issuers.
The following condensed consolidating financial information has been prepared in accordance with IFRS, as issued by the IASB and is unaudited.
CONDENSED CONSOLIDATING INCOME STATEMENT
|
|
|
|
|
|
|
|
|
|
|
||
|
Year ended December 31, 2025 |
|
||||||||||
(millions of U.S. dollars) |
Parent |
|
Subsidiary |
|
Subsidiary |
|
Non- |
|
Eliminations |
|
Consolidated |
|
CONTINUING OPERATIONS |
|
|
|
|
|
|
|
|
|
|
|
|
Revenues |
- |
|
- |
|
1,365 |
|
6,389 |
|
(278) |
|
7,476 |
|
Operating expenses |
(16) |
|
- |
|
(881) |
|
(3,959) |
|
278 |
|
(4,578) |
|
Depreciation |
- |
|
- |
|
(30) |
|
(81) |
|
- |
|
(111) |
|
Amortization of software |
- |
|
- |
|
(40) |
|
(681) |
|
- |
|
(721) |
|
Amortization of other |
- |
|
- |
|
(43) |
|
(55) |
|
- |
|
(98) |
|
Other operating gains, net |
- |
|
- |
|
196 |
|
158 |
|
(190) |
|
164 |
|
Operating (loss) profit |
(16) |
|
- |
|
567 |
|
1,771 |
|
(190) |
|
2,132 |
|
Finance (costs) income, net: |
|
|
|
|
|
|
|
|
|
|
|
|
Net interest (expense) |
(42) |
|
(70) |
|
3 |
|
(35) |
|
1 |
|
(143) |
|
Other finance costs |
(37) |
|
(5) |
|
(2) |
|
(43) |
|
32 |
|
(55) |
|
Intercompany net interest |
98 |
|
70 |
|
(45) |
|
(123) |
|
- |
|
- |
|
Income (loss) before tax and |
3 |
|
(5) |
|
523 |
|
1,570 |
|
(157) |
|
1,934 |
|
Share of post-tax losses in |
- |
|
- |
|
- |
|
(28) |
|
- |
|
(28) |
|
Share of post-tax earnings in |
1,499 |
|
- |
|
194 |
|
407 |
|
(2,100) |
|
- |
|
Tax benefit (expense) |
- |
|
1 |
|
(116) |
|
(323) |
|
15 |
|
(423) |
|
Earnings (loss) from |
1,502 |
|
(4) |
|
601 |
|
1,626 |
|
(2,242) |
|
1,483 |
|
Earnings from discontinued |
- |
|
- |
|
- |
|
19 |
|
- |
|
19 |
|
Net earnings (loss) |
1,502 |
|
(4) |
|
601 |
|
1,645 |
|
(2,242) |
|
1,502 |
|
|
|
|
|
|
|
|
|
|
|
|
|
|
Earnings (loss) attributable to: |
|
|
|
|
|
|
|
|
|
|
|
|
Common shareholders |
1,502 |
|
(4) |
|
601 |
|
1,645 |
|
(2,242) |
|
1,502 |
|
Non-controlling interests |
- |
|
- |
|
- |
|
- |
|
- |
|
- |
|
|
|
|
|
|
|
|
|
|
|
|
|
|
Thomson Reuters Annual Report 2025 |
Page 91 |
CONDENSED CONSOLIDATING INCOME STATEMENT
|
|
|
|
|
|
|
|
|
|
|
|
||
|
|
Year ended December 31, 2024 |
|
||||||||||
|
|
|
|
|
|
|
|
|
|
|
|
|
|
|
|
|
|
|
|
|
|
|
|
|
|
|
|
(millions of U.S. dollars) |
|
Parent |
|
Subsidiary |
|
Subsidiary |
|
Non- |
|
Eliminations |
|
Consolidated |
|
|
|
|
|
|
|
|
|
|
|
|
|
|
|
|
|
|
|
|
|
|
|
|
|
|
|
|
|
CONTINUING OPERATIONS |
|
|
|
|
|
|
|
|
|
|
|
|
|
Revenues |
|
- |
|
- |
|
2,122 |
|
5,679 |
|
(543) |
|
7,258 |
|
Operating expenses |
|
(15) |
|
- |
|
(1,575) |
|
(3,424) |
|
543 |
|
(4,471) |
|
Depreciation |
|
- |
|
- |
|
(36) |
|
(77) |
|
- |
|
(113) |
|
Amortization of software |
|
- |
|
- |
|
(16) |
|
(602) |
|
- |
|
(618) |
|
Amortization of other identifiable |
|
- |
|
- |
|
(40) |
|
(51) |
|
- |
|
(91) |
|
Other operating (losses) gains, net |
|
(1) |
|
- |
|
56 |
|
89 |
|
- |
|
144 |
|
|
|
|
|
|
|
|
|
|
|
|
|
|
|
|
|
|
|
|
|
|
|
|
|
|
|
|
|
Operating (loss) profit |
|
(16) |
|
- |
|
511 |
|
1,614 |
|
- |
|
2,109 |
|
Finance (costs) income, net: |
|
|
|
|
|
|
|
|
|
|
|
|
|
Net interest (expense) income |
|
(137) |
|
- |
|
6 |
|
6 |
|
- |
|
(125) |
|
Other finance (costs) income |
|
(30) |
|
- |
|
1 |
|
74 |
|
- |
|
45 |
|
Intercompany net interest |
|
116 |
|
- |
|
(59) |
|
(57) |
|
- |
|
- |
|
|
|
|
|
|
|
|
|
|
|
|
|
|
|
|
|
|
|
|
|
|
|
|
|
|
|
|
|
(Loss) income before tax and |
|
(67) |
|
- |
|
459 |
|
1,637 |
|
- |
|
2,029 |
|
Share of post-tax earnings in |
|
- |
|
- |
|
- |
|
40 |
|
- |
|
40 |
|
Share of post-tax earnings |
|
2,034 |
|
- |
|
(2) |
|
340 |
|
(2,372) |
|
- |
|
Tax benefit (expense) |
|
240 |
|
- |
|
(119) |
|
2 |
|
- |
|
123 |
|
|
|
|
|
|
|
|
|
|
|
|
|
|
|
|
|
|
|
|
|
|
|
|
|
|
|
|
|
Earnings from continuing |
|
2,207 |
|
- |
|
338 |
|
2,019 |
|
(2,372) |
|
2,192 |
|
Earnings from discontinued |
|
- |
|
- |
|
- |
|
15 |
|
- |
|
15 |
|
|
|
|
|
|
|
|
|
|
|
|
|
|
|
|
|
|
|
|
|
|
|
|
|
|
|
|
|
Net earnings |
|
2,207 |
|
- |
|
338 |
|
2,034 |
|
(2,372) |
|
2,207 |
|
|
|
|
|
|
|
|
|
|
|
|
|
|
|
|
|
|
|
|
|
|
|
|
|
|
|
|
|
Earnings (loss) attributable to: |
|
|
|
|
|
|
|
|
|
|
|
|
|
Common shareholders |
|
2,207 |
|
- |
|
338 |
|
2,037 |
|
(2,372) |
|
2,210 |
|
Non-controlling interests |
|
- |
|
- |
|
- |
|
(3) |
|
- |
|
(3) |
|
|
|
|
|
|
|
|
|
|
|
|
|
|
|
Page 92 |
Thomson Reuters Annual Report 2025 |
CONDENSED CONSOLIDATING STATEMENT OF FINANCIAL POSITION
|
|
|
|
|
|
|
|
|
|
|
|
||
|
|
December 31, 2025 |
|
||||||||||
|
|
|
|
|
|
|
|
|
|
|
|
|
|
|
|
|
|
|
|
|
|
|
|
|
|
|
|
(millions of U.S. dollars) |
|
Parent |
|
Subsidiary |
|
Subsidiary |
|
Non- |
|
Eliminations |
|
Consolidated |
|
|
|
|
|
|
|
|
|
|
|
|
|
|
|
|
|
|
|
|
|
|
|
|
|
|
|
|
|
ASSETS |
|
|
|
|
|
|
|
|
|
|
|
|
|
Cash and cash equivalents |
|
8 |
|
- |
|
65 |
|
438 |
|
- |
|
511 |
|
Trade and other receivables |
|
- |
|
- |
|
260 |
|
883 |
|
- |
|
1,143 |
|
Intercompany receivables |
|
1,145 |
|
454 |
|
493 |
|
1,540 |
|
(3,632) |
|
- |
|
Other financial assets |
|
- |
|
7 |
|
60 |
|
27 |
|
- |
|
94 |
|
Prepaid expenses and other |
|
- |
|
- |
|
199 |
|
281 |
|
- |
|
480 |
|
|
|
|
|
|
|
|
|
|
|
|
|
|
|
|
|
|
|
|
|
|
|
|
|
|
|
|
|
Current assets |
|
1,153 |
|
461 |
|
1,077 |
|
3,169 |
|
(3,632) |
|
2,228 |
|
Property and equipment, net |
|
- |
|
- |
|
138 |
|
223 |
|
- |
|
361 |
|
Software, net |
|
- |
|
- |
|
1 |
|
1,823 |
|
(179) |
|
1,645 |
|
Other identifiable intangible |
|
- |
|
- |
|
952 |
|
2,150 |
|
- |
|
3,102 |
|
Goodwill |
|
- |
|
- |
|
4,422 |
|
3,491 |
|
- |
|
7,913 |
|
Equity method investments |
|
- |
|
- |
|
- |
|
202 |
|
- |
|
202 |
|
Other financial assets |
|
163 |
|
- |
|
2 |
|
301 |
|
- |
|
466 |
|
Other non-current assets |
|
- |
|
- |
|
96 |
|
584 |
|
- |
|
680 |
|
Intercompany receivables |
|
- |
|
1,267 |
|
57 |
|
- |
|
(1,324) |
|
- |
|
Investments in subsidiaries |
|
12,044 |
|
- |
|
545 |
|
4,708 |
|
(17,297) |
|
- |
|
Deferred tax |
|
238 |
|
3 |
|
- |
|
1,081 |
|
21 |
|
1,343 |
|
|
|
|
|
|
|
|
|
|
|
|
|
|
|
|
|
|
|
|
|
|
|
|
|
|
|
|
|
Total assets |
|
13,598 |
|
1,731 |
|
7,290 |
|
17,732 |
|
(22,411) |
|
17,940 |
|
|
|
|
|
|
|
|
|
|
|
|
|
|
|
|
|
|
|
|
|
|
|
|
|
|
|
|
|
LIABILITIES AND EQUITY |
|
|
|
|
|
|
|
|
|
|
|
|
|
Liabilities |
|
|
|
|
|
|
|
|
|
|
|
|
|
Current indebtedness |
|
354 |
|
439 |
|
- |
|
- |
|
2 |
|
795 |
|
Payables, accruals and provisions |
|
35 |
|
18 |
|
262 |
|
775 |
|
- |
|
1,090 |
|
Current tax liabilities |
|
- |
|
- |
|
- |
|
224 |
|
- |
|
224 |
|
Deferred revenue |
|
- |
|
- |
|
284 |
|
967 |
|
- |
|
1,251 |
|
Intercompany payables |
|
1,172 |
|
17 |
|
362 |
|
2,081 |
|
(3,632) |
|
- |
|
Other financial liabilities |
|
- |
|
- |
|
14 |
|
94 |
|
- |
|
108 |
|
|
|
|
|
|
|
|
|
|
|
|
|
|
|
|
|
|
|
|
|
|
|
|
|
|
|
|
|
Current liabilities |
|
1,561 |
|
474 |
|
922 |
|
4,141 |
|
(3,630) |
|
3,468 |
|
Long-term indebtedness |
|
118 |
|
1,245 |
|
- |
|
- |
|
(35) |
|
1,328 |
|
Provisions and other non-current |
|
5 |
|
- |
|
4 |
|
647 |
|
- |
|
656 |
|
Other financial liabilities |
|
- |
|
16 |
|
70 |
|
124 |
|
- |
|
210 |
|
Intercompany payables |
|
- |
|
- |
|
778 |
|
546 |
|
(1,324) |
|
- |
|
Deferred tax |
|
- |
|
- |
|
263 |
|
96 |
|
5 |
|
364 |
|
|
|
|
|
|
|
|
|
|
|
|
|
|
|
|
|
|
|
|
|
|
|
|
|
|
|
|
|
Total liabilities |
|
1,684 |
|
1,735 |
|
2,037 |
|
5,554 |
|
(4,984) |
|
6,026 |
|
Equity |
|
|
|
|
|
|
|
|
|
|
|
|
|
Total equity |
|
11,914 |
|
(4) |
|
5,253 |
|
12,178 |
|
(17,427) |
|
11,914 |
|
|
|
|
|
|
|
|
|
|
|
|
|
|
|
|
|
|
|
|
|
|
|
|
|
|
|
|
|
Total liabilities and equity |
|
13,598 |
|
1,731 |
|
7,290 |
|
17,732 |
|
(22,411) |
|
17,940 |
|
|
|
|
|
|
|
|
|
|
|
|
|
|
|
Thomson Reuters Annual Report 2025 |
Page 93 |
CONDENSED CONSOLIDATING STATEMENT OF FINANCIAL POSITION
|
|
|
|
|
|
|
|
|
|
|
|
||
|
|
December 31, 2024 |
|
||||||||||
|
|
|
|
|
|
|
|
|
|
|
|
|
|
|
|
|
|
|
|
|
|
|
|
|
|
|
|
(millions of U.S. dollars) |
|
Parent |
|
Subsidiary |
|
Subsidiary |
|
Non- |
|
Eliminations |
|
Consolidated |
|
|
|
|
|
|
|
|
|
|
|
|
|
|
|
|
|
|
|
|
|
|
|
|
|
|
|
|
|
ASSETS |
|
|
|
|
|
|
|
|
|
|
|
|
|
Cash and cash equivalents |
|
14 |
|
- |
|
230 |
|
1,724 |
|
- |
|
1,968 |
|
Trade and other receivables |
|
- |
|
- |
|
257 |
|
830 |
|
- |
|
1,087 |
|
Intercompany receivables |
|
1,032 |
|
- |
|
505 |
|
1,674 |
|
(3,211) |
|
- |
|
Other financial assets |
|
- |
|
- |
|
23 |
|
12 |
|
- |
|
35 |
|
Prepaid expenses and other |
|
- |
|
- |
|
170 |
|
230 |
|
- |
|
400 |
|
|
|
|
|
|
|
|
|
|
|
|
|
|
|
|
|
|
|
|
|
|
|
|
|
|
|
|
|
Current assets |
|
1,046 |
|
- |
|
1,185 |
|
4,470 |
|
(3,211) |
|
3,490 |
|
Property and equipment, net |
|
- |
|
- |
|
158 |
|
228 |
|
- |
|
386 |
|
Software, net |
|
- |
|
- |
|
34 |
|
1,419 |
|
- |
|
1,453 |
|
Other identifiable intangible |
|
- |
|
- |
|
981 |
|
2,153 |
|
- |
|
3,134 |
|
Goodwill |
|
- |
|
- |
|
3,727 |
|
3,535 |
|
- |
|
7,262 |
|
Equity method investments |
|
- |
|
- |
|
- |
|
269 |
|
- |
|
269 |
|
Other financial assets |
|
82 |
|
- |
|
46 |
|
314 |
|
- |
|
442 |
|
Other non-current assets |
|
- |
|
- |
|
105 |
|
520 |
|
- |
|
625 |
|
Intercompany receivables |
|
160 |
|
- |
|
2 |
|
778 |
|
(940) |
|
- |
|
Investments in subsidiaries |
|
14,584 |
|
- |
|
465 |
|
4,041 |
|
(19,090) |
|
- |
|
Deferred tax |
|
243 |
|
- |
|
- |
|
1,133 |
|
- |
|
1,376 |
|
|
|
|
|
|
|
|
|
|
|
|
|
|
|
|
|
|
|
|
|
|
|
|
|
|
|
|
|
Total assets |
|
16,115 |
|
- |
|
6,703 |
|
18,860 |
|
(23,241) |
|
18,437 |
|
|
|
|
|
|
|
|
|
|
|
|
|
|
|
|
|
|
|
|
|
|
|
|
|
|
|
|
|
LIABILITIES AND EQUITY |
|
|
|
|
|
|
|
|
|
|
|
|
|
Liabilities |
|
|
|
|
|
|
|
|
|
|
|
|
|
Current indebtedness |
|
973 |
|
- |
|
- |
|
- |
|
- |
|
973 |
|
Payables, accruals and provisions |
|
52 |
|
- |
|
276 |
|
763 |
|
- |
|
1,091 |
|
Current tax liabilities |
|
- |
|
- |
|
- |
|
197 |
|
- |
|
197 |
|
Deferred revenue |
|
- |
|
- |
|
350 |
|
712 |
|
- |
|
1,062 |
|
Intercompany payables |
|
1,214 |
|
- |
|
461 |
|
1,536 |
|
(3,211) |
|
- |
|
Other financial liabilities |
|
20 |
|
- |
|
11 |
|
82 |
|
- |
|
113 |
|
|
|
|
|
|
|
|
|
|
|
|
|
|
|
|
|
|
|
|
|
|
|
|
|
|
|
|
|
Current liabilities |
|
2,259 |
|
- |
|
1,098 |
|
3,290 |
|
(3,211) |
|
3,436 |
|
Long-term indebtedness |
|
1,847 |
|
- |
|
- |
|
- |
|
- |
|
1,847 |
|
Provisions and other non-current |
|
3 |
|
- |
|
4 |
|
668 |
|
- |
|
675 |
|
Other financial liabilities |
|
- |
|
- |
|
80 |
|
152 |
|
- |
|
232 |
|
Intercompany payables |
|
- |
|
- |
|
778 |
|
162 |
|
(940) |
|
- |
|
Deferred tax |
|
- |
|
- |
|
237 |
|
4 |
|
- |
|
241 |
|
|
|
|
|
|
|
|
|
|
|
|
|
|
|
|
|
|
|
|
|
|
|
|
|
|
|
|
|
Total liabilities |
|
4,109 |
|
- |
|
2,197 |
|
4,276 |
|
(4,151) |
|
6,431 |
|
Equity |
|
|
|
|
|
|
|
|
|
|
|
|
|
Total equity |
|
12,006 |
|
- |
|
4,506 |
|
14,584 |
|
(19,090) |
|
12,006 |
|
|
|
|
|
|
|
|
|
|
|
|
|
|
|
|
|
|
|
|
|
|
|
|
|
|
|
|
|
Total liabilities and equity |
|
16,115 |
|
- |
|
6,703 |
|
18,860 |
|
(23,241) |
|
18,437 |
|
|
|
|
|
|
|
|
|
|
|
|
|
|
|
Page 94 |
Thomson Reuters Annual Report 2025 |
The following supplemental financial information is also being provided in accordance with Article 13 of Regulation S-X in respect of debt securities issued by the Subsidiary Issuer, which are fully and unconditionally guaranteed by the Parent and the Subsidiary Guarantors, and debt securities issued by the Parent, which are fully and unconditionally guaranteed by the Subsidiary Guarantors (in each case, as described above).
Set forth below is summarized financial information of the Parent, Subsidiary Issuer and Subsidiary Guarantors (collectively, the Obligor Group) and Parent and Subsidiary Guarantors (collectively, the Obligor Group excluding Subsidiary Issuer) as presented on a combined basis with intercompany balances and transactions between entities in the Obligor Group and Obligor Group excluding Subsidiary Issuer eliminated. Investments in and equity in earnings of the non-obligor group, which are not members of these groups and financial information of the non-obligor group have been excluded from the summarized financial information. In addition, the Obligor Group and the Obligor Group excluding Subsidiary Issuer’s amounts due to, amounts due from and transactions with each respective non-obligor group are presented below:
SUMMARIZED INCOME STATEMENT
|
Year ended December 31, 2025 |
|
(millions of U.S. dollars) |
Obligor Group |
Obligor Group excluding Subsidiary Issuer |
Revenues |
1,365 |
1,365 |
Operating profit(1) |
5,134 |
5,134 |
Earnings from continuing operations(1)(2) |
4,989 |
4,993 |
Net earnings |
4,989 |
4,993 |
Earnings attributable to common shareholders |
4,989 |
4,993 |
SUMMARIZED STATEMENT OF FINANCIAL POSITION
|
December 31, 2025 |
|
(millions of U.S. dollars) |
Obligor Group |
Obligor Group excluding Subsidiary Issuer |
Intercompany receivables from non-obligor group |
2,083 |
1,638 |
Current assets excluding intercompany receivables |
599 |
592 |
Total current assets |
2,682 |
2,230 |
Goodwill |
4,422 |
4,422 |
Intercompany receivables from non-obligor group |
546 |
57 |
Non-current assets excluding goodwill and intercompany receivables |
1,593 |
1,590 |
Total non-current assets |
6,561 |
6,069 |
|
|
|
Intercompany payables to non-obligor group |
1,542 |
1,534 |
Current liabilities excluding intercompany payables |
1,406 |
949 |
Total current liabilities |
2,948 |
2,483 |
Intercompany payables to non-obligor group |
- |
778 |
Non-current liabilities excluding intercompany payables |
1,721 |
460 |
Total non-current liabilities |
1,721 |
1,238 |
Thomson Reuters Annual Report 2025 |
Page 95 |

The management of Thomson Reuters Corporation (the “Company”) is responsible for the accompanying consolidated financial statements and other information included in this annual report. The financial statements have been prepared in conformity with International Financial Reporting Standards, as issued by the International Accounting Standards Board, using the best estimates and judgments of management, where appropriate. Information presented elsewhere in this annual report is consistent with that in the financial statements.
The Company’s board of directors is responsible for ensuring that management fulfills its responsibilities in respect of financial reporting and internal control. The Audit Committee of the board of directors meets periodically with management and the Company’s independent auditor to discuss auditing matters and financial reporting issues. In addition, the Audit Committee approves the interim consolidated financial statements and recommends to the board of directors the approval of the annual consolidated financial statements and the annual appointment of the independent auditor. The board of directors has approved the information contained in the accompanying consolidated financial statements.
/s/ Steve Hasker |
/s/ Michael Eastwood |
|
|
Steve Hasker President and Chief Executive Officer |
Michael Eastwood Chief Financial Officer |
|
|
March 5, 2026 |
|
Management is responsible for establishing and maintaining adequate internal control over financial reporting.
Internal control over financial reporting is a process that is designed to provide reasonable assurance regarding the reliability of financial reporting and the preparation of financial statements for external purposes in accordance with International Financial Reporting Standards (“IFRS”), as issued by the International Accounting Standards Board. Internal control over financial reporting includes those policies and procedures that (i) pertain to the maintenance of records that, in reasonable detail, accurately and fairly reflect the transactions and dispositions of the assets of Thomson Reuters Corporation (the “Company”); (ii) provide reasonable assurance that transactions are recorded as necessary to permit preparation of financial statements in accordance with IFRS, and that receipts and expenditures of the Company are being made only in accordance with authorizations of management and directors of the Company; and (iii) provide reasonable assurance regarding prevention or timely detection of unauthorized acquisition, use, or disposition of the Company’s assets that could have a material effect on the financial statements.
Because of its inherent limitations, internal control over financial reporting may not prevent or detect misstatements. Also, projections of any evaluation of effectiveness to future periods are subject to the risk that controls may become inadequate because of changes in conditions, or that the degree of compliance with the policies and procedures may deteriorate.
Management conducted an evaluation of the effectiveness of its system of internal control over financial reporting based on the framework and criteria established in Internal Control - Integrated Framework (2013) issued by the Committee of Sponsoring Organizations of the Treadway Commission. Based on this evaluation, management concluded that the Company’s internal control over financial reporting was effective as of December 31, 2025.
The effectiveness of the Company’s internal control over financial reporting as of December 31, 2025 has been audited by PricewaterhouseCoopers LLP, independent registered public accounting firm, as stated in its report which appears herein.
/s/ Steve Hasker |
/s/ Michael Eastwood |
|
|
Steve Hasker President and Chief Executive Officer |
Michael Eastwood Chief Financial Officer |
|
|
March 5, 2026 |
|
Page 96 |
Thomson Reuters Annual Report 2025 |
To the Board of Directors and Shareholders of Thomson Reuters Corporation
Opinions on the Financial Statements and Internal Control over Financial Reporting
We have audited the accompanying consolidated statement of financial position of Thomson Reuters Corporation and its subsidiaries (the “Company”) as of December 31, 2025 and 2024, and the related consolidated statements of income, of comprehensive income, of changes in equity and of cash flow for the years then ended, including the related notes (collectively referred to as the “consolidated financial statements”). We also have audited the Company’s internal control over financial reporting as of December 31, 2025, based on criteria established in Internal Control – Integrated Framework (2013) issued by the Committee of Sponsoring Organizations of the Treadway Commission (COSO).
In our opinion, the consolidated financial statements referred to above present fairly, in all material respects, the financial position of the Company as of December 31, 2025 and 2024, and the results of its operations and its cash flows for the years then ended in conformity with International Financial Reporting Standards as issued by the International Accounting Standards Board. Also in our opinion, the Company maintained, in all material respects, effective internal control over financial reporting as of December 31, 2025, based on criteria established in Internal Control - Integrated Framework (2013) issued by the COSO.
Basis for Opinions
The Company's management is responsible for these consolidated financial statements, for maintaining effective internal control over financial reporting, and for its assessment of the effectiveness of internal control over financial reporting, included in the accompanying Management’s Report on Internal Control over Financial Reporting. Our responsibility is to express opinions on the Company’s consolidated financial statements and on the Company's internal control over financial reporting based on our audits. We are a public accounting firm registered with the Public Company Accounting Oversight Board (United States) (PCAOB) and are required to be independent with respect to the Company in accordance with the U.S. federal securities laws and the applicable rules and regulations of the Securities and Exchange Commission and the PCAOB.
We conducted our audits in accordance with the standards of the PCAOB. Those standards require that we plan and perform the audits to obtain reasonable assurance about whether the consolidated financial statements are free of material misstatement, whether due to error or fraud, and whether effective internal control over financial reporting was maintained in all material respects.
Our audits of the consolidated financial statements included performing procedures to assess the risks of material misstatement of the consolidated financial statements, whether due to error or fraud, and performing procedures that respond to those risks. Such procedures included examining, on a test basis, evidence regarding the amounts and disclosures in the consolidated financial statements. Our audits also included evaluating the accounting principles used and significant estimates made by management, as well as evaluating the overall presentation of the consolidated financial statements. Our audit of internal control over financial reporting included obtaining an understanding of internal control over financial reporting, assessing the risk that a material weakness exists, and testing and evaluating the design and operating effectiveness of internal control based on the assessed risk. Our audits also included performing such other procedures as we considered necessary in the circumstances. We believe that our audits provide a reasonable basis for our opinions.
Definition and Limitations of Internal Control over Financial Reporting
A company’s internal control over financial reporting is a process designed to provide reasonable assurance regarding the reliability of financial reporting and the preparation of financial statements for external purposes in accordance with generally accepted accounting principles. A company’s internal control over financial reporting includes those policies and procedures that (i) pertain to the maintenance of records that, in reasonable detail, accurately and fairly reflect the transactions and dispositions of the assets of the company; (ii) provide reasonable assurance that transactions are recorded as necessary to permit preparation of financial statements in accordance with generally accepted accounting principles, and that receipts and expenditures of the company are being made only in accordance with authorizations of management and directors of the company; and (iii) provide reasonable assurance regarding prevention or timely detection of unauthorized acquisition, use, or disposition of the company’s assets that could have a material effect on the financial statements.
Because of its inherent limitations, internal control over financial reporting may not prevent or detect misstatements. Also, projections of any evaluation of effectiveness to future periods are subject to the risk that controls may become inadequate because of changes in conditions, or that the degree of compliance with the policies or procedures may deteriorate.
Thomson Reuters Annual Report 2025 |
Page 97 |
Critical Audit Matters
The critical audit matter communicated below is a matter arising from the current period audit of the consolidated financial statements that was communicated or required to be communicated to the audit committee and that (i) relates to accounts or disclosures that are material to the consolidated financial statements and (ii) involved our especially challenging, subjective, or complex judgments. The communication of critical audit matters does not alter in any way our opinion on the consolidated financial statements, taken as a whole, and we are not, by communicating the critical audit matter below, providing a separate opinion on the critical audit matter or on the accounts or disclosures to which it relates.
Uncertain Tax Positions
As described in Note 2 to the consolidated financial statements, the Company is subject to taxation in numerous jurisdictions and there are transactions within those jurisdictions for which the ultimate tax determination is uncertain. The Company maintains provisions for uncertain tax positions that it believes appropriately reflect its risk. These provisions are made using management’s best estimates of the amount expected to be paid based on a qualitative assessment of all relevant factors. When appropriate, management performs an expected value calculation to determine its provisions. Management reviews the adequacy of these provisions at the end of each reporting period and adjusts them based on changing facts and circumstances. The estimate of uncertain tax positions includes estimates and assumptions regarding prices and values used to record intercompany transactions. As of December 31, 2025, the Company has recorded an aggregate provision of $303 million for uncertain tax positions (excluding interest) within its current and deferred tax accounts.
The principal considerations for our determination that performing procedures relating to the Company’s uncertain tax positions is a critical audit matter are (i) the significant judgment by management when determining the liability for uncertain tax positions; (ii) a high degree of auditor judgment, subjectivity and effort in performing procedures and in evaluating audit evidence related to prices and values used to record intercompany transactions and the timely identification and accurate measurement of uncertain tax positions; and (iii) the audit effort involved the use of professionals with specialized skill and knowledge.
Addressing the matter involved performing procedures and evaluating audit evidence in connection with forming our overall opinion on the consolidated financial statements. These procedures included testing the effectiveness of controls relating to the identification, recognition, and measurement of the liability for uncertain tax positions and controls addressing completeness of the uncertain tax positions. These procedures also included, among others (i) testing the information used in the calculation of the liability for uncertain tax positions, including intercompany agreements, international and Canadian domestic filing positions, and the related final tax returns; (ii) testing the calculation of the liability for uncertain tax positions by jurisdiction, including management’s assessment of the technical merits of tax positions and estimates of the amount of tax benefit expected to be sustained; (iii) testing management’s assessment of the identification of uncertain tax positions and possible outcomes of selected uncertain tax positions; and (iv) evaluating the status and results of income tax audits with the relevant tax authorities. Professionals with specialized skill and knowledge were used to assist in (i) evaluating the completeness of the identification and possible outcomes of the uncertain tax positions, including evaluating the reasonableness of management’s assessment of whether tax positions are probable to be sustained and the amount of potential benefit to be realized; and (ii) the application of relevant tax laws.
/s/ PricewaterhouseCoopers LLP
New York, New York
March 5, 2026
We have served as the Company’s auditor since 2012.
Page 98 |
Thomson Reuters Annual Report 2025 |
THOMSON REUTERS CORPORATION |
|
|
|
|
|
CONSOLIDATED INCOME STATEMENT |
|
|
|
|
|
|
|
|
Year ended December 31, |
||
(millions of U.S. dollars, except per share amounts) |
Notes |
|
2025 |
|
2024 |
CONTINUING OPERATIONS |
|
|
|
|
|
Revenues |
3 |
|
|
||
Operating expenses |
5 |
|
( |
|
( |
Depreciation |
|
|
( |
|
( |
Amortization of software |
|
|
( |
|
( |
Amortization of other identifiable intangible assets |
|
|
( |
|
( |
Other operating gains, net |
6 |
|
|
||
Operating profit |
|
|
|
||
Finance costs, net: |
|
|
|
|
|
Net interest expense |
8 |
|
( |
|
( |
Other finance (costs) income |
8 |
|
( |
|
|
Income before tax and equity method investments |
|
|
|
||
Share of post-tax (losses) earnings in equity method investments |
9 |
|
( |
|
|
Tax (expense) benefit |
10 |
|
( |
|
|
Earnings from continuing operations |
|
|
|
||
Earnings from discontinued operations, net of tax |
11 |
|
|
||
Net earnings |
|
|
|
||
Earnings (loss) attributable to: |
|
|
|
|
|
Common shareholders |
|
|
|
||
Non-controlling interests |
|
|
|
( |
|
|
|
|
|
|
|
Earnings per share |
12 |
|
|
|
|
Basic earnings per share: |
|
|
|
|
|
From continuing operations |
|
|
$ |
|
$ |
From discontinued operations |
|
|
|
||
Basic earnings per share |
|
|
$ |
|
$ |
|
|
|
|
|
|
Diluted earnings per share: |
|
|
|
|
|
From continuing operations |
|
|
$ |
|
$ |
From discontinued operations |
|
|
|
||
Diluted earnings per share |
|
|
$ |
|
$ |
The related notes form an integral part of these consolidated financial statements.
Thomson Reuters Annual Report 2025 |
Page 99 |
THOMSON REUTERS CORPORATION |
|
|
|
|
|
CONSOLIDATED STATEMENT OF COMPREHENSIVE INCOME |
|
|
|
|
|
|
|
|
Year ended December 31, |
||
(millions of U.S. dollars) |
Notes |
|
2025 |
|
2024 |
Net earnings |
|
|
|
||
|
|
|
|
|
|
Other comprehensive income (loss) |
|
|
|
|
|
Items that have been or may be subsequently reclassified to net earnings: |
|
|
|
|
|
Cash flow hedges adjustments to net earnings |
20 |
|
( |
|
|
Cash flow hedges adjustments to equity |
20 |
|
|
( |
|
Related tax benefit (expense) on cash flow hedges adjustments to equity |
10 |
|
|
( |
|
Foreign currency translation adjustments to equity |
20 |
|
|
( |
|
|
|
|
|
( |
|
Items that will not be reclassified to net earnings: |
|
|
|
|
|
Fair value adjustments on financial assets |
20 |
|
|
||
Related tax expense on fair value adjustments on financial assets |
10 |
|
( |
|
( |
Remeasurement on defined benefit pension plans |
27 |
|
|
||
Related tax expense on remeasurement on defined benefit pension |
10 |
|
( |
|
( |
|
|
|
|
||
Other comprehensive income (loss) |
|
|
|
( |
|
Total comprehensive income |
|
|
|
||
|
|
|
|
|
|
Comprehensive income (loss) for the period attributable to: |
|
|
|
|
|
Common shareholders: |
|
|
|
|
|
Continuing operations |
|
|
|
||
Discontinued operations |
|
|
|
||
Non-controlling interests |
|
|
|
( |
|
Total comprehensive income |
|
|
|
||
The related notes form an integral part of these consolidated financial statements.
Page 100 |
Thomson Reuters Annual Report 2025 |
THOMSON REUTERS CORPORATION |
|
|
|
|
|
CONSOLIDATED STATEMENT OF FINANCIAL POSITION |
|
|
|
|
|
|
|
|
December 31, |
||
(millions of U.S. dollars) |
Notes |
|
2025 |
|
2024 |
ASSETS |
|
|
|
|
|
Cash and cash equivalents |
13 |
|
|
||
Trade and other receivables |
14 |
|
|
||
Other financial assets |
20 |
|
|
||
Prepaid expenses and other current assets |
15 |
|
|
||
Current assets |
|
|
|
||
Property and equipment, net |
16 |
|
|
||
Software, net |
17 |
|
|
||
Other identifiable intangible assets, net |
18 |
|
|
||
Goodwill |
19 |
|
|
||
Equity method investments |
9 |
|
|
||
Other financial assets |
20 |
|
|
||
Other non-current assets |
21 |
|
|
||
Deferred tax |
24 |
|
|
||
Total assets |
|
|
|
||
|
|
|
|
|
|
LIABILITIES AND EQUITY |
|
|
|
|
|
Liabilities |
|
|
|
|
|
Current indebtedness |
20 |
|
|
||
Payables, accruals and provisions |
22 |
|
|
||
Current tax liabilities |
|
|
|
||
Deferred revenue |
3 |
|
|
||
Other financial liabilities |
20 |
|
|
||
Current liabilities |
|
|
|
||
Long-term indebtedness |
20 |
|
|
||
Provisions and other non-current liabilities |
23 |
|
|
||
Other financial liabilities |
20 |
|
|
||
Deferred tax |
24 |
|
|
||
Total liabilities |
|
|
|
||
Equity |
|
|
|
|
|
Capital |
25 |
|
|
||
Retained earnings |
|
|
|
||
Accumulated other comprehensive loss |
|
|
( |
|
( |
Total equity |
|
|
|
||
Total liabilities and equity |
|
|
|
||
Contingencies (note 31) |
|
|
|
|
|
The related notes form an integral part of these consolidated financial statements.
These consolidated financial statements were approved by the Company’s board of directors on March 4, 2026.
/s/ David Thomson |
/s/ Steve Hasker |
|
|
David Thomson |
Steve Hasker |
Director |
Director |
Thomson Reuters Annual Report 2025 |
Page 101 |
THOMSON REUTERS CORPORATION |
|
|
|
|
|
CONSOLIDATED STATEMENT OF CASH FLOW |
|
|
|
|
|
|
|
|
Year ended December 31, |
||
(millions of U.S. dollars) |
Notes |
|
2025 |
|
2024 |
Cash provided by (used in): |
|
|
|
|
|
OPERATING ACTIVITIES |
|
|
|
|
|
Earnings from continuing operations |
|
|
|
||
Adjustments for: |
|
|
|
|
|
Depreciation |
|
|
|
||
Amortization of software |
|
|
|
||
Amortization of other identifiable intangible assets |
|
|
|
||
Share of post-tax losses (earnings) in equity method investments |
9 |
|
|
( |
|
Net gains on disposals of businesses and investments |
6 |
|
( |
|
( |
Deferred tax |
24 |
|
|
( |
|
Other |
29 |
|
|
||
Changes in working capital and other items |
29 |
|
|
||
Operating cash flows from continuing operations |
|
|
|
||
Operating cash flows from discontinued operations |
|
|
|
( |
|
Net cash provided by operating activities |
|
|
|
||
INVESTING ACTIVITIES |
|
|
|
|
|
Acquisitions, net of cash acquired |
30 |
|
( |
|
( |
Proceeds related to disposals of businesses and investments |
7 |
|
|
||
Proceeds from sales of LSEG shares |
9 |
|
|
||
Capital expenditures |
|
|
( |
|
( |
Other investing activities |
|
|
|
||
Taxes paid on sales of LSEG shares and disposals |
|
|
( |
|
( |
Net cash (used in) provided by investing activities |
|
|
( |
|
|
FINANCING ACTIVITIES |
|
|
|
|
|
Repayments of debt |
20 |
|
( |
|
( |
Net borrowings (repayments) under short-term loan facilities |
20 |
|
|
( |
|
Payments of lease principal |
28 |
|
( |
|
( |
Repurchases of common shares |
25 |
|
( |
|
( |
Dividends paid on preference shares |
|
|
( |
|
( |
Dividends paid on common shares |
25 |
|
( |
|
( |
Purchase of non-controlling interests |
30 |
|
|
( |
|
Other financing activities |
|
|
( |
|
|
Net cash used in financing activities |
|
|
( |
|
( |
Translation adjustments |
|
|
|
( |
|
(Decrease) increase in cash and cash equivalents |
|
|
( |
|
|
Cash and cash equivalents at beginning of period |
|
|
|
||
Cash and cash equivalents at end of period |
13 |
|
|
||
Supplemental cash flow information is provided in note 29. |
|
|
|
|
|
Interest paid, net of debt-related hedges |
8 |
|
( |
|
( |
Interest received |
8 |
|
|
||
Income taxes paid |
29 |
|
( |
|
( |
Interest received and interest paid are reflected as operating cash flows.
Income taxes paid are reflected as either operating or investing cash flows depending on the nature of the underlying transaction.
The related notes form an integral part of these consolidated financial statements.
Page 102 |
Thomson Reuters Annual Report 2025 |
THOMSON REUTERS CORPORATION |
|
|
|
|
||||||
CONSOLIDATED STATEMENT OF CHANGES IN EQUITY |
|
|
||||||||
|
|
|
|
|
|
|
|
|
|
|
(millions of U.S. dollars) |
Stated share capital |
Contributed surplus |
Total capital |
Retained earnings |
Unrecognized gain (loss) on financial instruments |
Foreign currency translation adjustments |
Total accumulated other comprehensive loss (“AOCL”) |
Shareholders' equity |
Non-controlling interests |
Total equity |
Balance, December 31, 2024 |
( |
( |
- |
|||||||
Net earnings |
- |
- |
- |
- |
- |
- |
- |
|||
Other comprehensive income |
- |
- |
- |
- |
||||||
Total comprehensive income |
- |
- |
- |
- |
||||||
Transfer of gain on disposal of |
- |
- |
- |
( |
- |
( |
- |
- |
- |
|
Dividends declared on preference |
- |
- |
- |
( |
- |
- |
- |
( |
|
( |
Dividends declared on common |
- |
- |
- |
( |
- |
- |
- |
( |
- |
( |
Shares issued under Dividend |
- |
- |
- |
- |
- |
- |
||||
Repurchases of common shares |
( |
- |
( |
( |
- |
- |
- |
( |
- |
( |
Stock compensation plans |
( |
( |
- |
- |
- |
- |
||||
Balance, December 31, 2025 |
( |
( |
- |
|||||||
|
|
|
|
|
|
|
|
|
|
|
(millions of U.S. dollars) |
Stated share capital |
Contributed surplus |
Total capital |
Retained earnings |
Unrecognized gain (loss) on financial instruments |
Foreign currency translation adjustments |
AOCL |
Shareholders' equity |
Non-controlling interests |
Total equity |
Balance, December 31, 2023 |
( |
( |
- |
|||||||
Net earnings |
- |
- |
- |
- |
- |
- |
( |
|||
Other comprehensive income (loss) |
- |
- |
- |
- |
( |
( |
( |
( |
( |
|
Total comprehensive income (loss) |
- |
- |
- |
( |
( |
( |
||||
Non-controlling interests on |
- |
- |
- |
- |
- |
- |
- |
- |
||
Purchase of non-controlling |
- |
- |
- |
( |
- |
- |
- |
( |
( |
( |
Transfer of gain on disposal of |
- |
- |
- |
( |
- |
( |
- |
- |
- |
|
Dividends declared on preference |
- |
- |
- |
( |
- |
- |
- |
( |
- |
( |
Dividends declared on common |
- |
- |
- |
( |
- |
- |
- |
( |
- |
( |
Shares issued under DRIP |
- |
- |
- |
- |
- |
- |
||||
Repurchases of common shares |
( |
- |
( |
( |
- |
- |
- |
( |
- |
( |
Stock compensation plans |
( |
- |
- |
- |
- |
- |
||||
Balance, December 31, 2024 |
( |
( |
- |
|||||||
The related notes form an integral part of these consolidated financial statements.
Thomson Reuters Annual Report 2025 |
Page 103 |
Notes to Consolidated Financial Statements
(unless otherwise stated, all amounts are in millions of U.S. dollars)
Note 1: Summary of Business and Material Accounting Policies
General business description
Thomson Reuters Corporation is an Ontario, Canada corporation with common shares listed on the Toronto Stock Exchange (“TSX”) and on the U.S. stock exchange, Nasdaq Global Select Market (“Nasdaq”), under the ticker symbol “TRI” and its Series II preference shares are listed on the TSX.
Unless otherwise indicated or the context otherwise requires, references in these consolidated financial statements to the “Company” and “Thomson Reuters” are to Thomson Reuters Corporation and its subsidiaries.
The Company serves professionals across legal, tax, audit, accounting, compliance, government and media. The Company’s products combines highly specialized software and insights to empower professionals with the data, intelligence and solutions needed to make informed decisions, and to help institutions in their pursuit of justice, truth and transparency. Reuters, part of Thomson Reuters, is a world leading provider of trusted journalism and news.
These consolidated financial statements were approved by the Company’s board of directors on March 4, 2026.
Basis of preparation
These consolidated financial statements were prepared in accordance with International Financial Reporting Standards (“IFRS”), as issued by the International Accounting Standards Board (“IASB”), on a going concern basis, under the historical cost convention, as modified by the revaluation of financial assets and financial liabilities at fair value.
The preparation of financial statements in accordance with IFRS requires the use of certain critical accounting estimates. It also requires management to exercise judgment in applying the Company’s accounting policies. The areas involving more judgment or complexity, or areas where assumptions and estimates are significant to the consolidated financial statements are disclosed in note 2.
References to “$” are to U.S. dollars, references to “C$” are to Canadian dollars, references to “£” are to British pounds sterling, references to “€” are to Euros and references to SEK are to Swedish Kronor.
Changes in accounting policies
IAS 21, The Effect of Changes in Foreign Exchange Rates
In August 2023, the IASB issued amendments to IAS 21, which provide guidance on the determination of an exchange rate to translate transactions and financial statements denominated or presented in a currency that is not exchangeable into another currency. The amendments were effective for reporting periods beginning January 1, 2025 and did not have a material impact on the Company’s financial statements.
Principles of consolidation
The consolidated financial statements of the Company include the accounts of all its subsidiaries.
Subsidiaries
Subsidiaries are entities over which the Company has control, where control is defined as having power over the investee, exposure, or rights, to variable returns from involvement with the investee, and the ability to use the power over the investee to affect the amount of those returns. Generally, the Company has a shareholding of more than
The Company generally uses cash rather than equity to acquire subsidiaries and applies the acquisition method of accounting as follows:
Page 104 |
Thomson Reuters Annual Report 2025 |
Intercompany transactions between subsidiaries are eliminated in consolidation.
Non-controlling interests represent third party shareholdings in a subsidiary controlled by the Company. Non-controlling interests are measured at fair value on the date acquired plus their proportionate share of subsequent changes in equity. The purchase of the remaining ownership interests from third-party shareholders are recorded directly in equity and are presented in financing activities within the consolidated statement of cash flow.
Equity method investees
Equity method investees are entities over which the Company has significant influence, but not control. Generally, the Company has a shareholding of between
Upon loss of significant influence, any retained interest in the investee is remeasured to its fair value with the change in carrying amount recognized in other operating gains or losses in the consolidated income statement.
Operating segments
The Company’s operating segments are organized around the customers it serves and are reported in a manner consistent with the internal reporting provided to the chief operating decision-maker (“CODM”). The Chief Executive Officer has authority for resource allocation and assessment of the Company’s performance and is therefore the CODM.
The accounting policies applied by the segments are the same as those applied by the Company.
Foreign currency
The consolidated financial statements are presented in U.S. dollars, which is the Company's presentation currency. The financial statements of each of the Company's subsidiaries are measured using the currency of the primary economic environment in which the subsidiary operates (the “functional currency”).
Thomson Reuters Annual Report 2025 |
Page 105 |
Accumulated foreign exchange gains and losses are recycled from accumulated other comprehensive loss to “Other operating gains or losses, net” or to discontinued operations, as applicable, within the consolidated income statement upon loss of control or significant influence of the applicable entity, including foreign exchange amounts relating to settled intercompany loans that had previously been considered permanent.
Revenue recognition
Revenue is recognized when the promised goods or services are transferred to customers and the performance obligations are satisfied. This occurs when the Company transfers control of its products or services to a customer. Control transfers when the customer obtains access to use the product or receives the benefits of the Company's services. The amount of revenues recognized reflects the consideration to which the Company expects to be entitled. Such consideration is net of estimated returns, discounts, value-added and other sales taxes.
The Company derives its revenues from selling information, software solutions and services. Revenues are generally recognized as follows:
Recurring revenues
Recurring revenues are generally recognized on a ratable basis over the contract term. Recurring revenues primarily consist of fees to access products or services over time, such as Westlaw, Practical Law, CoCounsel and many of the Company’s tax compliance products. These products are generally provided under subscription arrangements, which most customers renew at the end of each subscription term. Most subscription arrangements have terms that range from
Transactions revenues
Transactions revenues, which includes the Company's Confirmation, SafeSend and SurePrep products, are recognized primarily at a point in time based on their type, as follows:
Transactions revenues may be billed in advance or in arrears.
Print revenues
The majority of print revenues, which includes the Company's printed products, as well as commercial printing services for third party book publishers, are recognized at the point of shipment, which is concurrent with billing. Print revenues that are sold under subscription agreements, which provide access to a library of print products as well as updates released during the subscription term, are generally recognized on a ratable basis over the contract term and may be billed in advance or in arrears.
Print revenues primarily consist of fees for content that is delivered primarily in traditional paper format.
The Company also considers the following when recognizing revenues:
Multiple performance obligations
Certain customer contracts include multiple products and services, which are accounted for as separate performance obligations when they are distinct. A product or service is distinct if a customer can benefit from it either on its own or with other readily available resources, and the promise to transfer the product or service is separately identifiable in the contract. The transaction price is allocated to the separate performance obligations based on the relative standalone selling price.
A series of distinct products or services is accounted for as a single performance obligation if the items in the series are substantially the same, have the same pattern of transfer and: (1) each distinct item in the series represents a performance obligation that would be satisfied over time, and (2) the measure to satisfy the performance obligation for each distinct item in the series is the same.
Certain arrangements include installation or implementation services. If these services are distinct, consideration is allocated to them and they are recognized as services are performed and included as transactions revenues. If the services are not distinct, they are recognized as part of the related subscription arrangement or as part of the related software license, as applicable.
Page 106 |
Thomson Reuters Annual Report 2025 |
Sales involving third parties
Revenues from sales of third-party content or services delivered on the Company’s platforms are recorded gross when the Company is a principal to the transaction, and net of costs when the Company is acting as an agent between the customer and the vendor. The Company considers several factors to determine whether it is acting as principal or an agent, most notably whether it is primarily responsible for (1) fulfilling the promise to provide the content or services, (2) setting the price, and (3) the credit risk for the amount billed to the customer.
Deferred revenue
Deferred revenue, a contract liability, is recorded when cash payments are received or due in advance of the transfer of the related products or services.
Contract costs
Incremental costs of obtaining a contract with a customer are deferred and recognized as an asset if the benefit of such costs is expected to be
The Company recognizes “Deferred commissions” short-term within “Prepaid expenses and other current assets” and “Deferred commissions” long-term within “Other non-current assets” in the consolidated statement of financial position.
The Company recognizes the incremental cost of obtaining a contract as an expense when incurred if the amortization period is
Employee future benefits
The net periodic pension expense of defined benefit pension plans and other post-employment benefits is actuarially determined on an annual basis using the projected unit credit method. Past service cost arising from plan amendments is recognized immediately in the consolidated income statement.
The asset or liability recognized in the consolidated statement of financial position is the present value of the defined benefit obligation at the end of the reporting period less the fair value of plan assets. The present value of the defined benefit obligation is determined by discounting the estimated future cash outflows using interest rates of high-quality corporate bonds that are denominated in the currency in which the benefits will be paid and that have terms to maturity approximating the terms of the related pension liability. All actuarial gains and losses that arise in calculating the present value of the defined benefit obligation and the fair value of plan assets are recognized immediately in retained earnings and included in the consolidated statement of comprehensive income. For funded plans, surpluses are recognized only to the extent that the surplus is considered recoverable. Recoverability is primarily based on the extent to which the Company can unilaterally reduce future contributions to the plan.
Payments to defined contribution plans are expensed as incurred.
Share-based compensation plans
The Company operates equity-settled share-based compensation plans under which it receives services from employees as consideration for equity instruments of the Company.
Share-based compensation expense is based on the grant date fair value of the awards expected to vest over the vesting period. The expense is recognized over the vesting period, which is the period over which the specified vesting conditions are satisfied. For awards with graded vesting, the fair value of each tranche is recognized over its respective vesting period. At the end of each reporting period, the Company reassesses its estimates of the number of awards that are expected to vest and recognizes the impact in the consolidated income statement.
Termination benefits
Termination benefits are generally payable when an employee is terminated before the normal retirement date. The associated charges are recognized when the Company can no longer withdraw the offer of termination benefits because it has communicated to the affected employees a termination plan that is unlikely to change, describing (a) the type and amount of benefits, (b) the number, job classifications or functions and locations of employees to be terminated and (c) the plan’s expected completion date.
Thomson Reuters Annual Report 2025 |
Page 107 |
Bonus plans
Liabilities for bonus plans are based on a formula that considers various financial metrics and certain adjustments. The Company recognizes an accrual where contractually obliged or where there is a past practice that has created a constructive obligation to make such compensation payments.
Cash and cash equivalents
Cash and cash equivalents comprise cash on hand, demand deposits and investments with a short maturity (generally,
Trade receivables
Trade receivables are amounts due from customers from providing services or the sale of products in the ordinary course of business, including billed and unbilled amounts. Trade receivables are recognized initially at fair value and subsequently measured at amortized cost, less impairment. Trade receivables are classified as current assets if payment is due within one year or less.
The Company maintains an allowance for expected credit losses to provide for impairment of trade receivables. The expense relating to expected credit losses is included within “Operating expenses” in the consolidated income statement. The Company also maintains an allowance for sales adjustments. Revenues are recorded net of sales adjustments.
The Company is exposed to normal credit risk with respect to its accounts receivable, and therefore maintains provisions for expected losses arising from non-payment and other sales adjustments. The Company estimates credit losses for trade receivables by aggregating similar customer types together, because they tend to share similar credit risk characteristics, taking into consideration the number of days the receivable is past due. Provision rates for the allowance for expected credit losses are based on historical credit loss experience and calibrated, based on management’s judgment, with forward looking information about a debtor’s ability to pay.
Financial assets
Purchases and sales of financial assets are recognized on the settlement date, which is the date the asset is delivered to or by the Company. Financial assets are derecognized when the rights to receive cash flows from the assets have expired or were transferred and the Company has transferred substantially all risks and rewards of ownership. Financial assets are classified in the following categories at the time of initial recognition based on the purpose for which the financial assets were acquired:
Financial assets at fair value through the consolidated income statement
This category includes assets acquired primarily for the purpose of selling in the short-term, such as financial assets held for trading, or when designated by management. Examples include money market accounts, a receivable under an indemnification arrangement, contingent receivables, as well as foreign exchange contracts not designated as hedges for accounting purposes.
The fair value measurement of other receivables considers credit risk of the counterparty.
Financial assets at amortized cost
This category includes cash as well as trade and other receivables, which represent non-derivative financial assets that are held for the purpose of collecting their contractually fixed or determinable payments.
Trade and other receivables are initially recognized at the transaction price and subsequently measured at amortized cost using the effective interest method. Allowances for expected credit losses provide for impairment of receivables.
Financial assets at fair value through other comprehensive income
These financial assets are non-derivatives that are irrevocably designated in this category. This category includes equity investments, which are not held-for-trading and do not qualify as associates accounted for under the equity method.
Page 108 |
Thomson Reuters Annual Report 2025 |
These financial instruments are initially recognized at fair value plus transaction costs and are subsequently carried at fair value with changes recognized in other comprehensive income or loss. The amounts recorded in accumulated other comprehensive income or loss are not subsequently recycled to the consolidated income statement, but rather are reclassified directly to retained earnings.
The fair value measurement of equity investments that are accounted for as other financial assets considers information such as pricing from equity funding rounds and quoted prices.
Offsetting financial instruments
Financial assets and liabilities are offset and reported net in the consolidated statement of financial position when there is a legally enforceable right to offset the recognized amounts and there is an intention to settle on a net basis or to simultaneously realize the asset and settle the liability. Bank overdrafts in cash pooling arrangements may only be netted against cash and cash equivalents when settlement occurs on or about the end of the reporting period.
Derivative financial instruments and hedging
Derivatives are initially recognized at fair value on the date a contract is entered into and are subsequently re-measured at their fair value. The method of recognizing the resulting gain or loss depends on whether the derivative is designated as a hedging instrument and the nature of the item being hedged.
At the inception of the transaction, the Company documents the relationship between hedging instruments and hedged items, as well as its risk management objectives and strategy for undertaking various hedging transactions. The Company also documents its assessment, both at hedge inception and on an ongoing basis, of whether the derivatives that are used in hedging transactions are highly effective in offsetting changes in fair values or cash flows of hedged items.
Non-performance risk, including the Company’s own credit risk, is considered when determining the fair value of financial instruments.
The Company designates certain derivatives as either:
These are hedges of the exposure to changes in fair value of a recognized asset or liability or unrecognized firm commitment. Changes in the fair value of derivatives that are designated as fair value hedges are recorded in the consolidated income statement together with any changes in the fair value of the hedged asset or liability that are attributable to the hedged risk.
These are hedges of the exposure to variability in cash flows of a recognized asset or liability or a highly probable forecast transaction. The effective portion of changes in the fair value of derivatives that are designated as a cash flow hedge is recognized in other comprehensive income or loss. The gain or loss relating to the ineffective portion is recognized immediately in the consolidated income statement. Additionally:
The fair value measurement of derivative instruments considers credit risk of the counterparty.
Derivatives that do not qualify for hedge accounting
Certain derivative instruments, while providing effective economic hedges, are not designated as hedges for accounting purposes. Changes in the fair value of derivatives that are not designated as hedges for accounting purposes are recognized within “Other finance (costs) income” in the consolidated income statement consistent with the underlying nature and purpose of the derivative instruments. Settlements from these instruments are classified within the cash flow line item where the economic hedge relationship exists in the consolidated statement of cash flow.
Thomson Reuters Annual Report 2025 |
Page 109 |
Property and equipment
Property and equipment are recorded at cost and depreciated on a straight-line basis over their estimated useful lives as follows:
|
|
|
Buildings and building improvements |
|
|
|
|
|
|
|
|
Computer equipment |
|
|
|
|
|
|
|
|
Furniture, fixtures and other equipment |
|
|
|
|
|
Right-of-use lease assets included in property and equipment are depreciated over the shorter of the asset’s estimated useful life as noted above or the lease term, on a straight-line basis. Residual values and useful lives are reviewed at the end of each reporting period and adjusted if appropriate. Fully depreciated assets are retained in cost and accumulated depreciation accounts until such assets are removed from service. Gains or losses on the disposal of property and equipment are included within “Operating profit” in the consolidated income statement and computed as the proceeds from disposal less the net book value of the related assets. The proceeds are presented as an investing activity in the consolidated statement of cash flow.
Intangible assets
Software
Certain costs incurred in the development of software to be used internally or for providing services to customers are capitalized once a project has progressed beyond a conceptual, preliminary stage to that of application development. Development costs that are directly attributable to the design and testing of identifiable and unique software products controlled by the Company are recognized as intangible assets when the following criteria are met:
Costs that qualify for capitalization include both internal and external costs but are limited to those that are directly related to the specific project. Software obtained from the acquisition of a business is recorded at fair value.
Software is amortized over its expected useful life, which ranges from
Cloud computing arrangements
In a cloud computing arrangement, the Company is granted a right to access software and other technology capabilities at a third-party provider through the internet. These arrangements typically do not allow the Company to acquire, take possession or control the underlying assets of the provider. Costs associated with cloud computing arrangements are generally expensed as incurred because they generally do not meet software capitalization criteria.
The Company capitalizes costs to develop software that is hosted in the public cloud when:
The Company capitalizes costs to migrate software from on-premise data centers to the public cloud when the software is either rebuilt specifically for the cloud or has been significantly optimized to run in a cloud environment.
Page 110 |
Thomson Reuters Annual Report 2025 |
Other identifiable intangible assets
Upon acquisition, identifiable intangible assets are recorded at fair value and are carried at cost less accumulated amortization.
|
|
|
Trade names |
|
|
|
|
|
|
|
|
Customer relationships |
|
|
|
|
|
|
|
|
Databases and content |
|
|
|
|
|
|
|
|
Other |
|
|
|
|
|
Useful lives are reviewed at the end of each reporting period and adjusted if appropriate.
Goodwill
Goodwill represents the excess of the cost of an acquisition over the fair value of the Company’s share of the identifiable net assets of the acquired subsidiary at the date of acquisition.
Impairment
When the recoverable amount of assets is less than their carrying amount, an impairment charge is recognized in the consolidated income statement. Impairment losses, other than those relating to goodwill, are evaluated for potential reversals when events or changes in circumstances warrant such consideration.
Goodwill and Intangible assets
The carrying values of all intangible assets and goodwill are reviewed for impairment whenever events or changes in circumstances indicate that their carrying amounts may not be recoverable and at the end of each reporting period for indicators of impairment. Goodwill and identifiable intangible assets with indefinite lives are not amortized, but tested annually for impairment. The recoverable amount is the higher of an asset’s fair value less costs of disposal or its value in use. For purposes of impairment testing:
Non-financial assets
The carrying value of a non-financial asset with a finite life, such as property and equipment and software, is assessed for impairment whenever events or changes in circumstances indicate that its carrying value may not be recoverable and at the end of each reporting period for indicators of impairment. The recoverable amount is the higher of an asset’s fair value less costs of disposal or its value in use. An asset is assessed for impairment at the lowest level that the asset generates cash inflows that are largely independent of cash inflows from other assets. The lowest level may be an individual asset or a group of assets that form a CGU.
Disposal of long-lived assets and discontinued operations
Long-lived assets are classified as held for sale if the carrying amount will be recovered principally through a sale transaction rather than through continued use and such sale is considered highly probable. The criteria for classification as held for sale include a firm decision by management or the board of directors to dispose of a business or a group of selected assets in its present condition, an active marketing plan, and the expectation that such disposal will be completed within a 12-month period. Assets held for sale are measured at the lower of their carrying amounts or their fair value less costs of disposal and are no longer depreciated. Gains and losses on the disposal of an entity include an allocation of goodwill. Assets held for sale are classified as discontinued operations if the operations and cash flows can be clearly distinguished operationally and for financial reporting purposes from the rest of the Company and they:
Thomson Reuters Annual Report 2025 |
Page 111 |
Trade payables and accruals
Trade payables and accruals are obligations to pay for goods or services that have been acquired in the ordinary course of business. Amounts are initially recognized at fair value and subsequently measured at amortized cost using the effective interest method. Trade payables and accruals are classified as current liabilities if payment is due within one year or less.
Provisions
Provisions represent liabilities of the Company for which the amount or timing is uncertain. Provisions are recognized when the Company has a present legal or constructive obligation due to past events, it is probable that an outflow of resources will be required to settle the obligation, and the amount can be reliably estimated. Provisions are not recognized for future operating losses. Provisions are measured at the present value of the expected expenditures to settle the obligation using a discount rate that reflects current market assessments of the time value of money and the risks specific to the obligation. The increase in the provision due to passage of time is recognized as interest expense.
Indebtedness
Debt is recognized initially at fair value, net of transaction costs. Debt is subsequently stated at amortized cost with any difference between the proceeds (net of transactions costs) and the redemption value recognized in the consolidated income statement over the term of the debt using the effective interest method. Where a debt instrument is in a fair value hedging relationship, a fair value adjustment is made to its carrying value to reflect hedged risk. Interest on indebtedness is expensed as incurred unless capitalized for qualifying assets in accordance with IAS 23, Borrowing Costs.
Debt is classified as a non-current liability, unless it is due to be settled within one year or less or the Company does not have the right to defer settlement of the liability for at least one year after the reporting period, at which time it is classified as a current liability.
Leases
A contract is or contains a lease if it conveys the right to control the use of an identified asset for a specified period in exchange for consideration. When the Company leases assets from third parties, the Company is the lessee. The Company does not have significant activity where it acts as the lessor, a transaction in which it leases assets to third parties.
Lessee
At the lease commencement date, a right-of-use asset for the underlying leased asset and corresponding lease liability are recognized in the consolidated statement of financial position measured on a present value basis. Lease payments are discounted using the interest rate implicit in the lease. If that rate cannot be readily determined, the Company uses its incremental borrowing rate, which is the interest rate that the Company would pay to borrow funds to obtain an asset of a similar value to the right-of-use asset with a comparable security, economic environment and term.
The right-of-use asset is included in “Property and equipment, net”, and the lease liability is included in “Other financial liabilities”, current or long-term as appropriate, within the consolidated statement of financial position.
Right-of-use assets are measured based on various factors including:
Lease liabilities are measured as the present value of non-cancellable payments over the lease term, which may include:
Where exercise of renewal or termination options is deemed reasonably certain, such assumptions are reflected in the valuation of the right-of-use asset and lease liability. The reasonably certain assessment is made at the lease commencement date and re-assessed if there is a material change in circumstances supporting the assessment.
Lease payments are apportioned between the liability and a finance charge, which is reported within “Finance costs, net” in the consolidated income statement. The right-of-use asset is depreciated over the shorter of the asset's useful life or the lease term on a straight-line basis and presented within “Depreciation” in the consolidated income statement.
Page 112 |
Thomson Reuters Annual Report 2025 |
Most of the Company’s leases are comprised of property leases, for which fixed payments covering lease and non-lease components are included in the value of the right-of-use assets and lease liabilities.
Payments for leases with a term of 12 months or less and certain low-value leases are recognized on a straight-line basis within “Operating expenses” in the consolidated income statement and are not recognized as right-of-use assets in the consolidated statement of financial position.
Taxation
Tax expense comprises current and deferred income tax. Tax is recognized in the consolidated income statement except to the extent it relates to items recognized in other comprehensive income or loss or directly in equity.
Current tax
Current tax expense is based on the results for the period as adjusted for items that are currently not taxable or not deductible. Current tax is calculated using tax rates and laws that were enacted or substantively enacted at the end of the reporting period. Management periodically evaluates positions taken in tax returns with respect to situations in which applicable tax regulation is subject to interpretation. Provisions are established where appropriate based on amounts expected to be paid to the tax authorities. Interest on underpaid taxes is included within “Net interest expense” in the consolidated income statement.
Deferred tax
Deferred tax is recognized on temporary differences arising between the tax bases of assets and liabilities and their carrying amounts in the consolidated statement of financial position. Deferred tax is calculated using regular tax rates and laws that have been enacted or substantively enacted at the end of each reporting period, and which are expected to apply when the related deferred income tax asset is realized, or the deferred income tax liability is settled. The Company does not adjust deferred tax balances for the impact of minimum tax rates that may apply in any given period.
Deferred tax liabilities:
Deferred tax assets:
Deferred tax assets and liabilities are not recognized in respect of temporary differences that arise on initial recognition of assets and liabilities acquired other than in a business combination.
Accounting pronouncements effective in future periods
IFRS 18, Presentation and Disclosure in Financial Statements and associated amendments to IAS 7, Statement of Cash Flows
In April 2024, the IASB issued IFRS 18 and amendments to IAS 7. IFRS 18 will replace IAS 1, Presentation of Financial Statements. Both IFRS 18 and amendments to IAS 7 are effective for reporting periods beginning January 1, 2027.
IFRS 18 will change the presentation of the Company’s financial statements and add new disclosure requirements. Specifically, the new standard requires:
The amendments to IAS 7 were issued to align the presentation of the statement of cash flows, as prepared under
the indirect method, to the changes prescribed to the income statement under IFRS 18.
Thomson Reuters Annual Report 2025 |
Page 113 |
Both IFRS 18 and the amendments to IAS 7 are presentation and disclosure related and do not impact the measurement of the Company’s results of operations, financial condition, or cash flows. The Company is assessing the impact of these pronouncements on its disclosures.
Amendments to IFRS 9 and IFRS 7, Amendments to the Classification and Measurement of Financial Instruments
In May 2024, the IASB issued amendments to IFRS 9, Financial Instruments and IFRS 7, Financial Instruments: Disclosures. The amendments introduce:
The amendments are effective for reporting periods beginning on January 1, 2026. The Company has concluded that there will be no material impact from the adoption of these amendments on its financial statements or disclosures.
Other pronouncements issued by the IASB and International Financial Reporting Interpretations Committee (“IFRIC”) are not applicable or consequential to the Company.
Note 2: Critical Accounting Estimates and Judgments
The preparation of financial statements requires management to make estimates and judgments about the future. Estimates and judgments are continually evaluated and are based on historical experience and other factors, including expectations of future events that are believed to be reasonable under the circumstances. Accounting estimates will, by definition, seldom equal the actual results.
The Company continues to operate in an uncertain macroeconomic environment, reflecting ongoing geopolitical risk, uneven economic growth, and an evolving interest rate and inflationary backdrop, among other factors. While the Company is closely monitoring these conditions to assess potential impacts on its businesses, some of management’s estimates and judgments may be more variable and may change materially in the future due to the significant uncertainty created by these circumstances.
The following discussion sets forth management’s:
Critical accounting estimates and assumptions
Software
Software represented $
Most expenditures for internally developed software relate to product development and enhancements. Management exercises judgment in determining the development activities that meet capitalization criteria. Software acquired through business combinations is recorded at fair value, which is estimated at the acquisition date, based on, among other factors, cash flow projections from the use or sale of the asset, the weighted-average cost of capital and the remaining useful life, all of which require judgment.
For all software, management must estimate the expected period of benefit over which amounts recognized as assets should be amortized. The basis of these estimates includes the timing of technological obsolescence, economic and competitive pressures, historical experience and internal business plans for the use of the software. Due to rapidly changing technology and the uncertainty of the software development process itself, future results could be affected if management’s current assessment differs from actual performance.
Other identifiable intangible assets and goodwill
Other identifiable intangible assets and goodwill represented $
Page 114 |
Thomson Reuters Annual Report 2025 |
Subsequent to acquisition, the Company tests other identifiable intangible assets and goodwill for impairment as required. The outcome of these tests is highly dependent on management’s latest estimates and assumptions regarding cash flow projections, economic risk and weighted-average cost of capital. Specifically, cash flow projections could be impacted by deterioration in macroeconomic conditions, including potential impacts of regulation on customers, changes in customer buying patterns or competitive pressures. The Company’s assumption of perpetual growth could be impacted by changes in long-term outlooks for global inflation. Additionally, the discount rate, tax rate and EBITDA multiples used in various impairment tests are based on those for comparable companies, which are driven by market conditions and prevailing tax laws.
If future events or results differ adversely from the estimates and assumptions made at acquisition or as part of subsequent impairment tests, the Company could record increased amortization or impairment charges in the future.
See note 19 for discussion of the annual impairment testing of goodwill.
Employee future benefits
The Company sponsors defined benefit plans providing pension and other post-employment benefits to covered employees. The Company’s most significant defined benefit plans no longer accrue benefits to active employees. The determination of benefit costs associated with employee future benefits requires assumptions such as the discount rate, which is used to measure benefit plan obligations and the net interest income (expense) on the net benefit plan assets (obligations). Other significant assumptions include expected mortality and the expected rate of increase with respect to certain future pension payments.
For retiree medical benefits in the U.S., the Company provides a fixed subsidy to plan participants that may be used to purchase healthcare insurance on the individual marketplace. This plan design eliminates the need for management to estimate healthcare cost inflation trends and claims frequency.
Because the determination of the cost and obligations associated with employee future benefits requires the use of various assumptions, there is measurement uncertainty inherent in the actuarial valuation process. Actual results will differ from results which are estimated based on assumptions. See note 27.
Income taxes
The Company computes an income tax provision in each of the jurisdictions in which it operates. These income tax provisions include amounts that are based upon the Company’s estimates and assumptions regarding prices and values used to record intercompany transactions. Actual amounts of income tax expense only become final upon filing and acceptance of the tax return by the relevant authorities, which occurs after the issuance of the financial statements.
Additionally, estimation of income taxes includes evaluating the recoverability of deferred tax assets based on an assessment of the ability to use the underlying future tax deductions before they expire against future taxable income. The assessment is based upon existing tax laws and estimates of future taxable income. To the extent estimates differ from the final tax return, earnings would be affected in a subsequent period.
In interim periods, the income tax provision is based on estimates of full-year earnings by jurisdiction. The average annual effective income tax rates are re-estimated at each interim reporting date. To the extent that forecasts differ from actual results, adjustments are recorded in subsequent periods. See note 10 for further details on income taxes including a discussion on sensitivity.
The Company has deferred tax assets in connection with the intercompany transfer of certain operations. The determination of these assets requires management to make significant estimates and assumptions about the fair value of the related operations. Critical estimates include, but are not limited to, internal revenue and expense forecasts and discount rates, while critical assumptions include those regarding macroeconomic conditions and prevailing tax laws. The discount rates used in the income method to reduce expected future cash flows to present value are derived from a weighted-average cost of capital analysis and are adjusted to reflect the inherent risks related to the cash flow. Although the Company believes its assumptions and estimates are reasonable and appropriate, they are based in part on historical experience and are inherently uncertain. Unanticipated events and circumstances may occur that could differ adversely from the Company’s assumptions and estimates, which could require the Company to reduce its deferred tax assets in future periods.
Thomson Reuters Annual Report 2025 |
Page 115 |
Critical judgments in applying accounting policies
Revenue recognition
To determine the appropriate revenue recognition for its products and services, management must assess whether multiple products and services in customer contracts are distinct performance obligations that should be accounted for separately, or whether they must be accounted for together. In making the determination, management considers, for example, whether the Company regularly sells a product or service separately, or whether the products or services are highly interrelated. Management must also determine the standalone selling price (“SSP”) for each distinct performance obligation. The Company typically has more than one SSP for individual products and services due to the stratification of its offerings by customer. As a result, management determines the SSP taking into consideration market conditions and other factors, including the value of its contracts, the product or service sold, the customer’s market, geographic location and the number and types of users in each contract. Finally, management must also estimate the period over which to amortize assets arising from incremental costs of obtaining a contract. As management estimates that this period corresponds to the period over which a customer benefits from existing technology in the underlying product or service, this judgment is closely linked with the determination of software amortization periods.
Uncertain tax positions
The Company is subject to taxation in numerous jurisdictions and is routinely under audit by many different taxing authorities in the ordinary course of business. There are many transactions and calculations in the course of business for which the ultimate tax determination is uncertain, as taxing authorities may challenge some of the Company’s positions and propose adjustments or changes to its tax filings. As a result, the Company maintains provisions for uncertain tax positions that it believes appropriately reflect its risk. These provisions are made using the Company’s best estimates of the amount expected to be paid based on a qualitative assessment of all relevant factors. When appropriate, the Company performs an expected value calculation to determine its provisions. The Company reviews the adequacy of these provisions at the end of each reporting period and adjusts them based on changing facts and circumstances. Due to the uncertainty associated with tax audits, it is possible that at some future date, liabilities resulting from such audits or related litigation could vary significantly from the Company’s provisions. Where the outcome of these tax-related matters is different from the amounts that were initially recorded, such differences will affect the tax provisions in the period in which such determination is made. As of December 31, 2025, the Company has recorded an aggregate provision of $
Deferred Tax Assets
Deferred tax assets are recognized to the extent it is probable that taxable profits will be available against which the deductible temporary differences can be utilized, and are reduced to the extent that it is not probable that sufficient taxable profits will be available to allow all or part of the asset to be recovered. In evaluating deferred tax assets, management must make judgments to assess the future taxable profits and likely outcomes of unresolved tax audits associated with the relevant jurisdictions. As of December 31, 2025, the Company had deferred tax assets of $
Note 3: Revenues
Revenues by type and geography
The following tables disaggregate revenues by type and geography and reconcile them to reportable segments (see note 4).
Revenues by type |
Legal |
|
Corporates |
Tax, Audit & Accounting Professionals |
|
Reuters |
|
Global Print |
|
Eliminations/ Rounding |
|
Total |
|||||||||||||
Year ended |
2025 |
|
2024 |
|
2025 |
|
2024 |
2025 |
|
2024 |
|
2025 |
|
2024 |
|
2025 |
|
2024 |
|
2025 |
|
2024 |
|
2025 |
2024 |
Recurring |
|
|
|
|
|
|
|
- |
|
- |
|
( |
|
( |
|
||||||||||
Transactions |
|
|
|
|
|
|
|
- |
|
- |
|
- |
|
- |
|
||||||||||
Global Print |
- |
|
- |
|
- |
|
- |
- |
|
- |
|
- |
|
- |
|
|
|
- |
|
- |
|
||||
Total |
|
|
|
|
|
|
|
|
|
( |
|
( |
|
||||||||||||
Page 116 |
Thomson Reuters Annual Report 2025 |
Revenues by |
Legal |
|
Corporates |
Tax, Audit & Accounting Professionals |
|
Reuters |
|
Global Print |
|
Eliminations/ Rounding |
|
Total |
|||||||||||||
Year ended |
2025 |
|
2024 |
|
2025 |
|
2024 |
2025 |
|
2024 |
|
2025 |
|
2024 |
|
2025 |
|
2024 |
|
2025 |
|
2024 |
|
2025 |
2024 |
U.S. |
|
|
|
|
|
|
|
|
|
( |
|
( |
|
||||||||||||
Canada |
|
|
|
|
|
|
|
|
|
- |
|
- |
|
||||||||||||
Other |
|
|
|
|
|
|
|
|
|
- |
|
- |
|
||||||||||||
Americas |
|
|
|
|
|
|
|
|
|
( |
|
( |
|
||||||||||||
U.K. |
|
|
|
|
|
|
|
|
|
- |
|
- |
|
||||||||||||
Other |
|
|
|
|
|
|
|
|
|
- |
|
- |
|
||||||||||||
EMEA |
|
|
|
|
|
|
|
|
|
- |
|
- |
|
||||||||||||
Asia Pacific |
|
|
|
|
|
|
|
|
|
- |
|
- |
|
||||||||||||
Total |
|
|
|
|
|
|
|
|
|
( |
|
( |
|
||||||||||||
Contract liabilities
The following table includes contract liabilities:
|
|
|
December 31, |
|||
(millions of U.S. dollars) |
|
|
2025 |
|
2024 |
2023 |
Deferred revenue |
|
|
|
|||
Deferred revenue as of December 31, 2025 increased compared to the balance as of December 31, 2024 as cash payments received or due in advance of satisfying performance obligations exceeded $
Deferred revenue as of December 31, 2024 increased compared to the balance as of December 31, 2023 as cash payments received or due in advance of satisfying performance obligations exceeded $
Costs to obtain a contract
Amortization of deferred commissions was $
Remaining performance obligations
As of December 31, 2025, remaining performance obligations were $
|
|
|
December 31, |
||
|
|
|
2025 |
|
2024 |
1 year |
|
|
|
||
Between 1 and 2 years |
|
|
|
||
Between 2 and 3 years |
|
|
|
||
Later than 3 years |
|
|
|
||
The remaining performance obligations later than three years largely relates to an agreement between Reuters and the Data & Analytics business of LSEG pursuant to which Reuters supplies news and information services to the Data & Analytics business of LSEG for a minimum amount of revenue through October 1, 2048. In 2025, the Company recorded $
Thomson Reuters Annual Report 2025 |
Page 117 |
Note 4: Segment Information
The Company is organized as
In the fourth quarter of 2025, the Company changed the names of its Tax & Accounting Professionals segment to Tax, Audit & Accounting Professionals and its Reuters News segment to Reuters to reflect the broader scope of the activities in each of the respective segments. These name changes did not change the segment's composition or the measurement of the segment's results as previously or currently reported.
Legal Professionals
Serves law firms and governments with research and workflow products powered by AI-enabled technology, focusing on intuitive legal research and integrated legal workflow solutions that combine content, tools and analytics.
Corporates
Serves corporations, ranging from small businesses to multinational organizations, including the seven largest global accounting firms, with the Company’s full suite of content-driven products, powered by AI-enabled technology and integrated compliance workflow solutions to help them achieve their business outcomes.
Tax, Audit & Accounting Professionals
Serves tax, audit and accounting firms (other than the seven largest, which are served by the Corporates segment) with research and workflow products powered by AI-enabled technology.
Reuters
Supplies business, financial and global news and data to the world’s media organizations, professionals and news consumers through Reuters News Agency, Reuters.com, Reuters Events, Thomson Reuters products and to financial firms exclusively via LSEG products.
Global Print
Provides legal and tax information primarily in print format to customers around the world and provides commercial printing services to a wide range of book publishers.
Information by segment and reconciliations to the consolidated income statement are set forth below:
(millions of U.S. dollars) |
Legal |
Corporates |
Tax, Audit & Accounting Professionals |
Reuters |
Global Print |
Eliminations/ Rounding |
Total |
|||||||
Year ended December 31, |
2025 |
2024 |
2025 |
2024 |
2025 |
2024 |
2025 |
2024 |
2025 |
2024 |
2025 |
2024 |
2025 |
2024 |
Revenues |
( |
( |
||||||||||||
Staff costs(1) |
( |
( |
( |
( |
( |
( |
( |
( |
( |
( |
- |
- |
( |
( |
Goods and services(1) |
( |
( |
( |
( |
( |
( |
( |
( |
( |
( |
( |
( |
||
Other expenses |
( |
( |
( |
( |
( |
( |
( |
( |
( |
( |
- |
- |
( |
( |
Fair value adjustments on acquired |
- |
- |
- |
- |
- |
- |
- |
- |
||||||
Reportable segments adjusted EBITDA |
- |
- |
||||||||||||
Corporate costs |
|
|
|
|
|
|
|
|
|
|
|
|
( |
( |
Remove fair value adjustments on acquired deferred revenue |
|
|
( |
( |
||||||||||
Fair value adjustments (see note 5) |
|
|
( |
|||||||||||
Depreciation |
|
|
|
|
|
|
|
|
|
|
|
|
( |
( |
Amortization of software |
|
|
( |
( |
||||||||||
Amortization of other identifiable intangible assets |
|
|
( |
( |
||||||||||
Other operating gains, net |
|
|
||||||||||||
Operating profit |
|
|
|
|
|
|
|
|
|
|
|
|
||
Net interest expense |
|
|
|
|
|
|
|
|
|
( |
( |
|||
Other finance (costs) income |
|
|
( |
|||||||||||
Share of post-tax (losses) earnings in equity method investments |
|
|
( |
|||||||||||
Tax (expense) benefit |
|
|
( |
|||||||||||
Earnings from continuing operations |
|
|
||||||||||||
Reuters revenues included $
Page 118 |
Thomson Reuters Annual Report 2025 |
In accordance with IFRS 8, Operating Segments, the Company discloses certain information about its reportable segments based upon measures used by management in assessing the performance of those reportable segments. The profitability measure is defined below and may not be comparable to similar measures of other companies.
Segment Adjusted EBITDA
Each segment includes an allocation of costs, based on usage or other applicable measures, for centralized support services such as technology-related services, commercial operations, marketing costs, and product and content development. Additionally, product costs are allocated when one segment sells products managed by another segment. Corporate costs, which include expenses for certain centrally managed functions such as finance, legal, human resources and the executive office are not allocated to the segments.
Revenues by Classes of Similar Products and Services
The following table presents revenues by classes of similar products and services:
|
|
|
Year ended December 31, |
||
(millions of U.S. dollars) |
|
|
2025 |
|
2024 |
Electronic, software & services |
|
|
|
||
Global Print |
|
|
|
||
Total |
|
|
|
||
Non-current Assets by Geography
The following table presents non-current assets by geography:
Geographic Information(1) |
Non-Current Assets(2) |
||
|
December 31, |
||
(millions of U.S. dollars) |
2025 |
|
2024 |
U.S. |
|
||
Canada |
|
||
Other |
|
||
Americas |
|
||
Switzerland |
|
||
U.K. |
|
||
Other |
|
||
EMEA |
|
||
Asia Pacific |
|
||
Total |
|
||
Thomson Reuters Annual Report 2025 |
Page 119 |
Note 5: Operating Expenses
The components of operating expenses include the following:
|
|
|
Year ended December 31, |
||
(millions of U.S. dollars) |
|
|
2025 |
|
2024 |
Salaries, commissions and allowances |
|
|
|
||
Share-based payments |
|
|
|
||
Post-employment benefits |
|
|
|
||
Total staff costs |
|
|
|
||
Goods and services(1) |
|
|
|
||
Content |
|
|
|
||
Telecommunications |
|
|
|
||
Facilities |
|
|
|
||
Fair value adjustments(2) |
|
|
|
( |
|
Total operating expenses |
|
|
|
||
Note 6: Other Operating Gains, Net
Other operating gains, net, were $
Other operating gains, net, were $
Note 7: Disposals
In 2025, disposals of businesses were not material. In December 2024, the Company sold its FindLaw business in a transaction valued at up to $
The net assets disposed and gain on the above transactions as of their closing date are as follows:
|
|
|
Year ended December 31, |
||
(millions of U.S. dollars) |
|
|
|
|
2024 |
Consideration received or receivable: |
|
|
|
|
|
Cash and cash equivalents |
|
|
|
|
|
Fair value of contingent consideration |
|
|
|
|
|
Total consideration |
|
|
|
|
|
Trade and other receivables |
|
|
|
|
( |
Prepaid expenses and other current assets |
|
|
|
|
( |
Software |
|
|
|
|
( |
Goodwill |
|
|
|
|
( |
Other non-current assets |
|
|
|
|
( |
Total assets |
|
|
|
|
( |
Deferred revenue |
|
|
|
|
|
Total liabilities |
|
|
|
|
|
Net assets disposed |
|
|
|
|
( |
Other |
|
|
|
|
( |
Gain on sale before income tax |
|
|
|
|
|
Page 120 |
Thomson Reuters Annual Report 2025 |
Note 8: Finance Costs, Net
The components of finance costs, net, include interest expense (income) and other finance costs (income).
|
|
|
Year ended December 31, |
||
(millions of U.S. dollars) |
|
|
2025 |
|
2024 |
Interest expense: |
|
|
|
|
|
Debt |
|
|
|
||
Other, net |
|
|
|
||
Fair value (gains) losses on financial instruments (see note 20) |
|
|
|
|
|
Debt |
|
|
( |
|
|
Fair value hedges |
|
|
|
||
Cash flow hedges, transfer from equity |
|
|
( |
|
|
Net foreign exchange losses (gains) on debt |
|
|
|
( |
|
Net interest expense - debt and other |
|
|
|
||
Net interest expense - leases |
|
|
|
||
Net interest expense - pension and other post-employment benefit plans |
|
|
|
||
Interest income |
|
|
( |
|
( |
Net interest expense |
|
|
|
||
The components of finance costs (income) are as follows:
|
|
|
Year ended December 31, |
||
(millions of U.S. dollars) |
|
|
2025 |
|
2024 |
Net losses (gains) due to changes in foreign currency exchange rates |
|
|
|
( |
|
Other |
|
|
|
||
Other finance costs (income) |
|
|
|
( |
|
Net losses (gains) due to changes in foreign currency exchange rates were principally comprised of amounts related to certain intercompany funding arrangements. Other includes ineffective portion of cash flow and fair value hedges.
Note 9: Equity Method Investments
Equity method investments in the consolidated statement of financial position were $
As of December 31, 2025, total equity method investments primarily included the Company's investment in 3 Times Square Associates LLC (“3XSQ Associates”) and the Company’s ownership interest in a company affiliated with Pagero, which was acquired in January 2024 (see note 30).
In June 2023, the Company sold a majority interest in its Elite business, a provider of financial and practice management solutions to law firms, to TPG, a global alternative asset management firm, and retained a
In May 2024, the Company sold all of its remaining LSEG shares that it indirectly owned through its direct investment in York Parent Limited and its subsidiaries (“YPL”), which, from the date the remaining shares were sold, was no longer a material associate of the Company. For the full year of 2024, the Company sold
The investment in LSEG was subject to equity accounting because the LSEG shares were held through YPL, over which the Company had significant influence. As YPL owned only the financial investment in LSEG shares, which the parties intended to sell over time, and was not involved in operating LSEG, the investment in LSEG shares held by YPL was accounted for at fair value, based on the share price of LSEG. Proceeds from sales of LSEG shares were recorded as a reduction of the Company’s investment (excluding amounts related to the settlement of the foreign exchange contracts) and presented as investing activities in the consolidated statement of cash flow.
Thomson Reuters Annual Report 2025 |
Page 121 |
The Company’s share of post-tax earnings (losses) in its YPL investment was comprised of the following items in 2024:
|
|
|
Year ended December 31, |
||
(millions of U.S. dollars) |
|
|
|
|
2024 |
Decrease in LSEG share price |
|
|
|
|
( |
Foreign exchange losses on LSEG shares |
|
|
|
|
( |
Dividend income |
|
|
|
|
|
Gain from call options |
|
|
|
|
|
Historical excluded equity adjustment(1) |
|
|
|
|
|
YPL - Share of post-tax earnings in equity method investments |
|
|
|
|
|
Set forth below is summarized financial information for 100% of YPL for the six months ended June 30, 2024 when YPL was a material associate of the Company.
|
|
|
Six months ended June 30, |
||
(millions of U.S. dollars) |
|
|
|
|
2024 |
Mark-to-market of LSEG shares |
|
|
|
|
( |
Dividend income |
|
|
|
|
|
Gain from call options |
|
|
|
|
|
Net loss |
|
|
|
|
( |
Total comprehensive loss |
|
|
|
|
( |
Refer to note 32 for related party transactions with equity method investees.
Note 10: Taxation
The components of tax expense (benefit) for 2025 and 2024 are as follows:
|
|
|
Year ended December 31, |
||
(millions of U.S. dollars) |
|
|
2025 |
|
2024 |
Current tax expense |
|
|
|
||
Deferred tax expense (benefit) |
|
|
|
( |
|
Total tax expense (benefit) |
|
|
|
( |
|
Taxes on items recognized in “Other comprehensive income (loss)” or directly in equity in 2025 and 2024 are as follows:
|
|
|
Year ended December 31, |
||
(millions of U.S. dollars) |
|
|
2025 |
|
2024 |
Included in Other comprehensive income (loss) |
|
|
|
|
|
Deferred tax (benefit) expense on cash flow hedges adjustments to equity |
|
|
( |
|
|
Deferred tax expense on fair value adjustments on financial assets |
|
|
|
||
Deferred tax expense on remeasurement on defined benefit pension plans |
|
|
|||
Included in Equity |
|
|
|
|
|
Deferred tax expense on share-based payments |
|
|
|
||
Current tax benefit on share-based payments |
|
|
( |
|
( |
Items affecting tax expense for 2025 and 2024
In 2025, tax expense included $
In 2024, the net tax benefit included a $
Page 122 |
Thomson Reuters Annual Report 2025 |
In January 2024, the Company began recording tax expense associated with the “Pillar Two model rules” as published by the Organization for Economic Cooperation and Development and enacted by key jurisdictions in which the Company operates. These rules are designed to ensure large multinational enterprises within the scope of the rules pay a minimum level of tax in each jurisdiction where they operate. In general, the “Pillar Two model rules” apply a system of top-up taxes to bring the enterprise’s effective tax rate in each jurisdiction to a minimum of
Below is a reconciliation of income taxes calculated at the Canadian corporate tax rate of
|
|
|
Year ended December 31, |
||
(millions of U.S. dollars) |
|
|
2025 |
|
2024 |
Income before tax |
|
|
|
||
Income before tax multiplied by the standard rate of Canadian |
|
|
|
||
Effects of: |
|
|
|
|
|
Income taxes recorded at rates different from the Canadian tax rate |
|
|
( |
|
( |
Tax expense related to the transfer of certain technology assets |
|
|
|
- |
|
Net non-taxable foreign exchange and other gains and losses |
|
|
( |
|
|
Tax expense on changes in statutory intercompany investment values |
|
|
|
||
Recognition of tax losses that arose in prior years due to changes in |
|
|
( |
|
( |
Provision for uncertain tax positions |
|
|
|
( |
|
Recognition of tax assets that arose in prior years |
|
|
- |
|
( |
Derecognition of tax assets that arose in prior years |
|
|
- |
|
|
Impact of changes in tax laws and rates |
|
|
|
||
Research and development credits |
|
|
( |
|
( |
Other adjustments related to prior years |
|
|
|
||
Pillar Two top-up tax |
|
|
|
||
Withholding taxes |
|
|
|
||
Other differences |
|
|
|
||
Total tax expense (benefit) |
|
|
|
( |
|
The Company’s 2025 effective income tax rate on earnings from continuing operations was
On July 4, 2025, the U.S. enacted tax reform legislation as part of the One Big Beautiful Bill Act ("OBBBA"). The OBBBA leaves the U.S. corporate tax rate unchanged at
Note 11: Discontinued Operations
Earnings from discontinued operations, net of tax, was $
Thomson Reuters Annual Report 2025 |
Page 123 |
Note 12: Earnings Per Share
Basic earnings per share was calculated by dividing earnings attributable to common shareholders less dividends declared on preference shares by the sum of the weighted-average number of common shares outstanding and vested deferred share units (“DSUs”) outstanding during the period. DSUs represent common shares that certain employees have elected to receive in the future upon vesting of share-based compensation awards or in lieu of cash compensation.
Diluted earnings per share was calculated using the denominator of the basic calculation described above adjusted to include the potentially dilutive effect of outstanding stock options and time-based restricted share units (“TRSUs”).
Earnings used in determining consolidated earnings per share and earnings per share from continuing operations are as follows:
|
|
|
Year ended December 31, |
||
(millions of U.S. dollars) |
|
|
2025 |
|
2024 |
Earnings attributable to common shareholders |
|
|
|
||
Less: Dividends declared on preference shares |
|
|
( |
|
( |
Earnings used in consolidated earnings per share |
|
|
|
||
Less: Earnings from discontinued operations, net of tax |
|
|
( |
|
( |
Earnings used in earnings per share from continuing operations |
|
|
|
||
The weighted-average number of common shares outstanding, as well as a reconciliation of the weighted-average number of common shares outstanding used in the basic earnings per share computation to the weighted-average number of common shares outstanding used in the diluted earnings per share computation, is presented below:
|
|
|
Year ended December 31, |
||
|
|
|
2025 |
|
2024 |
Weighted-average number of common shares outstanding |
|
|
|
||
Weighted-average number of vested DSUs |
|
|
|
||
Basic |
|
|
|
||
Effect of stock options and TRSUs |
|
|
|
||
Diluted |
|
|
|
||
There were
Note 13: Cash and Cash Equivalents
The components of cash and cash equivalents include the following:
|
|
|
December 31, |
||
(millions of U.S. dollars) |
|
|
2025 |
|
2024 |
Cash |
|
|
|
|
|
Cash at banks and on hand |
|
|
|
||
Cash equivalents |
|
|
|
|
|
Money market accounts and other securities |
|
|
|
||
Cash and cash equivalents |
|
|
|
||
Of total cash and cash equivalents, $
Page 124 |
Thomson Reuters Annual Report 2025 |
Note 14: Trade and Other Receivables
Trade and other receivables consist of the following:
|
|
|
December 31, |
||
(millions of U.S. dollars) |
|
|
2025 |
|
2024 |
Trade receivables |
|
|
|
||
Less: Allowance for expected credit losses |
|
|
( |
|
( |
Less: Allowance for sales adjustments |
|
|
( |
|
( |
Net trade receivables |
|
|
|
||
Other receivables |
|
|
|
||
Trade and other receivables |
|
|
|
||
The aging of trade receivables at each reporting date are as follows:
|
|
|
December 31, |
||
(millions of U.S. dollars) |
|
|
2025 |
|
2024 |
Current - 30 days |
|
|
|
||
Past due 31-60 days |
|
|
|
||
Past due 61-90 days |
|
|
|
||
Past due 91-180 days |
|
|
|
||
Past due >180 days |
|
|
|
||
Balance as of December 31 |
|
|
|
||
Allowance for expected credit losses
The change in the allowance for expected credit losses are as follows:
|
|
|
December 31, |
||
(millions of U.S. dollars) |
|
|
2025 |
|
2024 |
Balance at beginning of year |
|
|
|
||
Bad debt expense |
|
|
|
||
Write-offs |
|
|
( |
|
( |
Acquisitions |
|
|
|
||
Disposals of businesses |
|
|
|
( |
|
Translation and other, net |
|
|
|
||
Balance at end of year |
|
|
|
||
Trade and other receivables are written off when there is no reasonable expectation of recovery, such as the bankruptcy of the debtor. The potential for such losses is mitigated because the Company has a broad and diversified customer base, combined with active monitoring and credit policies to mitigate the risk of loss including aging analyses, automated dunning, and cancellation of services. There is also no significant exposure to any single customer.
Note 15: Prepaid Expenses and Other Current Assets
The components of prepaid expenses and other current assets include the following:
|
|
|
December 31, |
||
(millions of U.S. dollars) |
|
|
2025 |
|
2024 |
Prepaid expenses |
|
|
|
||
Deferred commissions |
|
|
|
||
Current tax receivables |
|
|
|
||
Inventory |
|
|
|
||
Other current assets |
|
|
|
||
Prepaid expenses and other current assets |
|
|
|
||
Thomson Reuters Annual Report 2025 |
Page 125 |
Note 16: Property and Equipment
Property and equipment consist of the following:
(millions of U.S. dollars) |
Land, Buildings and Building Improvements |
|
Computer Equipment |
Furniture, Fixtures and Other Equipment |
Total |
Cost: |
|
|
|
|
|
December 31, 2023 |
|
||||
Additions: |
|
|
|
|
|
Capital expenditures |
|
||||
Leases |
|
||||
Acquisitions |
|
||||
Removed from service |
( |
|
( |
( |
( |
Disposals of businesses and property |
( |
|
( |
( |
|
Translation and other, net |
( |
|
( |
( |
( |
December 31, 2024 |
|
||||
Additions: |
|
|
|
|
|
Capital expenditures |
|
||||
Leases |
|
||||
Acquisitions |
|
||||
Removed from service |
( |
|
( |
( |
( |
Translation and other, net |
( |
|
( |
( |
|
December 31, 2025 |
|
||||
Accumulated depreciation: |
|
|
|
|
|
December 31, 2023 |
( |
|
( |
( |
( |
Depreciation |
( |
|
( |
( |
( |
Removed from service |
|
||||
Disposals of businesses and property |
|
||||
Translation and other, net |
|
||||
December 31, 2024 |
( |
|
( |
( |
( |
Depreciation |
( |
|
( |
( |
( |
Removed from service |
|
||||
Translation and other, net |
|
( |
|||
December 31, 2025 |
( |
|
( |
( |
( |
Carrying amount: |
|
|
|
|
|
December 31, 2024 |
|
||||
December 31, 2025 |
|
The above categories include right-of-use assets. See note 28 for right-of-use assets carrying amounts and other related leases disclosures.
Page 126 |
Thomson Reuters Annual Report 2025 |
Note 17: Software
Software consists of the following:
(millions of U.S. dollars) |
Internally Developed |
|
Acquisitions - Business Combinations(1) |
Purchased |
Total |
Cost: |
|
|
|
|
|
December 31, 2023 |
|
||||
Additions |
|
||||
Removed from service |
( |
|
( |
||
Disposals of businesses |
( |
|
( |
||
Translation and other, net |
|
( |
( |
( |
|
December 31, 2024 |
|
||||
Additions |
|
||||
Removed from service |
( |
|
( |
||
Disposals of businesses |
( |
|
( |
||
Translation and other, net |
|
||||
December 31, 2025 |
|
||||
Accumulated amortization: |
|
|
|
|
|
December 31, 2023 |
( |
|
( |
( |
( |
Amortization |
( |
|
( |
( |
( |
Removed from service |
|
||||
Disposals of businesses |
|
||||
Translation and other, net |
( |
|
( |
( |
|
December 31, 2024 |
( |
|
( |
( |
( |
Amortization |
( |
|
( |
( |
( |
Removed from service |
|
||||
Disposals of businesses |
|
||||
Translation and other, net |
( |
|
( |
( |
( |
December 31, 2025 |
( |
|
( |
( |
( |
Carrying amount: |
|
|
|
|
|
December 31, 2024 |
|
||||
December 31, 2025 |
|
Thomson Reuters Annual Report 2025 |
Page 127 |
Note 18: Other Identifiable Intangible Assets
Other identifiable intangible assets consist of the following:
|
Indefinite Useful Life |
|
Finite Useful Life |
|
|
|||
(millions of U.S. dollars) |
Trade Names |
|
Trade Names |
Customer Relationships |
Databases and Content |
Other |
|
Total |
Cost: |
|
|
|
|
|
|
|
|
December 31, 2023 |
|
|
||||||
Acquisitions |
|
|
||||||
Disposals of businesses |
|
( |
|
( |
||||
Translation and other, net |
|
( |
( |
( |
( |
|
( |
|
December 31, 2024 |
|
|
||||||
Acquisitions |
|
|
||||||
Disposals of businesses |
|
( |
|
( |
||||
Translation and other, net |
|
|
||||||
December 31, 2025 |
|
|
||||||
Accumulated amortization: |
|
|
|
|
|
|
|
|
December 31, 2023 |
|
( |
( |
( |
( |
|
( |
|
Amortization |
|
( |
( |
( |
|
( |
||
Disposals of businesses |
|
|
||||||
Translation and other, net |
|
|
||||||
December 31, 2024 |
|
( |
( |
( |
( |
|
( |
|
Amortization |
|
( |
( |
( |
( |
|
( |
|
Disposals of businesses |
|
|
||||||
Translation and other, net |
- |
|
( |
( |
( |
|
( |
|
December 31, 2025 |
|
( |
( |
( |
( |
|
( |
|
Carrying amount: |
|
|
|
|
|
|
|
|
December 31, 2024 |
|
|
||||||
December 31, 2025 |
|
|
||||||
The carrying amount of indefinite-lived trade names was $
Note 19: Goodwill
The following table presents the movement in goodwill for the years ended December 31, 2025 and 2024:
|
|
|
|
|
December 31, |
|
(millions of U.S. dollars) |
|
|
|
|
2025 |
2024 |
Cost: |
|
|
|
|
|
|
Balance as of January 1, |
|
|
|
|
||
Acquisitions |
|
|
|
|
||
Disposals of businesses |
|
|
|
|
( |
( |
Translation and other, net |
|
|
|
|
( |
|
Carrying amount as of December 31: |
|
|
|
|
||
Page 128 |
Thomson Reuters Annual Report 2025 |
Impairment test of goodwill
The Company performed its annual goodwill impairment test as of October 1, 2025.
|
|
|
|
|
October 1, |
(millions of U.S. dollars) |
|
|
|
|
2025 |
Legal Professionals |
|
|
|
|
|
Corporates |
|
|
|
|
|
Tax, Audit & Accounting Professionals |
|
|
|
|
|
Reuters |
|
|
|
|
|
Global Print |
|
|
|
|
|
|
|
|
|
|
As allowed under IAS 36, Impairment of Assets, the Company did not re-estimate the recoverable value of these CGUs for the 2025 impairment test but rather carried forward the recoverable value from 2023 because management concluded that no events or changes in circumstances indicated that the carrying value of these CGUs might not be recoverable. The valuation techniques, significant assumptions and sensitivities described below relate to the recoverable values determined in the 2023 impairment test.
Valuation Techniques
The selection and application of valuation techniques and the determination of significant assumptions requires judgment. As with previous impairment tests, the recoverable value of each CGU was based on fair value less costs of disposal, using a weighted average of the income approach and market approach. IFRS 13, Fair Value Measurement, defines fair value as a market-based measurement rather than an entity-specific measurement. Therefore, the fair value of the CGU must be measured using the assumptions that market participants would use rather than those related specifically to the Company. To calculate market participant assumptions, publicly available data was gathered from companies operating in businesses similar to each CGU, which includes key competitors. As certain inputs to the valuation are not based on observable market data, the recoverable value of each CGU is categorized in Level 3 of the fair value measurement hierarchy.
Income approach
The income approach is predicated upon the value of the future cash flows that a business will generate. The Company used the discounted cash flow (“DCF”) method, which involves projecting cash flows and converting them into a present value equivalent through discounting. The discounting process uses a rate of return that is commensurate with the risk associated with the business and the time value of money. This approach requires assumptions about revenue growth rates, operating margins, capital expenditures, tax rates and discount rates.
Market approach
The market approach assumes that companies operating in the same industry will share similar characteristics and that company values will correlate to those characteristics. Therefore, a comparison of a CGU to similar companies whose financial information is publicly available may provide a reasonable basis to estimate fair value. Under the market approach, fair value is calculated based on EBITDA multiples of benchmark companies comparable to the businesses in each CGU. Data for the benchmark companies was obtained from publicly available information.
Significant Assumptions
Weighting of Valuation Techniques
The Company weighted the results of the two valuation techniques noted above, consistently applied to each CGU, as follows:
Cash Flow Projections
Cash flow projections were based on the Company’s internal forecasts. The Company projected cash flows for a period of three years and applied a perpetual growth rate thereafter, as prescribed by IAS 36. To project cash flows for the three-year period, the Company considered growth in revenues and costs as well as capital expenditures. In preparing its projections, the Company considered experience, economic trends such as GDP growth and inflation as well as industry and market trends. The projections also considered the expected impact from efficiency initiatives, new product launches, customer retention, as well as the maturity of the markets in which each business operates.
Thomson Reuters Annual Report 2025 |
Page 129 |
Discount Rate
The Company assumed a discount rate to calculate the present value of its projected cash flows. The discount rate represented a weighted-average cost of capital (“WACC”) for comparable companies operating in similar industries as the applicable CGU, based on publicly available information. The WACC is an estimate of the overall required rate of return on an investment for both debt and equity owners and serves as the basis for developing an appropriate discount rate.
Determination of the WACC requires separate analysis of the cost of equity and the cost of debt. The cost of equity reflects the long-term risk-free interest rate associated with U.S. Treasury bonds and considers a risk premium based on an assessment of risks related to the projected cash flows of each CGU.
Lower discount rates were applied to CGUs whose cash flows are expected to be less volatile due to factors such as the maturity of the market they serve and their market position. Higher discount rates were applied to CGUs whose cash flows are expected to be more volatile due to competition or participation in less stable geographic markets.
Tax Rate
The tax rates applied to the projections were based on effective tax rates of comparable companies operating in similar industries as the applicable CGU, based on publicly available information or statutory tax rates. Tax assumptions are sensitive to changes in tax laws and the jurisdictions in which profits are earned.
The key assumptions used in performing the impairment test, by CGU, are presented below:
|
|
|
Perpetual |
Discount |
Tax |
Cash-Generating Unit |
|
|
Growth Rate(1) |
Rate |
Rate |
Legal Professionals |
|
|
|||
Corporates |
|
|
|||
Tax, Audit & Accounting Professionals |
|
|
|||
Reuters |
|
|
|||
Global Print |
|
|
( |
Results and Sensitivities
As the fair value for each CGU exceeded its carrying value by a substantial amount, the sensitivity analysis demonstrated that no reasonably possible change in the perpetual growth rate, discount rate or income tax assumptions would cause the carrying amounts of any CGU to exceed its recoverable amount.
Page 130 |
Thomson Reuters Annual Report 2025 |
Note 20: Financial Instruments
Financial assets and liabilities
Financial assets and liabilities in the consolidated statement of financial position are as follows:
December 31, 2025 |
|
|
Assets/ (Liabilities) at Amortized Cost |
Assets/ (Liabilities) at Fair Value through Earnings |
Assets at Fair Value through Other Comprehensive Income or Loss |
Derivatives Used for Hedging(1) |
|
Total |
Cash and cash equivalents |
|
|
|
|||||
Trade and other receivables |
|
|
|
|||||
Other financial assets - current |
|
|
|
|||||
Other financial assets - non-current |
|
|
|
|||||
Current indebtedness |
|
|
( |
|
( |
|||
Trade payables (see note 22) |
|
|
( |
|
( |
|||
Accruals (see note 22) |
|
|
( |
|
( |
|||
Other financial liabilities - current(2) |
|
|
( |
( |
|
( |
||
Long-term indebtedness |
|
|
( |
|
( |
|||
Other financial liabilities - |
|
|
( |
( |
|
( |
||
Total |
|
|
( |
( |
|
( |
||
|
|
|
|
|
|
|
|
|
December 31, 2024 |
|
|
Assets/ (Liabilities) at Amortized Cost |
Assets/ (Liabilities) at Fair Value through Earnings |
Assets at Fair Value through Other Comprehensive Income or Loss |
Derivatives Used for Hedging(1) |
|
Total |
Cash and cash equivalents |
|
|
|
|||||
Trade and other receivables |
|
|
|
|||||
Other financial assets - current |
|
|
|
|||||
Other financial assets - non-current |
|
|
|
|||||
Current indebtedness |
|
|
( |
|
( |
|||
Trade payables (see note 22) |
|
|
( |
|
( |
|||
Accruals (see note 22) |
|
|
( |
|
( |
|||
Other financial liabilities - current(2) |
|
|
( |
( |
( |
|
( |
|
Long-term indebtedness |
|
|
( |
|
( |
|||
Other financial liabilities - |
|
|
( |
( |
|
( |
||
Total |
|
|
( |
( |
|
( |
Fair Value
The fair values of cash and cash equivalents, trade and other receivables, trade payables and accruals approximate their carrying amounts because of the short-term maturity of these instruments.
Debt and Related Derivative Instruments
Carrying Amounts
Amounts recorded in the consolidated statement of financial position are referred to as “carrying amounts”. The carrying amounts of primary debt are reflected in “Current indebtedness” or “Long-term indebtedness” and the carrying amounts of related derivative instruments used for hedging are included in “Other financial assets” and “Other financial liabilities”, current or non-current within the consolidated statement of financial position, as appropriate.
Fair Value
The fair value of debt is estimated based on either quoted market prices for similar issues or current rates offered to the Company for debt of the same maturity. The fair value of interest rate swaps is estimated based upon discounted cash flows using applicable current market rates and considering non-performance risk.
Thomson Reuters Annual Report 2025 |
Page 131 |
Derivatives used for hedging
The Company may use derivative instruments (including fixed-to-floating and cross-currency interest rate swaps) to manage exposures to interest rate and foreign currency risks related to its indebtedness. These derivatives are designated as fair value hedges (to offset changes in the fair value of recognized debt due to fluctuations in a market benchmark interest rate) or cash flow hedges (to mitigate variability in future interest and principal payments due to changes in foreign currency exchange rates).
Hedge relationships are designated and documented at inception, including the risk management objective and strategy, the hedged risk, the hedged item, the hedging instrument, and the method used to assess hedge effectiveness. Hedge effectiveness is assessed at inception and each reporting date, including whether an economic relationship exists, credit risk does not dominate, and the hedge ratio remains appropriate. The Company generally targets a
Debt Exchange
In March 2025, the Company completed a debt exchange to optimize the Company’s capital structure and to align indebtedness to revenue generation. Holders of U.S. dollar denominated notes originally issued by Thomson Reuters Corporation (“TRC”), the “Old Notes”, were offered the option to receive notes issued by TR Finance LLC (“TR Finance”), an indirect
Series of notes |
|
|
Principal amount New Notes issued by TR Finance |
Principal amount remaining Old Notes of TRC |
Principal amount outstanding notes |
|
|
||||
|
|
||||
|
|
||||
|
|
||||
|
|
||||
Total |
|
|
The New Notes issued by TR Finance have the same interest rate, interest payment dates and maturity date as the applicable series of Old Notes. The New Notes are fully and unconditionally guaranteed as to payment of principal and interest by TRC as well as West Publishing Corporation, Thomson Reuters Applications Inc. and Thomson Reuters (Tax & Accounting) Inc., each of which is an indirect
The exchange was not a debt extinguishment. Accordingly, the transaction did not result in a derecognition of the existing indebtedness. In 2025, the Company paid $
Page 132 |
Thomson Reuters Annual Report 2025 |
The following is a summary of the Company's debt and related derivative instruments that hedge debt:
|
|
Carrying Amount |
|
Fair Value |
||
December 31, 2025 |
|
Primary Debt Instruments |
Derivative Instruments |
|
Primary Debt Instruments |
Derivative Instruments |
Commercial paper |
|
|
||||
$ |
|
|
||||
$ |
|
|
||||
$ |
|
|
||||
$ |
|
|
||||
$ |
|
|
||||
Total |
|
|
||||
Current portion |
|
|
|
|
||
Long-term portion |
|
|
|
|
||
|
|
|
|
|
|
|
|
|
Carrying Amount |
|
Fair Value |
||
December 31, 2024 |
|
Primary Debt Instruments |
Derivative Instruments |
|
Primary Debt Instruments |
Derivative Instruments |
C$ |
|
|
||||
$ |
|
|
||||
$ |
|
|
||||
$ |
|
|
||||
$ |
|
|
||||
$ |
|
|
||||
Total |
|
|
||||
Current portion |
|
|
|
|
||
Long-term portion |
|
|
|
|
||
Debt Repayments and Cross-currency Interest Rate Swap Settlements
In May 2025, the Company repaid its C$
Fixed-to-Floating Interest Rate Swaps
In 2025, the Company entered into fixed-to-floating interest rate swaps totaling $
In addition, the Company has credit support agreements with its counterparties under which one party may call on the other party to post cash collateral when the market value of the swaps exceeds specific thresholds, thus limiting credit exposure. The Company posted $
The swaps are reported at fair value in the consolidated statement of financial position with changes in their fair value recorded within “Other finance (costs) income” in the consolidated income statement. The fair value of the swaps was a liability of $
The details of these instruments are set forth below:
(millions of U.S. dollars) |
Paid |
Hedged Risk |
|
Year of Maturity |
|
Principal Amount |
|
Fair value hedges |
|
|
|
|
|
||
|
|
|
US$ |
||||
Cash flow hedges |
|
|
|
|
|
|
|
|
|
|
US$ |
||||
Thomson Reuters Annual Report 2025 |
Page 133 |
Currency Risk Exposures
As of December 31, 2025, all indebtedness was denominated in U.S. dollars. As of December 31, 2024, all indebtedness was denominated in U.S. dollars or had been swapped into U.S. dollar obligations.
The carrying amount of debt, all of which is unsecured, was denominated in the following currencies:
|
|
December 31, |
|
December 31, |
||
|
|
2025(1) |
2024 |
|
2025(1) |
2024(2) |
(millions of U.S. dollars) |
Before Currency Hedging Arrangements |
|
After Currency Hedging Arrangements |
|||
Canadian dollar |
|
|
||||
U.S. dollar |
|
|
||||
|
|
|
||||
Interest Rate Risk Exposures
As of December 31, 2025, the Company held interest rate swaps which swap interest rates in its notes from fixed-to-floating.
|
December 31, 2025 |
December 31, 2024 |
||||
(millions of U.S. dollars, except |
Carrying Amount |
Weighted-Average |
% Share |
Carrying Amount |
Weighted-Average |
% Share |
Total fixed |
||||||
Total floating |
||||||
Total debt |
||||||
Foreign Exchange Contracts
The Company previously entered into foreign exchange contracts that were intended to reduce foreign currency risk related to a portion of its former indirect investment in LSEG, which was denominated in British pounds sterling. These instruments were not related to changes in the LSEG share price. In May 2024, the Company settled its remaining foreign exchange contracts in conjunction with the sale of its remaining shares in LSEG (see note 9).
During 2024, the Company settled foreign exchange contracts with a notional amount of £
Foreign exchange contracts are reported at fair value on the consolidated statement of financial position, with changes in their fair value recorded through the consolidated income statement. In 2024, losses of $
Fair value gains and losses from derivative financial instruments
Fair value gains and losses from derivative financial instruments recognized in the consolidated income statement and consolidated statement of changes in equity are as follows:
|
|
Year ended December 31, |
||||
|
|
2025 |
|
2024 |
||
(millions of U.S. dollars) |
|
Fair Value (Loss) Gain Through Earnings |
Fair Value Loss Through Equity |
|
Fair Value Loss Through Earnings |
Fair Value Gain Through Equity |
Foreign exchange contracts |
|
|
( |
|||
Hedging instruments: |
|
|
|
|
|
|
Fixed-to-floating interest rate swaps - |
|
( |
|
|||
Cross currency interest rate swaps - |
|
( |
|
( |
||
|
|
( |
|
( |
||
Page 134 |
Thomson Reuters Annual Report 2025 |
Financial Risk Management
The Company is exposed to a variety of financial risks including market risk (primarily currency risk and interest rate risk), credit risk and liquidity risk, as its operations are diverse and global. A centralized corporate treasury group works to minimize the potential adverse effects from these risks by using various hedging strategies including the use of derivative instruments, where applicable, as well as associating with high quality financial institutions, limiting exposures to counterparties and ensuring flexible sources of funding. The Chief Financial Officer oversees the overall approach and ensures the use of strict guidelines and internal control processes.
Market Risk
Currency Risk
The Company’s consolidated financial statements are expressed in U.S. dollars. However, the Company transacts a portion of its business in other currencies and is therefore subject to the effects of foreign currency translation into U.S. dollars as well as currency transaction risk.
The impact of foreign currency translation from changes in exchange rates between 2024 and 2025 had no net impact on consolidated revenues and operating expenses.
Foreign currency translation also generated $
Exposure to currency transaction risk is minimized as the Company generally bills customers and incurs operating expenses in the functional currency of the legal entity that records the transaction. However, the Company is exposed to currency transaction risk from the revaluation of non-permanent intercompany loans in certain of its legal entities, which impacts earnings.
The table below shows the impact on earnings that a hypothetical
(millions of U.S. dollars) |
£ |
SEK |
€ |
C$ |
Other Currencies |
Total |
|
Financial assets and liabilities |
|
( |
( |
||||
Receivables under indemnification |
|
( |
( |
( |
( |
||
Non-permanent intercompany loans |
|
||||||
Total impact on earnings |
|
( |
|||||
Interest Rate Risk
The Company is exposed to fluctuations in interest rates with respect to cash and cash equivalents. As of December 31, 2025, $
Price Risk
The Company has no significant exposure to price risk from commodities in the normal course of business.
Credit Risk
Credit risk arises from cash and cash equivalents and derivative financial instruments, as well as credit exposure to customers including outstanding receivables. The Company attempts to minimize credit exposure as follows:
Thomson Reuters Annual Report 2025 |
Page 135 |
No allowance for credit losses on financial assets was required as of December 31, 2025, other than the allowance for expected credit losses (see note 14) and for credit risk associated with a receivable under an indemnification arrangement and contingent receivables (see “Fair value estimation” section below). Further, no financial or other assets have been pledged.
The Company’s maximum exposure with respect to credit risk, assuming no mitigating factors, would be the aggregate of its cash and cash equivalents of $
The Company is also exposed to credit risk from the guarantee related to its investment in 3XSQ Associates (see note 31).
Liquidity Risk
A centralized treasury function provides flexibility in cash management, including forecasting future cash flow expectations. Cash holdings are supplemented by maintaining sufficient capacity under the Company’s borrowing facilities. Cash flow estimates are based on rolling forecasts of operating, investing and financing flows. Such forecasting also considers account borrowing limits, cash restrictions and compliance with debt covenants.
The majority of cash is invested in money market funds or bank deposits with overnight accessibility. In addition, the Company maintains a $
Commercial Paper Program
The Company’s $
Credit Facility
In November 2025, the Company amended and restated its credit facility agreement to extend the maturity date to November 2030, with no other material changes to terms and conditions. The $
The Company guarantees borrowings by its subsidiaries under the credit facility. The Company must also maintain a ratio of net debt as defined in the credit agreement (total debt plus hedging agreements, less cash and cash equivalents) as of the last day of each fiscal quarter to EBITDA as defined in the credit agreement (earnings before interest, income taxes, depreciation and amortization and other modifications described in the credit agreement) for the last four quarters ended of not more than
Page 136 |
Thomson Reuters Annual Report 2025 |
The tables below set forth non-derivative and derivative financial liabilities by maturity based on the remaining period from December 31, 2025 and 2024, respectively, to the contractual maturity date. The amounts disclosed are the contractual undiscounted cash flows.
December 31, 2025 |
2026 |
2027 |
2028 |
2029 |
2030 |
Thereafter |
Total |
Commercial paper |
|||||||
Notes/debentures(1) |
|||||||
Interest payable(1) |
|||||||
Debt-related hedges outflows(2) |
|||||||
Debt-related hedges inflows(1) |
( |
( |
( |
( |
( |
( |
( |
Trade payables |
|||||||
Accruals |
|||||||
Lease liabilities |
|||||||
Other financial liabilities |
|||||||
Total |
|||||||
|
|
|
|
|
|
|
|
December 31, 2024 |
2025 |
2026 |
2027 |
2028 |
2029 |
Thereafter |
Total |
Notes/debentures(1) |
|||||||
Interest payable(1) |
|||||||
Debt-related hedges outflows(3) |
|||||||
Debt-related hedges inflows(1) |
( |
( |
|||||
Trade payables |
|||||||
Accruals |
|||||||
Lease liabilities |
|||||||
Other financial liabilities |
|||||||
Total |
(1) Represents contractual cash flows.
(2) Represents contractual cash flows calculated using observable forward curves as of the period then ended.
(3) Represents contractual cash flows calculated using spot foreign exchange rates as of the period then ended.
Capital Management
The Company’s capital management strategy is focused on ensuring that it has the investment capacity to drive revenue growth both organically and through acquisitions, while also maintaining its long-term financial leverage and credit ratings and continuing to provide returns to shareholders.
The Company’s principal sources of liquidity are cash and cash equivalents and cash provided by operating activities. From time to time, the Company issues commercial paper, issues debt securities and borrows under its credit facility. The Company’s principal uses of cash are for debt repayments, debt servicing costs, dividend payments, capital expenditures, share repurchases and acquisitions. The Company believes that its existing sources of liquidity will be sufficient to fund its expected cash requirements in the normal course of business for the next 12 months.
Additionally, the Company targets a leverage ratio of net debt, as defined below, to adjusted EBITDA of 2.5x as a measure of its financial flexibility and ability to maintain investment grade credit ratings. As of December 31, 2025, the Company was below its target ratio.
The Company’s investment grade credit ratings provide additional financial flexibility and the ability to borrow to support the operations and growth strategies of the business.
|
Moody's |
|
S&P Global Ratings |
|
Fitch |
Long-term debt |
|
|
|||
Commercial paper |
|
|
|||
Trend/Outlook |
|
|
Thomson Reuters Annual Report 2025 |
Page 137 |
Net debt is defined as total debt plus related hedging instruments and collateral balances, along with lease liabilities, excluding unamortized transaction costs and any premiums or discounts on debt, minus cash and cash equivalents. The Company excludes specific hedging components to reflect the net cash outflow upon debt maturity. As the Company hedges some of its debt to manage risk, the hedging instruments are included in the measurement of the total obligation associated with its outstanding debt. However, because the Company generally intends to hold the debt and related hedges to maturity, the net debt calculation is adjusted to reflect the net cash outflow at maturity, after deducting cash and cash equivalents.
The following table presents the calculation of net debt:
|
|
|
December 31, |
||
(millions of U.S. dollars) |
|
|
2025 |
|
2024 |
Current indebtedness |
|
|
|
||
Long-term indebtedness |
|
|
|
||
Total debt |
|
|
|
||
Swaps |
|
|
|
||
Total debt after swaps |
|
|
|
||
Remove fair value adjustments for hedges(1) |
|
|
( |
|
|
Total debt after hedging arrangements |
|
|
|
||
Collateral assets |
|
|
( |
|
|
Remove transaction costs, premiums or discounts, included in the carrying |
|
|
|||
Add: Lease liabilities (current and non-current) |
|
|
|
||
Less: Cash and cash equivalents |
|
|
( |
|
( |
Net debt |
|
|
|
||
The following reconciles movements of liabilities to cash flows arising from financing activities for the years ended December 31, 2025 and 2024:
(millions of U.S. dollars) |
|
Notes and Debentures |
Commercial |
Derivative Instruments (Assets) Liabilities |
|
Lease |
Total Liabilities From Financing Activities |
December 31, 2023 |
|
( |
|
||||
Repayments of debt |
|
( |
|
( |
|||
Proceeds from commercial paper |
|
|
|||||
Repayments of commercial paper |
|
( |
|
( |
|||
Payments of lease principal |
|
|
( |
( |
|||
Additional leases |
|
|
|||||
Acquisitions |
|
|
|||||
Foreign exchange movements |
|
( |
|
( |
( |
||
Other, net(1) |
|
( |
|
||||
December 31, 2024 |
|
|
|||||
Repayments of debt |
|
( |
- |
|
- |
( |
|
Proceeds from commercial paper |
|
- |
- |
|
- |
||
Repayments of commercial paper |
|
- |
( |
- |
|
- |
( |
Payments of lease principal |
|
- |
- |
- |
|
( |
( |
Additional leases |
|
- |
- |
- |
|
||
Acquisitions |
|
- |
- |
- |
|
||
Interest fair value movements |
|
( |
- |
|
- |
||
Foreign exchange movements |
|
- |
( |
|
|||
Other, net(2) |
|
( |
- |
|
( |
( |
|
December 31, 2025 |
|
|
Page 138 |
Thomson Reuters Annual Report 2025 |
Fair value estimation
The following fair value measurement hierarchy is used for financial instruments that are measured in the consolidated statement of financial position at fair value:
The levels used to determine fair value measurements for those instruments carried at fair value in the consolidated statement of financial position are as follows:
December 31, 2025 |
|
|
|
|
|
Total |
(millions of U.S. dollars) |
|
|
Level 1 |
Level 2 |
Level 3 |
Balance |
Assets |
|
|
|
|
|
|
Money market accounts and other securities |
||||||
Other receivables(1) |
|
|
||||
Financial assets at fair value through earnings |
||||||
Financial assets at fair value through other comprehensive income(2) |
- |
|||||
Total assets |
|
|
||||
Liabilities |
|
|
|
|
|
|
Derivatives used for hedging(3) |
|
|
( |
( |
||
Contingent consideration(4) |
|
|
( |
( |
||
Financial liabilities at fair value through earnings |
( |
( |
( |
|||
Total liabilities |
|
|
( |
( |
( |
|
|
|
|
|
|
|
|
December 31, 2024 |
|
|
|
|
|
Total |
(millions of U.S. dollars) |
|
|
Level 1 |
Level 2 |
Level 3 |
Balance |
Assets |
|
|
|
|
|
|
Money market accounts and other securities |
||||||
Other receivables(1) |
|
|
||||
Financial assets at fair value through earnings |
||||||
Financial assets at fair value through other comprehensive income(2) |
||||||
Total assets |
|
|
||||
Liabilities |
|
|
|
|
|
|
Derivatives used for hedging(3) |
|
|
( |
( |
||
Contingent consideration(4) |
|
|
( |
( |
||
Financial liabilities at fair value through earnings |
( |
( |
( |
|||
Total liabilities |
|
|
( |
( |
( |
|
As of December 31, 2025, other receivables in level 3 of the fair value measurement hierarchy include $
As of December 31, 2025, investments in level 3 financial assets measured at fair value through other comprehensive income was $
Thomson Reuters Annual Report 2025 |
Page 139 |
The Company recognizes transfers into and out of the fair value measurement hierarchy levels at the end of the reporting period in which the event or change in circumstances that caused the transfer occurred. There were no transfers between hierarchy levels for the year ended December 31, 2025.
Valuation Techniques
The fair value of financial instruments that are not traded in an active market (for example, over-the-counter derivatives) is determined by using valuation techniques. These valuation techniques maximize the use of observable market data where it is available and rely as little as possible on entity specific estimates. If all significant inputs required to fair value an instrument are observable, the instrument is included in level 2. If one or more of the significant inputs is not based on observable market data, the instrument is included in level 3.
Specific valuation techniques used to value financial instruments include:
Offsetting Financial Assets and Financial Liabilities
The Company is subject to master netting arrangements with certain counterparties. Certain of these arrangements allow for the netting of assets and liabilities in the ordinary course of business and are reflected on a net basis in the consolidated statement of financial position. In other circumstances, netting is permitted only in the event of bankruptcy or default of either party to the agreement, and such amounts are not netted in the consolidated statement of financial position.
Financial assets |
|
Gross Financial Assets |
Gross Financial Liabilities Netted Against Assets |
Net Financial Assets in the Consolidated Statement of Financial Position |
Related Financial Liabilities Not Netted |
Net Amount |
|
Cash and cash equivalents |
|
(1) |
|||||
Cash collateral |
|
(2) |
( |
||||
December 31, 2025 |
|
|
( |
||||
Cash and cash equivalents |
|
(1) |
|||||
December 31, 2024 |
|
|
|||||
|
|
|
|
|
|
|
|
Financial liabilities |
|
Gross Financial Liabilities |
Gross Financial Assets Netted Against Liabilities |
Net Financial Liabilities in the Consolidated Statement of Financial Position |
Related Financial Assets Not Netted |
Net Amount |
|
Derivative financial liabilities |
|
(3) |
( |
||||
December 31, 2025 |
|
|
( |
||||
Derivative financial liabilities |
|
(3) |
|||||
December 31, 2024 |
|
|
|||||
Page 140 |
Thomson Reuters Annual Report 2025 |
Note 21: Other Non-Current Assets
The components of other non-current assets include the following:
|
|
|
December 31, |
||
(millions of U.S. dollars) |
|
|
2025 |
|
2024 |
Cash surrender value of life insurance policies |
|
|
|
||
Deferred commissions |
|
|
|
||
Net defined benefit plan surpluses (see note 27) |
|
|
|
||
Other non-current assets(1) |
|
|
|
||
Total other non-current assets |
|
|
|
||
Note 22: Payables, Accruals and Provisions
The components of payables, accruals and provisions include the following:
|
|
|
December 31, |
||
(millions of U.S. dollars) |
|
|
2025 |
|
2024 |
Trade payables |
|
|
|
||
Accruals |
|
|
|
||
Provisions (see note 23) |
|
|
|
||
Other current liabilities |
|
|
|
||
Total payables, accruals and provisions |
|
|
|
||
Note 23: Provisions and Other Non-Current Liabilities
The components of provisions and other non-current liabilities include the following:
|
|
|
December 31, |
||
(millions of U.S. dollars) |
|
|
2025 |
|
2024 |
Net defined benefit plan obligations (see note 27) |
|
|
|
||
Deferred compensation and employee incentives |
|
|
|
||
Provisions |
|
|
|
||
Other non-current liabilities |
|
|
|
||
Total provisions and other non-current liabilities |
|
|
|
||
The following table presents the movement in provisions for the years ended December 31, 2025 and 2024:
(millions of U.S. dollars) |
|
|
Employee- |
Facilities- |
Other |
Total |
Balance as of December 31, 2023 |
|
|
||||
Charges |
|
|
||||
Utilization |
|
|
( |
( |
( |
( |
Translation and other, net |
|
|
( |
( |
( |
|
Balance as of December 31, 2024 |
|
|
||||
Less: short-term provisions |
|
|
||||
Long-term provisions |
|
|
||||
Balance as of December 31, 2024 |
|
|
||||
Charges |
|
|
||||
Utilization |
|
|
( |
( |
( |
( |
Translation and other, net |
|
|
||||
Balance as of December 31, 2025 |
|
|
||||
Less: short-term provisions |
|
|
||||
Long-term provisions |
|
|
Employee-related
The employee-related provisions consisted of severance.
Thomson Reuters Annual Report 2025 |
Page 141 |
Facilities-related
Facilities-related provisions include lease retirement obligations, which arise when the Company agrees to restore a leased property to a specified condition at the completion of the lease period. Lease retirement provisions relate primarily to leases which expire over the next
Other
Other includes provisions related to items such as disposed businesses, legal matters and health care.
Note 24: Deferred Tax
The movements of deferred tax assets and liabilities are shown below:
Deferred tax liabilities |
|
|
Goodwill and Other Identifiable Intangible Assets |
Equity Method Investments |
Other |
Total |
December 31, 2023 |
|
|
||||
Acquisitions |
|
|
||||
Benefit to income statement - continuing |
|
|
( |
( |
( |
( |
Expense to other comprehensive income |
|
|
||||
Translation and other, net |
|
|
( |
( |
||
December 31, 2024 |
|
|
||||
Acquisitions |
|
|
||||
Expense (benefit) to income statement - |
|
|
( |
|||
Expense to other comprehensive income |
|
|
||||
Translation and other, net |
|
|
( |
( |
||
December 31, 2025 |
|
|
Deferred tax assets |
Tax Losses and Other Attributes |
|
Goodwill and Other Identifiable Intangible Assets |
Employee Benefits and Compensation |
Other |
Total |
December 31, 2023 |
|
|||||
Acquisitions |
|
|||||
Benefit (expense) to income statement - |
|
( |
||||
Expense to other comprehensive income |
|
( |
( |
( |
||
Expense to equity |
|
( |
( |
|||
Translation and other, net |
( |
|
( |
( |
( |
|
December 31, 2024 |
|
|||||
Acquisitions |
|
( |
||||
Benefit (expense) to income statement - |
|
( |
( |
( |
||
Expense to other comprehensive income |
|
( |
( |
|||
Expense to equity |
|
( |
( |
|||
Translation and other, net |
|
( |
||||
December 31, 2025 |
|
|||||
Net deferred tax asset as of December 31, 2024 |
|
|
|
|
||
Net deferred tax asset as of December 31, 2025 |
|
|
|
|
||
In 2024, the Company recognized $
Page 142 |
Thomson Reuters Annual Report 2025 |
The estimated recovery period for the deferred tax balances, which is based on the classification of the underlying items in the consolidated statement of financial position, is shown below:
|
|
|
December 31, |
||
(millions of U.S. dollars) |
|
|
2025 |
|
2024 |
Deferred tax liabilities |
|
|
|
|
|
Deferred tax liabilities to be recovered after more than 12 months |
|
|
|
||
Deferred tax liabilities to be recovered within 12 months |
|
|
|
||
Total deferred tax liabilities |
|
|
|
||
Deferred tax assets |
|
|
|
|
|
Deferred tax assets to be recovered after more than 12 months |
|
|
|
||
Deferred tax assets to be recovered within 12 months |
|
|
|
||
Total deferred tax assets |
|
|
|
||
Net deferred tax asset |
|
|
|
||
Deferred tax assets are recognized to the extent that the realization of the related tax benefit through future taxable profits and the resolution of uncertain tax positions is probable. The ability to realize these deferred tax benefits is dependent on a number of factors, including the future profitability of operations and the resolution of tax audits in the jurisdictions in which the deferred tax assets arose.
As of December 31, 2025, the following summarizes the Company’s tax losses, certain deductible temporary differences and other tax attributes:
(millions of U.S. dollars) |
|
|
Carry Forward Loss/ Tax Attributes |
Tax |
Unrecognized Deferred Tax Assets |
Net Deferred Tax Assets |
|
Canadian net operating losses |
|
|
|
( |
|||
Net operating losses - other jurisdictions |
|
( |
|||||
Capital losses |
|
|
|
( |
|||
Investment in subsidiaries |
|
|
|
( |
|||
Other deductible temporary differences |
|
( |
|||||
U.S. state net operating losses(1) |
|
|
|
( |
|||
Total |
|
|
|
( |
|||
If not utilized, most of the Canadian tax losses carried forward will expire between 2029 and 2045. Approximately $
No deferred tax is recognized on the temporary differences associated with investments in subsidiaries and equity method investments to the extent that the Company can control the timing and reversal of such differences, or the reversal would not create a tax liability. These temporary differences are primarily attributable to the undistributed earnings of non-Canadian subsidiaries, which were $
Note 25: Capital
The change in capital, which includes stated share capital and contributed surplus, are as follows:
(millions of U.S. dollars) |
|
Number of Common Shares |
Stated Share Capital |
Series II, Cumulative Redeemable Preference Share Capital |
|
Contributed Surplus |
Total Capital |
Balance, December 31, 2023 |
|
$ |
$ |
|
$ |
$ |
|
Shares issued under DRIP |
|
|
|||||
Stock compensation plans(1) |
|
|
( |
||||
Repurchases of common shares |
|
( |
( |
|
( |
||
Balance, December 31, 2024 |
|
|
|||||
Shares issued under DRIP |
|
|
|||||
Stock compensation plans(1) |
|
|
( |
||||
Repurchases of common shares |
|
( |
( |
|
( |
||
Balance, December 31, 2025 |
|
$ |
$ |
|
$ |
$ |
Thomson Reuters Annual Report 2025 |
Page 143 |
Common shares of the Company have no par value and the authorized common share capital is an unlimited number of shares.
Dividends
Dividends on common shares are declared in U.S. dollars. In the consolidated statement of cash flow, dividends paid on common shares are shown net of amounts reinvested in the Company under its DRIP.
Details of dividends declared per common share and dividends paid on common shares are as follows:
|
|
|
Year ended December 31, |
||
(millions of U.S. dollars, except per share amounts) |
|
|
2025 |
|
2024 |
Dividends declared per common share |
|
|
$ |
|
$ |
Dividends declared |
|
|
|
||
Dividends reinvested |
|
|
( |
|
( |
Dividends paid |
|
|
|
||
Registered holders of common shares may participate in the DRIP, under which cash dividends are automatically reinvested in new common shares. Common shares are valued at the weighted-average price at which the shares traded on the TSX during the five trading days immediately preceding the record date for the dividend.
Share Repurchases – Normal Course Issuer Bid (“NCIB”)
The Company buys back shares (and subsequently cancels them) from time to time as part of its capital strategy. Share repurchases are typically executed under a NCIB program, which is approved by the TSX. The current NCIB program, as amended in February 2026, allows the Company to repurchase up to
In February 2026, we announced our plan to repurchase up to $
In August 2025, the Company announced its intention to repurchase up to $
Prior to the 2025 share repurchase program, the Company also completed a $
The Company may repurchase common shares in open market transactions on the TSX, Nasdaq and/or other exchanges and alternative trading systems, if eligible, or by such other means as may be permitted by the TSX and/or Nasdaq or under applicable law, including private agreement purchases or share purchase program agreement purchases, if the Company receives, if applicable, an issuer bid exemption order in the future from applicable securities regulatory authorities in Canada for such purchases. The price that the Company will pay for common shares in open market transactions will be the market price at the time of purchase or such other price as may be permitted by the TSX.
Details of share repurchases are as follows:
|
|
|
Year ended December 31, |
||
|
|
|
2025 |
|
2024 |
Share repurchases (millions of U.S. dollars) |
|
|
|
||
Shares repurchased (number in millions) |
|
|
|
||
Share repurchases - average price per share |
|
|
$ |
|
$ |
Decisions regarding any future repurchases will depend on certain factors, such as market conditions, share price, and other opportunities to invest capital for growth. The Company may elect to suspend or discontinue share repurchases at any time, in accordance with applicable laws. From time to time when the Company does not possess material nonpublic information about itself or its securities, it may enter into a pre-defined plan with its broker to allow for the repurchase of shares at times when the Company ordinarily would not be active in the market due to its own internal trading blackout periods, insider trading rules or otherwise. Any such plans entered into with the Company’s broker will be adopted in accordance with applicable Canadian securities laws and the requirements of Rule 10b5-1 under the U.S. Securities Exchange Act of 1934, as amended.
Excise taxes payable totaled $
Page 144 |
Thomson Reuters Annual Report 2025 |
Series II, Cumulative Redeemable Preference Shares
The authorized preference share capital of the Company is an unlimited number of preference shares without par value. The directors are authorized to issue preference shares without par value in one or more series, and to determine the number of shares in and terms attaching to, each such series. As of December 31, 2025 and 2024,
Note 26: Share-Based Compensation
The Company operates equity-settled compensation plans under which it receives services from employees as consideration for equity instruments of the Company. Each plan is described below:
Stock Incentive Plan
Under its stock incentive plan, the Company may grant stock options, TRSUs, performance restricted share units (“PRSUs”) and other awards to certain employees for a maximum of up to
Type of equity-settled award |
Vesting period |
Fair Value Measure |
Compensation expense based on: |
Stock options |
option pricing model |
to grant date |
|
TRSUs |
share price |
to grant date |
|
PRSUs |
performance period |
share price |
to grant date and adjusting the number of awards expected to vest based on company performance |
Additional information on each type of award is as follows:
Stock Options
The maximum term of an option is
The weighted-average fair value of options granted for the years ended December 31, 2025 and 2024 and principal assumptions used in applying the Black-Scholes option pricing model are as follows:
|
|
|
Year ended December 31, |
||
|
|
|
2025 |
|
2024 |
Weighted-average fair value |
|
|
$ |
|
$ |
Weighted-average of key assumptions: |
|
|
|
|
|
Share price |
|
|
$ |
|
$ |
Exercise price |
|
|
$ |
|
$ |
Risk-free interest rate |
|
|
|
||
Dividend yield |
|
|
|
||
Volatility factor |
|
|
|
||
Expected life (in years) |
|
|
|
||
The Black-Scholes model was developed for use in estimating the fair value of traded options that have no vesting restrictions. The model requires the use of subjective assumptions, including expected stock-price volatility. Historical data has been considered in setting the assumptions.
Time-Based Restricted Share Units ("TRSUs")
TRSUs give the holder the right to receive one common share for each unit that vests on the vesting date. The holders of TRSUs have no voting rights and accumulate additional units based on notional dividends paid by the Company on its common shares on each dividend payment date, which are reinvested as additional TRSUs. The weighted-average fair value of TRSUs granted was $
Thomson Reuters Annual Report 2025 |
Page 145 |
Performance Restricted Share Units ("PRSUs")
PRSUs give the holder the right to receive one common share for each unit that vests on the vesting date. The holders of PRSUs have no voting rights and accumulate additional units based on notional dividends paid by the Company on its common shares on each dividend payment date, which are reinvested as additional PRSUs. The percentage of PRSUs initially granted that vests depends upon the Company’s performance, typically over a
Employee Stock Purchase Plan ("ESPP")
The Company maintains an ESPP whereby eligible employees can purchase common shares at a
The movement in the number of awards outstanding and their related weighted-average exercise prices are as follows:
Awards outstanding (in thousands): |
Stock Options |
TRSUs |
PRSUs |
Total |
Weighted-Average Exercise |
Outstanding as of December 31, 2023 |
$ |
||||
Granted |
$ |
||||
Exercised |
( |
( |
( |
( |
$ |
Forfeited |
( |
( |
( |
( |
$ |
Outstanding as of December 31, 2024 |
$ |
||||
Exercisable as of December 31, 2024 |
$ |
||||
Granted |
$ |
||||
Exercised |
( |
( |
( |
( |
$ |
Forfeited |
( |
( |
( |
( |
$ |
Outstanding as of December 31, 2025 |
$ |
||||
Exercisable as of December 31, 2025 |
$ |
In 2025, the weighted-average share price at the time of exercise for the awards described above was $
Share-based compensation expense for years ended December 31, 2025 and 2024 are as follows:
(millions of U.S. dollars) |
|
Stock Options |
TRSUs |
PRSUs |
|
ESPP |
Total |
December 31, 2025 |
|
|
|||||
December 31, 2024 |
|
|
Relative to the share-based awards outstanding as of December 31, 2025, the Company expects to pay approximately $
The following table summarizes additional information relating to stock options outstanding as of December 31, 2025:
Range of exercise prices(1) |
|
Number Outstanding (in thousands) |
Weighted-Average Remaining Contractual Life (years) |
Weighted-Average Exercise Price for Awards Outstanding |
|
Number Exercisable |
Weighted-Average Exercise Price for Awards Exercisable |
$50.01 - $55.00 |
|
$ |
|
$ |
|||
$75.01 - $80.00 |
|
$ |
|
$ |
|||
$85.01 - $90.00 |
|
$ |
|
$ |
|||
$100.01 - $105.00 |
|
$ |
|
$ |
|||
$120.01 - $125.00 |
|
$ |
|
$ |
|||
$155.01 - $160.00 |
|
$ |
|
$ |
|||
$165.01 - $195.00 |
|
$ |
|
$ |
|||
Total |
|
|
|
|
|
Page 146 |
Thomson Reuters Annual Report 2025 |
Note 27: Employee Benefit Plans
Retirement Benefits
The Company sponsors both defined benefit and defined contribution employee future benefit plans covering substantially all employees. Costs for future employee benefits are accrued over the periods in which employees earn the benefits. Defined benefit plans provide pension and other post-employment benefits (“OPEB”) to covered employees. Significant plans are valued under IAS 19, Employee Benefits, using the projected unit credit method.
The most significant funded defined benefit plans are the Thomson Reuters Group Pension Plan (“TRGP”), covering U.S. employees, and The Thomson Corporation PLC Pension Scheme (“TTC”), covering U.K. employees. The TRGP and TTC plans were frozen from future service accruals effective January 1, 2023 and July 1, 2021, respectively. Except where required by law, virtually all defined benefit plans are closed to new employees. The Company also has unfunded obligations consisting of supplemental executive retirement plans (“SERPs”) and OPEB consisting largely of retiree medical benefits, both primarily in the U.S. Defined benefit obligations in the rest of the world are less significant.
Defined benefit plan design and governance
Benefits are generally based on salary and years of service, although each plan has a unique benefits formula. The normal retirement age is typically in the range of
The TRGP is a qualified pension plan in the U.S. and is governed by the Employee Retirement Income Security Act of 1974 (“ERISA”). In its role as plan fiduciary, the Company has a policy to contribute at least the minimum required amount under ERISA.
Similar to the TRGP, the Company bears the cost of the TTC plan (less employee contributions). However, the responsibility for the management and governance of the TTC plan lies with an independent trustee board (the “Trustees”). The Trustees are responsible for carrying out triennial valuations (unless circumstances require an earlier review) and securing funding for benefit payments. To develop funding valuations and investment policies, the Trustees consult with the plan’s actuary (who is independent of the Company’s actuary), the plan’s investment advisors (also independent of the Company’s investment advisors) and the Company. The Trustees and the Company are required to agree on a schedule of contributions in support of funding objectives. These arrangements are updated in conjunction with the triennial valuations.
Other international locations operate various pension plans in accordance with local regulations and practices.
Plan amendment
In the third quarter of 2024, retiree medical benefits in the U.S. were amended with effect from January 1, 2025 to transition to a health reimbursement arrangement ("HRA") where the Company provides a fixed subsidy to plan participants that may be used to purchase healthcare insurance on the individual marketplace. Previously, the Company delivered benefits through a combination of self-insured and fully-insured models. The amendment resulted in a gain of $
Thomson Reuters Annual Report 2025 |
Page 147 |
Net defined benefit plan obligations
The movement on net defined benefit plan obligations is as follows:
(millions of U.S. dollars) |
Pension Plans(1) |
|
OPEB(1) |
|
Total(1) |
|||
|
2025 |
2024 |
|
2025 |
2024 |
|
2025 |
2024 |
As of January 1 |
( |
( |
|
( |
( |
|
( |
( |
Plan (expense) benefit recognized in income |
( |
( |
|
( |
|
( |
( |
|
Actuarial gains (losses) |
|
( |
|
|||||
Exchange differences |
|
( |
|
( |
||||
Contributions paid |
|
|
||||||
Net plan obligations as of December 31 |
( |
( |
|
( |
( |
|
( |
( |
Net plan surpluses recognized in non-current assets |
|
|||||||
Net plan obligations recognized in non-current liabilities |
|
|
( |
( |
||||
Analysis of material defined benefit plans
The following analysis relates to the Company’s most significant defined benefit plans, the largest of which are in the U.S. and the U.K.
The net surpluses (obligations) of the material defined benefit plans recognized in the consolidated statement of financial position are as follows:
(millions of U.S. dollars) |
Funded |
|
Unfunded(1) |
|
OPEB |
|
Total |
||||
As of December 31, |
2025 |
2024 |
|
2025 |
2024 |
|
2025 |
2024 |
|
2025 |
2024 |
Present value of plan obligations |
( |
( |
|
( |
( |
|
( |
( |
|
( |
( |
Fair value of plan assets |
|
|
|
||||||||
Net plan obligations |
( |
( |
|
( |
( |
|
( |
( |
|
( |
( |
Net plan surpluses |
|
|
|
||||||||
Net plan obligations |
( |
( |
|
( |
( |
|
( |
( |
|
( |
( |
Defined benefit obligation
The following summarizes activity in the defined benefit obligation:
Present Value of Defined Benefit |
Funded |
|
Unfunded |
|
OPEB |
|
Total |
||||
As of December 31, |
2025 |
2024 |
|
2025 |
2024 |
|
2025 |
2024 |
|
2025 |
2024 |
Opening defined benefit obligation |
( |
( |
|
( |
( |
|
( |
( |
|
( |
( |
Current service cost |
( |
( |
|
( |
( |
|
( |
|
( |
( |
|
Administration fees |
( |
( |
|
|
|
( |
( |
||||
Interest cost |
( |
( |
|
( |
( |
|
( |
( |
|
( |
( |
Actuarial (losses) gains from changes in |
( |
|
( |
|
( |
|
( |
||||
Actuarial gains from changes in demographic |
|
|
|
||||||||
Experience (losses) gains |
( |
( |
|
( |
|
( |
|
( |
( |
||
Contributions by employees |
( |
( |
|
|
( |
|
( |
( |
|||
Benefits paid |
|
|
|
||||||||
Administration fees disbursements |
|
|
|
||||||||
Plan amendments |
( |
|
|
( |
|
( |
|||||
Exchange differences |
( |
|
( |
|
|
( |
|||||
Closing defined benefit obligation |
( |
( |
|
( |
( |
|
( |
( |
|
( |
( |
Page 148 |
Thomson Reuters Annual Report 2025 |
The total closing defined benefit obligation can be further analyzed by participant group and by geography.
As of December 31, |
2025 |
2024 |
|
As of December 31, |
2025 |
2024 |
Active employees |
|
U.S. |
||||
Deferred |
|
U.K. |
||||
Retirees |
|
Rest of world |
||||
Closing defined benefit obligation |
|
|
The weighted-average duration of plan obligations for the TRGP and TTC in 2025 was
Plan assets
The following summarizes activity in plan assets:
Fair Value of Plan Assets |
Funded |
|
Unfunded |
|
OPEB |
|
Total |
||||
As of December 31, |
2025 |
2024 |
|
2025 |
2024 |
|
2025 |
2024 |
|
2025 |
2024 |
Opening fair value of plan assets |
|
|
|
||||||||
Interest income(1) |
|
|
|
||||||||
Return on plan assets excluding amounts |
( |
|
|
|
( |
||||||
Contributions by employer |
|
|
|
||||||||
Contributions by employees |
|
|
|
||||||||
Benefits paid |
( |
( |
|
( |
( |
|
( |
( |
|
( |
( |
Administration fees disbursements |
( |
( |
|
|
|
( |
( |
||||
Exchange differences |
( |
|
|
|
( |
||||||
Closing fair value of plan assets |
|
|
|
||||||||
Investment policy of funded plans
Plan assets are invested to adequately secure benefits and to minimize the Company’s long-term contributions to the plans. However, specific investment allocations will vary across plans. The Company funds unfunded and OPEB plans as claims are made.
Plan fiduciaries, comprised of the Company, plan trustees, or third-party investment advisors selected by the Company set investment policies and strategies for each funded plan and oversee investment allocation, which includes selecting investment managers, commissioning periodic asset-liability studies and setting long-term strategic targets. Investment allocation considers various factors including the funded status of the plan, a balance between risk and return, the plan’s liquidity needs, current and expected economic and market conditions, specific asset class risk as well as the risk profile and maturity pattern of the respective plan.
Target investment allocation ranges are guidelines, not limitations. Funded plans may have broadly diversified portfolios with investments in equities, fixed income, real estate, insurance contracts, derivatives and other asset classes through direct ownership or through other instruments such as mutual funds, commingled funds and hedge funds. Derivatives, repurchase agreements and other financial instruments may also be used to achieve investment objectives or as a component of risk management such as for interest rate and currency management strategies.
Thomson Reuters Annual Report 2025 |
Page 149 |
In aggregate, the major categories of plan assets for funded plans are as follows:
(millions of U.S. dollars) |
Quoted(1) |
|
Unquoted |
|
Total |
|||
As of December 31, |
2025 |
2024 |
|
2025 |
2024 |
|
2025 |
2024 |
Equities(2) |
|
|
||||||
Bonds(3)(4) |
|
|
|
|
|
|
|
|
Corporate |
|
|
||||||
Government |
|
|
||||||
Other fixed income |
|
|
||||||
Total Bonds |
|
|
||||||
Multi-asset(5) |
|
|
||||||
Derivatives |
( |
( |
|
|
( |
( |
||
Cash and cash equivalents |
|
|
||||||
Other(6) |
|
|
||||||
Total |
|
|
||||||
These portfolios are diversified in terms of geographic distribution and market sectors. As of December 31, 2025 and 2024, there were
Contributions
In 2025 and 2024, the Company contributed $
In 2026, the Company expects to contribute approximately $
From time to time, the Company may elect to make voluntary contributions to improve the funded status of the plans. For certain plans, the trustees have the right to call for special valuations, which could subsequently result in the Company having to make an unexpected contribution. Market-related factors may also affect the timing and amount of contributions. The amount and timing of any future required contributions to pension plans could differ significantly from the Company’s estimates as of December 31, 2025.
Actuarial assumptions
The weighted-average actuarial assumptions are as follows:
|
|
|
|
Funded |
|
Unfunded |
|
OPEB |
|||
As of December 31, |
|
|
|
2025 |
2024 |
|
2025 |
2024 |
|
2025 |
2024 |
Discount rate |
|
|
|
|
|
||||||
Inflation assumption |
|
|
|
|
|
||||||
Rate of increase in pension payments |
|
|
|
|
|
||||||
Discount rate
The discount rate was based on current market interest rates of high-quality, fixed-rate debt securities adjusted to reflect the duration of expected future cash outflows for pension benefit payments. To estimate the discount rate, the Company used a hypothetical yield curve that represented yields on high quality zero-coupon bonds with durations that mirrored the expected payment stream of the benefit obligation. For the TRGP and the TTC plans combined, a
Rates of inflation and pension payments
The rate of inflation, which impacts increases in eligible U.K. pension payments, was determined by reference to consumer and retail price indices. For the TTC plan, a
Page 150 |
Thomson Reuters Annual Report 2025 |
Mortality assumptions
The mortality assumptions used to assess the defined benefit obligation as of December 31, 2025 are based on the following:
The following table illustrates the life expectation in years of an average plan participant retiring at age
|
|
|
|
|
Life Expectation in Years |
|
December 31, 2025 |
|
|
|
|
Male |
Female |
Employee retiring as of December 31, 2025 at age 65 |
||||||
Employee age 40 as of December 31, 2025 retiring at age 65 |
||||||
|
|
|
|
|
|
|
|
|
|
|
|
Life Expectation in Years |
|
December 31, 2024 |
|
|
|
|
Male |
Female |
Employee retiring as of December 31, 2024 at age 65 |
||||||
Employee age 40 as of December 31, 2024 retiring at age 65 |
||||||
For the TRGP and the TTC plans combined, an increase in life expectancy of
The sensitivity analyses are based on a change in one assumption while holding all other assumptions constant, so that interdependencies between assumptions are excluded. The measurement methodology (i.e. present value of the obligation calculated using the projected unit credit method) applied in the sensitivity analyses is also consistent with that used to determine the defined benefit obligation in the consolidated statement of financial position.
Risks and uncertainties
The material risks and uncertainties the Company is exposed to in relation to defined benefit pension plans are:
For defined benefit retiree medical plans, the material risk is mortality risk, as described above. Inflation of future medical costs or the frequency of participants’ claims being greater than assumed are no longer risks to higher costs effective January 1, 2025, upon adoption of the HRA design. See “Plan amendment” above for additional information.
Thomson Reuters Annual Report 2025 |
Page 151 |
Analysis of income and expense
Defined benefit plan expense (income) for material defined benefit plans for years ended December 31, 2025 and 2024 are as follows:
Income Statement(1) |
Funded |
|
Unfunded |
|
OPEB |
|
Total |
||||
Year ended December 31, |
2025 |
2024 |
|
2025 |
2024 |
|
2025 |
2024 |
|
2025 |
2024 |
Current service cost |
|
|
|
||||||||
Net interest cost |
|
|
|
||||||||
Administration fees |
|
|
|
||||||||
Plan amendments |
|
|
( |
|
( |
||||||
Defined benefit plan expense (income) |
|
|
( |
|
|||||||
Analysis of other comprehensive (income) loss
The following summarizes amounts recognized in other comprehensive (income) loss for material defined benefit plans:
Other Comprehensive (Income) Loss |
Funded |
|
Unfunded |
|
OPEB |
|
Total |
||||
Year ended December 31, |
2025 |
2024 |
|
2025 |
2024 |
|
2025 |
2024 |
|
2025 |
2024 |
Remeasurement losses (gains) on defined |
|
|
|
|
|
|
|
|
|
|
|
Due to financial assumption changes |
( |
|
( |
|
( |
|
( |
||||
Due to demographic assumption changes |
( |
|
|
|
( |
||||||
Due to experience |
|
|
( |
|
|||||||
Return on plan assets (greater than) less |
( |
|
|
|
|
( |
|||||
Total recognized in other comprehensive |
( |
( |
|
( |
|
( |
|
( |
( |
||
Accumulated Comprehensive Loss |
Funded |
|
Unfunded |
|
OPEB |
|
Total |
||||
|
2025 |
2024 |
|
2025 |
2024 |
|
2025 |
2024 |
|
2025 |
2024 |
Balance of accumulated comprehensive loss |
|
|
( |
( |
|
||||||
Net actuarial (gains) losses recognized in the |
( |
( |
|
( |
|
( |
|
( |
( |
||
Total accumulated comprehensive loss |
|
|
( |
( |
|
||||||
Defined contribution plans
The Company sponsors various defined contribution savings plans that provide for Company matching contributions. Total expense related to defined contribution plans was $
Page 152 |
Thomson Reuters Annual Report 2025 |
Note 28: Leases
Lessee
In the ordinary course of business, the Company enters into leases primarily for property and equipment.
(millions of U.S. dollars) |
|
Land, Buildings and Building Improvements |
Computer Equipment |
|
Furniture, Fixtures and Other Equipment |
Total |
Year ended December 31, 2025 |
|
|
|
|
|
|
Carrying amount |
|
|
||||
Depreciation |
|
|
||||
Year ended December 31, 2024 |
|
|
|
|
|
|
Carrying amount |
|
|
||||
Depreciation |
|
|
For the years ended December 31, 2025 and 2024, cash outflows for leases, which include payments of lease principal, interest, short-term and low value leases, were $
The following table sets forth the Company’s future aggregate undiscounted non-cancellable lease payments over the lease term as well as its discounted lease liabilities as reported in the consolidated statement of financial position as of December 31, 2025 and 2024:
|
|
|
|
|
December 31, |
|
(millions of U.S. dollars) |
|
|
|
|
2025 |
2024 |
Within 1 year |
|
|
|
|
||
Between 1 and 2 years |
|
|
|
|
||
Between 2 and 3 years |
|
|
|
|
||
Between 3 and 4 years |
|
|
|
|
||
Between 4 and 5 years |
|
|
|
|
||
Later than 5 years |
|
|
|
|
||
Total undiscounted cash flows |
|
|
|
|
||
Lease liabilities included in the consolidated statement of financial position |
|
|||||
Current |
|
|
|
|
||
Non-current |
|
|
|
|
||
As of December 31, 2025 and 2024, the Company was committed to leases with future cash outflows totaling $
With certain leases, the Company guarantees the restoration of the leased property to a specified condition at the completion of the lease period. The liability associated with these restorations is recorded within “Provisions and other non-current liabilities” in the consolidated statement of financial position.
Note 29: Supplemental Cash Flow Information
Details of “Other” within the net cash provided by operating activities section in the consolidated statement of cash flow are as follows:
|
|
|
Year ended December 31, |
||
(millions of U.S. dollars) |
|
|
2025 |
|
2024 |
Non-cash employee benefit charges |
|
|
|
||
Net losses (gains) on foreign exchange and derivative financial instruments |
|
|
|
( |
|
Fair value adjustments (see note 5) |
|
|
|
( |
|
Other |
|
|
|
||
|
|
|
|
||
Thomson Reuters Annual Report 2025 |
Page 153 |
Details of “Changes in working capital and other items” within the net cash provided by operating activities section in the consolidated statement of cash flow are as follows:
|
|
|
Year ended December 31, |
||
(millions of U.S. dollars) |
|
|
2025 |
|
2024 |
Trade and other receivables |
|
|
( |
|
|
Prepaid expenses and other current assets |
|
|
( |
|
|
Payables, accruals and provisions |
|
|
( |
|
( |
Deferred revenue |
|
|
|
||
Income taxes(1) |
|
|
|
||
Other |
|
|
( |
|
( |
|
|
|
|
||
Details of income taxes paid are as follows:
|
|
|
Year ended December 31, |
||
(millions of U.S. dollars) |
|
|
2025 |
|
2024 |
Operating activities - continuing operations |
|
|
( |
|
( |
Investing activities |
|
|
( |
|
( |
Total income taxes paid |
|
|
( |
|
( |
Note 30: Acquisitions
Acquisitions include the purchase of a controlling or a non-controlling interest in a business. Acquisitions also include asset acquisitions for the purchase of other identifiable intangible assets.
Acquisitions where control is acquired are integrated into existing operations of the Company to broaden its offerings to customers as well as its presence in global markets. The results of acquired businesses are included in the consolidated financial statements from the date of acquisition.
In 2024, the Company acquired Pagero in stages, resulting in the presentation of the consideration in the investing and financing sections of the consolidated statement of cash flow. See “Pagero” section below for additional details.
Acquisition activity
Acquisition consideration is as follows:
|
|
|
Year ended December 31, |
||
(millions of U.S. dollars) |
|
|
2025 |
|
2024 |
Businesses acquired, net of cash |
|
|
|
||
Investments in businesses |
|
|
|
||
Asset acquisitions |
|
|
|
||
Deferred and contingent consideration payments |
|
|
|
||
Total |
|
|
|
||
Page 154 |
Thomson Reuters Annual Report 2025 |
The following provides a brief description of the most significant acquisitions completed during 2025 and 2024:
Date |
|
Company |
|
Acquiring Segments |
|
Description |
|
|
|
|
|
||||
|
|
|
|
||||
|
|
|
|
||||
|
|
|
|
||||
|
|
|
|
||||
|
|
|
|
|
|
|
|
The details of net assets acquired, including purchase price adjustments, are as follows:
(millions of U.S. dollars) |
|
|
|
2025 |
|
|
|
|
SafeSend |
Other |
Total |
Cash and cash equivalents |
|
|
|||
Trade receivables |
|
|
|||
Prepaid expenses and other current assets |
|
|
|||
Current assets |
|
|
|||
Property and equipment |
|
|
|||
Software |
|
|
|||
Other identifiable intangible assets |
|
|
|||
Other non-current assets |
|
|
|||
Total assets |
|
|
|||
Payables and accruals |
|
|
( |
( |
|
Deferred revenue(1) |
|
|
( |
( |
( |
Current liabilities |
|
|
( |
( |
( |
Other financial liabilities |
|
|
( |
( |
|
Deferred tax |
|
|
( |
( |
( |
Total liabilities |
|
|
( |
( |
( |
Net assets acquired |
|
|
|||
Goodwill |
|
|
|||
Total |
|
|
|||
Businesses acquired, net of cash |
|
|
Thomson Reuters Annual Report 2025 |
Page 155 |
(millions of U.S. dollars) |
|
|
|
2024 |
|
|
|
|
Pagero |
Other |
Total |
Cash and cash equivalents |
|
|
|||
Trade receivables |
|
|
|||
Prepaid expenses and other current assets |
|
|
|||
Current assets |
|
|
|||
Property and equipment |
|
|
|||
Software |
|
|
|||
Other identifiable intangible assets |
|
|
|||
Equity method investments |
|
|
|||
Other non-current assets |
|
|
|||
Total assets |
|
|
|||
Payables and accruals |
|
|
( |
( |
( |
Current taxes payable |
|
|
( |
( |
( |
Deferred revenue(1) |
|
|
( |
( |
( |
Other financial liabilities |
|
|
( |
( |
( |
Current liabilities |
|
|
( |
( |
( |
Long-term indebtedness |
|
|
( |
( |
|
Provisions and other non-current liabilities |
|
|
( |
( |
|
Other financial liabilities |
|
|
( |
( |
( |
Deferred tax |
|
|
( |
( |
( |
Total liabilities |
|
|
( |
( |
( |
Net assets acquired |
|
|
|||
Goodwill |
|
|
|||
Less: Fair value of previously held financial asset through other |
|
( |
( |
||
Total |
|
|
|||
Businesses acquired, net of cash |
|
|
|||
Non-controlling interests |
|
|
|||
The excess of the purchase price over the net assets acquired was recorded as goodwill and reflects synergies and the value of the acquired workforce. Relative to the acquisitions completed in 2025 and 2024, the majority of goodwill is
Purchase price allocation
Purchase price allocations related to certain acquisitions may be subject to adjustment pending completion of final valuations.
Pagero
In January 2024, the Company acquired a controlling interest in Pagero through a public tender offer. Subsequently, the Company purchased the remaining interests from the non-controlling shareholders to increase its ownership of Pagero to
The non-controlling interest was measured at fair value, based on the tender offer price of SEK
Other
The revenues and operating profit of acquired businesses were not material to the Company’s results of operations.
Page 156 |
Thomson Reuters Annual Report 2025 |
Note 31: Contingencies, Commitments and Guarantees
Lawsuits and legal claims
The Company is engaged in various legal proceedings, claims, audits and investigations that have arisen in the ordinary course of business. These matters include, but are not limited to, employment matters, commercial matters, privacy and data protection matters, defamation matters and intellectual property infringement matters. The outcome of all the matters against the Company is subject to future resolution, including uncertainties of litigation. Litigation outcomes are difficult to predict with certainty due to various factors, including but not limited to: the preliminary nature of some claims; uncertain damage theories and demands; an incomplete factual record; uncertainty concerning legal theories and procedures and their resolution by the courts, at both trial and appellate levels; and the unpredictable nature of opposing parties. Based on information currently known to the Company and after consultation with outside legal counsel, management believes that the ultimate resolution of any such matters, individually or in the aggregate, will not have a material adverse impact on the Company’s financial condition taken as a whole.
Uncertain tax positions
The Company is subject to taxation in numerous jurisdictions and is routinely under audit by many different taxing authorities in the ordinary course of business. There are many transactions and calculations during the course of business for which the ultimate tax determination is uncertain, as taxing authorities may challenge some of the Company’s positions and propose adjustments or changes to its tax filings.
As a result, the Company maintains provisions for uncertain tax positions that it believes appropriately reflect its risk. These provisions are made using the Company’s best estimates of the amount expected to be paid based on a qualitative assessment of all relevant factors. When appropriate, the Company performs an expected value calculation to determine its provisions. The Company reviews the adequacy of these provisions at the end of each reporting period and adjusts them based on changing facts and circumstances. Due to the uncertainty associated with tax audits, it is possible that at some future date, liabilities resulting from such audits or related litigation could vary significantly from the Company’s provisions. However, based on currently enacted legislation, information currently known by the Company and after consultation with outside tax advisors, management believes that the ultimate resolution of any such matters, individually or in the aggregate, will not have a material adverse impact on the Company’s financial condition taken as a whole.
Prior to December 31, 2023, the Company paid $
The Company does not believe that the resolution of these matters will have a material adverse effect on its financial condition taken as a whole. Payments made by the Company are not a reflection of its view on the merits of the case. As the Company expects to receive refunds of substantially all of the amounts paid pursuant to these notices of assessment, it has recorded substantially all of these payments as non-current receivables from HMRC or the indemnity counterparty, in its financial statements.
Guarantees
The Company has an investment in 3XSQ Associates, an entity jointly owned by a subsidiary of the Company and Rudin Times Square Associates LLC (“Rudin”), that owns and operates the 3 Times Square office building (“the building”) in New York, New York. In May 2025, 3XSQ Associates extended the maturity of its
Thomson Reuters Annual Report 2025 |
Page 157 |
Dispositions
In certain disposition agreements, the Company guarantees to the purchaser the recoverability of certain assets or limits on certain liabilities, including as in the “Uncertain tax positions” section above. The Company does not believe based upon current facts and circumstances described that additional payments in connection with these transactions would have a material adverse impact on the Company’s financial condition taken as a whole.
Unconditional purchase obligations
The Company has various obligations for technology, outsourcing and other services contracted in the ordinary course of business. The future unconditional purchase obligations as of December 31, 2025 and 2024 are as follows:
|
|
|
December 31, |
||
(millions of U.S. dollars) |
|
|
2025 |
|
2024 |
Within 1 year |
|
|
|
||
Between 1 and 2 years |
|
|
|
||
Between 2 and 3 years |
|
|
|
||
Between 3 and 4 years |
|
|
|
||
Between 4 and 5 years |
|
|
|
||
Later than 5 years |
|
|
|
||
|
|
|
|
||
The increase in unconditional purchase obligations as of December 31, 2025, compared to December 31, 2024, primarily reflects multi-year technology contracts entered into during the year.
Note 32: Related Party Transactions
As of December 31, 2025, the Company’s principal shareholder, Woodbridge (together with its affiliates), beneficially owned approximately
Transactions with Woodbridge
From time to time, in the normal course of business, the Company enters into transactions with Woodbridge and certain of its affiliates. These transactions involve providing and receiving product and service offerings and are not material to the Company’s results of operations or financial condition either individually or in the aggregate.
Transactions with YPL
In 2024, the Company received $
Transactions with 3XSQ Associates
In 2025, the Company made an $
Additionally, in October 2025, the Company amended its lease agreement with 3XSQ Associates for additional office space in the 3 Times Square building in New York, New York and extended the lease term to
Transactions with other associates
From time to time, the Company enters into transactions with other associates. These transactions typically involve providing or receiving services in the normal course of business and are not material to the Company’s results of operations or financial condition either individually or in the aggregate.
Compensation of key management personnel
Key management personnel compensation, including directors, are as follows:
|
|
|
Year ended December 31, |
||
(millions of U.S. dollars) |
|
|
2025 |
|
2024 |
Salaries and other benefits |
|
|
|
||
Share-based payments |
|
|
|
||
Total compensation |
|
|
|
||
Key management personnel are comprised of the Company’s directors and executive officers.
Page 158 |
Thomson Reuters Annual Report 2025 |
Note 33: Subsequent Events
2026 Dividends
In February 2026, the Company announced a
Share Repurchases and Return of Capital
In February 2026, the Company announced that it plans to repurchase up to $
In February 2026, the Company also announced that it plans to return $
Acquisition
In February 2026, the Company acquired Noetica, Inc., a New York-based AI-native start-up that transforms transaction-deal data into structured market intelligence for deal professionals. This business will be primarily reported in the Legal Professionals segment. The Company is in the process of allocating the purchase consideration to the assets and liabilities assumed for accounting purposes.
Thomson Reuters Annual Report 2025 |
Page 159 |

Executive Officers
The following individuals are our executive officers as of March 4, 2026.
Name |
Age |
Title |
Steve Hasker |
56 |
President & Chief Executive Officer |
Mike Eastwood |
59 |
Chief Financial Officer |
Kirsty Roth |
50 |
Chief Operations & Technology Officer |
David Wong |
41 |
Chief Product Officer |
Ragunath Ramanathan |
54 |
President, Legal Professionals |
Elizabeth Beastrom |
58 |
President, Tax, Audit & Accounting Professionals |
Laura A. Clayton |
65 |
President, Corporates |
Paul Bascobert |
61 |
President, Reuters |
Mary Alice Vuicic |
58 |
Chief People Officer |
Norie Campbell |
54 |
Chief Legal Officer & Company Secretary |
|
|
Steve Hasker has been President and Chief Executive Officer and a director of Thomson Reuters since March 2020. Prior to joining Thomson Reuters in February 2020, he was Senior Advisor to TPG Capital, a private equity firm, from August 2019 to February 2020. Prior to that, he was Chief Executive Officer of CAA Global, a TPG Capital portfolio company, from January 2018 to August 2019. Steve served as Global President and Chief Operating Officer of Nielsen Holdings PLC from December 2015 to December 2017 and prior to that served as Nielsen’s President, Global Products from November 2009 to January 2014. Steve spent more than a decade with McKinsey & Company as a partner in the Global Media, Entertainment and Information practice from 1998 to 2009. Before joining McKinsey, Steve spent five years in several financial roles in the United States and other countries. Steve started his career with PwC, where he qualified as a chartered accountant. Steve has an undergraduate economics degree from the University of Melbourne and holds an MBA and master’s degree in international affairs from Columbia University. Steve is also a non-executive director of Appen Limited. He is a member of the Australia and New Zealand Institute of Chartered Accountants. Steve is based in Toronto, Ontario, Canada. |
|
|
|
|
|
Mike Eastwood has been Chief Financial Officer of Thomson Reuters since March 2020. Mike will remain our Chief Executive Officer until May 8, 2026. Following that date, he will become the Chairman of the Board of the Thomson Reuters Foundation and will continue to support Thomson Reuters as an advisor to Steve Hasker. Mike joined Thomson in 1998 and has had several senior finance roles. Mike was previously Senior Vice President and Head of Corporate Finance from January 2016 to March 2020. Prior to that, he was Chief Operations Officer for Thomson Reuters Latin America from April 2014 to December 2015. Mike was also previously Chief Financial Officer of the company’s former Intellectual Property & Science business (which was sold in 2016). Mike received a BSA in Accounting from East Carolina University and an MBA from the University of North Carolina. Mike is based in Toronto, Ontario, Canada. |
|
|
|
|
|
Kirsty Roth has been Chief Operations and Technology Officer since August 2020. Prior to joining Thomson Reuters, Kirsty was Global Head of Operations and a Group General Manager for HSBC from May 2016 to August 2020. Before that, Kirsty was Chief Operating Officer for Finance, Operations and IT at Credit Suisse from 2011 to 2016 and a Consulting Partner with Deloitte from 2001 to 2011. Kirsty is a non-executive director on the board of Deutsche Bank AG. Kirsty received a bachelor's degree in Chemistry from the University of Bristol. Kirsty resides in Wollerau, Switzerland. |
|
|
|
|
|
David Wong has been Chief Product Officer since July 2020. Prior to joining Thomson Reuters, David worked at Facebook as Product Management Lead from January 2019 to June 2020 and Product Manager from February 2018 to January 2019. David served as SVP of Product Leadership of Nielsen Holdings PLC from November 2014 to February 2018 and prior to that, served as Nielsen’s VP of Product Leadership from May 2011 to November 2014. David was also a consultant at McKinsey & Company from August 2006 to March 2011. He holds a degree in Engineering Science from the University of Toronto, where he specialized in applied physics and electrical engineering. David resides in Toronto, Ontario, Canada. |
|
|
|
Page 160 |
Thomson Reuters Annual Report 2025 |

|
|
Ragunath (Raghu) Ramanathan has been President, Legal Professionals since February 2024. Prior to joining Thomson Reuters in February 2024, Raghu held several roles with SAP from August 2004 to February 2024, including most recently as their Chief Revenue Officer of SAP Business Technology Platform from February 2021 to February 2024 and Global Chief Operating Officer, SAP Business Technology Platform from April 2019 to February 2021. Raghu is a Trustee on the Thomson Reuters Foundation Board and currently serves on the board of directors of Solace, a data company. He holds a bachelor’s degree in engineering from Coimbatore Institute of Technology in India and an MBA from the Indian Institute of Management in Ahmedabad. Raghu is based in New York, New York, United States. |
|
|
|
|
|
Elizabeth Beastrom has been President, Tax, Audit & Accounting Professionals since March 2021. Prior to that, Elizabeth was President, Global Print from July 2018 through March 2021. From April 2018 through July 2018, Elizabeth led the FindLaw business as Managing Director. Prior to that, she was Chief Financial Officer, Vice President of Finance – Large and Medium Law Firms, Corporate Counsel and Legal Managed Services from August 2013 to April 2018. Prior to joining Thomson Reuters in December 2004, she was Finance Director at Valspar. She holds a bachelor’s degree in accounting from the University of Minnesota Carlson School of Management. Elizabeth resides in Eden Prairie, Minnesota, United States. |
|
|
|
|
|
Laura A. Clayton (professionally known as Laura Clayton McDonnell) has been President, Corporates since March 2023. Prior to joining Thomson Reuters in March 2023, Laura was Senior Vice President, Sales – East, Canada and Latin America from January 2019 through February 2023 at ServiceNow, Inc., a cloud computing platform that helps companies manage digital workflows for enterprise operations. From November 2015 through December 2018, Laura was a Vice President at Microsoft Corporation, leading a team of industry sales, technical and business professionals in the New York area. Prior to that, she was Senior Vice President, North America Sales at Aspect Software from May 2014 through October 2015. From 2003 through 2014, Laura served in a number of positions at IBM, with her last role as Vice President, Strategic Services. Laura is a Trustee on the Thomson Reuters Foundation Board and previously served on the board of directors of Signal AI, a private company which provides insights for entities from data collected from traditional and social media. Laura holds a bachelor’s degree with honors in international business from San Jose State University and a JD and MBA in international business and finance from the University of California at Berkeley. She is licensed to practice law in the State of California and the District of Columbia. Laura resides in New York, New York, United States. |
|
|
|
|
|
Paul Bascobert has been President of Reuters since September 2022. Prior to joining Thomson Reuters in September 2022, he was the CEO of Blue Ocean Acquisition Corp, a special purpose acquisition company focused on media, marketplace and tech platform businesses from April 2021 to September 2022. Prior to that, he was CEO of Gannett Co., Inc from August 2019 to July 2020. Paul served as President of XO Group, a U.S. based media and technology company from September 2016 to May 2019 and prior to that served as President of Yodle Inc. from May 2014 to September 2016. Paul also served as President of Bloomberg Businessweek and Head of Business Operations for the newly created Bloomberg Media Group from December 2009 to May 2014, as well as Senior Vice President of Operations and then Chief Marketing Officer at Dow Jones from January 2006 to December 2009. Paul has a degree in electrical engineering from Kettering University and an MBA in Finance from the Wharton School of the University of Pennsylvania and is a member of the Council on Foreign Relations. Paul resides in New York, New York, United States. |
|
|
|
|
|
Mary Alice Vuicic has been Chief People Officer since November 2017. Previously, Mary Alice served as the Global Chief Human Resources Officer for L Brands, a portfolio of retail brands, from October 2015 to October 2017. Before that, Mary Alice was Executive Vice President, Human Resources & Labour Relations at Loblaw Companies Ltd. from March 2014 to May 2015 and she was Chief Administrative Officer & Executive Vice President at Shoppers Drug Mart from January 2007 to March 2014 prior to its acquisition by Loblaw Companies Ltd. Mary Alice has also held senior executive roles at Walmart. Mary Alice is a Trustee on the Thomson Reuters Foundation Board and is an Advisory Board Member on the Good Jobs Institute. She has also served as a director of the Business Development Bank of Canada where she chaired the Human Resources Committee for eight years. She has a BA degree from the University of Windsor, an Advanced HR Certificate from the University of Toronto and completed the Advanced Management Program at Harvard Business School. Mary Alice resides in Toronto, Ontario, Canada. |
|
|
|
|
|
Norie Campbell has been Chief Legal Officer & Company Secretary since September 2023. Prior to joining Thomson Reuters in September 2023, she held a number of executive-level roles at TD Bank Group from December 2000 to April 2022 including serving as General Counsel for a decade. Norie serves as a director of the Rideau Hall Foundation and Toronto Metropolitan University. She has Bachelor of Laws and Master of Laws degrees from Osgoode Hall Law School. Norie resides in Toronto, Ontario, Canada. |
|
|
|
Thomson Reuters Annual Report 2025 |
Page 161 |
|
|
On March 2, 2026, we announced that Gary E. Bischoping, Jr. will become Chief Financial Officer effective May 8, 2026, replacing Mike Eastwood, who will be retiring.
|
|
|
Gary E. Bischoping, Jr. will be Chief Financial Officer of Thomson Reuters effective on May 8, 2026. His most recent role was as an Operating Partner at Hellman & Friedman, a global private equity firm, where he has been since June 2021. Prior to that, Mr. Bischoping served as Senior Vice President, Chief Financial Officer of Finastra Inc. from March 2020 to June 2021. From May 2017 to March 2020, he was Senior Vice President, Chief Financial Officer of Varian Medical Systems. Mr. Bischoping also spent more than 17 years at Dell Inc. in senior finance leadership roles. Mr. Bischoping holds an M.B.A. in Finance and Strategy from the University of Rochester Simon School of Business Administration and a B.S. in Accounting from the State University of New York. He resides in Austin, Texas, United States. |
Page 162 |
Thomson Reuters Annual Report 2025 |
Directors
The names, city and country where they are based or reside, offices and principal occupations of our directors as of March 4, 2026 are shown below. Each director has been a director since the year indicated below. All of our directors have been engaged for more than five years in their present principal occupations or in other capacities within Thomson Reuters, except where noted below. Each director will continue to hold office until the next annual meeting of our shareholders (scheduled to be held on June 10, 2026) or until the director resigns or a successor is elected or appointed.
All of our directors were elected at our 2025 annual meeting of shareholders.
|
Committee Memberships |
|
|||||
Name |
|
Age |
Audit |
Corporate Governance |
Human Resources |
Risk |
Director Since |
David Thomson, Chairman |
|
68 |
|
|
|
|
1988 |
Steve Hasker |
|
56 |
|
|
|
|
2020 |
Kirk E. Arnold |
|
66 |
|
• |
• |
Chair |
2020 |
LaVerne Council |
|
64 |
• |
|
|
• |
2022 |
Michael E. Daniels |
|
71 |
• |
Chair |
• |
• |
2014 |
Michael Friisdahl |
|
63 |
|
• |
• |
|
2025 |
Kirk Koenigsbauer |
|
58 |
|
|
• |
• |
2020 |
Deanna Oppenheimer |
|
68 |
• |
• |
|
|
2020 |
Simon Paris |
|
56 |
|
• |
Chair |
|
2020 |
Kim M. Rivera |
|
57 |
• |
|
|
• |
2019 |
Paul Sagan |
|
67 |
|
|
|
• |
2025 |
Barry Salzberg |
|
72 |
Chair |
• |
|
• |
2015 |
Peter J. Thomson |
|
60 |
|
|
• |
|
1995 |
Beth Wilson |
|
57 |
• |
|
• |
|
2022 |
|
|
David Thomson is Chairman of Thomson Reuters. He is also a Chairman of Woodbridge, the Thomson family investment company, and Chairman of The Globe and Mail Inc., a Canadian media company. David is an active private investor with a focus on real estate and serves on the boards of several private companies. David has an MA from Cambridge. David resides in Toronto, Ontario, Canada. |
|
|
|
|
|
Steve Hasker has been President and Chief Executive Officer and a director of Thomson Reuters since March 2020. Prior to joining Thomson Reuters in February 2020, he was Senior Advisor to TPG Capital, a private equity firm, from August 2019 to February 2020. Prior to that, he was Chief Executive Officer of CAA Global, a TPG Capital portfolio company, from January 2018 to August 2019. Steve served as Global President and Chief Operating Officer of Nielsen Holdings PLC from December 2015 to December 2017 and prior to that served as Nielsen’s President, Global Products from November 2009 to January 2014. Steve spent more than a decade with McKinsey & Company as a partner in the Global Media, Entertainment and Information practice from 1998 to 2009. Before joining McKinsey, Steve spent five years in several financial roles in the United States and other countries. Steve started his career with PwC, where he qualified as a chartered accountant. Steve has an undergraduate economics degree from the University of Melbourne and received an MBA and master’s in international affairs from Columbia University. Steve is also a non-executive director of Appen Limited. He is a member of the Australia and New Zealand Institute of Chartered Accountants. Steve is based in Toronto, Ontario, Canada. |
|
|
|
|
|
Kirk E. Arnold is a corporate director. She was previously Chief Executive Officer of Data Intensity, LLC, a cloud-based data, applications and analytics managed service provider, from 2013 to 2017. Prior to that, Kirk was Chief Operating Officer of Avid, a technology provider in the media industry, and Chief Executive Officer and President of Keane, Inc., then a publicly traded global services provider. She has also held senior leadership roles at Computer Sciences Corp., Fidelity Investments and IBM. In addition, she was founder and Chief Executive Officer of NerveWire, a management consulting and systems integration provider. She is a non-executive director of Trane Technologies and previously served on the board of IngersollRand plc. Kirk also serves on the boards of several private companies, including Housecall Pro and The Predictive Index. In addition, she is a Senior Lecturer at MIT Sloan School of Management and an advisor to the Center for MIT Entrepreneurship. Kirk received a bachelor’s degree from Dartmouth College. Kirk resides in Kennebunk, Maine, United States. |
Thomson Reuters Annual Report 2025 |
Page 163 |
|
|
|
|
|
LaVerne Council is the Chief Executive Officer of Emerald One, LLC, an information technology consulting company focused on helping businesses develop innovative methodologies for driving change and transformation. She was the National Managing Principal, Enterprise Technology Strategy & Innovation, for Grant Thornton LLP from 2017 to 2019 and served as the Senior Vice President and General Manager for MITRE Corporation in 2017. LaVerne was Assistant Secretary for the Office of Information & Technology and Chief Information Officer for the United States Department of Veterans Affairs from 2015 to 2017. She was the Chief Executive Officer of Council Advisory Services, LLC from 2012 through 2015. LaVerne has also held significant corporate leadership roles focused on supply chain, IT centralization and integration. She served as the Corporate Vice President and Global Chief Information Officer for Johnson & Johnson from 2006 through 2011. Before that, she served in several roles of increasing responsibility at DELL, Inc. from 2000 to 2006, including as the Global Vice President, Information Technology, Global Business Solutions, and Development Services. She is also a non-executive director and Chair of CONMED Corporation and a non-executive director of Concentrix Corporation. She received her MBA from Illinois State University and her Bachelor of Business Administration in Computer Science from Western Illinois University. LaVerne also holds an honorary Doctorate of Business Administration from Drexel University. LaVerne resides in Great Falls, Virginia, United States. |
|
|
|
|
|
Michael E. Daniels is a corporate director. In 2013, Mike retired as Senior Vice President and Group Executive IBM Services after 36 years with the company where he directed IBM’s consulting, systems integration, application management, cloud computing and outsourcing services around the globe. Mike also held a number of senior leadership positions in his career at IBM, including General Manager of Sales and Distribution Operations of the Americas as well as leading Global Services in the Asia Pacific region. Mike has a bachelor’s degree in political science from Holy Cross College. Mike resides in Hilton Head, South Carolina, United States. |
|
|
|
|
|
Michael Friisdahl is a corporate director. He was previously the Executive Chairman of Signature Aviation, a global network of private aviation terminals and services, from January 2022 until October 2023. Prior to that, he was the President and CEO of Maple Leaf Sports & Entertainment (MLSE), a diversified sports and entertainment company based in Toronto. Michael has also served as Chief Executive Officer of Air Canada Leisure Group, as Chief Executive Officer of Thomas Cook North America and on the Group Executive Board of Thomas Cook Group plc. He serves on the board of The Woodbridge Company Limited as an independent director and also previously served as a non-executive director of Entertainment One Ltd. and SAS AB. Michael resides in Boca Raton, Florida, United States. |
|
|
|
|
|
Kirk Koenigsbauer has been Chief Operating Officer & Corporate Vice President, Experiences and Devices Group at Microsoft Corporation since February 2020. From December 2016 to February 2020, he was Corporate Vice President, Microsoft 365 and from July 2012 to November 2016, he was Corporate Vice President, Office Apps Engineering, at Microsoft. Prior to that, he was Corporate Vice President, Office Product Management at Microsoft from June 2002 to July 2012. Kirk worked at Amazon.com from 1998 to 2001 where he held the roles of General Manager, Software & Video Games Stores and Director of Product Management, Auctions. Kirk also worked at Microsoft from 1992 to 1998 and as a consultant at Accenture from 1989 to 1991. Kirk has a bachelor’s degree from Colby College. Kirk resides in Seattle, Washington, United States. |
|
|
|
|
|
Deanna Oppenheimer is the founder of CameoWorks, LLC, a global firm that advises leaders of early stage companies and consultancies. Deanna founded CameoWorks in 2012. From 2005 to 2011, she served in a number of roles at Barclays PLC, first as chief executive of UK Retail and Business Banking and then as vice chair of Global Retail Banking. From 1985 to 2005, Deanna served in a number of positions at Washington Mutual, Inc., with her last role as president of Consumer Banking. She is also the non-executive chair of the board of directors of InterContinental Hotels Group PLC, a non-executive director of Slalom and is the founder of BoardReady. She is a former director of the King’s Trust UK, a royal charity. Deanna received a BA from the University of Puget Sound. Deanna resides in Seattle, Washington, United States. |
|
|
|
|
|
Simon Paris is the Chief Executive Officer of Unit4, a company that provides enterprise cloud applications for organizations, since February 2025. Prior to that, he was Chief Executive Officer of Finastra, a global financial technology (fintech) provider, from 2018 to January 2025. He joined Finastra (previously Misys) as president in 2015 and also served as its Chief Sales Officer, before being appointed Deputy CEO in 2017 and CEO in 2018. Simon previously worked at SAP from 2007 to 2015, where he held a number of senior leadership positions. Simon was also previously a senior consultant with McKinsey & Company. Simon holds a BA from the European Business School and an MBA from INSEAD. Simon resides in London, United Kingdom. |
|
|
|
Page 164 |
Thomson Reuters Annual Report 2025 |
|
|
Kim M. Rivera is the Chief Legal and Business Affairs Officer of One Trust, LLC, a privacy, security and governance management software company. She was Special Advisor to the CEO of HP Inc. from February 2021 through December 2021. Prior to that, Kim was President, Strategy and Business Management and Chief Legal Officer at HP Inc. from January 2019 through January 2021. She served as Chief Legal Officer and General Counsel of HP Inc. from November 2015 to January 2019. Prior to joining HP Inc., Kim was the Chief Legal Officer and Corporate Secretary for DaVita HealthCare Partners where she was employed from 2010 to 2015. Prior to that, she served as the Chief Compliance Officer and Head of International Legal Services at The Clorox Company and Chief Litigation Counsel for Rockwell Automation, as well as General Counsel for its Automation Controls and Information Group. Kim has a bachelor’s degree from Duke University and a Juris Doctor degree from Harvard Law School. Kim resides in Portola Valley, California, United States. |
|
|
|
|
|
Paul Sagan is a Catalyst Advisor at General Catalyst, a venture capital and private equity firm, which he joined in 2013 and became a Managing Director of in 2018. Prior to that, he was Chief Executive Officer of Akamai Technologies, Inc., a company that specializes in content delivery, cybersecurity, DDoS mitigation and cloud services. He has also served as a senior advisor to the World Economic Forum, a senior executive at Time Warner in online services and cable programming, and a news executive with CBS Inc. Paul has extensive experience as a director of public companies and is currently a director of Moderna, Inc. and Okta Inc. Paul has a B.S. from the Medill School of Journalism at Northwestern University. Paul resides in Cambridge, Massachusetts, United States. |
|
|
|
|
|
Barry Salzberg is a corporate director. Barry served as the Global Chief Executive Officer of Deloitte Touche Tohmatsu Limited from 2011 until his retirement in 2015. He joined Deloitte in 1977 and his roles included Chief Executive Officer and Managing Partner of the firm’s U.S. operations. Barry has previously served as a board member of Embark Intermediate Holdings, LLC. and New Profit, Inc. and previously served as Chairman of the United Way Worldwide, Chairman of the board of College Summit and Chairman of the board of the YMCA of Greater New York. From July 2015 until June 2018, he was a Professor at Columbia Business School. Barry has a BS in Accounting from Brooklyn College, a JD from Brooklyn Law School, and an LLM in Taxation from the New York University School of Law. Barry resides in New York, New York, United States. |
|
|
|
|
|
Peter J. Thomson is a Chairman of Woodbridge, the Thomson family investment company. Peter is an active private equity investor and serves on the boards of several private companies. Peter has a BA from the University of Western Ontario. Peter resides in Toronto, Ontario, Canada. |
|
|
|
|
|
Beth Wilson is a corporate director. Beth served as the Chair of the Chartered Professional Accountants of Canada from October 2023 to September 2025 and the Vice-Chair from October 2021 to October 2023. She is the former Chief Executive Officer of Dentons Canada LLP and was a member of the global leadership team, serving on the Global Board and Global Management Committee from July 2017 to January 2022. Prior to this role, Beth was an audit partner at KPMG from 2000 to 2016 and served as Managing Partner at KPMG in the Greater Toronto Area from 2009 to 2016. Between 2005 and 2016, she also served as a member of KPMG’s Management Committee in various leadership positions, including Canadian Managing Partner Community Leadership, Canadian Managing Partner Regions and Enterprise with responsibility for 24 regional offices across Canada, and Chief Human Resources Officer. Beth is currently a director at Traferox Technologies Inc., Fountain Tire and Woodgreen Community Services, and a trustee of Hospital for SickKids. She is also a non-executive director at IGM Financial Inc. and Power Corporation of Canada. Beth has a BComm from the University of Toronto and is a CPA. Beth resides in Toronto, Ontario, Canada. |
Thomson Reuters Annual Report 2025 |
Page 165 |
Audit Committee
The Audit Committee comprises Barry Salzberg (Chair), LaVerne Council, Michael E. Daniels, Deanna Oppenheimer, Kim M. Rivera and Beth Wilson. The Audit Committee is comprised entirely of independent directors. All members of the Audit Committee are financially literate in accordance with applicable Canadian and U.S. securities rules. Barry Salzberg and Beth Wilson each qualify as an “audit committee financial expert” (within the meaning of applicable SEC rules and the Nasdaq listing rules). Biographies for each member of our Audit Committee are included earlier in this section of the annual report.
The following is a brief summary of the education and experience of each member of the Audit Committee that is relevant to the performance of his or her responsibilities, including any education or experience that has provided the member with an understanding of the accounting principles we use to prepare our financial statements.
Audit Committee Member |
Education/Experience |
Barry Salzberg (Chair) |
• Former Global Chief Executive Officer of Deloitte Touche Tohmatsu Limited • Former Professor at Columbia Business School • Degree in accounting from Brooklyn College, a JD from Brooklyn Law School and an LLM in tax from the New York University |
LaVerne Council |
• MBA and bachelor’s degree in business administration • Member of CONMED Corporation board of directors and audit committee • Member of Concentrix Corporation board of directors and audit committee • Member of Mathematica board of directors and audit committee |
Michael E. Daniels |
• Over 25 years of executive experience at IBM • Former member of the Tyco International Ltd. audit committee |
Deanna Oppenheimer |
• Former Vice Chair of Global Retail Banking of Barclays PLC • Former President of Consumer Banking of Washington Mutual, Inc. • Former member of AXA Global Insurance audit committee • Former member of NCR Corporation audit committee |
Kim M. Rivera |
• Chief Legal and Business Affairs Officer of One Trust, LLC • Former President, Strategy and Business Management and Chief Legal Officer of HP Inc. • Supported audit committees of two publicly-traded Fortune 500 companies |
Beth Wilson |
• Audit Committee Chair at Fountain Tire, The Hospital for Sick Children and Woodgreen Community Services • Member of Power Corporation of Canada and IGM Financial Inc. audit committees • Bachelor of Commerce degree from University of Toronto and a Certified Professional Accountant in good standing with the Chartered Professional Accountants of Ontario • Former Chair of the Chartered Professional Accountants of Canada • Former Chief Executive Officer of Dentons Canada LLP • Former audit partner and Managing Partner at KPMG |
Page 166 |
Thomson Reuters Annual Report 2025 |
Principal Accountant Fees and Services
The following table sets forth fees related to services rendered by PricewaterhouseCoopers LLP and its affiliates in 2025 and 2024.
(in millions of U.S. dollars) |
|
2025 |
|
2024 |
|
|
|
|
|
|
|
Audit fees |
|
$13.6 |
|
$13.4 |
|
Audit-related fees |
|
0.8 |
|
1.1 |
|
Tax fees |
|
0.4 |
|
0.7 |
|
All other fees |
|
- |
|
- |
|
Total |
|
$14.8 |
|
$15.2 |
|
The following are descriptions of fees for services rendered by PricewaterhouseCoopers LLP in 2025 and 2024.
Audit Fees
These audit fees were for professional services rendered for the audits of consolidated financial statements, reviews of interim financial statements included in periodic reports, audits related to internal control over financial reporting, statutory audits and services that generally only the independent auditor can reasonably provide, such as comfort letters and consents.
Audit-related Fees
These audit-related fees were for assurance and related services that are reasonably related to the performance of the audit or review of the financial statements and are not reported under the “audit fees” category above. These services included transaction due diligence, pre-post implementation reviews, other attestation engagements, audits of various employee benefit plans and agreed-upon procedures principally related to executive compensation reporting.
Tax Fees
Tax fees were for tax compliance, tax advice and tax planning. These services included the preparation and review of corporate tax returns, assistance with tax audits and transfer pricing matters, advisory services relating to federal, state, provincial and international tax compliance and restructurings, mergers and acquisitions and divestitures.
All Other Fees
Fees disclosed in the tables above under the item “all other fees” were for services other than the audit fees, audit-related fees and tax fees described above.
Pre-Approval Policies and Procedures
The Audit Committee has adopted a policy regarding its pre-approval of all audit and permissible non-audit services provided to our company by the independent auditors.
Thomson Reuters Annual Report 2025 |
Page 167 |
Woodbridge
As of March 2, 2026, Woodbridge and its affiliates beneficially owned approximately 70% of our common shares and is the principal and controlling shareholder of Thomson Reuters.
Woodbridge, a private company, is the primary investment vehicle for members of the family of the late Roy H. Thomson, the first Lord Thomson of Fleet. Woodbridge is a professionally managed company that, in addition to its controlling interest in Thomson Reuters, has other substantial investments.
Prior to his passing in 2006, Kenneth R. Thomson controlled our company through Woodbridge. He did so by holding shares of a holding company of Woodbridge, Thomson Investments Limited. Under his estate arrangements, the 2003 TIL Settlement, a trust of which the trust company subsidiary of a Canadian chartered bank is trustee and members of the family of the late first Lord Thomson of Fleet are beneficiaries, holds those holding company shares. Kenneth R. Thomson established these arrangements to provide for long-term stability of the business of Woodbridge. The equity of Woodbridge continues to be owned by members of successive generations of the family of the first Lord Thomson of Fleet.
Under the estate arrangements of Kenneth R. Thomson, the directors and officers of Woodbridge are responsible for its business and operations. In certain limited circumstances, including very substantial dispositions of Thomson Reuters Corporation common shares by Woodbridge, the estate arrangements provide for approval of the trustee to be obtained.
Woodbridge’s primary investment is its holding of our shares. It actively monitors our company as a controlling shareholder. In its involvement with our company, Woodbridge focuses on these matters:
With its substantial equity investment in our company, Woodbridge considers that its interests as a Thomson Reuters shareholder are aligned with those of all other shareholders.
Controlled Company
Our company is a “controlled company” as a result of Woodbridge’s ownership.
Thomson Reuters’ corporate governance practices include the following, which we believe are best practices for a Canadian public company with a controlling shareholder: • No members of the day-to-day Thomson Reuters executive leadership team are related to, or otherwise affiliated with, Woodbridge. • Woodbridge beneficially owns common shares that have one vote per share. Thomson Reuters has not issued a separate class of shares to Woodbridge with super-voting rights. • The Thomson Reuters Board is comprised of a majority of independent directors and the number of directors affiliated with Woodbridge is lower than the proportion of common shares controlled by it. Woodbridge’s beneficial ownership (together with its affiliates) as of March 2, 2026 was approximately 70% of our common shares and its representatives on the Thomson Reuters Board comprise approximately 29% of our directors. • As David Thomson is the Chairman of the Board, we have a separate Lead Independent Director. • As part of each Board meeting, the independent directors meet separately without management or Woodbridge- affiliated directors present. • All committees are comprised of a majority of independent directors (other than the Audit Committee, which is 100% independent directors). • The Board has an effective and transparent process to deal with related party transactions or conflicts of interest between Thomson Reuters and Woodbridge or directors affiliated with Woodbridge. The Corporate Governance Committee of our Board utilizes a policy for considering related party transactions that may take place between our company and Woodbridge, with any committee members related to Woodbridge abstaining from voting. In addition, any transactions between Woodbridge and our company are subject to public disclosure and other requirements under applicable Canadian securities laws. |
The Nasdaq listing rules require a listed company to have, among other things, solely independent directors on its compensation committee and directors to be nominated solely by independent directors. A “controlled company” (as defined by the Nasdaq listing rules) is a company of which more than 50% of the voting power for the election of directors is held by an individual, group or another company and is exempt from these requirements.
Page 168 |
Thomson Reuters Annual Report 2025 |
Supplemental guidelines issued by the Canadian Coalition for Good Governance (CCGG) address controlled companies. A “controlled company” (as defined by CCGG) includes corporations with a controlling shareholder who controls a sufficient number of shares to be able to elect the Board or to direct the management or policies of the corporation.
While a majority of members of each of the Corporate Governance Committee and the HR Committee of our company are independent, the Board believes it is appropriate for Michael Friisdahl and Peter Thomson, who are not considered to be independent under applicable rules because of their affiliation with Woodbridge, to serve on these committees and has approved our reliance on the Nasdaq’s controlled company exemption to do so. CCGG has stated that it believes it is appropriate for directors who are related to the controlling shareholder to sit on these committees to bring the knowledge and perspective of the controlling shareholder to executive compensation, appointments and Board nominations.
No directors affiliated with Woodbridge serve on our Audit Committee, which is required to have solely independent directors. A majority of members of the Risk Committee are also independent.
Independent Directors
A majority of the Board is independent. Under the corporate governance guidelines adopted by the Board, a director is not considered independent unless the Board affirmatively determines that the director has no “material relationship” with Thomson Reuters. In determining the independence of directors, the Board considers all relevant facts and circumstances. In March 2026, the Board conducted its annual assessment of the independence of its members and determined that 9 of the 14 current directors (approximately 64%) serving on the Board were independent. In determining independence, the Board examined and relied on the applicable definitions of “independent” in the Nasdaq listing standards and Canadian Securities Administrators’ National Instrument 58-101. The Board’s determination of independence was also based on responses to questionnaires completed by directors.
In order for the Board to function independently from management:
|
Director Independence |
|||
Name of Director Nominee |
Management |
Independent |
Not Independent |
Reason for Non-Independence |
David Thomson |
|
|
|
A Chairman of Woodbridge |
Steve Hasker
|
|
|
|
President & Chief Executive Officer of |
Kirk E. Arnold |
|
|
|
|
LaVerne Council |
|
|
|
|
Michael E. Daniels |
|
|
|
|
Michael Friisdahl |
|
|
|
Independent Director of Woodbridge |
Kirk Koenigsbauer |
|
|
|
|
Deanna Oppenheimer |
|
|
|
|
Simon Paris |
|
|
|
|
Kim M. Rivera |
|
|
|
|
Paul Sagan |
|
|
|
Advisor to Woodbridge |
Barry Salzberg |
|
|
|
|
Peter J. Thomson |
|
|
|
A Chairman of Woodbridge |
Beth Wilson |
|
|
|
|
Total |
1 |
9 |
5 |
|
David Thomson, Michael Friisdahl, Paul Sagan and Peter Thomson are not members of Thomson Reuters executive management team. With its substantial equity investment in Thomson Reuters, Woodbridge considers that its interests as a shareholder are aligned with those of all other shareholders.
Thomson Reuters Annual Report 2025 |
Page 169 |
In determining the independence of directors, the Board also considers that in the normal course of business, we provide services to, and receive services from, companies with which some of the independent directors are affiliated.
Based on the specific facts and circumstances, the Board determined in March 2026 that these relationships were not material or would not, in the Board's view, interfere with the exercise of the applicable director's independent judgement.
Presiding Directors at Meetings of Non-Management and Independent Directors
At the beginning of each meeting, the Board has an “in-camera” session with the CEO, but no other members of management. This is intended to give the CEO an opportunity to discuss his objectives for the day’s meeting, and for directors to express preliminary observations based on their prior review of meeting materials. This permits a more effective use of time in the Board meeting. A similar session is held with the CEO at the end of the meeting, followed by a meeting of the Board without the CEO or other members of management present. Board committees also utilize “in-camera” meetings for discussions without the CEO or members of management present.
As part of each Board meeting, our independent directors meet as a group without the CEO and without the directors affiliated with Woodbridge. These meetings are chaired by the Lead Independent Director. The Lead Independent Director develops the agenda for these meetings, although discussion has not been limited to it. The agenda generally addresses any issues that might be specific to a public corporation with a controlling shareholder. The Lead Independent Director reports to the Chairman and the CEO on the substance of these meetings to the extent that action is appropriate or required. Six meetings of the independent directors took place in 2025 which were presided over by the Lead Independent Director (Michael E. Daniels).
Code of Business Conduct and Ethics
Our Code of Business Conduct and Ethics (Code), which was updated in March 2025, applies to our employees, contractors, directors and officers, including our CEO, CFO and Chief Accounting Officer & Controller. We review the Code on an annual basis and make updates as necessary. Our updated Code reflects changes in style and appearance based on our new branding guidelines.
While the content of the updated Code and its provisions are fundamentally the same, it also highlights our commitment to social impact and reflects certain content updates to make the Code consistent with internal policies, laws and regulations that have changed in the last few years. Every year, we require our employees, contractors, directors and officers to submit an acknowledgment confirming that they have received and read a copy of the Code and understand their obligations to comply with the principles and policies outlined in it. In an effort to further promote a culture of ethical business conduct throughout Thomson Reuters, we have instituted an online training course for new employees and contractors that supplements the Code, as well as an annual refresher course for employees and contractors to complete. The Corporate Governance Committee receives an annual report regarding the Code from management.
In 2025 and through the date of this annual report, no material violations by our directors or executive officers were reported for the Code. Also, no waivers under the Code were sought by or granted to any of our directors or executive officers.
Additional Disclosures
Additional information regarding the members of our Board, including our corporate governance and compensation practices, will be provided in our management proxy circular, which is being prepared in connection with our upcoming annual meeting of shareholders to be held on June 10, 2026. Each Board committee has a written charter which is publicly available at thomsonreuters.com The Audit Committee’s charter has been filed on SEDAR+ and EDGAR and is incorporated by reference in, and forms a part of, this annual report.
As of March 2, 2026, our executive officers and directors as a group beneficially owned, directly or indirectly, or exercised control or direction over, less than 1% of our outstanding common shares, based on the issued and outstanding shares of our company as of that date. David Thomson and Peter Thomson are the Chairmen of Woodbridge, our controlling shareholder. As of March 2, 2026, Woodbridge and its affiliates beneficially owned approximately 70% of our common shares. David Thomson and Peter Thomson are substantial shareholders of our company as members of the family that owns the equity of Woodbridge.
Page 170 |
Thomson Reuters Annual Report 2025 |
Thomson Reuters Corporation was incorporated under the Business Corporations Act (Ontario) by articles of incorporation dated December 28, 1977. Our company amalgamated with one of its wholly owned subsidiaries on March 10, 2010. On October 1, 2018, articles of amendment were filed to make certain amendments to our articles of amalgamation related to the Trust Principles and the consent rights of the Thomson Reuters Founders Share Company.
Our registered office and principal executive office is located at 19 Duncan Street, Toronto, Ontario M5H 3H1, Canada. Prior to April 17, 2008, Thomson Reuters Corporation was known as The Thomson Corporation.
Description of Capital Structure
As of March 2, 2026:
Common Shares
Each common share entitles its holder to receive notice of, to attend and to vote at all meetings of our shareholders (except for meetings of holders of a particular class or series of shares other than the common shares required by applicable laws to be held as a separate class or series meeting). Each common share also entitles its holder to receive dividends when declared by our Board, subject to the rights of holders of the preference shares. All dividends declared by our Board are paid equally on all common shares. Holders of common shares will participate equally in any distribution of our assets upon liquidation, dissolution or winding-up, subject to the rights of the holders of the preference shares. There are no preemptive, redemption, purchase or conversion rights attaching to our common shares.
We have also issued Depositary Interests (DIs) as an alternative way to hold our common shares. DIs are designed to facilitate the transfer and settlement of our shares in the U.K. when they are traded in the secondary market. Each DI represents one common share. The holder of DIs has beneficial ownership of the underlying common shares. The administrator of our DI program holds legal title to the common shares and holds the shares on behalf of and for the benefit of the DI holder. Holders of DIs have the same voting rights and receive the same dividends as other common shareholders.
Preference Shares
Our preference shares may be issued in one or more series as determined by our Board. Our Board is authorized to fix the number, the consideration per share and the rights and restrictions of the preference shares of each series. The preference shares of each series are to rank on a parity with the preference shares of each other series with respect to the payments of dividends and the return of capital on our liquidation, dissolution or winding-up. The preference shares are entitled to preference over the common shares and any other shares ranking junior to the preference shares with respect to the payment of dividends and the return of capital. The special rights and restrictions attaching to the preference shares as a class may not be amended without approval of at least two-thirds of the votes cast at a meeting of the holders of preference shares. The holders of preference shares are not entitled to any voting rights except as provided by our Board when authorizing a series or as provided by law. Our Series II preference shares are non-voting and are redeemable at our option for C$25.00 per share, together with accrued dividends. Dividends are payable quarterly at an annual rate of 70% of the Canadian bank prime rate applied to the stated capital of the shares.
Thomson Reuters Founders Share
Our company has issued a Thomson Reuters Founders Share to the Thomson Reuters Founders Share Company, which enables the Thomson Reuters Founders Share Company to exercise extraordinary voting power to safeguard the Thomson Reuters Trust Principles and to thwart those whose holdings of Thomson Reuters voting shares threaten the Thomson Reuters Trust Principles.
Thomson Reuters Annual Report 2025 |
Page 171 |
The Founders Share entitles the Thomson Reuters Founders Share Company to vote in circumstances where an acquiring person, other than an approved person or an entity within Thomson Reuters, has become or becomes “interested” in, or the beneficial owner of, 15% or more of the outstanding voting shares of Thomson Reuters or has obtained or is attempting to obtain the ability to control the exercise of, or beneficial ownership of, 30% or more of the outstanding voting shares of Thomson Reuters. In general, votes cast by the Thomson Reuters Founders Share Company, alone or in combination with votes cast by approved persons, will be sufficient either to negate the voting power of the acquiring person or to constitute the requisite majority voting power. The rights attaching to the Founders Share may not be varied or abrogated in any respect without the prior written consent of the Thomson Reuters Founders Share Company. In addition, without the prior written consent of the Thomson Reuters Founders Share Company, we may not take certain fundamental corporate actions, including certain changes to our share capital, remove or amend provisions in our organizational documents relating to the Thomson Reuters Founders Share Company and the Founders Share, or effect a sale (or similar transactions) of Reuters to an unrelated third-party or to effect or permit material acquisitions by, or material dispositions from, Reuters. For a discussion of the Thomson Reuters Trust Principles, the Thomson Reuters Founders Share Company and proposed amendments to the Thomson Reuters Trust Principles arrangements, see the “Material Contracts” section below.
Market for Securities
Listings and Index Participation
Our common shares are listed in Canadian dollars on the TSX and in U.S. dollars on the Nasdaq under the symbol “TRI”. Our Series II preference shares are listed in Canadian dollars on the TSX under the symbol “TRI.PR.B”. Our company is included in the S&P/TSX series of indices.
Share Prices
The following table provides information regarding the price history of our common shares and our Series II preference shares for the periods indicated.
|
|
|
|
|
|
|
|
|
|
|
|
|
|
|
|
|
|
|
|
|
|
|
|
|
|
|
|
|
Common Shares (C$)Common Shares (US$) |
|
|
|
|
|
|
|
|
|
|
|
Preference Shares (C$) |
||||||||||||
|
|
|
|
|
|
|
|
|
|
|
|
|
|
|
|
|
|
|
|
|
|
|
|
|
|
|
|
|
|
|
|
|
|
|
|
|
|
|
|
|
|
|
|
|
|
|
|
|
|
|
|
|
|
|
|
High |
|
Low |
|
Closing |
|
Trading |
|
|
High |
|
Low |
|
Closing |
|
Trading |
|
|
High |
|
Low |
|
Closing |
|
Trading |
|
|
|
|
|
|
|
|
|
|
|
|
|
|
|
|
|
|
|
|
|
|
|
|
|
|
|
|
|
|
|
|
|
|
|
|
|
|
|
|
|
|
|
|
|
|
|
|
|
|
|
|
|
|
2025 |
|
|
|
|
|
|
|
|
|
|
|
|
|
|
|
|
|
|
|
|
|
|
|
|
|
|
|
|
|
|
|
|
|
|
|
|
|
|
|
|
|
|
|
|
|
|
|
|
|
|
|
|
|
|
|
|
|
|
|
|
|
|
|
|
|
|
|
|
|
|
|
|
|
|
|
|
|
|
|
|
January |
|
244.65 |
|
221.65 |
|
244.23 |
|
5,550,283 |
|
|
169.04 |
|
154.46 |
|
168.25 |
|
6,157,382 |
|
|
15.25 |
|
14.70 |
|
15.15 |
|
76,461 |
|
|
|
|
|
|
|
|
|
|
|
|
|
|
|
|
|
|
|
|
|
|
|
|
|
|
|
|
|
|
|
|
|
|
|
|
|
|
|
|
|
|
|
|
|
|
|
|
|
|
|
|
|
|
February |
|
258.63 |
|
237.57 |
|
258.63 |
|
9,524,739 |
|
|
179.32 |
|
168.06 |
|
178.82 |
|
12,599,643 |
|
|
15.30 |
|
14.80 |
|
15.03 |
|
180,344 |
|
|
|
|
|
|
|
|
|
|
|
|
|
|
|
|
|
|
|
|
|
|
|
|
|
|
|
|
|
|
|
|
|
|
|
|
|
|
|
|
|
|
|
|
|
|
|
|
|
|
|
|
|
|
March |
|
258.63 |
|
243.46 |
|
248.33 |
|
7,903,309 |
|
|
178.82 |
|
170.01 |
|
172.78 |
|
8,657,688 |
|
|
15.22 |
|
14.63 |
|
14.79 |
|
148,551 |
|
|
|
|
|
|
|
|
|
|
|
|
|
|
|
|
|
|
|
|
|
|
|
|
|
|
|
|
|
|
|
|
|
|
|
|
|
|
|
|
|
|
|
|
|
|
|
|
|
|
|
|
|
|
April |
|
256.53 |
|
230.24 |
|
256.53 |
|
8,289,598 |
|
|
185.98 |
|
161.45 |
|
185.98 |
|
16,571,100 |
|
|
14.91 |
|
14.10 |
|
14.10 |
|
35,328 |
|
|
|
|
|
|
|
|
|
|
|
|
|
|
|
|
|
|
|
|
|
|
|
|
|
|
|
|
|
|
|
|
|
|
|
|
|
|
|
|
|
|
|
|
|
|
|
|
|
|
|
|
|
|
May |
|
272.77 |
|
254.64 |
|
272.66 |
|
6,911,728 |
|
|
198.65 |
|
184.26 |
|
198.65 |
|
12,585,999 |
|
|
14.75 |
|
14.00 |
|
14.40 |
|
29,360 |
|
|
|
|
|
|
|
|
|
|
|
|
|
|
|
|
|
|
|
|
|
|
|
|
|
|
|
|
|
|
|
|
|
|
|
|
|
|
|
|
|
|
|
|
|
|
|
|
|
|
|
|
|
|
June |
|
273.84 |
|
262.59 |
|
273.84 |
|
7,246,466 |
|
|
201.13 |
|
192.05 |
|
201.13 |
|
11,537,177 |
|
|
14.55 |
|
14.22 |
|
14.24 |
|
145,779 |
|
|
|
|
|
|
|
|
|
|
|
|
|
|
|
|
|
|
|
|
|
|
|
|
|
|
|
|
|
|
|
|
|
|
|
|
|
|
|
|
|
|
|
|
|
|
|
|
|
|
|
|
|
|
July |
|
293.53 |
|
269.90 |
|
278.08 |
|
8,288,158 |
|
|
214.21 |
|
198.68 |
|
200.91 |
|
51,829,820 |
|
|
14.71 |
|
14.24 |
|
14.50 |
|
198,351 |
|
|
|
|
|
|
|
|
|
|
|
|
|
|
|
|
|
|
|
|
|
|
|
|
|
|
|
|
|
|
|
|
|
|
|
|
|
|
|
|
|
|
|
|
|
|
|
|
|
|
|
|
|
|
August |
|
277.45 |
|
231.86 |
|
243.91 |
|
10,508,827 |
|
|
203.82 |
|
167.81 |
|
177.61 |
|
29,295,299 |
|
|
15.15 |
|
14.38 |
|
14.99 |
|
69,564 |
|
|
|
|
|
|
|
|
|
|
|
|
|
|
|
|
|
|
|
|
|
|
|
|
|
|
|
|
|
|
|
|
|
|
|
|
|
|
|
|
|
|
|
|
|
|
|
|
|
|
|
|
|
|
September |
|
247.18 |
|
216.10 |
|
216.10 |
|
11,809,678 |
|
|
178.77 |
|
155.33 |
|
155.3 |
|
29,057,963 |
|
|
15.68 |
|
14.86 |
|
15.20 |
|
51,338 |
|
|
|
|
|
|
|
|
|
|
|
|
|
|
|
|
|
|
|
|
|
|
|
|
|
|
|
|
|
|
|
|
|
|
|
|
|
|
|
|
|
|
|
|
|
|
|
|
|
|
|
|
|
|
October |
|
228.64 |
|
210.48 |
|
214.84 |
|
10,331,023 |
|
|
163.45 |
|
150.10 |
|
153.06 |
|
27,068,650 |
|
|
15.10 |
|
14.75 |
|
14.75 |
|
74,932 |
|
|
|
|
|
|
|
|
|
|
|
|
|
|
|
|
|
|
|
|
|
|
|
|
|
|
|
|
|
|
|
|
|
|
|
|
|
|
|
|
|
|
|
|
|
|
|
|
|
|
|
|
|
|
November |
|
218.92 |
|
185.77 |
|
189.55 |
|
10,818,837 |
|
|
155.72 |
|
131.70 |
|
135.43 |
|
26,358,268 |
|
|
14.90 |
|
14.70 |
|
14.72 |
|
11,800 |
|
|
|
|
|
|
|
|
|
|
|
|
|
|
|
|
|
|
|
|
|
|
|
|
|
|
|
|
|
|
|
|
|
|
|
|
|
|
|
|
|
|
|
|
|
|
|
|
|
|
|
|
|
|
December |
|
187.47 |
|
178.26 |
|
181.13 |
|
8,048,999 |
|
|
134.30 |
|
128.65 |
|
131.89 |
|
19,705,280 |
|
|
15.00 |
|
14.75 |
|
14.95 |
|
27,568 |
|
|
|
|
|
|
|
|
|
|
|
|
|
|
|
|
|
|
|
|
|
|
|
|
|
|
|
|
|
|
|
|
|
|
|
|
|
|
|
|
|
|
|
|
|
|
|
|
|
|
|
|
|
|
2026 |
|
|
|
|
|
|
|
|
|
|
|
|
|
|
|
|
|
|
|
|
|
|
|
|
|
|
|
|
|
|
|
|
|
|
|
|
|
|
|
|
|
|
|
|
|
|
|
|
|
|
|
|
|
|
|
|
|
|
|
|
|
|
|
|
|
|
|
|
|
|
|
|
|
|
|
|
|
|
|
|
January |
|
181.13 |
|
150.45 |
|
150.45 |
|
10,868,734 |
|
|
131.89 |
|
110.63 |
|
110.63 |
|
24,479,246 |
|
|
15.25 |
|
14.8 |
|
15.15 |
|
34,300 |
|
|
|
|
|
|
|
|
|
|
|
|
|
|
|
|
|
|
|
|
|
|
|
|
|
|
|
|
|
|
|
|
|
|
|
|
|
|
|
|
|
|
|
|
|
|
|
|
|
|
|
|
|
|
February |
|
150.45 |
|
110.84 |
|
131.33 |
|
28,595,227 |
|
|
110.63 |
|
80.86 |
|
96.41 |
|
89,063,440 |
|
|
15.15 |
|
14.50 |
|
14.72 |
|
52,813 |
|
|
|
|
|
|
|
|
|
|
|
|
|
|
|
|
|
|
|
|
|
|
|
|
|
|
|
Dividends
Our company and our predecessor companies have paid dividends for over 30 years and we view dividends as a critical component of shareholder return.
Any dividends that we declare on our shares take into account all factors that our Board considers relevant, including our available cash flow, financial condition and capital requirements.
Our Board reviews our dividend policy each fiscal year. In February 2026, we announced that our Board approved a 10% increase to our annualized dividend rate of $0.24 to $2.62 per share (or $0.655 per share on a quarterly basis), effective with our dividend to be paid on March 10, 2026 to common shareholders of record as of February 17, 2026. The declaration of dividends by our Board and the amount of those dividends is at the discretion of the Board.
Page 172 |
Thomson Reuters Annual Report 2025 |
The following graph shows our annualized dividends per common share for the periods indicated.
Annualized Dividend per Common Share
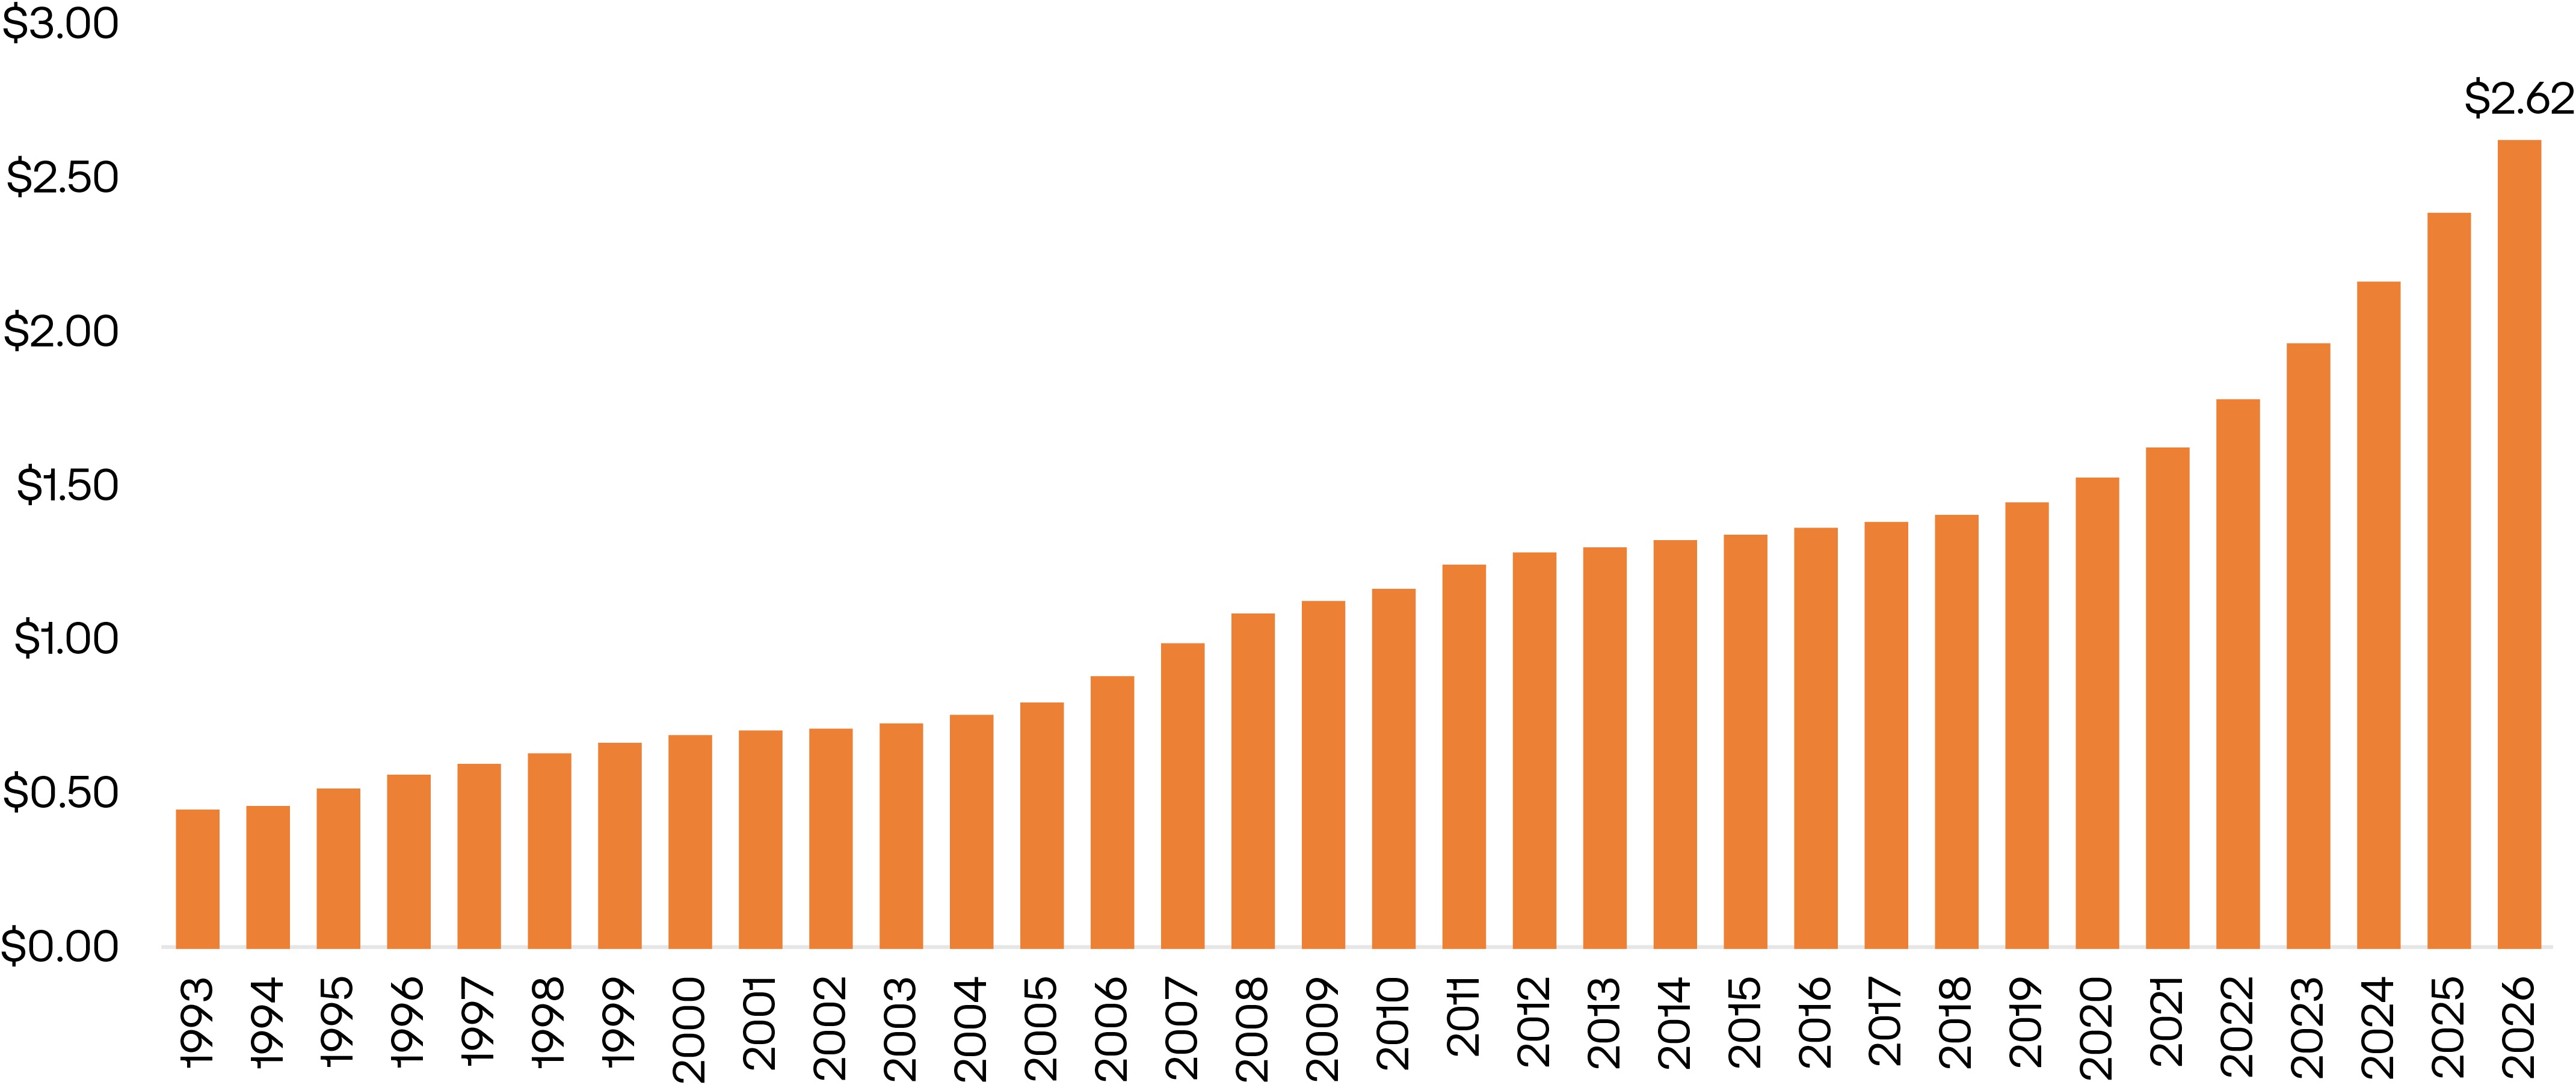
The following table provides information regarding the default currencies for our dividend payments, as well as other currency options that were available to our shareholders as of March 1, 2026.
|
Dividend Currency (Default) |
Dividend Currency (For Electing Holders) |
Common shares |
U.S. dollars |
Canadian dollars British pounds sterling |
DIs (representing common shares) |
British pounds sterling |
U.S. dollars Canadian dollars |
Series II preference shares |
Canadian dollars |
N/A |
We also have a dividend reinvestment plan which allows eligible holders of our common shares to elect to have their cash dividends reinvested in additional shares.
Additional information regarding currency elections for our dividends as well as our dividend reinvestment plan is provided in the Investor Relations section of our website under “Stock Info – Dividend Timetable”.
We pay dividends on our Series II preference shares quarterly at an annual rate of 70% of the Canadian bank prime rate applied to the stated capital of these shares.
Thomson Reuters Annual Report 2025 |
Page 173 |
The table below sets forth the dividends declared on our common shares and Series II preference shares in the last three years and the first quarter of 2026.
|
|
|
|
|
|
|
|
|
|
|
|
Common Shares (US$) |
|
Series II Preference Shares (C$) |
|||||
|
|
|
|
|
|
|
|
|
|
|
|
|
|
|
|
|
|
|
|
2023 |
|
|
|
|
|
|
|||
Q1 |
|
|
$0.490000 |
|
|
C$ |
|
0.285658 |
|
Q2 |
|
|
$0.490000 |
|
|
C$ |
|
0.293631 |
|
Q3 |
|
|
$0.490000 |
|
|
C$ |
|
0.315825 |
|
Q4 |
|
|
$0.490000 |
|
|
C$ |
|
0.317589 |
|
2024 |
|
|
|
|
|
|
|
|
|
Q1 |
|
|
$0.540000 |
|
|
C$ |
|
0.313279 |
|
Q2 |
|
|
$0.540000 |
|
|
C$ |
|
0.311973 |
|
Q3 |
|
|
$0.540000 |
|
|
C$ |
|
0.296486 |
|
Q4 |
|
|
$0.540000 |
|
|
C$ |
|
0.267014 |
|
2025 |
|
|
|
|
|
|
|
|
|
Q1 |
|
|
$0.595000 |
|
|
C$ |
|
0.228267 |
|
Q2 |
|
|
$0.595000 |
|
|
C$ |
|
0.215969 |
|
Q3 |
|
|
$0.595000 |
|
|
C$ |
|
0.218342 |
|
Q4 |
|
|
$0.595000 |
|
|
C$ |
|
0.200699 |
|
2025 |
|
|
|
|
|
|
|
|
|
Q1 |
|
|
$0.655000 |
|
|
C$ |
|
* |
|
|
|
|
|
|
|
|
|
|
|
*As of the date of this annual report, our company had not yet finalized the final dividend amount for the first quarter 2026 dividend on our Series II preference shares.
Transfer Agents and Registrars
Type of Shares |
Country |
Transfer Agent/Registrar |
Location of Transfer Facilities |
Common shares |
Canada |
Computershare Trust Company of Canada |
Toronto; Montreal; Calgary; and Vancouver |
|
United States |
Computershare Trust Company N.A. |
Canton, Massachusetts; and Jersey City, New Jersey |
|
United Kingdom |
Computershare Investor Services PLC |
Bristol, England |
Depositary interests |
United Kingdom |
Computershare Investor Services PLC |
Bristol, England |
Series II preference shares |
Canada |
Computershare Trust Company of Canada |
Toronto |
Ratings of Debt Securities
Our access to financing depends on, among other things, suitable market conditions and the maintenance of suitable long-term credit ratings. Our credit ratings may be adversely affected by various factors, including increased debt levels, decreased earnings, declines in customer demands, increased competition, a further deterioration in general economic and business conditions and adverse publicity. Any downgrades in our credit ratings may impede our access to the debt markets or raise our borrowing rates.
Our long-term unsecured debt securities are rated Baa1 (positive) by Moody’s, A- (stable) by S&P, and A- (stable) by Fitch. These credit ratings are not recommendations to purchase, hold or sell securities and do not address the market price or suitability of a specific security for a particular investor. Credit ratings may not reflect the potential impact of all risks on the value of securities. In addition, real or anticipated changes in the rating assigned to a security will generally affect the market value of that security. Shareholders cannot be assured that a rating will remain in effect for any given period of time or that a rating will not be revised or withdrawn entirely by a rating agency in the future.
Page 174 |
Thomson Reuters Annual Report 2025 |
Moody’s Investors Services (Moody’s)
Moody’s long-term credit ratings are on a rating scale that ranges from Aaa to C, which represents the range from highest to lowest quality of such securities rated. Moody’s “Baa” rating assigned to our long-term debt instruments is the fourth highest rating of nine rating categories. Obligations rated “Baa” are subject to moderate credit risk. They are considered medium-grade and as such may possess certain speculative characteristics. Moody’s appends numerical modifiers from 1 to 3 to its long-term debt ratings, which indicate where the obligation ranks within its generic rating category, with 1 being the highest. Ratings outlooks represent Moody’s assessment regarding the likely direction of the rating over the medium-term. In November 2025, Moody’s changed Thomson Reuters’ outlook from Stable to Positive, indicating a potential rating upgrade in the next 12-18 months.
Standard & Poor’s Global Ratings (S&P)
S&P’s long-term credit ratings are on a rating scale that ranges from AAA to D, which represents the range from highest to lowest quality of such securities rated. S&P’s “A-” rating assigned to our long-term debt instruments is the third highest rating of 10 rating categories. An “A-” rating indicates that the obligor has strong capacity to meet its financial commitments. However, adverse economic conditions or changing circumstances are somewhat likely to lead to a weakened capacity of the obligor to meet its financial commitment. S&P uses “+” or “-” designations to indicate the relative standing of securities within a particular rating category. Outlooks represent S&P’s assessment regarding the potential direction of the rating over the immediate term (typically six months to two years). In May 2025, S&P upgraded Thomson Reuters’ rating from BBB+ to A- with Stable rating outlook.
Fitch Ratings (Fitch)
Fitch’s long-term credit ratings are on a rating scale that ranges from AAA to D, which represents the range from highest to lowest quality of such securities rated. Fitch’s “A-” rating assigned to our long-term debt instruments is the third highest rating of 11 rating categories. An “A-” rating indicates a low expectation of default, and that while the capacity for payment of financial commitments is considered strong, it is more vulnerable to adverse business or economic conditions than is the case for higher ratings. Fitch uses “+” or “-” designations to indicate the relative standing of securities within a particular rating category.
Outlooks represents Fitch’s assessment regarding the direction a rating is likely to move over a one to two-year period. In September 2025, Fitch upgraded Thomson Reuters’ rating from BBB+ to A- with Stable rating outlook.
Material Contracts
Credit Facility Agreement
We have a $2.0 billion syndicated credit facility agreement which matures in November 2030 and may be used to provide liquidity for general corporate purposes (including acquisitions or support for our commercial paper program). There were no outstanding borrowings under the credit facility as of December 31, 2025 and 2024. We have the option to request an increase, subject to approval by applicable lenders, in the lenders’ commitments in an aggregate amount of $600 million for a maximum credit facility commitment of $2.6 billion. Based on our current credit ratings, the cost of borrowing under the agreement is priced at Term Secured Overnight Financing Rate (SOFR)/Euro Interbank Offered Rate (EURIBOR)/ Simple Sterling Overnight Index Average (SONIA) plus 92bp. If our debt rating is downgraded by any two of Moody’s, S&P or Fitch, our facility fees and borrowing costs could increase, although availability would be unaffected. Conversely, an upgrade in our ratings may reduce our facility fees and borrowing costs. We also monitor the lenders that are party to our facility and believe they continue to be able to lend to us.
We guarantee borrowings by our subsidiaries under the credit facility. We must also maintain a ratio of net debt as defined in the credit agreement (total debt after hedging agreements less cash and cash equivalents) as of the last day of each fiscal quarter to EBITDA as defined in the credit agreement (earnings before interest, income taxes, depreciation and amortization and other modifications described in the credit agreement) for the last four quarters ended of not more than 4.5:1. If we complete an acquisition with a purchase price of over $500 million, we may elect, subject to notification, to temporarily increase the ratio of net debt to EBITDA to 5.0:1 at the end of the quarter within which the transaction closed for each of the three immediately following fiscal quarters. At the end of that period, the ratio would revert to 4:5:1. As of December 31, 2025, we were in compliance with this covenant as our ratio of net debt to EBITDA, as calculated under the terms of our syndicated credit facility, was 0.6:1.
Thomson Reuters Annual Report 2025 |
Page 175 |
Thomson Reuters Trust Principles and Thomson Reuters Founders Share Company
Our company is dedicated to upholding the Thomson Reuters Trust Principles and to preserving its integrity, independence and freedom from bias in the gathering and dissemination of information and news.
The Trust Principles read as follows:
The Thomson Reuters Founders Share Company was established in 1984 when Reuters became a public company. The directors of the Thomson Reuters Founders Share Company have a duty to ensure, to the extent possible, that the Thomson Reuters Trust Principles are complied with.
The directors of the Thomson Reuters Founders Share Company are experienced and eminent people from the world of politics, diplomacy, media, public service and business. They generally have all held high offices in their respective sectors. The directors are selected by a nomination committee and proposed to the board of the Thomson Reuters Founders Share Company to be considered for appointment. The nomination committee also has unique features. Two of its members are appointed in consultation with the European Court of Human Rights (ECHR) and assist in scrutinizing candidates’ suitability. These have historically been judges of the ECHR. Our Board currently has one representative on the nomination committee. In addition to the chairman and deputy chairman of the Thomson Reuters Founders Share Company, who are also members of the nomination committee, the chairman of the Thomson Reuters Founders Share Company appoints three other representatives to the nomination committee. Other members are representatives of press associations from the United Kingdom and Australia.
The directors of the Thomson Reuters Founders Share Company have a minimum of two meetings per year. They receive reports on our activities in different fields in which we operate. The directors meet with representatives of senior management at the Thomson Reuters Founders Share Company board meetings and Thomson Reuters site visits; the directors of the Thomson Reuters Founders Share Company also have access to our Board, as necessary. Through the Thomson Reuters Founders Share Company’s chairman, regular contact is maintained with our company. The Thomson Reuters Founders Share Company also has certain consultation rights as to the appointments of the president and editor in chief of the news services of Reuters.
Amended and Restated Reuters Support Agreement
In December 2020, Thomson Reuters Founders Share Company, Thomson Reuters and Reuters entered into an Amended and Restated Reuters Support Agreement (ARRSA). The following is a summary of certain provisions of the agreement, a copy of which has been filed with the Canadian Securities Administrators’ SEDAR+ website, www.sedarplus.ca, and in the EDGAR section of the Securities and Exchange Commission’s (SEC) website at www.sec.gov.
Under the ARRSA, the prior written consent of Thomson Reuters Founders Share Company is required to effect a sale (or similar transaction) to an unrelated third-party of, a material acquisition by, or material dispositions from, Reuters. Reuters will remain a separate business unit of Thomson Reuters – the sole unit that carries on the business of providing multimedia news services. Reuters will receive access to capital and shared services and will continue to provide services to our company’s other business units. Reuters has agreed to invest all of the license fees payable under the news agreement with LSEG into the Reuters business, and has agreed not to amend the news agreement in a manner that would negatively impact the annual fee payable, significantly increase Reuters’ costs without reimbursement or amend any provision related to the Trust Principles without Thomson Reuters Founders Share Company’s prior written consent. Thomson Reuters and Reuters agreed not to amend any provisions of the Brand License Agreements related to the Trust Principles without Thomson Reuters Founders Share Company’s prior written consent.
Page 176 |
Thomson Reuters Annual Report 2025 |
Directors of the Thomson Reuters Founders Share Company
The current directors of the Thomson Reuters Founders Share Company, with their countries of residence and the year of initial appointments, are:
Name |
Country |
Director Since |
Stephen Toope (Chair) |
Canada |
2024 |
Linda Robinson |
U.K. |
2019 |
Pawel Dangel |
Poland |
2020 |
Anne Bouverot |
France |
2021 |
Aiko Doden |
Japan |
2021 |
Murilo Portugal |
Brazil |
2022 |
Nikiwe Bikitsha |
South Africa |
2023 |
Yuen Yuen Ang |
U.S. |
2023 |
Naushad Forbes |
India |
2024 |
Michael Froman |
U.S. |
2024 |
Ann Marie Lipinski |
U.S. |
2024 |
Sharmila Nebhrajani |
U.K. |
2024 |
Tim Gardam |
U.K. |
2024 |
Aidan Eyakuze |
Tanzania |
2025 |
Emma Cowdroy |
Australia |
2025 |
Directors are appointed for an initial term of three years and must retire on December 31 following the third anniversary of appointment. Those directors are eligible for re-appointment for additional terms of three years, subject to a maximum term of nine years.
Our company is a party to a Deed of Mutual Covenant, under which Thomson Reuters and the Thomson Reuters Founders Share Company have covenanted with press associations from the United Kingdom and Australia to use their best endeavors to ensure that the Trust Principles are complied with in relation to Thomson Reuters.
Under a Thomson Reuters Trust Principles Support Agreement, Woodbridge has agreed to support the Trust Principles and to exercise its voting rights to give effect to this support and the Thomson Reuters Founders Share Company has irrevocably designated Woodbridge as an approved person for so long as Woodbridge is controlled by members of the Thomson family, companies controlled by them and trusts for their benefit.
Thomson Reuters Annual Report 2025 |
Page 177 |
Principal Subsidiaries
The following provides information about our principal subsidiaries as of December 31, 2025. As of that date, we beneficially owned, directly or indirectly, 100% of the voting securities and non-voting securities of each of these subsidiaries. Certain subsidiaries, each of which represents not more than 10% of the consolidated assets and not more than 10% of the consolidated revenues of our company, and all of which, in the aggregate, represent not more than 20% of the total consolidated assets and the total consolidated revenues of our company as of December 31, 2025, have been omitted.
Subsidiary |
Jurisdiction of Incorporation/Formation |
3276838 Nova Scotia Company |
Nova Scotia, Canada |
Additive AI, Inc. |
Delaware, United States |
Bedrijfsbeheer TRA B.V. |
The Netherlands |
Capital Confirmation Inc. |
Delaware, United States |
CPaperless, LLC |
Delaware, United States |
HighQ Solutions Limited |
England |
LiveNote Technologies Limited |
England |
LN Holdings Limited |
Bermuda |
Pagero AB |
Sweden |
Pagero GmbH |
Germany |
Pagero Sverge AB |
Sweden |
Pagero UK Ltd. |
England |
Reuters Limited |
England |
Reuters News & Media Inc. |
Delaware, United States |
Reuters News & Media Limited |
England |
SafeSend Topco, Inc. |
Delaware, United States |
SurePrep, LLC |
Delaware, United States |
Thomson Reuters (Australia) Pty Limited |
Australia |
Thomson Reuters (Legal) Inc. |
Minnesota, United States |
Thomson Reuters (Professional) Australia Limited |
Australia |
Thomson Reuters (Professional) UK Limited |
England |
Thomson Reuters (Tax & Accounting) Inc. |
Texas, United States |
Thomson Reuters (TRI) Inc. |
Delaware, United States |
Thomson Reuters America Corporation |
Delaware, United States |
Thomson Reuters Applications Inc. |
Delaware, United States |
Thomson Reuters Brasil Conteúdo e Tecnologia Ltda |
Brazil |
Thomson Reuters Canada Limited |
Ontario, Canada |
Thomson Reuters Contact Center, S.A. de C.V. |
Mexico |
Thomson Reuters Enterprise Centre GmbH |
Switzerland |
Thomson Reuters Finance S.A. |
Luxembourg |
Thomson Reuters Group Limited |
England |
Thomson Reuters Holdco LLC |
Delaware, United States |
Thomson Reuters Holdings B.V. |
The Netherlands |
Thomson Reuters Holdings Inc. |
Delaware, United States |
Thomson Reuters Holdings S.A. |
Luxembourg |
Thomson Reuters Investment Holdings Limited |
England |
Thomson Reuters MX Servicios, S.A. de C.V. |
Mexico |
Thomson Reuters No. 5 LLC |
Delaware, United States |
Thomson Reuters No. 8 LLC |
Delaware, United States |
Thomson Reuters U.S. LLC |
Delaware, United States |
TR (2008) Limited |
England |
TR 2023 LLC |
Delaware, United States |
TR Finance LLC |
Delaware, United States |
TR Holdings Limited |
Bermuda |
TTC (1994) Limited |
England |
TTC Holdings Limited |
Bermuda |
West Publishing Corporation |
Minnesota, United States |
Page 178 |
Thomson Reuters Annual Report 2025 |
Interests of Experts
Our independent registered public accounting firm is PricewaterhouseCoopers LLP, who has issued an independent registered public accounting firm’s report dated March 5, 2026 in respect of our consolidated financial statements as of December 31, 2025 and December 31, 2024 and for each of the years ended December 31, 2025 and December 31, 2024 and our internal control over financial reporting as of December 31, 2025. PricewaterhouseCoopers LLP has advised that it is independent with respect to our company within the meaning of the Rules of Professional Conduct of the Institute of Chartered Accountants of Ontario and has complied with the auditor independence rules of the U.S. Securities and Exchange Commission and the requirements of the Public Company Accounting Oversight Board (United States).
Further Information and Disclosures
Cybersecurity Risk Management
We implement a wide range of security policies, standards, technology, and practices, which are integrated in our overall enterprise risk management framework. Under the leadership of our Chief Operations & Technology Officer, teams across the organization play a critical role in identifying, assessing, responding, monitoring, and reporting risks under the guidelines of the enterprise risk management framework. Our Information Security Risk Management (ISRM) team is responsible for operating and enhancing our security capabilities, based on the National Institute of Standards and Technology (NIST) Cybersecurity Framework (CSF) and Capability Maturity Model (CMMI), to help prevent, detect, and respond to cybersecurity threats.
Our Chief Operations & Technology Officer is in charge of the management of cybersecurity risks as an important component of our overall enterprise risk management framework. Our Board is responsible for confirming that a system is in place to identify the principal risks facing Thomson Reuters and that appropriate procedures and systems are in place to monitor, mitigate and manage those risks. The Board, through its committees, periodically receives reports from or meets with members of management to discuss material enterprise risks, including cybersecurity risks.
Iran Threat Reduction and Syria Human Rights Act Disclosure
The Iran Threat Reduction and Syria Human Rights Act of 2012 (ITRA) requires us to disclose information in our annual report if we or any of our affiliates knowingly engaged in certain transactions or dealings related to Iran and other sanctioned individuals or entities in 2025. Disclosure is generally required, even if the transactions or dealings were conducted in compliance with applicable law and regulations.
During 2025, one of our non-U.S. subsidiaries sold Reuters news text newswires and video products to one broadcasting entity in Iran covered by the ITRA. These transactions were exempt from U.S. economic sanctions laws and regulations, to the extent they may apply, as information or informational materials per 31 CFR § 560.210 (c). The aggregate gross revenue attributable to these 2025 sales was approximately $625,000. We recognized $141,000 of revenue from these sales in 2025. These sales represented approximately 0.01% of our company’s 2025 consolidated revenues. Additionally, in 2025, we recognized approximately $507,000 in revenue related to the delayed collection of outstanding receivables from prior-year periods related to the same broadcasting entity bringing total revenue recognized in 2025 to $648,000. We estimate that the 2025 net profit attributable to this revenue (utilizing Reuters’ 2025 segment adjusted EBITDA margin disclosed in this annual report) was approximately $130,000. We discussed these pre-2025 outstanding receivables in our previously-filed annual reports.
Our Reuters business plans to continue current contracts but does not plan on entering into any new sales contracts with customers covered by the ITRA, subject to limited exceptions where continued sales are permissible under applicable export control and economic sanctions laws and regulations.
Other Information and Disclosures
Steve Hasker, our President and Chief Executive Officer and a director of our company, was a director of Global Eagle Entertainment Inc. until May 2020. In July 2020, Global Eagle Entertainment Inc. commenced voluntary proceedings under Chapter 11 of the United States Bankruptcy Code.
Kim Rivera, a director of our company, was a director of Cano Health, Inc. In February 2024, Cano Health, Inc. commenced voluntary proceedings under Chapter 11 of the United States Bankruptcy Code.
Michael Friisdahl, a director of our company, was a director of SAS AB. In July 2022, SAS AB commenced voluntary proceedings under Chapter 11 of the United States Bankruptcy Code.
For more information about Thomson Reuters, please see our various filings and notifications posted on our website, thomsonreuters.com, the Canadian Securities Administrators’ SEDAR+ website, www.sedarplus.ca, and in the EDGAR section of the Securities and Exchange Commission’s (SEC) website at www.sec.gov.
Thomson Reuters Annual Report 2025 |
Page 179 |
Additional information, including directors’ and officers’ remuneration and indebtedness, principal holders of our shares and securities authorized for issuance under our equity compensation plans, will be contained in our management proxy circular, which is being prepared in connection with our upcoming annual meeting of shareholders to be held on June 10, 2026. Copies of our management proxy circular will be available upon request in writing to: Investor Relations Department, Thomson Reuters, 3 Times Square, New York, New York 10036, United States. Requests may also be sent by e-mail to: investor.relations@thomsonreuters.com.
Information required to be provided pursuant to Canadian Securities Administrators Multilateral Instrument Form 52-110F1 (Audit Committees) for our company is included in the “Governance” section of this annual report.
Additional financial information is included in the “Management’s Discussion and Analysis” and “Consolidated Financial Statements” sections of this annual report.
Under Rule 5615(a)(3) of the Nasdaq listing rules, we are required to disclose any home country practices we follow as a foreign private issuer in lieu of certain Nasdaq corporate governance requirements. Pursuant to Nasdaq Rule 5615(a)(3), Thomson Reuters follows home country practices in lieu of two Nasdaq listing rules.
Nasdaq Listing Rule 5635 requires shareholder approval of all “equity compensation plans” and material revisions to these types of plans (with limited exceptions). TSX rules require shareholder approval of security-based compensation arrangements only for plans which involve newly issued shares or specified amendments to the plans. Similar to a number of other Canadian issuers, our company follows the TSX rules.
Further, Nasdaq Rule 5620(c) requires that the minimum quorum for a shareholder meeting shall be 33-1/3% of the outstanding common shares, whereas Thomson Reuters’ by-laws provide that a quorum for a shareholder meeting shall either be: (a) two persons present and each are entitled to vote or (b) the holder of the Thomson Reuters Founders Share. However, if the shareholder meeting includes the consideration of any resolution on which the holder of the Thomson Reuters Founders Share is entitled to vote, a quorum shall not be present for any purpose unless the holder of the Thomson Reuters Founders Share is present. Thomson Reuters’ quorum requirements comply with the Business Corporations Act (Ontario), and the TSX rules do not contain specific quorum requirements.
Our Code of Business Conduct and Ethics, corporate governance guidelines and Board committee charters are available on thomsonreuters.com as well as in print or electronically (without charge) to any shareholder who requests a copy in writing or by e-mail to our Investor Relations Department. Shareholders and other interested parties may contact the Board or its non-management or independent directors as a group, or the directors who preside over their meetings, by writing to them by e-mail at board@thomsonreuters.com or by mail at Thomson Reuters Board of Directors, Attention: Chief Legal Officer and Company Secretary, Thomson Reuters, 19 Duncan Street, Toronto, Ontario M5H 3H1, Canada.
Any statement in this annual report about any of our contracts or other documents is not necessarily complete. If the contract or document is filed as an exhibit to our annual report with the SEC or as a material contract with the Canadian securities regulatory authorities, then the contract or document is deemed to modify the description contained in this annual report. You should review the contracts or documents themselves for a complete description.
We are required to file reports and other information with the SEC under the U.S. Securities Exchange Act of 1934, as amended, and regulations under that act. As a foreign private issuer, we are exempt from the rules under the U.S. Securities Exchange Act prescribing the form and content of proxy statements and our officers, directors and principal shareholders are exempt from the reporting and short swing profit recovery provisions contained in Section 16 of the U.S. Securities Exchange Act.
Page 180 |
Thomson Reuters Annual Report 2025 |
Cross Reference Tables
For the convenience of our shareholders, we have prepared one annual report for the year ended December 31, 2025 that addresses our disclosure requirements under applicable Canadian and U.S. laws and regulations.
The following pages include cross reference tables that reflect where we have disclosed information required to be contained in an annual information form prepared in accordance with Canadian laws and regulations and an annual report on Form 40-F prepared in accordance with SEC requirements.
Annual Information Form (Form 51-102F2) Cross Reference Table
|
|
|
|
Page/Document |
Item 1. |
|
Cover Page |
|
Cover |
Item 2. |
|
Table of Contents |
|
1 |
Item 3. |
|
Corporate Structure |
|
|
|
|
3.1 Name, Address And Incorporation |
|
171 |
|
|
3.2 Intercorporate Relationships |
|
178 |
Item 4. |
|
General Development of the Business |
|
|
|
|
4.1 Three Year History |
|
5 |
|
|
4.2 Significant Acquisitions |
|
13, 38 |
Item 5. |
|
Describe the Business |
|
|
|
|
5.1 General |
|
2-18 |
|
|
5.2 Risk Factors |
|
19-32 |
|
|
5.3 Companies With Asset-Backed Securities Outstanding |
|
N/A |
|
|
5.4 Companies With Mineral Projects |
|
N/A |
|
|
5.5 Companies With Oil And Gas Activities |
|
N/A |
Item 6. |
|
Dividends |
|
172-174 |
Item 7. |
|
Description of Capital Structure |
|
|
|
|
7.1 General Description Of Capital Structure |
|
171-172 |
|
|
7.2 Constraints |
|
N/A |
|
|
7.3 Ratings |
|
174-175 |
Item 8. |
|
Market for Securities |
|
|
|
|
8.1 Trading Price And Volume |
|
172 |
|
|
8.2 Prior Sales |
|
N/A |
Item 9. |
|
Escrowed Securities and Securities Subject to Contractual Restriction on Transfer |
|
N/A |
Item 10. |
|
Directors and Officers |
|
|
|
|
10.1 Name, Occupation And Security Holding |
|
160-170 |
|
|
10.2 Cease Trade Orders, Bankruptcies, Penalties Or Sanctions |
|
179-180 |
|
|
10.3 Conflicts Of Interest |
|
N/A |
Item 11. |
|
Promoters |
|
N/A |
Item 12. |
|
Legal Proceedings and Regulatory Actions |
|
|
|
|
12.1 Legal Proceedings |
|
57 |
|
|
12.2 Regulatory Actions |
|
57 |
|
|
|
|
|
Item 13. |
|
Interest of Management and Others in Material Transactions |
|
62 |
Item 14. |
|
Transfer Agents and Registrars |
|
174 |
Item 15. |
|
Material Contracts |
|
175-176 |
Item 16. |
|
Interests of Experts |
|
179 |
|
|
16.1 Names Of Experts |
|
179 |
|
|
16.2 Interests Of Experts |
|
179 |
Item 17. |
|
Additional Information |
|
179-180 |
Thomson Reuters Annual Report 2025 |
Page 181 |
Item 18. |
|
Additional Disclosure for Companies Not Sending Information Circulars |
|
N/A |
Form 40-F Cross Reference Table
|
|
Page/Document |
|
Annual Information Form |
|
See AIF Table |
|
Audited Annual Financial Statements |
|
96-159 |
|
Management’s Discussion And Analysis |
|
33-95 |
|
Disclosure Controls And Procedures |
|
65 |
|
Internal Control Over Financial Reporting |
|
|
|
|
a. Changes In Internal Controls Over Financial Reporting |
|
65 |
|
b. Management’s Report On Internal Control Over Financial Reporting |
|
96 |
|
c. Independent Auditor’s Report On Internal Control Over Financial Reporting |
|
97-98 |
Notice Pursuant To Regulation BTR |
|
N/A |
|
Audit Committee Financial Expert |
|
166 |
|
Code Of Ethics |
|
170 |
|
Principal Accountant Fees And Services |
|
167 |
|
Off-Balance Sheet Arrangements |
|
56-57 |
|
Material Cash Requirements |
|
50,51,52,56,57 |
|
Identification Of The Audit Committee |
|
166 |
|
Disclosure Regarding Foreign Jurisdictions that Prevent Inspections |
|
N/A |
|
Page 182 |
Thomson Reuters Annual Report 2025 |
THOMSON REUTERS |
|
|
|
|
19 Duncan Street |
|
|
|
|
Toronto, Ontario M5H 3H1 |
|
|
||
tel: +1 647 480 7000 |
|
|
||
thomsonreuters.com |
|
|
|
|