Shareholder Report
Dec. 31, 2025
USD ($)
Holding
What were the Fund costs for the last year ?
(based on a hypothetical $10,000 investment)
| Class name | Costs of a $10,000 investment |
Costs paid as a percentage of a $10,000 investment |
| $5 | 0.04% |
How did the Fund perform last year ?
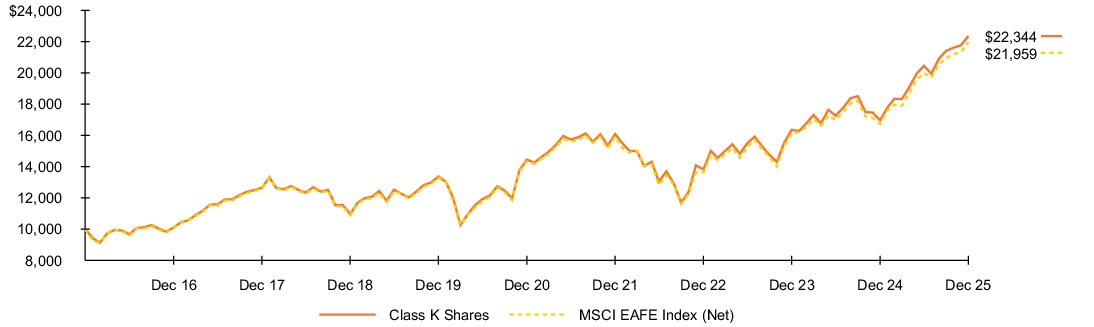
- For the reporting period ended December 31, 2025, the Fund’s Class K Shares returned 31.73%.
- For the same period, the Fund’s benchmark, the MSCI EAFE Index (Net) returned 31.22%.
In 2025, European equities started the year in positive territory despite rising United States (“U.S.”) tariff pressures. The European Central Bank (“ECB”) cut rates by 25 basis points in both January 2025 and March 2025 to mitigate recession risks, with President Lagarde noting that euro area growth would likely remain weak amid persistent inflationary pressures. European Union finance ministers emphasized unity and deeper market integration to offset tariff‑related disruptions. In Japan, equities were volatile throughout the first quarter, and the Nikkei 225 Index ended the period in negative territory as investors grew cautious about the new U.S. administration’s tougher tariff stance and its implications for corporate earnings and broader economic conditions.
European equities continued to advance in the second quarter of 2025, supported by resilient investor sentiment despite slower economic momentum and persistent global trade tensions. The ECB held rates steady following the earlier cuts and reiterated its commitment to supporting growth as inflation remained elevated. Policymakers also highlighted the importance of fiscal discipline and reinforced the need for European Union cohesion. Japan experienced a strong rebound during the second quarter, with the Nikkei 225 Index closing near all‑time highs on June 30, 2025, driven by new stimulus measures and a more stable Japanese Yen, although uncertainties around export demand and supply chain pressures continued to weigh on corporate outlooks.
Europe remained resilient during the third quarter of 2025, supported by firm domestic demand and a healthy labor market. The ECB maintained rates at 2.0% in both July 2025 and September 2025, pausing its year‑long easing cycle as inflation hovered near target despite a slight uptick in September. Japanese equities extended their gains through the third quarter, supported by easing trade tensions, increasing investor interest in artificial intelligence (“AI”), and improved sentiment tied to anticipated political leadership changes. The Bank of Japan (“BOJ”) kept rates unchanged at 0.5%, though some policymakers signaled openness to future increases.
European equities continued to rise in the fourth quarter of 2025, even as global volatility driven by AI‑related market concerns briefly unsettled sentiment before rebound into year‑end. The ECB retained rates at 2.0% in both October 2025 and December 2025, citing better‑than‑expected eurozone growth and inflation trending close to target while maintaining a cautious, data‑dependent stance. Japan again delivered strong equity performance in the fourth quarter, supported by above‑target inflation, notable wage growth, sustained AI‑driven enthusiasm, and a weak yen that boosted export competitiveness. The BOJ held rates steady in October 2025 and raised them in December 2025 to 0.75%, reflecting growing confidence in Japan’s improving economic backdrop despite continuing global trade uncertainty.
The views expressed reflect the opinions of BlackRock as of the date of this report and are subject to change based on changes in market, economic or other conditions. These views are not intended to be a forecast of future events and are no guarantee of future results.
Fund performance
Cumulative performance: January 1, 2016 through December 31, 2025
Initial investment of $10,000
See “Average annual total returns” for additional information on fund performance.
| Average annual total returns | ||||||
| 1 Year | 5 Years | 10 Years | ||||
| 31.73 | % | 9.12 | % | 8.37 | % | |
| 31.22 | 8.92 | 8.18 |
| Key Fund statistics | |
| $13,317,571,383 | |
| 702 | |
| $1,176,645 | |
| 8% |
What did the Fund invest in?
(as of December 31, 2025)
| Geographic allocation | ||
| Country/Geographic Region | Percent of Net Assets |
|
| 21.9 | % | |
| 12.7 | ||
| 10.3 | ||
| 9.5 | ||
| 7.6 | ||
| 6.9 | ||
| 4.7 | ||
| 4.5 | ||
| 3.7 | ||
| 3.3 | ||
| 14.4 | ||
| 0.5 | ||
| Ten largest holdings | ||
| Security(a) | Percent of Net Assets |
|
| 2.0 | % | |
| 1.4 | ||
| 1.4 | ||
| 1.3 | ||
| 1.3 | ||
| 1.3 | ||
| 1.2 | ||
| 1.0 | ||
| 1.0 | ||
| 1.0 | ||
| Excludes short-term securities. |
| Ten largest countries/geographic regions are presented. Additional countries/geographic regions are found in Other. |
| Ten largest holdings | ||
| Security(a) | Percent of Net Assets |
|
| 2.0 | % | |
| 1.4 | ||
| 1.4 | ||
| 1.3 | ||
| 1.3 | ||
| 1.3 | ||
| 1.2 | ||
| 1.0 | ||
| 1.0 | ||
| 1.0 | ||
What were the Fund costs for the last year ?
(based on a hypothetical $10,000 investment)
| Class name | Costs of a $10,000 investment |
Costs paid as a percentage of a $10,000 investment |
| $3 | 0.03% |
How did the Fund perform last year ?
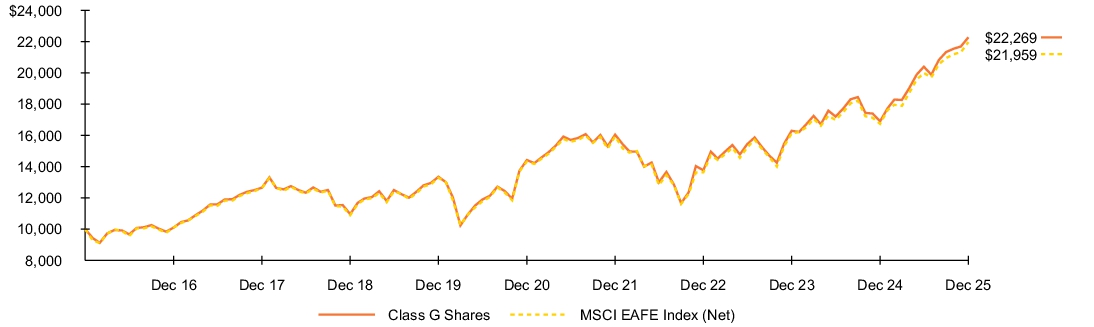
- For the reporting period ended December 31, 2025, the Fund’s Class G Shares returned 31.76%.
- For the same period, the Fund’s benchmark, the MSCI EAFE Index (Net) returned 31.22%.
In 2025, European equities started the year in positive territory despite rising United States (“U.S.”) tariff pressures. The European Central Bank (“ECB”) cut rates by 25 basis points in both January 2025 and March 2025 to mitigate recession risks, with President Lagarde noting that euro area growth would likely remain weak amid persistent inflationary pressures. European Union finance ministers emphasized unity and deeper market integration to offset tariff‑related disruptions. In Japan, equities were volatile throughout the first quarter, and the Nikkei 225 Index ended the period in negative territory as investors grew cautious about the new U.S. administration’s tougher tariff stance and its implications for corporate earnings and broader economic conditions.
European equities continued to advance in the second quarter of 2025, supported by resilient investor sentiment despite slower economic momentum and persistent global trade tensions. The ECB held rates steady following the earlier cuts and reiterated its commitment to supporting growth as inflation remained elevated. Policymakers also highlighted the importance of fiscal discipline and reinforced the need for European Union cohesion. Japan experienced a strong rebound during the second quarter, with the Nikkei 225 Index closing near all‑time highs on June 30, 2025, driven by new stimulus measures and a more stable Japanese Yen, although uncertainties around export demand and supply chain pressures continued to weigh on corporate outlooks.
Europe remained resilient during the third quarter of 2025, supported by firm domestic demand and a healthy labor market. The ECB maintained rates at 2.0% in both July 2025 and September 2025, pausing its year‑long easing cycle as inflation hovered near target despite a slight uptick in September. Japanese equities extended their gains through the third quarter, supported by easing trade tensions, increasing investor interest in artificial intelligence (“AI”), and improved sentiment tied to anticipated political leadership changes. The Bank of Japan (“BOJ”) kept rates unchanged at 0.5%, though some policymakers signaled openness to future increases.
European equities continued to rise in the fourth quarter of 2025, even as global volatility driven by AI‑related market concerns briefly unsettled sentiment before rebound into year‑end. The ECB retained rates at 2.0% in both October 2025 and December 2025, citing better‑than‑expected eurozone growth and inflation trending close to target while maintaining a cautious, data‑dependent stance. Japan again delivered strong equity performance in the fourth quarter, supported by above‑target inflation, notable wage growth, sustained AI‑driven enthusiasm, and a weak yen that boosted export competitiveness. The BOJ held rates steady in October 2025 and raised them in December 2025 to 0.75%, reflecting growing confidence in Japan’s improving economic backdrop despite continuing global trade uncertainty.
The views expressed reflect the opinions of BlackRock as of the date of this report and are subject to change based on changes in market, economic or other conditions. These views are not intended to be a forecast of future events and are no guarantee of future results.
Fund performance
Cumulative performance: January 1, 2016 through December 31, 2025
Initial investment of $10,000
See “Average annual total returns” for additional information on fund performance.
| Average annual total returns | ||||||
| 1 Year | 5 Years | 10 Years | ||||
| 31.76 | % | 9.09 | % | 8.34 | % | |
| 31.22 | 8.92 | 8.18 |
| Key Fund statistics | |
| $13,317,571,383 | |
| 702 | |
| $1,176,645 | |
| 8% |
What did the Fund invest in?
(as of December 31, 2025)
| Geographic allocation | ||
| Country/Geographic Region | Percent of Net Assets |
|
| 21.9 | % | |
| 12.7 | ||
| 10.3 | ||
| 9.5 | ||
| 7.6 | ||
| 6.9 | ||
| 4.7 | ||
| 4.5 | ||
| 3.7 | ||
| 3.3 | ||
| 14.4 | ||
| 0.5 | ||
| Ten largest holdings | ||
| Security(a) | Percent of Net Assets |
|
| 2.0 | % | |
| 1.4 | ||
| 1.4 | ||
| 1.3 | ||
| 1.3 | ||
| 1.3 | ||
| 1.2 | ||
| 1.0 | ||
| 1.0 | ||
| 1.0 | ||
| Excludes short-term securities. |
| Ten largest countries/geographic regions are presented. Additional countries/geographic regions are found in Other. |
| Ten largest holdings | ||
| Security(a) | Percent of Net Assets |
|
| 2.0 | % | |
| 1.4 | ||
| 1.4 | ||
| 1.3 | ||
| 1.3 | ||
| 1.3 | ||
| 1.2 | ||
| 1.0 | ||
| 1.0 | ||
| 1.0 | ||
What were the Fund costs for the last year ?
(based on a hypothetical $10,000 investment)
| Class name | Costs of a $10,000 investment |
Costs paid as a percentage of a $10,000 investment |
| $39 | 0.34% |
How did the Fund perform last year ?
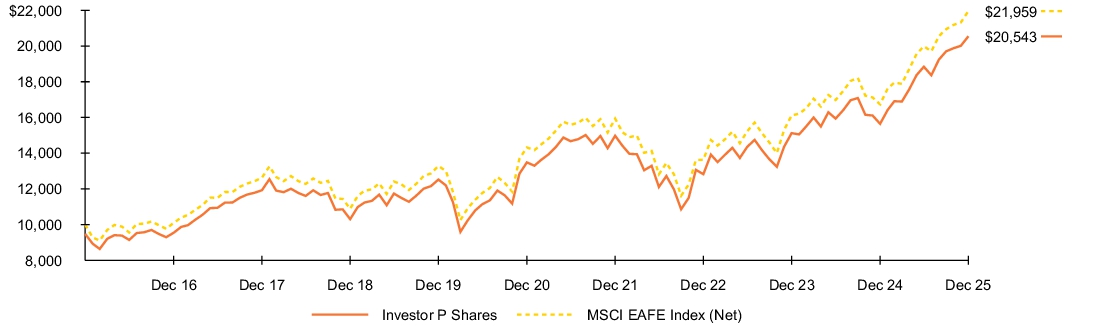
- For the reporting period ended December 31, 2025, the Fund’s Investor P Shares returned 31.30%.
- For the same period, the Fund’s benchmark, the MSCI EAFE Index (Net) returned 31.22%.
In 2025, European equities started the year in positive territory despite rising United States (“U.S.”) tariff pressures. The European Central Bank (“ECB”) cut rates by 25 basis points in both January 2025 and March 2025 to mitigate recession risks, with President Lagarde noting that euro area growth would likely remain weak amid persistent inflationary pressures. European Union finance ministers emphasized unity and deeper market integration to offset tariff‑related disruptions. In Japan, equities were volatile throughout the first quarter, and the Nikkei 225 Index ended the period in negative territory as investors grew cautious about the new U.S. administration’s tougher tariff stance and its implications for corporate earnings and broader economic conditions.
European equities continued to advance in the second quarter of 2025, supported by resilient investor sentiment despite slower economic momentum and persistent global trade tensions. The ECB held rates steady following the earlier cuts and reiterated its commitment to supporting growth as inflation remained elevated. Policymakers also highlighted the importance of fiscal discipline and reinforced the need for European Union cohesion. Japan experienced a strong rebound during the second quarter, with the Nikkei 225 Index closing near all‑time highs on June 30, 2025, driven by new stimulus measures and a more stable Japanese Yen, although uncertainties around export demand and supply chain pressures continued to weigh on corporate outlooks.
Europe remained resilient during the third quarter of 2025, supported by firm domestic demand and a healthy labor market. The ECB maintained rates at 2.0% in both July 2025 and September 2025, pausing its year‑long easing cycle as inflation hovered near target despite a slight uptick in September. Japanese equities extended their gains through the third quarter, supported by easing trade tensions, increasing investor interest in artificial intelligence (“AI”), and improved sentiment tied to anticipated political leadership changes. The Bank of Japan (“BOJ”) kept rates unchanged at 0.5%, though some policymakers signaled openness to future increases.
European equities continued to rise in the fourth quarter of 2025, even as global volatility driven by AI‑related market concerns briefly unsettled sentiment before rebound into year‑end. The ECB retained rates at 2.0% in both October 2025 and December 2025, citing better‑than‑expected eurozone growth and inflation trending close to target while maintaining a cautious, data‑dependent stance. Japan again delivered strong equity performance in the fourth quarter, supported by above‑target inflation, notable wage growth, sustained AI‑driven enthusiasm, and a weak yen that boosted export competitiveness. The BOJ held rates steady in October 2025 and raised them in December 2025 to 0.75%, reflecting growing confidence in Japan’s improving economic backdrop despite continuing global trade uncertainty.
The views expressed reflect the opinions of BlackRock as of the date of this report and are subject to change based on changes in market, economic or other conditions. These views are not intended to be a forecast of future events and are no guarantee of future results.
Fund performance
Cumulative performance: January 1, 2016 through December 31, 2025
Initial investment of $10,000
See “Average annual total returns” for additional information on fund performance.
| Average annual total returns | ||||||
| 1 Year | 5 Years | 10 Years | ||||
| 31.30 | % | 8.78 | % | 8.05 | % | |
| 24.41 | 7.62 | 7.46 | ||||
| 31.22 | 8.92 | 8.18 |
| Key Fund statistics | |
| $13,317,571,383 | |
| 702 | |
| $1,176,645 | |
| 8% |
What did the Fund invest in?
(as of December 31, 2025)
| Geographic allocation | ||
| Country/Geographic Region | Percent of Net Assets |
|
| 21.9 | % | |
| 12.7 | ||
| 10.3 | ||
| 9.5 | ||
| 7.6 | ||
| 6.9 | ||
| 4.7 | ||
| 4.5 | ||
| 3.7 | ||
| 3.3 | ||
| 14.4 | ||
| 0.5 | ||
| Ten largest holdings | ||
| Security(a) | Percent of Net Assets |
|
| 2.0 | % | |
| 1.4 | ||
| 1.4 | ||
| 1.3 | ||
| 1.3 | ||
| 1.3 | ||
| 1.2 | ||
| 1.0 | ||
| 1.0 | ||
| 1.0 | ||
| Excludes short-term securities. |
| Ten largest countries/geographic regions are presented. Additional countries/geographic regions are found in Other. |
| Ten largest holdings | ||
| Security(a) | Percent of Net Assets |
|
| 2.0 | % | |
| 1.4 | ||
| 1.4 | ||
| 1.3 | ||
| 1.3 | ||
| 1.3 | ||
| 1.2 | ||
| 1.0 | ||
| 1.0 | ||
| 1.0 | ||
What were the Fund costs for the last year ?
(based on a hypothetical $10,000 investment)
| Class name | Costs of a $10,000 investment |
Costs paid as a percentage of a $10,000 investment |
| $39 | 0.34% |
How did the Fund perform last year ?
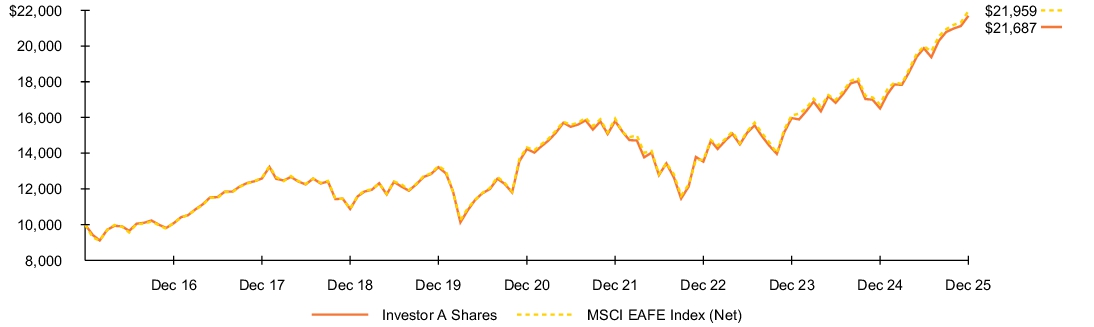
- For the reporting period ended December 31, 2025, the Fund’s Investor A Shares returned 31.39%.
- For the same period, the Fund’s benchmark, the MSCI EAFE Index (Net) returned 31.22%.
In 2025, European equities started the year in positive territory despite rising United States (“U.S.”) tariff pressures. The European Central Bank (“ECB”) cut rates by 25 basis points in both January 2025 and March 2025 to mitigate recession risks, with President Lagarde noting that euro area growth would likely remain weak amid persistent inflationary pressures. European Union finance ministers emphasized unity and deeper market integration to offset tariff‑related disruptions. In Japan, equities were volatile throughout the first quarter, and the Nikkei 225 Index ended the period in negative territory as investors grew cautious about the new U.S. administration’s tougher tariff stance and its implications for corporate earnings and broader economic conditions.
European equities continued to advance in the second quarter of 2025, supported by resilient investor sentiment despite slower economic momentum and persistent global trade tensions. The ECB held rates steady following the earlier cuts and reiterated its commitment to supporting growth as inflation remained elevated. Policymakers also highlighted the importance of fiscal discipline and reinforced the need for European Union cohesion. Japan experienced a strong rebound during the second quarter, with the Nikkei 225 Index closing near all‑time highs on June 30, 2025, driven by new stimulus measures and a more stable Japanese Yen, although uncertainties around export demand and supply chain pressures continued to weigh on corporate outlooks.
Europe remained resilient during the third quarter of 2025, supported by firm domestic demand and a healthy labor market. The ECB maintained rates at 2.0% in both July 2025 and September 2025, pausing its year‑long easing cycle as inflation hovered near target despite a slight uptick in September. Japanese equities extended their gains through the third quarter, supported by easing trade tensions, increasing investor interest in artificial intelligence (“AI”), and improved sentiment tied to anticipated political leadership changes. The Bank of Japan (“BOJ”) kept rates unchanged at 0.5%, though some policymakers signaled openness to future increases.
European equities continued to rise in the fourth quarter of 2025, even as global volatility driven by AI‑related market concerns briefly unsettled sentiment before rebound into year‑end. The ECB retained rates at 2.0% in both October 2025 and December 2025, citing better‑than‑expected eurozone growth and inflation trending close to target while maintaining a cautious, data‑dependent stance. Japan again delivered strong equity performance in the fourth quarter, supported by above‑target inflation, notable wage growth, sustained AI‑driven enthusiasm, and a weak yen that boosted export competitiveness. The BOJ held rates steady in October 2025 and raised them in December 2025 to 0.75%, reflecting growing confidence in Japan’s improving economic backdrop despite continuing global trade uncertainty.
The views expressed reflect the opinions of BlackRock as of the date of this report and are subject to change based on changes in market, economic or other conditions. These views are not intended to be a forecast of future events and are no guarantee of future results.
Fund performance
Cumulative performance: January 1, 2016 through December 31, 2025
Initial investment of $10,000
See “Average annual total returns” for additional information on fund performance.
| Average annual total returns | ||||||
| 1 Year | 5 Years | 10 Years | ||||
| 31.39 | % | 8.79 | % | 8.05 | % | |
| 31.22 | 8.92 | 8.18 |
| Key Fund statistics | |
| $13,317,571,383 | |
| 702 | |
| $1,176,645 | |
| 8% |
What did the Fund invest in?
(as of December 31, 2025)
| Geographic allocation | ||
| Country/Geographic Region | Percent of Net Assets |
|
| 21.9 | % | |
| 12.7 | ||
| 10.3 | ||
| 9.5 | ||
| 7.6 | ||
| 6.9 | ||
| 4.7 | ||
| 4.5 | ||
| 3.7 | ||
| 3.3 | ||
| 14.4 | ||
| 0.5 | ||
| Ten largest holdings | ||
| Security(a) | Percent of Net Assets |
|
| 2.0 | % | |
| 1.4 | ||
| 1.4 | ||
| 1.3 | ||
| 1.3 | ||
| 1.3 | ||
| 1.2 | ||
| 1.0 | ||
| 1.0 | ||
| 1.0 | ||
| Excludes short-term securities. |
| Ten largest countries/geographic regions are presented. Additional countries/geographic regions are found in Other. |
| Ten largest holdings | ||
| Security(a) | Percent of Net Assets |
|
| 2.0 | % | |
| 1.4 | ||
| 1.4 | ||
| 1.3 | ||
| 1.3 | ||
| 1.3 | ||
| 1.2 | ||
| 1.0 | ||
| 1.0 | ||
| 1.0 | ||
What were the Fund costs for the last year ?
(based on a hypothetical $10,000 investment)
| Class name | Costs of a $10,000 investment |
Costs paid as a percentage of a $10,000 investment |
| $10 | 0.09% |
How did the Fund perform last year ?
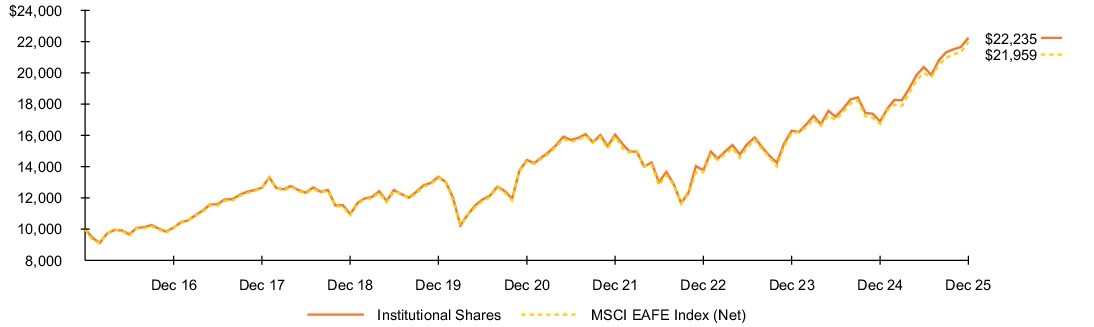
- For the reporting period ended December 31, 2025, the Fund’s Institutional Shares returned 31.64%.
- For the same period, the Fund’s benchmark, the MSCI EAFE Index (Net) returned 31.22%.
In 2025, European equities started the year in positive territory despite rising United States (“U.S.”) tariff pressures. The European Central Bank (“ECB”) cut rates by 25 basis points in both January 2025 and March 2025 to mitigate recession risks, with President Lagarde noting that euro area growth would likely remain weak amid persistent inflationary pressures. European Union finance ministers emphasized unity and deeper market integration to offset tariff‑related disruptions. In Japan, equities were volatile throughout the first quarter, and the Nikkei 225 Index ended the period in negative territory as investors grew cautious about the new U.S. administration’s tougher tariff stance and its implications for corporate earnings and broader economic conditions.
European equities continued to advance in the second quarter of 2025, supported by resilient investor sentiment despite slower economic momentum and persistent global trade tensions. The ECB held rates steady following the earlier cuts and reiterated its commitment to supporting growth as inflation remained elevated. Policymakers also highlighted the importance of fiscal discipline and reinforced the need for European Union cohesion. Japan experienced a strong rebound during the second quarter, with the Nikkei 225 Index closing near all‑time highs on June 30, 2025, driven by new stimulus measures and a more stable Japanese Yen, although uncertainties around export demand and supply chain pressures continued to weigh on corporate outlooks.
Europe remained resilient during the third quarter of 2025, supported by firm domestic demand and a healthy labor market. The ECB maintained rates at 2.0% in both July 2025 and September 2025, pausing its year‑long easing cycle as inflation hovered near target despite a slight uptick in September. Japanese equities extended their gains through the third quarter, supported by easing trade tensions, increasing investor interest in artificial intelligence (“AI”), and improved sentiment tied to anticipated political leadership changes. The Bank of Japan (“BOJ”) kept rates unchanged at 0.5%, though some policymakers signaled openness to future increases.
European equities continued to rise in the fourth quarter of 2025, even as global volatility driven by AI‑related market concerns briefly unsettled sentiment before rebound into year‑end. The ECB retained rates at 2.0% in both October 2025 and December 2025, citing better‑than‑expected eurozone growth and inflation trending close to target while maintaining a cautious, data‑dependent stance. Japan again delivered strong equity performance in the fourth quarter, supported by above‑target inflation, notable wage growth, sustained AI‑driven enthusiasm, and a weak yen that boosted export competitiveness. The BOJ held rates steady in October 2025 and raised them in December 2025 to 0.75%, reflecting growing confidence in Japan’s improving economic backdrop despite continuing global trade uncertainty.
The views expressed reflect the opinions of BlackRock as of the date of this report and are subject to change based on changes in market, economic or other conditions. These views are not intended to be a forecast of future events and are no guarantee of future results.
Fund performance
Cumulative performance: January 1, 2016 through December 31, 2025
Initial investment of $10,000
See “Average annual total returns” for additional information on fund performance.
| Average annual total returns | ||||||
| 1 Year | 5 Years | 10 Years | ||||
| 31.64 | % | 9.05 | % | 8.32 | % | |
| 31.22 | 8.92 | 8.18 |
| Key Fund statistics | |
| $13,317,571,383 | |
| 702 | |
| $1,176,645 | |
| 8% |
What did the Fund invest in?
(as of December 31, 2025)
| Geographic allocation | ||
| Country/Geographic Region | Percent of Net Assets |
|
| 21.9 | % | |
| 12.7 | ||
| 10.3 | ||
| 9.5 | ||
| 7.6 | ||
| 6.9 | ||
| 4.7 | ||
| 4.5 | ||
| 3.7 | ||
| 3.3 | ||
| 14.4 | ||
| 0.5 | ||
| Ten largest holdings | ||
| Security(a) | Percent of Net Assets |
|
| 2.0 | % | |
| 1.4 | ||
| 1.4 | ||
| 1.3 | ||
| 1.3 | ||
| 1.3 | ||
| 1.2 | ||
| 1.0 | ||
| 1.0 | ||
| 1.0 | ||
| Excludes short-term securities. |
| Ten largest countries/geographic regions are presented. Additional countries/geographic regions are found in Other. |
| Ten largest holdings | ||
| Security(a) | Percent of Net Assets |
|
| 2.0 | % | |
| 1.4 | ||
| 1.4 | ||
| 1.3 | ||
| 1.3 | ||
| 1.3 | ||
| 1.2 | ||
| 1.0 | ||
| 1.0 | ||
| 1.0 | ||
What were the Fund costs for the last year ?
(based on a hypothetical $10,000 investment)
| Class name | Costs of a $10,000 investment |
Costs paid as a percentage of a $10,000 investment |
| $13(a) | 0.12%(a) |
| Because the Fund invests all of its assets in the Series, the expense example reflects the net expenses of both the Fund and the Series. |
How did the Fund perform last year ?
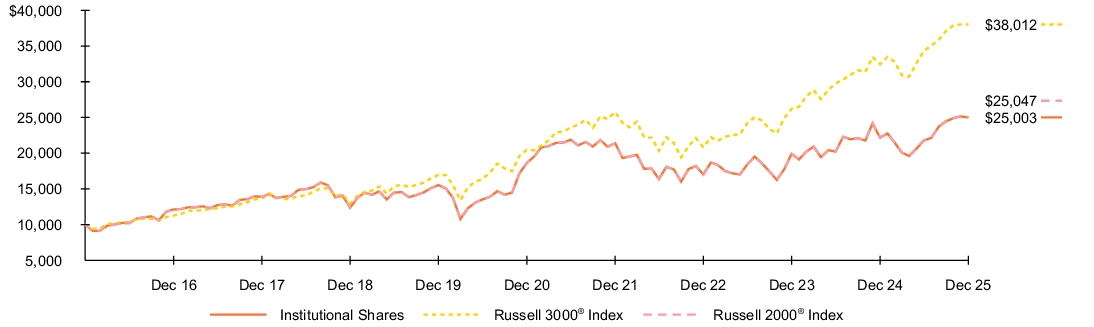
- For the reporting period ended December 31, 2025, the Fund’s Institutional Shares returned 12.78%.
- For the same period, the Fund’s benchmark, the Russell 3000® Index returned 17.15% and the Russell 2000® Index returned 12.81%.
Domestic United States (“U.S.”) equities ended the first quarter in negative territory as the U.S. administration introduced broad shifts in global trade policy, including reciprocal tariffs that elevated economic uncertainty and pushed U.S. equity markets briefly into correction territory. Markets remained highly sensitive to tariff announcements expected in April 2025. The Federal Open Market Committee (“FOMC”) held interest rates at 4.25%–4.50% in January and reaffirmed expectations for two rate cuts in 2025, though policymakers maintained a firmly data‑dependent stance given persistent inflation and a still‑resilient labor market.
U.S. equities rebounded in the second quarter and finished in positive territory as volatility eased following an early‑April 2025 spike that drove the Chicago Board Options Exchange Volatility Index (“VIX”) to multi‑year highs. Sentiment improved after the U.S. administration announced a 90‑day pause on most proposed tariffs, temporarily alleviating trade pressures ahead of the July 2025 deadline. On April 9th, just after significant market volatility and rising economic concerns, President Trump and the White House suspended additional tariffs above a 10% base rate for most countries, with the pause set to expire in early July.
The FOMC kept rates unchanged at 4.25%–4.50% in both May and June, noting cautious progress toward the 2% inflation target. Strong corporate earnings and continued enthusiasm around artificial intelligence (“AI”) supported equity gains even as reciprocal tariffs on more than 60 countries, while additional trade deals were being agreed on, China tariffs were paused to allow for negotiations to continue. This added uncertainty to longer‑term economic forecasts.
U.S. equities continued to advance through the third quarter, supported by solid earnings momentum and receding market volatility. The FOMC maintained its data‑driven approach, holding rates steady in July 2025 and delivering the first rate cut of the year in September, lowering the target range to 4.00%–4.25%. The committee cited slowing job growth and a meaningful decline in hiring as key drivers of the “risk‑management” cut, while tariff‑related inflation pressures remained a central consideration for future policy decisions. Despite mixed macroeconomic signals, investor sentiment remained broadly constructive.
Equity markets posted modest gains in the fourth quarter amid elevated volatility driven by concerns about an emerging AI bubble. Fears escalated throughout the quarter with investors worrying about lofty valuations and heavy capital expenditures, weighing on sentiment before stabilizing on signs of real revenue growth. The longest U.S. government shutdown in history, lasting 43 days, had a muted impact on markets, while renewed tariff negotiations with China in October 2025 added another layer of uncertainty. Labor conditions weakened as unemployment rose to 4.6% in November and inflation remained above the Federal Reserve’s 2% target, prompting the FOMC to cut rates by 25 bps in both October and December, ending the year with a 3.50%–3.75% target range and a continued commitment to data dependent policymaking heading into 2026.
The views expressed reflect the opinions of BlackRock as of the date of this report and are subject to change based on changes in market, economic or other conditions. These views are not intended to be a forecast of future events and are no guarantee of future results.
Fund performance
Cumulative performance: January 1, 2016 through December 31, 2025
Initial investment of $10,000
See “Average annual total returns” for additional information on fund performance.
| Average annual total returns | ||||||
| 1 Year | 5 Years | 10 Years | ||||
| 12.78 | % | 6.05 | % | 9.60 | % | |
| 17.15 | 13.15 | 14.29 | ||||
| 12.81 | 6.09 | 9.62 |
| Key Fund statistics | |
| $3,182,739,573 | |
| 1 | |
| $268,174 | |
| 21% |
What were the Fund costs for the last year ?
(based on a hypothetical $10,000 investment)
| Class name | Costs of a $10,000 investment |
Costs paid as a percentage of a $10,000 investment |
| $39(a) | 0.37%(a) |
| Because the Fund invests all of its assets in the Series, the expense example reflects the net expenses of both the Fund and the Series. |
How did the Fund perform last year ?
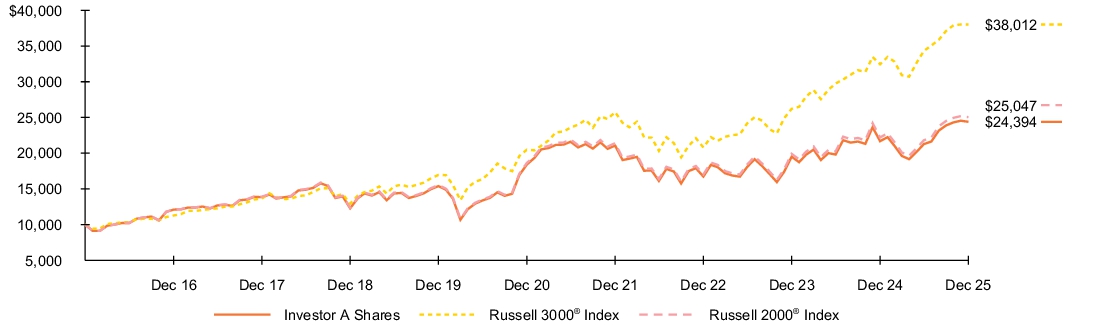
- For the reporting period ended December 31, 2025, the Fund’s Investor A Shares returned 12.50%.
- For the same period, the Fund’s benchmark, the Russell 3000® Index returned 17.15% and the Russell 2000® Index returned 12.81%.
Domestic United States (“U.S.”) equities ended the first quarter in negative territory as the U.S. administration introduced broad shifts in global trade policy, including reciprocal tariffs that elevated economic uncertainty and pushed U.S. equity markets briefly into correction territory. Markets remained highly sensitive to tariff announcements expected in April 2025. The Federal Open Market Committee (“FOMC”) held interest rates at 4.25%–4.50% in January and reaffirmed expectations for two rate cuts in 2025, though policymakers maintained a firmly data‑dependent stance given persistent inflation and a still‑resilient labor market.
U.S. equities rebounded in the second quarter and finished in positive territory as volatility eased following an early‑April 2025 spike that drove the Chicago Board Options Exchange Volatility Index (“VIX”) to multi‑year highs. Sentiment improved after the U.S. administration announced a 90‑day pause on most proposed tariffs, temporarily alleviating trade pressures ahead of the July 2025 deadline. On April 9th, just after significant market volatility and rising economic concerns, President Trump and the White House suspended additional tariffs above a 10% base rate for most countries, with the pause set to expire in early July.
The FOMC kept rates unchanged at 4.25%–4.50% in both May and June, noting cautious progress toward the 2% inflation target. Strong corporate earnings and continued enthusiasm around artificial intelligence (“AI”) supported equity gains even as reciprocal tariffs on more than 60 countries, while additional trade deals were being agreed on, China tariffs were paused to allow for negotiations to continue. This added uncertainty to longer‑term economic forecasts.
U.S. equities continued to advance through the third quarter, supported by solid earnings momentum and receding market volatility. The FOMC maintained its data‑driven approach, holding rates steady in July 2025 and delivering the first rate cut of the year in September, lowering the target range to 4.00%–4.25%. The committee cited slowing job growth and a meaningful decline in hiring as key drivers of the “risk‑management” cut, while tariff‑related inflation pressures remained a central consideration for future policy decisions. Despite mixed macroeconomic signals, investor sentiment remained broadly constructive.
Equity markets posted modest gains in the fourth quarter amid elevated volatility driven by concerns about an emerging AI bubble. Fears escalated throughout the quarter with investors worrying about lofty valuations and heavy capital expenditures, weighing on sentiment before stabilizing on signs of real revenue growth. The longest U.S. government shutdown in history, lasting 43 days, had a muted impact on markets, while renewed tariff negotiations with China in October 2025 added another layer of uncertainty. Labor conditions weakened as unemployment rose to 4.6% in November and inflation remained above the Federal Reserve’s 2% target, prompting the FOMC to cut rates by 25 bps in both October and December, ending the year with a 3.50%–3.75% target range and a continued commitment to data dependent policymaking heading into 2026.
The views expressed reflect the opinions of BlackRock as of the date of this report and are subject to change based on changes in market, economic or other conditions. These views are not intended to be a forecast of future events and are no guarantee of future results.
Fund performance
Cumulative performance: January 1, 2016 through December 31, 2025
Initial investment of $10,000
See “Average annual total returns” for additional information on fund performance.
| Average annual total returns | ||||||
| 1 Year | 5 Years | 10 Years | ||||
| 12.50 | % | 5.78 | % | 9.33 | % | |
| 17.15 | 13.15 | 14.29 | ||||
| 12.81 | 6.09 | 9.62 |
| Key Fund statistics | |
| $3,182,739,573 | |
| 1 | |
| $268,174 | |
| 21% |
What were the Fund costs for the last year ?
(based on a hypothetical $10,000 investment)
| Class name | Costs of a $10,000 investment |
Costs paid as a percentage of a $10,000 investment |
| $39(a) | 0.37%(a) |
| Because the Fund invests all of its assets in the Series, the expense example reflects the net expenses of both the Fund and the Series. |
How did the Fund perform last year ?
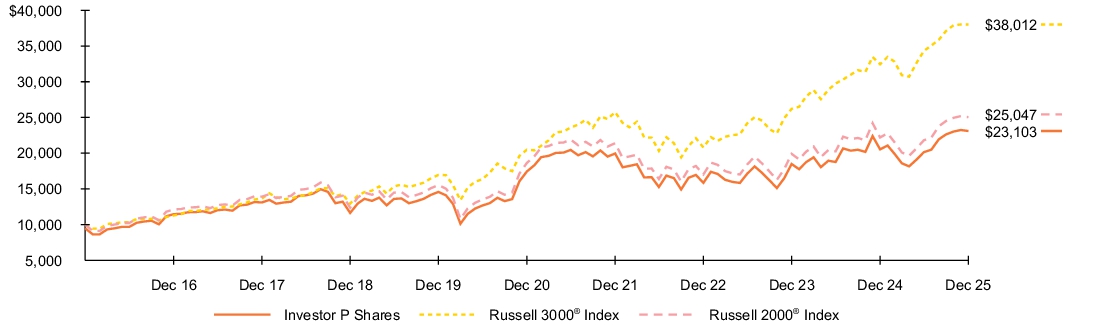
- For the reporting period ended December 31, 2025, the Fund’s Investor P Shares returned 12.47%.
- For the same period, the Fund’s benchmark, the Russell 3000® Index returned 17.15% and the Russell 2000® Index returned 12.81%.
Domestic United States (“U.S.”) equities ended the first quarter in negative territory as the U.S. administration introduced broad shifts in global trade policy, including reciprocal tariffs that elevated economic uncertainty and pushed U.S. equity markets briefly into correction territory. Markets remained highly sensitive to tariff announcements expected in April 2025. The Federal Open Market Committee (“FOMC”) held interest rates at 4.25%–4.50% in January and reaffirmed expectations for two rate cuts in 2025, though policymakers maintained a firmly data‑dependent stance given persistent inflation and a still‑resilient labor market.
U.S. equities rebounded in the second quarter and finished in positive territory as volatility eased following an early‑April 2025 spike that drove the Chicago Board Options Exchange Volatility Index (“VIX”) to multi‑year highs. Sentiment improved after the U.S. administration announced a 90‑day pause on most proposed tariffs, temporarily alleviating trade pressures ahead of the July 2025 deadline. On April 9th, just after significant market volatility and rising economic concerns, President Trump and the White House suspended additional tariffs above a 10% base rate for most countries, with the pause set to expire in early July.
The FOMC kept rates unchanged at 4.25%–4.50% in both May and June, noting cautious progress toward the 2% inflation target. Strong corporate earnings and continued enthusiasm around artificial intelligence (“AI”) supported equity gains even as reciprocal tariffs on more than 60 countries, while additional trade deals were being agreed on, China tariffs were paused to allow for negotiations to continue. This added uncertainty to longer‑term economic forecasts.
U.S. equities continued to advance through the third quarter, supported by solid earnings momentum and receding market volatility. The FOMC maintained its data‑driven approach, holding rates steady in July 2025 and delivering the first rate cut of the year in September, lowering the target range to 4.00%–4.25%. The committee cited slowing job growth and a meaningful decline in hiring as key drivers of the “risk‑management” cut, while tariff‑related inflation pressures remained a central consideration for future policy decisions. Despite mixed macroeconomic signals, investor sentiment remained broadly constructive.
Equity markets posted modest gains in the fourth quarter amid elevated volatility driven by concerns about an emerging AI bubble. Fears escalated throughout the quarter with investors worrying about lofty valuations and heavy capital expenditures, weighing on sentiment before stabilizing on signs of real revenue growth. The longest U.S. government shutdown in history, lasting 43 days, had a muted impact on markets, while renewed tariff negotiations with China in October 2025 added another layer of uncertainty. Labor conditions weakened as unemployment rose to 4.6% in November and inflation remained above the Federal Reserve’s 2% target, prompting the FOMC to cut rates by 25 bps in both October and December, ending the year with a 3.50%–3.75% target range and a continued commitment to data dependent policymaking heading into 2026.
The views expressed reflect the opinions of BlackRock as of the date of this report and are subject to change based on changes in market, economic or other conditions. These views are not intended to be a forecast of future events and are no guarantee of future results.
Fund performance
Cumulative performance: January 1, 2016 through December 31, 2025
Initial investment of $10,000
See “Average annual total returns” for additional information on fund performance.
| Average annual total returns | ||||||
| 1 Year | 5 Years | 10 Years | ||||
| 12.47 | % | 5.78 | % | 9.32 | % | |
| 6.56 | 4.65 | 8.73 | ||||
| 17.15 | 13.15 | 14.29 | ||||
| 12.81 | 6.09 | 9.62 |
| Key Fund statistics | |
| $3,182,739,573 | |
| 1 | |
| $268,174 | |
| 21% |
What were the Fund costs for the last year ?
(based on a hypothetical $10,000 investment)
| Class name | Costs of a $10,000 investment |
Costs paid as a percentage of a $10,000 investment |
| $7(a) | 0.07%(a) |
| Because the Fund invests all of its assets in the Series, the expense example reflects the net expenses of both the Fund and the Series. |
How did the Fund perform last year ?
- For the reporting period ended December 31, 2025, the Fund’s Class K Shares returned 12.83%.
- For the same period, the Fund’s benchmark, the Russell 3000® Index returned 17.15% and the Russell 2000® Index returned 12.81%.
Domestic United States (“U.S.”) equities ended the first quarter in negative territory as the U.S. administration introduced broad shifts in global trade policy, including reciprocal tariffs that elevated economic uncertainty and pushed U.S. equity markets briefly into correction territory. Markets remained highly sensitive to tariff announcements expected in April 2025. The Federal Open Market Committee (“FOMC”) held interest rates at 4.25%–4.50% in January and reaffirmed expectations for two rate cuts in 2025, though policymakers maintained a firmly data‑dependent stance given persistent inflation and a still‑resilient labor market.
U.S. equities rebounded in the second quarter and finished in positive territory as volatility eased following an early‑April 2025 spike that drove the Chicago Board Options Exchange Volatility Index (“VIX”) to multi‑year highs. Sentiment improved after the U.S. administration announced a 90‑day pause on most proposed tariffs, temporarily alleviating trade pressures ahead of the July 2025 deadline. On April 9th, just after significant market volatility and rising economic concerns, President Trump and the White House suspended additional tariffs above a 10% base rate for most countries, with the pause set to expire in early July.
The FOMC kept rates unchanged at 4.25%–4.50% in both May and June, noting cautious progress toward the 2% inflation target. Strong corporate earnings and continued enthusiasm around artificial intelligence (“AI”) supported equity gains even as reciprocal tariffs on more than 60 countries, while additional trade deals were being agreed on, China tariffs were paused to allow for negotiations to continue. This added uncertainty to longer‑term economic forecasts.
U.S. equities continued to advance through the third quarter, supported by solid earnings momentum and receding market volatility. The FOMC maintained its data‑driven approach, holding rates steady in July 2025 and delivering the first rate cut of the year in September, lowering the target range to 4.00%–4.25%. The committee cited slowing job growth and a meaningful decline in hiring as key drivers of the “risk‑management” cut, while tariff‑related inflation pressures remained a central consideration for future policy decisions. Despite mixed macroeconomic signals, investor sentiment remained broadly constructive.
Equity markets posted modest gains in the fourth quarter amid elevated volatility driven by concerns about an emerging AI bubble. Fears escalated throughout the quarter with investors worrying about lofty valuations and heavy capital expenditures, weighing on sentiment before stabilizing on signs of real revenue growth. The longest U.S. government shutdown in history, lasting 43 days, had a muted impact on markets, while renewed tariff negotiations with China in October 2025 added another layer of uncertainty. Labor conditions weakened as unemployment rose to 4.6% in November and inflation remained above the Federal Reserve’s 2% target, prompting the FOMC to cut rates by 25 bps in both October and December, ending the year with a 3.50%–3.75% target range and a continued commitment to data dependent policymaking heading into 2026.
The views expressed reflect the opinions of BlackRock as of the date of this report and are subject to change based on changes in market, economic or other conditions. These views are not intended to be a forecast of future events and are no guarantee of future results.
Fund performance
Cumulative performance: January 1, 2016 through December 31, 2025
Initial investment of $10,000
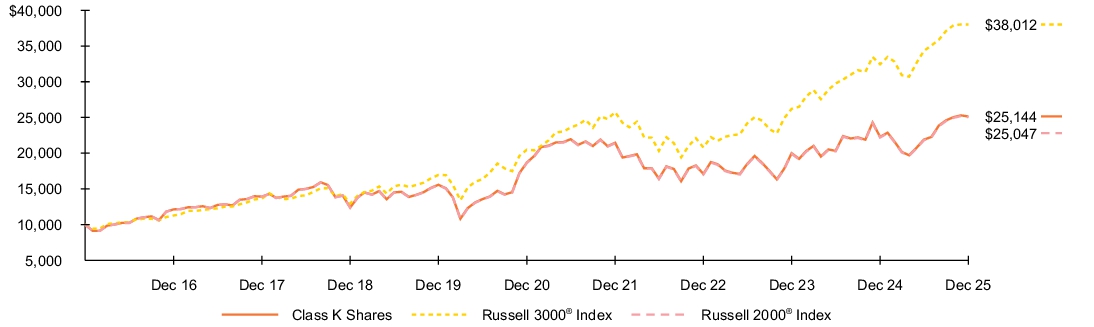
See “Average annual total returns” for additional information on fund performance.
| Average annual total returns | ||||||
| 1 Year | 5 Years | 10 Years | ||||
| 12.83 | % | 6.11 | % | 9.66 | % | |
| 17.15 | 13.15 | 14.29 | ||||
| 12.81 | 6.09 | 9.62 |
| Key Fund statistics | |
| $3,182,739,573 | |
| 1 | |
| $268,174 | |
| 21% |
| [1] | Because the Fund invests all of its assets in the Series, the expense example reflects the net expenses of both the Fund and the Series. |
| [2] | Because the Fund invests all of its assets in the Series, the expense example reflects the net expenses of both the Fund and the Series. |
| [3] | Because the Fund invests all of its assets in the Series, the expense example reflects the net expenses of both the Fund and the Series. |
| [4] | Because the Fund invests all of its assets in the Series, the expense example reflects the net expenses of both the Fund and the Series. |