Shareholder Report
Dec. 31, 2025
USD ($)
Holding
This report describes changes to the Fund that occurred during the reporting period.
What were the Fund costs for the last year?
(Based on a hypothetical $10,000 investment)
| Costs of a $10,000 investment |
Costs paid as a percentage of a $10,000 investment | |||
| Midas Discovery |
$687 | 3.47% | ||
How did the Fund perform during the period? What affected the Fund’s performance?
PRECIOUS METALS AND FINANCIAL MARKETS:
During the year ended December 31, 2025, the gold price averaged about $3,439 per ounce (all metal prices are based on the London PM Fix) as compared to $2,388 and $1,943 in 2024 and 2023, respectively. With a low of $2,633 and a high of $4,481, the gold price ended up about 63% over the course of 2025. Similarly, the price of silver rose 154% over 2025. These market conditions have positively impacted the Fund because the Fund was invested in companies whose revenue is derived from the mining and sale of gold, silver, and certain base metals.
INVESTMENT STRATEGY AND RETURNS:
The Fund seeks primarily capital appreciation and protection against inflation and, secondarily, current income. During the year ended December 31, 2025, the Fund’s total return was 195.76% and the S&P 500 Index total return was 17.88%. The Fund’s net investment loss, net realized gain on investments, and net increase in unrealized appreciation on investments were, respectively, $492,074, $2,854,311, and $22,149,302, which contributed materially to the Fund’s total return. The Fund’s top performance contributors were Lundin Gold, a Canadian gold miner with operations in Ecuador, and DPM Metals, Inc., a Canadian-based precious metals producer with operations in Europe. The Fund’s top performance detractors during the same period were Victoria Gold Corp., a Canadian gold miner, and B2Gold Corp., a Canadian gold miner with operations in Africa and the Philippines. During this period, unrealized depreciation was recorded from holdings of, among others, B2Gold Corp., and unrealized appreciation from, among others, Agnico Eagle Mines, Ltd., a Canadian precious metals producer.
Fund Performance
The performance graph shows returns of an initial investment of $10,000 in the Fund as of December 31, 2025. The data presented represents past performance and cannot be used to predict future results.
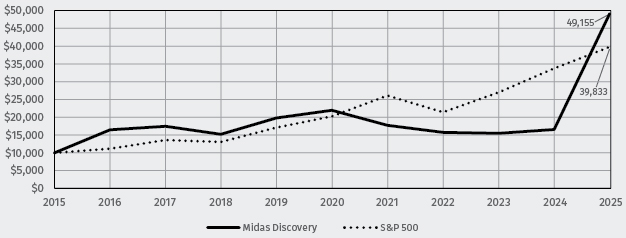
Average Annual Total Returns (for the periods ended December 31, 2025):
| 1 Year | 5 Years | 10 Years | ||||||||||
| MIDAS DISCOVERY |
195.76% | 17.47% | 17.26% | |||||||||
| S&P 500 Index Benchmark (reflects no deduction for fees, expenses, or taxes) |
17.88% | 14.42% | 14.82% | |||||||||
Key Fund Statistics (as of December 31, 2025)
| Fund’s net assets | $ | 44,059,740 | ||
| Total number of portfolio holdings | 26 | |||
| Portfolio turnover rate | 28% | |||
| Total advisory fees paid | $ | 251,429 | ||
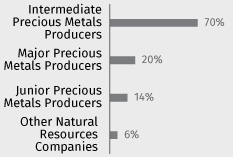
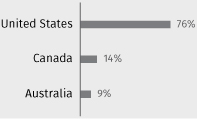
Graphical Representation of Holdings (as of December 31, 2025)
The tables below show the investment make up of the Fund, representing percentage of total net assets of the Fund.
| Top Ten Security Holdings |
|
Percent of Total Net Assets |
|
Sector Allocation |
Geographical Allocation | |||||||||||
| Agnico Eagle Mines Limited |
12 | % |
 |
 | ||||||||||||
| Lundin Gold Inc. |
9 | % | ||||||||||||||
| DPM Metals Inc. |
7 | % | ||||||||||||||
| Evolution Mining Ltd. |
6 | % | ||||||||||||||
| IAMGold Corp. |
6 | % | ||||||||||||||
| Endeavour Mining plc |
4 | % | ||||||||||||||
| Kinross Gold Corp. |
4 | % | ||||||||||||||
| OceanaGold Corp. |
4 | % | ||||||||||||||
| Royal Gold, Inc. |
4 | % | ||||||||||||||
| Torex Gold Resources Inc. |
4 | % | ||||||||||||||
| Total |
60 | % | ||||||||||||||
The tables are shown with approximate percentages of net assets, are subject to change, and may not add up to 100% due to leverage, cash or other assets, rounding, and other factors. Allocations of less than 1% in the aggregate are not shown. The above portfolio information should not be considered as a recommendation to purchase or sell a particular security and there is no assurance that any securities will remain in or out of the Fund.
| Top Ten Security Holdings |
|
Percent of Total Net Assets |
|
Sector Allocation |
Geographical Allocation | |||||||||||
| Agnico Eagle Mines Limited |
12 | % |
|
| ||||||||||||
| Lundin Gold Inc. |
9 | % | ||||||||||||||
| DPM Metals Inc. |
7 | % | ||||||||||||||
| Evolution Mining Ltd. |
6 | % | ||||||||||||||
| IAMGold Corp. |
6 | % | ||||||||||||||
| Endeavour Mining plc |
4 | % | ||||||||||||||
| Kinross Gold Corp. |
4 | % | ||||||||||||||
| OceanaGold Corp. |
4 | % | ||||||||||||||
| Royal Gold, Inc. |
4 | % | ||||||||||||||
| Torex Gold Resources Inc. |
4 | % | ||||||||||||||
| Total |
60 | % | ||||||||||||||
Material Fund Changes
This is a summary of certain changes to the Fund since January 1, 2025. For more complete information, you may review the Fund’s next prospectus, which we expect to be available by April 30, 2026 at www.MidasFunds.com or upon request at 800‑400‑6432.
Effective April 30, 2025, the Fund’s name changed from Midas Fund to Midas Discovery.
Effective April 30, 2025, the Fund’s name changed from Midas Fund to Midas Discovery.
This is a summary of certain changes to the Fund since January 1, 2025. For more complete information, you may review the Fund’s next prospectus, which we expect to be available by April 30, 2026 at www.MidasFunds.com or upon request at 800‑400‑6432.
This report describes changes to the Fund that occurred during the reporting period.
What were the Fund costs for the last year?
(Based on a hypothetical $10,000 investment)
| Costs of a $10,000 investment |
Costs paid as a percentage of a $10,000 investment | |||
| Midas Special Opportunities |
$395 | 3.44% | ||
How did the Fund perform during the period? What affected the Fund’s performance?
Over the course of 2025, U.S. equity markets reacted favorably to the Federal Reserve’s accommodative monetary policy, positive GDP growth in the second and third quarters of 2025, and moderate inflation as measured by the Consumer Price Index. Additionally, U.S. corporate earnings remained resilient, as U.S corporate profits after tax were 4.3% higher in the third quarter of 2025 compared to the third quarter 2024. In addition, the Fund benefited from, among other things, investor enthusiasm over the potential of artificial intelligence, which favorably impacted two of the Fund’s holdings, Alphabet Inc. and Lam Research Corporation.
INVESTMENT STRATEGY AND RETURNS:
The Fund seeks capital appreciation. Over fiscal year 2025, the Fund’s total return was 29.82% and the S&P 500 Index total return was 17.88%. The Fund’s net investment loss, net realized gain on investments, and net increase in unrealized appreciation on investments were, respectively, $577,506, $898,502, and $5,606,140, which contributed materially to the Fund’s total return. The Fund’s top performance contributors were Alphabet, Inc., a multinational technology company, and Lam Research Corporation, an American supplier of equipment to the semiconductor industry. The Fund’s top performance detractors were UnitedHealth Group, Inc., a health care company that provides health insurance and services, and Williams-Sonoma, Inc., a consumer retail company that sells kitchenware and home furnishings.
Fund Performance
The performance graph shows returns of an initial investment of $10,000 in the Fund as of December 31, 2025. The data presented represents past performance and cannot be used to predict future results.
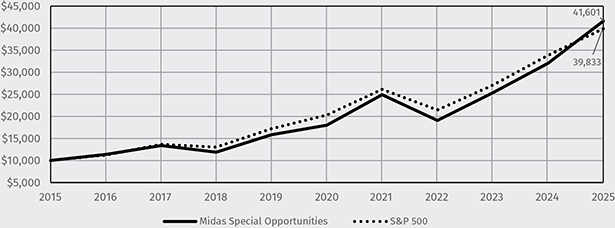
Average Annual Total Returns (for the periods ended December 31, 2025):
| 1 Year | 5 Years | 10 Years | ||||||||||
| MIDAS SPECIAL OPPORTUNITIES |
29.87% | 18.25% | 15.32% | |||||||||
| S&P 500 Index Benchmark (reflects no deduction for fees, expenses, or taxes) |
17.88% | 14.42% | 14.82% | |||||||||
Key Fund Statistics (as of December 31, 2025)
| Fund’s net assets | $ | 25,231,039 | ||
| Total number of portfolio holdings | 11 | |||
| Portfolio turnover rate | 5% | |||
| Total advisory fees paid | $ | 202,740 | ||
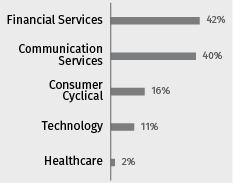
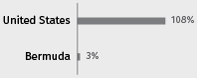
Graphical Representation of Holdings (as of December 31, 2025)
The tables below show the investment make up of the Fund, representing percentage of total net assets of the Fund.
| Top Ten Security Holdings |
|
Percent of Total Net Assets |
|
Sector Allocation |
Geographical Allocation | |||||||||||
| Alphabet Inc. Class A |
40 | % |
 |
 | ||||||||||||
| Mastercard Incorporated Class A |
23 | % | ||||||||||||||
| JPMorgan Chase & Co. |
9 | % | ||||||||||||||
| AutoZone, Inc. |
9 | % | ||||||||||||||
| Lam Research Corporation |
8 | % | ||||||||||||||
| Williams-Sonoma, Inc. |
7 | % | ||||||||||||||
| Berkshire Hathaway Inc. Class B |
6 | % | ||||||||||||||
| QUALCOMM Inc. |
3 | % | ||||||||||||||
| Essent Group Ltd. |
3 | % | ||||||||||||||
| Interactive Brokers Group, Inc. |
2 | % | ||||||||||||||
| Total |
110 | % | ||||||||||||||
The tables are shown with approximate percentages of net assets, are subject to change, and may not add up to 100% due to leverage, cash or other assets, rounding, and other factors. Allocations of less than 1% in the aggregate are not shown. The above portfolio information should not be considered as a recommendation to purchase or sell a particular security and there is no assurance that any securities will remain in or out of the Fund.
| Top Ten Security Holdings |
|
Percent of Total Net Assets |
|
Sector Allocation |
Geographical Allocation | |||||||||||
| Alphabet Inc. Class A |
40 | % |
|
| ||||||||||||
| Mastercard Incorporated Class A |
23 | % | ||||||||||||||
| JPMorgan Chase & Co. |
9 | % | ||||||||||||||
| AutoZone, Inc. |
9 | % | ||||||||||||||
| Lam Research Corporation |
8 | % | ||||||||||||||
| Williams-Sonoma, Inc. |
7 | % | ||||||||||||||
| Berkshire Hathaway Inc. Class B |
6 | % | ||||||||||||||
| QUALCOMM Inc. |
3 | % | ||||||||||||||
| Essent Group Ltd. |
3 | % | ||||||||||||||
| Interactive Brokers Group, Inc. |
2 | % | ||||||||||||||
| Total |
110 | % | ||||||||||||||
Material Fund Changes
This is a summary of certain changes to the Fund since January 1, 2025. For more complete information, you may review the Fund’s next prospectus, which we expect to be available by April 30, 2026 at www.MidasFunds.com or upon request at 800-400-6432.
Effective April 30, 2025, the Fund’s name changed from Midas Magic to Midas Special Opportunities.
Effective April 30, 2025, the Fund’s name changed from Midas Magic to Midas Special Opportunities.
This is a summary of certain changes to the Fund since January 1, 2025. For more complete information, you may review the Fund’s next prospectus, which we expect to be available by April 30, 2026 at www.MidasFunds.com or upon request at 800-400-6432.