Shareholder Report
Dec. 31, 2025
USD ($)
Holding
What were the Fund costs for the last year ?
(based on a hypothetical $10,000 investment)
| Class name | Costs of a $10,000 investment |
Costs paid as a percentage of a $10,000 investment |
| $25(a) | 0.24%(a) |
| Because the Fund invests all of its assets in the Master Portfolio, the expense example reflects the net expenses of both the Fund and the Master Portfolio. |
How did the Fund perform last year ?
- For the reporting period ended December 31, 2025, the Fund’s Class K Shares returned 6.84%.
- For the same period, the Fund’s benchmark, the Bloomberg U.S. Aggregate Bond Index returned 7.30%.
What contributed to performance?
Positive contributions to the Fund’s absolute performance for the period were led by exposure to higher yielding, credit-oriented areas of the bond market as a resilient economy supported stable credit spreads, with the exception of a brief spike in early April on tariff fears. In addition, as the period progressed and labor data softened, the market anticipated that the U.S. Federal Reserve was poised to begin cutting its benchmark overnight lending rate, leading yields lower and bond prices higher. Specifically, the Fund’s holdings of securitized assets, high yield corporate bonds and investment grade corporate bonds led contributions to return.
What detracted from performance?
The Fund’s positioning across global interest rate markets using cross-market rate swaps was the largest detractor from absolute performance for the period.
The views expressed reflect the opinions of BlackRock as of the date of this report and are subject to change based on changes in market, economic or other conditions. These views are not intended to be a forecast of future events and are no guarantee of future results.
Fund performance
Cumulative performance: January 1, 2016 through December 31, 2025
Initial investment of $10,000
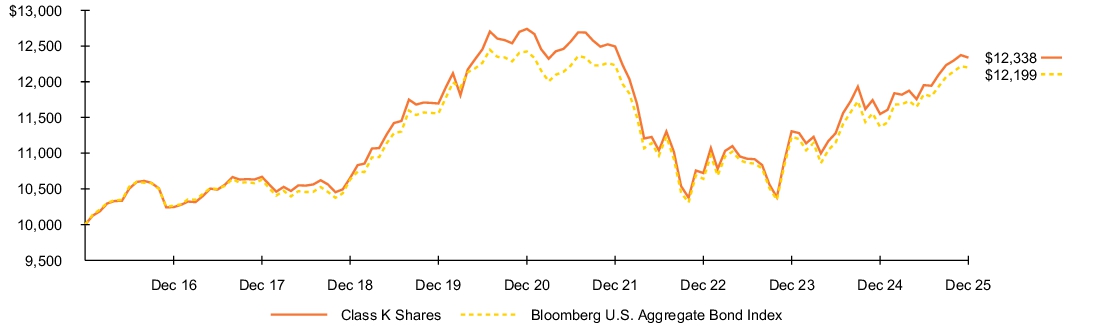
See “Average annual total returns” for additional information on fund performance.
| Average annual total returns | ||||||
| 1 Year | 5 Years | 10 Years | ||||
| 6.84 | % | (0.64 | )% | 2.12 | % | |
| 7.30 | (0.36 | ) | 2.01 |
| Key Fund statistics | |
| $722,727,638 | |
| 1 | |
| $1,700,178 | |
| 183% |
What were the Fund costs for the last year ?
(based on a hypothetical $10,000 investment)
| Class name | Costs of a $10,000 investment |
Costs paid as a percentage of a $10,000 investment |
| $133(a) | 1.29%(a) |
| Because the Fund invests all of its assets in the Master Portfolio, the expense example reflects the net expenses of both the Fund and the Master Portfolio. |
How did the Fund perform last year ?
- For the reporting period ended December 31, 2025, the Fund’s Investor C Shares returned 5.75%.
- For the same period, the Fund’s benchmark, the Bloomberg U.S. Aggregate Bond Index returned 7.30%.
What contributed to performance?
Positive contributions to the Fund’s absolute performance for the period were led by exposure to higher yielding, credit-oriented areas of the bond market as a resilient economy supported stable credit spreads, with the exception of a brief spike in early April on tariff fears. In addition, as the period progressed and labor data softened, the market anticipated that the U.S. Federal Reserve was poised to begin cutting its benchmark overnight lending rate, leading yields lower and bond prices higher. Specifically, the Fund’s holdings of securitized assets, high yield corporate bonds and investment grade corporate bonds led contributions to return.
What detracted from performance?
The Fund’s positioning across global interest rate markets using cross-market rate swaps was the largest detractor from absolute performance for the period.
The views expressed reflect the opinions of BlackRock as of the date of this report and are subject to change based on changes in market, economic or other conditions. These views are not intended to be a forecast of future events and are no guarantee of future results.
Fund performance
Cumulative performance: January 1, 2016 through December 31, 2025
Initial investment of $10,000
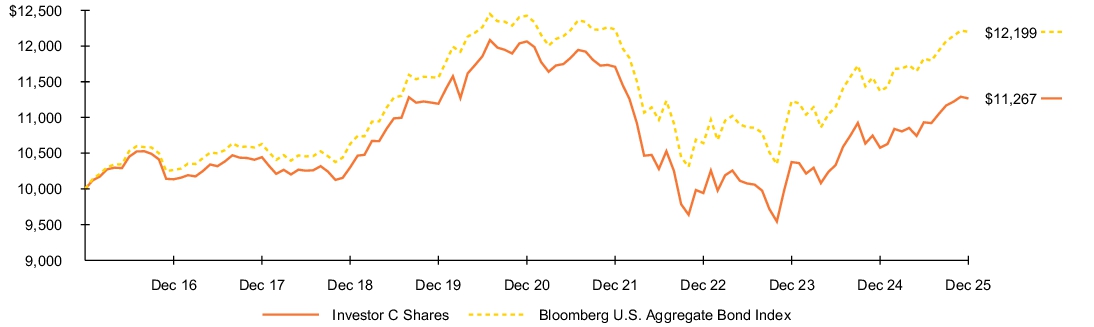
See “Average annual total returns” for additional information on fund performance.
| Average annual total returns | ||||||
| 1 Year | 5 Years | 10 Years | ||||
| 5.75 | % | (1.67 | )% | 1.20 | % | |
| 4.75 | (1.67 | ) | 1.20 | |||
| 7.30 | (0.36 | ) | 2.01 |
| Key Fund statistics | |
| $722,727,638 | |
| 1 | |
| $1,700,178 | |
| 183% |
What were the Fund costs for the last year ?
(based on a hypothetical $10,000 investment)
| Class name | Costs of a $10,000 investment |
Costs paid as a percentage of a $10,000 investment |
| $56(a) | 0.54%(a) |
| Because the Fund invests all of its assets in the Master Portfolio, the expense example reflects the net expenses of both the Fund and the Master Portfolio. |
How did the Fund perform last year ?
- For the reporting period ended December 31, 2025, the Fund’s Investor A Shares returned 6.53%.
- For the same period, the Fund’s benchmark, the Bloomberg U.S. Aggregate Bond Index returned 7.30%.
What contributed to performance?
Positive contributions to the Fund’s absolute performance for the period were led by exposure to higher yielding, credit-oriented areas of the bond market as a resilient economy supported stable credit spreads, with the exception of a brief spike in early April on tariff fears. In addition, as the period progressed and labor data softened, the market anticipated that the U.S. Federal Reserve was poised to begin cutting its benchmark overnight lending rate, leading yields lower and bond prices higher. Specifically, the Fund’s holdings of securitized assets, high yield corporate bonds and investment grade corporate bonds led contributions to return.
What detracted from performance?
The Fund’s positioning across global interest rate markets using cross-market rate swaps was the largest detractor from absolute performance for the period.
The views expressed reflect the opinions of BlackRock as of the date of this report and are subject to change based on changes in market, economic or other conditions. These views are not intended to be a forecast of future events and are no guarantee of future results.
Fund performance
Cumulative performance: January 1, 2016 through December 31, 2025
Initial investment of $10,000
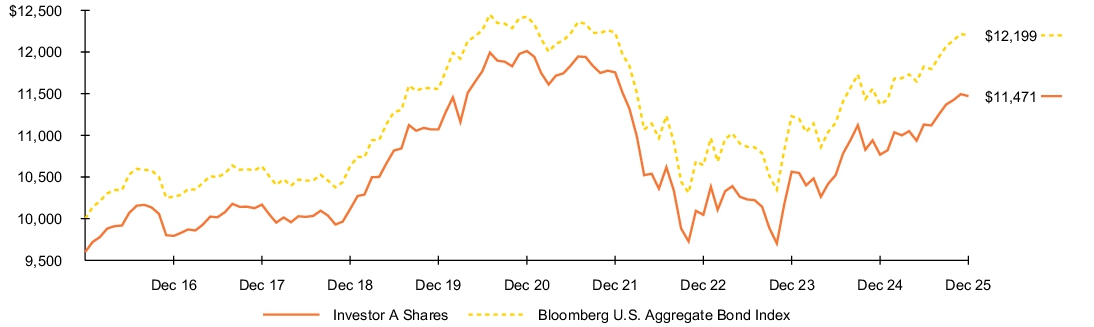
See “Average annual total returns” for additional information on fund performance.
| Average annual total returns | ||||||
| 1 Year | 5 Years | 10 Years | ||||
| 6.53 | % | (0.92 | )% | 1.80 | % | |
| 2.27 | (1.72 | ) | 1.38 | |||
| 7.30 | (0.36 | ) | 2.01 |
| Key Fund statistics | |
| $722,727,638 | |
| 1 | |
| $1,700,178 | |
| 183% |
What were the Fund costs for the last year ?
(based on a hypothetical $10,000 investment)
| Class name | Costs of a $10,000 investment |
Costs paid as a percentage of a $10,000 investment |
| $30(a) | 0.29%(a) |
| Because the Fund invests all of its assets in the Master Portfolio, the expense example reflects the net expenses of both the Fund and the Master Portfolio. |
How did the Fund perform last year ?
- For the reporting period ended December 31, 2025, the Fund’s Institutional Shares returned 6.79%.
- For the same period, the Fund’s benchmark, the Bloomberg U.S. Aggregate Bond Index returned 7.30%.
What contributed to performance?
Positive contributions to the Fund’s absolute performance for the period were led by exposure to higher yielding, credit-oriented areas of the bond market as a resilient economy supported stable credit spreads, with the exception of a brief spike in early April on tariff fears. In addition, as the period progressed and labor data softened, the market anticipated that the U.S. Federal Reserve was poised to begin cutting its benchmark overnight lending rate, leading yields lower and bond prices higher. Specifically, the Fund’s holdings of securitized assets, high yield corporate bonds and investment grade corporate bonds led contributions to return.
What detracted from performance?
The Fund’s positioning across global interest rate markets using cross-market rate swaps was the largest detractor from absolute performance for the period.
The views expressed reflect the opinions of BlackRock as of the date of this report and are subject to change based on changes in market, economic or other conditions. These views are not intended to be a forecast of future events and are no guarantee of future results.
Fund performance
Cumulative performance: January 1, 2016 through December 31, 2025
Initial investment of $10,000
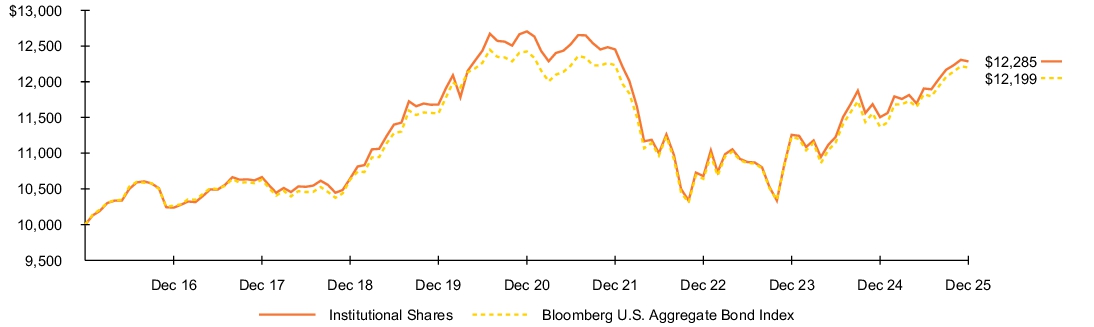
See “Average annual total returns” for additional information on fund performance.
| Average annual total returns | ||||||
| 1 Year | 5 Years | 10 Years | ||||
| 6.79 | % | (0.67 | )% | 2.08 | % | |
| 7.30 | (0.36 | ) | 2.01 |
| Key Fund statistics | |
| $722,727,638 | |
| 1 | |
| $1,700,178 | |
| 183% |
| [1] | Because the Fund invests all of its assets in the Master Portfolio, the expense example reflects the net expenses of both the Fund and the Master Portfolio. |
| [2] | Because the Fund invests all of its assets in the Master Portfolio, the expense example reflects the net expenses of both the Fund and the Master Portfolio. |
| [3] | Because the Fund invests all of its assets in the Master Portfolio, the expense example reflects the net expenses of both the Fund and the Master Portfolio. |
| [4] | Because the Fund invests all of its assets in the Master Portfolio, the expense example reflects the net expenses of both the Fund and the Master Portfolio. |