Shareholder Report
Dec. 31, 2025
USD ($)
Holding
What were the Fund costs for the last year?
(Based on a hypothetical $10,000 investment)
| Fund (Class) | Costs of a $10,000 investment | Costs paid as a percentage of a $10,000 investment |
| Virtus AlphaSimplex Global Alternatives Fund Class R6 / GAFNX |
$123 | 1.19% |
What factors impacted Fund performance over the reporting period?
The Fund is a multi-strategy alternative investment vehicle that seeks to provide capital appreciation consistent with the risk/return characteristics of a diversified portfolio of hedge funds. The secondary goal of the Fund is to achieve these returns with less volatility than major equity indexes. The Fund’s hedge fund replication models use advanced statistical techniques to identify and emulate the liquid market exposures of hedge funds and other liquid alternative strategies. The Fund’s alternative risk premia models use small allocations to historically non-correlated strategies designed to provide diversifying return streams. Over the course of the year, gains came primarily from the Fund’s hedge fund replication models, while the Fund’s alternative risk premia models detracted from performance. The Fund was able to capitalize on the broad market exposures of the hedge fund industry, particularly to equities and commodities, as well as on certain opportunistic trading strategies. The following table outlines key factors that materially affected the Fund’s performance during the reporting period.
| FACTOR | IMPACT | SUMMARY |
| Equities |
Positive |
Equities drove performance over the year as these markets made new highs, with gains coming from both the hedge fund replication models and the alternative risk premia models. |
| Fixed income |
Negative |
Fixed income detracted from performance as bond markets struggled to account for central bank policy. |
| Currencies |
Negative |
Currency losses came primarily from several of the alternative risk premia models as the U.S. dollar weakened. Gains within other models could not make up for these losses. |
| Commodities | Positive | Commodity gains came primarily from the hedge fund replication models, particularly due to the surge in gold prices, while the alternative risk premia models detracted from performance. |
The preceding information is the opinion of portfolio management only through the end of the period stated. Any such opinions are subject to change at any time based upon market or other conditions and should not be relied upon as investment advice. Performance figures assume reinvestment of distributions and exclude the effect of sales charges. Performance data quoted represents past results. Past performance is no guarantee of future results, and there is no guarantee that market forecasts will be realized.
How has the Fund historically performed?
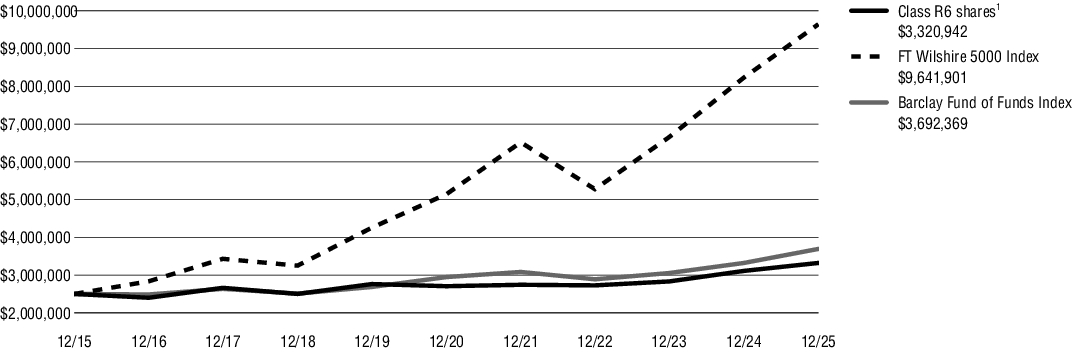
The following graph compares the initial and subsequent account values at the end of each of the most recently completed 10 fiscal years of Class R6 shares. It assumes a $2,500,000 initial investment at the beginning of the first fiscal year, in appropriate broad-based securities market and style-specific indexes for the same period. Performance assumes reinvestment of dividends and capital gain distributions.
GROWTH OF $2,500,000
| (1) |
“NAV” (Net Asset Value) total returns do not include the effect of any sales charge. |
| AVERAGE ANNUAL TOTAL RETURNS for periods ended 12/31/25 | 1 Year | 5 Years | 10 Years |
| Virtus AlphaSimplex Global Alternatives Fund (Class R6/GAFNX) at NAV(1) | 6.77% | 4.19% | 2.88% |
| FT Wilshire 5000 Index | 17.13 | 13.40 | 14.45 |
| Barclay Fund of Funds Index | 11.18 | 4.61 | 3.98 |
| (1) |
“NAV” (Net Asset Value) total returns do not include the effect of any sales charge. |
KEY FUND STATISTICS (as of December 31, 2025)
| Fund net assets (‘000s) | $75,884 |
| Total number of portfolio holdings | 652 |
| Total advisory fee paid (‘000s) | $901 |
| Portfolio turnover rate as of the end of the reporting period | 514% |
Asset Allocation(1)
| Common Stocks | 57 | % | ||
| Software | 3 | |||
| Oil, Gas & Consumable Fuels | 3 | |||
| Capital Markets | 3 | |||
| All other Common Stocks | 48 | |||
| Short-Term Investment | 38 | |||
| U.S. Government Security | 5 | |||
| Total | 100 | % |
| (1) |
Percentage of total investments as of December 31, 2025. |
What were the Fund costs for the last year?
(Based on a hypothetical $10,000 investment)
| Fund (Class) | Costs of a $10,000 investment | Costs paid as a percentage of a $10,000 investment |
| Virtus AlphaSimplex Global Alternatives Fund Class I / GAFYX |
$128 | 1.24% |
What factors impacted Fund performance over the reporting period?
The Fund is a multi-strategy alternative investment vehicle that seeks to provide capital appreciation consistent with the risk/return characteristics of a diversified portfolio of hedge funds. The secondary goal of the Fund is to achieve these returns with less volatility than major equity indexes. The Fund’s hedge fund replication models use advanced statistical techniques to identify and emulate the liquid market exposures of hedge funds and other liquid alternative strategies. The Fund’s alternative risk premia models use small allocations to historically non-correlated strategies designed to provide diversifying return streams. Over the course of the year, gains came primarily from the Fund’s hedge fund replication models, while the Fund’s alternative risk premia models detracted from performance. The Fund was able to capitalize on the broad market exposures of the hedge fund industry, particularly to equities and commodities, as well as on certain opportunistic trading strategies. The following table outlines key factors that materially affected the Fund’s performance during the reporting period.
| FACTOR | IMPACT | SUMMARY |
| Equities |
Positive |
Equities drove performance over the year as these markets made new highs, with gains coming from both the hedge fund replication models and the alternative risk premia models. |
| Fixed income |
Negative |
Fixed income detracted from performance as bond markets struggled to account for central bank policy. |
| Currencies |
Negative |
Currency losses came primarily from several of the alternative risk premia models as the U.S. dollar weakened. Gains within other models could not make up for these losses. |
| Commodities | Positive | Commodity gains came primarily from the hedge fund replication models, particularly due to the surge in gold prices, while the alternative risk premia models detracted from performance. |
The preceding information is the opinion of portfolio management only through the end of the period stated. Any such opinions are subject to change at any time based upon market or other conditions and should not be relied upon as investment advice. Performance figures assume reinvestment of distributions and exclude the effect of sales charges. Performance data quoted represents past results. Past performance is no guarantee of future results, and there is no guarantee that market forecasts will be realized.
How has the Fund historically performed?
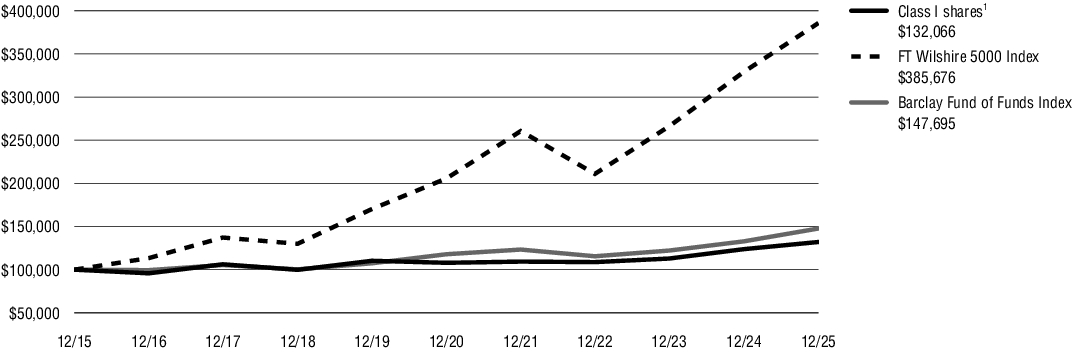
The following graph compares the initial and subsequent account values at the end of each of the most recently completed 10 fiscal years of Class I shares. It assumes a $100,000 initial investment at the beginning of the first fiscal year, in appropriate broad-based securities market and style-specific indexes for the same period. Performance assumes reinvestment of dividends and capital gain distributions.
GROWTH OF $100,000
| (1) |
“NAV” (Net Asset Value) total returns do not include the effect of any sales charge. |
| AVERAGE ANNUAL TOTAL RETURNS for periods ended 12/31/25 | 1 Year | 5 Years | 10 Years |
| Virtus AlphaSimplex Global Alternatives Fund (Class I/GAFYX) at NAV(1) | 6.78% | 4.11% | 2.82% |
| FT Wilshire 5000 Index | 17.13 | 13.40 | 14.45 |
| Barclay Fund of Funds Index | 11.18 | 4.61 | 3.98 |
| (1) |
“NAV” (Net Asset Value) total returns do not include the effect of any sales charge. |
KEY FUND STATISTICS (as of December 31, 2025)
| Fund net assets (‘000s) | $75,884 |
| Total number of portfolio holdings | 652 |
| Total advisory fee paid (‘000s) | $901 |
| Portfolio turnover rate as of the end of the reporting period | 514% |
Asset Allocation(1)
| Common Stocks | 57 | % | ||
| Software | 3 | |||
| Oil, Gas & Consumable Fuels | 3 | |||
| Capital Markets | 3 | |||
| All other Common Stocks | 48 | |||
| Short-Term Investment | 38 | |||
| U.S. Government Security | 5 | |||
| Total | 100 | % |
| (1) |
Percentage of total investments as of December 31, 2025. |
What were the Fund costs for the last year?
(Based on a hypothetical $10,000 investment)
| Fund (Class) | Costs of a $10,000 investment | Costs paid as a percentage of a $10,000 investment |
| Virtus AlphaSimplex Global Alternatives Fund Class C / GAFCX |
$230 | 2.24% |
What factors impacted Fund performance over the reporting period?
The Fund is a multi-strategy alternative investment vehicle that seeks to provide capital appreciation consistent with the risk/return characteristics of a diversified portfolio of hedge funds. The secondary goal of the Fund is to achieve these returns with less volatility than major equity indexes. The Fund’s hedge fund replication models use advanced statistical techniques to identify and emulate the liquid market exposures of hedge funds and other liquid alternative strategies. The Fund’s alternative risk premia models use small allocations to historically non-correlated strategies designed to provide diversifying return streams. Over the course of the year, gains came primarily from the Fund’s hedge fund replication models, while the Fund’s alternative risk premia models detracted from performance. The Fund was able to capitalize on the broad market exposures of the hedge fund industry, particularly to equities and commodities, as well as on certain opportunistic trading strategies. The following table outlines key factors that materially affected the Fund’s performance during the reporting period.
| FACTOR | IMPACT | SUMMARY |
| Equities |
Positive |
Equities drove performance over the year as these markets made new highs, with gains coming from both the hedge fund replication models and the alternative risk premia models. |
| Fixed income |
Negative |
Fixed income detracted from performance as bond markets struggled to account for central bank policy. |
| Currencies |
Negative |
Currency losses came primarily from several of the alternative risk premia models as the U.S. dollar weakened. Gains within other models could not make up for these losses. |
| Commodities | Positive | Commodity gains came primarily from the hedge fund replication models, particularly due to the surge in gold prices, while the alternative risk premia models detracted from performance. |
The preceding information is the opinion of portfolio management only through the end of the period stated. Any such opinions are subject to change at any time based upon market or other conditions and should not be relied upon as investment advice. Performance figures assume reinvestment of distributions and exclude the effect of sales charges. Performance data quoted represents past results. Past performance is no guarantee of future results, and there is no guarantee that market forecasts will be realized.
How has the Fund historically performed?
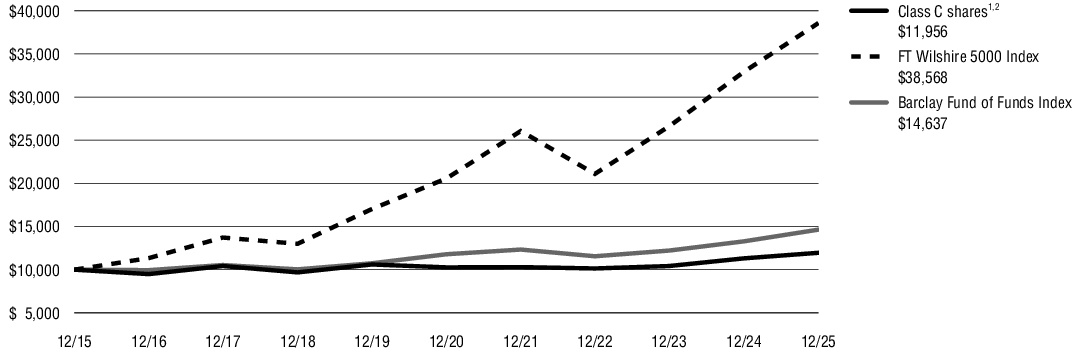
The following graph compares the initial and subsequent account values at the end of each of the most recently completed 10 fiscal years of Class C shares. It assumes a $10,000 initial investment at the beginning of the first fiscal year, in appropriate broad-based securities market and style-specific indexes for the same period. Performance assumes reinvestment of dividends and capital gain distributions.
GROWTH OF $10,000
| (1) |
“NAV” (Net Asset Value) total returns do not include the effect of any sales charge. |
| (2) |
“CDSC” (contingent deferred sales charge) is applied to redemptions of certain classes of shares that do not have a sales charge applied at the time of time of purchase. CDSC for all Class C shares are 1% within the first year and 0% thereafter. |
| AVERAGE ANNUAL TOTAL RETURNS for periods ended 12/31/25 | 1 Year | 5 Years | 10 Years |
| Virtus AlphaSimplex Global Alternatives Fund (Class C/GAFCX) at NAV(1) and with CDSC(2) | 5.69% | 3.09% | 1.80% |
| FT Wilshire 5000 Index | 17.13 | 13.40 | 14.45 |
| Barclay Fund of Funds Index | 11.18 | 4.61 | 3.98 |
| (1) |
“NAV” (Net Asset Value) total returns do not include the effect of any sales charge. |
| (2) |
“CDSC” (contingent deferred sales charge) is applied to redemptions of certain classes of shares that do not have a sales charge applied at the time of time of purchase. CDSC for all Class C shares are 1% within the first year and 0% thereafter. |
KEY FUND STATISTICS (as of December 31, 2025)
| Fund net assets (‘000s) | $75,884 |
| Total number of portfolio holdings | 652 |
| Total advisory fee paid (‘000s) | $901 |
| Portfolio turnover rate as of the end of the reporting period | 514% |
Asset Allocation(1)
| Common Stocks | 57 | % | ||
| Software | 3 | |||
| Oil, Gas & Consumable Fuels | 3 | |||
| Capital Markets | 3 | |||
| All other Common Stocks | 48 | |||
| Short-Term Investment | 38 | |||
| U.S. Government Security | 5 | |||
| Total | 100 | % |
| (1) |
Percentage of total investments as of December 31, 2025. |
Material Fund Changes
Effective January 26, 2026, Class C shares were converted to Class A shares.
What were the Fund costs for the last year?
(Based on a hypothetical $10,000 investment)
| Fund (Class) | Costs of a $10,000 investment | Costs paid as a percentage of a $10,000 investment |
| Virtus AlphaSimplex Global Alternatives Fund Class A / GAFAX |
$154 | 1.49% |
What factors impacted Fund performance over the reporting period?
The Fund is a multi-strategy alternative investment vehicle that seeks to provide capital appreciation consistent with the risk/return characteristics of a diversified portfolio of hedge funds. The secondary goal of the Fund is to achieve these returns with less volatility than major equity indexes. The Fund’s hedge fund replication models use advanced statistical techniques to identify and emulate the liquid market exposures of hedge funds and other liquid alternative strategies. The Fund’s alternative risk premia models use small allocations to historically non-correlated strategies designed to provide diversifying return streams. Over the course of the year, gains came primarily from the Fund’s hedge fund replication models, while the Fund’s alternative risk premia models detracted from performance. The Fund was able to capitalize on the broad market exposures of the hedge fund industry, particularly to equities and commodities, as well as on certain opportunistic trading strategies. The following table outlines key factors that materially affected the Fund’s performance during the reporting period.
| FACTOR | IMPACT | SUMMARY |
| Equities |
Positive |
Equities drove performance over the year as these markets made new highs, with gains coming from both the hedge fund replication models and the alternative risk premia models. |
| Fixed income |
Negative |
Fixed income detracted from performance as bond markets struggled to account for central bank policy. |
| Currencies |
Negative |
Currency losses came primarily from several of the alternative risk premia models as the U.S. dollar weakened. Gains within other models could not make up for these losses. |
| Commodities | Positive | Commodity gains came primarily from the hedge fund replication models, particularly due to the surge in gold prices, while the alternative risk premia models detracted from performance. |
The preceding information is the opinion of portfolio management only through the end of the period stated. Any such opinions are subject to change at any time based upon market or other conditions and should not be relied upon as investment advice. Performance figures assume reinvestment of distributions and exclude the effect of sales charges. Performance data quoted represents past results. Past performance is no guarantee of future results, and there is no guarantee that market forecasts will be realized.
How has the Fund historically performed?
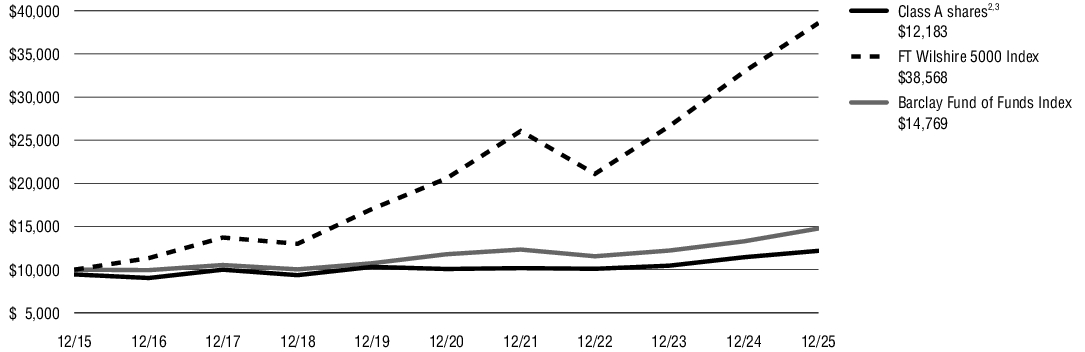
The following graph compares the initial and subsequent account values at the end of each of the most recently completed 10 fiscal years of Class A shares including any applicable sales charges or fees. It assumes a $10,000 initial investment at the beginning of the first fiscal year, in appropriate broad-based securities market and style-specific indexes for the same period. Performance assumes reinvestment of dividends and capital gain distributions.
GROWTH OF $10,000
| AVERAGE ANNUAL TOTAL RETURNS for periods ended 12/31/25 | 1 Year | 5 Years | 10 Years |
| Virtus AlphaSimplex Global Alternatives Fund (Class A/GAFAX) at NAV(1) | 6.48% | 3.87% | 2.57% |
| Virtus AlphaSimplex Global Alternatives Fund (Class A/GAFAX) at POP(2),(3) | 0.62 | 2.70 | 1.99 |
| FT Wilshire 5000 Index | 17.13 | 13.40 | 14.45 |
| Barclay Fund of Funds Index | 11.18 | 4.61 | 3.98 |
| (1) |
“NAV” (Net Asset Value) total returns do not include the effect of any sales charge. |
| (2) |
“POP” (Public Offering Price) total returns include the effect of the maximum front-end 5.50% sales charge. |
| (3) |
“CDSC” (contingent deferred sales charge) is applied to redemptions of certain classes of shares that do not have a sales charge applied at the time of purchase. A CDSC may be imposed on certain redemptions of Class A shares made within 18 months of a finder’s fee being paid. |
KEY FUND STATISTICS (as of December 31, 2025)
| Fund net assets (‘000s) | $75,884 |
| Total number of portfolio holdings | 652 |
| Total advisory fee paid (‘000s) | $901 |
| Portfolio turnover rate as of the end of the reporting period | 514% |
Asset Allocation(1)
| Common Stocks | 57 | % | ||
| Software | 3 | |||
| Oil, Gas & Consumable Fuels | 3 | |||
| Capital Markets | 3 | |||
| All other Common Stocks | 48 | |||
| Short-Term Investment | 38 | |||
| U.S. Government Security | 5 | |||
| Total | 100 | % |
| (1) |
Percentage of total investments as of December 31, 2025. |
What were the Fund costs for the last year?
(Based on a hypothetical $10,000 investment)
| Fund (Class) | Costs of a $10,000 investment | Costs paid as a percentage of a $10,000 investment |
| Virtus AlphaSimplex Managed Futures Strategy Fund Class A / AMFAX |
$162 | 1.70% |
What factors impacted Fund performance over the reporting period?
The Fund pursues an absolute return strategy that seeks to provide long-term capital appreciation. The Fund’s strategy uses a pure trend-following approach that seeks to take advantage of momentum in a range of liquid futures and forward contracts across global equity, fixed income, currency, and commodity markets. Significant volatility and structural shifts, driven by dramatic changes in U.S. political and economic policy, led to a difficult period for trend followers. The Fund’s losses were driven by fixed income and currencies, while commodities and equities contributed slightly to performance. The following table outlines key factors that materially affected the Fund’s performance during the reporting period.
| FACTOR | IMPACT | SUMMARY |
| Equity markets |
Positive |
As equity markets rallied during the fiscal year, the Fund saw gains from long positions in international developed markets and some emerging markets, with the biggest gains coming from the IBEX 35® (Spain), S&P/TSX 60 (Canada), and Japanese equities. U.S. equities detracted from performance, especially the S&P 500® Index and the Dow Jones Industrial Average®. |
| Fixed income |
Negative |
Losses came from both short and long positions as global bond markets struggled to account for central bank policy. The largest losses were in the French 10-Year Note (OAT), U.S. bonds, and the Canadian 10-Year Note. |
| Currencies |
Negative |
Currency losses were driven by short positions in foreign currencies, while being long the U.S. dollar, as the dollar weakened. The largest losses came from the euro, New Zealand dollar, and Swiss franc. Long positions in some emerging market currencies, while being short the U.S. dollar, especially the Mexican peso and Polish zloty, provided gains. |
| Commodities | Positive | Commodities were more mixed. The Fund had significant gains from long positions in precious metals, especially gold and silver, while energies, agricultural commodities, and base metals detracted from performance over the course of the year. |
The preceding information is the opinion of portfolio management only through the end of the period stated. Any such opinions are subject to change at any time based upon market or other conditions and should not be relied upon as investment advice. Performance figures assume reinvestment of distributions and exclude the effect of sales charges. Performance data quoted represents past results. Past performance is no guarantee of future results, and there is no guarantee that market forecasts will be realized.
How has the Fund historically performed?
The following graph compares the initial and subsequent account values at the end of each of the most recently completed 10 fiscal years of Class A shares including any applicable sales charges or fees. It assumes a $10,000 initial investment at the beginning of the first fiscal year, in appropriate broad-based securities market and style-specific indexes for the same period. Performance assumes reinvestment of dividends and capital gain distributions.
GROWTH OF $10,000
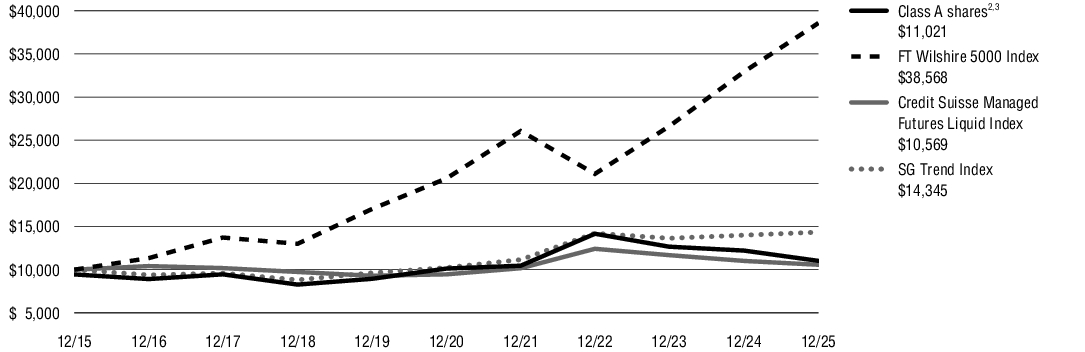
| AVERAGE ANNUAL TOTAL RETURNS for periods ended 12/31/25 | 1 Year | 5 Years | 10 Years |
| Virtus AlphaSimplex Managed Futures Strategy Fund (Class A/AMFAX) at NAV(1) | (9.86)% | 1.71% | 1.55% |
| Virtus AlphaSimplex Managed Futures Strategy Fund (Class A/AMFAX) at POP(2),(3) | (14.81) | 0.56 | 0.98 |
| FT Wilshire 5000 Index | 17.13 | 13.40 | 14.45 |
| Credit Suisse Managed Futures Liquid Index | (4.04) | 2.24 | 0.55 |
| SG Trend Index | 2.48 | 6.99 | 3.67 |
| (1) |
“NAV” (Net Asset Value) total returns do not include the effect of any sales charge. |
| (2) |
“POP” (Public Offering Price) total returns include the effect of the maximum front-end 5.50% sales charge. |
| (3) |
“CDSC” (contingent deferred sales charge) is applied to redemptions of certain classes of shares that do not have a sales charge applied at the time of purchase. A CDSC may be imposed on certain redemptions of Class A shares made within 18 months of a finder’s fee being paid. |
KEY FUND STATISTICS (as of December 31, 2025)
| Fund net assets (‘000s) | $1,111,820 |
| Total number of portfolio holdings | 94 |
| Number of Long Positions | 61 |
| Number of Short Positions | 33 |
| Total advisory fee paid (‘000s) | $15,637 |
| Portfolio turnover rate as of the end of the reporting period | % |
ASSET CLASS ALLOCATION(1)
| Certificates of Deposits | 58 | % |
| U.S. Government Securities | 36 | |
| Commercial Paper | 6 | |
| Total | 100 | % |
| (1) |
Percentage of total investments as of December 31, 2025. |
% RISK ALLOCATION (includes futures contracts)
| Commodities | 35 |
| Currencies | 17 |
| Equities | 29 |
| Fixed Income | 19 |
What were the Fund costs for the last year?
(Based on a hypothetical $10,000 investment)
| Fund (Class) | Costs of a $10,000 investment | Costs paid as a percentage of a $10,000 investment |
| Virtus AlphaSimplex Managed Futures Strategy Fund Class C / ASFCX |
$232 | 2.45% |
What factors impacted Fund performance over the reporting period?
The Fund pursues an absolute return strategy that seeks to provide long-term capital appreciation. The Fund’s strategy uses a pure trend-following approach that seeks to take advantage of momentum in a range of liquid futures and forward contracts across global equity, fixed income, currency, and commodity markets. Significant volatility and structural shifts, driven by dramatic changes in U.S. political and economic policy, led to a difficult period for trend followers. The Fund’s losses were driven by fixed income and currencies, while commodities and equities contributed slightly to performance. The following table outlines key factors that materially affected the Fund’s performance during the reporting period.
| FACTOR | IMPACT | SUMMARY |
| Equity markets |
Positive |
As equity markets rallied during the fiscal year, the Fund saw gains from long positions in international developed markets and some emerging markets, with the biggest gains coming from the IBEX 35® (Spain), S&P/TSX 60 (Canada), and Japanese equities. U.S. equities detracted from performance, especially the S&P 500® Index and the Dow Jones Industrial Average®. |
| Fixed income |
Negative |
Losses came from both short and long positions as global bond markets struggled to account for central bank policy. The largest losses were in the French 10-Year Note (OAT), U.S. bonds, and the Canadian 10-Year Note. |
| Currencies |
Negative |
Currency losses were driven by short positions in foreign currencies, while being long the U.S. dollar, as the dollar weakened. The largest losses came from the euro, New Zealand dollar, and Swiss franc. Long positions in some emerging market currencies, while being short the U.S. dollar, especially the Mexican peso and Polish zloty, provided gains. |
| Commodities | Positive | Commodities were more mixed. The Fund had significant gains from long positions in precious metals, especially gold and silver, while energies, agricultural commodities, and base metals detracted from performance over the course of the year. |
The preceding information is the opinion of portfolio management only through the end of the period stated. Any such opinions are subject to change at any time based upon market or other conditions and should not be relied upon as investment advice. Performance figures assume reinvestment of distributions and exclude the effect of sales charges. Performance data quoted represents past results. Past performance is no guarantee of future results, and there is no guarantee that market forecasts will be realized.
How has the Fund historically performed?
The following graph compares the initial and subsequent account values at the end of each of the most recently completed 10 fiscal years of Class C shares. It assumes a $10,000 initial investment at the beginning of the first fiscal year, in appropriate broad-based securities market and style-specific indexes for the same period. Performance assumes reinvestment of dividends and capital gain distributions.
GROWTH OF $10,000
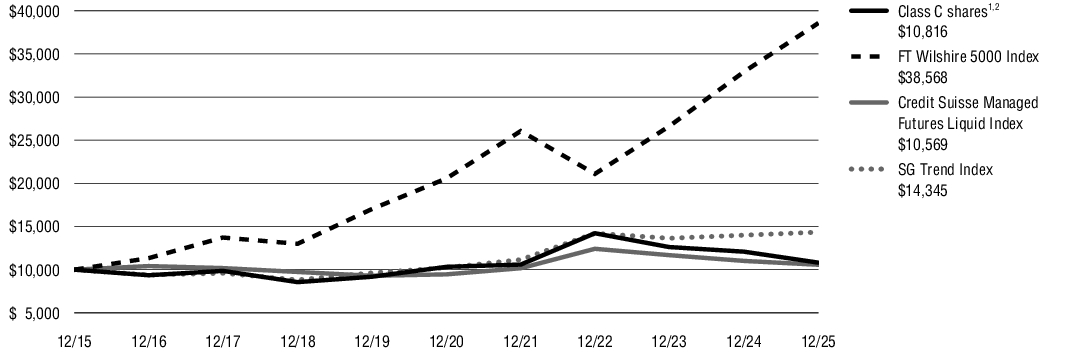
| AVERAGE ANNUAL TOTAL RETURNS for periods ended 12/31/25 | 1 Year | 5 Years | 10 Years |
| Virtus AlphaSimplex Managed Futures Strategy Fund (Class C/ASFCX) at NAV(1) and with CDSC(2) | (10.62)% | 0.93% | 0.79% |
| FT Wilshire 5000 Index | 17.13 | 13.40 | 14.45 |
| Credit Suisse Managed Futures Liquid Index | (4.04) | 2.24 | 0.55 |
| SG Trend Index | 2.48 | 6.99 | 3.67 |
| (1) |
“NAV” (Net Asset Value) total returns do not include the effect of any sales charge. |
| (2) |
“CDSC” (contingent deferred sales charge) is applied to redemptions of certain classes of shares that do not have a sales charge applied at the time of time of purchase. CDSC for all Class C shares are 1% within the first year and 0% thereafter. |
KEY FUND STATISTICS (as of December 31, 2025)
| Fund net assets (‘000s) | $1,111,820 |
| Total number of portfolio holdings | 94 |
| Number of Long Positions | 61 |
| Number of Short Positions | 33 |
| Total advisory fee paid (‘000s) | $15,637 |
| Portfolio turnover rate as of the end of the reporting period | % |
ASSET CLASS ALLOCATION(1)
| Certificates of Deposits | 58 | % |
| U.S. Government Securities | 36 | |
| Commercial Paper | 6 | |
| Total | 100 | % |
| (1) |
Percentage of total investments as of December 31, 2025. |
% RISK ALLOCATION (includes futures contracts)
| Commodities | 35 |
| Currencies | 17 |
| Equities | 29 |
| Fixed Income | 19 |
What were the Fund costs for the last year?
(Based on a hypothetical $10,000 investment)
| Fund (Class) | Costs of a $10,000 investment | Costs paid as a percentage of a $10,000 investment |
| Virtus AlphaSimplex Managed Futures Strategy Fund Class I / ASFYX |
$138 | 1.45% |
What factors impacted Fund performance over the reporting period?
The Fund pursues an absolute return strategy that seeks to provide long-term capital appreciation. The Fund’s strategy uses a pure trend-following approach that seeks to take advantage of momentum in a range of liquid futures and forward contracts across global equity, fixed income, currency, and commodity markets. Significant volatility and structural shifts, driven by dramatic changes in U.S. political and economic policy, led to a difficult period for trend followers. The Fund’s losses were driven by fixed income and currencies, while commodities and equities contributed slightly to performance. The following table outlines key factors that materially affected the Fund’s performance during the reporting period.
| FACTOR | IMPACT | SUMMARY |
| Equity markets |
Positive |
As equity markets rallied during the fiscal year, the Fund saw gains from long positions in international developed markets and some emerging markets, with the biggest gains coming from the IBEX 35® (Spain), S&P/TSX 60 (Canada), and Japanese equities. U.S. equities detracted from performance, especially the S&P 500® Index and the Dow Jones Industrial Average®. |
| Fixed income |
Negative |
Losses came from both short and long positions as global bond markets struggled to account for central bank policy. The largest losses were in the French 10-Year Note (OAT), U.S. bonds, and the Canadian 10-Year Note. |
| Currencies |
Negative |
Currency losses were driven by short positions in foreign currencies, while being long the U.S. dollar, as the dollar weakened. The largest losses came from the euro, New Zealand dollar, and Swiss franc. Long positions in some emerging market currencies, while being short the U.S. dollar, especially the Mexican peso and Polish zloty, provided gains. |
| Commodities | Positive | Commodities were more mixed. The Fund had significant gains from long positions in precious metals, especially gold and silver, while energies, agricultural commodities, and base metals detracted from performance over the course of the year. |
The preceding information is the opinion of portfolio management only through the end of the period stated. Any such opinions are subject to change at any time based upon market or other conditions and should not be relied upon as investment advice. Performance figures assume reinvestment of distributions and exclude the effect of sales charges. Performance data quoted represents past results. Past performance is no guarantee of future results, and there is no guarantee that market forecasts will be realized.
How has the Fund historically performed?
The following graph compares the initial and subsequent account values at the end of each of the most recently completed 10 fiscal years of Class I shares. It assumes a $100,000 initial investment at the beginning of the first fiscal year, in appropriate broad-based securities market and style-specific indexes for the same period. Performance assumes reinvestment of dividends and capital gain distributions.
GROWTH OF $100,000
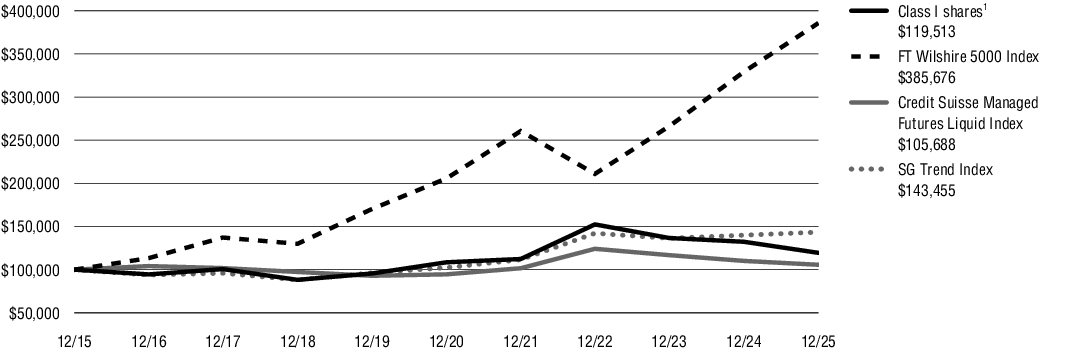
| AVERAGE ANNUAL TOTAL RETURNS for periods ended 12/31/25 | 1 Year | 5 Years | 10 Years |
| Virtus AlphaSimplex Managed Futures Strategy Fund (Class I/ASFYX) at NAV(1) | (9.78)% | 1.94% | 1.80% |
| FT Wilshire 5000 Index | 17.13 | 13.40 | 14.45 |
| Credit Suisse Managed Futures Liquid Index | (4.04) | 2.24 | 0.55 |
| SG Trend Index | 2.48 | 6.99 | 3.67 |
| (1) |
“NAV” (Net Asset Value) total returns do not include the effect of any sales charge. |
KEY FUND STATISTICS (as of December 31, 2025)
| Fund net assets (‘000s) | $1,111,820 |
| Total number of portfolio holdings | 94 |
| Number of Long Positions | 61 |
| Number of Short Positions | 33 |
| Total advisory fee paid (‘000s) | $15,637 |
| Portfolio turnover rate as of the end of the reporting period | % |
ASSET CLASS ALLOCATION(1)
| Certificates of Deposits | 58 | % |
| U.S. Government Securities | 36 | |
| Commercial Paper | 6 | |
| Total | 100 | % |
| (1) |
Percentage of total investments as of December 31, 2025. |
% RISK ALLOCATION (includes futures contracts)
| Commodities | 35 |
| Currencies | 17 |
| Equities | 29 |
| Fixed Income | 19 |
What were the Fund costs for the last year?
(Based on a hypothetical $10,000 investment)
| Fund (Class) | Costs of a $10,000 investment | Costs paid as a percentage of a $10,000 investment |
| Virtus AlphaSimplex Managed Futures Strategy Fund Class R6 / AMFNX |
$127 | 1.33% |
What factors impacted Fund performance over the reporting period?
The Fund pursues an absolute return strategy that seeks to provide long-term capital appreciation. The Fund’s strategy uses a pure trend-following approach that seeks to take advantage of momentum in a range of liquid futures and forward contracts across global equity, fixed income, currency, and commodity markets. Significant volatility and structural shifts, driven by dramatic changes in U.S. political and economic policy, led to a difficult period for trend followers. The Fund’s losses were driven by fixed income and currencies, while commodities and equities contributed slightly to performance. The following table outlines key factors that materially affected the Fund’s performance during the reporting period.
| FACTOR | IMPACT | SUMMARY |
| Equity markets |
Positive |
As equity markets rallied during the fiscal year, the Fund saw gains from long positions in international developed markets and some emerging markets, with the biggest gains coming from the IBEX 35® (Spain), S&P/TSX 60 (Canada), and Japanese equities. U.S. equities detracted from performance, especially the S&P 500® Index and the Dow Jones Industrial Average®. |
| Fixed income |
Negative |
Losses came from both short and long positions as global bond markets struggled to account for central bank policy. The largest losses were in the French 10-Year Note (OAT), U.S. bonds, and the Canadian 10-Year Note. |
| Currencies |
Negative |
Currency losses were driven by short positions in foreign currencies, while being long the U.S. dollar, as the dollar weakened. The largest losses came from the euro, New Zealand dollar, and Swiss franc. Long positions in some emerging market currencies, while being short the U.S. dollar, especially the Mexican peso and Polish zloty, provided gains. |
| Commodities | Positive | Commodities were more mixed. The Fund had significant gains from long positions in precious metals, especially gold and silver, while energies, agricultural commodities, and base metals detracted from performance over the course of the year. |
The preceding information is the opinion of portfolio management only through the end of the period stated. Any such opinions are subject to change at any time based upon market or other conditions and should not be relied upon as investment advice. Performance figures assume reinvestment of distributions and exclude the effect of sales charges. Performance data quoted represents past results. Past performance is no guarantee of future results, and there is no guarantee that market forecasts will be realized.
How has the Fund historically performed?
The following graph compares the initial and subsequent account values at the end of each of the most recently completed fiscal years of Class R6 shares from inception (May 1, 2017). It assumes a $2,500,000 initial investment from inception, in appropriate broad-based securities market and style-specific indexes for the same period. Performance assumes reinvestment of dividends and capital gain distributions.
GROWTH OF $2,500,000
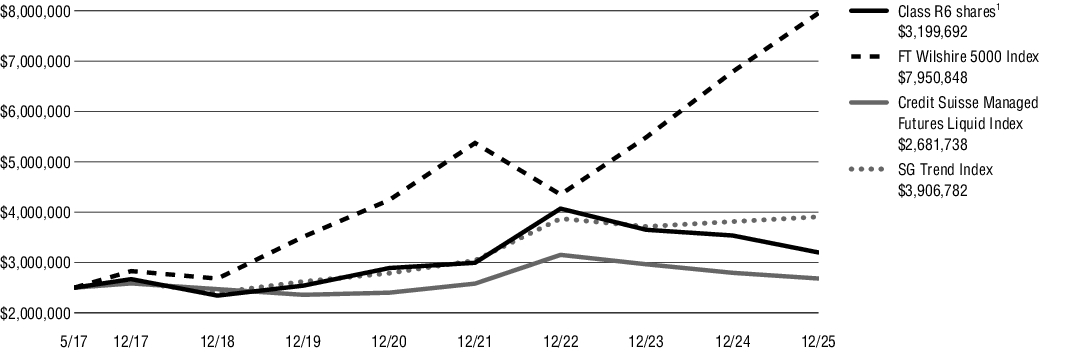
| AVERAGE ANNUAL TOTAL RETURNS for periods ended 12/31/25 | 1 Year | 5 Years | Since Inception |
| Virtus AlphaSimplex Managed Futures Strategy Fund (Class R6/AMFNX) at NAV(1) | (9.61)% | 2.06% | 2.89% |
| FT Wilshire 5000 Index | 17.13 | 13.40 | 14.27 |
| Credit Suisse Managed Futures Liquid Index | (4.04) | 2.24 | 0.81 |
| SG Trend Index | 2.48 | 6.99 | 5.28 |
| (1) |
“NAV” (Net Asset Value) total returns do not include the effect of any sales charge. |
KEY FUND STATISTICS (as of December 31, 2025)
| Fund net assets (‘000s) | $1,111,820 |
| Total number of portfolio holdings | 94 |
| Number of Long Positions | 61 |
| Number of Short Positions | 33 |
| Total advisory fee paid (‘000s) | $15,637 |
| Portfolio turnover rate as of the end of the reporting period | % |
ASSET CLASS ALLOCATION(1)
| Certificates of Deposits | 58 | % |
| U.S. Government Securities | 36 | |
| Commercial Paper | 6 | |
| Total | 100 | % |
| (1) |
Percentage of total investments as of December 31, 2025. |
% RISK ALLOCATION (includes futures contracts)
| Commodities | 35 |
| Currencies | 17 |
| Equities | 29 |
| Fixed Income | 19 |