Shareholder Report
Dec. 31, 2025
USD ($)
Holding
invesco.com/reports
. You can also request this information by contacting us at (800) 959-4246
.
What Were The Fund Costs For The Last
Year
?
(Based on a hypothetical $10,000 investment)
Fund (Class) |
Costs of a $10,000 investment |
Costs paid as a percentage of a $10,000 investment |
| Invesco Active Allocation Fund (Class A) |
$ 47 |
0.44 % |
How Did The Fund Perform During The Period?
•
2025 was a year of change, especially in geopolitics. Tariffs dominated headlines, Europe kicked off new defense spending, and the artificial intelligence trade was strong. Despite a year of change, global risk assets rallied and performed well.•
For the fiscal year ended December 31, 2025, Class A shares of the Fund, excluding sales charge, returned 15.53%. For the same time period, the Custom Invesco Active Allocation Index (the "Benchmark") returned 18.82%.What contributed to performance?
Asset allocation - Fixed Income |
The Fund's underweight to fixed income relative to the Benchmark was the largest positive contributor to relative return given equities outperformed fixed income.Tactical asset allocation |
The Fund's tactical asset allocation contributed positively to relative performance as the Fund's foreign exchange activity and fixed income derivatives were additive.Asset allocation - Equity |
The Fund's equity exposure relative to the Benchmark was a positive contributor to relative return given equities outperformed the Benchmark.What detracted from performance?
Equity manager selection
|
The Fund's equity manager selection effects were the largest detractors from the Fund's relative performance, with the key detractors being the selection within global and international small and mid-cap equities.Equity style selection |
The Fund's equity style effects detracted from relative performance given the Fund's exposure to US large-cap multifactor and US mid-cap growth equities.Fixed Income manager selection |
The Fund's fixed income manager selection effects detracted from relative performance within core and core plus fixed income.How Has The Fund Historically Performed?
Growth of $10,000 Investment
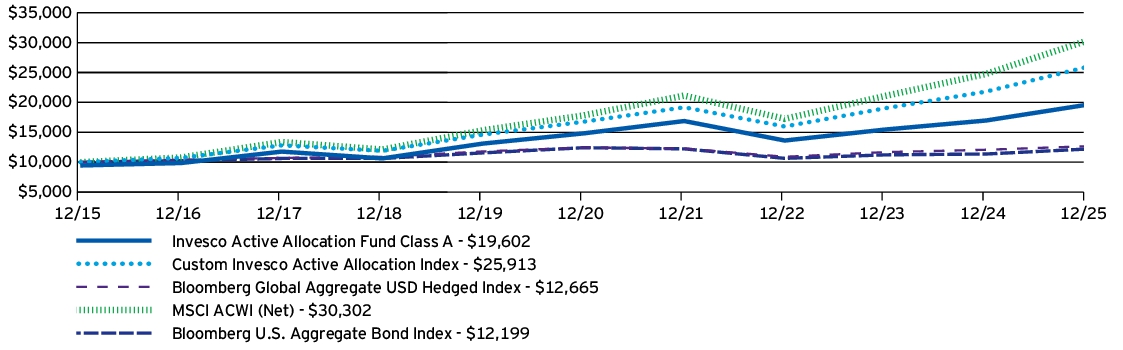
AVERAGE ANNUAL TOTAL RETURNS |
1 Year |
5 Years |
10 Years |
Invesco Active Allocation Fund (Class A) —including sales charge |
9.17 % |
4.56 % |
6.96 % |
Invesco Active Allocation Fund (Class A) —excluding sales charge |
15.53 % |
5.76 % |
7.57 % |
Custom Invesco Active Allocation Index |
18.82 % |
9.09 % |
9.99 % |
Bloomberg Global Aggregate USD Hedged Index |
4.86 % |
0.34 % |
2.39 % |
MSCI ACWI (Net) |
22.34 % |
11.19 % |
11.72 % |
Bloomberg U.S. Aggregate Bond Index |
7.30 % |
-0.36 % |
2.01 % |
invesco.com/performance
for more recent performance information.
What Are Key Statistics About The Fund?
(as of December 31, 2025)
| Fund net assets | $ 1,973,581,259 |
| Total number of portfolio holdings | 24 |
| Total advisory fees paid | $ 1,634,660 |
| Portfolio turnover rate | 32 % |
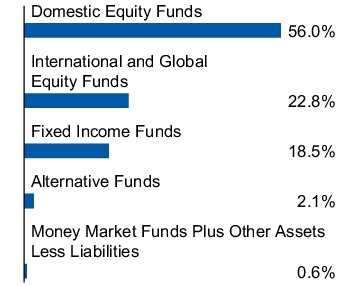
What Comprised The Fund's Holdings?
(as of December 31, 2025)
Asset allocation
(% of net assets)

How Has The Fund Changed Over The Past Year?
This is a summary of certain changes to the Fund since December 31, 2024. For more complete information, you may review the Fund's prospectus, which is available at
invesco.com/reports
or upon request at (800) 959-4246
.
The Fund added unlisted closed-end interval fund risk to its principal risks to reflect that shares of an underlying unlisted closed-end interval fund in which the Fund may invest are considered an illiquid investment because shareholders (such as the Fund) cannot redeem or sell their shares outside of periodic repurchse offers.
invesco.com/reports
or upon request at (800) 959-4246
.
invesco.com/reports
. You can also request this information by contacting us at (800) 959-4246
.
What Were The Fund Costs For The Last
Year
?
(Based on a hypothetical $10,000 investment)
Fund (Class) |
Costs of a $10,000 investment |
Costs paid as a percentage of a $10,000 investment |
| Invesco Active Allocation Fund (Class C) |
$ 129 |
1.20 % |
How Did The Fund Perform During The Period?
•
2025 was a year of change, especially in geopolitics. Tariffs dominated headlines, Europe kicked off new defense spending, and the artificial intelligence trade was strong. Despite a year of change, global risk assets rallied and performed well.•
For the fiscal year ended December 31, 2025, Class C shares of the Fund, excluding sales charge, returned 14.63%. For the same time period, the Custom Invesco Active Allocation Index (the "Benchmark") returned 18.82%.What contributed to performance?
Asset allocation - Fixed Income |
The Fund's underweight to fixed income relative to the Benchmark was the largest positive contributor to relative return given equities outperformed fixed income.Tactical asset allocation |
The Fund's tactical asset allocation contributed positively to relative performance as the Fund's foreign exchange activity and fixed income derivatives were additive.Asset allocation - Equity |
The Fund's equity exposure relative to the Benchmark was a positive contributor to relative return given equities outperformed the Benchmark.What detracted from performance?
Equity manager selection
|
The Fund's equity manager selection effects were the largest detractors from the Fund's relative performance, with the key detractors being the selection within global and international small and mid-cap equities.Equity style selection |
The Fund's equity style effects detracted from relative performance given the Fund's exposure to US large-cap multifactor and US mid-cap growth equities.Fixed Income manager selection |
The Fund's fixed income manager selection effects detracted from relative performance within core and core plus fixed income.How Has The Fund Historically Performed?
Growth of $10,000 Investment

AVERAGE ANNUAL TOTAL RETURNS |
1 Year |
5 Years |
10 Years |
Invesco Active Allocation Fund (Class C) —including sales charge |
13.63 % |
4.96 % |
6.91 % |
Invesco Active Allocation Fund (Class C) —excluding sales charge |
14.63 % |
4.96 % |
6.91 % |
Custom Invesco Active Allocation Index |
18.82 % |
9.09 % |
9.99 % |
Bloomberg Global Aggregate USD Hedged Index |
4.86 % |
0.34 % |
2.39 % |
MSCI ACWI (Net) |
22.34 % |
11.19 % |
11.72 % |
Bloomberg U.S. Aggregate Bond Index |
7.30 % |
-0.36 % |
2.01 % |
invesco.com/performance
for more recent performance information.
What Are Key Statistics About The Fund?
(as of December 31, 2025)
| Fund net assets | $ 1,973,581,259 |
| Total number of portfolio holdings | 24 |
| Total advisory fees paid | $ 1,634,660 |
| Portfolio turnover rate | 32 % |
What Comprised The Fund's Holdings?
(as of December 31, 2025)
Asset allocation
(% of net assets)

How Has The Fund Changed Over The Past Year?
This is a summary of certain changes to the Fund since December 31, 2024. For more complete information, you may review the Fund's prospectus, which is available at
invesco.com/reports
or upon request at (800) 959-4246
.
The Fund added unlisted closed-end interval fund risk to its principal risks to reflect that shares of an underlying unlisted closed-end interval fund in which the Fund may invest are considered an illiquid investment because shareholders (such as the Fund) cannot redeem or sell their shares outside of periodic repurchse offers.
invesco.com/reports
or upon request at (800) 959-4246
.
invesco.com/reports
. You can also request this information by contacting us at (800) 959-4246
.
What Were The Fund Costs For The Last
Year
?
(Based on a hypothetical $10,000 investment)
Fund (Class) |
Costs of a $10,000 investment |
Costs paid as a percentage of a $10,000 investment |
| Invesco Active Allocation Fund (Class R) |
$ 75 |
0.70 % |
How Did The Fund Perform During The Period?
•
2025 was a year of change, especially in geopolitics. Tariffs dominated headlines, Europe kicked off new defense spending, and the artificial intelligence trade was strong. Despite a year of change, global risk assets rallied and performed well.•
For the fiscal year ended December 31, 2025, Class R shares of the Fund returned 15.20%. For the same time period, the Custom Invesco Active Allocation Index (the "Benchmark") returned 18.82%.What contributed to performance?
Asset allocation - Fixed Income |
The Fund's underweight to fixed income relative to the Benchmark was the largest positive contributor to relative return given equities outperformed fixed income.Tactical asset allocation |
The Fund's tactical asset allocation contributed positively to relative performance as the Fund's foreign exchange activity and fixed income derivatives were additive.Asset allocation - Equity |
The Fund's equity exposure relative to the Benchmark was a positive contributor to relative return given equities outperformed the Benchmark.What detracted from performance?
Equity manager selection
|
The Fund's equity manager selection effects were the largest detractors from the Fund's relative performance, with the key detractors being the selection within global and international small and mid-cap equities.Equity style selection |
The Fund's equity style effects detracted from relative performance given the Fund's exposure to US large-cap multifactor and US mid-cap growth equities.Fixed Income manager selection |
The Fund's fixed income manager selection effects detracted from relative performance within core and core plus fixed income.How Has The Fund Historically Performed?
Growth of $10,000 Investment

AVERAGE ANNUAL TOTAL RETURNS |
1 Year |
5 Years |
10 Years |
Invesco Active Allocation Fund (Class R) |
15.20 % |
5.49 % |
7.30 % |
Custom Invesco Active Allocation Index |
18.82 % |
9.09 % |
9.99 % |
Bloomberg Global Aggregate USD Hedged Index |
4.86 % |
0.34 % |
2.39 % |
MSCI ACWI (Net) |
22.34 % |
11.19 % |
11.72 % |
Bloomberg U.S. Aggregate Bond Index |
7.30 % |
-0.36 % |
2.01 % |
invesco.com/performance
for more recent performance information.
What Are Key Statistics About The Fund?
(as of December 31, 2025)
| Fund net assets | $ 1,973,581,259 |
| Total number of portfolio holdings | 24 |
| Total advisory fees paid | $ 1,634,660 |
| Portfolio turnover rate | 32 % |
What Comprised The Fund's Holdings?
(as of December 31, 2025)
Asset allocation
(% of net assets)

How Has The Fund Changed Over The Past Year?
This is a summary of certain changes to the Fund since December 31, 2024. For more complete information, you may review the Fund's prospectus, which is available at
invesco.com/reports
or upon request at (800) 959-4246
.
The Fund added unlisted closed-end interval fund risk to its principal risks to reflect that shares of an underlying unlisted closed-end interval fund in which the Fund may invest are considered an illiquid investment because shareholders (such as the Fund) cannot redeem or sell their shares outside of periodic repurchse offers.
invesco.com/reports
or upon request at (800) 959-4246
.
invesco.com/reports
. You can also request this information by contacting us at (800) 959-4246
.
What Were The Fund Costs For The Last
Year
?
(Based on a hypothetical $10,000 investment)
Fund (Class) |
Costs of a $10,000 investment |
Costs paid as a percentage of a $10,000 investment |
| Invesco Active Allocation Fund (Class Y) |
$ 22 |
0.20 % |
How Did The Fund Perform During The Period?
•
2025 was a year of change, especially in geopolitics. Tariffs dominated headlines, Europe kicked off new defense spending, and the artificial intelligence trade was strong. Despite a year of change, global risk assets rallied and performed well.•
For the fiscal year ended December 31, 2025, Class Y shares of the Fund returned 15.76%. For the same time period, the Custom Invesco Active Allocation Index (the "Benchmark") returned 18.82%.What contributed to performance?
Asset allocation - Fixed Income |
The Fund's underweight to fixed income relative to the Benchmark was the largest positive contributor to relative return given equities outperformed fixed income.Tactical asset allocation |
The Fund's tactical asset allocation contributed positively to relative performance as the Fund's foreign exchange activity and fixed income derivatives were additive.Asset allocation - Equity |
The Fund's equity exposure relative to the Benchmark was a positive contributor to relative return given equities outperformed the Benchmark.What detracted from performance?
Equity manager selection
|
The Fund's equity manager selection effects were the largest detractors from the Fund's relative performance, with the key detractors being the selection within global and international small and mid-cap equities.Equity style selection |
The Fund's equity style effects detracted from relative performance given the Fund's exposure to US large-cap multifactor and US mid-cap growth equities.Fixed Income manager selection |
The Fund's fixed income manager selection effects detracted from relative performance within core and core plus fixed income.How Has The Fund Historically Performed?
Growth of $10,000 Investment

AVERAGE ANNUAL TOTAL RETURNS |
1 Year |
5 Years |
10 Years |
Invesco Active Allocation Fund (Class Y) |
15.76 % |
6.02 % |
7.82 % |
Custom Invesco Active Allocation Index |
18.82 % |
9.09 % |
9.99 % |
Bloomberg Global Aggregate USD Hedged Index |
4.86 % |
0.34 % |
2.39 % |
MSCI ACWI (Net) |
22.34 % |
11.19 % |
11.72 % |
Bloomberg U.S. Aggregate Bond Index |
7.30 % |
-0.36 % |
2.01 % |
invesco.com/performance
for more recent performance information.
What Are Key Statistics About The Fund?
(as of December 31, 2025)
| Fund net assets | $ 1,973,581,259 |
| Total number of portfolio holdings | 24 |
| Total advisory fees paid | $ 1,634,660 |
| Portfolio turnover rate | 32 % |
What Comprised The Fund's Holdings?
(as of December 31, 2025)
Asset allocation
(% of net assets)

How Has The Fund Changed Over The Past Year?
This is a summary of certain changes to the Fund since December 31, 2024. For more complete information, you may review the Fund's prospectus, which is available at
invesco.com/reports
or upon request at (800) 959-4246
.
The Fund added unlisted closed-end interval fund risk to its principal risks to reflect that shares of an underlying unlisted closed-end interval fund in which the Fund may invest are considered an illiquid investment because shareholders (such as the Fund) cannot redeem or sell their shares outside of periodic repurchse offers.
invesco.com/reports
or upon request at (800) 959-4246
.
invesco.com/reports
. You can also request this information by contacting us at (800) 959-4246
.
What Were The Fund Costs For The Last
Year
?
(Based on a hypothetical $10,000 investment)
Fund (Class) |
Costs of a $10,000 investment |
Costs paid as a percentage of a $10,000 investment |
| Invesco Active Allocation Fund (Class R5) |
$ 23 |
0.21 % |
How Did The Fund Perform During The Period?
•
2025 was a year of change, especially in geopolitics. Tariffs dominated headlines, Europe kicked off new defense spending, and the artificial intelligence trade was strong. Despite a year of change, global risk assets rallied and performed well.•
For the fiscal year ended December 31, 2025, Class R5 shares of the Fund returned 15.72%. For the same time period, the Custom Invesco Active Allocation Index (the "Benchmark") returned 18.82%.What contributed to performance?
Asset allocation - Fixed Income |
The Fund's underweight to fixed income relative to the Benchmark was the largest positive contributor to relative return given equities outperformed fixed income.Tactical asset allocation |
The Fund's tactical asset allocation contributed positively to relative performance as the Fund's foreign exchange activity and fixed income derivatives were additive.Asset allocation - Equity |
The Fund's equity exposure relative to the Benchmark was a positive contributor to relative return given equities outperformed the Benchmark.What detracted from performance?
Equity manager selection
|
The Fund's equity manager selection effects were the largest detractors from the Fund's relative performance, with the key detractors being the selection within global and international small and mid-cap equities.Equity style selection |
The Fund's equity style effects detracted from relative performance given the Fund's exposure to US large-cap multifactor and US mid-cap growth equities.Fixed Income manager selection |
The Fund's fixed income manager selection effects detracted from relative performance within core and core plus fixed income.How Has The Fund Historically Performed?
Growth of $10,000 Investment
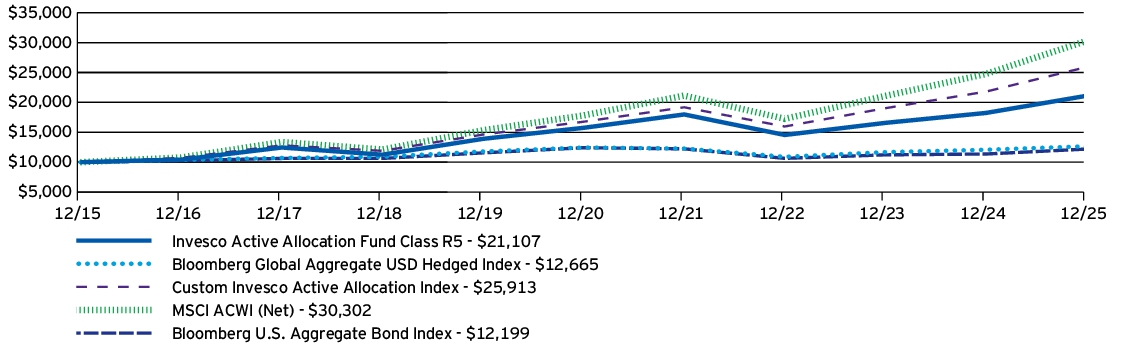
AVERAGE ANNUAL TOTAL RETURNS |
1 Year |
5 Years |
10 Years |
Invesco Active Allocation Fund (Class R5) |
15.72 % |
6.03 % |
7.76 % |
Custom Invesco Active Allocation Index |
18.82 % |
9.09 % |
9.99 % |
Bloomberg Global Aggregate USD Hedged Index |
4.86 % |
0.34 % |
2.39 % |
MSCI ACWI (Net) |
22.34 % |
11.19 % |
11.72 % |
Bloomberg U.S. Aggregate Bond Index |
7.30 % |
-0.36 % |
2.01 % |
invesco.com/performance
for more recent performance information.
What Are Key Statistics About The Fund?
(as of December 31, 2025)
| Fund net assets | $ 1,973,581,259 |
| Total number of portfolio holdings | 24 |
| Total advisory fees paid | $ 1,634,660 |
| Portfolio turnover rate | 32 % |
What Comprised The Fund's Holdings?
(as of December 31, 2025)
Asset allocation
(% of net assets)

How Has The Fund Changed Over The Past Year?
This is a summary of certain changes to the Fund since December 31, 2024. For more complete information, you may review the Fund's prospectus, which is available at
invesco.com/reports
or upon request at (800) 959-4246
.
The Fund added unlisted closed-end interval fund risk to its principal risks to reflect that shares of an underlying unlisted closed-end interval fund in which the Fund may invest are considered an illiquid investment because shareholders (such as the Fund) cannot redeem or sell their shares outside of periodic repurchse offers.
invesco.com/reports
or upon request at (800) 959-4246
.
invesco.com/reports
. You can also request this information by contacting us at (800) 959-4246
.
What Were The Fund Costs For The Last
Year
?
(Based on a hypothetical $10,000 investment)
Fund (Class) |
Costs of a $10,000 investment |
Costs paid as a percentage of a $10,000 investment |
| Invesco Active Allocation Fund (Class R6) |
$ 15 |
0.14 % |
How Did The Fund Perform During The Period?
•
2025 was a year of change, especially in geopolitics. Tariffs dominated headlines, Europe kicked off new defense spending, and the artificial intelligence trade was strong. Despite a year of change, global risk assets rallied and performed well.•
For the fiscal year ended December 31, 2025, Class R6 shares of the Fund returned 15.90%. For the same time period, the Custom Invesco Active Allocation Index (the "Benchmark") returned 18.82%.What contributed to performance?
Asset allocation - Fixed Income |
The Fund's underweight to fixed income relative to the Benchmark was the largest positive contributor to relative return given equities outperformed fixed income.Tactical asset allocation |
The Fund's tactical asset allocation contributed positively to relative performance as the Fund's foreign exchange activity and fixed income derivatives were additive.Asset allocation - Equity |
The Fund's equity exposure relative to the Benchmark was a positive contributor to relative return given equities outperformed the Benchmark.What detracted from performance?
Equity manager selection
|
The Fund's equity manager selection effects were the largest detractors from the Fund's relative performance, with the key detractors being the selection within global and international small and mid-cap equities.Equity style selection |
The Fund's equity style effects detracted from relative performance given the Fund's exposure to US large-cap multifactor and US mid-cap growth equities.Fixed Income manager selection |
The Fund's fixed income manager selection effects detracted from relative performance within core and core plus fixed income.How Has The Fund Historically Performed?
Growth of $10,000 Investment
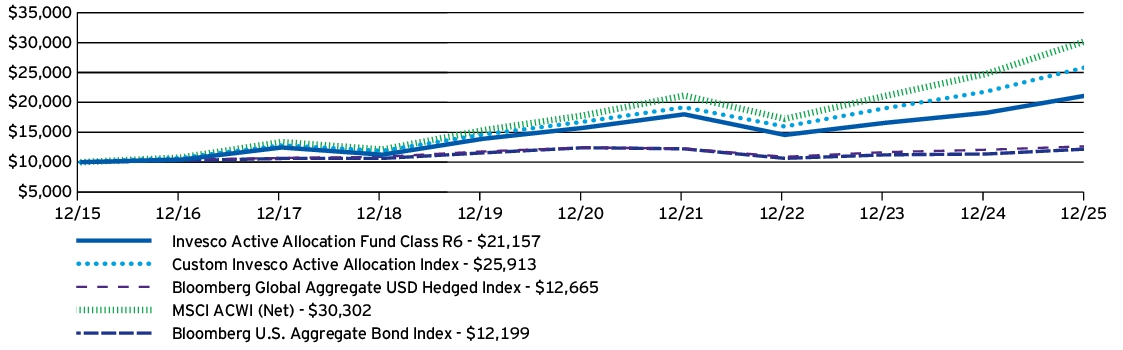
AVERAGE ANNUAL TOTAL RETURNS |
1 Year |
5 Years |
10 Years |
Invesco Active Allocation Fund (Class R6) |
15.90 % |
6.08 % |
7.78 % |
Custom Invesco Active Allocation Index |
18.82 % |
9.09 % |
9.99 % |
Bloomberg Global Aggregate USD Hedged Index |
4.86 % |
0.34 % |
2.39 % |
MSCI ACWI (Net) |
22.34 % |
11.19 % |
11.72 % |
Bloomberg U.S. Aggregate Bond Index |
7.30 % |
-0.36 % |
2.01 % |
invesco.com/performance
for more recent performance information.
What Are Key Statistics About The Fund?
(as of December 31, 2025)
| Fund net assets | $ 1,973,581,259 |
| Total number of portfolio holdings | 24 |
| Total advisory fees paid | $ 1,634,660 |
| Portfolio turnover rate | 32 % |
What Comprised The Fund's Holdings?
(as of December 31, 2025)
Asset allocation
(% of net assets)
How Has The Fund Changed Over The Past Year?
This is a summary of certain changes to the Fund since December 31, 2024. For more complete information, you
ma
y review the Fund's prospectus, which is available at invesco.com/reports
or upon request at (800) 959-4246
.
The Fund added unlisted closed-end interval fund risk to its principal risks to reflect that shares of an underlying unlisted closed-end interval fund in which the Fund may invest are considered an illiquid investment because shareholders (such as the Fund) cannot redeem or sell their shares outside of periodic repurchse offers.
ma
y review the Fund's prospectus, which is available at invesco.com/reports
or upon request at (800) 959-4246
.
invesco.com/reports
. You can also request this information by contacting us at (800) 959-4246
.
What Were The Fund Costs For The Last
Year
?
(Based on a hypothetical $10,000 investment)
Fund (Class) |
Costs of a $10,000 investment |
Costs paid as a percentage of a $10,000 investment |
| Invesco Convertible Securities Fund (Class A) |
$ 103 |
0.95 % |
How Did The Fund Perform During The Period?
•
While 2025 was a year marked by uncertainty, key areas of resilience helped deliver strong returns for risk assets. Economic activity remained stronger than expected in the US and inflation continued to abate despite tariff induced fears of reignition. In this environment, supported by stable credit markets and strong equity performance, convertible securities performed well.•
For the fiscal year ended December 31, 2025, Class A shares of the Fund, excluding sales charge, returned 15.84%. For the same time period, the ICE BofA US Convertible Index returned 17.98%.What contributed to performance?
Seagate HDD Cayman |
Seagate is a leader in mass-capacity data storage. An overweight position in Seagate benefited the Fund as the tech company surged on explosive demand for artificial intelligence-driven data-center storage and expanding margins.AST SpaceMobile, Inc. |
AST SpaceMobile is a publicly traded satellite designer and manufacturer. An overweight position in the company contributed to relative performance as the company reached major deployment milestones and saw growing partnerships in the telecom space.What detracted from performance?
Rocket Lab USA, Inc.
|
Rocket Lab is an end-to-end space company delivering reliable launch services, complete spacecraft design and manufacturing, satellite components, flight software, and more. An underweight position to Rocket Labs hurt the Fund as the company posted strong revenue growth. We exited our position during the period.Bloom Energy Corp. |
Bloom's Energy Server generates power onsite, converting fuels like natural gas, biogas and hydrogen into electricity without combustion. An underweight position to Bloom Energy detracted from relative performance as the energy company saw continued demand growth for its fuel cell solutions.How Has The Fund Historically Performed?
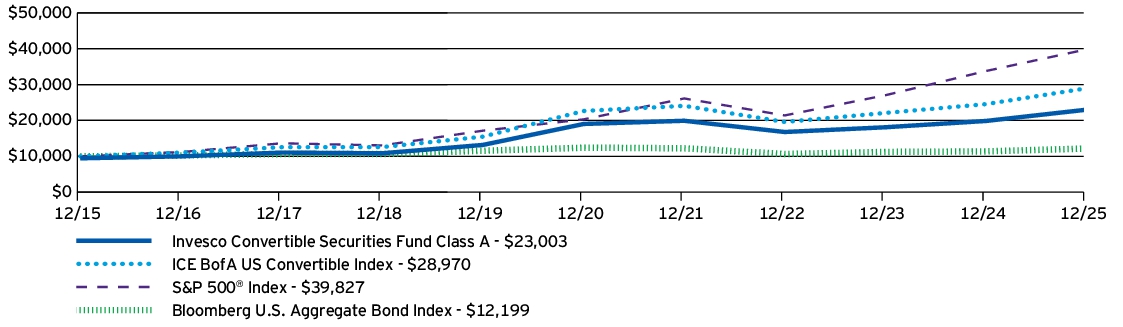
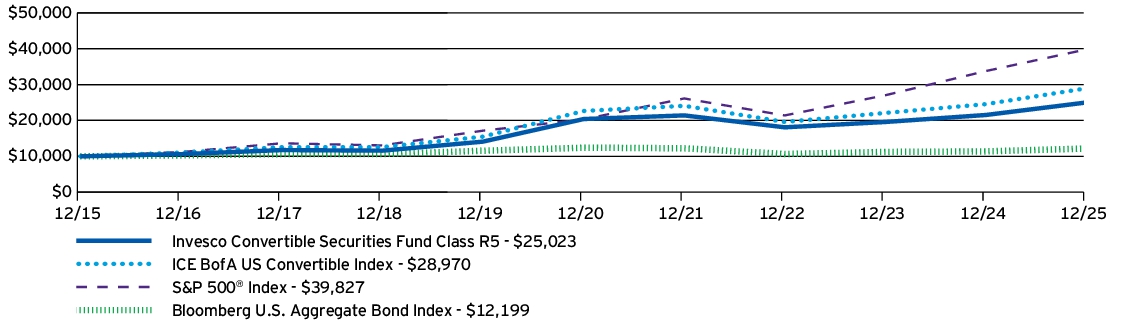
Growth of $10,000 Investment
AVERAGE ANNUAL TOTAL RETURNS |
1 Year |
5 Years |
10 Years |
Invesco Convertible Securities Fund (Class A) —including sales charge |
9.46 % |
2.71 % |
8.69 % |
Invesco Convertible Securities Fund (Class A) —excluding sales charge |
15.84 % |
3.88 % |
9.31 % |
ICE BofA US Convertible Index |
17.98 % |
5.05 % |
11.22 % |
S&P 500 ® Index |
17.88 % |
14.42 % |
14.82 % |
Bloomberg U.S. Aggregate Bond Index |
7.30 % |
-0.36 % |
2.01 % |
invesco.com/performance
for more recent performance information.
What Are Key Statistics About The Fund?
(as of December 31, 2025)
| Fund net assets | $ 720,987,050 |
| Total number of portfolio holdings | 133 |
| Total advisory fees paid | $ 3,741,191 |
| Portfolio turnover rate | 114 % |
What Comprised The Fund's Holdings?
(as of December 31, 2025)
Top ten holdings*
(% of net assets)
| Bank of America Corp., Series L, Conv. Pfd., 7.25% | 3.35 % |
| Boeing Co. (The), Conv. Pfd., 6.00%, 10/15/2027 | 2.84 % |
| Lumentum Holdings, Inc., Conv., 0.38%, 03/15/2032 | 2.38 % |
| Welltower OP LLC, Conv., 3.13%, 07/15/2029 | 2.13 % |
| Cloudflare, Inc., Conv. , 06/15/2030 | 1.87 % |
| Snowflake, Inc., Conv. , 10/01/2029 | 1.66 % |
| Uber Technologies, Inc., Series 2028, Conv., 0.88%, 12/01/2028 | 1.57 % |
| Coinbase Global, Inc., Conv., 0.25%, 04/01/2030 | 1.54 % |
| Live Nation Entertainment, Inc., Conv., 3.13%, 01/15/2029 | 1.51 % |
| Southern Co. (The), Conv., 4.50%, 06/15/2027 | 1.48 % |
| * Excluding money market f un d holdings, if any. |
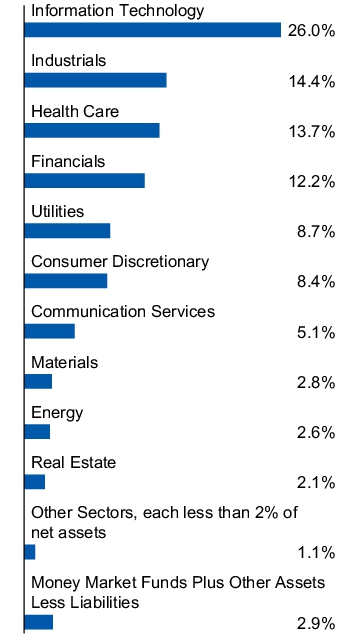
Sector allocation
(% of net assets)

Top ten holdings*
(% of net assets)
| Bank of America Corp., Series L, Conv. Pfd., 7.25% | 3.35 % |
| Boeing Co. (The), Conv. Pfd., 6.00%, 10/15/2027 | 2.84 % |
| Lumentum Holdings, Inc., Conv., 0.38%, 03/15/2032 | 2.38 % |
| Welltower OP LLC, Conv., 3.13%, 07/15/2029 | 2.13 % |
| Cloudflare, Inc., Conv. , 06/15/2030 | 1.87 % |
| Snowflake, Inc., Conv. , 10/01/2029 | 1.66 % |
| Uber Technologies, Inc., Series 2028, Conv., 0.88%, 12/01/2028 | 1.57 % |
| Coinbase Global, Inc., Conv., 0.25%, 04/01/2030 | 1.54 % |
| Live Nation Entertainment, Inc., Conv., 3.13%, 01/15/2029 | 1.51 % |
| Southern Co. (The), Conv., 4.50%, 06/15/2027 | 1.48 % |
| * Excluding money market f un d holdings, if any. |
invesco.com/reports
. You can also request this information by contacting us at (800) 959-4246
.
What Were The Fund Costs For The Last
Year
?
(Based on a hypothetical $10,000 investment)
Fund (Class) |
Costs of a $10,000 investment |
Costs paid as a percentage of a $10,000 investment |
| Invesco Convertible Securities Fund (Class C) |
$ 182 |
1.69 % |
How Did The Fund Perform During The Period?
•
While 2025 was a year marked by uncertainty, key areas of resilience helped deliver strong returns for risk assets. Economic activity remained stronger than expected in the US and inflation continued to abate despite tariff induced fears of reignition. In this environment, supported by stable credit markets and strong equity performance, convertible securities performed well.•
For the fiscal year ended December 31, 2025, Class C shares of the Fund, excluding sales charge, returned 15.01%. For the same time period, the ICE BofA US Convertible Index returned 17.98%.What contributed to performance?
Seagate HDD Cayman |
Seagate is a leader in mass-capacity data storage. An overweight position in Seagate benefited the Fund as the tech company surged on explosive demand for artificial intelligence-driven data-center storage and expanding margins.AST SpaceMobile, Inc. |
AST SpaceMobile is a publicly traded satellite designer and manufacturer. An overweight position in the company contributed to relative performance as the company reached major deployment milestones and saw growing partnerships in the telecom space.What detracted from performance?
Rocket Lab USA, Inc.
|
Rocket Lab is an end-to-end space company delivering reliable launch services, complete spacecraft design and manufacturing, satellite components, flight software, and more. An underweight position to Rocket Labs hurt the Fund as the company posted strong revenue growth. We exited our position during the period.Bloom Energy Corp. |
Bloom's Energy Server generates power onsite, converting fuels like natural gas, biogas and hydrogen into electricity without combustion. An underweight position to Bloom Energy detracted from relative performance as the energy company saw continued demand growth for its fuel cell solutions.How Has The Fund Historically Performed?
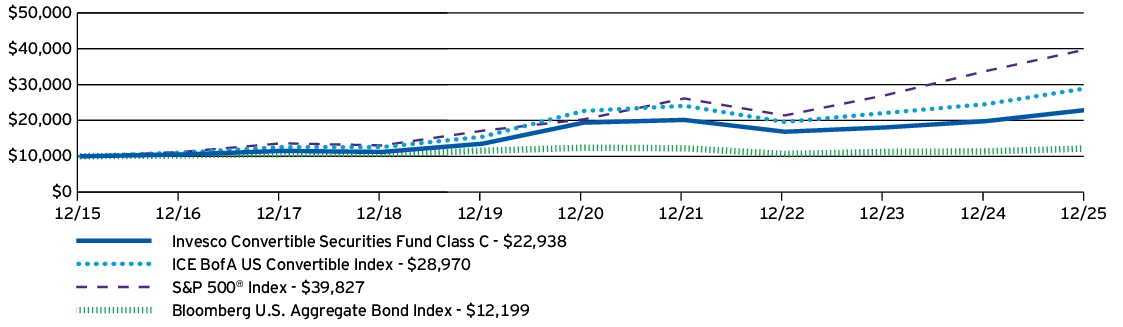
Growth of $10,000 Investment
AVERAGE ANNUAL TOTAL RETURNS |
1 Year |
5 Years |
10 Years |
Invesco Convertible Securities Fund (Class C) —including sales charge |
14.01 % |
3.12 % |
8.66 % |
Invesco Convertible Securities Fund (Class C) —excluding sales charge |
15.01 % |
3.12 % |
8.66 % |
ICE BofA US Convertible Index |
17.98 % |
5.05 % |
11.22 % |
S&P 500 ® Index |
17.88 % |
14.42 % |
14.82 % |
Bloomberg U.S. Aggregate Bond Index |
7.30 % |
-0.36 % |
2.01 % |
invesco.com/performance
for more recent performance information.
What Are Key Statistics About The Fund?
(as of December 31, 2025)
| Fund net assets | $ 720,987,050 |
| Total number of portfolio holdings | 133 |
| Total advisory fees paid | $ 3,741,191 |
| Portfolio turnover rate | 114 % |
What Comprised The Fund's Holdings?
(as of December 31, 2025)
Top ten holdings*
(% of net assets)
| Bank of America Corp., Series L, Conv. Pfd., 7.25% | 3.35 % |
| Boeing Co. (The), Conv. Pfd., 6.00%, 10/15/2027 | 2.84 % |
| Lumentum Holdings, Inc., Conv., 0.38%, 03/15/2032 | 2.38 % |
| Welltower OP LLC, Conv., 3.13%, 07/15/2029 | 2.13 % |
| Cloudflare, Inc., Conv. , 06/15/2030 | 1.87 % |
| Snowflake, Inc., Conv. , 10/01/2029 | 1.66 % |
| Uber Technologies, Inc., Series 2028, Conv., 0.88%, 12/01/2028 | 1.57 % |
| Coinbase Global, Inc., Conv., 0.25%, 04/01/2030 | 1.54 % |
| Live Nation Entertainment, Inc., Conv., 3.13%, 01/15/2029 | 1.51 % |
| Southern Co. (The), Conv., 4.50%, 06/15/2027 | 1.48 % |
| * Excluding money market fund holdings, if any. |
Sector allocation
(% of net assets)
Top ten holdings*
(% of net assets)
| Bank of America Corp., Series L, Conv. Pfd., 7.25% | 3.35 % |
| Boeing Co. (The), Conv. Pfd., 6.00%, 10/15/2027 | 2.84 % |
| Lumentum Holdings, Inc., Conv., 0.38%, 03/15/2032 | 2.38 % |
| Welltower OP LLC, Conv., 3.13%, 07/15/2029 | 2.13 % |
| Cloudflare, Inc., Conv. , 06/15/2030 | 1.87 % |
| Snowflake, Inc., Conv. , 10/01/2029 | 1.66 % |
| Uber Technologies, Inc., Series 2028, Conv., 0.88%, 12/01/2028 | 1.57 % |
| Coinbase Global, Inc., Conv., 0.25%, 04/01/2030 | 1.54 % |
| Live Nation Entertainment, Inc., Conv., 3.13%, 01/15/2029 | 1.51 % |
| Southern Co. (The), Conv., 4.50%, 06/15/2027 | 1.48 % |
| * Excluding money market fund holdings, if any. |
invesco.com/reports
. You can also request this information by contacting us at (800) 959-4246
.
What Were The Fund Costs For The Last
Year
?
(Based on a hypothetical $10,000 investment)
Fund (Class) |
Costs of a $10,000 investment |
Costs paid as a percentage of a $10,000 investment |
| Invesco Convertible Securities Fund (Class Y) |
$ 76 |
0.70 % |
How Did The Fund Perform During The Period?
•
While 2025 was a year marked by uncertainty, key areas of resilience helped deliver strong returns for risk assets. Economic activity remained stronger than expected in the US and inflation continued to abate despite tariff induced fears of reignition. In this environment, supported by stable credit markets and strong equity performance, convertible securities performed well.•
For the fiscal year ended December 31, 2025, Class Y shares of the Fund returned 16.14%. For the same time period, the ICE BofA US Convertible Index returned 17.98%.What contributed to performance?
Seagate HDD Cayman |
Seagate is a leader in mass-capacity data storage. An overweight position in Seagate benefited the Fund as the tech company surged on explosive demand for artificial intelligence-driven data-center storage and expanding margins.AST SpaceMobile, Inc. |
AST SpaceMobile is a publicly traded satellite designer and manufacturer. An overweight position in the company contributed to relative performance as the company reached major deployment milestones and saw growing partnerships in the telecom space.What detracted from performance?
Rocket Lab USA, Inc.
|
Rocket Lab is an end-to-end space company delivering reliable launch services, complete spacecraft design and manufacturing, satellite components, flight software, and more. An underweight position to Rocket Labs hurt the Fund as the company posted strong revenue growth. We exited our position during the period.Bloom Energy Corp. |
Bloom's Energy Server generates power onsite, converting fuels like natural gas, biogas and hydrogen into electricity without combustion. An underweight position to Bloom Energy detracted from relative performance as the energy company saw continued demand growth for its fuel cell solutions.How Has The Fund Historically Performed?
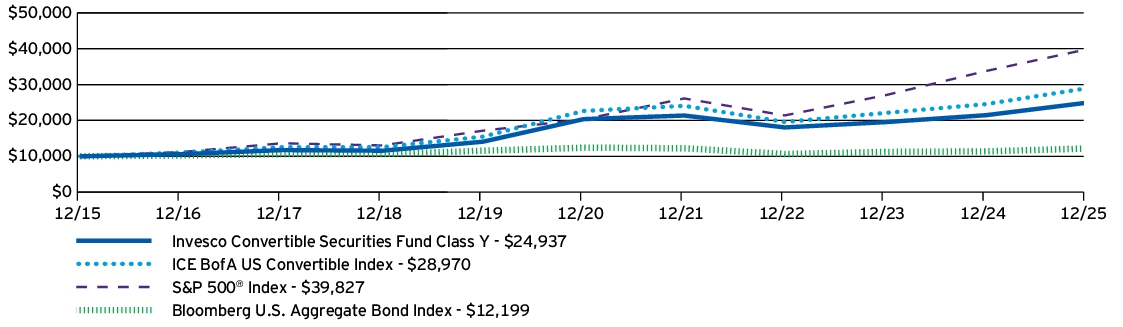
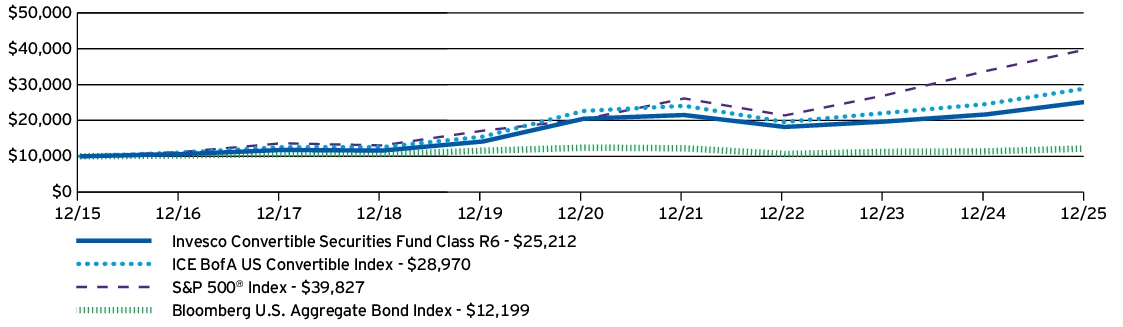
Growth of $10,000 Investment
AVERAGE ANNUAL TOTAL RETURNS |
1 Year |
5 Years |
10 Years |
Invesco Convertible Securities Fund (Class Y) |
16.14 % |
4.13 % |
9.57 % |
ICE BofA US Convertible Index |
17.98 % |
5.05 % |
11.22 % |
S&P 500 ® Index |
17.88 % |
14.42 % |
14.82 % |
Bloomberg U.S. Aggregate Bond Index |
7.30 % |
-0.36 % |
2.01 % |
invesco.com/performance
for more recent performance information.
What Are Key Statistics About The Fund?
(as of December 31, 2025)
| Fund net assets | $ 720,987,050 |
| Total number of portfolio holdings | 133 |
| Total advisory fees paid | $ 3,741,191 |
| Portfolio turnover rate | 114 % |
What Comprised The Fund's Holdings?
(as of December 31, 2025)
Top ten holdings*
(% of net assets)
| Bank of America Corp., Series L, Conv. Pfd., 7.25% | 3.35 % |
| Boeing Co. (The), Conv. Pfd., 6.00%, 10/15/2027 | 2.84 % |
| Lumentum Holdings, Inc., Conv., 0.38%, 03/15/2032 | 2.38 % |
| Welltower OP LLC, Conv., 3.13%, 07/15/2029 | 2.13 % |
| Cloudflare, Inc., Conv. , 06/15/2030 | 1.87 % |
| Snowflake, Inc., Conv. , 10/01/2029 | 1.66 % |
| Uber Technologies, Inc., Series 2028, Conv., 0.88%, 12/01/2028 | 1.57 % |
| Coinbase Global, Inc., Conv., 0.25%, 04/01/2030 | 1.54 % |
| Live Nation Entertainment, Inc., Conv., 3.13%, 01/15/2029 | 1.51 % |
| Southern Co. (The), Conv., 4.50%, 06/15/2027 | 1.48 % |
| * Excluding money market fund holdings, if any. |
Sector allocation
(% of net assets)

Top ten holdings*
(% of net assets)
| Bank of America Corp., Series L, Conv. Pfd., 7.25% | 3.35 % |
| Boeing Co. (The), Conv. Pfd., 6.00%, 10/15/2027 | 2.84 % |
| Lumentum Holdings, Inc., Conv., 0.38%, 03/15/2032 | 2.38 % |
| Welltower OP LLC, Conv., 3.13%, 07/15/2029 | 2.13 % |
| Cloudflare, Inc., Conv. , 06/15/2030 | 1.87 % |
| Snowflake, Inc., Conv. , 10/01/2029 | 1.66 % |
| Uber Technologies, Inc., Series 2028, Conv., 0.88%, 12/01/2028 | 1.57 % |
| Coinbase Global, Inc., Conv., 0.25%, 04/01/2030 | 1.54 % |
| Live Nation Entertainment, Inc., Conv., 3.13%, 01/15/2029 | 1.51 % |
| Southern Co. (The), Conv., 4.50%, 06/15/2027 | 1.48 % |
| * Excluding money market fund holdings, if any. |
invesco.com/reports
. You can also request this information by contacting us at (800) 959-4246
.
What Were The Fund Costs For The Last
Year
?
(Based on a hypothetical $10,000 investment)
Fund (Class) |
Costs of a $10,000 investment |
Costs paid as a percentage of a $10,000 investment |
| Invesco Convertible Securities Fund (Class R5) |
$ 65 |
0.60 % |
How Did The Fund Perform During The Period?
•
While 2025 was a year marked by uncertainty, key areas of resilience helped deliver strong returns for risk assets. Economic activity remained stronger than expected in the US and inflation continued to abate despite tariff induced fears of reignition. In this environment, supported by stable credit markets and strong equity performance, convertible securities performed well.•
For the fiscal year ended December 31, 2025, Class R5 shares of the Fund returned 16.22%. For the same time period, the ICE BofA US Convertible Index returned 17.98%.What contributed to performance?
Seagate HDD Cayman |
Seagate is a leader in mass-capacity data storage. An overweight position in Seagate benefited the Fund as the tech company surged on explosive demand for artificial intelligence-driven data-center storage and expanding margins.AST SpaceMobile, Inc. |
AST SpaceMobile is a publicly traded satellite designer and manufacturer. An overweight position in the company contributed to relative performance as the company reached major deployment milestones and saw growing partnerships in the telecom space.What detracted from performance?
Rocket Lab USA, Inc.
|
Rocket Lab is an end-to-end space company delivering reliable launch services, complete spacecraft design and manufacturing, satellite components, flight software, and more. An underweight position to Rocket Labs hurt the Fund as the company posted strong revenue growth. We exited our position during the period.Bloom Energy Corp. |
Bloom's Energy Server generates power onsite, converting fuels like natural gas, biogas and hydrogen into electricity without combustion. An underweight position to Bloom Energy detracted from relative performance as the energy company saw continued demand growth for its fuel cell solutions.How Has The Fund Historically Performed?
Growth of $10,000 Investment
AVERAGE ANNUAL TOTAL RETURNS |
1 Year |
5 Years |
10 Years |
Invesco Convertible Securities Fund (Class R5) |
16.22 % |
4.18 % |
9.61 % |
ICE BofA US Convertible Index |
17.98 % |
5.05 % |
11.22 % |
S&P 500 ® Index |
17.88 % |
14.42 % |
14.82 % |
Bloomberg U.S. Aggregate Bond Index |
7.30 % |
-0.36 % |
2.01 % |
invesco.com/performance
for more recent performance information.
What Are Key Statistics About The Fund?
(as of December 31, 2025)
| Fund net assets | $ 720,987,050 |
| Total number of portfolio holdings | 133 |
| Total advisory fees paid | $ 3,741,191 |
| Portfolio turnover rate | 114 % |
What Comprised The Fund's Holdings?
(as of December 31, 2025)
Top ten holdings*
(% of net assets)
| Bank of America Corp., Series L, Conv. Pfd., 7.25% | 3.35 % |
| Boeing Co. (The), Conv. Pfd., 6.00%, 10/15/2027 | 2.84 % |
| Lumentum Holdings, Inc., Conv., 0.38%, 03/15/2032 | 2.38 % |
| Welltower OP LLC, Conv., 3.13%, 07/15/2029 | 2.13 % |
| Cloudflare, Inc., Conv. , 06/15/2030 | 1.87 % |
| Snowflake, Inc., Conv. , 10/01/2029 | 1.66 % |
| Uber Technologies, Inc., Series 2028, Conv., 0.88%, 12/01/2028 | 1.57 % |
| Coinbase Global, Inc., Conv., 0.25%, 04/01/2030 | 1.54 % |
| Live Nation Entertainment, Inc., Conv., 3.13%, 01/15/2029 | 1.51 % |
| Southern Co. (The), Conv., 4.50%, 06/15/2027 | 1.48 % |
| * Excluding money market fund holdings, if any. |
Sector allocation
(% of net assets)

Top ten holdings*
(% of net assets)
| Bank of America Corp., Series L, Conv. Pfd., 7.25% | 3.35 % |
| Boeing Co. (The), Conv. Pfd., 6.00%, 10/15/2027 | 2.84 % |
| Lumentum Holdings, Inc., Conv., 0.38%, 03/15/2032 | 2.38 % |
| Welltower OP LLC, Conv., 3.13%, 07/15/2029 | 2.13 % |
| Cloudflare, Inc., Conv. , 06/15/2030 | 1.87 % |
| Snowflake, Inc., Conv. , 10/01/2029 | 1.66 % |
| Uber Technologies, Inc., Series 2028, Conv., 0.88%, 12/01/2028 | 1.57 % |
| Coinbase Global, Inc., Conv., 0.25%, 04/01/2030 | 1.54 % |
| Live Nation Entertainment, Inc., Conv., 3.13%, 01/15/2029 | 1.51 % |
| Southern Co. (The), Conv., 4.50%, 06/15/2027 | 1.48 % |
| * Excluding money market fund holdings, if any. |
invesco.com/reports
. You can also request this information by contacting us at (800) 959-4246
.
What Were The Fund Costs For The Last
Year
?
(Based on a hypothetical $10,000 investment)
Fund (Class) |
Costs of a $10,000 investment |
Costs paid as a percentage of a $10,000 investment |
| Invesco Convertible Securities Fund (Class R6) |
$ 65 |
0.60 % |
How Did The Fund Perform During The Period?
•
While 2025 was a year marked by uncertainty, key areas of resilience helped deliver strong returns for risk assets. Economic activity remained stronger than expected in the US and inflation continued to abate despite tariff induced fears of reignition. In this environment, supported by stable credit markets and strong equity performance, convertible securities performed well.•
For the fiscal year ended December 31, 2025, Class R6 shares of the Fund returned 16.28%. For the same time period, the ICE BofA US Convertible Index returned 17.98%.What contributed to performance?
Seagate HDD Cayman |
Seagate is a leader in mass-capacity data storage. An overweight position in Seagate benefited the Fund as the tech company surged on explosive demand for artificial intelligence-driven data-center storage and expanding margins.AST SpaceMobile, Inc. |
AST SpaceMobile is a publicly traded satellite designer and manufacturer. An overweight position in the company contributed to relative performance as the company reached major deployment milestones and saw growing partnerships in the telecom space.What detracted from performance?
Rocket Lab USA, Inc.
|
Rocket Lab is an end-to-end space company delivering reliable launch services, complete spacecraft design and manufacturing, satellite components, flight software, and more. An underweight position to Rocket Labs hurt the Fund as the company posted strong revenue growth. We exited our position during the period.Bloom Energy Corp. |
Bloom's Energy Server generates power onsite, converting fuels like natural gas, biogas and hydrogen into electricity without combustion. An underweight position to Bloom Energy detracted from relative performance as the energy company saw continued demand growth for its fuel cell solutions.How Has The Fund Historically Performed?
Growth of $10,000 Investment
AVERAGE ANNUAL TOTAL RETURNS |
1 Year |
5 Years |
10 Years |
Invesco Convertible Securities Fund (Class R6) |
16.28 % |
4.25 % |
9.69 % |
ICE BofA US Convertible Index |
17.98 % |
5.05 % |
11.22 % |
S&P 500 ® Index |
17.88 % |
14.42 % |
14.82 % |
Bloomberg U.S. Aggregate Bond Index |
7.30 % |
-0.36 % |
2.01 % |
invesco.com/performance
for more recent performance information.
What Are Key Statistics About The Fund?
(as of December 31, 2025)
| Fund net assets | $ 720,987,050 |
| Total number of portfolio holdings | 133 |
| Total advisory fees paid | $ 3,741,191 |
| Portfolio turnover rate | 114 % |
What Comprised The Fund's Holdings?
(as of December 31, 2025)
Top ten holdings*
(% of net assets)
| Bank of America Corp., Series L, Conv. Pfd., 7.25% | 3.35 % |
| Boeing Co. (The), Conv. Pfd., 6.00%, 10/15/2027 | 2.84 % |
| Lumentum Holdings, Inc., Conv., 0.38%, 03/15/2032 | 2.38 % |
| Welltower OP LLC, Conv., 3.13%, 07/15/2029 | 2.13 % |
| Cloudflare, Inc., Conv. , 06/15/2030 | 1.87 % |
| Snowflake, Inc., Conv. , 10/01/2029 | 1.66 % |
| Uber Technologies, Inc., Series 2028, Conv., 0.88%, 12/01/2028 | 1.57 % |
| Coinbase Global, Inc., Conv., 0.25%, 04/01/2030 | 1.54 % |
| Live Nation Entertainment, Inc., Conv., 3.13%, 01/15/2029 | 1.51 % |
| Southern Co. (The), Conv., 4.50%, 06/15/2027 | 1.48 % |
| * Excluding money market fund holdings, if any. |
Sector allocation
(% of net assets)

Top ten holdings*
(% of net assets)
| Bank of America Corp., Series L, Conv. Pfd., 7.25% | 3.35 % |
| Boeing Co. (The), Conv. Pfd., 6.00%, 10/15/2027 | 2.84 % |
| Lumentum Holdings, Inc., Conv., 0.38%, 03/15/2032 | 2.38 % |
| Welltower OP LLC, Conv., 3.13%, 07/15/2029 | 2.13 % |
| Cloudflare, Inc., Conv. , 06/15/2030 | 1.87 % |
| Snowflake, Inc., Conv. , 10/01/2029 | 1.66 % |
| Uber Technologies, Inc., Series 2028, Conv., 0.88%, 12/01/2028 | 1.57 % |
| Coinbase Global, Inc., Conv., 0.25%, 04/01/2030 | 1.54 % |
| Live Nation Entertainment, Inc., Conv., 3.13%, 01/15/2029 | 1.51 % |
| Southern Co. (The), Conv., 4.50%, 06/15/2027 | 1.48 % |
| * Excluding money market fund holdings, if any. |
invesco.com/reports
. You can also request this information by contacting us at (800) 959-4246
.
What Were The Fund Costs For The Last
Year
?
(Based on a hypothetical $10,000 investment)
Fund (Class) |
Costs of a $10,000 investment |
Costs paid as a percentage of a $10,000 investment |
| Invesco Income Allocation Fund (Class A) |
$ 47 |
0.44 % |
How Did The Fund Perform During The Period?
•
2025 was a year of change, especially in geopolitics. Tariffs dominated headlines, Europe kicked off new defense spending, and the artificial intelligence trade was strong. Despite a year of change, global risk assets rallied and performed well.•
For the fiscal year ended December 31, 2025, Class A shares of the Fund, excluding sales charge, returned 11.63%. For the same time period, the Custom Invesco Income Allocation Index (the "Benchmark") returned 11.04%.What contributed to performance?
Asset allocation - Equity |
The Fund's equity exposure relative to the Benchmark was a positive contributor to relative return given equities outperformed the Benchmark.Asset allocation - Fixed Income |
The Fund's underweight to fixed income relative to the Benchmark was a positive contributor to relative return given equities outperformed fixed income.Equity manager selection |
The Fund's equity manager selection effects were a positive contribution to the Fund's relative performance, with positive manager selection within US value equities.What detracted from performance?
Fixed Income style selection
|
The Fund's fixed income style effects detracted from relative performance given the Fund's exposure to floating rate and core fixed income.Fixed Income manager selection |
The Fund's fixed income manager selection effects detracted from relative performance, specifically within core and core plus fixed income.Asset allocation - Cash |
The Fund's allocation to cash had a negative effect (also known as "cash drag") on the Fund's relative performance, while both the equity and fixed income markets had positive returns.How Has The Fund Historically Performed?
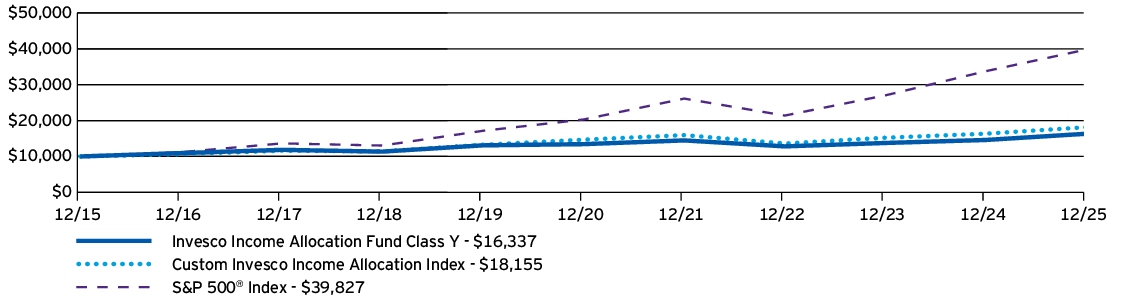
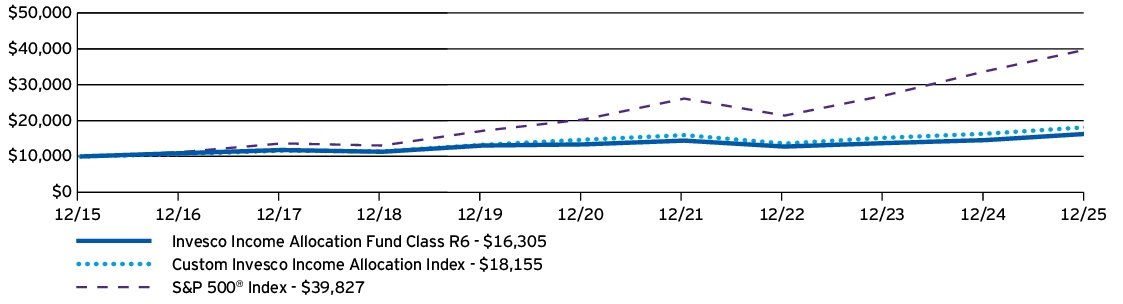
Growth of $10,000 Investment

AVERAGE ANNUAL TOTAL RETURNS |
1 Year |
5 Years |
10 Years |
Invesco Income Allocation Fund (Class A) —including sales charge |
5.52 % |
2.57 % |
4.18 % |
Invesco Income Allocation Fund (Class A) —excluding sales charge |
11.63 % |
3.73 % |
4.77 % |
Custom Invesco Income Allocation Index |
11.04 % |
4.35 % |
6.15 % |
S&P 500 ® Index |
17.88 % |
14.42 % |
14.82 % |
invesco.com/performance
for more recent performance information.
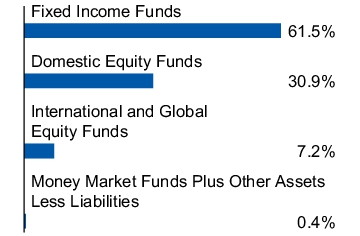
What Are Key Statistics About The Fund?
(as of December 31, 2025)
| Fund net assets | $ 323,845,354 |
| Total number of portfolio holdings | 20 |
| Total advisory fees paid | $ 0 |
| Portfolio turnover rate | 5 % |
What Comprised The Fund's Holdings?
(as of December 31, 2025)
Asset allocation
(% of net assets)

How Has The Fund Changed Over The Past Year?
This is a summary of certain changes to the Fund since December 31, 2024. For more complete information, you may review the Fund's prospectus, which is available at
invesco.com/reports
or upon request at (800) 959-4246
.
The Fund added unlisted closed-end interval fund risk to its principal risks to reflect that shares of an underlying unlisted closed-end interval fund in which the Fund may invest are considered an illiquid investment because shareholders (such as the Fund) cannot redeem or sell their shares outside of periodic repurchse offers.
invesco.com/reports
or upon request at (800) 959-4246
.
invesco.com/reports
. You can also request this information by contacting us at (800) 959-4246
.
What Were The Fund Costs For The Last
Year
?
(Based on a hypothetical $10,000 investment)
Fund (Class) |
Costs of a $10,000 investment |
Costs paid as a percentage of a $10,000 investment |
| Invesco Income Allocation Fund (Class C) |
$ 125 |
1.19 % |
How Did The Fund Perform During The Period?
•
2025 was a year of change, especially in geopolitics. Tariffs dominated headlines, Europe kicked off new defense spending, and the artificial intelligence trade was strong. Despite a year of change, global risk assets rallied and performed well.•
For the fiscal year ended December 31, 2025, Class C shares of the Fund, excluding sales charge, returned 10.68%. For the same time period, the Custom Invesco Income Allocation Index (the "Benchmark") returned 11.04%.What contributed to performance?
Asset allocation - Equity |
The Fund's equity exposure relative to the Benchmark was a positive contributor to relative return given equities outperformed the Benchmark.Asset allocation - Fixed Income |
The Fund's underweight to fixed income relative to the Benchmark was a positive contributor to relative return given equities outperformed fixed income.Equity manager selection |
The Fund's equity manager selection effects were a positive contribution to the Fund's relative performance, with positive manager selection within US value equities.What detracted from performance?
Fixed Income style selection
|
The Fund's fixed income style effects detracted from relative performance given the Fund's exposure to floating rate and core fixed income.Fixed Income manager selection |
The Fund's fixed income manager selection effects detracted from relative performance, specifically within core and core plus fixed income.Asset allocation - Cash |
The Fund's allocation to cash had a negative effect (also known as "cash drag") on the Fund's relative performance, while both the equity and fixed income markets had positive returns.How Has The Fund Historically Performed?
Growth of $10,000 Investment

AVERAGE ANNUAL TOTAL RETURNS |
1 Year |
5 Years |
10 Years |
Invesco Income Allocation Fund (Class C) —including sales charge |
9.68 % |
2.96 % |
4.15 % |
Invesco Income Allocation Fund (Class C) —excluding sales charge |
10.68 % |
2.96 % |
4.15 % |
Custom Invesco Income Allocation Index |
11.04 % |
4.35 % |
6.15 % |
S&P 500 ® Index |
17.88 % |
14.42 % |
14.82 % |
invesco.com/performance
for more recent performance information.
What Are Key Statistics About The Fund?
(as of December 31, 2025)
| Fund net assets | $ 323,845,354 |
| Total number of portfolio holdings | 20 |
| Total advisory fees paid | $ 0 |
| Portfolio turnover rate | 5 % |
What Comprised The Fund's Holdings?
(as of December 31, 2025)
Asset allocation
(% of net assets)

How Has The Fund Changed Over The Past Year?
This is a summary of certain changes to the Fund since December 31, 2024. For more complete information, you may review the Fund's prospectus, which is available at
invesco.com/reports
or upon request at (800) 959-4246
.
The Fund added unlisted closed-end interval fund risk to its principal risks to reflect that shares of an underlying unlisted closed-end interval fund in which the Fund may invest are considered an illiquid investment because shareholders (such as the Fund) cannot redeem or sell their shares outside of periodic repurchse offers.
invesco.com/reports
or upon request at (800) 959-4246
.
invesco.com/reports
. You can also request this information by contacting us at (800) 959-4246
.
What Were The Fund Costs For The Last
Year
?
(Based on a hypothetical $10,000 investment)
Fund (Class) |
Costs of a $10,000 investment |
Costs paid as a percentage of a $10,000 investment |
| Invesco Income Allocation Fund (Class R) |
$ 73 |
0.69 % |
How Did The Fund Perform During The Period?
•
2025 was a year of change, especially in geopolitics. Tariffs dominated headlines, Europe kicked off new defense spending, and the artificial intelligence trade was strong. Despite a year of change, global risk assets rallied and performed well.•
For the fiscal year ended December 31, 2025, Class R shares of the Fund returned 11.34%. For the same time period, the Custom Invesco Income Allocation Index (the "Benchmark") returned 11.04%.What contributed to performance?
Asset allocation - Equity |
The Fund's equity exposure relative to the Benchmark was a positive contributor to relative return given equities outperformed the Benchmark.Asset allocation - Fixed Income |
The Fund's underweight to fixed income relative to the Benchmark was a positive contributor to relative return given equities outperformed fixed income.Equity manager selection |
The Fund's equity manager selection effects were a positive contribution to the Fund's relative performance, with positive manager selection within US value equities.What detracted from performance?
Fixed Income style selection
|
The Fund's fixed income style effects detracted from relative performance given the Fund's exposure to floating rate and core fixed income.Fixed Income manager selection |
The Fund's fixed income manager selection effects detracted from relative performance, specifically within core and core plus fixed income.Asset allocation - Cash |
The Fund's allocation to cash had a negative effect (also known as "cash drag") on the Fund's relative performance, while both the equity and fixed income markets had positive returns.How Has The Fund Historically Performed?
Growth of $10,000 Investment

AVERAGE ANNUAL TOTAL RETURNS |
1 Year |
5 Years |
10 Years |
Invesco Income Allocation Fund (Class R) |
11.34 % |
3.47 % |
4.51 % |
Custom Invesco Income Allocation Index |
11.04 % |
4.35 % |
6.15 % |
S&P 500 ® Index |
17.88 % |
14.42 % |
14.82 % |
invesco.com/performance
for more recent performance information.
What Are Key Statistics About The Fund?
(as of December 31, 2025)
| Fund net assets | $ 323,845,354 |
| Total number of portfolio holdings | 20 |
| Total advisory fees paid | $ 0 |
| Portfolio turnover rate | 5 % |
What Comprised The Fund's Holdings?
(as of December 31, 2025)
Asset allocation
(% of net assets)

How Has The Fund Changed Over The Past Year?
This is a summary of certain changes to the Fund since December 31, 2024. For more complete information, you may review the Fund's prospectus, which is available at
invesco.com/reports
or upon request at (800) 959-4246
.
The Fund added unlisted closed-end interval fund risk to its principal risks to reflect that shares of an underlying unlisted closed-end interval fund in which the Fund may invest are considered an illiquid investment because shareholders (such as the Fund) cannot redeem or sell their shares outside of periodic repurchse offers.
invesco.com/reports
or upon request at (800) 959-4246
.
invesco.com/reports
. You can also request this information by contacting us at (800) 959-4246
.
What Were The Fund Costs For The Last
Year
?
(Based on a hypothetical $10,000 investment)
Fund (Class) |
Costs of a $10,000 investment |
Costs paid as a percentage of a $10,000 investment |
| Invesco Income Allocation Fund (Class Y) |
$ 20 |
0.19 % |
How Did The Fund Perform During The Period?
•
2025 was a year of change, especially in geopolitics. Tariffs dominated headlines, Europe kicked off new defense spending, and the artificial intelligence trade was strong. Despite a year of change, global risk assets rallied and performed well.•
For the fiscal year ended December 31, 2025, Class Y shares of the Fund returned 11.91%. For the same time period, the Custom Invesco Income Allocation Index (the "Benchmark") returned 11.04%.What contributed to performance?
Asset allocation - Equity |
The Fund's equity exposure relative to the Benchmark was a positive contributor to relative return given equities outperformed the Benchmark.Asset allocation - Fixed Income |
The Fund's underweight to fixed income relative to the Benchmark was a positive contributor to relative return given equities outperformed fixed income.Equity manager selection |
The Fund's equity manager selection effects were a positive contribution to the Fund's relative performance, with positive manager selection within US value equities.What detracted from performance?
Fixed Income style selection
|
The Fund's fixed income style effects detracted from relative performance given the Fund's exposure to floating rate and core fixed income.Fixed Income manager selection |
The Fund's fixed income manager selection effects detracted from relative performance, specifically within core and core plus fixed income.Asset allocation - Cash |
The Fund's allocation to cash had a negative effect (also known as "cash drag") on the Fund's relative performance, while both the equity and fixed income markets had positive returns.How Has The Fund Historically Performed?
Growth of $10,000 Investment
AVERAGE ANNUAL TOTAL RETURNS |
1 Year |
5 Years |
10 Years |
Invesco Income Allocation Fund (Class Y) |
11.91 % |
3.99 % |
5.03 % |
Custom Invesco Income Allocation Index |
11.04 % |
4.35 % |
6.15 % |
S&P 500 ® Index |
17.88 % |
14.42 % |
14.82 % |
invesco.com/performance
for more recent performance information.
What Are Key Statistics About The Fund?
(as of December 31, 2025)
| Fund net assets | $ 323,845,354 |
| Total number of portfolio holdings | 20 |
| Total advisory fees paid | $ 0 |
| Portfolio turnover rate | 5 % |
What Comprised The Fund's Holdings?
(as of December 31, 2025)
Asset allocation
(% of net assets)

How Has The Fund Changed Over The Past Year?
This is a summary of certain changes to the Fund since December 31, 2024. For more complete information, you may review the Fund's prospectus, which is available at
invesco.com/reports
or upon request at (800) 959-4246
.
The Fund added unlisted closed-end interval fund risk to its principal risks to reflect that shares of an underlying unlisted closed-end interval fund in which the Fund may invest are considered an illiquid investment because shareholders (such as the Fund) cannot redeem or sell their shares outside of periodic repurchse offers.
invesco.com/reports
or upon request at (800) 959-4246
.
invesco.com/reports
. You can also request this information by contacting us at (800) 959-4246
.
What Were The Fund Costs For The Last
Year
?
(Based on a hypothetical $10,000 investment)
Fund (Class) |
Costs of a $10,000 investment |
Costs paid as a percentage of a $10,000 investment |
| Invesco Income Allocation Fund (Class R5) |
$ 15 |
0.14 % |
How Did The Fund Perform During The Period?
•
2025 was a year of change, especially in geopolitics. Tariffs dominated headlines, Europe kicked off new defense spending, and the artificial intelligence trade was strong. Despite a year of change, global risk assets rallied and performed well.•
For the fiscal year ended December 31, 2025, Class R5 shares of the Fund returned 11.95%. For the same time period, the Custom Invesco Income Allocation Index (the "Benchmark") returned 11.04%.What contributed to performance?
Asset allocation - Equity |
The Fund's equity exposure relative to the Benchmark was a positive contributor to relative return given equities outperformed the Benchmark.Asset allocation - Fixed Income |
The Fund's underweight to fixed income relative to the Benchmark was a positive contributor to relative return given equities outperformed fixed income.Equity manager selection |
The Fund's equity manager selection effects were a positive contribution to the Fund's relative performance, with positive manager selection within US value equities.What detracted from performance?
Fixed Income style selection
|
The Fund's fixed income style effects detracted from relative performance given the Fund's exposure to floating rate and core fixed income.Fixed Income manager selection |
The Fund's fixed income manager selection effects detracted from relative performance, specifically within core and core plus fixed income.Asset allocation - Cash |
The Fund's allocation to cash had a negative effect (also known as "cash drag") on the Fund's relative performance, while both the equity and fixed income markets had positive returns.How Has The Fund Historically Performed?
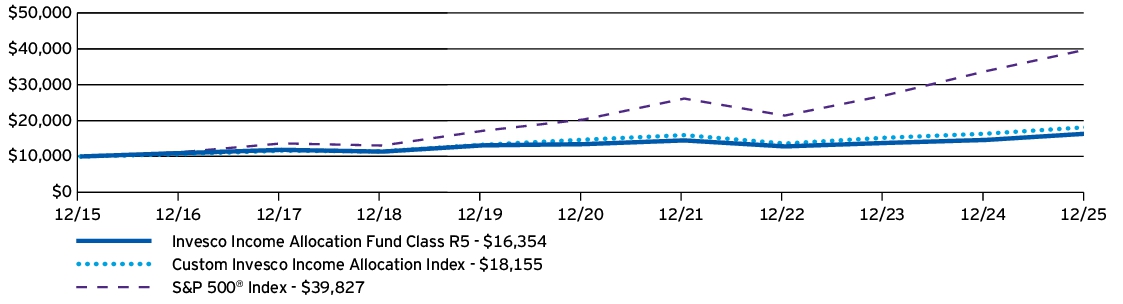
Growth of $10,000 Investment
AVERAGE ANNUAL TOTAL RETURNS |
1 Year |
5 Years |
10 Years |
Invesco Income Allocation Fund (Class R5) |
11.95 % |
4.02 % |
5.04 % |
Custom Invesco Income Allocation Index |
11.04 % |
4.35 % |
6.15 % |
S&P 500 ® Index |
17.88 % |
14.42 % |
14.82 % |
invesco.com/performance
for more recent performance information.
What Are Key Statistics About The Fund?
(as of December 31, 2025)
| Fund net assets | $ 323,845,354 |
| Total number of portfolio holdings | 20 |
| Total advisory fees paid | $ 0 |
| Portfolio turnover rate | 5 % |
What Comprised The Fund's Holdings?
(as of December 31, 2025)
Asset allocation
(% of net assets)
How Has The Fund Changed Over The Past Year?
This is a summary of certain changes to the Fund since December 31, 2024. For more complete information, you may review the Fund's prospectus, which is available at
invesco.com/reports
or upon request at (800) 959-4246
.
The Fund added unlisted closed-end interval fund risk to its principal risks to reflect that shares of an underlying unlisted closed-end interval fund in which the Fund may invest are considered an illiquid investment because shareholders (such as the Fund) cannot redeem or sell their shares outside of periodic repurchse offers.
invesco.com/reports
or upon request at (800) 959-4246
.
invesco.com/reports
. You can also request this information by contacting us at (800) 959-4246
.
What Were The Fund Costs For The Last
Year
?
(Based on a hypothetical $10,000 investment)
Fund (Class) |
Costs of a $10,000 investment |
Costs paid as a percentage of a $10,000 investment |
| Invesco Income Allocation Fund (Class R6) |
$ 11 |
0.10 % |
How Did The Fund Perform During The Period?
•
2025 was a year of change, especially in geopolitics. Tariffs dominated headlines, Europe kicked off new defense spending, and the artificial intelligence trade was strong. Despite a year of change, global risk assets rallied and performed well.•
For the fiscal year ended December 31, 2025, Class R6 shares of the Fund returned 11.92%. For the same time period, the Custom Invesco Income Allocation Index (the "Benchmark") returned 11.04%.What contributed to performance?
Asset allocation - Equity |
The Fund's equity exposure relative to the Benchmark was a positive contributor to relative return given equities outperformed the Benchmark.Asset allocation - Fixed Income |
The Fund's underweight to fixed income relative to the Benchmark was a positive contributor to relative return given equities outperformed fixed income.Equity manager selection |
The Fund's equity manager selection effects were a positive contribution to the Fund's relative performance, with positive manager selection within US value equities.What detracted from performance?
Fixed Income style selection
|
The Fund's fixed income style effects detracted from relative performance given the Fund's exposure to floating rate and core fixed income.Fixed Income manager selection |
The Fund's fixed income manager selection effects detracted from relative performance, specifically within core and core plus fixed income.Asset allocation - Cash |
The Fund's allocation to cash had a negative effect (also known as "cash drag") on the Fund's relative performance, while both the equity and fixed income markets had positive returns.How Has The Fund Historically Performed?
Growth of $10,000 Investment
AVERAGE ANNUAL TOTAL RETURNS |
1 Year |
5 Years |
10 Years |
Invesco Income Allocation Fund (Class R6) |
11.92 % |
4.05 % |
5.01 % |
Custom Invesco Income Allocation Index |
11.04 % |
4.35 % |
6.15 % |
S&P 500 ® Index |
17.88 % |
14.42 % |
14.82 % |
invesco.com/performance
for more recent performance information.
What Are Key Statistics About The Fund?
(as of December 31, 2025)
| Fund net assets | $ 323,845,354 |
| Total number of portfolio holdings | 20 |
| Total advisory fees paid | $ 0 |
| Portfolio turnover rate | 5 % |
What Comprised The Fund's Holdings?
(as of December 31, 2025)
Asset allocation
(% of net assets)

How Has The Fund Changed Over The Past Year?
This is a summary of certain changes to the Fund since December 31, 2024. For more complete information, you may review the Fund's prospectus, which is available at
invesco.com/reports
or upon request at (800) 959-4246
.
The Fund added unlisted closed-end interval fund risk to its principal risks to reflect that shares of an un
derlyin
g unlisted closed-end interval fund in which the Fund may invest are considered an illiquid investment because shareholders (such as the Fund) cannot redeem or sell their shares outside of periodic repurchse offers.derlyin
g unlisted closed-end interval fund in which the Fund may invest are considered an illiquid investment because shareholders (such as the Fund) cannot redeem or sell their shares outside of periodic repurchse offers.
invesco.com/reports
or upon request at (800) 959-4246
.
invesco.com/reports
. You can also request this information by contacting us at (800) 959-4246
.
What Were The Fund Costs For The Last
Year
?
(Based on a hypothetical $10,000 investment)
Fund (Class) | Costs of a $10,000 investment | Costs paid as a percentage of a $10,000 investment |
| Invesco International Diversified Fund (Class A) | $ 46 | 0.42 % |
How Did The Fund Perform During The Period?
•
During the fiscal year ended December 31, 2025, international equity markets were supported by themes tied to artificial intelligence adoption, optimism of moderating inflation in major economies that would lead to more accommodative monetary policies from central banks, and greater fiscal stimulus. •
For the fiscal year ended December 31, 2025, Class A shares of the Fund, excluding sales charge, returned 21.06%. For the same time period, the MSCI ACWI ex USA®
Index (Net) (the "Benchmark") returned 32.39%. The Fund underperformed the Benchmark primarily due to its exposure to certain holdings in the industrials and financials sectors. These results were partially offset by its holdings in energy and consumer staples.What contributed to performance?
Sectors and Geography |
The Fund's stock selection and underweight allocation to the energy and consumer staples sectors contributed positively to relative performance. From a geographical perspective, the Fund's overweight to emerging markets, specifically within Latin America and Asia, contributed positively to relative performance.Underlying Funds |
As of the fiscal year end, the Fund’s portfolio consisted of six underlying funds, all six of which contributed to the Fund's absolute returns. The largest contributors: were Invesco Developing Markets Fund returned 28.84%, contributing 5.34% to absolute return, Invesco International Small-Mid Company Fund returned 17.19%, contributing 5.67% to absolute return, Invesco EQV International Equity Fund returned 16.38%, contributing 3.67% to absolute return, and Invesco International Growth Fund returned 16.29%, contributing 3.91% to absolute return. Invesco International Value Fund and Invesco International Growth Focus ETF also had a positive impact on absolute returns.What detracted from performance?
Sectors and Geography
|
The Fund's underperformance compared to its Benchmark was driven by stock selection in financials and industrials. The Fund's underweight allocation to financials also detracted from relative results. Stock selection in developed markets was the largest detractor from relative results. Style |
The Fund had a growth bias for a majority of the period, which detracted from performance relative to the Benchmark which has more value and cyclical exposure. None of the underlying funds detracted from absolute returns during the reporting period.How Has The Fund Historically Performed?
Growth of $10,000 Investment
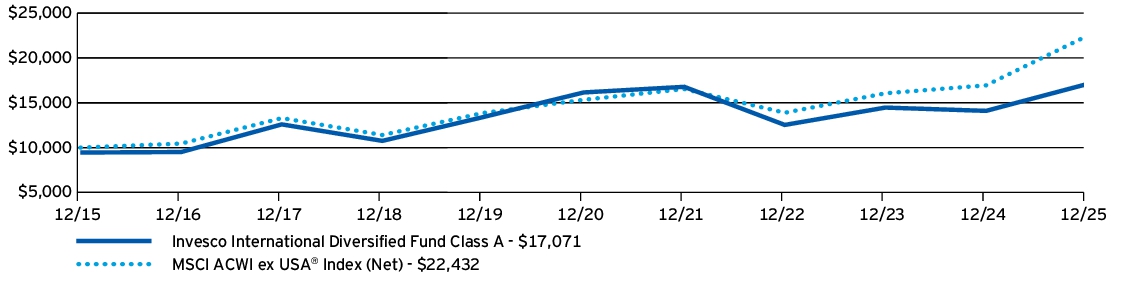
AVERAGE ANNUAL TOTAL RETURNS | 1 Year | 5 Years | 10 Years |
Invesco International Diversified Fund (Class A) —including sales charge | 14.41 % | -0.03 % | 5.49 % |
Invesco International Diversified Fund (Class A) —excluding sales charge | 21.06 % | 1.11 % | 6.09 % |
MSCI ACWI ex USA ® Index (Net) | 32.39 % | 7.91 % | 8.41 % |
share
s.
invesco.com/performance
for more recent performance information.
What Are Key Statistics About The Fund?
(as of December 31, 2025)
| Fund net assets | $ 1,405,030,396 |
| Total number of portfolio holdings | 6 |
| Total advisory fees paid | $ 0 |
| Portfolio turnover rate | 64 % |
What Comprised The Fund's Holdings?
(as of December 31, 2025)
Portfolio composition
(% of total investments)
| Invesco International Value Fund, Class R6 | 37.06 % |
| Invesco Developing Markets Fund, Class R6 | 19.52 |
| Invesco International Small-Mid Company Fund, Class R6 | 14.27 |
| Invesco International Growth Focus ETF | 10.07 |
| Invesco EQV International Equity Fund, Class R6 | 9.54 |
| Invesco International Growth Fund, Class R6 | 9.54 |
invesco.com/reports
. You can also request this information by contacting us at (800) 959-4246
.
What Were The Fund Costs For The Last
Year
?
(Based on a hypothetical $10,000 investment)
Fund (Class) | Costs of a $10,000 investment | Costs paid as a percentage of a $10,000 investment |
| Invesco International Diversified Fund (Class C) | $ 129 | 1.17 % |
How Did The Fund Perform During The Period?
•
During the fiscal year ended December 31, 2025, international equity markets were supported by themes tied to artificial intelligence adoption, optimism of moderating inflation in major economies that would lead to more accommodative monetary policies from central banks, and greater fiscal stimulus. •
For the fiscal year ended December 31, 2025, Class C shares of the Fund, excluding sales charge, returned 20.19%. For the same time period, the MSCI ACWI ex USA®
Index (Net) (the "Benchmark") returned 32.39%. The Fund underperformed the Benchmark primarily due to its exposure to certain holdings in the industrials and financials sectors. These results were partially offset by its holdings in energy and consumer staples.What contributed to performance?
Sectors and Geography |
The Fund's stock selection and underweight allocation to the energy and consumer staples sectors contributed positively to relative performance. From a geographical perspective, the Fund's overweight to emerging markets, specifically within Latin America and Asia, contributed positively to relative performance.Underlying Funds |
As of the fiscal year end, the Fund’s portfolio consisted of six underlying funds, all six of which contributed to the Fund's absolute returns. The largest contributors: were Invesco Developing Markets Fund returned 28.84%, contributing 5.34% to absolute return, Invesco International Small-Mid Company Fund returned 17.19%, contributing 5.67% to absolute return, Invesco EQV International Equity Fund returned 16.38%, contributing 3.67% to absolute return, and Invesco International Growth Fund returned 16.29%, contributing 3.91% to absolute return. Invesco International Value Fund and Invesco International Growth Focus ETF also had a positive impact on absolute returns.What detracted from performance?
Sectors and Geography
|
The Fund's underperformance compared to its Benchmark was driven by stock selection in financials and industrials. The Fund's underweight allocation to financials also detracted from relative results. Stock selection in developed markets was the largest detractor from relative results. Style |
The Fund had a growth bias for a majority of the period, which detracted from performance relative to the Benchmark which has more value and cyclical exposure. None of the underlying funds detracted from absolute returns during the reporting period
.How Has The Fund Historically Performed?
Growth of $10,000 Investment
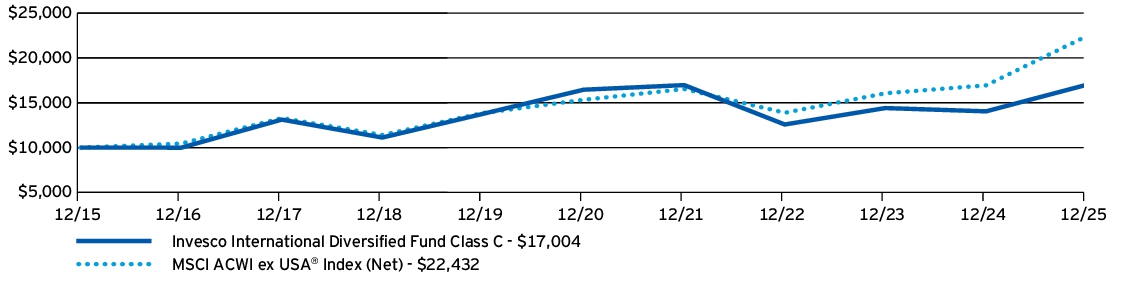
AVERAGE ANNUAL TOTAL RETURNS | 1 Year | 5 Years | 10 Years |
Invesco International Diversified Fund (Class C) —including sales charge | 19.33 % | 0.36 % | 5.45 % |
Invesco International Diversified Fund (Class C) —excluding sales charge | 20.19 % | 0.36 % | 5.45 % |
MSCI ACWI ex USA ® Index (Net) | 32.39 % | 7.91 % | 8.41 % |
invesco.com/performance
for more recent performance information.
What Are Key Statistics About The Fund?
(as of December 31, 2025)
| Fund net assets | $ 1,405,030,396 |
| Total number of portfolio holdings | 6 |
| Total advisory fees paid | $ 0 |
| Portfolio turnover rate | 64 % |
What Comprised The Fund's Holdings?
(as of December 31, 2025)
Portfolio composition
(% of total investments)
| Invesco International Value Fund, Class R6 | 37.06 % |
| Invesco Developing Markets Fund, Class R6 | 19.52 |
| Invesco International Small-Mid Company Fund, Class R6 | 14.27 |
| Invesco International Growth Focus ETF | 10.07 |
| Invesco EQV International Equity Fund, Class R6 | 9.54 |
| Invesco International Growth Fund, Class R6 | 9.54 |
invesco.com/reports
. You can also request this information by contacting us at (800) 959-4246
.
What Were The Fund Costs For The Last
Year
?
(Based on a hypothetical $10,000 investment)
Fund (Class) | Costs of a $10,000 investment | Costs paid as a percentage of a $10,000 investment |
| Invesco International Diversified Fund (Class R) | $ 74 | 0.67 % |
How Did The Fund Perform During The Period?
•
During the fiscal year ended December 31, 2025, international equity markets were supported by themes tied to artificial intelligence adoption, optimism of moderating inflation in major economies that would lead to more accommodative monetary policies from central banks, and greater fiscal stimulus. •
For the fiscal year ended December 31, 2025, Class R shares of the Fund returned 20.90%. For the same time period, the MSCI ACWI ex USA®
Index (Net) (the "Benchmark") returned 32.39%. The Fund underperformed the Benchmark primarily due to its exposure to certain holdings in the industrials and financials sectors. These results were partially offset by its holdings in energy and consumer staples.What contributed to performance?
Sectors and Geography |
The Fund's stock selection and underweight allocation to the energy and consumer staples sectors contributed positively to relative performance. From a geographical perspective, the Fund's overweight to emerging markets, specifically within Latin America and Asia, contributed positively to relative performance.Underlying Funds |
As of the fiscal year end, the Fund’s portfolio consisted of six underlying funds, all six of which contributed to the Fund's absolute returns. The largest contributors: were Invesco Developing Markets Fund returned 28.84%, contributing 5.34% to absolute return, Invesco International Small-Mid Company Fund returned 17.19%, contributing 5.67% to absolute return, Invesco EQV International Equity Fund returned 16.38%, contributing 3.67% to absolute return, and Invesco International Growth Fund returned 16.29%, contributing 3.91% to absolute return. Invesco International Value Fund and Invesco International Growth Focus ETF also had a positive impact on absolute returns.What detracted from performance?
Sectors and Geography
|
The Fund's underperformance compared to its Benchmark was driven by stock selection in financials and industrials. The Fund's underweight allocation to financials also detracted from relative results. Stock selection in developed markets was the largest detractor from relative results. Style |
The Fund had a growth bias for a majority of the period, which detracted from performance relative to the Benchmark which has
more value and cyclical exposure. None of the underlying funds detracted from absolute returns during the reporting period
.How Has The Fund Historically Performed?
Growth of $10,000 Investment
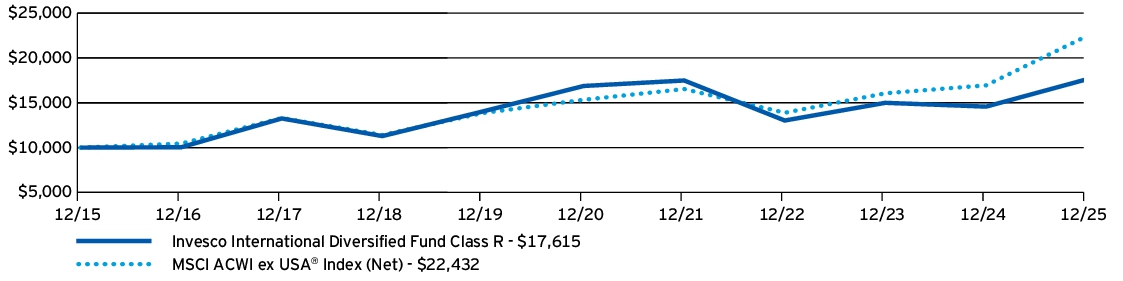
AVERAGE ANNUAL TOTAL RETURNS | 1 Year | 5 Years | 10 Years |
Invesco International Diversified Fund (Class R) | 20.90 % | 0.87 % | 5.82 % |
MSCI ACWI ex USA ® Index (Net) | 32.39 % | 7.91 % | 8.41 % |
invesco.com/performance
for more recent performance information.
What Are Key Statistics About The Fund?
(as of December 31, 2025)
| Fund net assets | $ 1,405,030,396 |
| Total number of portfolio holdings | 6 |
| Total advisory fees paid | $ 0 |
| Portfolio turnover rate | 64 % |
What Comprised The Fund's Holdings?
(as of December 31, 2025)
Portfolio composition
(% of total investments)
| Invesco International Value Fund, Class R6 | 37.06 % |
| Invesco Developing Markets Fund, Class R6 | 19.52 |
| Invesco International Small-Mid Company Fund, Class R6 | 14.27 |
| Invesco International Growth Focus ETF | 10.07 |
| Invesco EQV International Equity Fund, Class R6 | 9.54 |
| Invesco International Growth Fund, Class R6 | 9.54 |
invesco.com/reports
. You can also request this information by contacting us at (800) 959-4246
.
What Were The Fund Costs For The Last
Year
?
(Based on a hypothetical $10,000 investment)
Fund (Class) | Costs of a $10,000 investment | Costs paid as a percentage of a $10,000 investment |
| Invesco International Diversified Fund (Class Y) | $ 19 | 0.17 % |
How Did The Fund Perform During The Period?
•
During the fiscal year ended December 31, 2025, international equity markets were supported by themes tied to artificial intelligence adoption, optimism of moderating inflation in major economies that would lead to more accommodative monetary policies from central banks, and greater fiscal stimulus. •
For the fiscal year ended December 31, 2025, Class Y shares of the Fund returned 21.37%. For the same time period, the MSCI ACWI ex USA®
Index (Net) (the "Benchmark") returned 32.39%. The Fund underperformed the Benchmark primarily due to its exposure to certain holdings in the industrials and financials sectors. These results were partially offset by its holdings in energy and consumer staples.What contributed to performance?
Sectors and Geography |
The Fund's stock selection and underweight allocation to the energy and consumer staples sectors contributed positively to relative performance. From a geographical perspective, the Fund's overweight to emerging markets, specifically within Latin America and Asia, contributed positively to relative performance.Underlying Funds |
As of the fiscal year end, the Fund’s portfolio consisted of six underlying funds, all six of which contributed to the Fund's absolute returns. The largest contributors: were Invesco Developing Markets Fund returned 28.84%, contributing 5.34% to absolute return, Invesco International Small-Mid Company Fund returned 17.19%, contributing 5.67% to absolute return, Invesco EQV International Equity Fund returned 16.38%, contributing 3.67% to absolute return, and Invesco International Growth Fund returned 16.29%, contributing 3.91% to absolute return. Invesco International Value Fund and Invesco International Growth Focus ETF also had a positive impact on absolute returns.What detracted from performance?
Sectors and Geography
|
The Fund's underperformance compared to its Benchmark was driven by stock selection in financials and industrials. The Fund's underweight allocation to financials also detracted from relative results. Stock selection in developed markets was the largest detractor from relative results. Style |
The Fund had a growth bias for a majority of the period, which detracted from performance relative to the Benchmark which has
more value and cyclical exposure. None of the underlying funds detracted from absolute returns during the reporting period.How Has The Fund Historically Performed?
Growth of $10,000 Investment
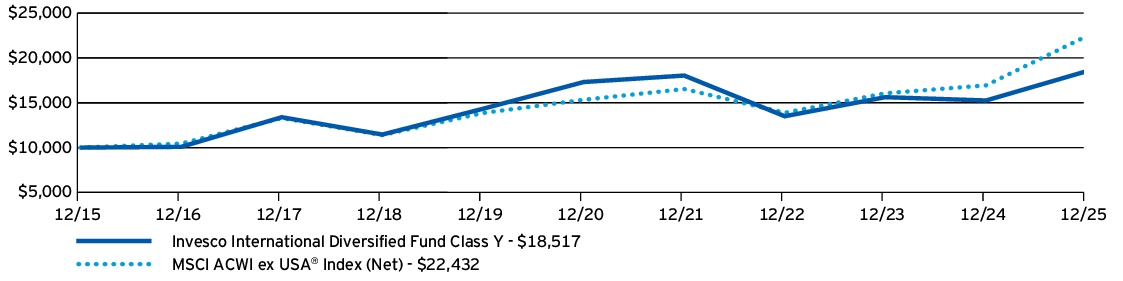
AVERAGE ANNUAL TOTAL RETURNS | 1 Year | 5 Years | 10 Years |
Invesco International Diversified Fund (Class Y) | 21.37 % | 1.35 % | 6.35 % |
MSCI ACWI ex USA ® Index (Net) | 32.39 % | 7.91 % | 8.41 % |
invesco.com/performance
for more recent performance information.
What Are Key Statistics About The Fund?
(as of December 31, 2025)
| Fund net assets | $ 1,405,030,396 |
| Total number of portfolio holdings | 6 |
| Total advisory fees paid | $ 0 |
| Portfolio turnover rate | 64 % |
What Comprised The Fund's Holdings?
(as of December 31, 2025)
Portfolio composition
(% of total investments)
| Invesco International Value Fund, Class R6 | 37.06 % |
| Invesco Developing Markets Fund, Class R6 | 19.52 |
| Invesco International Small-Mid Company Fund, Class R6 | 14.27 |
| Invesco International Growth Focus ETF | 10.07 |
| Invesco EQV International Equity Fund, Class R6 | 9.54 |
| Invesco International Growth Fund, Class R6 | 9.54 |
invesco.com/reports
. You can also request this information by contacting us at (800) 959-4246
.
What Were The Fund Costs For The Last
Year
?
(Based on a hypothetical $10,000 investment)
Fund (Class) | Costs of a $10,000 investment | Costs paid as a percentage of a $10,000 investment |
| Invesco International Diversified Fund (Class R5) | $ 14 | 0.13 % |
How Did The Fund Perform During The Period?
•
During the fiscal year ended December 31, 2025, international equity markets were supported by themes tied to artificial intelligence adoption, optimism of moderating inflation in major economies that would lead to more accommodative monetary policies from central banks, and greater fiscal stimulus. •
For the fiscal year ended December 31, 2025, Class R5 shares of the Fund returned 21.27%. For the same time period, the MSCI ACWI ex USA®
Index (Net) (the "Benchmark") returned 32.39%. The Fund underperformed the Benchmark primarily due to its exposure to certain holdings in the industrials and financials sectors. These results were partially offset by its holdings in energy and consumer staples.What contributed to performance?
Sectors and Geography |
The Fund's stock selection and underweight allocation to the energy and consumer staples sectors contributed positively to relative performance. From a geographical perspective, the Fund's overweight to emerging markets, specifically within Latin America and Asia, contributed positively to relative performance.Underlying Funds |
As of the fiscal year end, the Fund’s portfolio consisted of six underlying funds, all six of which contributed to the Fund's absolute returns. The largest contributors: were Invesco Developing Markets Fund returned 28.84%, contributing 5.34% to absolute return, Invesco International Small-Mid Company Fund returned 17.19%, contributing 5.67% to absolute return, Invesco EQV International Equity Fund returned 16.38%, contributing 3.67% to absolute return, and Invesco International Growth Fund returned 16.29%, contributing 3.91% to absolute return. Invesco International Value Fund and Invesco International Growth Focus ETF also had a positive impact on absolute returns.What detracted from performance?
Sectors and Geography
|
The Fund's underperformance compared to its Benchmark was driven by stock selection in financials and industrials. The Fund's underweight allocation to financials also detracted from relative results. Stock selection in developed markets was the largest detractor from relative results. Style |
The Fund had a growth bias for a majority of the period, which detracted from performance relative to the Benchmark which has
more value and cyclical exposure. None of the underlying funds detracted from absolute returns during the reporting period.How Has The Fund Historically Performed?
Growth of $10,000 Investment

AVERAGE ANNUAL TOTAL RETURNS | 1 Year | 5 Years | 10 Years |
Invesco International Diversified Fund (Class R5) | 21.27 % | 1.41 % | 6.31 % |
MSCI ACWI ex USA ® Index (Net) | 32.39 % | 7.91 % | 8.41 % |
invesco.com/performance
for more recent performance information.
What Are Key Statistics About The Fund?
(as of December 31, 2025)
| Fund net assets | $ 1,405,030,396 |
| Total number of portfolio holdings | 6 |
| Total advisory fees paid | $ 0 |
| Portfolio turnover rate | 64 % |
What Comprised The Fund's Holdings?
(as of December 31, 2025)
Portfolio composition
(% of total investments)
| Invesco International Value Fund, Class R6 | 37.06 % |
| Invesco Developing Markets Fund, Class R6 | 19.52 |
| Invesco International Small-Mid Company Fund, Class R6 | 14.27 |
| Invesco International Growth Focus ETF | 10.07 |
| Invesco EQV International Equity Fund, Class R6 | 9.54 |
| Invesco International Growth Fund, Class R6 | 9.54 |
invesco.com/reports
. You can also request this information by contacting us at (800) 959-4246
.
What Were The Fund Costs For The Last
Year
?
(Based on a hypothetical $10,000 investment)
Fund (Class) | Costs of a $10,000 investment | Costs paid as a percentage of a $10,000 investment |
| Invesco International Diversified Fund (Class R6) | $ 7 | 0.06 % |
How Did The Fund Perform During The Period?
•
During the fiscal year ended December 31, 2025, international equity markets were supported by themes tied to artificial intelligence adoption, optimism of moderating inflation in major economies that would lead to more accommodative monetary policies from central banks, and greater fiscal stimulus. •
For the fiscal year ended December 31, 2025, Class R6 shares of the Fund returned 21.54%. For the same time period, the MSCI ACWI ex USA®
Index (Net) (the "Benchmark") returned 32.39%. The Fund underperformed the Benchmark primarily due to its exposure to certain holdings in the industrials and financials sectors. These results were partially offset by its holdings in energy and consumer staples.What contributed to performance?
Sectors and Geography |
The Fund's stock selection and underweight allocation to the energy and consumer staples sectors contributed positively to relative performance. From a geographical perspective, the Fund's overweight to emerging markets, specifically within Latin America and Asia, contributed positively to relative performance.Underlying Funds |
As of the fiscal year end, the Fund’s portfolio consisted of six underlying funds, all six of which contributed to the Fund's absolute returns. The largest contributors: were Invesco Developing Markets Fund returned 28.84%, contributing 5.34% to absolute return, Invesco International Small-Mid Company Fund returned 17.19%, contributing 5.67% to absolute return, Invesco EQV International Equity Fund returned 16.38%, contributing 3.67% to absolute return, and Invesco International Growth Fund returned 16.29%, contributing 3.91% to absolute return. Invesco International Value Fund and Invesco International Growth Focus ETF also had a positive impact on absolute returns.What detracted from performance?
Sectors and Geography
|
The Fund's underperformance compared to its Benchmark was driven by stock selection in financials and industrials. The Fund's underweight allocation to financials also detracted from relative results. Stock selection in developed markets was the largest detractor from relative results. Style |
The Fund had a growth bias for a majority of the period, which detracted from performance relative to the Benchmark which has
more value and cyclical exposure. None of the underlying funds detracted from absolute returns during the reporting period.How Has The Fund Historically Performed?
Growth of $10,000 Investment
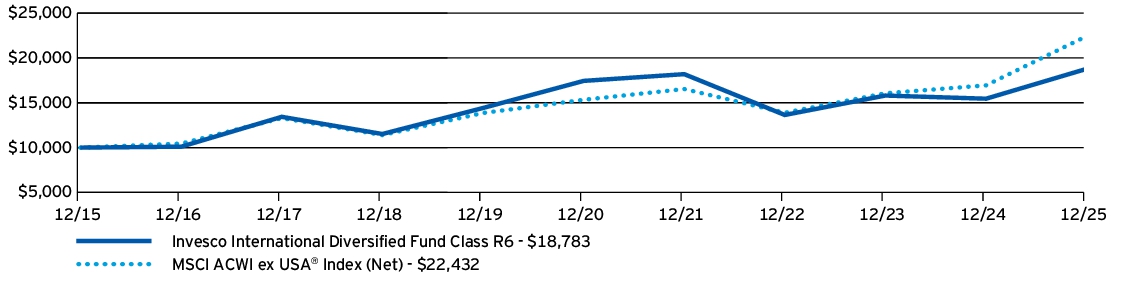
AVERAGE ANNUAL TOTAL RETURNS | 1 Year | 5 Years | 10 Years |
Invesco International Diversified Fund (Class R6) | 21.54 % | 1.50 % | 6.51 % |
MSCI ACWI ex USA ® Index (Net) | 32.39 % | 7.91 % | 8.41 % |
invesco.com/performance
for more recent performance information.
What Are Key Statistics About The Fund?
(as of December 31, 2025)
| Fund net assets | $ 1,405,030,396 |
| Total number of portfolio holdings | 6 |
| Total advisory fees paid | $ 0 |
| Portfolio turnover rate | 64 % |
What Comprised The Fund's Holdings?
(as of December 31, 2025)
Portfolio composition
(% of total investments)
| Invesco International Value Fund, Class R6 | 37.06 % |
| Invesco Developing Markets Fund, Class R6 | 19.52 |
| Invesco International Small-Mid Company Fund, Class R6 | 14.27 |
| Invesco International Growth Focus ETF | 10.07 |
| Invesco EQV International Equity Fund, Class R6 | 9.54 |
| Invesco International Growth Fund, Class R6 | 9.54 |
®
(the “Fund”) for the period January 1, 2025 to December 31, 2025.
invesco.com/reports
. You can also request this information by contacting us at (800) 959-4246
.
What Were The Fund Costs For The Last
Year
?
(Based on a hypothetical $10,000 investment)
Fund (Class) |
Costs of a $10,000 investment |
Costs paid as a percentage of a $10,000 investment |
| Invesco Main Street Mid Cap Fund ® (Class A) |
$ 109 |
1.04 % |
How Did The Fund Perform During The Period?
•
During the fiscal year ended December 31, 2025, US equities reached record highs despite volatility, driven by enthusiasm for artificial intelligence, easing trade concerns and the Federal Reserve's move to cut interest rates. •
For the fiscal year ended December 31, 2025, Class A shares of the Fund, excluding sales charge, returned 8.92%. For the same time period, the Russell Midcap®
Index (the "Benchmark") returned 10.60%. The Fund underperformed the Benchmark mainly as a result of stock selection in the information technology, consumer staples and financials sectors. Stronger stock selection in the health care, industrials and real estate sectors partially offset these results.What contributed to performance?
MongoDB, Inc. |
MongoDB is a software company providing a general-purpose database platform. MongoDB delivered robust results, as its cloud revenue growth accelerated and exceeded investor expectations.ATI, Inc. |
ATI produces specialty materials for global industrial and aerospace markets. ATI consistently exceeded earnings expectations and raised future earnings guidance during the period. Strong aerospace demand, particularly for jet engines, drove growth and provided promising future order visibility. What detracted from performance?
BellRing Brands, Inc.
|
BellRing Brands develops and markets protein-based products. BellRing Brands declined as competitive pressures and slowing sales weighed on performance. Despite beating earnings expectations early in the year, heightened rivalry in the protein shake category challenged BellRing Brands' ability to sustain its growth trajectory. We sold the holding during the fiscal year. The Trade Desk, Inc. |
The Trade Desk is a cloud-based platform for buying and optimizing digital ads across channels. The Trade Desk lagged as earnings came in below expectations and growth slowed amid industry headwinds. A mid-year reorganization impacted execution, while competitive pressures in connected TV further challenged performance. We sold the holding during the fiscal year. How Has The Fund Historically Performed?
Growth of $10,000 Investment
AVERAGE ANNUAL TOTAL RETURNS |
1 Year |
5 Years |
10 Years |
Invesco Main Street Mid Cap Fund ® (Class A) —including sales charge |
2.94 % |
7.77 % |
9.12 % |
Invesco Main Street Mid Cap Fund ® (Class A) —excluding sales charge |
8.92 % |
8.99 % |
9.73 % |
Russell Midcap ® Index |
10.60 % |
8.67 % |
11.01 % |
S&P 500 ® Index |
17.88 % |
14.42 % |
14.82 % |
invesco.com/performance
for more recent performance information.
What Are Key Statistics About The Fund?
(as of December 31, 2025)
| Fund net assets | $ 2,482,228,856 |
| Total number of portfolio holdings | 98 |
| Total advisory fees paid | $ 15,360,369 |
| Portfolio turnover rate | 44 % |
What Comprised The Fund's Holdings?
(as of December 31, 2025)
Top ten holdings*
(% of net assets)
| MongoDB, Inc. | 2.01 % |
| Raymond James Financial, Inc. | 1.78 % |
| Royal Caribbean Cruises Ltd. | 1.76 % |
| Howmet Aerospace, Inc. | 1.74 % |
| First Industrial Realty Trust, Inc. | 1.57 % |
| PPL Corp. | 1.52 % |
| Wintrust Financial Corp. | 1.49 % |
| Sysco Corp. | 1.43 % |
| American Healthcare REIT, Inc. | 1.43 % |
| Permian Resources Corp. | 1.43 % |
| * Excluding money market fund holdings, if any. |
Sector allocation
(% of net assets)

Top ten holdings*
(% of net assets)
| MongoDB, Inc. | 2.01 % |
| Raymond James Financial, Inc. | 1.78 % |
| Royal Caribbean Cruises Ltd. | 1.76 % |
| Howmet Aerospace, Inc. | 1.74 % |
| First Industrial Realty Trust, Inc. | 1.57 % |
| PPL Corp. | 1.52 % |
| Wintrust Financial Corp. | 1.49 % |
| Sysco Corp. | 1.43 % |
| American Healthcare REIT, Inc. | 1.43 % |
| Permian Resources Corp. | 1.43 % |
| * Excluding money market fund holdings, if any. |
®
(the “Fund”) for the period January 1, 2025 to December 31, 2025.
invesco.com/reports
. You can also request this information by contacting us at (800) 959-4246
.
What Were The Fund Costs For The Last
Year
?
(Based on a hypothetical $10,000 investment)
Fund (Class) |
Costs of a $10,000 investment |
Costs paid as a percentage of a $10,000 investment |
| Invesco Main Street Mid Cap Fund ® (Class C) |
$ 187 |
1.80 % |
How Did The Fund Perform During The Period?
•
During the fiscal year ended December 31, 2025, US equities reached record highs despite volatility, driven by enthusiasm for artificial intelligence, easing trade concerns and the Federal Reserve's move to cut interest rates. •
For the fiscal year ended December 31, 2025, Class C shares of the Fund, excluding sales charge, returned 8.06%. For the same time period, the Russell Midcap®
Index (the "Benchmark") returned 10.60%. The Fund underperformed the Benchmark mainly as a result of stock selection in the information technology, consumer staples and financials sectors. Stronger stock selection in the health care, industrials and real estate sectors partially offset these results.What contributed to performance?
MongoDB, Inc. |
MongoDB is a software company providing a general-purpose database platform. MongoDB delivered robust results, as its cloud revenue growth accelerated and exceeded investor expectations.ATI, Inc. |
ATI produces specialty materials for global industrial and aerospace markets. ATI consistently exceeded earnings expectations and raised future earnings guidance during the period. Strong aerospace demand, particularly for jet engines, drove growth and provided promising future order visibility. What detracted from performance?
BellRing Brands, Inc.
|
BellRing Brands develops and markets protein-based products. BellRing Brands declined as competitive pressures and slowing sales weighed on performance. Despite beating earnings expectations early in the year, heightened rivalry in the protein shake category challenged BellRing Brands' ability to sustain its growth trajectory. We sold the holding during the fiscal year. The Trade Desk, Inc. |
The Trade Desk is a cloud-based platform for buying and optimizing digital ads across channels. The Trade Desk lagged as earnings came in below expectations and growth slowed amid industry headwinds. A mid-year reorganization impacted execution, while competitive pressures in connected TV further challenged performance. We sold the holding during the fiscal year. How Has The Fund Historically Performed?
Growth of $10,000 Investment
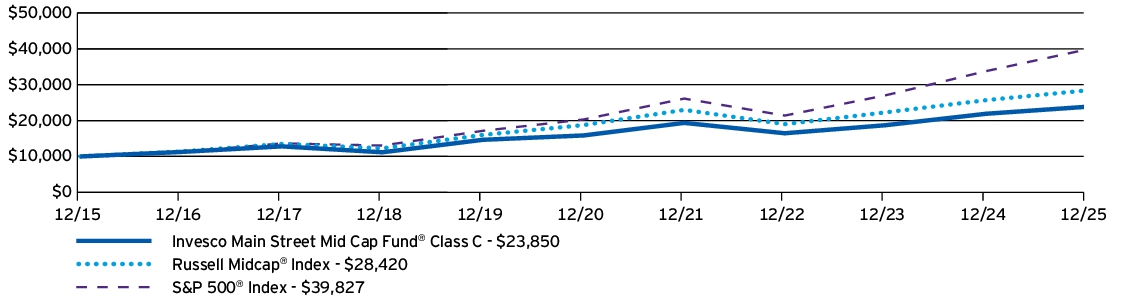
AVERAGE ANNUAL TOTAL RETURNS |
1 Year |
5 Years |
10 Years |
Invesco Main Street Mid Cap Fund ® (Class C) —including sales charge |
7.11 % |
8.17 % |
9.08 % |
Invesco Main Street Mid Cap Fund ® (Class C) —excluding sales charge |
8.06 % |
8.17 % |
9.08 % |
Russell Midcap ® Index |
10.60 % |
8.67 % |
11.01 % |
S&P 500 ® Index |
17.88 % |
14.42 % |
14.82 % |
invesco.com/performance
for more recent performance information.
What Are Key Statistics About The Fund?
(as of December 31, 2025)
| Fund net assets | $ 2,482,228,856 |
| Total number of portfolio holdings | 98 |
| Total advisory fees paid | $ 15,360,369 |
| Portfolio turnover rate | 44 % |
What Comprised The Fund's Holdings?
(as of December 31, 2025)
Top ten holdings*
(% of net assets)
| MongoDB, Inc. | 2.01 % |
| Raymond James Financial, Inc. | 1.78 % |
| Royal Caribbean Cruises Ltd. | 1.76 % |
| Howmet Aerospace, Inc. | 1.74 % |
| First Industrial Realty Trust, Inc. | 1.57 % |
| PPL Corp. | 1.52 % |
| Wintrust Financial Corp. | 1.49 % |
| Sysco Corp. | 1.43 % |
| American Healthcare REIT, Inc. | 1.43 % |
| Permian Resources Corp. | 1.43 % |
| * Excluding money market fund holdings, if any. |
Sector allocation
(% of net assets)

Top ten holdings*
(% of net assets)
| MongoDB, Inc. | 2.01 % |
| Raymond James Financial, Inc. | 1.78 % |
| Royal Caribbean Cruises Ltd. | 1.76 % |
| Howmet Aerospace, Inc. | 1.74 % |
| First Industrial Realty Trust, Inc. | 1.57 % |
| PPL Corp. | 1.52 % |
| Wintrust Financial Corp. | 1.49 % |
| Sysco Corp. | 1.43 % |
| American Healthcare REIT, Inc. | 1.43 % |
| Permian Resources Corp. | 1.43 % |
| * Excluding money market fund holdings, if any. |
®
(the “Fund”) for the period January 1, 2025 to December 31, 2025.
invesco.com/reports
. You can also request this information by contacting us at (800) 959-4246
.
What Were The Fund Costs For The Last
Year
?
(Based on a hypothetical $10,000 investment)
Fund (Class) |
Costs of a $10,000 investment |
Costs paid as a percentage of a $10,000 investment |
| Invesco Main Street Mid Cap Fund ® (Class R) |
$ 136 |
1.30 % |
How Did The Fund Perform During The Period?
•
During the fiscal year ended December 31, 2025, US equities reached record highs despite volatility, driven by enthusiasm for artificial intelligence, easing trade concerns and the Federal Reserve's move to cut interest rates. •
For the fiscal year ended December 31, 2025, Class R shares of the Fund returned 8.64%. For the same time period, the Russell Midcap®
Index (the "Benchmark") returned 10.60%. The Fund underperformed the Benchmark mainly as a result of stock selection in the information technology, consumer staples and financials sectors. Stronger stock selection in the health care, industrials and real estate sectors partially offset these results.What contributed to performance?
MongoDB, Inc. |
MongoDB is a software company providing a general-purpose database platform. MongoDB delivered robust results, as its cloud revenue growth accelerated and exceeded investor expectations.ATI, Inc. |
ATI produces specialty materials for global industrial and aerospace markets. ATI consistently exceeded earnings expectations and raised future earnings guidance during the period. Strong aerospace demand, particularly for jet engines, drove growth and provided promising future order visibility. What detracted from performance?
BellRing Brands, Inc.
|
BellRing Brands develops and markets protein-based products. BellRing Brands declined as competitive pressures and slowing sales weighed on performance. Despite beating earnings expectations early in the year, heightened rivalry in the protein shake category challenged BellRing Brands' ability to sustain its growth trajectory. We sold the holding during the fiscal year. The Trade Desk, Inc. |
The Trade Desk is a cloud-based platform for buying and optimizing digital ads across channels. The Trade Desk lagged as earnings came in below expectations and growth slowed amid industry headwinds. A mid-year reorganization impacted execution, while competitive pressures in connected TV further challenged performance. We sold the holding during the fiscal year. How Has The Fund Historically Performed?
Growth of $10,000 Investment
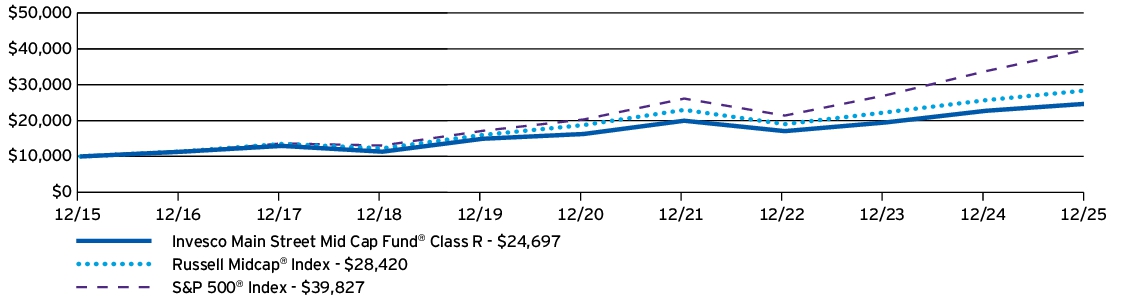
AVERAGE ANNUAL TOTAL RETURNS |
1 Year |
5 Years |
10 Years |
Invesco Main Street Mid Cap Fund ® (Class R) |
8.64 % |
8.72 % |
9.46 % |
Russell Midcap ® Index |
10.60 % |
8.67 % |
11.01 % |
S&P 500 ® Index |
17.88 % |
14.42 % |
14.82 % |
invesco.com/performance
for more recent performance information.
What Are Key Statistics About The Fund?
(as of December 31, 2025)
| Fund net assets | $ 2,482,228,856 |
| Total number of portfolio holdings | 98 |
| Total advisory fees paid | $ 15,360,369 |
| Portfolio turnover rate | 44 % |
What Comprised The Fund's Holdings?
(as of December 31, 2025)
Top ten holdings*
(% of net assets)
| MongoDB, Inc. | 2.01 % |
| Raymond James Financial, Inc. | 1.78 % |
| Royal Caribbean Cruises Ltd. | 1.76 % |
| Howmet Aerospace, Inc. | 1.74 % |
| First Industrial Realty Trust, Inc. | 1.57 % |
| PPL Corp. | 1.52 % |
| Wintrust Financial Corp. | 1.49 % |
| Sysco Corp. | 1.43 % |
| American Healthcare REIT, Inc. | 1.43 % |
| Permian Resources Corp. | 1.43 % |
| * Excluding money market fund holdings, if any. |
Sector allocation
(% of net assets)

Top ten holdings*
(% of net assets)
| MongoDB, Inc. | 2.01 % |
| Raymond James Financial, Inc. | 1.78 % |
| Royal Caribbean Cruises Ltd. | 1.76 % |
| Howmet Aerospace, Inc. | 1.74 % |
| First Industrial Realty Trust, Inc. | 1.57 % |
| PPL Corp. | 1.52 % |
| Wintrust Financial Corp. | 1.49 % |
| Sysco Corp. | 1.43 % |
| American Healthcare REIT, Inc. | 1.43 % |
| Permian Resources Corp. | 1.43 % |
| * Excluding money market fund holdings, if any. |
®
(the “Fund”) for the period January 1, 2025 to December 31, 2025.
invesco.com/reports
. You can also request this information by contacting us at (800) 959-4246
.
What Were The Fund Costs For The Last
Year
?
(Based on a hypothetical $10,000 investment)
Fund (Class) |
Costs of a $10,000 investment |
Costs paid as a percentage of a $10,000 investment |
| Invesco Main Street Mid Cap Fund ® (Class Y) |
$ 84 |
0.80 % |
How Did The Fund Perform During The Period?
•
During the fiscal year ended December 31, 2025, US equities reached record highs despite volatility, driven by enthusiasm for artificial intelligence, easing trade concerns and the Federal Reserve's move to cut interest rates. •
For the fiscal year ended December 31, 2025, Class Y shares of the Fund returned 9.20%. For the same time period, the Russell Midcap®
Index (the "Benchmark") returned 10.60%. The Fund underperformed the Benchmark mainly as a result of stock selection in the information technology, consumer staples and financials sectors. Stronger stock selection in the health care, industrials and real estate sectors partially offset these results.What contributed to performance?
MongoDB, Inc. |
MongoDB is a software company providing a general-purpose database platform. MongoDB delivered robust results, as its cloud revenue growth accelerated and exceeded investor expectations.ATI, Inc. |
ATI produces specialty materials for global industrial and aerospace markets. ATI consistently exceeded earnings expectations and raised future earnings guidance during the period. Strong aerospace demand, particularly for jet engines, drove growth and provided promising future order visibility. What detracted from performance?
BellRing Brands, Inc.
|
BellRing Brands develops and markets protein-based products. BellRing Brands declined as competitive pressures and slowing sales weighed on performance. Despite beating earnings expectations early in the year, heightened rivalry in the protein shake category challenged BellRing Brands' ability to sustain its growth trajectory. We sold the holding during the fiscal year. The Trade Desk, Inc. |
The Trade Desk is a cloud-based platform for buying and optimizing digital ads across channels. The Trade Desk lagged as earnings came in below expectations and growth slowed amid industry headwinds. A mid-year reorganization impacted execution, while competitive pressures in connected TV further challenged performance. We sold the holding during the fiscal year. How Has The Fund Historically Performed?
Growth of $10,000 Investment
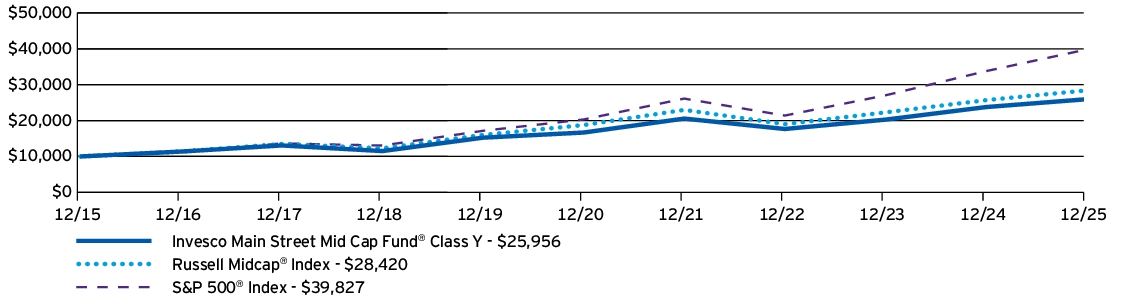
AVERAGE ANNUAL TOTAL RETURNS |
1 Year |
5 Years |
10 Years |
Invesco Main Street Mid Cap Fund ® (Class Y) |
9.20 % |
9.26 % |
10.01 % |
Russell Midcap ® Index |
10.60 % |
8.67 % |
11.01 % |
S&P 500 ® Index |
17.88 % |
14.42 % |
14.82 % |
invesco.com/performance
for more recent performance information.
What Are Key Statistics About The Fund?
(as of December 31, 2025)
| Fund net assets | $ 2,482,228,856 |
| Total number of portfolio holdings | 98 |
| Total advisory fees paid | $ 15,360,369 |
| Portfolio turnover rate | 44 % |
What Comprised The Fund's Holdings?
(as of December 31, 2025)
Top ten holdings*
(% of net assets)
| MongoDB, Inc. | 2.01 % |
| Raymond James Financial, Inc. | 1.78 % |
| Royal Caribbean Cruises Ltd. | 1.76 % |
| Howmet Aerospace, Inc. | 1.74 % |
| First Industrial Realty Trust, Inc. | 1.57 % |
| PPL Corp. | 1.52 % |
| Wintrust Financial Corp. | 1.49 % |
| Sysco Corp. | 1.43 % |
| American Healthcare REIT, Inc. | 1.43 % |
| Permian Resources Corp. | 1.43 % |
| * Excluding money market fund holdings, if any. |
Sector allocation
(% of net assets)
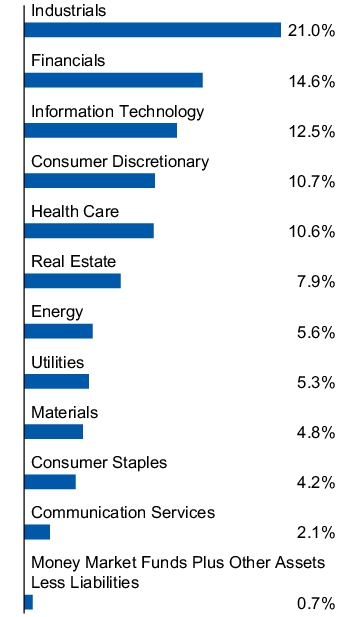
Top ten holdings*
(% of net assets)
| MongoDB, Inc. | 2.01 % |
| Raymond James Financial, Inc. | 1.78 % |
| Royal Caribbean Cruises Ltd. | 1.76 % |
| Howmet Aerospace, Inc. | 1.74 % |
| First Industrial Realty Trust, Inc. | 1.57 % |
| PPL Corp. | 1.52 % |
| Wintrust Financial Corp. | 1.49 % |
| Sysco Corp. | 1.43 % |
| American Healthcare REIT, Inc. | 1.43 % |
| Permian Resources Corp. | 1.43 % |
| * Excluding money market fund holdings, if any. |
®
(the “Fund”) for the period January 1, 2025 to December 31, 2025.
invesco.com/reports
. You can also request this information by contacting us at (800) 959-4246
.
What Were The Fund Costs For The Last
Year
?
(Based on a hypothetical $10,000 investment)
Fund (Class) |
Costs of a $10,000 investment |
Costs paid as a percentage of a $10,000 investment |
| Invesco Main Street Mid Cap Fund ® (Class R5) |
$ 78 |
0.75 % |
How Did The Fund Perform During The Period?
•
During the fiscal year ended December 31, 2025, US equities reached record highs despite volatility, driven by enthusiasm for artificial intelligence, easing trade concerns and the Federal Reserve's move to cut interest rates. •
For the fiscal year ended December 31, 2025, Class R5 shares of the Fund returned 9.23%. For the same time period, the Russell Midcap®
Index (the "Benchmark") returned 10.60%. The Fund underperformed the Benchmark mainly as a result of stock selection in the information technology, consumer staples and financials sectors. Stronger stock selection in the health care, industrials and real estate sectors partially offset these results.What contributed to performance?
MongoDB, Inc. |
MongoDB is a software company providing a general-purpose database platform. MongoDB delivered robust results, as its cloud revenue growth accelerated and exceeded investor expectations.ATI, Inc. |
ATI produces specialty materials for global industrial and aerospace markets. ATI consistently exceeded earnings expectations and raised future earnings guidance during the period. Strong aerospace demand, particularly for jet engines, drove growth and provided promising future order visibility. What detracted from performance?
BellRing Brands, Inc.
|
BellRing Brands develops and markets protein-based products. BellRing Brands declined as competitive pressures and slowing sales weighed on performance. Despite beating earnings expectations early in the year, heightened rivalry in the protein shake category challenged BellRing Brands' ability to sustain its growth trajectory. We sold the holding during the fiscal year. The Trade Desk, Inc. |
The Trade Desk is a cloud-based platform for buying and optimizing digital ads across channels. The Trade Desk lagged as earnings came in below expectations and growth slowed amid industry headwinds. A mid-year reorganization impacted execution, while competitive pressures in connected TV further challenged performance. We sold the holding during the fiscal year. How Has The Fund Historically Performed?
Growth of $10,000 Investment

AVERAGE ANNUAL TOTAL RETURNS |
1 Year |
5 Years |
10 Years |
Invesco Main Street Mid Cap Fund ® (Class R5) |
9.23 % |
9.32 % |
9.97 % |
Russell Midcap ® Index |
10.60 % |
8.67 % |
11.01 % |
S&P 500 ® Index |
17.88 % |
14.42 % |
14.82 % |
invesco.com/performance
for more recent performance information.
What Are Key Statistics About The Fund?
(as of December 31, 2025)
| Fund net assets | $ 2,482,228,856 |
| Total number of portfolio holdings | 98 |
| Total advisory fees paid | $ 15,360,369 |
| Portfolio turnover rate | 44 % |
What Comprised The Fund's Holdings?
(as of December 31, 2025)
Top ten holdings*
(% of net assets)
| MongoDB, Inc. | 2.01 % |
| Raymond James Financial, Inc. | 1.78 % |
| Royal Caribbean Cruises Ltd. | 1.76 % |
| Howmet Aerospace, Inc. | 1.74 % |
| First Industrial Realty Trust, Inc. | 1.57 % |
| PPL Corp. | 1.52 % |
| Wintrust Financial Corp. | 1.49 % |
| Sysco Corp. | 1.43 % |
| American Healthcare REIT, Inc. | 1.43 % |
| Permian Resources Corp. | 1.43 % |
| * Excluding money market fund holdings, if any. |
Sector allocation
(% of net assets)

Top ten holdings*
(% of net assets)
| MongoDB, Inc. | 2.01 % |
| Raymond James Financial, Inc. | 1.78 % |
| Royal Caribbean Cruises Ltd. | 1.76 % |
| Howmet Aerospace, Inc. | 1.74 % |
| First Industrial Realty Trust, Inc. | 1.57 % |
| PPL Corp. | 1.52 % |
| Wintrust Financial Corp. | 1.49 % |
| Sysco Corp. | 1.43 % |
| American Healthcare REIT, Inc. | 1.43 % |
| Permian Resources Corp. | 1.43 % |
| * Excluding money market fund holdings, if any. |
®
(the “Fund”) for the period January 1, 2025 to December 31, 2025.
invesco.com/reports
. You can also request this information by contacting us at (800) 959-4246
.
What Were The Fund Costs For The Last
Year
?
(Based on a hypothetical $10,000 investment)
Fund (Class) |
Costs of a $10,000 investment |
Costs paid as a percentage of a $10,000 investment |
| Invesco Main Street Mid Cap Fund ® (Class R6) |
$ 71 |
0.68 % |
How Did The Fund Perform During The Period?
•
During the fiscal year ended December 31, 2025, US equities reached record highs despite volatility, driven by enthusiasm for artificial intelligence, easing trade concerns and the Federal Reserve's move to cut interest rates. •
For the fiscal year ended December 31, 2025, Class R6 shares of the Fund returned 9.32%. For the same time period, the Russell Midcap®
Index (the "Benchmark") returned 10.60%. The Fund underperformed the Benchmark mainly as a result of stock selection in the information technology, consumer staples and financials sectors. Stronger stock selection in the health care, industrials and real estate sectors partially offset these results.What contributed to performance?
MongoDB, Inc. |
MongoDB is a software company providing a general-purpose database platform. MongoDB delivered robust results, as its cloud revenue growth accelerated and exceeded investor expectations.ATI, Inc. |
ATI produces specialty materials for global industrial and aerospace markets. ATI consistently exceeded earnings expectations and raised future earnings guidance during the period. Strong aerospace demand, particularly for jet engines, drove growth and provided promising future order visibility. What detracted from performance?
BellRing Brands, Inc.
|
BellRing Brands develops and markets protein-based products. BellRing Brands declined as competitive pressures and slowing sales weighed on performance. Despite beating earnings expectations early in the year, heightened rivalry in the protein shake category challenged BellRing Brands' ability to sustain its growth trajectory. We sold the holding during the fiscal year. The Trade Desk, Inc. |
The Trade Desk is a cloud-based platform for buying and optimizing digital ads across channels. The Trade Desk lagged as earnings came in below expectations and growth slowed amid industry headwinds. A mid-year reorganization impacted execution, while competitive pressures in connected TV further challenged performance. We sold the holding during the fiscal year. How Has The Fund Historically Performed?
Growth of $10,000 Investment

AVERAGE ANNUAL TOTAL RETURNS |
1 Year |
5 Years |
10 Years |
Invesco Main Street Mid Cap Fund ® (Class R6) |
9.32 % |
9.40 % |
10.18 % |
Russell Midcap ® Index |
10.60 % |
8.67 % |
11.01 % |
S&P 500 ® Index |
17.88 % |
14.42 % |
14.82 % |
invesco.com/performance
for more recent performance information.
What Are Key Statistics About The Fund?
(as of December 31, 2025)
| Fund net assets | $ 2,482,228,856 |
| Total number of portfolio holdings | 98 |
| Total advisory fees paid | $ 15,360,369 |
| Portfolio turnover rate | 44 % |
What Comprised The Fund's Holdings?
(as of December 31, 2025)
Top ten holdings*
(% of net assets)
| MongoDB, Inc. | 2.01 % |
| Raymond James Financial, Inc. | 1.78 % |
| Royal Caribbean Cruises Ltd. | 1.76 % |
| Howmet Aerospace, Inc. | 1.74 % |
| First Industrial Realty Trust, Inc. | 1.57 % |
| PPL Corp. | 1.52 % |
| Wintrust Financial Corp. | 1.49 % |
| Sysco Corp. | 1.43 % |
| American Healthcare REIT, Inc. | 1.43 % |
| Permian Resources Corp. | 1.43 % |
| * Excluding money market fund holdings, if any. |
Sector allocation
(% of net assets)

Top ten holdings*
(% of net assets)
| MongoDB, Inc. | 2.01 % |
| Raymond James Financial, Inc. | 1.78 % |
| Royal Caribbean Cruises Ltd. | 1.76 % |
| Howmet Aerospace, Inc. | 1.74 % |
| First Industrial Realty Trust, Inc. | 1.57 % |
| PPL Corp. | 1.52 % |
| Wintrust Financial Corp. | 1.49 % |
| Sysco Corp. | 1.43 % |
| American Healthcare REIT, Inc. | 1.43 % |
| Permian Resources Corp. | 1.43 % |
| * Excluding money market fund holdings, if any. |
®
(the “Fund”) for the period January 1, 2025 to December 31, 2025.
invesco.com/reports
. You can also request this information by contacting us at (800) 959-4246
.
What Were The Fund Costs For The Last
Year
?
(Based on a hypothetical $10,000 investment)
Fund (Class) |
Costs of a $10,000 investment |
Costs paid as a percentage of a $10,000 investment |
| Invesco Main Street Small Cap Fund ® (Class A) |
$ 109 |
1.05 % |
How Did The Fund Perform During The Period?
•
During the fiscal year ended December 31, 2025, US equities reached record highs despite volatility, driven by enthusiasm for artificial intelligence, easing trade concerns and the Federal Reserve's move to cut interest rates. •
For the fiscal year ended December 31, 2025, Class A shares of the Fund, excluding sales charge, returned 8.45%. For the same time period, the Russell 2000®
Index (the "Benchmark") returned 12.81%. The Fund underperformed the Benchmark mainly as a result of stock selection in the energy, materials and industrials sectors. Stronger stock selection in the financials, real estate and information technology sectors partially offset these results.What contributed to performance?
Guardant Health, Inc. |
Guardant Health operates as a biotechnology company. Guardant Health delivered strong results, driven by diagnostics momentum and strategic partnerships with leading testing centers. Early cash flow positivity and reimbursement approvals for colorectal cancer tests positioned the company for continued growth. ATI, Inc. |
ATI produces specialty materials for global industrial and aerospace markets. ATI consistently exceeded earnings expectations and raised future earnings guidance during the period. Strong aerospace demand, particularly for jet engines, drove growth and provided promising future order visibility. What detracted from performance?
BellRing Brands, Inc.
|
BellRing Brands develops and markets protein-based products. BellRing Brands declined as competitive pressures and slowing sales weighed on performance. Despite beating earnings expectations early in the year, heightened rivalry in the protein shake category challenged BellRing Brands' ability to sustain its growth trajectory. We sold the holding during the fiscal year. Northern Oil and Gas, Inc. |
Northern Oil and Gas faced weaker oil prices, sector volatility and supply concerns. Broader energy market pressures added uncertainty, offsetting operational improvements and growth initiatives. How Has The Fund Historically Performed?
Growth of $10,000 Investment
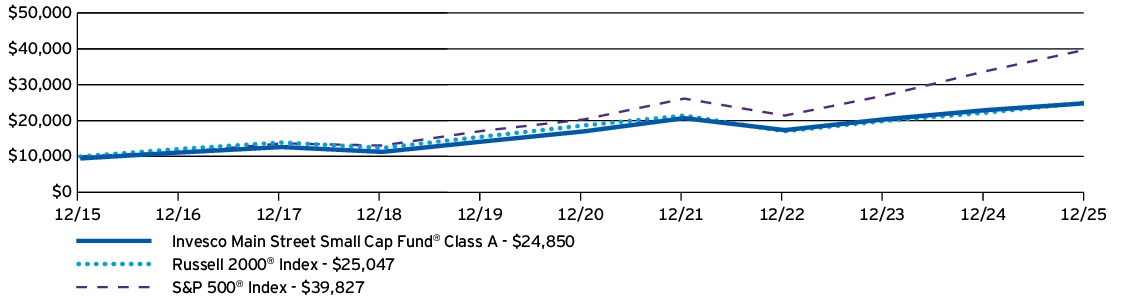
AVERAGE ANNUAL TOTAL RETURNS |
1 Year |
5 Years |
10 Years |
Invesco Main Street Small Cap Fund ® (Class A) —including sales charge |
2.46 % |
6.70 % |
9.53 % |
Invesco Main Street Small Cap Fund ® (Class A) —excluding sales charge |
8.45 % |
7.92 % |
10.15 % |
Russell 2000 ® Index |
12.81 % |
6.09 % |
9.62 % |
S&P 500 ® Index |
17.88 % |
14.42 % |
14.82 % |
invesco.com/performance
for more recent performance information.
What Are Key Statistics About The Fund?
(as of December 31, 2025)
| Fund net assets | $ 2,340,817,063 |
| Total number of portfolio holdings | 98 |
| Total advisory fees paid | $ 13,120,090 |
| Portfolio turnover rate | 53 % |
What Comprised The Fund's Holdings?
(as of December 31, 2025)
Top ten holdings*
(% of net assets)
| American Healthcare REIT, Inc. | 2.06 % |
| PennyMac Financial Services, Inc. | 2.03 % |
| ADMA Biologics, Inc. | 1.82 % |
| Enpro, Inc. | 1.77 % |
| Columbia Banking System, Inc. | 1.76 % |
| BrightSpring Health Services, Inc. | 1.70 % |
| Guardant Health, Inc. | 1.68 % |
| Wintrust Financial Corp. | 1.65 % |
| BridgeBio Pharma, Inc. | 1.64 % |
| Helmerich & Payne, Inc. | 1.61 % |
| * Excluding money market fund holdings, if any. |
Sector allocation
(% of net assets)

Top ten holdings*
(% of net assets)
| American Healthcare REIT, Inc. | 2.06 % |
| PennyMac Financial Services, Inc. | 2.03 % |
| ADMA Biologics, Inc. | 1.82 % |
| Enpro, Inc. | 1.77 % |
| Columbia Banking System, Inc. | 1.76 % |
| BrightSpring Health Services, Inc. | 1.70 % |
| Guardant Health, Inc. | 1.68 % |
| Wintrust Financial Corp. | 1.65 % |
| BridgeBio Pharma, Inc. | 1.64 % |
| Helmerich & Payne, Inc. | 1.61 % |
| * Excluding money market fund holdings, if any. |
®
(the “Fund”) for the period January 1, 2025 to December 31, 2025.
invesco.com/reports
. You can also request this information by contacting us at (800) 959-4246
.
What Were The Fund Costs For The Last
Year
?
(Based on a hypothetical $10,000 investment)
Fund (Class) |
Costs of a $10,000 investment |
Costs paid as a percentage of a $10,000 investment |
| Invesco Main Street Small Cap Fund ® (Class C) |
$ 187 |
1.80 % |
How Did The Fund Perform During The Period?
•
During the fiscal year ended December 31, 2025, US equities reached record highs despite volatility, driven by enthusiasm for artificial intelligence, easing trade concerns and the Federal Reserve's move to cut interest rates. •
For the fiscal year ended December 31, 2025, Class C shares of the Fund, excluding sales charge, returned 7.64%. For the same time period, the Russell 2000®
Index (the "Benchmark") returned 12.81%. The Fund underperformed the Benchmark mainly as a result of stock selection in the energy, materials and industrials sectors. Stronger stock selection in the financials, real estate and information technology sectors partially offset these results.What contributed to performance?
Guardant Health, Inc. |
Guardant Health operates as a biotechnology company. Guardant Health delivered strong results, driven by diagnostics momentum and strategic partnerships with leading testing centers. Early cash flow positivity and reimbursement approvals for colorectal cancer tests positioned the company for continued growth. ATI, Inc. |
ATI produces specialty materials for global industrial and aerospace markets. ATI consistently exceeded earnings expectations and raised future earnings guidance during the period. Strong aerospace demand, particularly for jet engines, drove growth and provided promising future order visibility. What detracted from performance?
BellRing Brands, Inc.
|
BellRing Brands develops and markets protein-based products. BellRing Brands declined as competitive pressures and slowing sales weighed on performance. Despite beating earnings expectations early in the year, heightened rivalry in the protein shake category challenged BellRing Brands' ability to sustain its growth trajectory. We sold the holding during the fiscal year. Northern Oil and Gas, Inc. |
Northern Oil and Gas faced weaker oil prices, sector volatility and supply concerns. Broader energy market pressures added uncertainty, offsetting operational improvements and growth initiatives. How Has The Fund Historically Performed?
Growth of $10,000 Investment
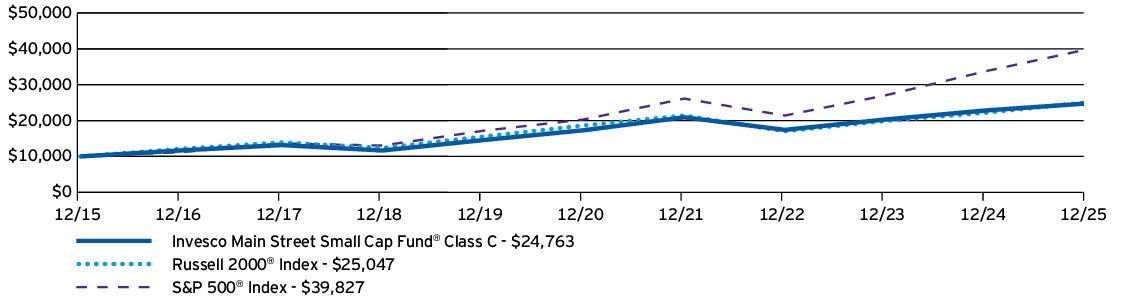
AVERAGE ANNUAL TOTAL RETURNS |
1 Year |
5 Years |
10 Years |
Invesco Main Street Small Cap Fund ® (Class C) —including sales charge |
6.65 % |
7.11 % |
9.49 % |
Invesco Main Street Small Cap Fund ® (Class C) —excluding sales charge |
7.64 % |
7.11 % |
9.49 % |
Russell 2000 ® Index |
12.81 % |
6.09 % |
9.62 % |
S&P 500 ® Index |
17.88 % |
14.42 % |
14.82 % |
invesco.com/performance
for more recent performance information.
What Are Key Statistics About The Fund?
(as of December 31, 2025)
| Fund net assets | $ 2,340,817,063 |
| Total number of portfolio holdings | 98 |
| Total advisory fees paid | $ 13,120,090 |
| Portfolio turnover rate | 53 % |
What Comprised The Fund's Holdings?
(as of December 31, 2025)
Top ten holdings*
(% of net assets)
| American Healthcare REIT, Inc. | 2.06 % |
| PennyMac Financial Services, Inc. | 2.03 % |
| ADMA Biologics, Inc. | 1.82 % |
| Enpro, Inc. | 1.77 % |
| Columbia Banking System, Inc. | 1.76 % |
| BrightSpring Health Services, Inc. | 1.70 % |
| Guardant Health, Inc. | 1.68 % |
| Wintrust Financial Corp. | 1.65 % |
| BridgeBio Pharma, Inc. | 1.64 % |
| Helmerich & Payne, Inc. | 1.61 % |
| * Excluding money market fund holdings, if any. |
Sector allocation
(% of net assets)

Top ten holdings*
(% of net assets)
| American Healthcare REIT, Inc. | 2.06 % |
| PennyMac Financial Services, Inc. | 2.03 % |
| ADMA Biologics, Inc. | 1.82 % |
| Enpro, Inc. | 1.77 % |
| Columbia Banking System, Inc. | 1.76 % |
| BrightSpring Health Services, Inc. | 1.70 % |
| Guardant Health, Inc. | 1.68 % |
| Wintrust Financial Corp. | 1.65 % |
| BridgeBio Pharma, Inc. | 1.64 % |
| Helmerich & Payne, Inc. | 1.61 % |
| * Excluding money market fund holdings, if any. |
®
(the “Fund”) for the period January 1, 2025 to December 31, 2025.
invesco.com/reports
. You can also request this information by contacting us at (800) 959-4246
.
What Were The Fund Costs For The Last
Year
?
(Based on a hypothetical $10,000 investment)
Fund (Class) |
Costs of a $10,000 investment |
Costs paid as a percentage of a $10,000 investment |
| Invesco Main Street Small Cap Fund ® (Class R) |
$ 135 |
1.30 % |
How Did The Fund Perform During The Period?
•
During the fiscal year ended December 31, 2025, US equities reached record highs despite volatility, driven by enthusiasm for artificial intelligence, easing trade concerns and the Federal Reserve's move to cut interest rates. •
For the fiscal year ended December 31, 2025, Class R shares of the Fund returned 8.20%. For the same time period, the Russell 2000®
Index (the "Benchmark") returned 12.81%. The Fund underperformed the Benchmark mainly as a result of stock selection in the energy, materials and industrials sectors. Stronger stock selection in the financials, real estate and information technology sectors partially offset these results.What contributed to performance?
Guardant Health, Inc. |
Guardant Health operates as a biotechnology company. Guardant Health delivered strong results, driven by diagnostics momentum and strategic partnerships with leading testing centers. Early cash flow positivity and reimbursement approvals for colorectal cancer tests positioned the company for continued growth. ATI, Inc. |
ATI produces specialty materials for global industrial and aerospace markets. ATI consistently exceeded earnings expectations and raised future earnings guidance during the period. Strong aerospace demand, particularly for jet engines, drove growth and provided promising future order visibility. What detracted from performance?
BellRing Brands, Inc.
|
BellRing Brands develops and markets protein-based products. BellRing Brands declined as competitive pressures and slowing sales weighed on performance. Despite beating earnings expectations early in the year, heightened rivalry in the protein shake category challenged BellRing Brands' ability to sustain its growth trajectory. We sold the holding during the fiscal year. Northern Oil and Gas, Inc. |
Northern Oil and Gas faced weaker oil prices, sector volatility and supply concerns. Broader energy market pressures added uncertainty, offsetting operational improvements and growth initiatives. How Has The Fund Historically Performed?
Growth of $10,000 Investment
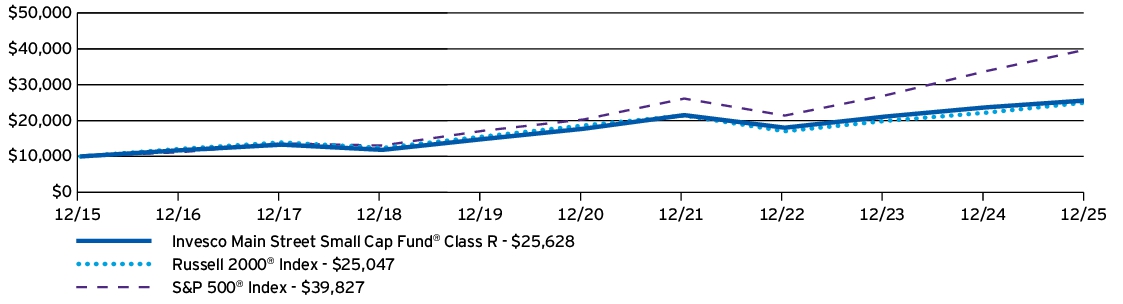
AVERAGE ANNUAL TOTAL RETURNS |
1 Year |
5 Years |
10 Years |
Invesco Main Street Small Cap Fund ® (Class R) |
8.20 % |
7.65 % |
9.87 % |
Russell 2000 ® Index |
12.81 % |
6.09 % |
9.62 % |
S&P 500 ® Index |
17.88 % |
14.42 % |
14.82 % |
invesco.com/performance
for more recent performance information.
What Are Key Statistics About The Fund?
(as of December 31, 2025)
| Fund net assets | $ 2,340,817,063 |
| Total number of portfolio holdings | 98 |
| Total advisory fees paid | $ 13,120,090 |
| Portfolio turnover rate | 53 % |
What Comprised The Fund's Holdings?
(as of December 31, 2025)
Top ten holdings*
(% of net assets)
| American Healthcare REIT, Inc. | 2.06 % |
| PennyMac Financial Services, Inc. | 2.03 % |
| ADMA Biologics, Inc. | 1.82 % |
| Enpro, Inc. | 1.77 % |
| Columbia Banking System, Inc. | 1.76 % |
| BrightSpring Health Services, Inc. | 1.70 % |
| Guardant Health, Inc. | 1.68 % |
| Wintrust Financial Corp. | 1.65 % |
| BridgeBio Pharma, Inc. | 1.64 % |
| Helmerich & Payne, Inc. | 1.61 % |
| * Excluding money market fund holdings, if any. |
Sector allocation
(% of net assets)

Top ten holdings*
(% of net assets)
| American Healthcare REIT, Inc. | 2.06 % |
| PennyMac Financial Services, Inc. | 2.03 % |
| ADMA Biologics, Inc. | 1.82 % |
| Enpro, Inc. | 1.77 % |
| Columbia Banking System, Inc. | 1.76 % |
| BrightSpring Health Services, Inc. | 1.70 % |
| Guardant Health, Inc. | 1.68 % |
| Wintrust Financial Corp. | 1.65 % |
| BridgeBio Pharma, Inc. | 1.64 % |
| Helmerich & Payne, Inc. | 1.61 % |
| * Excluding money market fund holdings, if any. |
®
(the “Fund”) for the period January 1, 2025 to December 31, 2025.
invesco.com/reports
. You can also request this information by contacting us at (800) 959-4246
.
What Were The Fund Costs For The Last
Year
?
(Based on a hypothetical $10,000 investment)
Fund (Class) |
Costs of a $10,000 investment |
Costs paid as a percentage of a $10,000 investment |
| Invesco Main Street Small Cap Fund ® (Class Y) |
$ 83 |
0.80 % |
How Did The Fund Perform During The Period?
•
During the fiscal year ended December 31, 2025, US equities reached record highs despite volatility, driven by enthusiasm for artificial intelligence, easing trade concerns and the Federal Reserve's move to cut interest rates. •
For the fiscal year ended December 31, 2025, Class Y shares of the Fund returned 8.70%. For the same time period, the Russell 2000®
Index (the "Benchmark") returned 12.81%. The Fund underperformed the Benchmark mainly as a result of stock selection in the energy, materials and industrials sectors. Stronger stock selection in the financials, real estate and information technology sectors partially offset these results.What contributed to performance?
Guardant Health, Inc. |
Guardant Health operates as a biotechnology company. Guardant Health delivered strong results, driven by diagnostics momentum and strategic partnerships with leading testing centers. Early cash flow positivity and reimbursement approvals for colorectal cancer tests positioned the company for continued growth. ATI, Inc. |
ATI produces specialty materials for global industrial and aerospace markets. ATI consistently exceeded earnings expectations and raised future earnings guidance during the period. Strong aerospace demand, particularly for jet engines, drove growth and provided promising future order visibility. What detracted from performance?
BellRing Brands, Inc.
|
BellRing Brands develops and markets protein-based products. BellRing Brands declined as competitive pressures and slowing sales weighed on performance. Despite beating earnings expectations early in the year, heightened rivalry in the protein shake category challenged BellRing Brands' ability to sustain its growth trajectory. We sold the holding during the fiscal year. Northern Oil and Gas, Inc. |
Northern Oil and Gas faced weaker oil prices, sector volatility and supply concerns. Broader energy market pressures added uncertainty, offsetting operational improvements and growth initiatives. How Has The Fund Historically Performed?
Growth of $10,000 Investment

AVERAGE ANNUAL TOTAL RETURNS |
1 Year |
5 Years |
10 Years |
Invesco Main Street Small Cap Fund ® (Class Y) |
8.70 % |
8.19 % |
10.45 % |
Russell 2000 ® Index |
12.81 % |
6.09 % |
9.62 % |
S&P 500 ® Index |
17.88 % |
14.42 % |
14.82 % |
invesco.com/performance
for more recent performance information.
What Are Key Statistics About The Fund?
(as of December 31, 2025)
| Fund net assets | $ 2,340,817,063 |
| Total number of portfolio holdings | 98 |
| Total advisory fees paid | $ 13,120,090 |
| Portfolio turnover rate | 53 % |
What Comprised The Fund's Holdings?
(as of December 31, 2025)
Top ten holdings*
(% of net assets)
| American Healthcare REIT, Inc. | 2.06 % |
| PennyMac Financial Services, Inc. | 2.03 % |
| ADMA Biologics, Inc. | 1.82 % |
| Enpro, Inc. | 1.77 % |
| Columbia Banking System, Inc. | 1.76 % |
| BrightSpring Health Services, Inc. | 1.70 % |
| Guardant Health, Inc. | 1.68 % |
| Wintrust Financial Corp. | 1.65 % |
| BridgeBio Pharma, Inc. | 1.64 % |
| Helmerich & Payne, Inc. | 1.61 % |
| * Excluding money market fund holdings, if any. |
Sector allocation
(% of net assets)

Top ten holdings*
(% of net assets)
| American Healthcare REIT, Inc. | 2.06 % |
| PennyMac Financial Services, Inc. | 2.03 % |
| ADMA Biologics, Inc. | 1.82 % |
| Enpro, Inc. | 1.77 % |
| Columbia Banking System, Inc. | 1.76 % |
| BrightSpring Health Services, Inc. | 1.70 % |
| Guardant Health, Inc. | 1.68 % |
| Wintrust Financial Corp. | 1.65 % |
| BridgeBio Pharma, Inc. | 1.64 % |
| Helmerich & Payne, Inc. | 1.61 % |
| * Excluding money market fund holdings, if any. |
®
(the “Fund”) for the period January 1, 2025 to December 31, 2025.
invesco.com/reports
. You can also request this information by contacting us at (800) 959-4246
.
What Were The Fund Costs For The Last
Year
?
(Based on a hypothetical $10,000 investment)
Fund (Class) | Costs of a $10,000 investment | Costs paid as a percentage of a $10,000 investment |
| Invesco Main Street Small Cap Fund ® (Class R5) | $ 79 | 0.76 % |
How Did The Fund Perform During The Period?
•
During the fiscal year ended December 31, 2025, US equities reached record highs despite volatility, driven by enthusiasm for artificial intelligence, easing trade concerns and the Federal Reserve's move to cut interest rates. •
For the fiscal year ended December 31, 2025, Class R5 shares of the Fund returned 8.74%. For the same time period, the Russell 2000®
Index (the "Benchmark") returned 12.81%. The Fund underperformed the Benchmark mainly as a result of stock selection in the energy, materials and industrials sectors. Stronger stock selection in the financials, real estate and information technology sectors partially offset these results.What contributed to performance?
Guardant Health, Inc. |
Guardant Health operates as a biotechnology company. Guardant Health delivered strong results, driven by diagnostics momentum and strategic partnerships with leading testing centers. Early cash flow positivity and reimbursement approvals for colorectal cancer tests positioned the company for continued growth. ATI, Inc. |
ATI produces specialty materials for global industrial and aerospace markets. ATI consistently exceeded earnings expectations and raised future earnings guidance during the period. Strong aerospace demand, particularly for jet engines, drove growth and provided promising future order visibility. What detracted from performance?
BellRing Brands, Inc.
|
BellRing Brands develops and markets protein-based products. BellRing Brands declined as competitive pressures and slowing sales weighed on performance. Despite beating earnings expectations early in the year, heightened rivalry in the protein shake category challenged BellRing Brands' ability to sustain its growth trajectory. We sold the holding during the fiscal year. Northern Oil and Gas, Inc. |
Northern Oil and Gas faced weaker oil prices, sector volatility and supply concerns. Broader
energy
market pressures added uncertainty, offsetting operational improvements and growth initiatives. How Has The Fund Historically Performed?
Growth of $10,000 Investment

AVERAGE ANNUAL TOTAL RETURNS | 1 Year | 5 Years | 10 Years |
Invesco Main Street Small Cap Fund ® (Class R5) | 8.74 % | 8.27 % | 10.40 % |
Russell 2000 ® Index | 12.81 % | 6.09 % | 9.62 % |
S&P 500 ® Index | 17.88 % | 14.42 % | 14.82 % |
invesco.com/performance
for more recent performance information.
What Are Key Statistics About The Fund?
(as of December 31, 2025)
| Fund net assets | $ 2,340,817,063 |
| Total number of portfolio holdings | 98 |
| Total advisory fees paid | $ 13,120,090 |
| Portfolio turnover rate | 53 % |
What Comprised The Fund's Holdings?
(as of December 31, 2025)
Top ten holdings*
(% of net assets)
| American Healthcare REIT, Inc. | 2.06 % |
| PennyMac Financial Services, Inc. | 2.03 % |
| ADMA Biologics, Inc. | 1.82 % |
| Enpro, Inc. | 1.77 % |
| Columbia Banking System, Inc. | 1.76 % |
| BrightSpring Health Services, Inc. | 1.70 % |
| Guardant Health, Inc. | 1.68 % |
| Wintrust Financial Corp. | 1.65 % |
| BridgeBio Pharma, Inc. | 1.64 % |
| Helmerich & Payne, Inc. | 1.61 % |
| * Excluding money market fund holdings, if any. |
Sector allocation
(% of net assets)
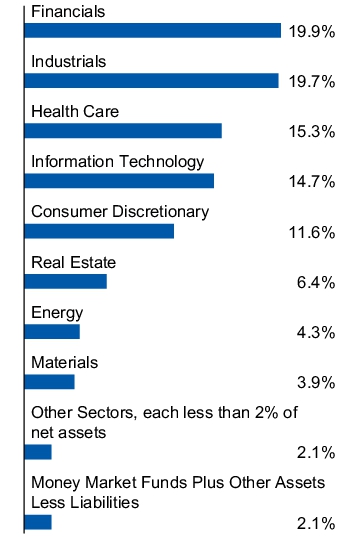
Top ten holdings*
(% of net assets)
| American Healthcare REIT, Inc. | 2.06 % |
| PennyMac Financial Services, Inc. | 2.03 % |
| ADMA Biologics, Inc. | 1.82 % |
| Enpro, Inc. | 1.77 % |
| Columbia Banking System, Inc. | 1.76 % |
| BrightSpring Health Services, Inc. | 1.70 % |
| Guardant Health, Inc. | 1.68 % |
| Wintrust Financial Corp. | 1.65 % |
| BridgeBio Pharma, Inc. | 1.64 % |
| Helmerich & Payne, Inc. | 1.61 % |
| * Excluding money market fund holdings, if any. |
®
(the “Fund”) for the period January 1, 2025 to December 31, 2025.
invesco.com/reports
. You can also request this information by contacting us at (800) 959-4246
.
What Were The Fund Costs For The Last
Year
?
(Based on a hypothetical $10,000 investment)
Fund (Class) |
Costs of a $10,000 investment |
Costs paid as a percentage of a $10,000 investment |
| Invesco Main Street Small Cap Fund ® (Class R6) |
$ 72 |
0.69 % |
How Did The Fund Perform During The Period?
•
During the fiscal year ended December 31, 2025, US equities reached record highs despite volatility, driven by enthusiasm for artificial intelligence, easing trade concerns and the Federal Reserve's move to cut interest rates. •
For the fiscal year ended December 31, 2025, Class R6 shares of the Fund returned 8.86%. For the same time period, the Russell 2000®
Index (the "Benchmark") returned 12.81%. The Fund underperformed the Benchmark mainly as a result of stock selection in the energy, materials and industrials sectors. Stronger stock selection in the financials, real estate and information technology sectors partially offset these results.What contributed to performance?
Guardant Health, Inc. |
Guardant Health operates as a biotechnology company. Guardant Health delivered strong results, driven by diagnostics momentum and strategic partnerships with leading testing centers. Early cash flow positivity and reimbursement approvals for colorectal cancer tests positioned the company for continued growth. ATI, Inc. |
ATI produces specialty materials for global industrial and aerospace markets. ATI consistently exceeded earnings expectations and raised future earnings guidance during the period. Strong aerospace demand, particularly for jet engines, drove growth and provided promising future order visibility. What detracted from performance?
BellRing Brands, Inc.
|
BellRing Brands develops and markets protein-based products. BellRing Brands declined as competitive pressures and slowing sales weighed on performance. Despite beating earnings expectations early in the year, heightened rivalry in the protein shake category challenged BellRing Brands' ability to sustain its growth trajectory. We sold the holding during the fiscal year. Northern Oil and Gas, Inc. |
Northern Oil and Gas faced weaker oil prices, sector volatility and supply concerns. Broader energy
market pressures added uncertainty, offsetting operational improvements and growth initiatives. How Has The Fund Historically Performed?
Growth of $10,000 Investment
AVERAGE ANNUAL TOTAL RETURNS |
1 Year |
5 Years |
10 Years |
Invesco Main Street Small Cap Fund ® (Class R6) |
8.86 % |
8.34 % |
10.60 % |
Russell 2000 ® Index |
12.81 % |
6.09 % |
9.62 % |
S&P 500 ® Index |
17.88 % |
14.42 % |
14.82 % |
invesco.com/performance
for more recent performance information.
What Are Key Statistics About The Fund?
(as of December 31, 2025)
| Fund net assets | $ 2,340,817,063 |
| Total number of portfolio holdings | 98 |
| Total advisory fees paid | $ 13,120,090 |
| Portfolio turnover rate | 53 % |
What Comprised The Fund's Holdings?
(as of December 31, 2025)
Top ten holdings*
(% of net
assets
)| American Healthcare REIT, Inc. | 2.06 % |
| PennyMac Financial Services, Inc. | 2.03 % |
| ADMA Biologics, Inc. | 1.82 % |
| Enpro, Inc. | 1.77 % |
| Columbia Banking System, Inc. | 1.76 % |
| BrightSpring Health Services, Inc. | 1.70 % |
| Guardant Health, Inc. | 1.68 % |
| Wintrust Financial Corp. | 1.65 % |
| BridgeBio Pharma, Inc. | 1.64 % |
| Helmerich & Payne, Inc. | 1.61 % |
| * Excluding money market fund holdings, if any. |
Sector allocation
(% of net assets)

Top ten holdings*
(% of net
assets
)| American Healthcare REIT, Inc. | 2.06 % |
| PennyMac Financial Services, Inc. | 2.03 % |
| ADMA Biologics, Inc. | 1.82 % |
| Enpro, Inc. | 1.77 % |
| Columbia Banking System, Inc. | 1.76 % |
| BrightSpring Health Services, Inc. | 1.70 % |
| Guardant Health, Inc. | 1.68 % |
| Wintrust Financial Corp. | 1.65 % |
| BridgeBio Pharma, Inc. | 1.64 % |
| Helmerich & Payne, Inc. | 1.61 % |
| * Excluding money market fund holdings, if any. |
invesco.com/reports
. You can also request this information by contacting us at (800) 959-4246
.
What Were The Fund Costs For The Last
Year
?
(Based on a hypothetical $10,000 investment)
Fund (Class) |
Costs of a $10,000 investment |
Costs paid as a percentage of a $10,000 investment |
| Invesco Quality Income Fund (Class A) |
$ 92 |
0.88 % † |
|
† |
Reflects fee waivers and/or expense reimbursements, without which expenses would have been higher. |
How Did The Fund Perform During The Period?
•
The Fund generated a positive return in 2025, supported by a broad decline in US Treasury yields of 40 to 80 basis points across the curve. Falling interest rates provided a favorable backdrop for duration sensitive assets, while credit and securitized sectors continued to benefit from stable economic conditions and resilient consumer fundamentals.•
For the fiscal year ended December 31, 2025, Class A shares of the Fund, excluding sales charge, returned 8.23%. For the same time period, the Bloomberg US Mortgage Backed Securities Index returned 8.58%.What contributed to performance?
Asset-backed securities (ABS) |
During 2025, ABS delivered the strongest contribution, supported by attractive starting yields and continued demand for high quality securitized assets.Agency mortgage-backed securities (MBS) |
Agency MBS, which accounted for approximately 90% of the Fund during the period, added to performance, primarily due to declining rates and the Fund’s positioning in higher coupon collateral.Non-agency MBS |
Non-agency MBS contributed positively for the year as spreads tightened and fundamentals remained stable.What detracted from performance?
Agency mortgages
|
Small detraction from security selection within agency mortgages.How Has The Fund Historically Performed?
Growth of $10,000 Investment
AVERAGE ANNUAL TOTAL RETURNS |
1 Year |
5 Years |
10 Years |
Invesco Quality Income Fund (Class A) —including sales charge |
3.66 % |
-1.09 % |
1.00 % |
Invesco Quality Income Fund (Class A) —excluding sales charge |
8.23 % |
-0.22 % |
1.44 % |
Bloomberg US Mortgage Backed Securities Index |
8.58 % |
0.15 % |
1.59 % |
Bloomberg U.S. Aggregate Bond Index |
7.30 % |
-0.36 % |
2.01 % |
invesco.com/performance
for more recent performance information.
What Are Key Statistics About The Fund?
(as of December 31, 2025)
| Fund net assets | $ 510,343,254 |
| Total number of portfolio holdings | 697 |
| Total advisory fees paid | $ 2,209,262 |
| Portfolio turnover rate | 349 % |
What Comprised The Fund's Holdings?
(as of December 31, 2025)
Top ten holdings*
(% of net assets)
| Government National Mortgage Association, TBA, 2.00%, 01/01/2056 | 3.81 % |
| Government National Mortgage Association, TBA, 2.50%, 01/01/2056 | 3.40 % |
| Uniform Mortgage-Backed Securities, TBA, 6.00%, 01/01/2056 | 3.17 % |
| Government National Mortgage Association, TBA, 5.00%, 01/01/2056 | 3.14 % |
| Government National Mortgage Association, TBA, 5.50%, 01/01/2056 | 3.00 % |
| Federal Home Loan Mortgage Corp., 2.50%, 10/01/2051 | 2.73 % |
| Government National Mortgage Association, TBA, 3.00%, 01/01/2056 | 2.08 % |
| Federal Home Loan Mortgage Corp., 2.00%, 05/01/2051 | 2.05 % |
| Federal Home Loan Mortgage Corp., 5.50%, 11/01/2052 | 2.04 % |
| Federal Home Loan Mortgage Corp., 2.50%, 04/01/2052 | 1.96 % |
| * Excluding money market fund holdings, if any. |
Security type allocation
(% of total investments)

Top ten holdings*
(% of net assets)
| Government National Mortgage Association, TBA, 2.00%, 01/01/2056 | 3.81 % |
| Government National Mortgage Association, TBA, 2.50%, 01/01/2056 | 3.40 % |
| Uniform Mortgage-Backed Securities, TBA, 6.00%, 01/01/2056 | 3.17 % |
| Government National Mortgage Association, TBA, 5.00%, 01/01/2056 | 3.14 % |
| Government National Mortgage Association, TBA, 5.50%, 01/01/2056 | 3.00 % |
| Federal Home Loan Mortgage Corp., 2.50%, 10/01/2051 | 2.73 % |
| Government National Mortgage Association, TBA, 3.00%, 01/01/2056 | 2.08 % |
| Federal Home Loan Mortgage Corp., 2.00%, 05/01/2051 | 2.05 % |
| Federal Home Loan Mortgage Corp., 5.50%, 11/01/2052 | 2.04 % |
| Federal Home Loan Mortgage Corp., 2.50%, 04/01/2052 | 1.96 % |
| * Excluding money market fund holdings, if any. |
invesco.com/reports
. You can also request this information by contacting us at (800) 959-4246
.
What Were The Fund Costs For The Last
Year
?
(Based on a hypothetical $10,000 investment)
Fund (Class) |
Costs of a $10,000 investment |
Costs paid as a percentage of a $10,000 investment |
| Invesco Quality Income Fund (Class C) |
$ 170 |
1.64 % † |
|
† |
Reflects fee waivers and/or expense reimbursements, without which expenses would have been higher. |
How Did The Fund Perform During The Period?
•
The Fund generated a positive return in 2025, supported by a broad decline in US Treasury yields of 40 to 80 basis points across the curve. Falling interest rates provided a favorable backdrop for duration sensitive assets, while credit and securitized sectors continued to benefit from stable economic conditions and resilient consumer fundamentals.•
For the fiscal year ended December 31, 2025, Class C shares of the Fund, excluding sales charge, returned 7.46%. For the same time period, the Bloomberg US Mortgage Backed Securities Index returned 8.58%.What contributed to performance?
Asset-backed securities (ABS) |
During 2025, ABS delivered the strongest contribution, supported by attractive starting yields and continued demand for high quality securitized assets.Agency mortgage-backed securities (MBS) |
Agency MBS, which accounted for approximately 90% of the Fund during the period, added to performance, primarily due to declining rates and the Fund’s positioning in higher coupon collateral.Non-agency MBS |
Non-agency MBS contributed positively for the year as spreads tightened and fundamentals remained stable.What detracted from performance?
Agency mortgages
|
Small detraction from security selection within agency mortgages.How Has The Fund Historically Performed?
Growth of $10,000 Investment
AVERAGE ANNUAL TOTAL RETURNS |
1 Year |
5 Years |
10 Years |
Invesco Quality Income Fund (Class C) —including sales charge |
6.46 % |
-0.97 % |
0.84 % |
Invesco Quality Income Fund (Class C) —excluding sales charge |
7.46 % |
-0.97 % |
0.84 % |
Bloomberg US Mortgage Backed Securities Index |
8.58 % |
0.15 % |
1.59 % |
Bloomberg U.S. Aggregate Bond Index |
7.30 % |
-0.36 % |
2.01 % |
invesco.com/performance
for more recent performance information.
What Are Key Statistics About The Fund?
(as of December 31, 2025)
| Fund net assets | $ 510,343,254 |
| Total number of portfolio holdings | 697 |
| Total advisory fees paid | $ 2,209,262 |
| Portfolio turnover rate | 349 % |
What Comprised The Fund's Holdings?
(as of December 31, 2025)
Top ten holdings*
(% of net assets)
| Government National Mortgage Association, TBA, 2.00%, 01/01/2056 | 3.81 % |
| Government National Mortgage Association, TBA, 2.50%, 01/01/2056 | 3.40 % |
| Uniform Mortgage-Backed Securities, TBA, 6.00%, 01/01/2056 | 3.17 % |
| Government National Mortgage Association, TBA, 5.00%, 01/01/2056 | 3.14 % |
| Government National Mortgage Association, TBA, 5.50%, 01/01/2056 | 3.00 % |
| Federal Home Loan Mortgage Corp., 2.50%, 10/01/2051 | 2.73 % |
| Government National Mortgage Association, TBA, 3.00%, 01/01/2056 | 2.08 % |
| Federal Home Loan Mortgage Corp., 2.00%, 05/01/2051 | 2.05 % |
| Federal Home Loan Mortgage Corp., 5.50%, 11/01/2052 | 2.04 % |
| Federal Home Loan Mortgage Corp., 2.50%, 04/01/2052 | 1.96 % |
| * Excluding money market fund holdings, if any. |
Security type allocation
(% of total investments)

Top ten holdings*
(% of net assets)
| Government National Mortgage Association, TBA, 2.00%, 01/01/2056 | 3.81 % |
| Government National Mortgage Association, TBA, 2.50%, 01/01/2056 | 3.40 % |
| Uniform Mortgage-Backed Securities, TBA, 6.00%, 01/01/2056 | 3.17 % |
| Government National Mortgage Association, TBA, 5.00%, 01/01/2056 | 3.14 % |
| Government National Mortgage Association, TBA, 5.50%, 01/01/2056 | 3.00 % |
| Federal Home Loan Mortgage Corp., 2.50%, 10/01/2051 | 2.73 % |
| Government National Mortgage Association, TBA, 3.00%, 01/01/2056 | 2.08 % |
| Federal Home Loan Mortgage Corp., 2.00%, 05/01/2051 | 2.05 % |
| Federal Home Loan Mortgage Corp., 5.50%, 11/01/2052 | 2.04 % |
| Federal Home Loan Mortgage Corp., 2.50%, 04/01/2052 | 1.96 % |
| * Excluding money market fund holdings, if any. |
invesco.com/reports
. You can also request this information by contacting us at (800) 959-4246
.
What Were The Fund Costs For The Last
Year
?
(Based on a hypothetical $10,000 investment)
Fund (Class) |
Costs of a $10,000 investment |
Costs paid as a percentage of a $10,000 investment |
| Invesco Quality Income Fund (Class R) |
$ 119 |
1.14 % † |
|
† |
Reflects fee waivers and/or expense reimbursements, without which expenses would have been higher. |
How Did The Fund Perform During The Period?
•
The Fund generated a positive return in 2025, supported by a broad decline in US Treasury yields of 40 to 80 basis points across the curve. Falling interest rates provided a favorable backdrop for duration sensitive assets, while credit and securitized sectors continued to benefit from stable economic conditions and resilient consumer fundamentals.•
For the fiscal year ended December 31, 2025, Class R shares of the Fund returned 7.96%. For the same time period, the Bloomberg US Mortgage Backed Securities Index returned 8.58%.What contributed to performance?
Asset-backed securities (ABS) |
During 2025, ABS delivered the strongest contribution, supported by attractive starting yields and continued demand for high quality securitized assets.Agency mortgage-backed securities (MBS) |
Agency MBS, which accounted for approximately 90% of the Fund during the period, added to performance, primarily due to declining rates and the Fund’s positioning in higher coupon collateral.Non-agency MBS |
Non-agency MBS contributed positively for the year as spreads tightened and fundamentals remained stable.What detracted from performance?
Agency mortgages
|
Small detraction from security selection within agency mortgages.How Has The Fund Historically Performed?
Growth of $10,000 Investment
AVERAGE ANNUAL TOTAL RETURNS |
1 Year |
5 Years |
10 Years |
Invesco Quality Income Fund (Class R) |
7.96 % |
-0.49 % |
1.17 % |
Bloomberg US Mortgage Backed Securities Index |
8.58 % |
0.15 % |
1.59 % |
Bloomberg U.S. Aggregate Bond Index |
7.30 % |
-0.36 % |
2.01 % |
invesco.com/performance
for more recent performance information.
What Are Key Statistics About The Fund?
(as of December 31, 2025)
| Fund net assets | $ 510,343,254 |
| Total number of portfolio holdings | 697 |
| Total advisory fees paid | $ 2,209,262 |
| Portfolio turnover rate | 349 % |
What Comprised The Fund's Holdings?
(as of December 31, 2025)
Top ten holdings*
(% of net assets)
| Government National Mortgage Association, TBA, 2.00%, 01/01/2056 | 3.81 % |
| Government National Mortgage Association, TBA, 2.50%, 01/01/2056 | 3.40 % |
| Uniform Mortgage-Backed Securities, TBA, 6.00%, 01/01/2056 | 3.17 % |
| Government National Mortgage Association, TBA, 5.00%, 01/01/2056 | 3.14 % |
| Government National Mortgage Association, TBA, 5.50%, 01/01/2056 | 3.00 % |
| Federal Home Loan Mortgage Corp., 2.50%, 10/01/2051 | 2.73 % |
| Government National Mortgage Association, TBA, 3.00%, 01/01/2056 | 2.08 % |
| Federal Home Loan Mortgage Corp., 2.00%, 05/01/2051 | 2.05 % |
| Federal Home Loan Mortgage Corp., 5.50%, 11/01/2052 | 2.04 % |
| Federal Home Loan Mortgage Corp., 2.50%, 04/01/2052 | 1.96 % |
| * Excluding money market fund holdings, if any. |
Security type allocation
(% of total investments)

Top ten holdings*
(% of net assets)
| Government National Mortgage Association, TBA, 2.00%, 01/01/2056 | 3.81 % |
| Government National Mortgage Association, TBA, 2.50%, 01/01/2056 | 3.40 % |
| Uniform Mortgage-Backed Securities, TBA, 6.00%, 01/01/2056 | 3.17 % |
| Government National Mortgage Association, TBA, 5.00%, 01/01/2056 | 3.14 % |
| Government National Mortgage Association, TBA, 5.50%, 01/01/2056 | 3.00 % |
| Federal Home Loan Mortgage Corp., 2.50%, 10/01/2051 | 2.73 % |
| Government National Mortgage Association, TBA, 3.00%, 01/01/2056 | 2.08 % |
| Federal Home Loan Mortgage Corp., 2.00%, 05/01/2051 | 2.05 % |
| Federal Home Loan Mortgage Corp., 5.50%, 11/01/2052 | 2.04 % |
| Federal Home Loan Mortgage Corp., 2.50%, 04/01/2052 | 1.96 % |
| * Excluding money market fund holdings, if any. |
invesco.com/reports
. You can also request this information by contacting us at (800) 959-4246
.
What Were The Fund Costs For The Last
Year
?
(Based on a hypothetical $10,000 investment)
Fund (Class) |
Costs of a $10,000 investment |
Costs paid as a percentage of a $10,000 investment |
| Invesco Quality Income Fund (Class Y) |
$ 67 |
0.64 % † |
|
† |
Reflects fee waivers and/or expense reimbursements, without which expenses would have been higher. |
How Did The Fund Perform During The Period?
•
The Fund generated a positive return in 2025, supported by a broad decline in US Treasury yields of 40 to 80 basis points across the curve. Falling interest rates provided a favorable backdrop for duration sensitive assets, while credit and securitized sectors continued to benefit from stable economic conditions and resilient consumer fundamentals.•
For the fiscal year ended December 31, 2025, Class Y shares of the Fund returned 8.48%. For the same time period, the Bloomberg US Mortgage Backed Securities Index returned 8.58%.What contributed to performance?
Asset-backed securities (ABS) |
During 2025, ABS delivered the strongest contribution, supported by attractive starting yields and continued demand for high quality securitized assets.Agency mortgage-backed securities (MBS) |
Agency MBS, which accounted for approximately 90% of the Fund during the period, added to performance, primarily due to declining rates and the Fund’s positioning in higher coupon collateral.Non-agency MBS |
Non-agency MBS contributed positively for the year as spreads tightened and fundamentals remained stable.What detracted from performance?
Agency mortgages
|
Small detraction from security selection within agency mortgages.How Has The Fund Historically Performed?
Growth of $10,000 Investment
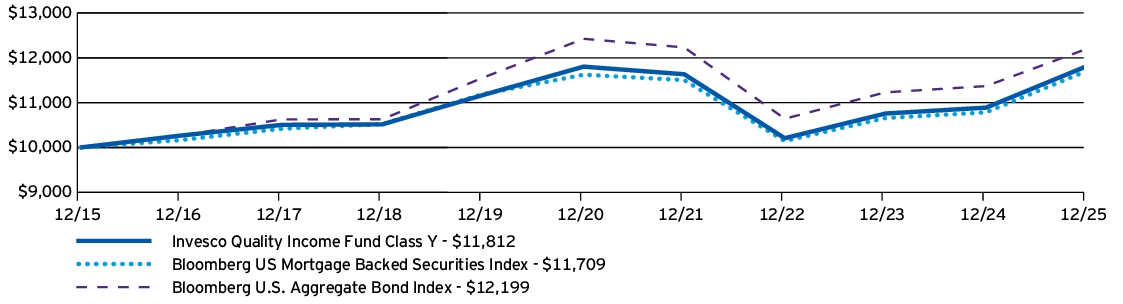
AVERAGE ANNUAL TOTAL RETURNS |
1 Year |
5 Years |
10 Years |
Invesco Quality Income Fund (Class Y) |
8.48 % |
0.02 % |
1.68 % |
Bloomberg US Mortgage Backed Securities Index |
8.58 % |
0.15 % |
1.59 % |
Bloomberg U.S. Aggregate Bond Index |
7.30 % |
-0.36 % |
2.01 % |
invesco.com/performance
for more recent performance information.
What Are Key Statistics About The Fund?
(as of December 31, 2025)
| Fund net assets | $ 510,343,254 |
| Total number of portfolio holdings | 697 |
| Total advisory fees paid | $ 2,209,262 |
| Portfolio turnover rate | 349 % |
What Comprised The Fund's Holdings?
(as of December 31, 2025)
Top ten holdings*
(% of net assets)
| Government National Mortgage Association, TBA, 2.00%, 01/01/2056 | 3.81 % |
| Government National Mortgage Association, TBA, 2.50%, 01/01/2056 | 3.40 % |
| Uniform Mortgage-Backed Securities, TBA, 6.00%, 01/01/2056 | 3.17 % |
| Government National Mortgage Association, TBA, 5.00%, 01/01/2056 | 3.14 % |
| Government National Mortgage Association, TBA, 5.50%, 01/01/2056 | 3.00 % |
| Federal Home Loan Mortgage Corp., 2.50%, 10/01/2051 | 2.73 % |
| Government National Mortgage Association, TBA, 3.00%, 01/01/2056 | 2.08 % |
| Federal Home Loan Mortgage Corp., 2.00%, 05/01/2051 | 2.05 % |
| Federal Home Loan Mortgage Corp., 5.50%, 11/01/2052 | 2.04 % |
| Federal Home Loan Mortgage Corp., 2.50%, 04/01/2052 | 1.96 % |
| * Excluding money market fund holdings, if any. |
Security type allocation
(% of total investments)

Top ten holdings*
(% of net assets)
| Government National Mortgage Association, TBA, 2.00%, 01/01/2056 | 3.81 % |
| Government National Mortgage Association, TBA, 2.50%, 01/01/2056 | 3.40 % |
| Uniform Mortgage-Backed Securities, TBA, 6.00%, 01/01/2056 | 3.17 % |
| Government National Mortgage Association, TBA, 5.00%, 01/01/2056 | 3.14 % |
| Government National Mortgage Association, TBA, 5.50%, 01/01/2056 | 3.00 % |
| Federal Home Loan Mortgage Corp., 2.50%, 10/01/2051 | 2.73 % |
| Government National Mortgage Association, TBA, 3.00%, 01/01/2056 | 2.08 % |
| Federal Home Loan Mortgage Corp., 2.00%, 05/01/2051 | 2.05 % |
| Federal Home Loan Mortgage Corp., 5.50%, 11/01/2052 | 2.04 % |
| Federal Home Loan Mortgage Corp., 2.50%, 04/01/2052 | 1.96 % |
| * Excluding money market fund holdings, if any. |
invesco.com/reports
. You can also request this information by contacting us at (800) 959-4246
.
What Were The Fund Costs For The Last
Year
?
(Based on a hypothetical $10,000 investment)
Fund (Class) |
Costs of a $10,000 investment |
Costs paid as a percentage of a $10,000 investment |
| Invesco Quality Income Fund (Class R5) |
$ 63 |
0.60 % |
How Did The Fund Perform During The Period?
•
The Fund generated a positive return in 2025, supported by a broad decline in US Treasury yields of 40 to 80 basis points across the curve. Falling interest rates provided a favorable backdrop for duration sensitive assets, while credit and securitized sectors continued to benefit from stable economic conditions and resilient consumer fundamentals.•
For the fiscal year ended December 31, 2025, Class R5 shares of the Fund returned 8.43%. For the same time period, the Bloomberg US Mortgage Backed Securities Index returned 8.58%.What contributed to performance?
Asset-backed securities (ABS) |
During 2025, ABS delivered the strongest contribution, supported by attractive starting yields and continued demand for high quality securitized assets.Agency mortgage-backed securities (MBS) |
Agency MBS, which accounted for approximately 90% of the Fund during the period, added to performance, primarily due to declining rates and the Fund’s positioning in higher coupon collateral.Non-agency MBS |
Non-agency MBS contributed positively for the year as spreads tightened and fundamentals remained stable.What detracted from performance?
Agency mortgages
|
Small detraction from security selection within agency mortgages.How Has The Fund Historically Performed?
Growth of $10,000 Investment
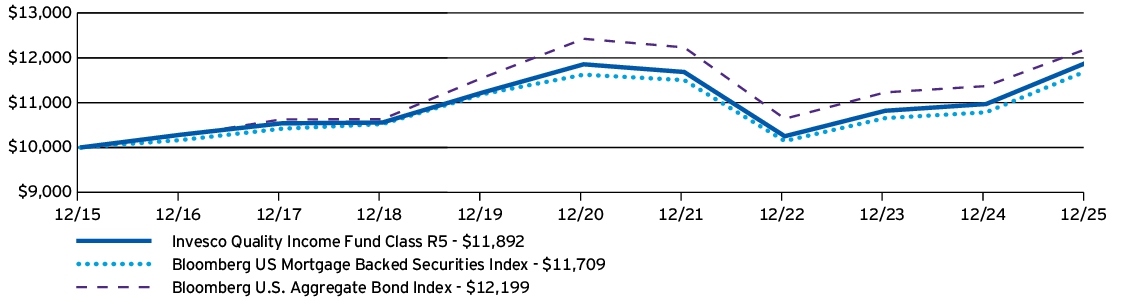
AVERAGE ANNUAL TOTAL RETURNS |
1 Year |
5 Years |
10 Years |
Invesco Quality Income Fund (Class R5) |
8.43 % |
0.06 % |
1.75 % |
Bloomberg US Mortgage Backed Securities Index |
8.58 % |
0.15 % |
1.59 % |
Bloomberg U.S. Aggregate Bond Index |
7.30 % |
-0.36 % |
2.01 % |
invesco.com/performance
for more recent performance information.
What Are Key Statistics About The Fund?
(as of December 31, 2025)
| Fund net assets | $ 510,343,254 |
| Total number of portfolio holdings | 697 |
| Total advisory fees paid | $ 2,209,262 |
| Portfolio turnover rate | 349 % |
What Comprised The Fund's Holdings?
(as of December 31, 2025)
Top ten holdings*
(% of net assets)
| Government National Mortgage Association, TBA, 2.00%, 01/01/2056 | 3.81 % |
| Government National Mortgage Association, TBA, 2.50%, 01/01/2056 | 3.40 % |
| Uniform Mortgage-Backed Securities, TBA, 6.00%, 01/01/2056 | 3.17 % |
| Government National Mortgage Association, TBA, 5.00%, 01/01/2056 | 3.14 % |
| Government National Mortgage Association, TBA, 5.50%, 01/01/2056 | 3.00 % |
| Federal Home Loan Mortgage Corp., 2.50%, 10/01/2051 | 2.73 % |
| Government National Mortgage Association, TBA, 3.00%, 01/01/2056 | 2.08 % |
| Federal Home Loan Mortgage Corp., 2.00%, 05/01/2051 | 2.05 % |
| Federal Home Loan Mortgage Corp., 5.50%, 11/01/2052 | 2.04 % |
| Federal Home Loan Mortgage Corp., 2.50%, 04/01/2052 | 1.96 % |
| * Excluding money market fund holdings, if any. |
Security type allocation
(% of total investments)

Top ten holdings*
(% of net assets)
| Government National Mortgage Association, TBA, 2.00%, 01/01/2056 | 3.81 % |
| Government National Mortgage Association, TBA, 2.50%, 01/01/2056 | 3.40 % |
| Uniform Mortgage-Backed Securities, TBA, 6.00%, 01/01/2056 | 3.17 % |
| Government National Mortgage Association, TBA, 5.00%, 01/01/2056 | 3.14 % |
| Government National Mortgage Association, TBA, 5.50%, 01/01/2056 | 3.00 % |
| Federal Home Loan Mortgage Corp., 2.50%, 10/01/2051 | 2.73 % |
| Government National Mortgage Association, TBA, 3.00%, 01/01/2056 | 2.08 % |
| Federal Home Loan Mortgage Corp., 2.00%, 05/01/2051 | 2.05 % |
| Federal Home Loan Mortgage Corp., 5.50%, 11/01/2052 | 2.04 % |
| Federal Home Loan Mortgage Corp., 2.50%, 04/01/2052 | 1.96 % |
| * Excluding money market fund holdings, if any. |
invesco.com/reports
. You can also request this information by contacting us at (800) 959-4246
.
What Were The Fund Costs For The Last
Year
?
(Based on a hypothetical $10,000 investment)
Fund (Class) |
Costs of a $10,000 investment |
Costs paid as a percentage of a $10,000 investment |
| Invesco Quality Income Fund (Class R6) |
$ 56 |
0.54 % |
How Did The Fund Perform During The Period?
•
The Fund generated a positive return in 2025, supported by a broad decline in US Treasury yields of 40 to 80 basis points across the curve. Falling interest rates provided a favorable backdrop for duration sensitive assets, while credit and securitized sectors continued to benefit from stable economic conditions and resilient consumer fundamentals.•
For the fiscal year ended December 31, 2025, Class R6 shares of the Fund returned 8.60%. For the same time period, the Bloomberg US Mortgage Backed Securities Index returned 8.58%.What contributed to performance?
Asset-backed securities (ABS) |
During 2025, ABS delivered the strongest contribution, supported by attractive starting yields and continued demand for high quality securitized assets.Agency mortgage-backed securities (MBS) |
Agency MBS, which accounted for approximately 90% of the Fund during the period, added to performance, primarily due to declining rates and the Fund’s positioning in higher coupon collateral.Non-agency MBS |
Non-agency MBS contributed positively for the year as spreads tightened and fundamentals remained stable.What detracted from performance?
Agency mortgages
|
Small detraction from security selection within agency mortgages.How Has The Fund Historically Performed?
Growth of $10,000 Investment
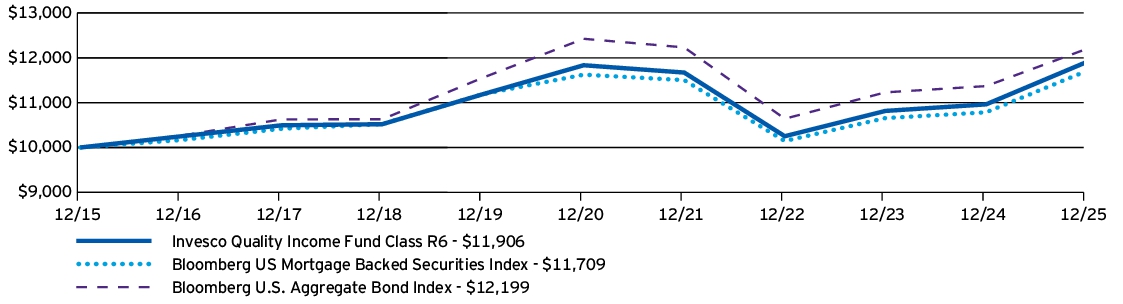
AVERAGE ANNUAL TOTAL RETURNS |
1 Year |
5 Years |
10 Years |
Invesco Quality Income Fund (Class R6) |
8.60 % |
0.12 % |
1.76 % |
Bloomberg US Mortgage Backed Securities Index |
8.58 % |
0.15 % |
1.59 % |
Bloomberg U.S. Aggregate Bond Index |
7.30 % |
-0.36 % |
2.01 % |
invesco.com/performance
for more recent performance information.
What Are Key Statistics About The Fund?
(as of December 31, 2025)
| Fund net assets | $ 510,343,254 |
| Total number of portfolio holdings | 697 |
| Total advisory fees paid | $ 2,209,262 |
| Portfolio turnover rate | 349 % |
What Comprised The Fund's Holdings?
(as of December 31, 2025)
Top ten holdings*
(% of net assets)
| Government National Mortgage Association, TBA, 2.00%, 01/01/2056 | 3.81 % |
| Government National Mortgage Association, TBA, 2.50%, 01/01/2056 | 3.40 % |
| Uniform Mortgage-Backed Securities, TBA, 6.00%, 01/01/2056 | 3.17 % |
| Government National Mortgage Association, TBA, 5.00%, 01/01/2056 | 3.14 % |
| Government National Mortgage Association, TBA, 5.50%, 01/01/2056 | 3.00 % |
| Federal Home Loan Mortgage Corp., 2.50%, 10/01/2051 | 2.73 % |
| Government National Mortgage Association, TBA, 3.00%, 01/01/2056 | 2.08 % |
| Federal Home Loan Mortgage Corp., 2.00%, 05/01/2051 | 2.05 % |
| Federal Home Loan Mortgage Corp., 5.50%, 11/01/2052 | 2.04 % |
| Federal Home Loan Mortgage Corp., 2.50%, 04/01/2052 | 1.96 % |
| * Excluding money market fund holdings, if any. |
Security type allocation
(% of total investments)
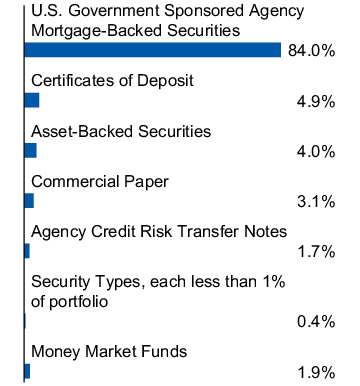
Top ten holdings*
(% of net assets)
| Government National Mortgage Association, TBA, 2.00%, 01/01/2056 | 3.81 % |
| Government National Mortgage Association, TBA, 2.50%, 01/01/2056 | 3.40 % |
| Uniform Mortgage-Backed Securities, TBA, 6.00%, 01/01/2056 | 3.17 % |
| Government National Mortgage Association, TBA, 5.00%, 01/01/2056 | 3.14 % |
| Government National Mortgage Association, TBA, 5.50%, 01/01/2056 | 3.00 % |
| Federal Home Loan Mortgage Corp., 2.50%, 10/01/2051 | 2.73 % |
| Government National Mortgage Association, TBA, 3.00%, 01/01/2056 | 2.08 % |
| Federal Home Loan Mortgage Corp., 2.00%, 05/01/2051 | 2.05 % |
| Federal Home Loan Mortgage Corp., 5.50%, 11/01/2052 | 2.04 % |
| Federal Home Loan Mortgage Corp., 2.50%, 04/01/2052 | 1.96 % |
| * Excluding money market fund holdings, if any. |
invesco.com/reports
. You can also request this information by contacting us at (800) 959-4246
.
What Were The Fund Costs For The Last
Year
?
(Based on a hypothetical $10,000 investment)
Fund (Class) |
Costs of a $10,000 investment |
Costs paid as a percentage of a $10,000 investment |
| Invesco Select Risk: Conservative Investor Fund (Class A) |
$ 42 |
0.40 % |
How Did The Fund Perform During The Period?
•
2025 was a year of change, especially in geopolitics. Tariffs dominated headlines, Europe kicked off new defense spending and the artificial intelligence trade was strong. Despite a year of change, global risk assets rallied and performed well.•
For the fiscal year ended December 31, 2025, Class A shares of the Fund, excluding sales charge, returned 9.37%. For the same time period, the Custom Invesco Select Risk: Conservative Investor Index (the "Benchmark") returned 8.32%.What contributed to performance?
Asset allocation - Fixed Income |
The Fund's underweight to fixed income relative to the Benchmark was a positive contributor to relative return given equities outperformed fixed income.Asset allocation - Equity |
The Fund's equity exposure relative to the Benchmark was a positive contributor to relative return given equities outperformed the Benchmark.Asset allocation - Alternatives |
The Fund's exposure to alternatives relative to the Benchmark was a positive contributor to relative return.What detracted from performance?
Fixed Income manager selection
|
The Fund's fixed income manager selection effects detracted from the Fund's relative performance, with key detractors being selection within core plus and core fixed income.Alternative manager selection |
The Fund's alternative manager selection effects were the largest detractors from the Fund's relative performance, with key detractors being selection within managed futures.Equity manager selection |
The Fund's equity manager selection effects detracted from the Fund's relative performance, with key detractors being selection within global and international smid-cap equities.How Has The Fund Historically Performed?
Growth of $10,000 Investment
AVERAGE ANNUAL TOTAL RETURNS |
1 Year |
5 Years |
10 Years |
Invesco Select Risk: Conservative Investor Fund (Class A) —including sales charge |
3.40 % |
0.26 % |
3.12 % |
Invesco Select Risk: Conservative Investor Fund (Class A) —excluding sales charge |
9.37 % |
1.39 % |
3.71 % |
Custom Invesco Select Risk: Conservative Investor Index |
8.32 % |
2.57 % |
4.38 % |
Bloomberg Global Aggregate USD Hedged Index |
4.86 % |
0.34 % |
2.39 % |
Bloomberg U.S. Aggregate Bond Index |
7.30 % |
-0.36 % |
2.01 % |
MSCI ACWI Index (Net) |
22.34 % |
11.19 % |
11.72 % |
invesco.com/performance
for more recent performance information.
What Are Key Statistics About The Fund?
(as of December 31, 2025)
| Fund net assets | $ 362,971,422 |
| Total number of portfolio holdings | 31 |
| Total advisory fees paid | $ 0 |
| Portfolio turnover rate | 21 % |
What Comprised The Fund's Holdings?
(as of December 31, 2025)
Asset allocation
(% of net assets)

How Has The Fund Changed Over The Past Year?
This is a summary of certain changes to the Fund since December 31, 2024. For more complete information, you may review the Fund's prospectus, which is available at
invesco.com/reports
or upon request at (800) 959-4246
.
The Fund added unlisted closed-end interval fund risk to its principal risks to reflect that shares of an underlying unlisted closed-end interval fund in which the Fund may invest are considered an illiquid investment because shareholders (such as the Fund) cannot redeem or sell their shares outside of periodic repurchase offers.
invesco.com/reports
or upon request at (800) 959-4246
.
invesco.com/reports
. You can also request this information by contacting us at (800) 959-4246
.
What Were The Fund Costs For The Last
Year
?
(Based on a hypothetical $10,000 investment)
Fund (Class) |
Costs of a $10,000 investment |
Costs paid as a percentage of a $10,000 investment |
| Invesco Select Risk: Conservative Investor Fund (Class C) |
$ 121 |
1.16 % |
How Did The Fund Perform During The Period?
•
2025 was a year of change, especially in geopolitics. Tariffs dominated headlines, Europe kicked off new defense spending and the artificial intelligence trade was strong. Despite a year of change, global risk assets rallied and performed well.•
For the fiscal year ended December 31, 2025, Class C shares of the Fund, excluding sales charge, returned 8.49%. For the same time period, the Custom Invesco Select Risk: Conservative Investor Index (the "Benchmark") returned 8.32%.What contributed to performance?
Asset allocation - Fixed Income |
The Fund's underweight to fixed income relative to the Benchmark was a positive contributor to relative return given equities outperformed fixed income.Asset allocation - Equity |
The Fund's equity exposure relative to the Benchmark was a positive contributor to relative return given equities outperformed the Benchmark.Asset allocation - Alternatives |
The Fund's exposure to alternatives relative to the Benchmark was a positive contributor to relative return.What detracted from performance?
Fixed Income manager selection
|
The Fund's fixed income manager selection effects detracted from the Fund's relative performance, with key detractors being selection within core plus and core fixed income.Alternative manager selection |
The Fund's alternative manager selection effects were the largest detractors from the Fund's relative performance, with key detractors being selection within managed futures.Equity manager selection |
The Fund's equity manager selection effects detracted from the Fund's relative performance, with key detractors being selection within global and international smid-cap equities.How Has The Fund Historically Performed?
Growth of $10,000 Investment
AVERAGE ANNUAL TOTAL RETURNS |
1 Year |
5 Years |
10 Years |
Invesco Select Risk: Conservative Investor Fund (Class C) —including sales charge |
7.49 % |
0.61 % |
3.09 % |
Invesco Select Risk: Conservative Investor Fund (Class C) —excluding sales charge |
8.49 % |
0.61 % |
3.09 % |
Custom Invesco Select Risk: Conservative Investor Index |
8.32 % |
2.57 % |
4.38 % |
Bloomberg Global Aggregate USD Hedged Index |
4.86 % |
0.34 % |
2.39 % |
Bloomberg U.S. Aggregate Bond Index |
7.30 % |
-0.36 % |
2.01 % |
MSCI ACWI Index (Net) |
22.34 % |
11.19 % |
11.72 % |
invesco.com/performance
for more recent performance information.
What Are Key Statistics About The Fund?
(as of December 31, 2025)
| Fund net assets | $ 362,971,422 |
| Total number of portfolio holdings | 31 |
| Total advisory fees paid | $ 0 |
| Portfolio turnover rate | 21 % |
What Comprised The Fund's Holdings?
(as of December 31, 2025)
Asset allocation
(% of net assets)

How Has The Fund Changed Over The Past Year?
This is a summary of certain changes to the Fund since December 31, 2024. For more complete information, you may review the Fund's prospectus, which is available at
invesco.com/reports
or upon request at (800) 959-4246
.
The Fund added unlisted closed-end interval fund risk to its principal risks to reflect that shares of an underlying unlisted closed-end interval fund in which the Fund may invest are considered an illiquid investment because shareholders (such as the Fund) cannot redeem or sell their shares outside of periodic repurchase offers.
invesco.com/reports
or upon request at (800) 959-4246
.
invesco.com/reports
. You can also request this information by contacting us at (800) 959-4246
.
What Were The Fund Costs For The Last
Year
?
(Based on a hypothetical $10,000 investment)
Fund (Class) |
Costs of a $10,000 investment |
Costs paid as a percentage of a $10,000 investment |
| Invesco Select Risk: Conservative Investor Fund (Class R) |
$ 69 |
0.66 % |
How Did The Fund Perform During The Period?
•
2025 was a year of change, especially in geopolitics. Tariffs dominated headlines, Europe kicked off new defense spending and the artificial intelligence trade was strong. Despite a year of change, global risk assets rallied and performed well.•
For the fiscal year ended December 31, 2025, Class R shares of the Fund returned 9.11%. For the same time period, the Custom Invesco Select Risk: Conservative Investor Index (the "Benchmark") returned 8.32%.What contributed to performance?
Asset allocation - Fixed Income |
The Fund's underweight to fixed income relative to the Benchmark was a positive contributor to relative return given equities outperformed fixed income.Asset allocation - Equity |
The Fund's equity exposure relative to the Benchmark was a positive contributor to relative return given equities outperformed the Benchmark.Asset allocation - Alternatives |
The Fund's exposure to alternatives relative to the Benchmark was a positive contributor to relative return.What detracted from performance?
Fixed Income manager selection
|
The Fund's fixed income manager selection effects detracted from the Fund's relative performance, with key detractors being selection within core plus and core fixed income.Alternative manager selection |
The Fund's alternative manager selection effects were the largest detractors from the Fund's relative performance, with key detractors being selection within managed futures.Equity manager selection |
The Fund's equity manager selection effects detracted from the Fund's relative performance, with key detractors being selection within global and international smid-cap equities.How Has The Fund Historically Performed?
Growth of $10,000 Investment
AVERAGE ANNUAL TOTAL RETURNS |
1 Year |
5 Years |
10 Years |
Invesco Select Risk: Conservative Investor Fund (Class R) |
9.11 % |
1.12 % |
3.44 % |
Custom Invesco Select Risk: Conservative Investor Index |
8.32 % |
2.57 % |
4.38 % |
Bloomberg Global Aggregate USD Hedged Index |
4.86 % |
0.34 % |
2.39 % |
Bloomberg U.S. Aggregate Bond Index |
7.30 % |
-0.36 % |
2.01 % |
MSCI ACWI Index (Net) |
22.34 % |
11.19 % |
11.72 % |
invesco.com/performance
for more recent performance information.
What Are Key Statistics About The Fund?
(as of December 31, 2025)
| Fund net assets | $ 362,971,422 |
| Total number of portfolio holdings | 31 |
| Total advisory fees paid | $ 0 |
| Portfolio turnover rate | 21 % |
What Comprised The Fund's Holdings?
(as of December 31, 2025)
Asset allocation
(% of net assets)

How Has The Fund Changed Over The Past Year?
This is a summary of certain changes to the Fund since December 31, 2024. For more complete information, you may review the Fund's prospectus, which is available at
invesco.com/reports
or upon request at (800) 959-4246
.
The Fund added unlisted closed-end interval fund risk to its principal risks to reflect that shares of an underlying unlisted closed-end interval fund in which the Fund may invest are considered an illiquid investment because shareholders (such as the Fund) cannot redeem or sell their shares outside of periodic repurchase offers.
invesco.com/reports
or upon request at (800) 959-4246
.
invesco.com/reports
. You can also request this information by contacting us at (800) 959-4246
.
What Were The Fund Costs For The Last
Year
?
(Based on a hypothetical $10,000 investment)
Fund (Class) | Costs of a $10,000 investment | Costs paid as a percentage of a $10,000 investment |
| Invesco Select Risk: Conservative Investor Fund (Class Y) | $ 17 | 0.16 % |
How Did The Fund Perform During The Period?
•
2025 was a year of change, especially in geopolitics. Tariffs dominated headlines, Europe kicked off new defense spending and the artificial intelligence trade was strong. Despite a year of change, global risk assets rallied and performed well.•
For the fiscal year ended December 31, 2025, Class Y shares of the Fund returned 9.59%. For the same time period, the Custom Invesco Select Risk: Conservative Investor Index (the "Benchmark") returned 8.32%.What contributed to performance?
Asset allocation - Fixed Income |
The Fund's underweight to fixed income relative to the Benchmark was a positive contributor to relative return given equities outperformed fixed income.Asset allocation - Equity |
The Fund's equity exposure relative to the Benchmark was a positive contributor to relative return given equities outperformed the Benchmark.Asset allocation - Alternatives |
The Fund's exposure to alternatives relative to the Benchmark was a positive contributor to relative return.What detracted from performance?
Fixed Income manager selection
|
The Fund's fixed income manager selection effects detracted from the Fund's relative performance, with key detractors being selection within core plus and core fixed income.Alternative manager selection |
The Fund's alternative manager selection effects were the largest detractors from the Fund's relative performance, with key detractors being selection within managed futures.Equity manager selection |
The Fund's equity manager selection effects detracted from the Fund's relative performance, with key detractors being selection within global and international smid-cap equities.How Has The Fund Historically Performed?
Growth of $10,000 Investment
AVERAGE ANNUAL TOTAL RETURNS | 1 Year | 5 Years | 10 Years |
Invesco Select Risk: Conservative Investor Fund (Class Y) | 9.59 % | 1.62 % | 3.96 % |
Custom Invesco Select Risk: Conservative Investor Index | 8.32 % | 2.57 % | 4.38 % |
Bloomberg Global Aggregate USD Hedged Index | 4.86 % | 0.34 % | 2.39 % |
Bloomberg U.S. Aggregate Bond Index | 7.30 % | -0.36 % | 2.01 % |
MSCI ACWI Index (Net) | 22.34 % | 11.19 % | 11.72 % |
invesco.com/performance
for more recent performance information.
What Are Key Statistics About The Fund?
(as of December 31, 2025)
| Fund net assets | $ 362,971,422 |
| Total number of portfolio holdings | 31 |
| Total advisory fees paid | $ 0 |
| Portfolio turnover rate | 21 % |
What Comprised The Fund's Holdings?
(as of December 31, 2025)
Asset allocation
(% of net assets)
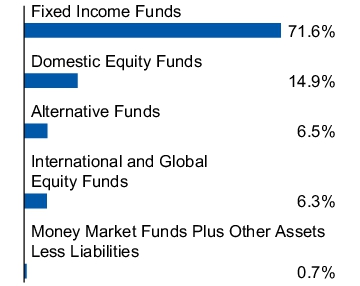
How Has The Fund Changed Over The Past Year?
This is a summary of certain changes to the Fund since December 31, 2024. For more complete information, you may review the Fund's prospectus, which is available at
invesco.com/reports
or upon request at (800) 959-4246
.
The Fund added unlisted closed-end interval fund risk to its principal risks to reflect that shares of an underlying unlisted closed-end interval fund in which the Fund may invest are considered an illiquid investment because shareholders (such as the Fund) cannot redeem or sell their shares outside of periodic repurchase offers.
invesco.com/reports
or upon request at (800) 959-4246
.
invesco.com/reports
. You can also request this information by contacting us at (800) 959-4246
.
This report describes changes to the Fund that occurred during the reporti
What Were The Fund Costs For The Last
Year
?
(Based on a hypothetical $10,000 investment)
Fund (Class) |
Costs of a $10,000 investment |
Costs paid as a percentage of a $10,000 investment |
| Invesco Select Risk: Conservative Investor Fund (Class R5) |
$ 9 |
0.09 % |
How Did The Fund Perform During The Period?
•
2025 was a year of change, especially in geopolitics. Tariffs dominated headlines, Europe kicked off new defense spending and the artificial intelligence trade was strong. Despite a year of change, global risk assets rallied and performed well.•
For the fiscal year ended December 31, 2025, Class R5 shares of the Fund returned 9.73%. For the same time period, the Custom Invesco Select Risk: Conservative Investor Index (the "Benchmark") returned 8.32%.What contributed to performance?
Asset allocation - Fixed Income |
The Fund's underweight to fixed income relative to the Benchmark was a positive contributor to relative return given equities outperformed fixed income.Asset allocation - Equity |
The Fund's equity exposure relative to the Benchmark was a positive contributor to relative return given equities outperformed the Benchmark.Asset allocation - Alternatives |
The Fund's exposure to alternatives relative to the Benchmark was a positive contributor to relative return.What detracted from performance?
Fixed Income manager selection
|
The Fund's fixed income manager selection effects detracted from the Fund's relative performance, with key detractors being selection within core plus and core fixed income.Alternative manager selection |
The Fund's alternative manager selection effects were the largest detractors from the Fund's relative performance, with key detractors being selection within managed futures.Equity manager selection |
The Fund's equity manager selection effects detracted from the Fund's relative performance, with key detractors being selection within global and international smid-cap equities.How Has The Fund Historically Performed?
Growth of $10,000 Investment
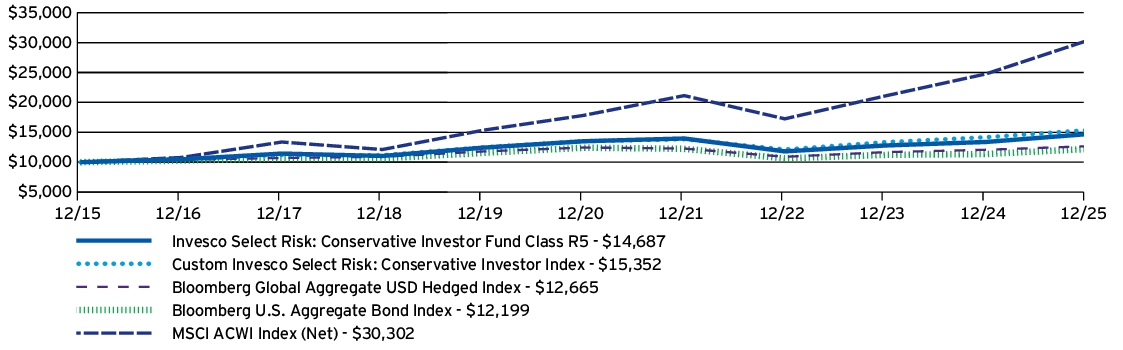
AVERAGE ANNUAL TOTAL RETURNS |
1 Year |
5 Years |
10 Years |
Invesco Select Risk: Conservative Investor Fund (Class R5) |
9.73 % |
1.69 % |
3.92 % |
Custom Invesco Select Risk: Conservative Investor Index |
8.32 % |
2.57 % |
4.38 % |
Bloomberg Global Aggregate USD Hedged Index |
4.86 % |
0.34 % |
2.39 % |
Bloomberg U.S. Aggregate Bond Index |
7.30 % |
-0.36 % |
2.01 % |
MSCI ACWI Index (Net) |
22.34 % |
11.19 % |
11.72 % |
invesco.com/performance
for more recent performance information.
What Are Key Statistics About The Fund?
(as of December 31, 2025)
| Fund net assets | $ 362,971,422 |
| Total number of portfolio holdings | 31 |
| Total advisory fees paid | $ 0 |
| Portfolio turnover rate | 21 % |
What Comprised The Fund's Holdings?
(as of December 31, 2025)
Asset allocation
(% of net assets)

How Has The Fund Changed Over The Past Year?
This is a summary of certain changes to the Fund since December 31, 2024. For more complete information, you may review the Fund's prospectus, which is available at
invesco.com/reports
or upon request at (800) 959-4246
.
The Fund added unlisted closed-end interval fund risk to its principal risks to reflect that shares of an underlying unlisted closed-end interval fund in which the Fund may invest are considered an illiquid investment because shareholders (such as the Fund) cannot redeem or sell their shares outside of periodic repurchase offers.
invesco.com/reports
or upon request at (800) 959-4246
.
invesco.com/reports
. You can also request this information by contacting us at (800) 959-4246
.
What Were The Fund Costs For The Last
Year
?
(Based on a hypothetical $10,000 investment)
Fund (Class) | Costs of a $10,000 investment | Costs paid as a percentage of a $10,000 investment |
| Invesco Select Risk: Conservative Investor Fund (Class R6) | $ 9 | 0.09 % |
How Did The Fund Perform During The Period?
•
2025 was a year of change, especially in geopolitics. Tariffs dominated headlines, Europe kicked off new defense spending and the artificial intelligence trade was strong. Despite a year of change, global risk assets rallied and performed well.•
For the fiscal year ended December 31, 2025, Class R6 shares of the Fund returned 9.73%. For the same time period, the Custom Invesco Select Risk: Conservative Investor Index (the "Benchmark") returned 8.32%.What contributed to performance?
Asset allocation - Fixed Income |
The Fund's underweight to fixed income relative to the Benchmark was a positive contributor to relative return given equities outperformed fixed income.Asset allocation - Equity |
The Fund's equity exposure relative to the Benchmark was a positive contributor to relative return given equities outperformed the Benchmark.Asset allocation - Alternatives |
The Fund's exposure to alternatives relative to the Benchmark was a positive contributor to relative return.What detracted from performance?
Fixed Income manager selection
|
The Fund's fixed income manager selection effects detracted from the Fund's relative performance, with key detractors being selection within core plus and core fixed income.Alternative manager selection |
The Fund's alternative manager selection effects were the largest detractors from the Fund's relative performance, with key detractors being selection within managed futures.Equity manager selection |
The Fund's equity manager selection effects detracted from the Fund's relative performance, with key detractors being selection within global and international smid-cap equities.How Has The Fund Historically Performed?
Growth of $10,000 Investment

AVERAGE ANNUAL TOTAL RETURNS | 1 Year | 5 Years | 10 Years |
Invesco Select Risk: Conservative Investor Fund (Class R6) | 9.73 % | 1.70 % | 3.92 % |
Custom Invesco Select Risk: Conservative Investor Index | 8.32 % | 2.57 % | 4.38 % |
Bloomberg Global Aggregate USD Hedged Index | 4.86 % | 0.34 % | 2.39 % |
Bloomberg U.S. Aggregate Bond Index | 7.30 % | -0.36 % | 2.01 % |
MSCI ACWI Index (Net) | 22.34 % | 11.19 % | 11.72 % |
invesco.com/performance
for more recent performance information.
What Are Key Statistics About The Fund?
(as of December 31, 2025)
| Fund net assets | $ 362,971,422 |
| Total number of portfolio holdings | 31 |
| Total advisory fees paid | $ 0 |
| Portfolio turnover rate | 21 % |
What Comprised The Fund's Holdings?
(as of December 31, 2025)
Asset allocation
(% of net assets)

How Has The Fund Changed Over The Past Year?
This is a summary of certain changes to the Fund since December 31, 2024. For more complete information, you may review the Fund's prospectus, which is available at
invesco.com/reports
or upon request at (800) 959-4246
.
The Fund added unlisted closed-end interval fund risk to its principal risks to reflect that shares of an underlying unlisted closed-end interval fund in which the Fund may invest are considered an illiquid investment because shareholders (such as the Fund) cannot redeem or sell their shares outside of periodic repurchase offers.
invesco.com/reports
or upon request at (800) 959-4246
.
invesco.com/reports
. You can also request this information by contacting us at (800) 959-4246
.
What Were The Fund Costs For The Last
Year
?
(Based on a hypothetical $10,000 investment)
Fund (Class) |
Costs of a $10,000 investment |
Costs paid as a percentage of a $10,000 investment |
| Invesco Select Risk: Growth Investor Fund (Class A) |
$ 44 |
0.41 % |
How Did The Fund Perform During The Period?
•
2025 was a year of change, especially in geopolitics. Tariffs dominated headlines, Europe kicked off new defense spending and the artificial intelligence trade was strong. Despite a year of change, global risk assets rallied and performed well.•
For the fiscal year ended December 31, 2025, Class A shares of the Fund, excluding sales charge, returned 15.49%. For the same time period, the Custom Invesco Select Risk: Growth Investor Index (the "Benchmark") returned 18.71%.What contributed to performance?
Asset allocation - Fixed Income |
The Fund's underweight to fixed income relative to the Benchmark was the largest positive contributor to relative return given equities outperformed fixed income.Asset allocation - Equity |
The Fund's equity exposure relative to the Benchmark was a positive contributor to relative return given equities outperformed the Benchmark.What detracted from performance?
Equity manager selection
|
The Fund's equity manager selection effects were the largest detractors from the Fund's relative performance, with key detractors being selection within global and international smid-cap equities.Equity style selection |
The Fund's equity style effects detracted from relative performance given the Fund's exposure to US large-cap multifactor and US mid-cap growth equities.Fixed Income manager selection |
The Fund's fixed income manager selection effects detracted from relative performance within core and core plus fixed income.How Has The Fund Histor
icall
y Performed?Growth of $10,000
Investment
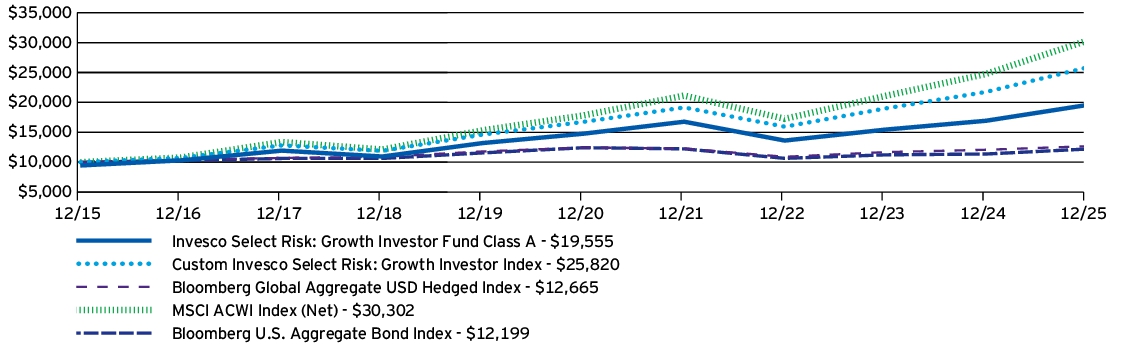
AVERAGE ANNUAL TOTAL RETURNS |
1 Year |
5 Years |
10 Years |
Invesco Select Risk: Growth Investor Fund (Class A) —including sales charge |
9.10 % |
4.58 % |
6.94 % |
Invesco Select Risk: Growth Investor Fund (Class A) —excluding sales charge |
15.49 % |
5.77 % |
7.54 % |
Custom Invesco Select Risk: Growth Investor Index |
18.71 % |
9.04 % |
9.95 % |
Bloomberg Global Aggregate USD Hedged Index |
4.86 % |
0.34 % |
2.39 % |
MSCI ACWI Index (Net) |
22.34 % |
11.19 % |
11.72 % |
Bloomberg U.S. Aggregate Bond Index |
7.30 % |
-0.36 % |
2.01 % |
invesco.com/performance
for more recent performance information.
What Are Key Statistics About The Fund?
(as of December 31, 2025)
| Fund net assets | $ 1,042,844,600 |
| Total number of portfolio holdings | 30 |
| Total advisory fees paid | $ 0 |
| Portfolio turnover rate | 32 % |
What Comprised The Fund's Holdings?
(as of December 31, 2025)
Asset allocation
(% of net assets)

How Has The Fund Changed Over The Past Year?
This is a summary of certain changes to the Fund since December 31, 2024. For more complete information, you may review the Fund's prospectus, which is available at
invesco.com/reports
or upon request at (800) 959-4246
.
The Fund added unlisted closed-end interval fund risk to its principal risks to reflect that shares of an underlying unlisted closed-end interval fund in which the Fund may invest are considered an illiquid investment because shareholders (such as the Fund) cannot redeem or sell their shares outside of periodic repurchase offers.
invesco.com/reports
or upon request at (800) 959-4246
.
invesco.com/reports
. You can also request this information by contacting us at (800) 959-4246
.
What Were The Fund Costs For The Last
Year
?
(Based on a hypothetical $10,000 investment)
Fund (Class) |
Costs of a $10,000 investment |
Costs paid as a percentage of a $10,000 investment |
| Invesco Select Risk: Growth Investor Fund (Class C) |
$ 124 |
1.16 % |
How Did The Fund Perform During The Period?
•
2025 was a year of change, especially in geopolitics. Tariffs dominated headlines, Europe kicked off new defense spending and the artificial intelligence trade was strong. Despite a year of change, global risk assets rallied and performed well.•
For the fiscal year ended December 31, 2025, Class C shares of the Fund, excluding sales charge, returned 14.61%. For the same time period, the Custom Invesco Select Risk: Growth Investor Index (the "Benchmark") returned 18.71%.What contributed to performance?
Asset allocation - Fixed Income |
The Fund's underweight to fixed income relative to the Benchmark was the largest positive contributor to relative return given equities outperformed fixed income.Asset allocation - Equity |
The Fund's equity exposure relative to the Benchmark was a positive contributor to relative return given equities outperformed the Benchmark.What detracted from performance?
Equity manager selection
|
The Fund's equity manager selection effects were the largest detractors from the Fund's relative performance, with key detractors being selection within global and international smid-cap equities.Equity style selection |
The Fund's equity style effects detracted from relative performance given the Fund's exposure to US large-cap multifactor and US mid-cap growth equities.Fixed Income manager selection |
The Fund's fixed income manager selection effects detracted from relative performance within core and core plus fixed income.How Has The Fund Historically Performed?
Growth of $10,000
Investment
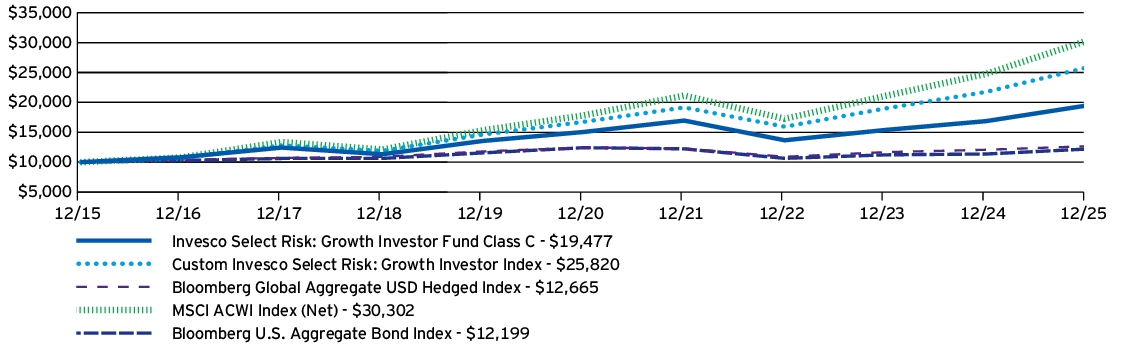
AVERAGE ANNUAL TOTAL RETURNS |
1 Year |
5 Years |
10 Years |
Invesco Select Risk: Growth Investor Fund (Class C) —including sales charge |
13.61 % |
4.97 % |
6.89 % |
Invesco Select Risk: Growth Investor Fund (Class C) —excluding sales charge |
14.61 % |
4.97 % |
6.89 % |
Custom Invesco Select Risk: Growth Investor Index |
18.71 % |
9.04 % |
9.95 % |
Bloomberg Global Aggregate USD Hedged Index |
4.86 % |
0.34 % |
2.39 % |
MSCI ACWI Index (Net) |
22.34 % |
11.19 % |
11.72 % |
Bloomberg U.S. Aggregate Bond Index |
7.30 % |
-0.36 % |
2.01 % |
invesco.com/performance
for more recent performance information.
What Are Key Statistics About The Fund?
(as of December 31, 2025)
| Fund net assets | $ 1,042,844,600 |
| Total number of portfolio holdings | 30 |
| Total advisory fees paid | $ 0 |
| Portfolio turnover rate | 32 % |
What Comprised The Fund's Holdings?
(as of December 31, 2025)
Asset allocation
(% of net assets)

How Has The Fund
Changed
Over The Past Year?This is a summary of certain changes to the Fund since December 31, 2024. For more complete information, you may review the Fund's prospectus, which is available at
invesco.com/reports
or upon request at(800) 959-4246
.
The Fund added unlisted closed-end interval fund risk to its principal risks to reflect that shares of an underlying unlisted closed-end interval fund in which the Fund may invest are considered an illiquid investment because shareholders (such as the Fund) cannot redeem or sell their shares outside of periodic repurchase offers.
invesco.com/reports
or upon request at(800) 959-4246
.
invesco.com/reports
. You can also request this information by contacting us at (800) 959-4246
.
What Were The Fund Costs For The Last
Year
?
(Based on a hypothetical $10,000 investment)
Fund (Class) |
Costs of a $10,000 investment |
Costs paid as a percentage of a $10,000 investment |
| Invesco Select Risk: Growth Investor Fund (Class R) |
$ 71 |
0.66 % |
How Did The Fund Perform During The Period?
•
2025 was a year of change, especially in geopolitics. Tariffs dominated headlines, Europe kicked off new defense spending and the artificial intelligence trade was strong. Despite a year of change, global risk assets rallied and performed well.•
For the fiscal year ended December 31, 2025, Class R shares of the Fund returned 15.15%. For the same time period, the Custom Invesco Select Risk: Growth Investor Index (the "Benchmark") returned 18.71%.What contributed to performance?
Asset allocation - Fixed Income |
The Fund's underweight to fixed income relative to the Benchmark was the largest positive contributor to relative return given equities outperformed fixed income.Asset allocation - Equity |
The Fund's equity exposure relative to the Benchmark was a positive contributor to relative return given equities outperformed the Benchmark.What detracted from performance?
Equity manager selection
|
The Fund's equity manager selection effects were the largest detractors from the Fund's relative performance, with key detractors being selection within global and international smid-cap equities.Equity style selection |
The Fund's equity style effects detracted from relative performance given the Fund's exposure to US large-cap multifactor and US mid-cap growth equities.Fixed Income manager selection |
The Fund's fixed income manager selection effects detracted from relative
performance within core and core plus fixed income.How Has The Fund Historically Performed?
Growth of $10,000 Investment

AVERAGE ANNUAL TOTAL RETURNS |
1 Year |
5 Years |
10 Years |
Invesco Select Risk: Growth Investor Fund (Class R) |
15.15 % |
5.50 % |
7.27 % |
Custom Invesco Select Risk: Growth Investor Index |
18.71 % |
9.04 % |
9.95 % |
Bloomberg Global Aggregate USD Hedged Index |
4.86 % |
0.34 % |
2.39 % |
MSCI ACWI Index (Net) |
22.34 % |
11.19 % |
11.72 % |
Bloomberg U.S. Aggregate Bond Index |
7.30 % |
-0.36 % |
2.01 % |
invesco.com/performance
for more recent performance information.
What Are Key Statistics About The Fund?
(as of December 31, 2025)
| Fund net assets | $ 1,042,844,600 |
| Total number of portfolio holdings | 30 |
| Total advisory fees paid | $ 0 |
| Portfolio turnover rate | 32 % |
What Comprised The Fund's Holdings?
(as of December 31, 2025)
Asset allocation
(% of net assets)

How Has The Fund Changed Over The Past Year?
This is a summary of certain changes to the Fund since December 31, 2024. For more complete information, you may review the Fund's prospectus, which is available at
invesco.com/reports
or upon request at (800) 959-4246
.
The Fund added unlisted closed-end interval fund risk to its principal risks to reflect that shares of an underlying unlisted closed-end interval fund in which the Fund may invest are considered an illiquid investment because shareholders (such as the Fund) cannot redeem or sell their shares outside of periodic repurchase offers.
invesco.com/reports
or upon request at (800) 959-4246
.
invesco.com/reports
. You can also request this information by contacting us at (800) 959-4246
.
What Were The Fund Costs For The Last
Year
?
(Based on a hypothetical $10,000 investment)
Fund (Class) |
Costs of a $10,000 investment |
Costs paid as a percentage of a $10,000 investment |
| Invesco Select Risk: Growth Investor Fund (Class S) |
$ 33 |
0.31 % |
How Did The Fund Perform During The Period?
•
2025 was a year of change, especially in geopolitics. Tariffs dominated headlines, Europe kicked off new defense spending and the artificial intelligence trade was strong. Despite a year of change, global risk assets rallied and performed well.•
For the fiscal year ended December 31, 2025, Class S shares of the Fund returned 15.57%. For the same time period, the Custom Invesco Select Risk: Growth Investor Index (the "Benchmark") returned 18.71%.What contributed to performance?
Asset allocation - Fixed Income |
The Fund's underweight to fixed income relative to the Benchmark was the largest positive contributor to relative return given equities outperformed fixed income.Asset allocation - Equity |
The Fund's equity exposure relative to the Benchmark was a positive contributor to relative return given equities outperformed the Benchmark.What detracted from performance?
Equity manager selection
|
The Fund's equity manager selection effects were the largest detractors from the Fund's relative performance, with key detractors being selection within global and international smid-cap equities.Equity style selection |
The Fund's equity style effects detracted from relative performance given the Fund's exposure to US large-cap multifactor and US mid-cap growth equities.Fixed Income manager selection |
The Fund's fixed income manager selection effects detracted from relative performance within core and core plus fixed income.How Has The Fund Historically Performed?
Growth of $10,000 Investment
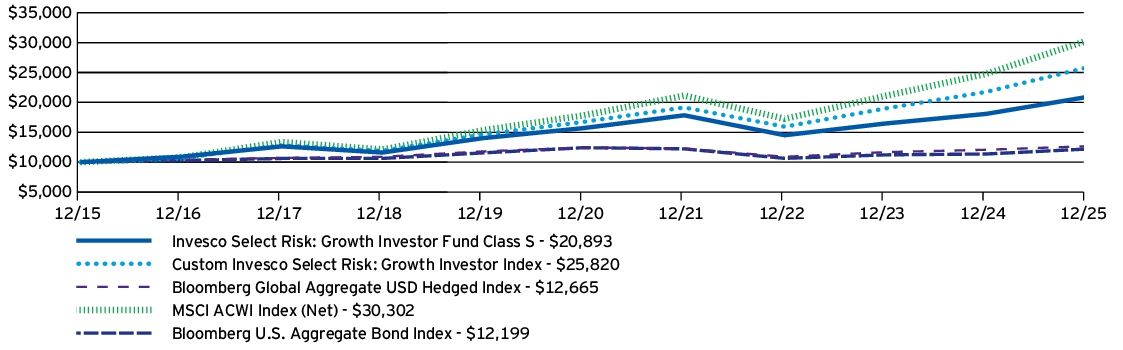
AVERAGE ANNUAL TOTAL RETURNS |
1 Year |
5 Years |
10 Years |
Invesco Select Risk: Growth Investor Fund (Class S) |
15.57 % |
5.88 % |
7.65 % |
Custom Invesco Select Risk: Growth Investor Index |
18.71 % |
9.04 % |
9.95 % |
Bloomberg Global Aggregate USD Hedged Index |
4.86 % |
0.34 % |
2.39 % |
MSCI ACWI Index (Net) |
22.34 % |
11.19 % |
11.72 % |
Bloomberg U.S. Aggregate Bond Index |
7.30 % |
-0.36 % |
2.01 % |
invesco.com/performance
for more recent performance information.
What Are Key Statistics About The Fund?
(as of December 31, 2025)
| Fund net assets | $ 1,042,844,600 |
| Total number of portfolio holdings | 30 |
| Total advisory fees paid | $ 0 |
| Portfolio turnover rate | 32 % |
What Comprised The Fund's Holdings?
(as of December 31, 2025)
Asset allocation
(% of net assets)

How Has The Fund Changed Over The Past Year?
This is a summary of certain changes to the Fund since December 31, 2024. For more complete information, you may review the Fund's prospectus, which is available at
invesco.com/reports
or upon request at (800) 959-4246
.
The Fund added unlisted closed-end interval fund risk to its principal risks to reflect that shares of an underlying unlisted closed-end interval fund in which the Fund may invest are considered an illiquid investment because shareholders (such as the Fund) cannot redeem or sell their shares outside of periodic repurchase offers.
invesco.com/reports
or upon request at (800) 959-4246
.
invesco.com/reports
. You can also request this information by contacting us at (800) 959-4246
.
What Were The Fund Costs For The Last
Year
?
(Based on a hypothetical $10,000 investment)
Fund (Class) |
Costs of a $10,000 investment |
Costs paid as a percentage of a $10,000 investment |
| Invesco Select Risk: Growth Investor Fund (Class Y) |
$ 17 |
0.16 % |
How Did The Fund Perform During The Period?
•
2025 was a year of change, especially in geopolitics. Tariffs dominated headlines, Europe kicked off new defense spending and the artificial intelligence trade was strong. Despite a year of change, global risk assets rallied and performed well.•
For the fiscal year ended December 31, 2025, Class Y shares of the Fund returned 15.82%. For the same time period, the Custom Invesco Select Risk: Growth Investor Index (the "Benchmark") returned 18.71%.What contributed to performance?
Asset allocation - Fixed Income |
The Fund's underweight to fixed income relative to the Benchmark was the largest positive contributor to relative return given equities outperformed fixed income.Asset allocation - Equity |
The Fund's equity exposure relative to the Benchmark was a positive contributor to relative return given equities outperformed the Benchmark.What detracted from performance?
Equity manager selection
|
The Fund's equity manager selection effects were the largest detractors from the Fund's relative performance, with key detractors being selection within global and international smid-cap equities.Equity style selection |
The Fund's equity style effects detracted from relative performance given the Fund's exposure to US large-cap multifactor and US mid-cap growth equities.Fixed Income manager selection |
The Fund's fixed income manager selection effects detracted from relative performance within core and core plus fixed income.How Has The Fund Historically Performed?
Growth of $10,000
Investment
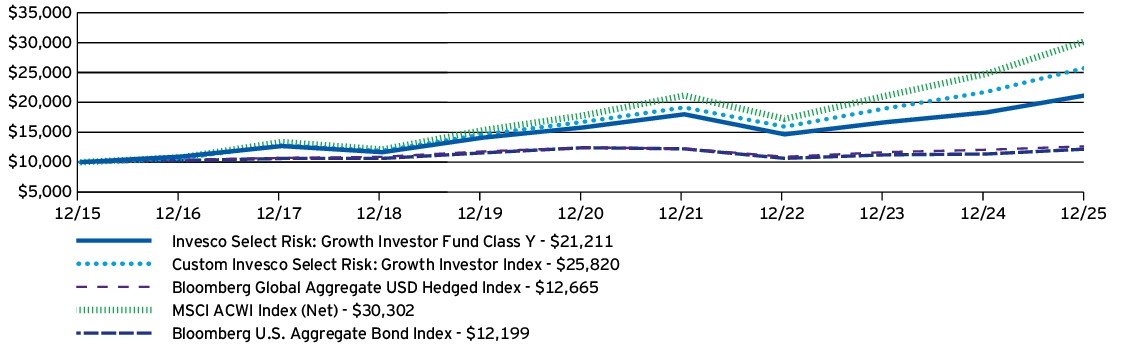
AVERAGE ANNUAL TOTAL RETURNS |
1 Year |
5 Years |
10 Years |
Invesco Select Risk: Growth Investor Fund (Class Y) |
15.82 % |
6.04 % |
7.81 % |
Custom Invesco Select Risk: Growth Investor Index |
18.71 % |
9.04 % |
9.95 % |
Bloomberg Global Aggregate USD Hedged Index |
4.86 % |
0.34 % |
2.39 % |
MSCI ACWI Index (Net) |
22.34 % |
11.19 % |
11.72 % |
Bloomberg U.S. Aggregate Bond Index |
7.30 % |
-0.36 % |
2.01 % |
invesco.com/performance
for more recent performance information.
What Are Key Statistics About The Fund?
(as of December 31, 2025)
| Fund net assets | $ 1,042,844,600 |
| Total number of portfolio holdings | 30 |
| Total advisory fees paid | $ 0 |
| Portfolio turnover rate | 32 % |
What Comprised The Fund's Holdings?
(as of December 31, 2025)
Asset allocation
(% of net assets)

How Has The Fund Changed Over The Past Year?
This is a summary of certain changes to the Fund since December 31, 2024. For more complete information, you may review the Fund's prospectus, which is available at
invesco.com/reports
or upon request at (800) 959-4246
.
The Fund added unlisted closed-end interval fund risk to its principal risks to reflect that shares of an underlying unlisted closed-end interval fund in which the Fund may invest are considered an illiquid investment because shareholders (such as the Fund) cannot redeem or sell their shares outside of periodic repurchase offers.
invesco.com/reports
or upon request at (800) 959-4246
.
invesco.com/reports
. You can also request this information by contacting us at (800) 959-4246
.
What Were The Fund Costs For The Last
Year
?
(Based on a hypothetical $10,000 investment)
Fund (Class) |
Costs of a $10,000 investment |
Costs paid as a percentage of a $10,000 investment |
| Invesco Select Risk: Growth Investor Fund (Class R5) |
$ 15 |
0.14 % |
How Did The Fund Perform During The Period?
•
2025 was a year of change, especially in geopolitics. Tariffs dominated headlines, Europe kicked off new defense spending and the artificial intelligence trade was strong. Despite a year of change, global risk assets rallied and performed well.•
For the fiscal year ended December 31, 2025, Class R5 shares of the Fund returned 15.80%. For the same time period, the Custom Invesco Select Risk: Growth Investor Index (the "Benchmark") returned 18.71%.What contributed to performance?
Asset allocation - Fixed Income |
The Fund's underweight to fixed income relative to the Benchmark was the largest positive contributor to relative return given equities outperformed fixed income.Asset allocation - Equity |
The Fund's equity exposure relative to the Benchmark was a positive contributor to relative return given equities outperformed the Benchmark.What detracted from performance?
Equity manager selection
|
The Fund's equity manager selection effects were the largest detractors from the Fund's relative performance, with key detractors being selection within global and international smid-cap equities.Equity style selection |
The Fund's equity style effects detracted from relative performance given the Fund's exposure to US large-cap multifactor and US mid-cap growth equities.Fixed Income manager selection |
The Fund's fixed income manager selection effects detracted from relative performance within core and core plus fixed income.How Has The Fund Historically
Performed
?Growth of $10,000 Investment
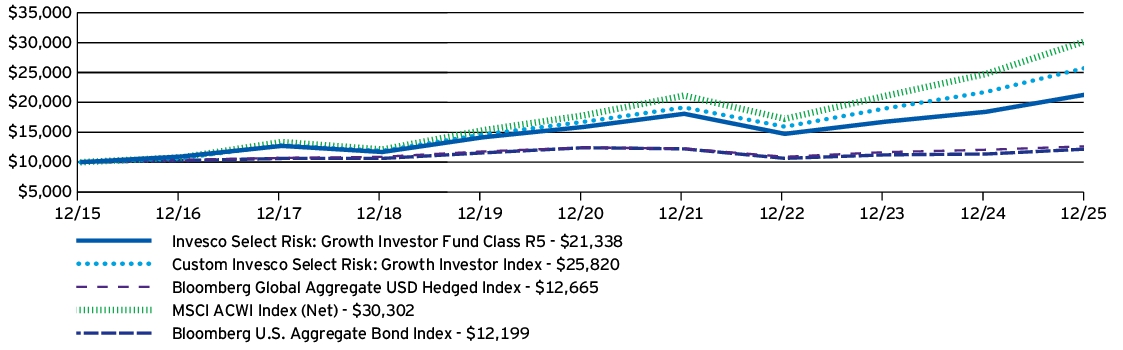
AVERAGE ANNUAL TOTAL RETURNS |
1 Year |
5 Years |
10 Years |
Invesco Select Risk: Growth Investor Fund (Class R5) |
15.80 % |
6.06 % |
7.87 % |
Custom Invesco Select Risk: Growth Investor Index |
18.71 % |
9.04 % |
9.95 % |
Bloomberg Global Aggregate USD Hedged Index |
4.86 % |
0.34 % |
2.39 % |
MSCI ACWI Index (Net) |
22.34 % |
11.19 % |
11.72 % |
Bloomberg U.S. Aggregate Bond Index |
7.30 % |
-0.36 % |
2.01 % |
invesco.com/performance
for more recent performance information.
What Are Key Statistics About The Fund?
(as of December 31, 2025)
| Fund net assets | $ 1,042,844,600 |
| Total number of portfolio holdings | 30 |
| Total advisory fees paid | $ 0 |
| Portfolio turnover rate | 32 % |
What Comprised The Fund's Holdings?
(as of December 31, 2025)
Asset allocation
(% of net assets)

How Has The Fund Changed Over The Past Year?
This is a summary of certain changes to the Fund since December 31, 2024. For more complete information, you may review the Fund's prospectus, which is available at
invesco.com/reports
or upon request at (800) 959-4246
.
The Fund added unlisted closed-end interval fund risk to its principal risks to reflect that shares of an underlying unlisted closed-end interval fund in which the Fund may invest are considered an illiquid investment because shareholders (such as the Fund) cannot redeem or sell their shares outside of periodic repurchase offers.
invesco.com/reports
or upon request at (800) 959-4246
.
invesco.com/reports
. You can also request this information by contacting us at (800) 959-4246
.
What Were The Fund Costs For The Last
Year
?
(Based on a hypothetical $10,000 investment)
Fund (Class) |
Costs of a $10,000 investment |
Costs paid as a percentage of a $10,000 investment |
| Invesco Select Risk: Growth Investor Fund (Class R6) |
$ 6 |
0.06 % |
How Did The Fund Perform During The Period?
•
2025 was a year of change, especially in geopolitics. Tariffs dominated headlines, Europe kicked off new defense spending and the artificial intelligence trade was strong. Despite a year of change, global risk assets rallied and performed well.•
For the fiscal year ended December 31, 2025, Class R6 shares of the Fund returned 15.79%. For the same time period, the Custom Invesco Select Risk: Growth Investor Index (the "Benchmark") returned 18.71%.What contributed to performance?
Asset allocation - Fixed Income |
The Fund's underweight to fixed income relative to the Benchmark was the largest positive contributor to relative return given equities outperformed fixed income.Asset allocation - Equity |
The Fund's equity exposure relative to the Benchmark was a positive contributor to relative return given equities outperformed the Benchmark.What detracted from performance?
Equity manager selection
|
The Fund's equity manager selection effects were the largest detractors from the Fund's relative performance, with key detractors being selection within global and international smid-cap equities.Equity style selection |
The Fund's equity style effects detracted from relative performance given the Fund's exposure to US large-cap multifactor and US mid-cap growth equities.Fixed Income manager selection |
The Fund's fixed income manager selection effects detracted from relative performance within core and core plus fixed income.How Has The Fund Historically Performed?
Growth of $10,000 Investment

AVERAGE ANNUAL TOTAL RETURNS |
1 Year |
5 Years |
10 Years |
Invesco Select Risk: Growth Investor Fund (Class R6) |
15.79 % |
6.13 % |
7.86 % |
Custom Invesco Select Risk: Growth Investor Index |
18.71 % |
9.04 % |
9.95 % |
Bloomberg Global Aggregate USD Hedged Index |
4.86 % |
0.34 % |
2.39 % |
MSCI ACWI Index (Net) |
22.34 % |
11.19 % |
11.72 % |
Bloomberg U.S. Aggregate Bond Index |
7.30 % |
-0.36 % |
2.01 % |
invesco.com/performance
for more recent performance information.
What Are Key Statistics About The Fund?
(as of December 31, 2025)
| Fund net assets | $ 1,042,844,600 |
| Total number of portfolio holdings | 30 |
| Total advisory fees paid | $ 0 |
| Portfolio turnover rate | 32 % |
What Comprised The Fund's Holdings?
(as of December 31, 2025)
Asset allocation
(% of net assets)

How Has The
Fund
Changed Over The Past Year?This is a summary of certain changes to the Fund since December 31, 2024. For more complete information, you may review the Fund's prospectus, which is available at
invesco.com/reports
or upon request at (800) 959-4246
.
The Fund added unlisted closed-end interval fund risk to its principal risks to reflect that shares of an underlying unlisted closed-end interval fund in which the Fund may invest are considered an illiquid investment because shareholders (such as the Fund) cannot redeem or sell their shares outside of periodic repurchase offers.
invesco.com/reports
or upon request at (800) 959-4246
.
invesco.com/reports
. You can also request this information by contacting us at (800) 959-4246
.
What Were The Fund Costs For The Last
Year
?
(Based on a hypothetical $10,000 investment)
Fund (Class) | Costs of a $10,000 investment | Costs paid as a percentage of a $10,000 investment |
| Invesco Select Risk: High Growth Investor Fund (Class A) | $ 37 | 0.34 % † |
† | Reflects fee waivers and/or expense reimbursements, without which expenses would have been higher. |
How Did The Fund Perform During The Period?
•
2025 was a year of change, especially in geopolitics. Tariffs dominated headlines, Europe kicked off new defense spending and the artificial intelligence trade was strong. Despite a year of change, global risk assets rallied and performed well.•
For the fiscal year ended December 31, 2025, Class A shares of the Fund, excluding sales charge, returned 16.34%. For the same time period, the Custom Invesco Select Risk: High Growth Investor Index (the "Benchmark") returned 20.51%.What contributed to performance?
Asset allocation - Fixed Income |
The Fund's underweight to fixed income relative to the Benchmark was the largest positive contributor to relative return given equities outperformed fixed income.Asset allocation - Equity |
The Fund's equity exposure relative to the Benchmark was a positive contributor to relative return given equities outperformed the Benchmark.Asset allocation - Alternatives |
The Fund's alternatives exposure relative to the Benchmark was a positive contributor to relative return.What detracted from performance?
Equity manager selection
|
The Fund's equity manager selection effects were the largest detractors from the Fund's relative performance, with key detractors being selection within global and international smid-cap equities.Equity style selection |
The Fund's equity style effects detracted from relative performance given the Fund's exposure to US large-cap multifactor and US mid-cap growth equities.Fixed Income manager selection |
The Fund's fixed income manager selection effects detracted from relative performance
within core and core plus fixed income.How Has The Fund Historically Performed?
Growth of $10,000 Investment
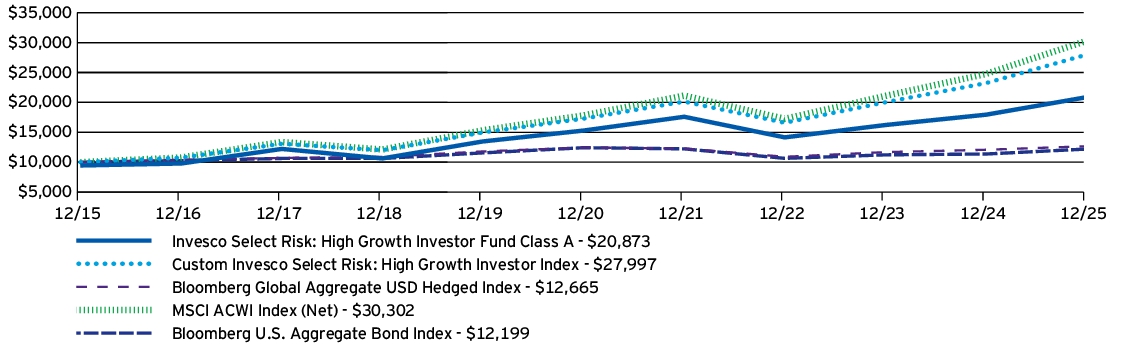
AVERAGE ANNUAL TOTAL RETURNS | 1 Year | 5 Years | 10 Years |
Invesco Select Risk: High Growth Investor Fund (Class A) —including sales charge | 9.91 % | 5.23 % | 7.64 % |
Invesco Select Risk: High Growth Investor Fund (Class A) —excluding sales charge | 16.34 % | 6.43 % | 8.25 % |
Custom Invesco Select Risk: High Growth Investor Index | 20.51 % | 10.12 % | 10.84 % |
Bloomberg Global Aggregate USD Hedged Index | 4.86 % | 0.34 % | 2.39 % |
MSCI ACWI Index (Net) | 22.34 % | 11.19 % | 11.72 % |
Bloomberg U.S. Aggregate Bond Index | 7.30 % | -0.36 % | 2.01 % |
invesco.com/performance
for more recent performance information.
What Are Key Statistics About The Fund?
(as of December 31, 2025)
| Fund net assets | $ 893,876,330 |
| Total number of portfolio holdings | 24 |
| Total advisory fees paid | $ 0 |
| Portfolio turnover rate | 33 % |
What Comprised The Fund's Holdings?
(as of December 31, 2025)
Asset allocation
(% of net assets)

How Has The Fund Changed Over The Past Year?
This is a summary of certain changes to the Fund since December 31, 2024. For more complete information, you may review the Fund's prospectus, which is available at
invesco.com/reports
or upon request at (800) 959-4246
.
The Fund added unlisted closed-end interval fund risk to its principal risks to reflect that shares of an underlying unlisted closed-end interval fund in which the Fund may invest are considered an illiquid investment because shareholders (such as the Fund) cannot redeem or sell their shares outside of periodic repurchase offers.
invesco.com/reports
or upon request at (800) 959-4246
.
invesco.com/reports
. You can also request this information by contacting us at (800) 959-4246
.
What Were The Fund Costs For The Last
Year
?
(Based on a hypothetical $10,000 investment)
Fund (Class) | Costs of a $10,000 investment | Costs paid as a percentage of a $10,000 investment |
| Invesco Select Risk: High Growth Investor Fund (Class C) | $ 119 | 1.10 % † |
† | Reflects fee waivers and/or expense reimbursements, without which expenses would have been higher. |
How Did The Fund Perform During The Period?
•
2025 was a year of change, especially in geopolitics. Tariffs dominated headlines, Europe kicked off new defense spending and the artificial intelligence trade was strong. Despite a year of change, global risk assets rallied and performed well.•
For the fiscal year ended December 31, 2025, Class C shares of the Fund, excluding sales charge, returned 15.53%. For the same time period, the Custom Invesco Select Risk: High Growth Investor Index (the "Benchmark") returned 20.51%.What contributed to performance?
Asset allocation - Fixed Income |
The Fund's underweight to fixed income relative to the Benchmark was the largest positive contributor to relative return given equities outperformed fixed income.Asset allocation - Equity |
The Fund's equity exposure relative to the Benchmark was a positive contributor to relative return given equities outperformed the Benchmark.Asset allocation - Alternatives |
The Fund's alternatives exposure relative to the Benchmark was a positive contributor to relative return.What detracted from performance?
Equity manager selection
|
The Fund's equity manager selection effects were the largest detractors from the Fund's relative performance, with key detractors being selection within global and international smid-cap equities.Equity style selection |
The Fund's equity style effects detracted from relative performance given the Fund's exposure to US large-cap multifactor and US mid-cap growth equities.Fixed Income manager selection |
The Fund's fixed
income manager selection effects detracted from relative performance within core and core plus fixed income.How Has The Fund Historically Performed?
Growth of $10,000 Investment
AVERAGE ANNUAL TOTAL RETURNS | 1 Year | 5 Years | 10 Years |
Invesco Select Risk: High Growth Investor Fund (Class C) —including sales charge | 14.53 % | 5.63 % | 7.60 % |
Invesco Select Risk: High Growth Investor Fund (Class C) —excluding sales charge | 15.53 % | 5.63 % | 7.60 % |
Custom Invesco Select Risk: High Growth Investor Index | 20.51 % | 10.12 % | 10.84 % |
Bloomberg Global Aggregate USD Hedged Index | 4.86 % | 0.34 % | 2.39 % |
MSCI ACWI Index (Net) | 22.34 % | 11.19 % | 11.72 % |
Bloomberg U.S. Aggregate Bond Index | 7.30 % | -0.36 % | 2.01 % |
invesco.com/performance
for more recent performance information.
What Are Key Statistics About The Fund?
(as of December 31, 2025)
| Fund net assets | $ 893,876,330 |
| Total number of portfolio holdings | 24 |
| Total advisory fees paid | $ 0 |
| Portfolio turnover rate | 33 % |
What Comprised The Fund's Holdings?
(as of December 31, 2025)
Asset allocation
(% of net assets)
How
Has
The Fund Changed Over The Past Year?This is a summary of certain changes to the Fund since December 31, 2024. For more complete information, you may review the Fund's prospectus, which is available at
invesco.com/reports
or upon request at (800) 959-4246
.
The Fund added unlisted closed-end interval fund risk to its principal risks to reflect that shares of an underlying unlisted closed-end interval fund in which the Fund may invest are considered an illiquid investment because shareholders (such as the Fund) cannot redeem or sell their shares outside of periodic repurchase offers.
invesco.com/reports
or upon request at (800) 959-4246
.
invesco.com/reports
. You can also request this information by contacting us at (800) 959-4246
.
What Were The Fund Costs For The Last
Year
?
(Based on a hypothetical $10,000 investment)
Fund (Class) | Costs of a $10,000 investment | Costs paid as a percentage of a $10,000 investment |
| Invesco Select Risk: High Growth Investor Fund (Class R) | $ 65 | 0.60 % † |
† | Reflects fee waivers and/or expense reimbursements, without which expenses would have been higher. |
How Did The Fund Perform During The Period?
•
2025 was a year of change, especially in geopolitics. Tariffs dominated headlines, Europe kicked off new defense spending and the artificial intelligence trade was strong. Despite a year of change, global risk assets rallied and performed well.•
For the fiscal year ended December 31, 2025, Class R shares of the Fund returned 16.16%. For the same time period, the Custom Invesco Select Risk: High Growth Investor Index (the "Benchmark") returned 20.51%.What contributed to performance?
Asset allocation - Fixed Income |
The Fund's underweight to fixed income relative to the Benchmark was the largest positive contributor to relative return given equities outperformed fixed income.Asset allocation - Equity |
The Fund's equity exposure relative to the Benchmark was a positive contributor to relative return given equities outperformed the Benchmark.Asset allocation - Alternatives |
The Fund's alternatives exposure relative to the Benchmark was a positive contributor to relative return.What detracted from performance?
Equity manager selection
|
The Fund's equity manager selection effects were the largest detractors from the Fund's relative performance, with key detractors being selection within global and international smid-cap equities.Equity style selection |
The Fund's equity style effects detracted from relative performance given the Fund's exposure to US large-cap multifactor and US mid-cap growth equities.Fixed Income manager selection |
The Fund's fixed income manager selection effects detracted from
relative performance within core and core plus fixed income.How Has The Fund Historically Performed?
Growth of $10,000 Investment
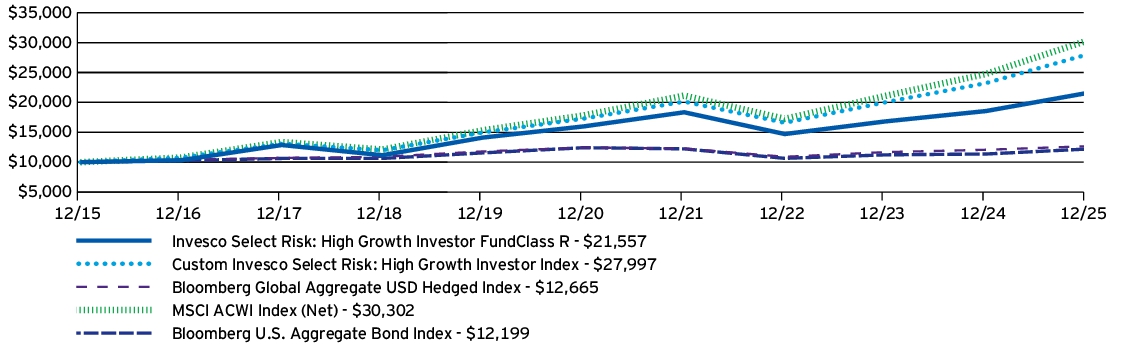
AVERAGE ANNUAL TOTAL RETURNS | 1 Year | 5 Years | 10 Years |
Invesco Select Risk: High Growth Investor Fund (Class R) | 16.16 % | 6.16 % | 7.98 % |
Custom Invesco Select Risk: High Growth Investor Index | 20.51 % | 10.12 % | 10.84 % |
Bloomberg Global Aggregate USD Hedged Index | 4.86 % | 0.34 % | 2.39 % |
MSCI ACWI Index (Net) | 22.34 % | 11.19 % | 11.72 % |
Bloomberg U.S. Aggregate Bond Index | 7.30 % | -0.36 % | 2.01 % |
invesco.com/performance
for more recent performance information.
What Are Key Statistics About The Fund?
(as of December 31, 2025)
| Fund net assets | $ 893,876,330 |
| Total number of portfolio holdings | 24 |
| Total advisory fees paid | $ 0 |
| Portfolio turnover rate | 33 % |
What Comprised The Fund's Holdings?
(as of December 31, 2025)
Asset allocation
(% of net assets)

How Has The Fund Changed Over The Past Year?
This is a summary of certain changes to the Fund since December 31, 2024. For more complete information, you may review the Fund's prospectus, which is available at
invesco.com/reports
or upon request at (800) 959-4246
.
The Fund added unlisted closed-end interval fund risk to its principal risks to reflect that shares of an underlying unlisted closed-end interval fund in which the Fund may invest are considered an illiquid investment because shareholders (such as the Fund) cannot redeem or sell their shares outside of periodic repurchase offers.
invesco.com/reports
or upon request at (800) 959-4246
.
invesco.com/reports
. You can also request this information by contacting us at (800) 959-4246
.
What Were The Fund Costs For The Last
Year
?
(Based on a hypothetical $10,000 investment)
Fund (Class) | Costs of a $10,000 investment | Costs paid as a percentage of a $10,000 investment |
| Invesco Select Risk: High Growth Investor Fund (Class Y) | $ 11 | 0.10 % † |
† | Reflects fee waivers and/or expense reimbursements, without which expenses would have been higher. |
How Did The Fund Perform During The Period?
•
2025 was a year of change, especially in geopolitics. Tariffs dominated headlines, Europe kicked off new defense spending and the artificial intelligence trade was strong. Despite a year of change, global risk assets rallied and performed well.•
For the fiscal year ended December 31, 2025, Class Y shares of the Fund returned 16.66%. For the same time period, the Custom Invesco Select Risk: High Growth Investor Index (the "Benchmark") returned 20.51%.What contributed to performance?
Asset allocation - Fixed Income |
The Fund's underweight to fixed income relative to the Benchmark was the largest positive contributor to relative return given equities outperformed fixed income.Asset allocation - Equity |
The Fund's equity exposure relative to the Benchmark was a positive contributor to relative return given equities outperformed the Benchmark.Asset allocation - Alternatives |
The Fund's alternatives exposure relative to the Benchmark was a positive contributor to relative return.What detracted from performance?
Equity manager selection
|
The Fund's equity manager selection effects were the largest detractors from the Fund's relative performance, with key detractors being selection within global and international smid-cap equities.Equity style selection |
The Fund's equity style effects detracted from relative performance given the Fund's exposure to US large-cap multifactor and US mid-cap growth equities.Fixed Income manager selection |
The Fund's fixed income manager selection effects detracted from relative performance
within core and core plus fixed income.How Has The Fund Historically Performed?
Growth of $10,000 Investment
AVERAGE ANNUAL TOTAL RETURNS | 1 Year | 5 Years | 10 Years |
Invesco Select Risk: High Growth Investor Fund (Class Y) | 16.66 % | 6.69 % | 8.52 % |
Custom Invesco Select Risk: High Growth Investor Index | 20.51 % | 10.12 % | 10.84 % |
Bloomberg Global Aggregate USD Hedged Index | 4.86 % | 0.34 % | 2.39 % |
MSCI ACWI Index (Net) | 22.34 % | 11.19 % | 11.72 % |
Bloomberg U.S. Aggregate Bond Index | 7.30 % | -0.36 % | 2.01 % |
invesco.com/performance
for more recent performance information.
What Are Key Statistics About The Fund?
(as of December 31, 2025)
| Fund net assets | $ 893,876,330 |
| Total number of portfolio holdings | 24 |
| Total advisory fees paid | $ 0 |
| Portfolio turnover rate | 33 % |
What Comprised The Fund's Holdings?
(as of December 31, 2025)
Asset allocation
(% of net assets)

How Has The Fund Changed Over The Past Year?
This is a summary of certain changes to the Fund since December 31, 2024. For more complete information, you may review the Fund's prospectus, which is available at
invesco.com/reports
or upon request at (800) 959-4246
.
The Fund added unlisted closed-end interval fund risk to its principal risks to reflect that shares of an underlying unlisted closed-end interval fund in which the Fund may invest are considered an illiquid investment because shareholders (such as the Fund) cannot redeem or sell their shares outside of periodic repurchase offers.
invesco.com/reports
or upon request at (800) 959-4246
.
annual shareholder repo
rt contains important information about Invesco Select Risk: High Growth Investor Fund (the “Fund”) for the period January 1, 2025 to December 31, 2025.
invesco.com/reports
. You can also request this information by contacting us at (800) 959-4246
.
What Were The Fund Costs For The Last
Year
?
(Based on a hypothetical $10,000 investment)
Fund (Class) | Costs of a $10,000 investment | Costs paid as a percentage of a $10,000 investment |
| Invesco Select Risk: High Growth Investor Fund (Class R5) | $ 5 | 0.05 % |
How Did The Fund Perform During The Period?
•
2025 was a year of change, especially in geopolitics. Tariffs dominated headlines, Europe kicked off new defense spending and the artificial intelligence trade was strong. Despite a year of change, global risk assets rallied and performed well.•
For the fiscal year ended December 31, 2025, Class R5 shares of the Fund returned 16.75%. For the same time period, the Custom Invesco Select Risk: High Growth Investor Index (the "Benchmark") returned 20.51%.What contributed to performance?
Asset allocation - Fixed Income |
The Fund's underweight to fixed income relative to the Benchmark was the largest positive contributor to relative return given equities outperformed fixed income.Asset allocation - Equity |
The Fund's equity exposure relative to the Benchmark was a positive contributor to relative return given equities outperformed the Benchmark.Asset allocation - Alternatives |
The Fund's alternatives exposure relative to the Benchmark was a positive contributor to relative return.What detracted from performance?
Equity manager selection
|
The Fund's equity manager selection effects were the largest detractors from the Fund's relative performance, with key detractors being selection within global and international smid-cap equities.Equity style selection |
The Fund's equity style effects detracted from relative performance given the Fund's exposure to US large-cap multifactor and US mid-cap growth equities.Fixed Income manager selection |
The Fund's fixed income manager selection effects detracted from
relative performance within core and core plus fixed income.How Has The Fund Historically Performed?
Growth of $10,000 Investment

AVERAGE ANNUAL TOTAL RETURNS | 1 Year | 5 Years | 10 Years |
Invesco Select Risk: High Growth Investor Fund (Class R5) | 16.75 % | 6.79 % | 8.48 % |
Custom Invesco Select Risk: High Growth Investor Index | 20.51 % | 10.12 % | 10.84 % |
Bloomberg Global Aggregate USD Hedged Index | 4.86 % | 0.34 % | 2.39 % |
MSCI ACWI Index (Net) | 22.34 % | 11.19 % | 11.72 % |
Bloomberg U.S. Aggregate Bond Index | 7.30 % | -0.36 % | 2.01 % |
invesco.com/performance
for more recent performance information.
What Are Key Statistics About The Fund?
(as of December 31, 2025)
| Fund net assets | $ 893,876,330 |
| Total number of portfolio holdings | 24 |
| Total advisory fees paid | $ 0 |
| Portfolio turnover rate | 33 % |
What Comprised The Fund's Holdings?
(as of December 31, 2025)
Asset allocation
(% of net assets)

How Has The Fund
Changed
Over The Past Year
?This is a summary of certain changes to the Fund since December 31, 2024. For more
complete information, you may review the Fund's prospectus, which is available at invesco.com/reports
or upon request at (800) 959-4246
.
The Fund added unlisted closed-end interval fund risk to its principal risks to reflect that shares of an underlying unlisted closed-end interval fund in which the Fund may invest are considered an illiquid investment because shareholders (such as the Fund) cannot redeem or sell their shares outside of periodic repurchase offers.
This is a summary of certain changes to the Fund since December 31, 2024. For more
complete information, you may review the Fund's prospectus, which is available at invesco.com/reports
or upon request at (800) 959-4246
.
invesco.com/reports
. You can also request this information by contacting us at (800) 959-4246
.
What Were The Fund Costs For The Last
Year
?
(Based on a hypothetical $10,000 investment)
Fund (Class) | Costs of a $10,000 investment | Costs paid as a percentage of a $10,000 investment |
| Invesco Select Risk: High Growth Investor Fund (Class R6) | $ 5 | 0.05 % |
How Did The Fund Perform During The Period?
•
2025 was a year of change, especially in geopolitics. Tariffs dominated headlines, Europe kicked off new defense spending and the artificial intelligence trade was strong. Despite a year of change, global risk assets rallied and performed well.•
For the fiscal year ended December 31, 2025, Class R6 shares of the Fund returned 16.76%. For the same time period, the Custom Invesco Select Risk: High Growth Investor Index (the "Benchmark") returned 20.51%.What contributed to performance?
Asset allocation - Fixed Income |
The Fund's underweight to fixed income relative to the Benchmark was the largest positive contributor to relative return given equities outperformed fixed income.Asset allocation - Equity |
The Fund's equity exposure relative to the Benchmark was a positive contributor to relative return given equities outperformed the Benchmark.Asset allocation - Alternatives |
The Fund's alternatives exposure relative to the Benchmark was a positive contributor to relative return.What detracted from performance?
Equity manager selection
|
The Fund's equity manager selection effects were the largest detractors from the Fund's relative performance, with key detractors being selection within global and international smid-cap equities.Equity style selection |
The Fund's equity style effects detracted from relative performance given the Fund's exposure to US large-cap multifactor and US mid-cap growth equities.Fixed Income manager selection |
The Fund's fixed income manager selection effects detracted from relative performance within core and core plus fixed income.How Has The Fund Historically Performed?
Growth of $10,000 Investment
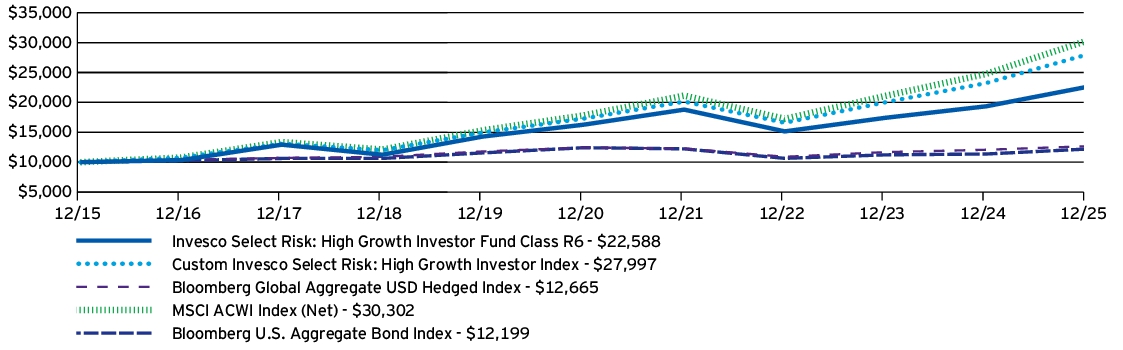
AVERAGE ANNUAL TOTAL RETURNS | 1 Year | 5 Years | 10 Years |
Invesco Select Risk: High Growth Investor Fund (Class R6) | 16.76 % | 6.78 % | 8.49 % |
Custom Invesco Select Risk: High Growth Investor Index | 20.51 % | 10.12 % | 10.84 % |
Bloomberg Global Aggregate USD Hedged Index | 4.86 % | 0.34 % | 2.39 % |
MSCI ACWI Index (Net) | 22.34 % | 11.19 % | 11.72 % |
Bloomberg U.S. Aggregate Bond Index | 7.30 % | -0.36 % | 2.01 % |
invesco.com/performance
for more recent performance information.
What Are Key Statistics About The Fund?
(as of December 31, 2025)
| Fund net assets | $ 893,876,330 |
| Total number of portfolio holdings | 24 |
| Total advisory fees paid | $ 0 |
| Portfolio turnover rate | 33 % |
What Comprised The Fund's Holdings?
(as of December 31, 2025)
Asset allocation
(% of net assets)

How Has The Fund Changed Over The Past
Year
?This is a summary of certain changes to the Fund since December 31, 2024. For more complete information, you may review the Fund's prospectus, which is available at
invesco.com/reports
or upon request at (800) 959-4246
.
The Fund added unlisted closed-end interval fund risk to its principal risks to reflect that shares of an underlying unlisted closed-end interval fund in which the Fund may invest are considered an illiquid investment because shareholders (such as the Fund) cannot redeem or sell their shares outside of periodic repurchase offers.
invesco.com/reports
or upon request at (800) 959-4246
.
invesco.com/reports
. You can also request this information by contacting us at (800) 959-4246
.
What Were The Fund Costs For The Last
Year
?
(Based on a hypothetical $10,000 investment)
Fund (Class) |
Costs of a $10,000 investment |
Costs paid as a percentage of a $10,000 investment |
| Invesco Select Risk: Moderate Investor Fund (Class A) |
$ 37 |
0.35 % |
How Did The Fund Perform During The Period?
•
2025 was a year of change, especially in geopolitics. Tariffs dominated headlines, Europe kicked off new defense spending, and the artificial intelligence trade was strong. Despite a year of change, global risk assets had a strong showing.•
For the fiscal year ended December 31, 2025, Class A shares of the Fund, excluding sales charge, returned 13.27%. For the same time period, the Custom Invesco Select Risk: Moderate Investor Index (the "Benchmark") returned 15.31%.What contributed to performance?
Asset allocation - Fixed Income |
The Fund's underweight to fixed income relative to the Benchmark was the largest positive contributor to relative return given equities outperformed fixed income.Asset allocation - Equity |
The Fund's equity exposure relative to the Benchmark was a positive contributor to relative return given equities outperformed the Benchmark.What detracted from performance?
Equity manager selection
|
The Fund's equity manager selection effects were the largest detractors from the Fund's relative performance, with key detractors being selection within global and international smid-cap equities.Equity style selection |
The Fund's equity style effects detracted from relative performance given the Fund's exposure to US large-cap multifactor and US mid-cap growth equities.Alternative manager selection |
The Fund's alternative manager selection effects detracted from the Fund's relative performance, with key detractors being selection within managed futures.How Has The Fund Historically Performed?
Growth of $10,000 Investment
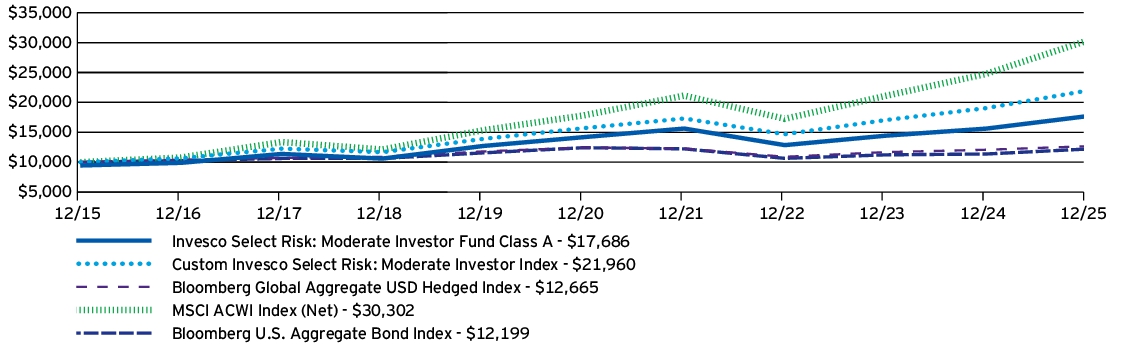
AVERAGE ANNUAL TOTAL RETURNS |
1 Year |
5 Years |
10 Years |
Invesco Select Risk: Moderate Investor Fund (Class A) —including sales charge |
7.01 % |
3.32 % |
5.87 % |
Invesco Select Risk: Moderate Investor Fund (Class A) —excluding sales charge |
13.27 % |
4.50 % |
6.47 % |
Custom Invesco Select Risk: Moderate Investor Index |
15.31 % |
6.95 % |
8.18 % |
Bloomberg Global Aggregate USD Hedged Index |
4.86 % |
0.34 % |
2.39 % |
MSCI ACWI Index (Net) |
22.34 % |
11.19 % |
11.72 % |
Bloomberg U.S. Aggregate Bond Index |
7.30 % |
-0.36 % |
2.01 % |
invesco.com/performance
for more recent performance information.
What Are Key Statistics About The Fund?
(as of December 31, 2025)
| Fund net assets | $ 1,848,440,972 |
| Total number of portfolio holdings | 26 |
| Total advisory fees paid | $ 0 |
| Portfolio turnover rate | 29 % |
What Comprised The Fund's Holdings?
(as of December 31, 2025)
Asset allocation
(% of net assets)
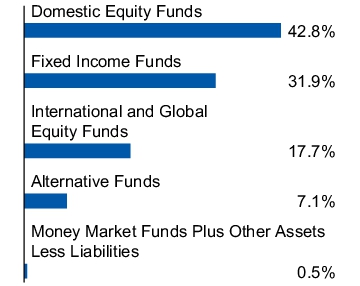
How Has The Fund Changed Over The Past Year?
This is a summary of certain changes to the Fund since December 31, 2024. For more complete information, you may review the Fund's prospectus, which is available at
invesco.com/reports
or upon request at (800) 959-4246
.
The Fund added unlisted closed-end interval fund risk to its principal risks to reflect that shares of an underlying unlisted closed-end interval fund in which the Fund may invest are considered an illiquid investment because shareholders (such as the Fund) cannot redeem or sell their shares outside of periodic repurchase offers.
invesco.com/reports
or upon request at (800) 959-4246
.
invesco.com/reports
. You can also request this information by contacting us at (800) 959-4246
.
What Were The Fund Costs For The Last
Year
?
(Based on a hypothetical $10,000 investment)
Fund (Class) |
Costs of a $10,000 investment |
Costs paid as a percentage of a $10,000 investment |
| Invesco Select Risk: Moderate Investor Fund (Class C) |
$ 118 |
1.11 % |
How Did The Fund Perform During The Period?
•
2025 was a year of change, especially in geopolitics. Tariffs dominated headlines, Europe kicked off new defense spending, and the artificial intelligence trade was strong. Despite a year of change, global risk assets had a strong showing.•
For the fiscal year ended December 31, 2025, Class C shares of the Fund, excluding sales charge, returned 12.39%. For the same time period, the Custom Invesco Select Risk: Moderate Investor Index (the "Benchmark") returned 15.31%.What contributed to performance?
Asset allocation - Fixed Income |
The Fund's underweight to fixed income relative to the Benchmark was the largest positive contributor to relative return given equities outperformed fixed income.Asset allocation - Equity |
The Fund's equity exposure relative to the Benchmark was a positive contributor to relative return given equities outperformed the Benchmark.What detracted from performance?
Equity manager selection
|
The Fund's equity manager selection effects were the largest detractors from the Fund's relative performance, with key detractors being selection within global and international smid-cap equities.Equity style selection |
The Fund's equity style effects detracted from relative performance given the Fund's exposure to US large-cap multifactor and US mid-cap growth equities.Alternative manager selection |
The Fund's alternative manager selection effects detracted from the Fund's relative performance, with key detractors being selection within managed futures.How Has The Fund Historically Performed?
Growth of $10,000 Investment

AVERAGE ANNUAL TOTAL RETURNS |
1 Year |
5 Years |
10 Years |
Invesco Select Risk: Moderate Investor Fund (Class C) —including sales charge |
11.39 % |
3.72 % |
5.82 % |
Invesco Select Risk: Moderate Investor Fund (Class C) —excluding sales charge |
12.39 % |
3.72 % |
5.82 % |
Custom Invesco Select Risk: Moderate Investor Index |
15.31 % |
6.95 % |
8.18 % |
Bloomberg Global Aggregate USD Hedged Index |
4.86 % |
0.34 % |
2.39 % |
MSCI ACWI Index (Net) |
22.34 % |
11.19 % |
11.72 % |
Bloomberg U.S. Aggregate Bond Index |
7.30 % |
-0.36 % |
2.01 % |
invesco.com/performance
for more recent performance information.
What Are Key Statistics About The Fund?
(as of December 31, 2025)
| Fund net assets | $ 1,848,440,972 |
| Total number of portfolio holdings | 26 |
| Total advisory fees paid | $ 0 |
| Portfolio turnover rate | 29 % |
What Comprised The Fund's Holdings?
(as of December 31, 2025)
Asset
allocation
(% of net assets)

How Has The Fund Changed Over The Past Year?
This is a summary of certain changes to the Fund since December 31, 2024. For more complete information, you may review the Fund's prospectus, which is available at
invesco.com/reports
or upon request at (800) 959-4246
.
The Fund added unlisted closed-end interval fund risk to its principal risks to reflect that shares of an underlying unlisted closed-end interval fund in which the Fund may invest are considered an illiquid investment because shareholders (such as the Fund) cannot redeem or sell their shares outside of periodic repurchase offers.
invesco.com/reports
or upon request at (800) 959-4246
.
invesco.com/reports
. You can also request this information by contacting us at (800) 959-4246
.
What Were The Fund Costs For The Last
Year
?
(Based on a hypothetical $10,000 investment)
Fund (Class) | Costs of a $10,000 investment | Costs paid as a percentage of a $10,000 investment |
| Invesco Select Risk: Moderate Investor Fund (Class R) | $ 65 | 0.61 % |
How Did The Fund Perform During The Period?
•
2025 was a year of change, especially in geopolitics. Tariffs dominated headlines, Europe kicked off new defense spending, and the artificial intelligence trade was strong. Despite a year of change, global risk assets had a strong showing.•
For the fiscal year ended December 31, 2025, Class R shares of the Fund returned 13.01%. For the same time period, the Custom Invesco Select Risk: Moderate Investor Index (the "Benchmark") returned 15.31%.What contributed to performance?
Asset allocation - Fixed Income |
The Fund's underweight to fixed income relative to the Benchmark was the largest positive contributor to relative return given equities outperformed fixed income.Asset allocation - Equity |
The Fund's equity exposure relative to the Benchmark was a positive contributor to relative return given equities outperformed the Benchmark.What detracted from performance?
Equity manager selection
|
The Fund's equity manager selection effects were the largest detractors from the Fund's relative performance, with key detractors being selection within global and international smid-cap equities.Equity style selection |
The Fund's equity style effects detracted from relative performance given the Fund's exposure to US large-cap multifactor and US mid-cap growth equities.Alternative manager selection |
The Fund's alternative manager selection effects detracted from the Fund's relative performance, with key detractors being selection within managed futures.How Has The Fund Historically Performed?
Growth of $10,000 Investment

AVERAGE ANNUAL TOTAL RETURNS | 1 Year | 5 Years | 10 Years |
Invesco Select Risk: Moderate Investor Fund (Class R) | 13.01 % | 4.25 % | 6.20 % |
Custom Invesco Select Risk: Moderate Investor Index | 15.31 % | 6.95 % | 8.18 % |
Bloomberg Global Aggregate USD Hedged Index | 4.86 % | 0.34 % | 2.39 % |
MSCI ACWI Index (Net) | 22.34 % | 11.19 % | 11.72 % |
Bloomberg U.S. Aggregate Bond Index | 7.30 % | -0.36 % | 2.01 % |
invesco.com/performance
for more recent performance information.
What Are Key Statistics About The Fund?
(as of December 31, 2025)
| Fund net assets | $ 1,848,440,972 |
| Total number of portfolio holdings | 26 |
| Total advisory fees paid | $ 0 |
| Portfolio turnover rate | 29 % |
What Comprised The Fund's Holdings?
(as of December 31, 2025)
Asset allocation
(% of net assets)

How Has The Fund Changed
Over
The Past Year?This is a summary of certain changes to the Fund since December 31, 2024. For more complete information, you may review the Fund's prospectus, which is available at
invesco.com/reports
or upon request at (800) 959-4246
.
The Fund added unlisted closed-end interval fund risk to its principal risks to reflect that shares of an underlying unlisted closed-end interval fund in which the Fund may invest are considered an illiquid investment because shareholders (such as the Fund) cannot redeem or sell their shares outside of periodic repurchase offers.
invesco.com/reports
or upon request at (800) 959-4246
.
invesco.com/reports
. You can also request this information by contacting us at (800) 959-4246
.
What Were The Fund Costs For The Last
Year
?
(Based on a hypothetical $10,000 investment)
Fund (Class) | Costs of a $10,000 investment | Costs paid as a percentage of a $10,000 investment |
| Invesco Select Risk: Moderate Investor Fund (Class S) | $ 28 | 0.26 % |
How Did The Fund Perform During The Period?
•
2025 was a year of change, especially in geopolitics. Tariffs dominated headlines, Europe kicked off new defense spending, and the artificial intelligence trade was strong. Despite a year of change, global risk assets had a strong showing.•
For the fiscal year ended December 31, 2025, Class S shares of the Fund returned 13.36%. For the same time period, the Custom Invesco Select Risk: Moderate Investor Index (the "Benchmark") returned 15.31%.What contributed to performance?
Asset allocation - Fixed Income |
The Fund's underweight to fixed income relative to the Benchmark was the largest positive contributor to relative return given equities outperformed fixed income.Asset allocation - Equity |
The Fund's equity exposure relative to the Benchmark was a positive contributor to relative return given equities outperformed the Benchmark.What detracted from performance?
Equity manager selection
|
The Fund's equity manager selection effects were the largest detractors from the Fund's relative performance, with key detractors being selection within global and international smid-cap equities.Equity style selection |
The Fund's equity style effects detracted from relative performance given the Fund's exposure to US large-cap multifactor and US mid-cap growth equities.Alternative manager selection |
The Fund's alternative manager selection
effects detracted from the Fund's relative performance, with key detractors being selection within managed futures.How Has The Fund Historically Performed?
Growth of $10,000 Investment
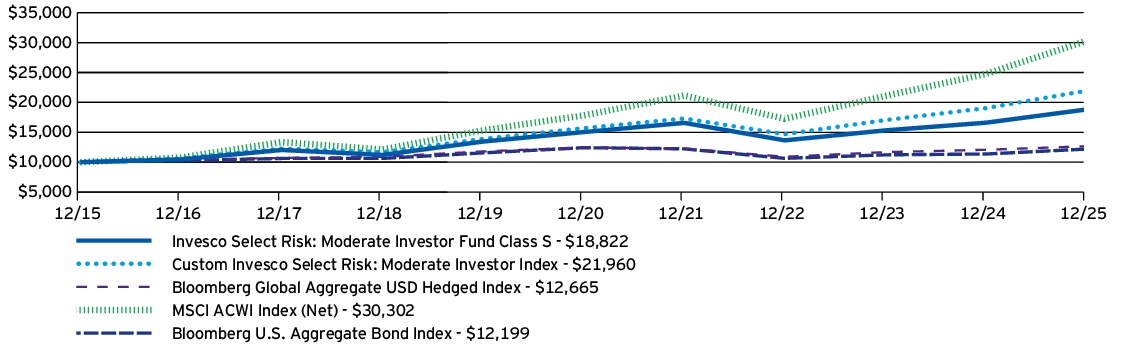
AVERAGE ANNUAL TOTAL RETURNS | 1 Year | 5 Years | 10 Years |
Invesco Select Risk: Moderate Investor Fund (Class S) | 13.36 % | 4.59 % | 6.53 % |
Custom Invesco Select Risk: Moderate Investor Index | 15.31 % | 6.95 % | 8.18 % |
Bloomberg Global Aggregate USD Hedged Index | 4.86 % | 0.34 % | 2.39 % |
MSCI ACWI Index (Net) | 22.34 % | 11.19 % | 11.72 % |
Bloomberg U.S. Aggregate Bond Index | 7.30 % | -0.36 % | 2.01 % |
invesco.com/performance
for more recent performance information.
What Are Key Statistics About The Fund?
(as of December 31, 2025)
| Fund net assets | $ 1,848,440,972 |
| Total number of portfolio holdings | 26 |
| Total advisory fees paid | $ 0 |
| Portfolio turnover rate | 29 % |
What Comprised The
Fund's
Holdings?(as of December 31, 2025)
Asset allocation
(% of net assets)

How Has The Fund Changed Over The Past Year?
This is a summary of certain changes to the Fund since December 31, 2024. For more complete information, you may review the Fund's prospectus, which is available at
invesco.com/reports
or upon request at (800) 959-4246
.
The Fund added unlisted closed-end interval fund risk to its principal risks to reflect that shares of an underlying unlisted closed-end interval fund in which the Fund may invest are considered an illiquid investment because shareholders (such as the Fund) cannot redeem or sell their shares outside of periodic repurchase offers.
invesco.com/reports
or upon request at (800) 959-4246
.
invesco.com/reports
. You can also request this information by contacting us at (800) 959-4246
.
What Were The Fund Costs For The Last
Year
?
(Based on a hypothetical $10,000 investment)
Fund (Class) | Costs of a $10,000 investment | Costs paid as a percentage of a $10,000 investment |
| Invesco Select Risk: Moderate Investor Fund (Class Y) | $ 12 | 0.11 % |
How Did The Fund Perform During The Period?
•
2025 was a year of change, especially in geopolitics. Tariffs dominated headlines, Europe kicked off new defense spending, and the artificial intelligence trade was strong. Despite a year of change, global risk assets had a strong showing.•
For the fiscal year ended December 31, 2025, Class Y shares of the Fund returned 13.59%. For the same time period, the Custom Invesco Select Risk: Moderate Investor Index (the "Benchmark") returned 15.31%.What contributed to performance?
Asset allocation - Fixed Income |
The Fund's underweight to fixed income relative to the Benchmark was the largest positive contributor to relative return given equities outperformed fixed income.Asset allocation - Equity |
The Fund's equity exposure relative to the Benchmark was a positive contributor to relative return given equities outperformed the Benchmark.What detracted from performance?
Equity manager selection
|
The Fund's equity manager selection effects were the largest detractors from the Fund's relative performance, with key detractors being selection within global and international smid-cap equities.Equity style selection |
The Fund's equity style effects detracted from relative performance given the Fund's exposure to US large-cap multifactor and US mid-cap growth equities.Alternative manager selection |
The Fund's alternative manager selection effects detracted from
the Fund's relative performance, with key detractors being selection within managed futures.How Has The Fund Historically Performed?
Growth of $10,000 Investment

AVERAGE ANNUAL TOTAL RETURNS | 1 Year | 5 Years | 10 Years |
Invesco Select Risk: Moderate Investor Fund (Class Y) | 13.59 % | 4.77 % | 6.74 % |
Custom Invesco Select Risk: Moderate Investor Index | 15.31 % | 6.95 % | 8.18 % |
Bloomberg Global Aggregate USD Hedged Index | 4.86 % | 0.34 % | 2.39 % |
MSCI ACWI Index (Net) | 22.34 % | 11.19 % | 11.72 % |
Bloomberg U.S. Aggregate Bond Index | 7.30 % | -0.36 % | 2.01 % |
invesco.com/performance
for more recent performance information.
What Are Key Statistics About The Fund?
(as of December 31, 2025)
| Fund net assets | $ 1,848,440,972 |
| Total number of portfolio holdings | 26 |
| Total advisory fees paid | $ 0 |
| Portfolio turnover rate | 29 % |
What Comprised The Fund's Holdings?
(as of December 31, 2025)
Asset allocation
(% of net assets)

How Has The Fund Changed Over The Past Year?
This is a summary of certain changes to the Fund since December 31, 2024. For more complete information, you may review the Fund's prospectus, which is available at
invesco.com/reports
or upon request at (800) 959-4246
.
The Fund added unlisted closed-end interval fund risk to its principal risks to reflect that shares of an underlying unlisted closed-end interval fund in which the Fund may invest are considered an illiquid investment because shareholders (such as the Fund) cannot redeem or sell their shares outside of periodic repurchase offers.
invesco.com/reports
or upon request at (800) 959-4246
.
invesco.com/reports
. You can also request this information by contacting us at (800) 959-4246
.
What Were The Fund Costs For The Last
Year
?
(Based on a hypothetical $10,000 investment)
Fund (Class) | Costs of a $10,000 investment | Costs paid as a percentage of a $10,000 investment |
| Invesco Select Risk: Moderate Investor Fund (Class R5) | $ 11 | 0.10 % |
How Did The Fund Perform During The Period?
•
2025 was a year of change, especially in geopolitics. Tariffs dominated headlines, Europe kicked off new defense spending, and the artificial intelligence trade was strong. Despite a year of change, global risk assets had a strong showing.•
For the fiscal year ended December 31, 2025, Class R5 shares of the Fund returned 13.53%. For the same time period, the Custom Invesco Select Risk: Moderate Investor Index (the "Benchmark") returned 15.31%.What contributed to performance?
Asset allocation - Fixed Income |
The Fund's underweight to fixed income relative to the Benchmark was the largest positive contributor to relative return given equities outperformed fixed income.Asset allocation - Equity |
The Fund's equity exposure relative to the Benchmark was a positive contributor to relative return given equities outperformed the Benchmark.What detracted from performance?
Equity manager selection
|
The Fund's equity manager selection effects were the largest detractors from the Fund's relative performance, with key detractors being selection within global and international smid-cap equities.Equity style selection |
The Fund's equity style effects detracted from relative performance given the Fund's exposure to US large-cap multifactor and US mid-cap growth equities.Alternative manager selection |
The Fund's alternative manager selection effects
detracted from the Fund's relative performance, with key detractors being selection within managed futures.How Has The Fund Historically Performed?
Growth of $10,000 Investment

AVERAGE ANNUAL TOTAL RETURNS | 1 Year | 5 Years | 10 Years |
Invesco Select Risk: Moderate Investor Fund (Class R5) | 13.53 % | 4.82 % | 6.69 % |
Custom Invesco Select Risk: Moderate Investor Index | 15.31 % | 6.95 % | 8.18 % |
Bloomberg Global Aggregate USD Hedged Index | 4.86 % | 0.34 % | 2.39 % |
MSCI ACWI Index (Net) | 22.34 % | 11.19 % | 11.72 % |
Bloomberg U.S. Aggregate Bond Index | 7.30 % | -0.36 % | 2.01 % |
invesco.com/performance
for more recent performance information.
What Are Key Statistics About The Fund?
(as of December 31, 2025)
| Fund net assets | $ 1,848,440,972 |
| Total number of portfolio holdings | 26 |
| Total advisory fees paid | $ 0 |
| Portfolio turnover rate | 29 % |
What Comprised The Fund's Holdings?
(as of December 31, 2025)
Asset allocation
(% of net assets)

How Has The Fund Changed Over The Past Year?
This is a summary of certain changes to the Fund since December 31, 2024. For more complete information, you may review the Fund's prospectus, which is available at
invesco.com/reports
or upon request at (800) 959-4246
.
The Fund added unlisted closed-end interval fund risk to its principal risks to reflect that shares of an underlying unlisted closed-end interval fund in which the Fund may invest are considered an illiquid investment because shareholders (such as the Fund) cannot redeem or sell their shares outside of periodic repurchase offers.
invesco.com/reports
or upon request at (800) 959-4246
.
invesco.com/reports
. You can also request this information by contacting us at (800) 959-4246
.
What Were The Fund Costs For The Last
Year
?
(Based on a hypothetical $10,000 investment)
Fund (Class) | Costs of a $10,000 investment | Costs paid as a percentage of a $10,000 investment |
| Invesco Select Risk: Moderate Investor Fund (Class R6) | $ 5 | 0.05 % |
How Did The Fund Perform During The Period?
•
2025 was a year of change, especially in geopolitics. Tariffs dominated headlines, Europe kicked off new defense spending, and the artificial intelligence trade was strong. Despite a year of change, global risk assets had a strong showing.•
For the fiscal year ended December 31, 2025, Class R6 shares of the Fund returned 13.60%. For the same time period, the Custom Invesco Select Risk: Moderate Investor Index (the "Benchmark") returned 15.31%.What contributed to performance?
Asset allocation - Fixed Income |
The Fund's underweight to fixed income relative to the Benchmark was the largest positive contributor to relative return given equities outperformed fixed income.Asset allocation - Equity |
The Fund's equity exposure relative to the Benchmark was a positive contributor to relative return given equities outperformed the Benchmark.What detracted from performance?
Equity manager selection
|
The Fund's equity manager selection effects were the largest detractors from the Fund's relative performance, with key detractors being selection within global and international smid-cap equities.Equity style selection |
The Fund's equity style effects detracted from relative performance given the Fund's exposure to US large-cap multifactor and US mid-cap growth equities.Alternative manager selection |
The Fund's alternative manager selection effects detracted from
the Fund's relative performance, with key detractors being selection within managed futures.How Has The Fund Historically Performed?
Growth of $10,000 Investment

AVERAGE ANNUAL TOTAL RETURNS | 1 Year | 5 Years | 10 Years |
Invesco Select Risk: Moderate Investor Fund (Class R6) | 13.60 % | 4.85 % | 6.70 % |
Custom Invesco Select Risk: Moderate Investor Index | 15.31 % | 6.95 % | 8.18 % |
Bloomberg Global Aggregate USD Hedged Index | 4.86 % | 0.34 % | 2.39 % |
MSCI ACWI Index (Net) | 22.34 % | 11.19 % | 11.72 % |
Bloomberg U.S. Aggregate Bond Index | 7.30 % | -0.36 % | 2.01 % |
invesco.com/performance
for more recent performance information.
What Are Key Statistics About The Fund?
(as of December 31, 2025)
| Fund net assets | $ 1,848,440,972 |
| Total number of portfolio holdings | 26 |
| Total advisory fees paid | $ 0 |
| Portfolio turnover rate | 29 % |
What Comprised The Fund's Holdings?
(as of December 31, 2025)
Where Can I Find More Information?
How Has The Fund Changed Over
The
Past Year?This is a summary of certain changes to the Fund since December 31, 2024. For more complete information, you may review the Fund's prospectus, which is available at
invesco.com/reports
or upon request at (800) 959-4246
.
The Fund added unlisted closed-end interval fund risk to its principal risks to reflect that shares of an underlying unlisted closed-end interval fund in which the Fund may invest are considered an illiquid investment because shareholders (such as the Fund) cannot redeem or sell their shares outside of periodic repurchase offers.
invesco.com/reports
or upon request at (800) 959-4246
.
invesco.com/reports
. You can also request this information by contacting us at (800) 959-4246
.
What Were The Fund Costs For The Last
Year
?
(Based on a hypothetical $10,000 investment)
Fund (Class) |
Costs of a $10,000 investment |
Costs paid as a percentage of a $10,000 investment |
| Invesco Select Risk: Moderately Conservative Investor Fund (Class A) |
$ 48 |
0.45 % |
How Did The Fund Perform During The Period?
•
2025 was a year of change, especially in geopolitics. Tariffs dominated headlines, Europe kicked off new defense spending and the artificial intelligence trade was strong. Despite a year of change, global risk assets rallied and performed well.•
For the fiscal year ended December 31, 2025, Class A shares of the Fund, excluding sales charge, returned 11.19%. For the same time period, the Custom Invesco Select Risk: Moderately Conservative Investor Index (the "Benchmark") returned 11.65%.What contributed to performance?
Asset allocation - Fixed Income |
The Fund's underweight to fixed income relative to the Benchmark was the largest positive contributor to relative return given equities outperformed fixed income.Asset allocation - Equity |
The Fund's equity exposure relative to the Benchmark was a positive contributor to relative return given equities outperformed the Benchmark.What detracted from performance?
Equity manager selection
|
The Fund's equity manager selection effects were the largest detractors from the Fund's relative performance, with key detractors being selection within global and international smid-cap equities.Alternative manager selection |
The Fund's alternative manager selection effects detracted from the Fund's relative performance, with key detractors being selection within managed futures.Equity style selection |
The Fund's equity style effects detracted from relative performance given the Fund's exposure to US large-cap multifactor and US mid-cap growth equities.How Has The Fund Historically Performed?
Growth of $10,000 Investment
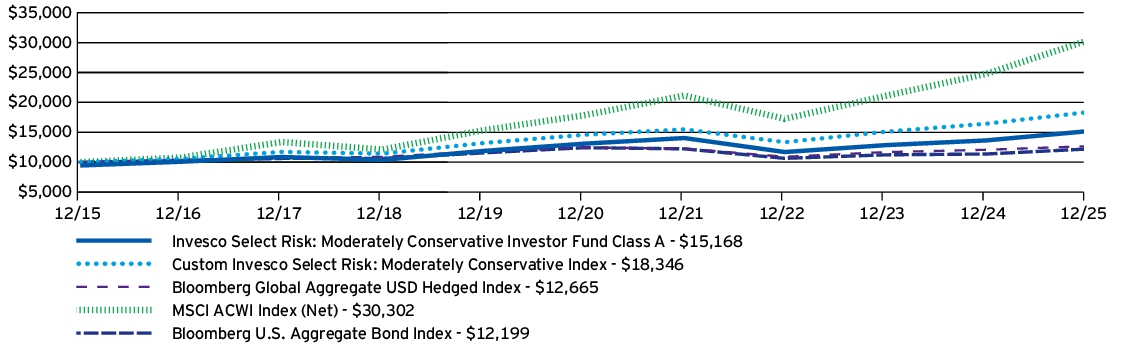
AVERAGE ANNUAL TOTAL RETURNS |
1 Year |
5 Years |
10 Years |
Invesco Select Risk: Moderately Conservative Investor Fund (Class A) —including sales charge |
5.06 % |
1.83 % |
4.25 % |
Invesco Select Risk: Moderately Conservative Investor Fund (Class A) —excluding sales charge |
11.19 % |
2.99 % |
4.84 % |
Custom Invesco Select Risk: Moderately Conservative Index |
11.65 % |
4.71 % |
6.26 % |
Bloomberg Global Aggregate USD Hedged Index |
4.86 % |
0.34 % |
2.39 % |
MSCI ACWI Index (Net) |
22.34 % |
11.19 % |
11.72 % |
Bloomberg U.S. Aggregate Bond Index |
7.30 % |
-0.36 % |
2.01 % |
invesco.com/performance
for more recent performance information.
What Are Key Statistics About The Fund?
(as of December 31, 2025)
| Fund net assets | $ 270,433,948 |
| Total number of portfolio holdings | 24 |
| Total advisory fees paid | $ 0 |
| Portfolio turnover rate | 27 % |
What Comprised The Fund's Holdings?
(as of December 31, 2025)
Asset allocation
(% of net assets)
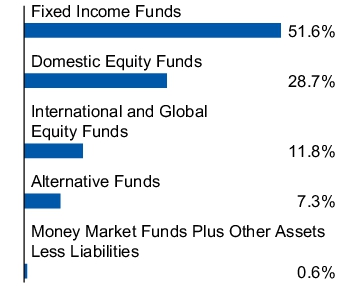
How Has T
he
Fund Changed Over The Past Year?This is a summary of certain changes to the Fund since December 31, 2024. For more complete information, you may review the Fund's prospectus, which is available at
invesco.com/reports
or upon request at (800) 959-4246
.
The Fund added unlisted closed-end interval fund risk to its principal risks to reflect that shares of an underlying unlisted closed-end interval fund in which the Fund may invest are considered an illiquid investment because shareholders (such as the Fund) cannot redeem or sell their shares outside of
periodic
repurchase offers.periodic
repurchase offers.
invesco.com/reports
or upon request at (800) 959-4246
.
invesco.com/reports
. You can also request this information by contacting us at (800) 959-4246
.
What Were The Fund Costs For The Last
Year
?
(Based on a hypothetical $10,000 investment)
Fund (Class) |
Costs of a $10,000 investment |
Costs paid as a percentage of a $10,000 investment |
| Invesco Select Risk: Moderately Conservative Investor Fund (Class C) |
$ 126 |
1.20 % |
How Did The Fund Perform During The Period?
•
2025 was a year of change, especially in geopolitics. Tariffs dominated headlines, Europe kicked off new defense spending and the artificial intelligence trade was strong. Despite a year of change, global risk assets rallied and performed well.•
For the fiscal year ended December 31, 2025, Class C shares of the Fund, excluding sales charge, returned 10.35%. For the same time period, the Custom Invesco Select Risk: Moderately Conservative Investor Index (the "Benchmark") returned 11.65%.What contributed to performance?
Asset allocation - Fixed Income |
The Fund's underweight to fixed income relative to the Benchmark was the largest positive contributor to relative return given equities outperformed fixed income.Asset allocation - Equity |
The Fund's equity exposure relative to the Benchmark was a positive contributor to relative return given equities outperformed the Benchmark.What detracted from performance?
Equity manager selection
|
The Fund's equity manager selection effects were the largest detractors from the Fund's relative performance, with key detractors being selection within global and international smid-cap equities.Alternative manager selection |
The Fund's alternative manager selection effects detracted from the Fund's relative performance, with key detractors being selection within managed futures.Equity style selection |
The Fund's equity style effects detracted from relative performance given the Fund's exposure to US large-cap multifactor and US mid-cap growth equities.How Has The Fund Historically Performed?
Growth of $10,000 Investment
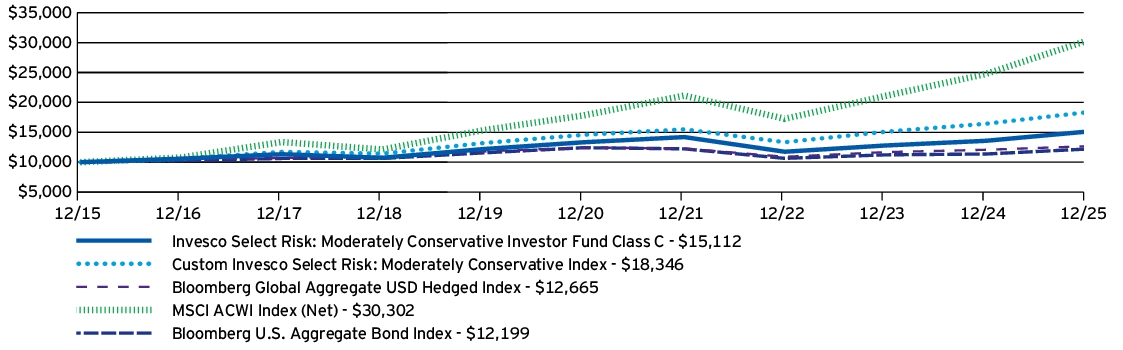
AVERAGE ANNUAL TOTAL RETURNS |
1 Year |
5 Years |
10 Years |
Invesco Select Risk: Moderately Conservative Investor Fund (Class C) —including sales charge |
9.35 % |
2.22 % |
4.22 % |
Invesco Select Risk: Moderately Conservative Investor Fund (Class C) —excluding sales charge |
10.35 % |
2.22 % |
4.22 % |
Custom Invesco Select Risk: Moderately Conservative Index |
11.65 % |
4.71 % |
6.26 % |
Bloomberg Global Aggregate USD Hedged Index |
4.86 % |
0.34 % |
2.39 % |
MSCI ACWI Index (Net) |
22.34 % |
11.19 % |
11.72 % |
Bloomberg U.S. Aggregate Bond Index |
7.30 % |
-0.36 % |
2.01 % |
invesco.com/performance
for more recent performance information.
What Are Key Statistics About The Fund?
(as of December 31, 2025)
| Fund net assets | $ 270,433,948 |
| Total number of portfolio holdings | 24 |
| Total advisory fees paid | $ 0 |
| Portfolio turnover rate | 27 % |
What Comprised The Fund's Holdings?
(as of December 31,
2025
)Asset allocation
(% of net assets)

How Has The Fund Changed Over The Past Year?
This is a summary of certain changes to the Fund since December 31, 2024. For more complete information, you may review the Fund's prospectus, which is available at
invesco.com/reports
or upon request at (800) 959-4246
.
The Fund added unlisted closed-end interval fund risk to its principal risks to reflect that shares of an underlying unlisted closed-end interval fund in which the Fund may invest are considered an illiquid investment because shareholders (such as the Fund) cannot redeem or sell their shares outside of periodic repurchase offers.
invesco.com/reports
or upon request at (800) 959-4246
.
invesco.com/reports
. You can also request this information by contacting us at (800) 959-4246
.
What Were The Fund Costs For The Last
Year
?
(Based on a hypothetical $10,000 investment)
Fund (Class) |
Costs of a $10,000 investment |
Costs paid as a percentage of a $10,000 investment |
| Invesco Select Risk: Moderately Conservative Investor Fund (Class R) |
$ 74 |
0.70 % |
How Did The Fund Perform During The Period?
•
2025 was a year of change, especially in geopolitics. Tariffs dominated headlines, Europe kicked off new defense spending and the artificial intelligence trade was strong. Despite a year of change, global risk assets rallied and performed well.•
For the fiscal year ended December 31, 2025, Class R shares of the Fund returned 10.94%. For the same time period, the Custom Invesco Select Risk: Moderately Conservative Investor Index (the "Benchmark") returned 11.65%.What contributed to performance?
Asset allocation - Fixed Income |
The Fund's underweight to fixed income relative to the Benchmark was the largest positive contributor to relative return given equities outperformed fixed income.Asset allocation - Equity |
The Fund's equity exposure relative to the Benchmark was a positive contributor to relative return given equities outperformed the Benchmark.What detracted from performance?
Equity manager selection
|
The Fund's equity manager selection effects were the largest detractors from the Fund's relative performance, with key detractors being selection within global and international smid-cap equities.Alternative manager selection |
The Fund's alternative manager selection effects detracted from the Fund's relative performance, with key detractors being selection within managed futures.Equity style selection |
The Fund's equity style effects detracted from relative performance given the Fund's exposure to US large-cap multifactor and US mid-cap growth equities.How Has The Fund Historically Performed?
Growth of $10,000 Investment
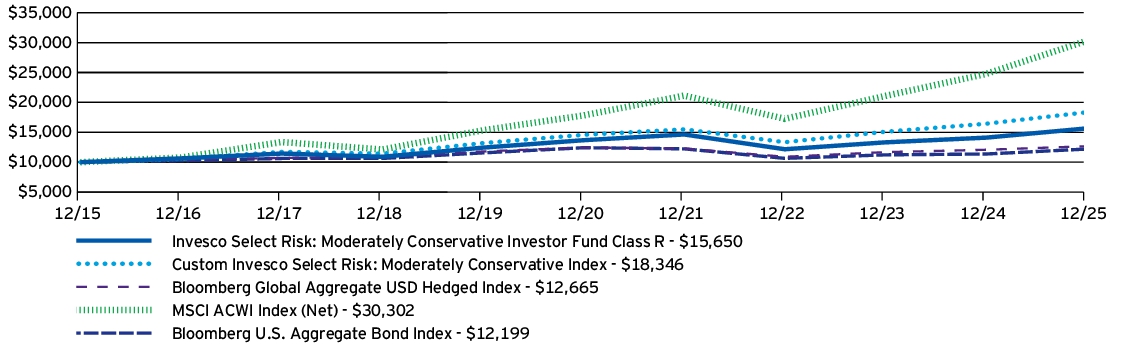
AVERAGE ANNUAL TOTAL RETURNS |
1 Year |
5 Years |
10 Years |
Invesco Select Risk: Moderately Conservative Investor Fund (Class R) |
10.94 % |
2.73 % |
4.58 % |
Custom Invesco Select Risk: Moderately Conservative Index |
11.65 % |
4.71 % |
6.26 % |
Bloomberg Global Aggregate USD Hedged Index |
4.86 % |
0.34 % |
2.39 % |
MSCI ACWI Index (Net) |
22.34 % |
11.19 % |
11.72 % |
Bloomberg U.S. Aggregate Bond Index |
7.30 % |
-0.36 % |
2.01 % |
invesco.com/performance
for more recent performance information.
What Are Key Statistics About The Fund?
(as of December 31, 2025)
| Fund net assets | $ 270,433,948 |
| Total number of portfolio holdings | 24 |
| Total advisory fees paid | $ 0 |
| Portfolio turnover rate | 27 % |
What Comprised The
Fund's
Holdings?(as of December 31, 2025)
Asset allocation
(% of net assets)

How Has The Fund Changed Over The Past Year?
This is a summary of certain changes to the Fund since December 31, 2024. For more complete information, you may review the Fund's prospectus, which is available at
invesco.com/reports
or upon request at (800) 959-4246
.
The Fund added unlisted closed-end interval fund risk to its principal risks to reflect that shares of an underlying unlisted closed-end interval fund in which the Fund may invest are considered an illiquid investment because shareholders (such as the Fund) cannot redeem or sell their shares outside of
periodic
repurchase offers.periodic
repurchase offers.
invesco.com/reports
or upon request at (800) 959-4246
.
invesco.com/reports
. You can also request this information by contacting us at (800) 959-4246
.
What Were The Fund Costs For The Last
Year
?
(Based on a hypothetical $10,000 investment)
Fund (Class) |
Costs of a $10,000 investment |
Costs paid as a percentage of a $10,000 investment |
| Invesco Select Risk: Moderately Conservative Investor Fund (Class S) |
$ 37 |
0.35 % |
How Did The Fund Perform During The Period?
•
2025 was a year of change, especially in geopolitics. Tariffs dominated headlines, Europe kicked off new defense spending and the artificial intelligence trade was strong. Despite a year of change, global risk assets rallied and performed well.•
For the fiscal year ended December 31, 2025, Class S shares of the Fund returned 11.29%. For the same time period, the Custom Invesco Select Risk: Moderately Conservative Investor Index (the "Benchmark") returned 11.65%.What contributed to performance?
Asset allocation - Fixed Income |
The Fund's underweight to fixed income relative to the Benchmark was the largest positive contributor to relative return given equities outperformed fixed income.Asset allocation - Equity |
The Fund's equity exposure relative to the Benchmark was a positive contributor to relative return given equities outperformed the Benchmark.What detracted from performance?
Equity manager selection
|
The Fund's equity manager selection effects were the largest detractors from the Fund's relative performance, with key detractors being selection within global and international smid-cap equities.Alternative manager selection |
The Fund's alternative manager selection effects detracted from the Fund's relative performance, with key detractors being selection within managed futures.Equity style selection |
The Fund's equity style effects detracted from relative performance given the Fund's exposure to US large-cap multifactor and US mid-cap growth equities.How Has The Fund Historically Performed?
Growth of $10,000 Investment
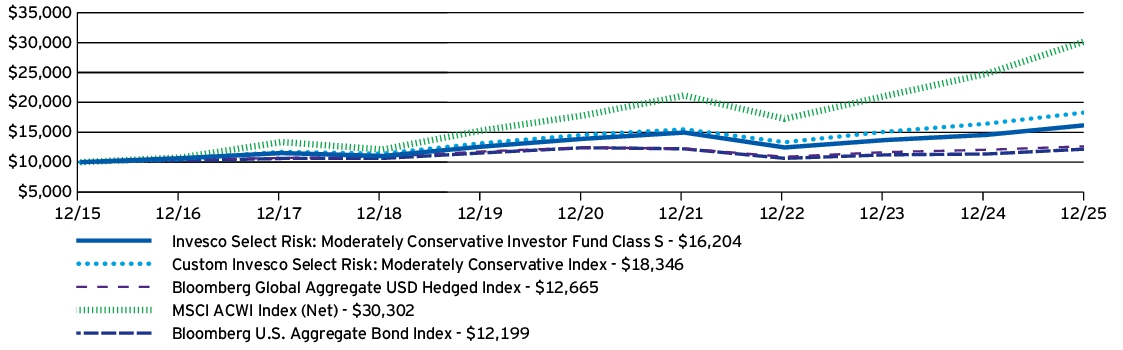
AVERAGE ANNUAL TOTAL RETURNS |
1 Year |
5 Years |
10 Years |
Invesco Select Risk: Moderately Conservative Investor Fund (Class S) |
11.29 % |
3.09 % |
4.95 % |
Custom Invesco Select Risk: Moderately Conservative Index |
11.65 % |
4.71 % |
6.26 % |
Bloomberg Global Aggregate USD Hedged Index |
4.86 % |
0.34 % |
2.39 % |
MSCI ACWI Index (Net) |
22.34 % |
11.19 % |
11.72 % |
Bloomberg U.S. Aggregate Bond Index |
7.30 % |
-0.36 % |
2.01 % |
invesco.com/performance
for more recent performance information.
What Are Key Statistics About The Fund?
(as of December 31, 2025)
| Fund net assets | $ 270,433,948 |
| Total number of portfolio holdings | 24 |
| Total advisory fees paid | $ 0 |
| Portfolio turnover rate | 27 % |
What Comprised The
Fund's
Holdings?(as of December 31, 2025)
Asset allocation
(% of net assets)

How Has The Fund Changed Over The Past Year?
This is a summary of certain changes to the Fund since December 31, 2024. For more complete information, you may review the Fund's prospectus, which is available at
invesco.com/reports
or upon request at (800) 959-4246
.
The Fund added unlisted closed-end interval fund risk to its principal risks to reflect that shares of an underlying unlisted closed-end interval fund in which the Fund may invest are considered an illiquid investment because shareholders (such as the Fund) cannot redeem or sell their shares outside of periodic repurchase offers.
invesco.com/reports
or upon request at (800) 959-4246
.
invesco.com/reports
. You can also request this information by contacting us at (800) 959-4246
.
What Were The Fund Costs For The Last
Year
?
(Based on a hypothetical $10,000 investment)
Fund (Class) |
Costs of a $10,000 investment |
Costs paid as a percentage of a $10,000 investment |
| Invesco Select Risk: Moderately Conservative Investor Fund (Class Y) |
$ 21 |
0.20 % |
How Did The Fund Perform During The Period?
•
2025 was a year of change, especially in geopolitics. Tariffs dominated headlines, Europe kicked off new defense spending and the artificial intelligence trade was strong. Despite a year of change, global risk assets rallied and performed well.•
For the fiscal year ended December 31, 2025, Class Y shares of the Fund returned 11.48%. For the same time period, the Custom Invesco Select Risk: Moderately Conservative Investor Index (the "Benchmark") returned 11.65%.What contributed to performance?
Asset allocation - Fixed Income |
The Fund's underweight to fixed income relative to the Benchmark was the largest positive contributor to relative return given equities outperformed fixed income.Asset allocation - Equity |
The Fund's equity exposure relative to the Benchmark was a positive contributor to relative return given equities outperformed the Benchmark.What detracted from performance?
Equity manager selection
|
The Fund's equity manager selection effects were the largest detractors from the Fund's relative performance, with key detractors being selection within global and international smid-cap equities.Alternative manager selection |
The Fund's alternative manager selection effects detracted from the Fund's relative performance, with key detractors being selection within managed futures.Equity style selection |
The Fund's equity style effects detracted from relative performance given the Fund's exposure to US large-cap multifactor and US mid-cap growth equities.How Has The Fund Historically Performed?
Growth of $10,000 Investment

AVERAGE ANNUAL TOTAL RETURNS |
1 Year |
5 Years |
10 Years |
Invesco Select Risk: Moderately Conservative Investor Fund (Class Y) |
11.48 % |
3.25 % |
5.10 % |
Custom Invesco Select Risk: Moderately Conservative Index |
11.65 % |
4.71 % |
6.26 % |
Bloomberg Global Aggregate USD Hedged Index |
4.86 % |
0.34 % |
2.39 % |
MSCI ACWI Index (Net) |
22.34 % |
11.19 % |
11.72 % |
Bloomberg U.S. Aggregate Bond Index |
7.30 % |
-0.36 % |
2.01 % |
invesco.com/performance
for more recent performance information.
What Are Key Statistics About The Fund?
(as of December 31, 2025)
| Fund net assets | $ 270,433,948 |
| Total number of portfolio holdings | 24 |
| Total advisory fees paid | $ 0 |
| Portfolio turnover rate | 27 % |
What Comprised The Fund's Holdings?
(as of
December
31, 2025)Asset allocation
(% of net assets)

How Has The Fund Changed Over The Past Year?
This is a summary of certain changes to the Fund since December 31, 2024. For more complete information, you may review the Fund's prospectus, which is available at
invesco.com/reports
or upon request at (800) 959-4246
.
The Fund added unlisted closed-end interval fund risk to its principal risks to reflect that shares of an underlying unlisted closed-end interval fund in which the Fund may invest are considered an illiquid investment because shareholders (such as the Fund) cannot redeem or sell their shares outside of periodic repurchase offers.
invesco.com/reports
or upon request at (800) 959-4246
.
invesco.com/reports
. You can also request this information by contacting us at (800) 959-4246
.
What Were The Fund Costs For The Last
Year
?
(Based on a hypothetical $10,000 investment)
Fund (Class) |
Costs of a $10,000 investment |
Costs paid as a percentage of a $10,000 investment |
| Invesco Select Risk: Moderately Conservative Investor Fund (Class R5) |
$ 21 |
0.20 % |
How Did The Fund Perform During The Period?
•
2025 was a year of change, especially in geopolitics. Tariffs dominated headlines, Europe kicked off new defense spending and the artificial intelligence trade was strong. Despite a year of change, global risk assets rallied and performed well.•
For the fiscal year ended December 31, 2025, Class R5 shares of the Fund returned 11.53%. For the same time period, the Custom Invesco Select Risk: Moderately Conservative Investor Index (the "Benchmark") returned 11.65%.What contributed to performance?
Asset allocation - Fixed Income |
The Fund's underweight to fixed income relative to the Benchmark was the largest positive contributor to relative return given equities outperformed fixed income.Asset allocation - Equity |
The Fund's equity exposure relative to the Benchmark was a positive contributor to relative return given equities outperformed the Benchmark.What detracted from performance?
Equity manager selection
|
The Fund's equity manager selection effects were the largest detractors from the Fund's relative performance, with key detractors being selection within global and international smid-cap equities.Alternative manager selection |
The Fund's alternative manager selection effects detracted from the Fund's relative performance, with key detractors being selection within managed futures.Equity style selection |
The Fund's equity style effects detracted from relative performance given the Fund's exposure to US large-cap multifactor and US mid-cap growth equities.How Has The Fund Historically Performed?
Growth of $10,000 Investment

AVERAGE ANNUAL TOTAL RETURNS |
1 Year |
5 Years |
10 Years |
Invesco Select Risk: Moderately Conservative Investor Fund (Class R5) |
11.53 % |
3.29 % |
5.15 % |
Custom Invesco Select Risk: Moderately Conservative Index |
11.65 % |
4.71 % |
6.26 % |
Bloomberg Global Aggregate USD Hedged Index |
4.86 % |
0.34 % |
2.39 % |
MSCI ACWI Index (Net) |
22.34 % |
11.19 % |
11.72 % |
Bloomberg U.S. Aggregate Bond Index |
7.30 % |
-0.36 % |
2.01 % |
invesco.com/performance
for more recent performance information.
What Are Key Statistics About The Fund?
(as of December 31, 2025)
| Fund net assets | $ 270,433,948 |
| Total number of portfolio holdings | 24 |
| Total advisory fees paid | $ 0 |
| Portfolio turnover rate | 27 % |
What Comprised
The
Fund's Holdings?(as of December 31, 2025)
Asset allocation
(% of net assets)

How Has The Fund Changed Over The Past Year?
This is a summary of certain changes to the Fund since December 31, 2024. For more complete information, you may review the Fund's prospectus, which is available at
invesco.com/reports
or upon request at (800) 959-4246
.
The Fund added unlisted closed-end interval fund risk to its principal risks to reflect that shares of an underlying unlisted closed-end interval fund in which the Fund may invest are considered an illiquid investment because shareholders (such as the Fund) cannot redeem or sell their shares outside of periodic repurchase offers.
invesco.com/reports
or upon request at (800) 959-4246
.
invesco.com/reports
. You can also request this information by contacting us at (800) 959-4246
.
What Were The Fund Costs For The Last
Year
?
(Based on a hypothetical $10,000 investment)
Fund (Class) | Costs of a $10,000 investment | Costs paid as a percentage of a $10,000 investment |
| Invesco Select Risk: Moderately Conservative Investor Fund (Class R6) | $ 14 | 0.13 % |
How Did The Fund Perform During The Period?
•
2025 was a year of change, especially in geopolitics. Tariffs dominated headlines, Europe kicked off new defense spending and the artificial intelligence trade was strong. Despite a year of change, global risk assets rallied and performed well.•
For the fiscal year ended December 31, 2025, Class R5 shares of the Fund returned 11.61%. For the same time period, the Custom Invesco Select Risk: Moderately Conservative Investor Index (the "Benchmark") returned 11.65%.What contributed to performance?
Asset allocation - Fixed Income |
The Fund's underweight to fixed income relative to the Benchmark was the largest positive contributor to relative return given equities outperformed fixed income.Asset allocation - Equity |
The Fund's equity exposure relative to the Benchmark was a positive contributor to relative return given equities outperformed the Benchmark.What detracted from performance?
Equity manager selection
|
The Fund's equity manager selection effects were the largest detractors from the Fund's relative performance, with key detractors being selection within global and international smid-cap equities.Alternative manager selection |
The Fund's alternative manager selection effects detracted from the Fund's relative performance, with key detractors being selection within managed futures.Equity style selection |
The Fund's equity style effects detracted from relative performance given the Fund's exposure to US large-cap multifactor and US mid-cap growth equities.How Has The Fund Historically Performed?
Growth of $10,000 Investment
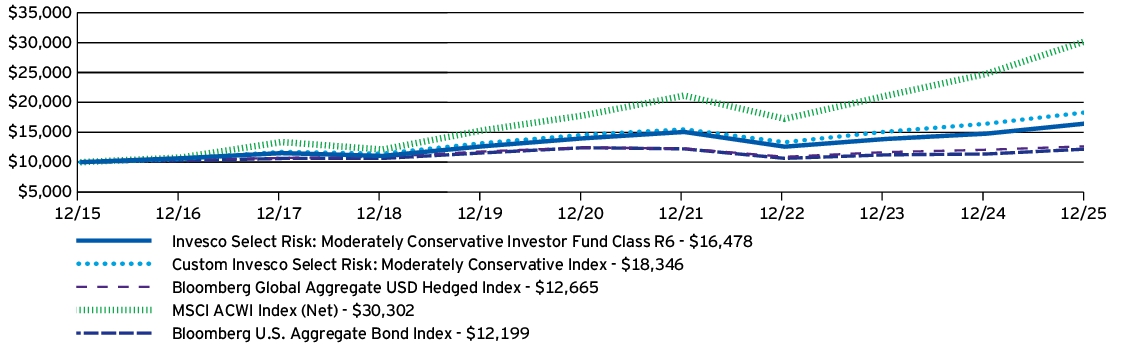
AVERAGE ANNUAL TOTAL RETURNS | 1 Year | 5 Years | 10 Years |
Invesco Select Risk: Moderately Conservative Investor Fund (Class R6) | 11.61 % | 3.32 % | 5.12 % |
Custom Invesco Select Risk: Moderately Conservative Index | 11.65 % | 4.71 % | 6.26 % |
Bloomberg Global Aggregate USD Hedged Index | 4.86 % | 0.34 % | 2.39 % |
MSCI ACWI Index (Net) | 22.34 % | 11.19 % | 11.72 % |
Bloomberg U.S. Aggregate Bond Index | 7.30 % | -0.36 % | 2.01 % |
invesco.com/performance
for more recent performance information.
What Are Key Statistics About The Fund?
(as of December 31, 2025)
| Fund net assets | $ 270,433,948 |
| Total number of portfolio holdings | 24 |
| Total advisory fees paid | $ 0 |
| Portfolio turnover rate | 27 % |
What Comprised The Fund's Holdings?
(as of December 31, 2025)
Asset allocation
(% of net assets)

How Has The Fund Changed Over The Past Year?
This is a summary of certain changes to the Fund since December 31, 2024. For more complete information, you may review the Fund's prospectus, which is available at
invesco.com/reports
or upon request at (800) 959-4246
.
The Fund added unlisted closed-end interval fund risk to its principal risks to reflect that shares of an underlying unlisted closed-end interval fund in which the Fund may invest are considered an illiquid investment because shareholders (such as the Fund) cannot redeem or sell their shares outside of periodic repurchase offers.
invesco.com/reports
or upon request at (800) 959-4246
.
invesco.com/reports
. You can also request this information by contacting us at (800) 959-4246
.
What Were The Fund Costs For The Last
Year
?
(Based on a hypothetical $10,000 investment)
Fund (Class) |
Costs of a $10,000 investment |
Costs paid as a percentage of a $10,000 investment |
| Invesco Small Cap Growth Fund (Class A) |
$ 120 |
1.17 % |
How Did The Fund Perform During The Period?
•
During the fiscal year ended December 31, 2025, US small cap equities saw improved performance as the Federal Reserve continued its easing cycle amid moderating inflation and a resilient labor market.•
For the fiscal year ended December 31, 2025, Class A shares of the Fund, excluding sales charge, returned 5.69%. For the same time period, the Russell 2000®
Growth Index (the "Benchmark") returned 13.01%. The Fund underperformed the Benchmark primarily due to stock selection in the industrials, health care, consumer staples and real estate sectors. These results were partially offset by positive stock selection within the utilities, information technology, and energy sectors, as well as an underweight exposure in the communication services and consumer staples sectors.What contributed to performance?
Circle Internet Group, Inc. |
Circle is an issuer of USDC stablecoins used to facilitate block-chain electronic payments. The Fund participated in the initial public offering (IPO) and sold the holding following a significant run up in its post-IPO valuation.Guardant Health, Inc. |
Guardant Health operates as a biotechnology company. The company delivered a strong year with accelerating oncology revenues, growing adoption of their blood biopsy tests that focus on cancer treatment selection and monitoring (Guardant360 and Reveal), and Guardant Shield for colorectal cancer emerging as a second growth engine.Kratos Defense & Security Solutions, Inc. |
Kratos Defense & Security Solutions focuses on drone and rocket technology. The stock has done well as defense is an area that has seen a resurgence in spending.What detracted from performance?
Freshpet, Inc.
|
Freshpet makes dog and cat food that uses fresh meat, fruit and vegetables, which is distributed in grocery and specialty stores. The company saw strong demand during COVID and built out capacity for continued growth. However, additional demand had not materialized. The Fund sold the stock during the period.Coherent Corp. |
Coherent makes electrical components used in artificial intelligence (AI) infrastructure. The stock pulled back during the period on concerns around the sustainability of AI capital expenditures. The Fund sold the stock during the period.Vaxcyte, Inc. |
Vaxcyte is a pneumococcal vaccine provider. The Fund sold the stock during the period following increasing pressure on vaccines under the current administration.How Has The Fund Historically Performed?
Growth of $10,000 Investment
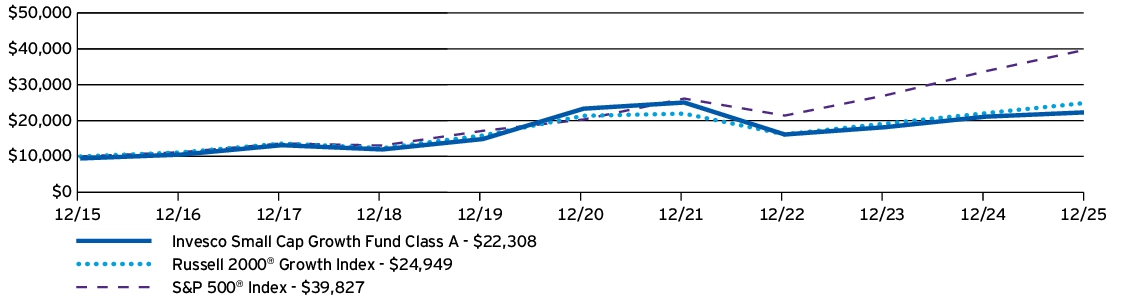
AVERAGE ANNUAL TOTAL RETURNS |
1 Year |
5 Years |
10 Years |
Invesco Small Cap Growth Fund (Class A) —including sales charge |
-0.12 % |
-2.00 % |
8.35 % |
Invesco Small Cap Growth Fund (Class A) —excluding sales charge |
5.69 % |
-0.89 % |
8.97 % |
Russell 2000 ® Growth Index |
13.01 % |
3.18 % |
9.57 % |
S&P 500 ® Index |
17.88 % |
14.42 % |
14.82 % |
invesco.com/performance
for more recent performance information.
What Are Key Statistics About The Fund?
(as of December 31, 2025)
| Fund net assets | $ 1,605,241,578 |
| Total number of portfolio holdings | 105 |
| Total advisory fees paid | $ 12,041,835 |
| Portfolio turnover rate | 85 % |
What Comprised The Fund's Holdings?
(as of December 31, 2025)
Top ten
holdings
*(% of net assets)
| Sanmina Corp. | 2.61 % |
| Guardant Health, Inc. | 2.42 % |
| MACOM Technology Solutions Holdings, Inc. | 2.29 % |
| Madrigal Pharmaceuticals, Inc. | 2.13 % |
| SPX Technologies, Inc. | 1.94 % |
| BridgeBio Pharma, Inc. | 1.90 % |
| Piper Sandler Cos. | 1.89 % |
| Fabrinet | 1.85 % |
| Carpenter Technology Corp. | 1.84 % |
| Axsome Therapeutics, Inc. | 1.83 % |
| * Excluding money market fund holdings, if any. |
Sector allocation
(% of net assets)

Top ten
holdings
*(% of net assets)
| Sanmina Corp. | 2.61 % |
| Guardant Health, Inc. | 2.42 % |
| MACOM Technology Solutions Holdings, Inc. | 2.29 % |
| Madrigal Pharmaceuticals, Inc. | 2.13 % |
| SPX Technologies, Inc. | 1.94 % |
| BridgeBio Pharma, Inc. | 1.90 % |
| Piper Sandler Cos. | 1.89 % |
| Fabrinet | 1.85 % |
| Carpenter Technology Corp. | 1.84 % |
| Axsome Therapeutics, Inc. | 1.83 % |
| * Excluding money market fund holdings, if any. |
invesco.com/reports
. You can also request this information by contacting us at (800) 959-4246
.
What Were The Fund Costs For The Last
Year
?
(Based on a hypothetical $10,000 investment)
Fund (Class) |
Costs of a $10,000 investment |
Costs paid as a percentage of a $10,000 investment |
| Invesco Small Cap Growth Fund (Class C) |
$ 193 |
1.88 % |
How Did The Fund Perform During The Period?
•
During the fiscal year ended December 31, 2025, US small cap equities saw improved performance as the Federal Reserve continued its easing cycle amid moderating inflation and a resilient labor market.•
For the fiscal year ended December 31, 2025, Class C shares of the Fund, excluding sales charge, returned 4.96%. For the same time period, the Russell 2000®
Growth Index (the "Benchmark") returned 13.01%. The Fund underperformed the Benchmark primarily due to stock selection in the industrials, health care, consumer staples and real estate sectors. These results were partially offset by positive stock selection within the utilities, information technology, and energy sectors, as well as an underweight exposure in the communication services and consumer staples sectors.What contributed to performance?
Circle Internet Group, Inc. |
Circle is an issuer of USDC stablecoins used to facilitate block-chain electronic payments. The Fund participated in the initial public offering (IPO) and sold the holding following a significant run up in its post-IPO valuation.Guardant Health, Inc. |
Guardant Health operates as a biotechnology company. The company delivered a strong year with accelerating oncology revenues, growing adoption of their blood biopsy tests that focus on cancer treatment selection and monitoring (Guardant360 and Reveal), and Guardant Shield for colorectal cancer emerging as a second growth engine.Kratos Defense & Security Solutions, Inc. |
Kratos Defense & Security Solutions focuses on drone and rocket technology. The stock has done well as defense is an area that has seen a resurgence in spending.What detracted from performance?
Freshpet, Inc.
|
Freshpet makes dog and cat food that uses fresh meat, fruit and vegetables, which is distributed in grocery and specialty stores. The company saw strong demand during COVID and built out capacity for continued growth. However, additional demand had not materialized. The Fund sold the stock during the period.Coherent Corp. |
Coherent makes electrical components used in artificial intelligence (AI) infrastructure. The stock pulled back during the period on concerns around the sustainability of AI capital expenditures. The Fund sold the stock during the period.Vaxcyte, Inc. |
Vaxcyte is a pneumococcal vaccine provider. The Fund sold the stock during the period following increasing pressure on vaccines under the current administration.How Has The Fund Historically Performed?
Growth of $10,000 Investment
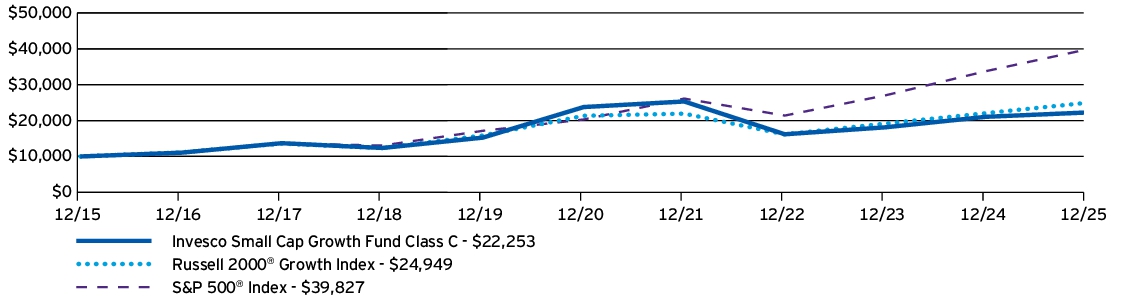
AVERAGE ANNUAL TOTAL RETURNS |
1 Year |
5 Years |
10 Years |
Invesco Small Cap Growth Fund (Class C) —including sales charge |
4.24 % |
-1.58 % |
8.33 % |
Invesco Small Cap Growth Fund (Class C) —excluding sales charge |
4.96 % |
-1.58 % |
8.33 % |
Russell 2000 ® Growth Index |
13.01 % |
3.18 % |
9.57 % |
S&P 500 ® Index |
17.88 % |
14.42 % |
14.82 % |
invesco.com/performance
for more recent performance information.
What Are Key Statistics About The Fund?
(as of December 31, 2025)
| Fund net assets | $ 1,605,241,578 |
| Total number of portfolio holdings | 105 |
| Total advisory fees paid | $ 12,041,835 |
| Portfolio turnover rate | 85 % |
What Comprised The Fund's Holdings?
(as of December 31, 2025)
Top ten holdings*
(% of net assets)
| Sanmina Corp. | 2.61 % |
| Guardant Health, Inc. | 2.42 % |
| MACOM Technology Solutions Holdings, Inc. | 2.29 % |
| Madrigal Pharmaceuticals, Inc. | 2.13 % |
| SPX Technologies, Inc. | 1.94 % |
| BridgeBio Pharma, Inc. | 1.90 % |
| Piper Sandler Cos. | 1.89 % |
| Fabrinet | 1.85 % |
| Carpenter Technology Corp. | 1.84 % |
| Axsome Therapeutics, Inc. | 1.83 % |
| * Excluding money market fund holdings, if any. |
Sector allocation
(% of net assets)
Top ten holdings*
(% of net assets)
| Sanmina Corp. | 2.61 % |
| Guardant Health, Inc. | 2.42 % |
| MACOM Technology Solutions Holdings, Inc. | 2.29 % |
| Madrigal Pharmaceuticals, Inc. | 2.13 % |
| SPX Technologies, Inc. | 1.94 % |
| BridgeBio Pharma, Inc. | 1.90 % |
| Piper Sandler Cos. | 1.89 % |
| Fabrinet | 1.85 % |
| Carpenter Technology Corp. | 1.84 % |
| Axsome Therapeutics, Inc. | 1.83 % |
| * Excluding money market fund holdings, if any. |
invesco.com/reports
. You can also request this information by contacting us at (800) 959-4246
.
What Were The Fund Costs For The Last
Year
?
(Based on a hypothetical $10,000 investment)
Fund (Class) |
Costs of a $10,000 investment |
Costs paid as a percentage of a $10,000 investment |
| Invesco Small Cap Growth Fund (Class R) |
$ 146 |
1.42 % |
How Did The Fund Perform During The Period?
•
During the fiscal year ended December 31, 2025, US small cap equities saw improved performance as the Federal Reserve continued its easing cycle amid moderating inflation and a resilient labor market.•
For the fiscal year ended December 31, 2025, Class R shares of the Fund returned 5.43%. For the same time period, the Russell 2000®
Growth Index (the "Benchmark") returned 13.01%. The Fund underperformed the Benchmark primarily due to stock selection in the industrials, health care, consumer staples and real estate sectors. These results were partially offset by positive stock selection within the utilities, information technology, and energy sectors, as well as an underweight exposure in the communication services and consumer staples sectors.What contributed to performance?
Circle Internet Group, Inc. |
Circle is an issuer of USDC stablecoins used to facilitate block-chain electronic payments. The Fund participated in the initial public offering (IPO) and sold the holding following a significant run up in its post-IPO valuation.Guardant Health, Inc. |
Guardant Health operates as a biotechnology company. The company delivered a strong year with accelerating oncology revenues, growing adoption of their blood biopsy tests that focus on cancer treatment selection and monitoring (Guardant360 and Reveal), and Guardant Shield for colorectal cancer emerging as a second growth engine.Kratos Defense & Security Solutions, Inc. |
Kratos Defense & Security Solutions focuses on drone and rocket technology. The stock has done well as defense is an area that has seen a resurgence in spending.What detracted from performance?
Freshpet, Inc.
|
Freshpet makes dog and cat food that uses fresh meat, fruit and vegetables, which is distributed in grocery and specialty stores. The company saw strong demand during COVID and built out capacity for continued growth. However, additional demand had not materialized. The Fund sold the stock during the period.Coherent Corp. |
Coherent makes electrical components used in artificial intelligence (AI) infrastructure. The stock pulled back during the period on concerns around the sustainability of AI capital expenditures. The Fund sold the stock during the period.Vaxcyte, Inc. |
Vaxcyte is a pneumococcal vaccine provider. The Fund sold the stock during the period following increasing pressure on vaccines under the current administration.How Has The Fund Historically Performed?
Growth of $10,000 Investment
AVERAGE ANNUAL TOTAL RETURNS |
1 Year |
5 Years |
10 Years |
Invesco Small Cap Growth Fund (Class R) |
5.43 % |
-1.14 % |
8.69 % |
Russell 2000 ® Growth Index |
13.01 % |
3.18 % |
9.57 % |
S&P 500 ® Index |
17.88 % |
14.42 % |
14.82 % |
invesco.com/performance
for more recent performance information.
What Are Key Statistics About The Fund?
(as of December 31, 2025)
| Fund net assets | $ 1,605,241,578 |
| Total number of portfolio holdings | 105 |
| Total advisory fees paid | $ 12,041,835 |
| Portfolio turnover rate | 85 % |
What Comprised The Fund's Holdings?
(as of December 31, 2025)
Top ten
holdings
*(% of net assets)
| Sanmina Corp. | 2.61 % |
| Guardant Health, Inc. | 2.42 % |
| MACOM Technology Solutions Holdings, Inc. | 2.29 % |
| Madrigal Pharmaceuticals, Inc. | 2.13 % |
| SPX Technologies, Inc. | 1.94 % |
| BridgeBio Pharma, Inc. | 1.90 % |
| Piper Sandler Cos. | 1.89 % |
| Fabrinet | 1.85 % |
| Carpenter Technology Corp. | 1.84 % |
| Axsome Therapeutics, Inc. | 1.83 % |
| * Excluding money market fund holdings, if any. |
Sector allocation
(% of net assets)

Top ten
holdings
*(% of net assets)
| Sanmina Corp. | 2.61 % |
| Guardant Health, Inc. | 2.42 % |
| MACOM Technology Solutions Holdings, Inc. | 2.29 % |
| Madrigal Pharmaceuticals, Inc. | 2.13 % |
| SPX Technologies, Inc. | 1.94 % |
| BridgeBio Pharma, Inc. | 1.90 % |
| Piper Sandler Cos. | 1.89 % |
| Fabrinet | 1.85 % |
| Carpenter Technology Corp. | 1.84 % |
| Axsome Therapeutics, Inc. | 1.83 % |
| * Excluding money market fund holdings, if any. |
invesco.com/reports
. You can also request this information by contacting us at (800) 959-4246
.
What Were The Fund Costs For The Last
Year
?
(Based on a hypothetical $10,000 investment)
Fund (Class) |
Costs of a $10,000 investment |
Costs paid as a percentage of a $10,000 investment |
| Invesco Small Cap Growth Fund (Class Y) |
$ 95 |
0.92 % |
How Did The Fund Perform During The Period?
•
During the fiscal year ended December 31, 2025, US small cap equities saw improved performance as the Federal Reserve continued its easing cycle amid moderating inflation and a resilient labor market.•
For the fiscal year ended December 31, 2025, Class Y shares of the Fund returned 5.95%. For the same time period, the Russell 2000®
Growth Index (the "Benchmark") returned 13.01%. The Fund underperformed the Benchmark primarily due to stock selection in the industrials, health care, consumer staples and real estate sectors. These results were partially offset by positive stock selection within the utilities, information technology, and energy sectors, as well as an underweight exposure in the communication services and consumer staples sectors.What contributed to performance?
Circle Internet Group, Inc. |
Circle is an issuer of USDC stablecoins used to facilitate block-chain electronic payments. The Fund participated in the initial public offering (IPO) and sold the holding following a significant run up in its post-IPO valuation.Guardant Health, Inc. |
Guardant Health operates as a biotechnology company. The company delivered a strong year with accelerating oncology revenues, growing adoption of their blood biopsy tests that focus on cancer treatment selection and monitoring (Guardant360 and Reveal), and Guardant Shield for colorectal cancer emerging as a second growth engine.Kratos Defense & Security Solutions, Inc. |
Kratos Defense & Security Solutions focuses on drone and rocket technology. The stock has done well as defense is an area that has seen a resurgence in spending.What detracted from performance?
Freshpet, Inc.
|
Freshpet makes dog and cat food that uses fresh meat, fruit and vegetables, which is distributed in grocery and specialty stores. The company saw strong demand during COVID and built out capacity for continued growth. However, additional demand had not materialized. The Fund sold the stock during the period.Coherent Corp. |
Coherent makes electrical components used in artificial intelligence (AI) infrastructure. The stock pulled back during the period on concerns around the sustainability of AI capital expenditures. The Fund sold the stock during the period.Vaxcyte, Inc. |
Vaxcyte is a pneumococcal vaccine provider. The Fund sold the stock during the period following increasing pressure on vaccines under the current administration.How Has The Fund Historically Performed?
Growth of $10,000 Investment
AVERAGE ANNUAL TOTAL RETURNS |
1 Year |
5 Years |
10 Years |
Invesco Small Cap Growth Fund (Class Y) |
5.95 % |
-0.64 % |
9.24 % |
Russell 2000 ® Growth Index |
13.01 % |
3.18 % |
9.57 % |
S&P 500 ® Index |
17.88 % |
14.42 % |
14.82 % |
invesco.com/performance
for more recent performance information.
What Are Key Statistics About The Fund?
(as of December 31, 2025)
| Fund net assets | $ 1,605,241,578 |
| Total number of portfolio holdings | 105 |
| Total advisory fees paid | $ 12,041,835 |
| Portfolio turnover rate | 85 % |
What Comprised The Fund's Holdings?
(as of December 31, 2025)
Top
ten
holdings*(% of net assets)
| Sanmina Corp. | 2.61 % |
| Guardant Health, Inc. | 2.42 % |
| MACOM Technology Solutions Holdings, Inc. | 2.29 % |
| Madrigal Pharmaceuticals, Inc. | 2.13 % |
| SPX Technologies, Inc. | 1.94 % |
| BridgeBio Pharma, Inc. | 1.90 % |
| Piper Sandler Cos. | 1.89 % |
| Fabrinet | 1.85 % |
| Carpenter Technology Corp. | 1.84 % |
| Axsome Therapeutics, Inc. | 1.83 % |
| * Excluding money market fund holdings, if any. |
Sector allocation
(% of net assets)

Top
ten
holdings*(% of net assets)
| Sanmina Corp. | 2.61 % |
| Guardant Health, Inc. | 2.42 % |
| MACOM Technology Solutions Holdings, Inc. | 2.29 % |
| Madrigal Pharmaceuticals, Inc. | 2.13 % |
| SPX Technologies, Inc. | 1.94 % |
| BridgeBio Pharma, Inc. | 1.90 % |
| Piper Sandler Cos. | 1.89 % |
| Fabrinet | 1.85 % |
| Carpenter Technology Corp. | 1.84 % |
| Axsome Therapeutics, Inc. | 1.83 % |
| * Excluding money market fund holdings, if any. |
invesco.com/reports
. You can also request this information by contacting us at (800) 959-4246
.
What Were The Fund Costs For The Last
Year
?
(Based on a hypothetical $10,000 investment)
Fund (Class) |
Costs of a $10,000 investment |
Costs paid as a percentage of a $10,000 investment |
| Invesco Small Cap Growth Fund (Investor Class) |
$ 114 |
1.11 % |
How Did The Fund Perform During The Period?
•
During the fiscal year ended December 31, 2025, US small cap equities saw improved performance as the Federal Reserve continued its easing cycle amid moderating inflation and a resilient labor market.•
For the fiscal year ended December 31, 2025, Investor Class shares of the Fund returned 5.74%. For the same time period, the Russell 2000®
Growth Index (the "Benchmark") returned 13.01%. The Fund underperformed the Benchmark primarily due to stock selection in the industrials, health care, consumer staples and real estate sectors. These results were partially offset by positive stock selection within the utilities, information technology, and energy sectors, as well as an underweight exposure in the communication services and consumer staples sectors.What contributed to performance?
Circle Internet Group, Inc. |
Circle is an issuer of USDC stablecoins used to facilitate block-chain electronic payments. The Fund participated in the initial public offering (IPO) and sold the holding following a significant run up in its post-IPO valuation.Guardant Health, Inc. |
Guardant Health operates as a biotechnology company. The company delivered a strong year with accelerating oncology revenues, growing adoption of their blood biopsy tests that focus on cancer treatment selection and monitoring (Guardant360 and Reveal), and Guardant Shield for colorectal cancer emerging as a second growth engine.Kratos Defense & Security Solutions, Inc. |
Kratos Defense & Security Solutions focuses on drone and rocket technology. The stock has done well as defense is an area that has seen a resurgence in spending.What detracted from performance?
Freshpet, Inc.
|
Freshpet makes dog and cat food that uses fresh meat, fruit and vegetables, which is distributed in grocery and specialty stores. The company saw strong demand during COVID and built out capacity for continued growth. However, additional demand had not materialized. The Fund sold the stock during the period.Coherent Corp. |
Coherent makes electrical components used in artificial intelligence (AI) infrastructure. The stock pulled back during the period on concerns around the sustainability of AI capital expenditures. The Fund sold the stock during the period.Vaxcyte, Inc. |
Vaxcyte is a pneumococcal vaccine provider. The Fund sold the stock during the period following increasing pressure on vaccines under the current administration.How Has The Fund Historically Performed?
Growth of $10,000 Investment
AVERAGE ANNUAL TOTAL RETURNS |
1 Year |
5 Years |
10 Years |
Invesco Small Cap Growth Fund (Investor Class) |
5.74 % |
-0.83 % |
9.01 % |
Russell 2000 ® Growth Index |
13.01 % |
3.18 % |
9.57 % |
S&P 500 ® Index |
17.88 % |
14.42 % |
14.82 % |
invesco.com/performance
for more recent performance information.
What Are Key Statistics About The Fund?
(as of December 31, 2025)
| Fund net assets | $ 1,605,241,578 |
| Total number of portfolio holdings | 105 |
| Total advisory fees paid | $ 12,041,835 |
| Portfolio turnover rate | 85 % |
What Comprised The Fund's Holdings?
(as of December 31, 2025)
Top ten *
holdings
(% of net assets)
| Sanmina Corp. | 2.61 % |
| Guardant Health, Inc. | 2.42 % |
| MACOM Technology Solutions Holdings, Inc. | 2.29 % |
| Madrigal Pharmaceuticals, Inc. | 2.13 % |
| SPX Technologies, Inc. | 1.94 % |
| BridgeBio Pharma, Inc. | 1.90 % |
| Piper Sandler Cos. | 1.89 % |
| Fabrinet | 1.85 % |
| Carpenter Technology Corp. | 1.84 % |
| Axsome Therapeutics, Inc. | 1.83 % |
| * Excluding money market fund holdings, if any. |
Sector allocation
(% of net assets)

Top ten *
holdings
(% of net assets)
| Sanmina Corp. | 2.61 % |
| Guardant Health, Inc. | 2.42 % |
| MACOM Technology Solutions Holdings, Inc. | 2.29 % |
| Madrigal Pharmaceuticals, Inc. | 2.13 % |
| SPX Technologies, Inc. | 1.94 % |
| BridgeBio Pharma, Inc. | 1.90 % |
| Piper Sandler Cos. | 1.89 % |
| Fabrinet | 1.85 % |
| Carpenter Technology Corp. | 1.84 % |
| Axsome Therapeutics, Inc. | 1.83 % |
| * Excluding money market fund holdings, if any. |
invesco.com/reports
. You can also request this information by contacting us at (800) 959-4246
.
What Were The Fund Costs For The Last
Year
?
(Based on a hypothetical $10,000 investment)
Fund (Class) |
Costs of a $10,000 investment |
Costs paid as a percentage of a $10,000 investment |
| Invesco Small Cap Growth Fund (Class R5) |
$ 85 |
0.83 % |
How Did The Fund Perform During The Period?
•
During the fiscal year ended December 31, 2025, US small cap equities saw improved performance as the Federal Reserve continued its easing cycle amid moderating inflation and a resilient labor market.•
For the fiscal year ended December 31, 2025, Class R5 shares of the Fund returned 6.02%. For the same time period, the Russell 2000®
Growth Index (the "Benchmark") returned 13.01%. The Fund underperformed the Benchmark primarily due to stock selection in the industrials, health care, consumer staples and real estate sectors. These results were partially offset by positive stock selection within the utilities, information technology, and energy sectors, as well as an underweight exposure in the communication services and consumer staples sectors.What contributed to performance?
Circle Internet Group, Inc. |
Circle is an issuer of USDC stablecoins used to facilitate block-chain electronic payments. The Fund participated in the initial public offering (IPO) and sold the holding following a significant run up in its post-IPO valuation.Guardant Health, Inc. |
Guardant Health operates as a biotechnology company. The company delivered a strong year with accelerating oncology revenues, growing adoption of their blood biopsy tests that focus on cancer treatment selection and monitoring (Guardant360 and Reveal), and Guardant Shield for colorectal cancer emerging as a second growth engine.Kratos Defense & Security Solutions, Inc. |
Kratos Defense & Security Solutions focuses on drone and rocket technology. The stock has done well as defense is an area that has seen a resurgence in spending.What detracted from performance?
Freshpet, Inc.
|
Freshpet makes dog and cat food that uses fresh meat, fruit and vegetables, which is distributed in grocery and specialty stores. The company saw strong demand during COVID and built out capacity for continued growth. However, additional demand had not materialized. The Fund sold the stock during the period.Coherent Corp. |
Coherent makes electrical components used in artificial intelligence (AI) infrastructure. The stock pulled back during the period on concerns around the sustainability of AI capital expenditures. The Fund sold the stock during the period.Vaxcyte, Inc. |
Vaxcyte is a pneumococcal vaccine provider. The Fund sold the stock during the period following increasing pressure on vaccines under the current administration.How Has The Fund Historically Performed?
Growth of $10,000 Investment
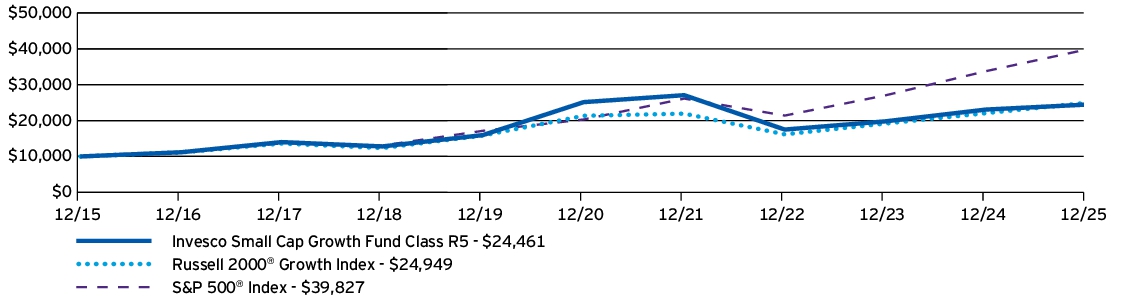
AVERAGE ANNUAL TOTAL RETURNS |
1 Year |
5 Years |
10 Years |
Invesco Small Cap Growth Fund (Class R5) |
6.02 % |
-0.55 % |
9.36 % |
Russell 2000 ® Growth Index |
13.01 % |
3.18 % |
9.57 % |
S&P 500 ® Index |
17.88 % |
14.42 % |
14.82 % |
invesco.com/performance
for more recent performance information.
What Are Key Statistics About The Fund?
(as of December 31, 2025)
| Fund net assets | $ 1,605,241,578 |
| Total number of portfolio holdings | 105 |
| Total advisory fees paid | $ 12,041,835 |
| Portfolio turnover rate | 85 % |
What Comprised The Fund's Holdings?
(as of December 31, 2025)
Top ten
holdings
*(% of net assets)
| Sanmina Corp. | 2.61 % |
| Guardant Health, Inc. | 2.42 % |
| MACOM Technology Solutions Holdings, Inc. | 2.29 % |
| Madrigal Pharmaceuticals, Inc. | 2.13 % |
| SPX Technologies, Inc. | 1.94 % |
| BridgeBio Pharma, Inc. | 1.90 % |
| Piper Sandler Cos. | 1.89 % |
| Fabrinet | 1.85 % |
| Carpenter Technology Corp. | 1.84 % |
| Axsome Therapeutics, Inc. | 1.83 % |
| * Excluding money market fund holdings, if any. |
Sector allocation
(% of net assets)

Top ten
holdings
*(% of net assets)
| Sanmina Corp. | 2.61 % |
| Guardant Health, Inc. | 2.42 % |
| MACOM Technology Solutions Holdings, Inc. | 2.29 % |
| Madrigal Pharmaceuticals, Inc. | 2.13 % |
| SPX Technologies, Inc. | 1.94 % |
| BridgeBio Pharma, Inc. | 1.90 % |
| Piper Sandler Cos. | 1.89 % |
| Fabrinet | 1.85 % |
| Carpenter Technology Corp. | 1.84 % |
| Axsome Therapeutics, Inc. | 1.83 % |
| * Excluding money market fund holdings, if any. |
invesco.com/reports
. You can also request this information by contacting us at (800) 959-4246
.
What Were The Fund Costs For The Last
Year
?
(Based on a hypothetical $10,000 investment)
Fund (Class) |
Costs of a $10,000 investment |
Costs paid as a percentage of a $10,000 investment |
| Invesco Small Cap Growth Fund (Class R6) |
$ 78 |
0.76 % |
How Did The Fund Perform During The Period?
•
During the fiscal year ended December 31, 2025, US small cap equities saw improved performance as the Federal Reserve continued its easing cycle amid moderating inflation and a resilient labor market.•
For the fiscal year ended December 31, 2025, Class R6 shares of the Fund returned 6.11%. For the same time period, the Russell 2000®
Growth Index (the "Benchmark") returned 13.01%. The Fund underperformed the Benchmark primarily due to stock selection in the industrials, health care, consumer staples and real estate sectors. These results were partially offset by positive stock selection within the utilities, information technology, and energy sectors, as well as an underweight exposure in the communication services and consumer staples sectors.What contributed to performance?
Circle Internet Group, Inc. |
Circle is an issuer of USDC stablecoins used to facilitate block-chain electronic payments. The Fund participated in the initial public offering (IPO) and sold the holding following a significant run up in its post-IPO valuation.Guardant Health, Inc. |
Guardant Health operates as a biotechnology company. The company delivered a strong year with accelerating oncology revenues, growing adoption of their blood biopsy tests that focus on cancer treatment selection and monitoring (Guardant360 and Reveal), and Guardant Shield for colorectal cancer emerging as a second growth engine.Kratos Defense & Security Solutions, Inc. |
Kratos Defense & Security Solutions focuses on drone and rocket technology. The stock has done well as defense is an area that has seen a resurgence in spending.What detracted from performance?
Freshpet, Inc.
|
Freshpet makes dog and cat food that uses fresh meat, fruit and vegetables, which is distributed in grocery and specialty stores. The company saw strong demand during COVID and built out capacity for continued growth. However, additional demand had not materialized. The Fund sold the stock during the period.Coherent Corp. |
Coherent makes electrical components used in artificial intelligence (AI) infrastructure. The stock pulled back during the period on concerns around the sustainability of AI capital expenditures. The Fund sold the stock during the period.Vaxcyte, Inc. |
Vaxcyte is a pneumococcal vaccine provider. The Fund sold the stock during the period following increasing pressure on vaccines under the current administration.How Has The Fund Historically Performed?
Growth of $10,000 Investment

AVERAGE ANNUAL TOTAL RETURNS |
1 Year |
5 Years |
10 Years |
Invesco Small Cap Growth Fund (Class R6) |
6.11 % |
-0.48 % |
9.45 % |
Russell 2000 ® Growth Index |
13.01 % |
3.18 % |
9.57 % |
S&P 500 ® Index |
17.88 % |
14.42 % |
14.82 % |
invesco.com/performance
for more recent performance information.
What Are Key Statistics About The Fund?
(as of December 31, 2025)
| Fund net assets | $ 1,605,241,578 |
| Total number of portfolio holdings | 105 |
| Total advisory fees paid | $ 12,041,835 |
| Portfolio turnover rate | 85 % |
What Comprised The Fund's Holdings?
(as of December 31, 2025)
Top ten holdings*
(% of net assets)
| Sanmina Corp. | 2.61 % |
| Guardant Health, Inc. | 2.42 % |
| MACOM Technology Solutions Holdings, Inc. | 2.29 % |
| Madrigal Pharmaceuticals, Inc. | 2.13 % |
| SPX Technologies, Inc. | 1.94 % |
| BridgeBio Pharma, Inc. | 1.90 % |
| Piper Sandler Cos. | 1.89 % |
| Fabrinet | 1.85 % |
| Carpenter Technology Corp. | 1.84 % |
| Axsome Therapeutics, Inc. | 1.83 % |
| * Excluding money market fund holdings, if any. |
Sector allocation
(% of net assets)

Top ten holdings*
(% of net assets)
| Sanmina Corp. | 2.61 % |
| Guardant Health, Inc. | 2.42 % |
| MACOM Technology Solutions Holdings, Inc. | 2.29 % |
| Madrigal Pharmaceuticals, Inc. | 2.13 % |
| SPX Technologies, Inc. | 1.94 % |
| BridgeBio Pharma, Inc. | 1.90 % |
| Piper Sandler Cos. | 1.89 % |
| Fabrinet | 1.85 % |
| Carpenter Technology Corp. | 1.84 % |
| Axsome Therapeutics, Inc. | 1.83 % |
| * Excluding money market fund holdings, if any. |
| [1] | Reflects fee waivers and/or expense reimbursements, without which expenses would have been higher. |