PAY VERSUS PERFORMANCE
Pay Versus Performance Table for 2025
|
|
|
Summary Compensation Table Total for PEO ($)(1) |
|
Compensation Actually |
|
Average Summary Compensation Table Total for Non-PEO NEOs ($)(3) |
|
Average Summary Compensation Actually Paid to Non-PEO NEOs ($)(4) |
|
Value of Initial Fixed $100 Investment Based On: |
|
Net Income (Loss) (in Thousands) ($)(6) |
|
Adjusted ROCE(7) | ||||||
|
Company TSR ($) |
|
Peer Group TSR ($)(5) |
||||||||||||||||||
|
Year |
|
Wright |
|
Gusek |
|
Wright |
|
Gusek |
|
|
|
|
|
|
|
|
|
|
|
|
|
2025 |
|
16,715,954 |
|
4,793,487 |
|
(1,857,300 |
) |
4,854,542 |
|
2,880,346 |
|
2,521,173 |
|
|
|
147,872 |
|
8.7% | ||
|
2024 |
|
5,836,488 |
|
— |
|
10,045,829 |
|
— |
|
2,411,705 |
|
3,805,434 |
|
|
|
316,010 |
|
19.6% | ||
|
2023 |
|
5,628,100 |
|
— |
|
9,819,996 |
|
— |
|
2,328,163 |
|
3,919,083 |
|
|
|
556,317 |
|
42.9% | ||
|
2022 |
|
5,747,485 |
|
— |
|
12,201,790 |
|
— |
|
2,367,374 |
|
4,567,954 |
|
|
|
399,602 |
|
34.0% | ||
|
2021 |
|
4,611,372 |
|
— |
|
3,946,524 |
|
— |
|
2,028,596 |
|
1,738,700 |
|
|
|
(179,244 |
) |
(10.3)% | ||
| (1) | The dollar amounts reported reflect the total compensation shown in the “Total” column of the Summary Compensation Table for Mr. Wright (our former Chairman and Chief Executive Officer) for each of 2021, 2022, 2023, 2024 and 2025, and for Mr. Gusek for 2025. |
| (2) | The dollar amounts reported represent the amount of “compensation actually paid” to Mr. Wright and Mr. Gusek, as computed in accordance with Item 402(v) of SEC Regulation S-K. The dollar amounts reported do not reflect the actual amount of compensation earned by or paid to Mr. Wright or Mr. Gusek during the applicable year. In accordance with the requirements of Item 402(v) of SEC Regulation S-K, the following adjustments were made to Mr. Wright and Mr. Gusek’s total compensation for each year to determine the compensation actually paid to Mr. Wright and Mr. Gusek: |
|
Year |
|
Reported Summary Compensation Table Total for PEO |
|
Deduct Fair Value of Equity Awards Reported in Summary Compensation Table |
|
Add Year-End Fair Value of Equity Awards Granted in Current Year |
|
Add (Deduct) Change in |
|
Add (Deduct) Change in |
|
|
Compensation Actually Paid to PEO |
|
|
2025 |
Gusek |
4,793,487 |
|
(2,943,855 |
) |
3,015,736 |
|
706,609 |
|
(717,435 |
) |
|
4,854,542 |
|
|
|
Wright |
16,715,954 |
|
(16,630,644 |
) |
— |
|
— |
|
(1,942,610 |
) |
|
(1,857,300 |
) |
|
2024 |
|
5,836,488 |
|
(3,832,639 |
) |
4,401,339 |
|
2,715,100 |
|
925,541 |
|
|
10,045,829 |
|
|
2023 |
|
5,628,100 |
|
(3,590,569 |
) |
4,164,509 |
|
4,410,269 |
|
(792,313 |
) |
|
9,819,996 |
|
|
2022 |
|
5,747,485 |
|
(3,406,258 |
) |
4,405,023 |
|
3,612,975 |
|
1,842,565 |
|
|
12,201,790 |
|
|
2021 |
|
4,611,372 |
|
(3,801,972 |
) |
2,841,227 |
|
99,171 |
|
196,725 |
|
|
3,946,524 |
|
| (3) | The dollar amounts reported for 2025 represent the average of the amounts reported for our NEOs as a group (excluding Mr. Wright and Mr. Gusek) in the “Total” column of the Summary Compensation Table provided above. For 2025, the non-PEO NEOs included for purposes of calculating the average amount are Messrs. Stock, Elliott and Gosney. For 2021, 2022, 2023 and 2024, the non-PEO NEOs included for the purposes of calculating the average amounts are Messrs. Stock, Gusek, Elliott and Gosney. |
| (4) | The dollar amounts reported represent the average amount of “compensation actually paid” to the NEOs as a group (excluding Mr. Wright), as computed in accordance with Item 402(v) of SEC Regulation S-K. The NEOs (excluding Mr. Wright) included for purposes of calculating the average amounts in each applicable year are Messrs. Stock, Gusek, Elliott and Gosney. The dollar amounts reported do not reflect the actual average amount of compensation earned by or paid to the NEOs as a group (excluding Mr. Wright) during the applicable year. In accordance with the requirements of Item 402(v) of SEC Regulation S-K, the following adjustments were made to average total compensation for the NEOs as a group (excluding Mr. Wright) for each year to determine the compensation actually paid: |
|
Year |
|
Reported Average Summary Compensation Table Total for Non-PEO NEOs |
|
Deduct |
|
Add Year-End Fair Value of Equity Awards Granted in Current Year |
|
Add (Deduct) Change in |
|
Add (Deduct) Change in Fair Value of Equity Awards Vested in Current Year |
|
Average Compensation Actually Paid to Non-PEO NEOs |
|
2025 |
|
2,880,346 |
|
(1,713,165 |
) |
1,426,478 |
|
375,453 |
|
(447,939 |
) |
2,521,173 |
|
2024 |
|
2,411,705 |
|
(1,297,394 |
) |
1,489,905 |
|
826,530 |
|
374,687 |
|
3,805,434 |
|
2023 |
|
2,328,163 |
|
(1,208,667 |
) |
1,401,868 |
|
1,667,331 |
|
(269,613 |
) |
3,919,083 |
|
2022 |
|
2,367,374 |
|
(1,146,682 |
) |
1,482,906 |
|
1,259,414 |
|
604,943 |
|
4,567,954 |
|
2021 |
|
2,028,596 |
|
(1,515,516 |
) |
1,132,550 |
|
22,787 |
|
70,282 |
|
1,738,700 |
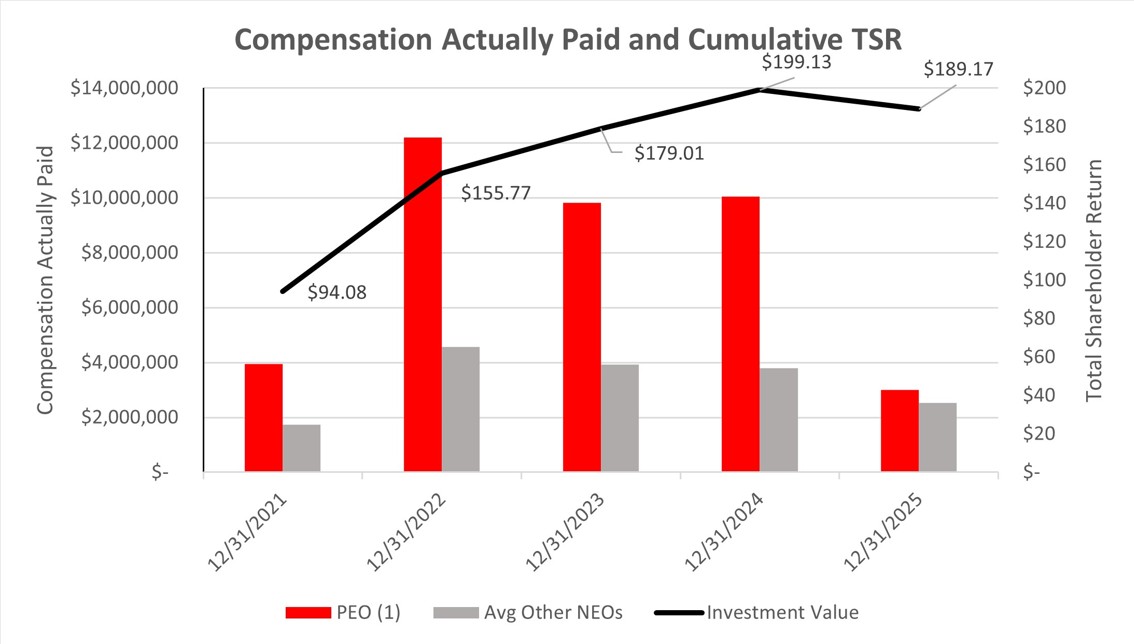
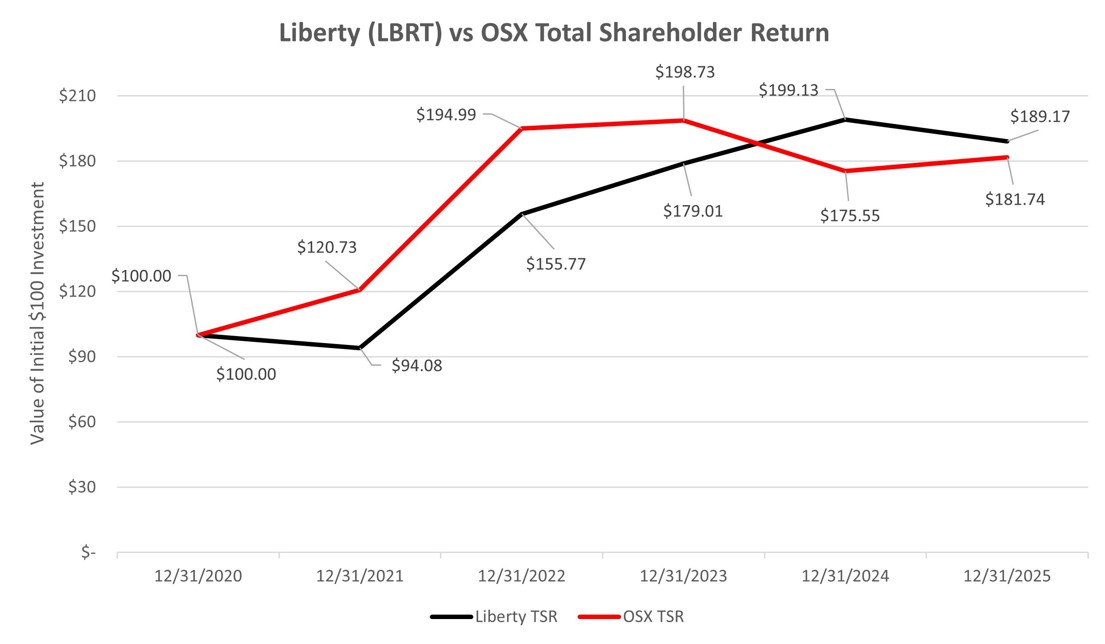
| (5) | The peer group selected for each listed year consists of the OSX. We also use this peer group for purposes of the Stock Performance Graph set forth in “Item 5 - Market for Registrant’s Common Equity, Related Stockholder Matters and Issuer Purchases of Equity Securities” of our Annual Report on Form 10-K for the year ended December 31, 2025. |
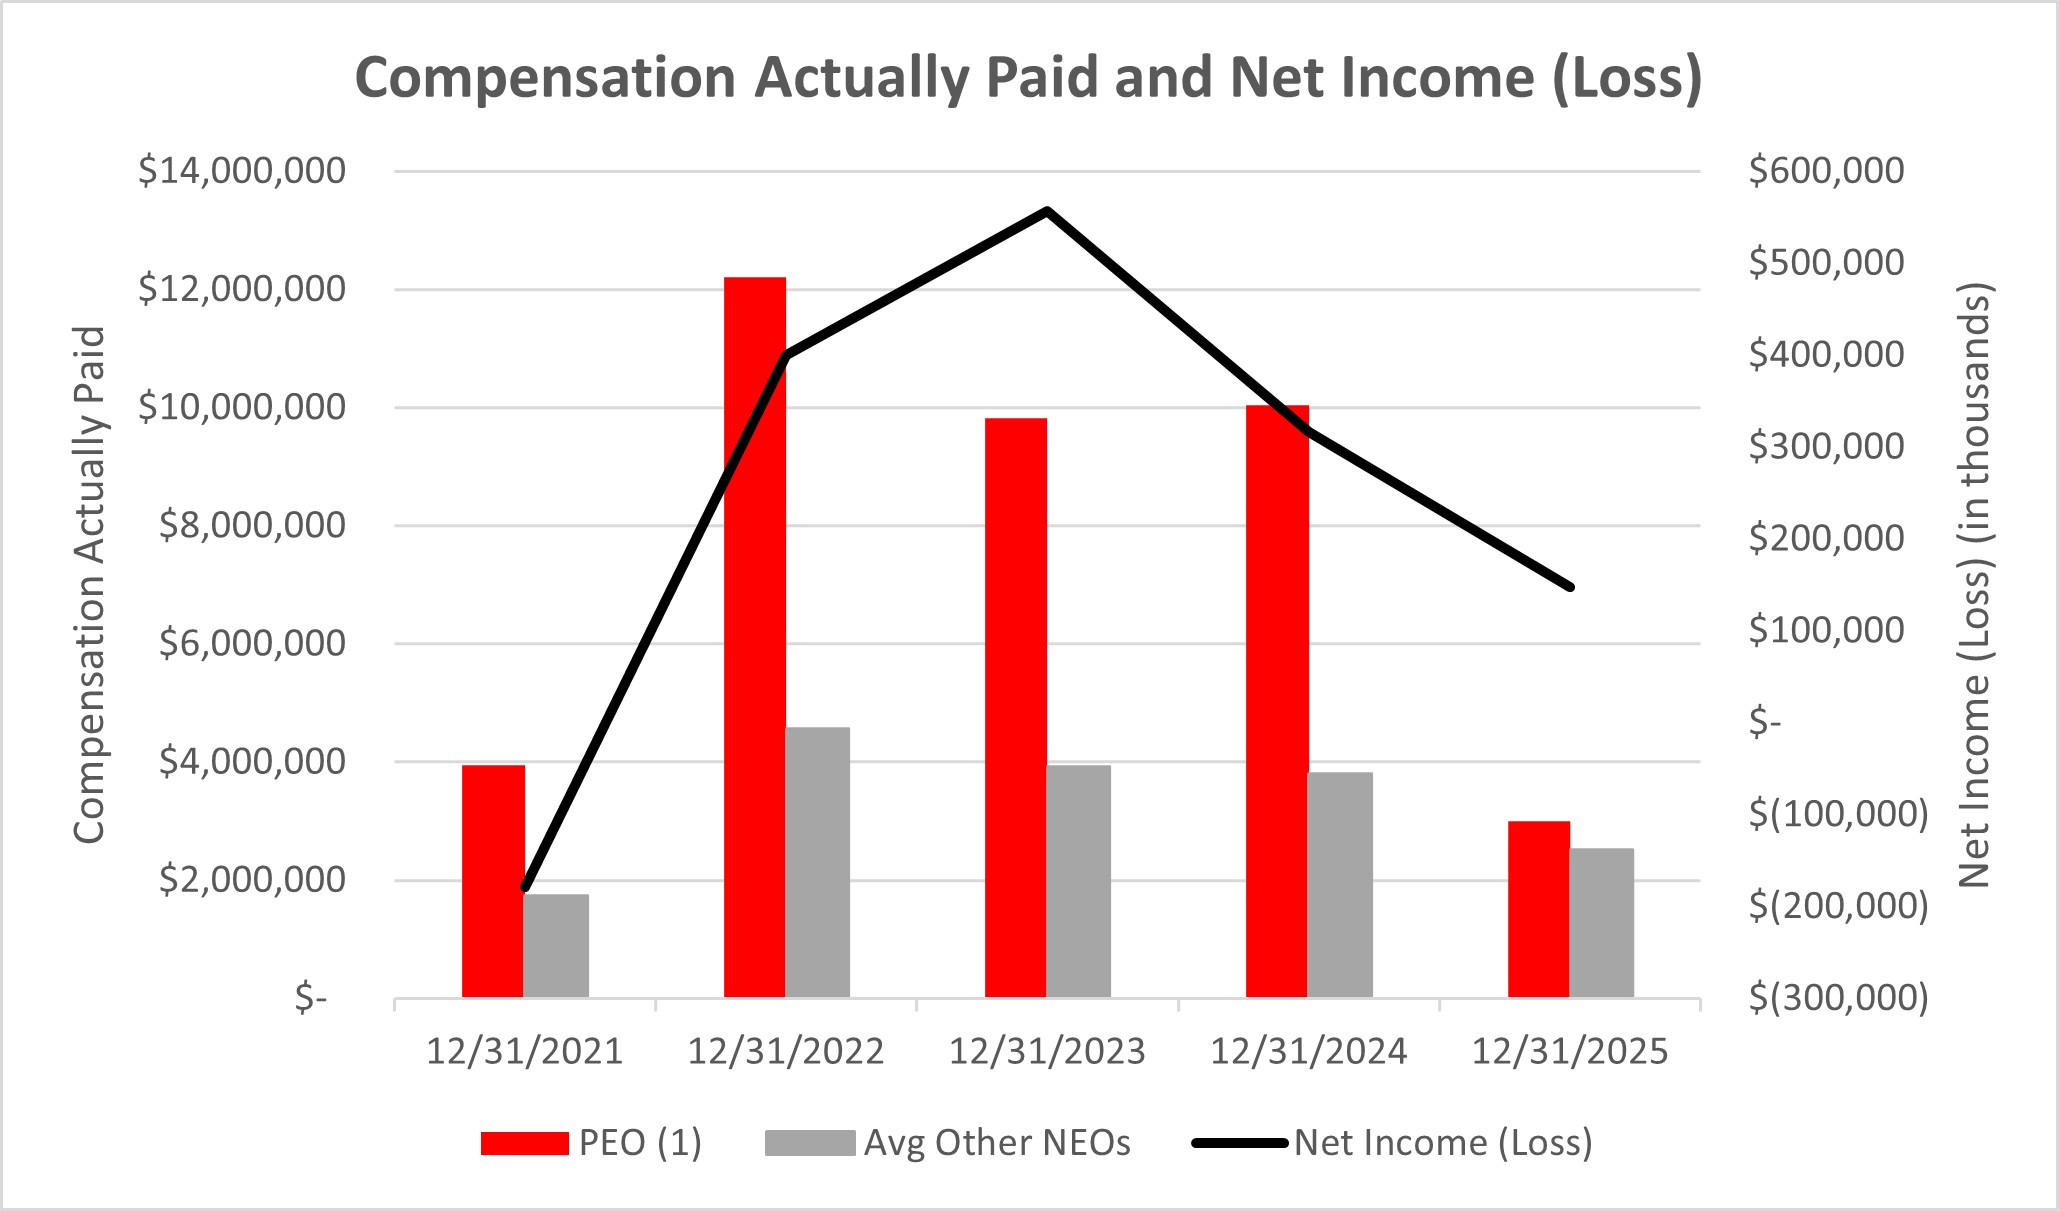
| (6) | The dollar amounts reported represent the amount of net income (loss) (in thousands) attributable to Liberty Energy Inc. in our audited consolidated financial statements for the applicable year |
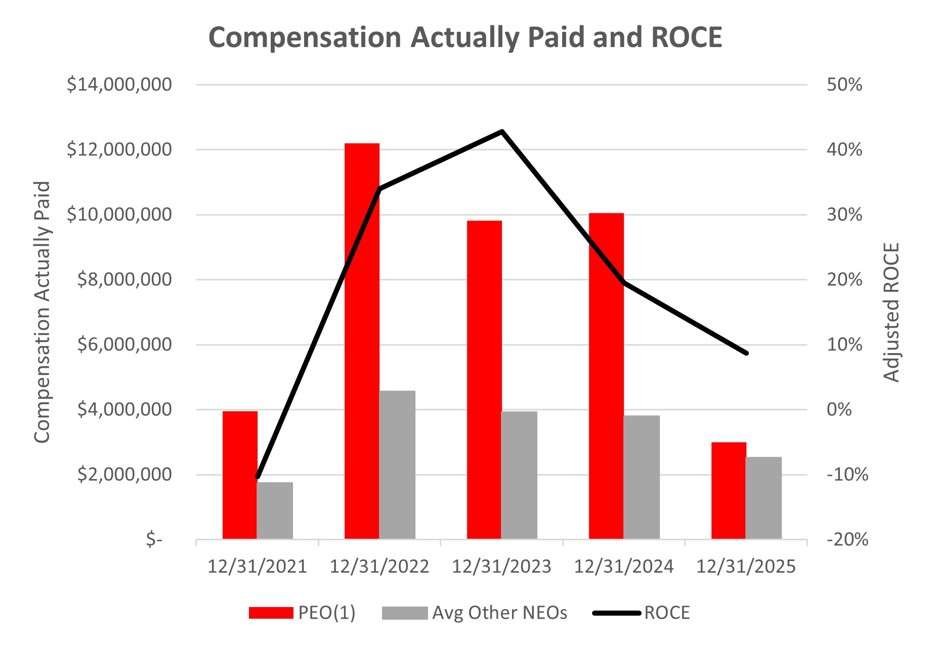
| (7) | For the years ended December 31, 2024 and December 31, 2025, Adjusted ROCE is equal to the Company’s income before taxes and loss (gain) on remeasurement of liability under tax receivable agreements, divided by the simple average of capital (debt and equity) employed at the beginning and end of the year. For the years ended December 31, 2021 to 2023, Adjusted ROCE is equal to the Company’s income before taxes and loss (gain) on remeasurement of liability under tax receivable agreements, plus interest expense and stock-based compensation expense for the year, divided by the simple average of capital (debt and equity) employed at the beginning and end of each year presented. We rank our Adjusted ROCE against those of the ROCE Peer Group to determine Comparative ROCE, which is used as a metric to determine a portion of annual incentive compensation and the vesting of performance-based RSU awards. While we use numerous financial and non-financial performance measures for the purpose of evaluating performance for our compensation programs, we have determined that our Adjusted ROCE is the financial performance measure that, in our assessment, represents the most important performance measure (that is not otherwise required to be disclosed in this table) used by us to link compensation actually paid to our NEOs for the most recently completed fiscal year, to our performance. |
| (1) | The dollar amounts reported reflect the total compensation shown in the “Total” column of the Summary Compensation Table for Mr. Wright (our former Chairman and Chief Executive Officer) for each of 2021, 2022, 2023, 2024 and 2025, and for Mr. Gusek for 2025. |
|
Year |
|
Reported Summary Compensation Table Total for PEO |
|
Deduct Fair Value of Equity Awards Reported in Summary Compensation Table |
|
Add Year-End Fair Value of Equity Awards Granted in Current Year |
|
Add (Deduct) Change in |
|
Add (Deduct) Change in |
|
|
Compensation Actually Paid to PEO |
|
|
2025 |
Gusek |
4,793,487 |
|
(2,943,855 |
) |
3,015,736 |
|
706,609 |
|
(717,435 |
) |
|
4,854,542 |
|
|
|
Wright |
16,715,954 |
|
(16,630,644 |
) |
— |
|
— |
|
(1,942,610 |
) |
|
(1,857,300 |
) |
|
2024 |
|
5,836,488 |
|
(3,832,639 |
) |
4,401,339 |
|
2,715,100 |
|
925,541 |
|
|
10,045,829 |
|
|
2023 |
|
5,628,100 |
|
(3,590,569 |
) |
4,164,509 |
|
4,410,269 |
|
(792,313 |
) |
|
9,819,996 |
|
|
2022 |
|
5,747,485 |
|
(3,406,258 |
) |
4,405,023 |
|
3,612,975 |
|
1,842,565 |
|
|
12,201,790 |
|
|
2021 |
|
4,611,372 |
|
(3,801,972 |
) |
2,841,227 |
|
99,171 |
|
196,725 |
|
|
3,946,524 |
|
|
Year |
|
Reported Average Summary Compensation Table Total for Non-PEO NEOs |
|
Deduct |
|
Add Year-End Fair Value of Equity Awards Granted in Current Year |
|
Add (Deduct) Change in |
|
Add (Deduct) Change in Fair Value of Equity Awards Vested in Current Year |
|
Average Compensation Actually Paid to Non-PEO NEOs |
|
2025 |
|
2,880,346 |
|
(1,713,165 |
) |
1,426,478 |
|
375,453 |
|
(447,939 |
) |
2,521,173 |
|
2024 |
|
2,411,705 |
|
(1,297,394 |
) |
1,489,905 |
|
826,530 |
|
374,687 |
|
3,805,434 |
|
2023 |
|
2,328,163 |
|
(1,208,667 |
) |
1,401,868 |
|
1,667,331 |
|
(269,613 |
) |
3,919,083 |
|
2022 |
|
2,367,374 |
|
(1,146,682 |
) |
1,482,906 |
|
1,259,414 |
|
604,943 |
|
4,567,954 |
|
2021 |
|
2,028,596 |
|
(1,515,516 |
) |
1,132,550 |
|
22,787 |
|
70,282 |
|
1,738,700 |
Compensation Actually Paid and Net Income (Loss)
Compensation Actually Paid and Adjusted ROCE
Performance Measures
The most important financial performance measures that we use to link executive compensation actually paid to the NEOs for the most recently completed fiscal year to our performance are Adjusted Pre-tax EPS, Adjusted ROCE, and Comparative ROCE, which performance measures for the most recently completed fiscal year are defined in the footnotes to the table in “Compensation Discussion and Analysis – Elements of Compensation – Annual Incentive Award” above.
| [1] | The dollar amounts reported for 2025 represent the average of the amounts reported for our NEOs as a group (excluding Mr. Wright and Mr. Gusek) in the “Total” column of the Summary Compensation Table provided above. For 2025, the non-PEO NEOs included for purposes of calculating the average amount are Messrs. Stock, Elliott and Gosney. For 2021, 2022, 2023 and 2024, the non-PEO NEOs included for the purposes of calculating the average amounts are Messrs. Stock, Gusek, Elliott and Gosney. |
| [2] | The dollar amounts reported represent the average amount of “compensation actually paid” to the NEOs as a group (excluding Mr. Wright), as computed in accordance with Item 402(v) of SEC Regulation S-K. The NEOs (excluding Mr. Wright) included for purposes of calculating the average amounts in each applicable year are Messrs. Stock, Gusek, Elliott and Gosney. The dollar amounts reported do not reflect the actual average amount of compensation earned by or paid to the NEOs as a group (excluding Mr. Wright) during the applicable year. In accordance with the requirements of Item 402(v) of SEC Regulation S-K, the following adjustments were made to average total compensation for the NEOs as a group (excluding Mr. Wright) for each year to determine the compensation actually paid: |
| [3] | The peer group selected for each listed year consists of the OSX. We also use this peer group for purposes of the Stock Performance Graph set forth in “Item 5 - Market for Registrant’s Common Equity, Related Stockholder Matters and Issuer Purchases of Equity Securities” of our Annual Report on Form 10-K for the year ended December 31, 2025. |
| [4] | The dollar amounts reported represent the amount of net income (loss) (in thousands) attributable to Liberty Energy Inc. in our audited consolidated financial statements for the applicable year |
| [5] | For the years ended December 31, 2024 and December 31, 2025, Adjusted ROCE is equal to the Company’s income before taxes and loss (gain) on remeasurement of liability under tax receivable agreements, divided by the simple average of capital (debt and equity) employed at the beginning and end of the year. For the years ended December 31, 2021 to 2023, Adjusted ROCE is equal to the Company’s income before taxes and loss (gain) on remeasurement of liability under tax receivable agreements, plus interest expense and stock-based compensation expense for the year, divided by the simple average of capital (debt and equity) employed at the beginning and end of each year presented. We rank our Adjusted ROCE against those of the ROCE Peer Group to determine Comparative ROCE, which is used as a metric to determine a portion of annual incentive compensation and the vesting of performance-based RSU awards. While we use numerous financial and non-financial performance measures for the purpose of evaluating performance for our compensation programs, we have determined that our Adjusted ROCE is the financial performance measure that, in our assessment, represents the most important performance measure (that is not otherwise required to be disclosed in this table) used by us to link compensation actually paid to our NEOs for the most recently completed fiscal year, to our performance. |
| [6] | The dollar amounts reported reflect the total compensation shown in the “Total” column of the Summary Compensation Table for Mr. Wright (our former Chairman and Chief Executive Officer) for each of 2021, 2022, 2023, 2024 and 2025, and for Mr. Gusek for 2025. |
| [7] | The dollar amounts reported represent the amount of “compensation actually paid” to Mr. Wright and Mr. Gusek, as computed in accordance with Item 402(v) of SEC Regulation S-K. The dollar amounts reported do not reflect the actual amount of compensation earned by or paid to Mr. Wright or Mr. Gusek during the applicable year. In accordance with the requirements of Item 402(v) of SEC Regulation S-K, the following adjustments were made to Mr. Wright and Mr. Gusek’s total compensation for each year to determine the compensation actually paid to Mr. Wright and Mr. Gusek: |