Shareholder Report
|
12 Months Ended |
|
Dec. 31, 2025
USD ($)
Holding
|
|---|
| Shareholder Report [Line Items] |
|
| Document Type |
N-CSR
|
| Amendment Flag |
false
|
| Registrant Name |
GOLDMAN SACHS TRUST
|
| Entity Central Index Key |
0000822977
|
| Entity Investment Company Type |
N-1A
|
| Document Period End Date |
Dec. 31, 2025
|
| Shareholder Report Annual or Semi-Annual |
Annual Shareholder Report
|
| C000057076 |
|
| Shareholder Report [Line Items] |
|
| Fund Name |
Goldman Sachs Absolute Return Tracker Fund
|
| Class Name |
Class A
|
| Trading Symbol |
GARTX
|
| Annual or Semi-Annual Statement [Text Block] |
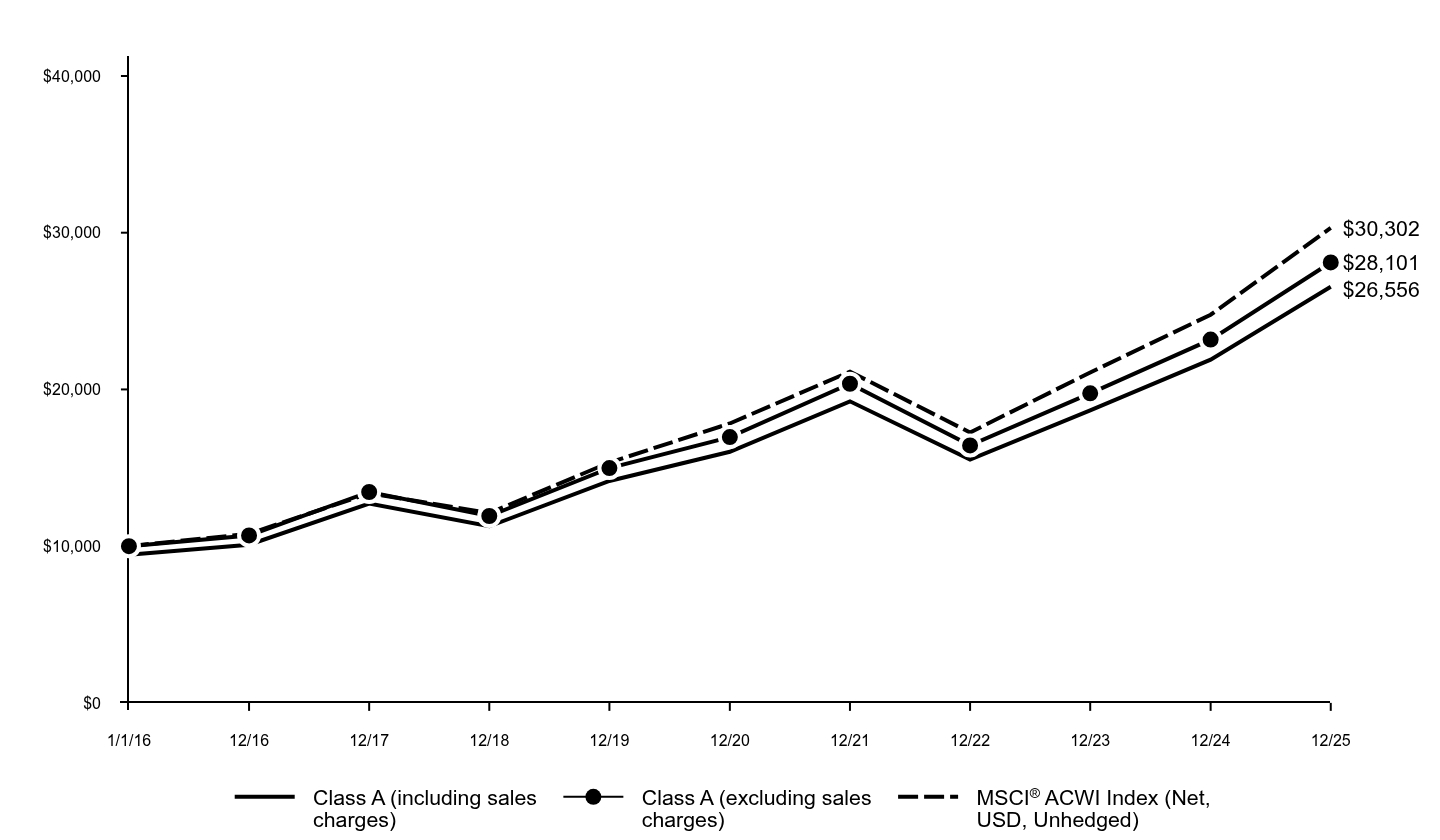
This annual shareholder report contains important information about Goldman Sachs Absolute Return Tracker Fund (the “Fund”) for the period of January 1, 2025 to December 31, 2025 (the “Period”).
|
| Additional Information [Text Block] |
You can find additional information about the Fund at am.gs.com or dfinview.com/GoldmanSachs. You can also request this information by contacting us at 1-800-526-7384.
|
| Additional Information Phone Number |
1-800-526-7384
|
| Additional Information Website |
<span style="box-sizing: border-box; color: rgb(0, 0, 0); display: inline; flex-wrap: nowrap; font-size: 12px; font-weight: 400; grid-area: auto; line-height: 18px; margin: 0px; overflow: visible; text-align: left; text-align-last: auto; white-space-collapse: preserve-breaks;">am.gs.com</span>
|
| Expenses [Text Block] |
What were the Fund costs for the Period?Based on a hypothetical $10,000 investment.
Class |
Costs of a $10,000 investment |
Costs paid as a percentage of a $10,000 investment |
A |
$106 |
1.01% | |
| Expenses Paid, Amount |
$ 106
|
| Expense Ratio, Percent |
1.01%
|
| Factors Affecting Performance [Text Block] |
How did the Fund perform and what affected its performance?Virtually all asset classes were impacted by U.S. monetary policy, inflation expectations, tariffs, AI, geopolitics, and commodity and currency movements. Hedge funds generally posted positive returns, led by equity long/short strategies. Relative value, global macro and event-driven hedge fund strategies also performed well. |
| Performance Past Does Not Indicate Future [Text] |
Performance data quoted above represents past performance. Past performance does not guarantee future results.
|
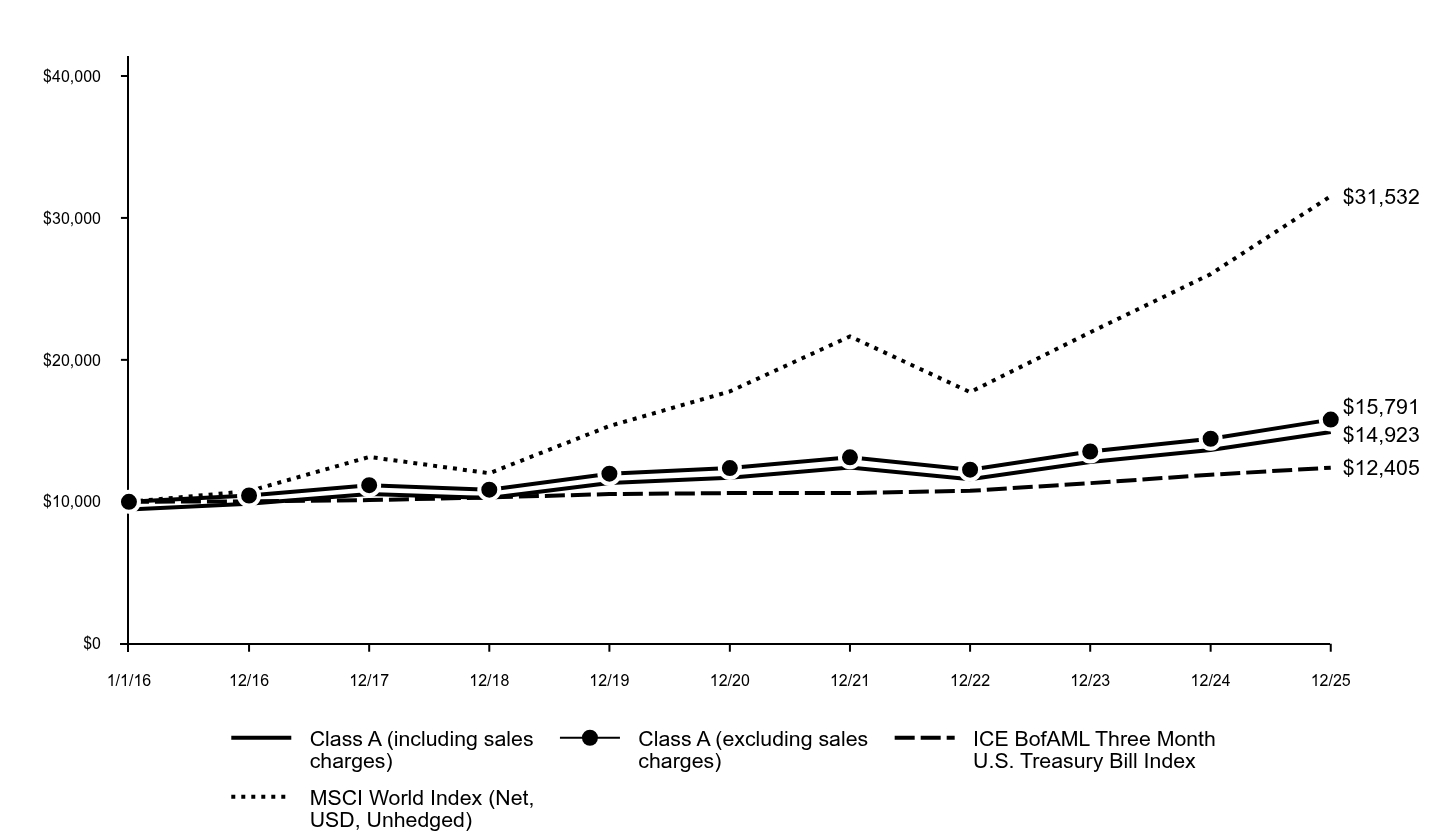
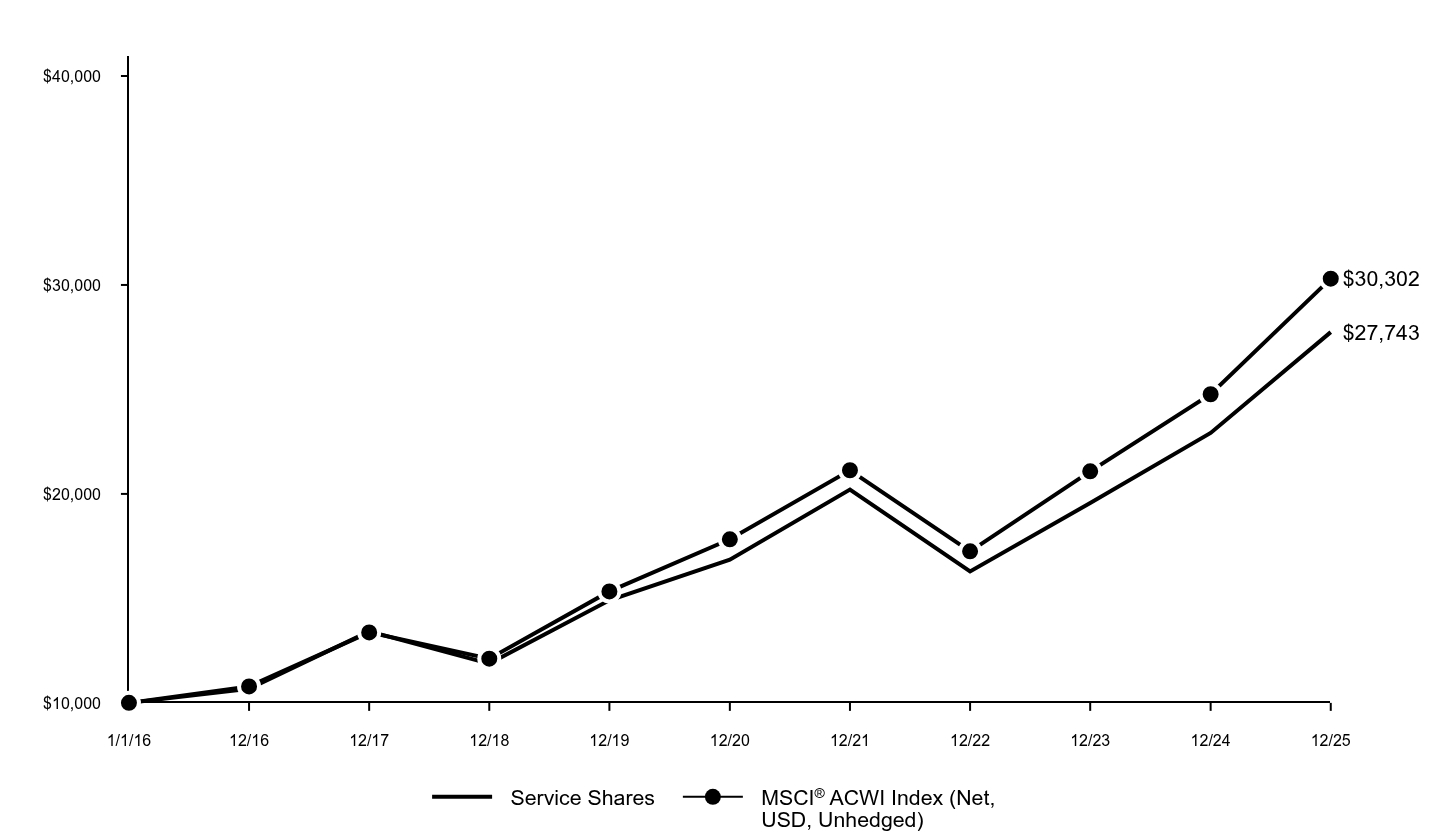
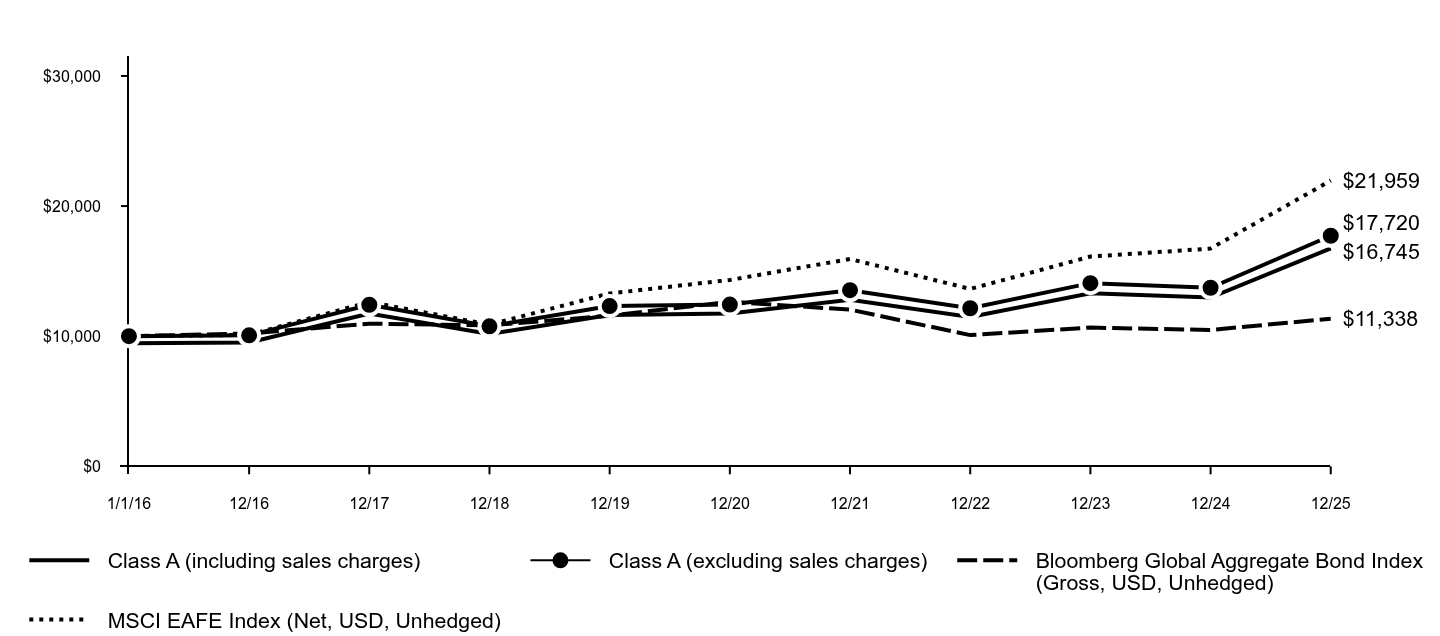
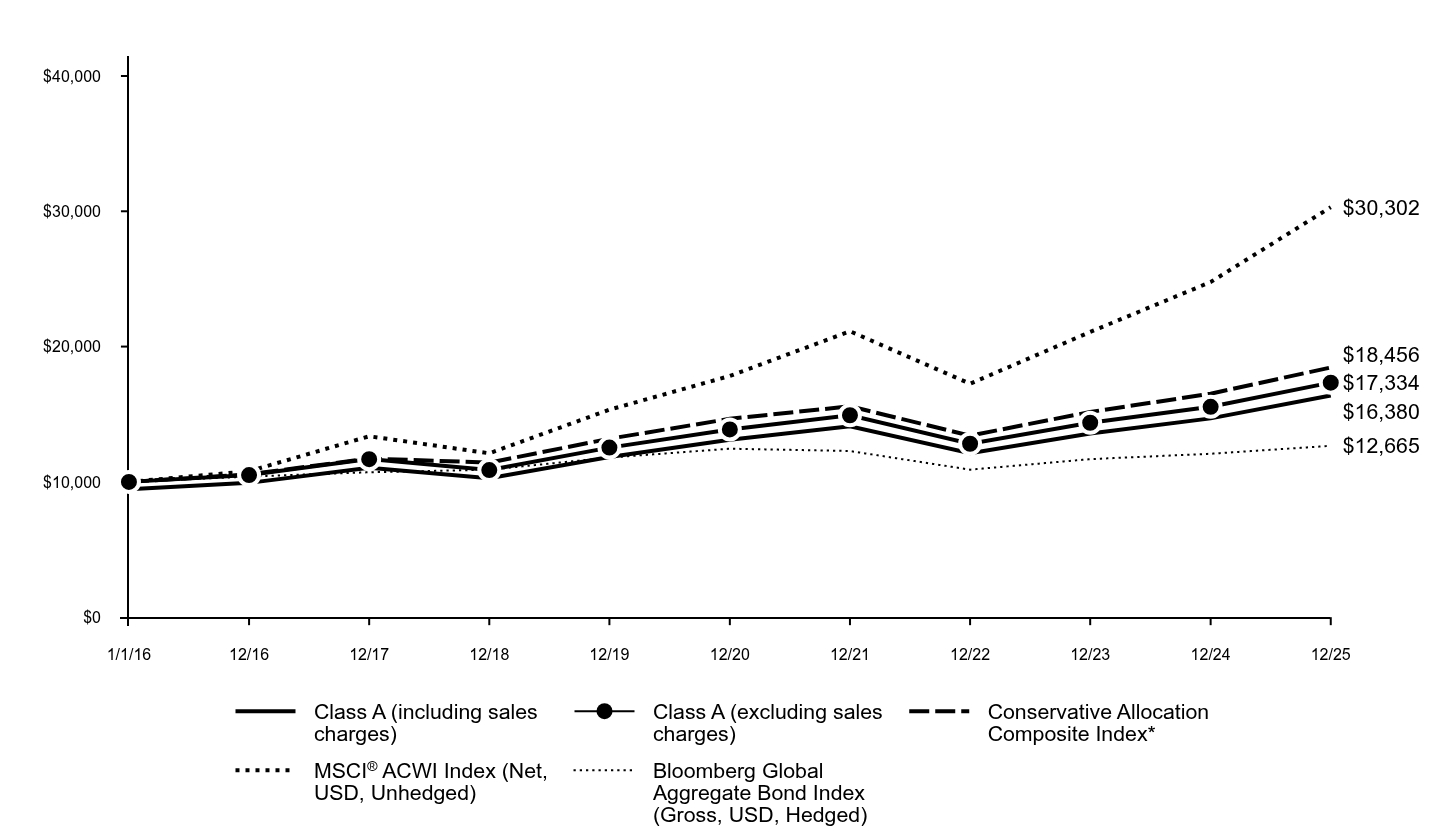
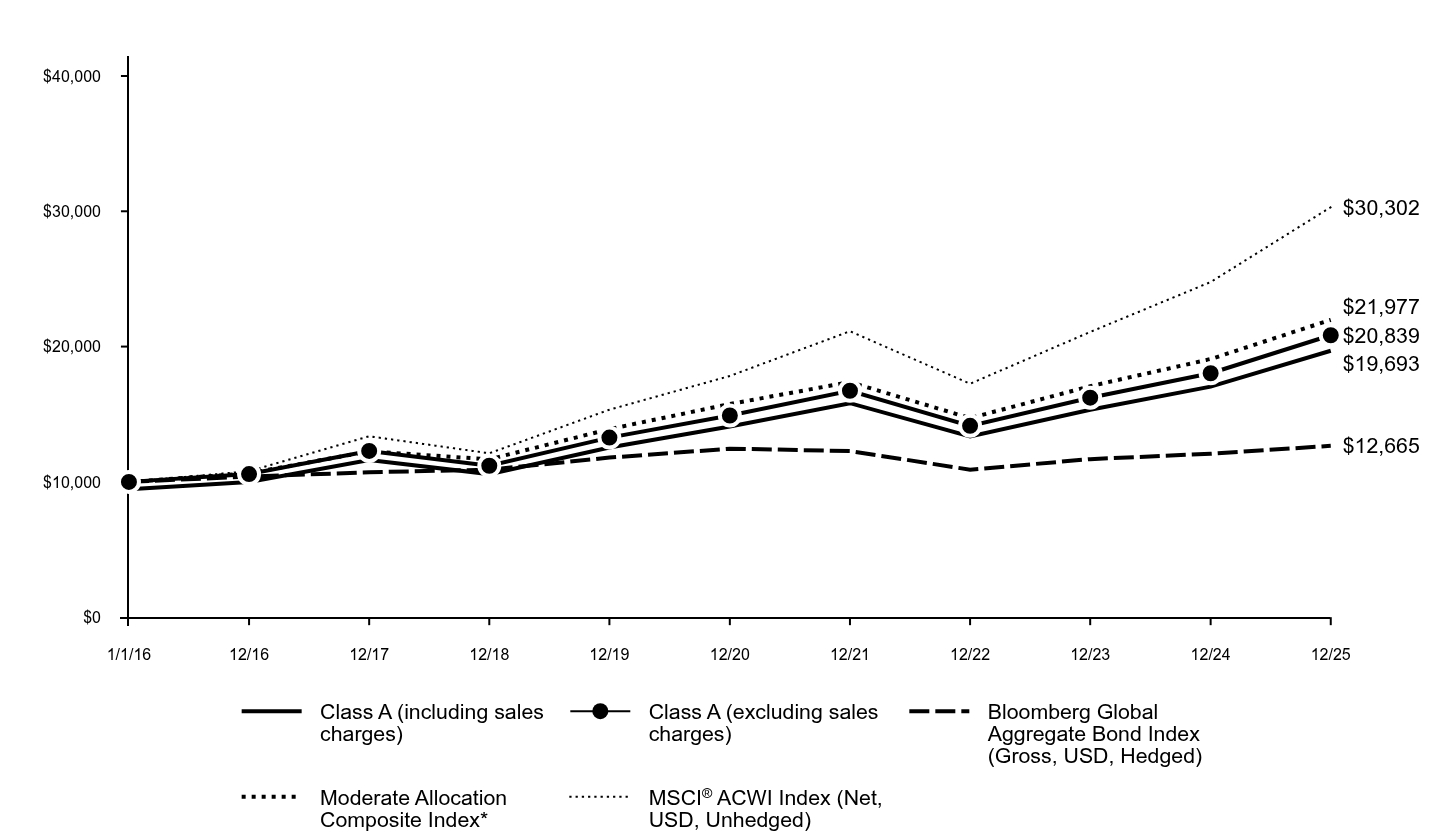
| Line Graph [Table Text Block] |
|
Class A (including sales charges) |
Class A (excluding sales charges) |
ICE BofAML Three Month U.S. Treasury Bill Index |
MSCI World Index (Net, USD, Unhedged) |
1/1/16 |
$9,450 |
$10,000 |
$10,000 |
$10,000 |
12/16 |
$9,871 |
$10,446 |
$10,033 |
$10,751 |
12/17 |
$10,556 |
$11,170 |
$10,119 |
$13,159 |
12/18 |
$10,260 |
$10,857 |
$10,308 |
$12,013 |
12/19 |
$11,323 |
$11,982 |
$10,543 |
$15,337 |
12/20 |
$11,697 |
$12,377 |
$10,613 |
$17,776 |
12/21 |
$12,409 |
$13,131 |
$10,619 |
$21,654 |
12/22 |
$11,587 |
$12,262 |
$10,773 |
$17,726 |
12/23 |
$12,798 |
$13,543 |
$11,314 |
$21,942 |
12/24 |
$13,647 |
$14,441 |
$11,908 |
$26,039 |
12/25 |
$14,923 |
$15,791 |
$12,405 |
$31,532 |
|
| Average Annual Return [Table Text Block] |
AATR |
1 Year |
5 Years |
10 Years |
Class A |
9.35% |
4.99% |
4.67% |
Class A including sales charges |
3.39% |
3.82% |
4.09% |
ICE BofAML Three Month U.S. Treasury Bill Index |
4.18% |
3.17% |
2.18% |
MSCI World Index (Net, USD, Unhedged) |
21.09% |
12.14% |
12.16% | |
| AssetsNet |
$ 5,560,131,787
|
| Holdings Count | Holding |
3,137
|
| Advisory Fees Paid, Amount |
$ 29,881,927
|
| InvestmentCompanyPortfolioTurnover |
134.00%
|
| Additional Fund Statistics [Text Block] |
Total Net Assets as of Period End |
$5,560,131,787 |
# of Portfolio Holdings as of Period End |
3,137 |
Portfolio Turnover Rate for the Period |
134% |
Total Net Advisory Fees Paid for the Period |
$29,881,927 | |
| Holdings [Text Block] |
Asset Class Exposure (%)*
Header |
Gross |
Long |
Short |
Net |
Cash and Short-Term Investments |
152.5 |
88.6 |
63.9 |
24.6 |
Commodities |
3.5 |
1.9 |
1.6 |
0.4 |
Convertible Securities |
2.4 |
2.4 |
- |
2.4 |
Credit |
14.5 |
14.5 |
- |
14.5 |
Developed Markets Currency |
2.7 |
1.3 |
1.4 |
-0.1 |
Developed Markets Equity Volatility |
7.5 |
1.8 |
5.7 |
-3.9 |
Developed Markets ex US Equity |
14.8 |
12.2 |
2.6 |
9.6 |
Developed markets FI volatility |
1.5 |
1.5 |
- |
1.5 |
Emerging Markets Currency |
3.8 |
2.0 |
1.7 |
0.3 |
Emerging Markets Equity |
8.4 |
8.4 |
- |
8.4 |
Global Real Estate |
0.2 |
0.2 |
- |
0.2 |
Interest rate |
0.8 |
0.2 |
0.6 |
-0.5 |
Long-Term Fixed Income |
10.2 |
5.0 |
5.2 |
-0.1 |
Medium-Term Fixed Income |
2.0 |
1.4 |
0.6 |
0.8 |
Preferred |
3.1 |
3.1 |
- |
3.1 |
Short-Term Fixed Income |
8.8 |
8.4 |
0.4 |
8.0 |
US Equity |
86.6 |
57.3 |
29.2 |
28.1 | * Asset class exposure includes the impact of derivatives. "Gross Exposure" represents the sum of the absolute value of long and short notional contract values in U.S. dollars of the Fund's positions (for a given asset class), divided by the Fund's net assets exposure within each asset class. "Net Exposure" represents the net exposure within the Fund to a given asset class, calculated as the difference between long and short exposures. The exposure of option contracts is delta-adjusted. Forward foreign currency exchange contracts for individual currency crosses are aggregated by settlement date and counterparty in the determination of gross exposure. Fixed income exposures are duration-adjusted to the 10-year reference rate of each respective country. |
| Material Fund Change [Text Block] |
|
| Updated Prospectus Phone Number |
1-800-526-7384
|
| Updated Prospectus Web Address |
<span style="box-sizing: border-box; color: rgb(0, 0, 0); display: inline; flex-wrap: nowrap; font-size: 12px; font-weight: 400; grid-area: auto; line-height: 18px; margin: 0px; overflow: visible; text-align: left; text-align-last: auto; white-space-collapse: preserve-breaks;">dfinview.com/GoldmanSachs</span>
|
| C000057077 |
|
| Shareholder Report [Line Items] |
|
| Fund Name |
Goldman Sachs Absolute Return Tracker Fund
|
| Class Name |
Class C
|
| Trading Symbol |
GCRTX
|
| Annual or Semi-Annual Statement [Text Block] |
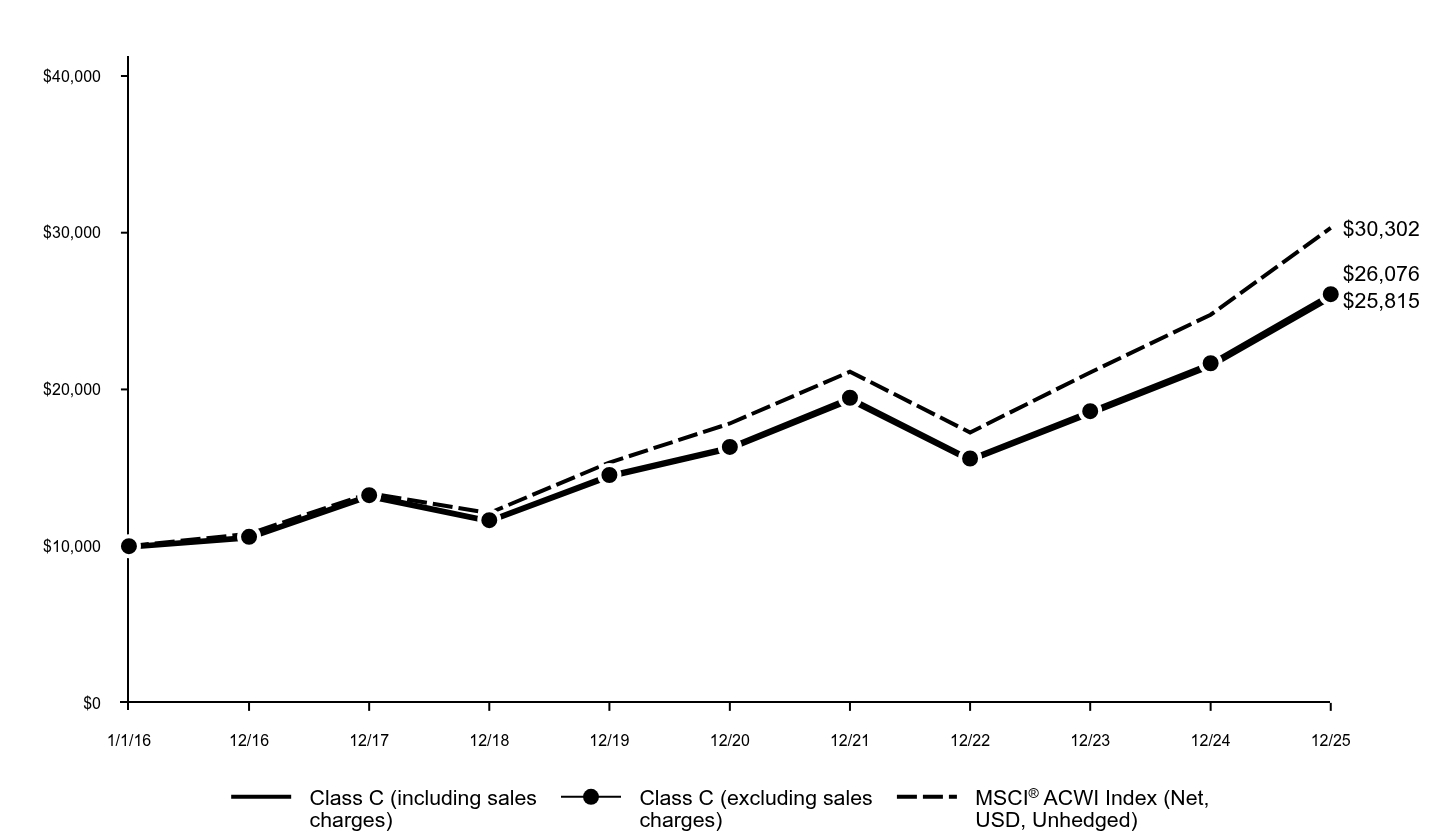
This annual shareholder report contains important information about Goldman Sachs Absolute Return Tracker Fund (the “Fund”) for the period of January 1, 2025 to December 31, 2025 (the “Period”).
|
| Additional Information [Text Block] |
You can find additional information about the Fund at am.gs.com or dfinview.com/GoldmanSachs. You can also request this information by contacting us at 1-800-526-7384.
|
| Additional Information Phone Number |
1-800-526-7384
|
| Additional Information Website |
<span style="box-sizing: border-box; color: rgb(0, 0, 0); display: inline; flex-wrap: nowrap; font-size: 12px; font-weight: 400; grid-area: auto; line-height: 18px; margin: 0px; overflow: visible; text-align: left; text-align-last: auto; white-space-collapse: preserve-breaks;">am.gs.com</span>
|
| Expenses [Text Block] |
What were the Fund costs for the Period?Based on a hypothetical $10,000 investment.
Class |
Costs of a $10,000 investment |
Costs paid as a percentage of a $10,000 investment |
C |
$183 |
1.76% | |
| Expenses Paid, Amount |
$ 183
|
| Expense Ratio, Percent |
1.76%
|
| Factors Affecting Performance [Text Block] |
How did the Fund perform and what affected its performance?Virtually all asset classes were impacted by U.S. monetary policy, inflation expectations, tariffs, AI, geopolitics, and commodity and currency movements. Hedge funds generally posted positive returns, led by equity long/short strategies. Relative value, global macro and event-driven hedge fund strategies also performed well. |
| Performance Past Does Not Indicate Future [Text] |
Performance data quoted above represents past performance. Past performance does not guarantee future results.
|
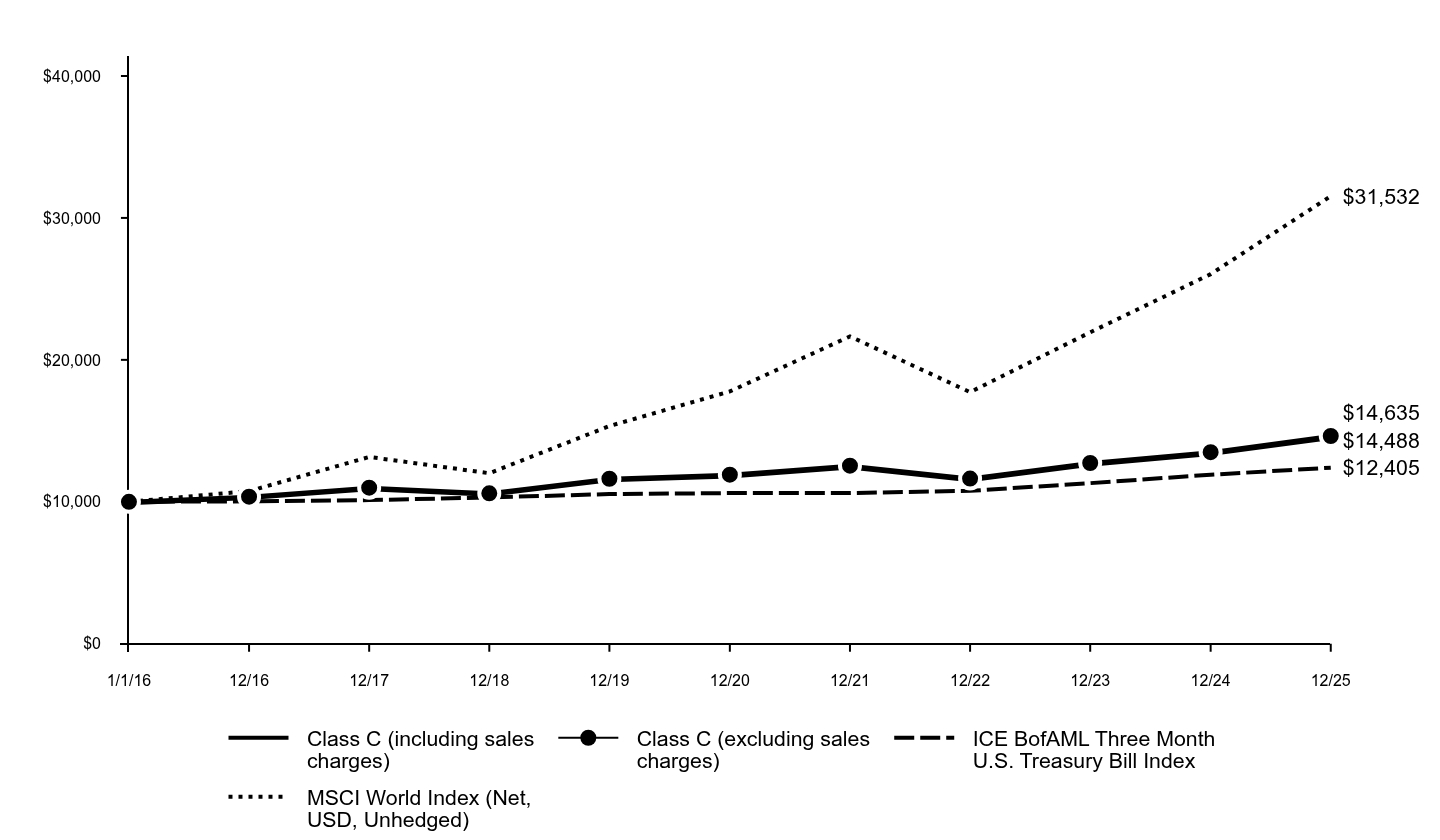
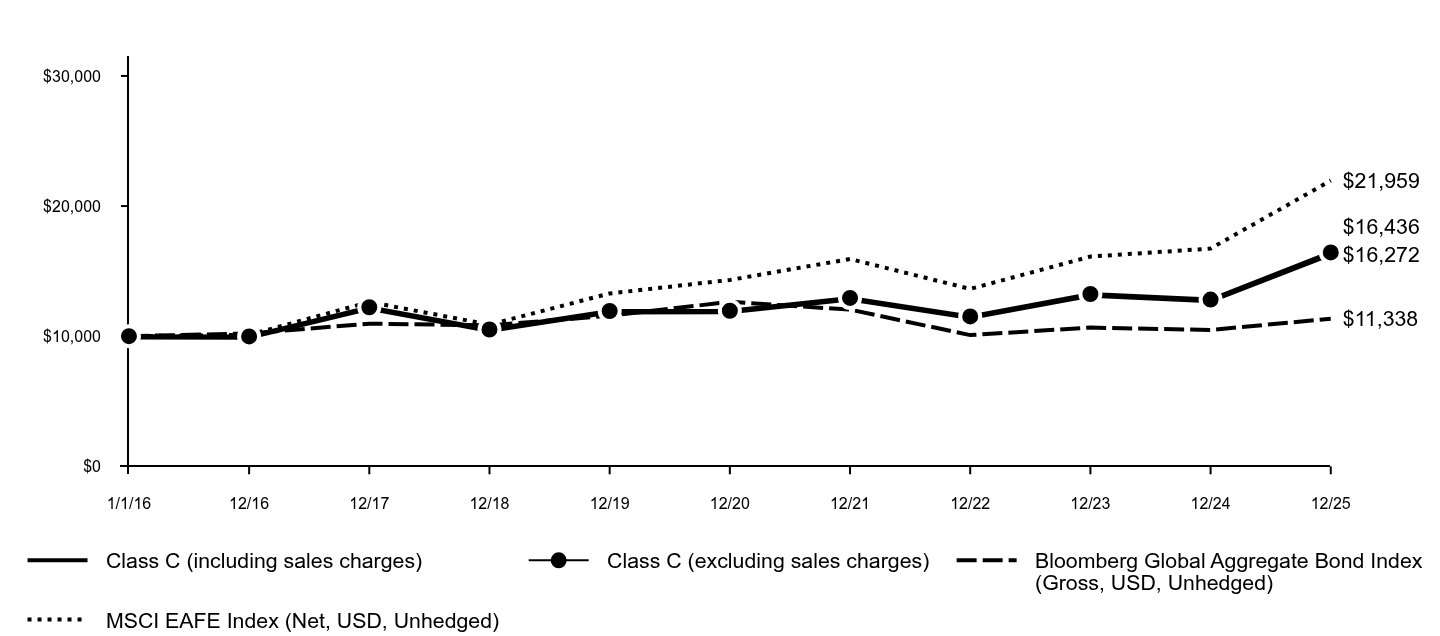
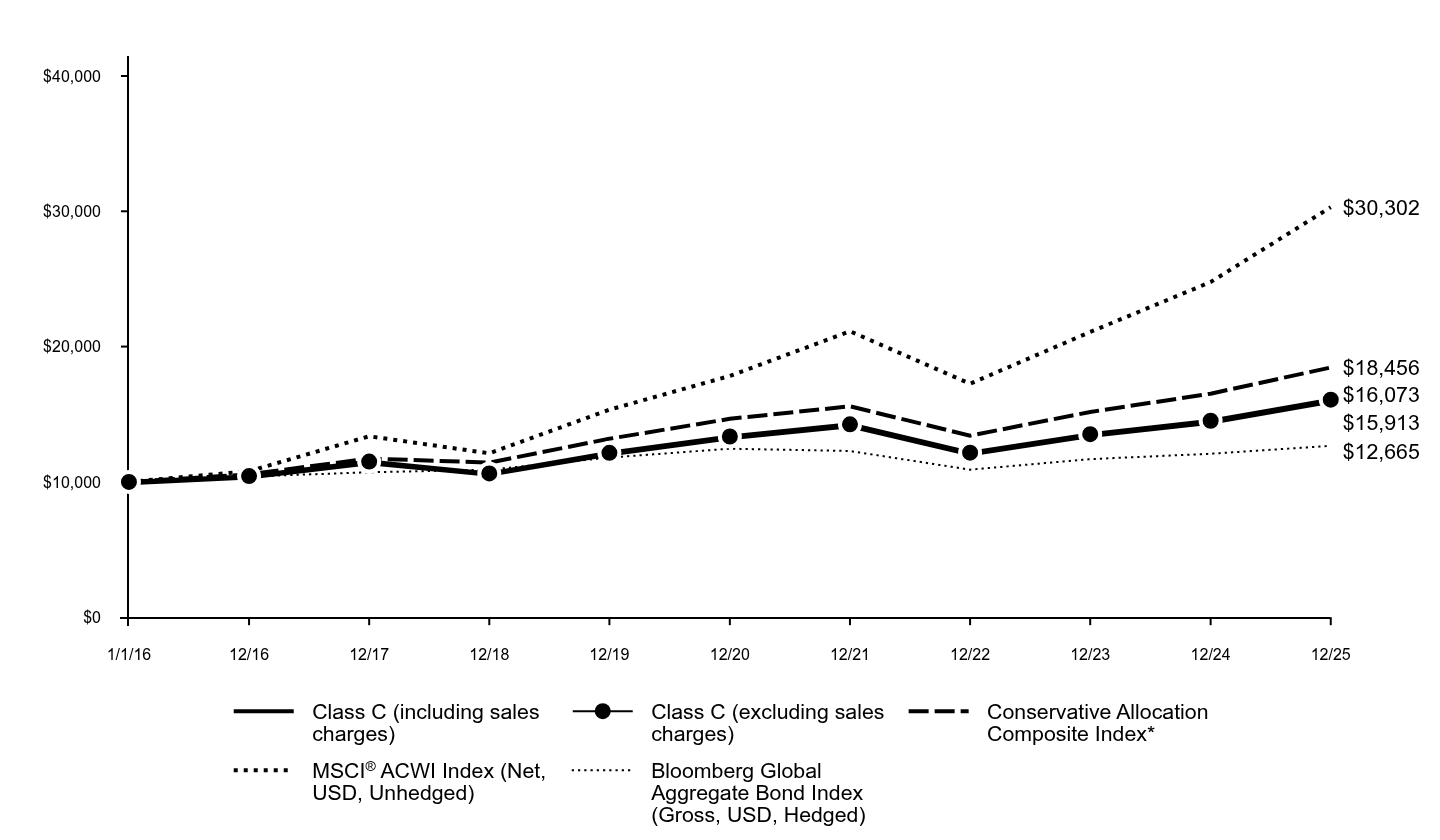
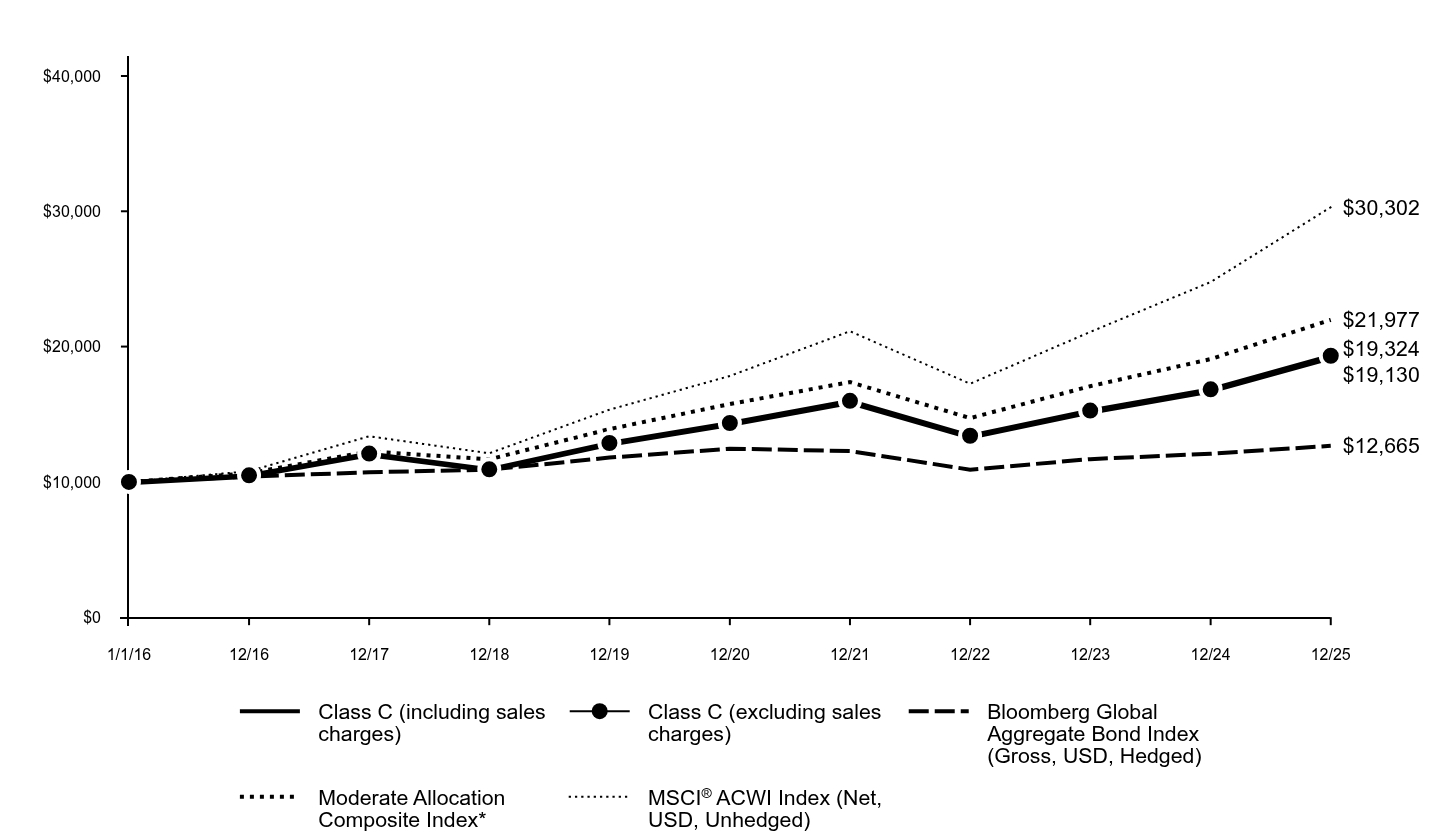
| Line Graph [Table Text Block] |
|
Class C (including sales charges) |
Class C (excluding sales charges) |
ICE BofAML Three Month U.S. Treasury Bill Index |
MSCI World Index (Net, USD, Unhedged) |
1/1/16 |
$9,900 |
$10,000 |
$10,000 |
$10,000 |
12/16 |
$10,259 |
$10,363 |
$10,033 |
$10,751 |
12/17 |
$10,885 |
$10,995 |
$10,119 |
$13,159 |
12/18 |
$10,493 |
$10,599 |
$10,308 |
$12,013 |
12/19 |
$11,510 |
$11,626 |
$10,543 |
$15,337 |
12/20 |
$11,791 |
$11,910 |
$10,613 |
$17,776 |
12/21 |
$12,417 |
$12,543 |
$10,619 |
$21,654 |
12/22 |
$11,519 |
$11,636 |
$10,773 |
$17,726 |
12/23 |
$12,608 |
$12,735 |
$11,314 |
$21,942 |
12/24 |
$13,361 |
$13,496 |
$11,908 |
$26,039 |
12/25 |
$14,488 |
$14,635 |
$12,405 |
$31,532 |
|
| Average Annual Return [Table Text Block] |
AATR |
1 Year |
5 Years |
10 Years |
Class C |
8.44% |
4.20% |
3.88% |
Class C including sales charges |
7.42% |
4.20% |
3.88% |
ICE BofAML Three Month U.S. Treasury Bill Index |
4.18% |
3.17% |
2.18% |
MSCI World Index (Net, USD, Unhedged) |
21.09% |
12.14% |
12.16% | |
| AssetsNet |
$ 5,560,131,787
|
| Holdings Count | Holding |
3,137
|
| Advisory Fees Paid, Amount |
$ 29,881,927
|
| InvestmentCompanyPortfolioTurnover |
134.00%
|
| Additional Fund Statistics [Text Block] |
Total Net Assets as of Period End |
$5,560,131,787 |
# of Portfolio Holdings as of Period End |
3,137 |
Portfolio Turnover Rate for the Period |
134% |
Total Net Advisory Fees Paid for the Period |
$29,881,927 | |
| Holdings [Text Block] |
Asset Class Exposure (%)*
Header |
Gross |
Long |
Short |
Net |
Cash and Short-Term Investments |
152.5 |
88.6 |
63.9 |
24.6 |
Commodities |
3.5 |
1.9 |
1.6 |
0.4 |
Convertible Securities |
2.4 |
2.4 |
- |
2.4 |
Credit |
14.5 |
14.5 |
- |
14.5 |
Developed Markets Currency |
2.7 |
1.3 |
1.4 |
-0.1 |
Developed Markets Equity Volatility |
7.5 |
1.8 |
5.7 |
-3.9 |
Developed Markets ex US Equity |
14.8 |
12.2 |
2.6 |
9.6 |
Developed markets FI volatility |
1.5 |
1.5 |
- |
1.5 |
Emerging Markets Currency |
3.8 |
2.0 |
1.7 |
0.3 |
Emerging Markets Equity |
8.4 |
8.4 |
- |
8.4 |
Global Real Estate |
0.2 |
0.2 |
- |
0.2 |
Interest rate |
0.8 |
0.2 |
0.6 |
-0.5 |
Long-Term Fixed Income |
10.2 |
5.0 |
5.2 |
-0.1 |
Medium-Term Fixed Income |
2.0 |
1.4 |
0.6 |
0.8 |
Preferred |
3.1 |
3.1 |
- |
3.1 |
Short-Term Fixed Income |
8.8 |
8.4 |
0.4 |
8.0 |
US Equity |
86.6 |
57.3 |
29.2 |
28.1 | * Asset class exposure includes the impact of derivatives. "Gross Exposure" represents the sum of the absolute value of long and short notional contract values in U.S. dollars of the Fund's positions (for a given asset class), divided by the Fund's net assets exposure within each asset class. "Net Exposure" represents the net exposure within the Fund to a given asset class, calculated as the difference between long and short exposures. The exposure of option contracts is delta-adjusted. Forward foreign currency exchange contracts for individual currency crosses are aggregated by settlement date and counterparty in the determination of gross exposure. Fixed income exposures are duration-adjusted to the 10-year reference rate of each respective country. |
| Material Fund Change [Text Block] |
|
| Updated Prospectus Phone Number |
1-800-526-7384
|
| Updated Prospectus Web Address |
<span style="box-sizing: border-box; color: rgb(0, 0, 0); display: inline; flex-wrap: nowrap; font-size: 12px; font-weight: 400; grid-area: auto; line-height: 18px; margin: 0px; overflow: visible; text-align: left; text-align-last: auto; white-space-collapse: preserve-breaks;">dfinview.com/GoldmanSachs</span>
|
| C000201773 |
|
| Shareholder Report [Line Items] |
|
| Fund Name |
Goldman Sachs Absolute Return Tracker Fund
|
| Class Name |
Class P
|
| Trading Symbol |
GSGPX
|
| Annual or Semi-Annual Statement [Text Block] |
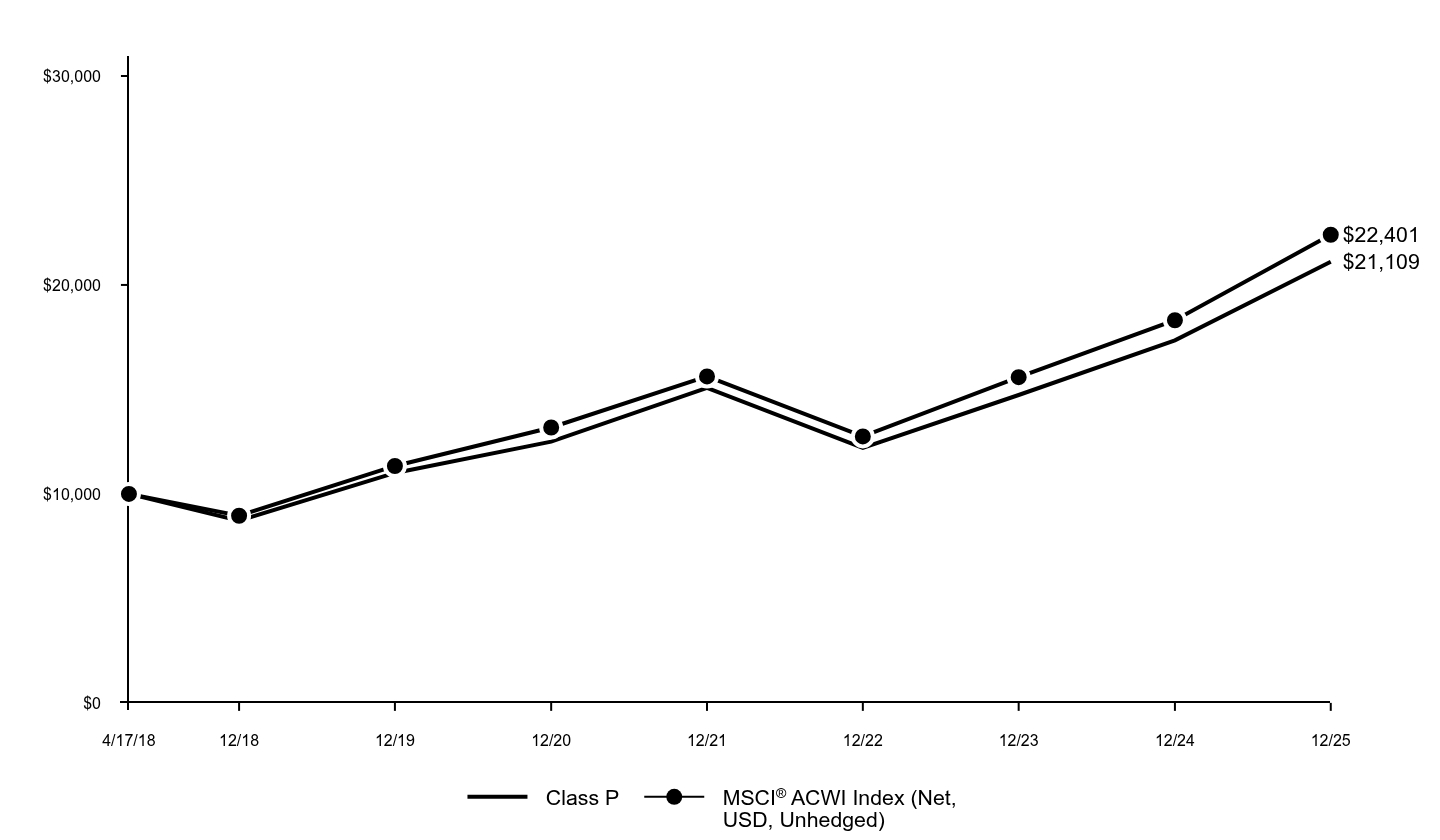
This annual shareholder report contains important information about Goldman Sachs Absolute Return Tracker Fund (the “Fund”) for the period of January 1, 2025 to December 31, 2025 (the “Period”).
|
| Additional Information [Text Block] |
You can find additional information about the Fund at am.gs.com or dfinview.com/GoldmanSachs. You can also request this information by contacting us at 1-800-621-2550.
|
| Additional Information Phone Number |
1-800-621-2550
|
| Additional Information Website |
<span style="box-sizing: border-box; color: rgb(0, 0, 0); display: inline; flex-wrap: nowrap; font-size: 12px; font-weight: 400; grid-area: auto; line-height: 18px; margin: 0px; overflow: visible; text-align: left; text-align-last: auto; white-space-collapse: preserve-breaks;">am.gs.com</span>
|
| Expenses [Text Block] |
What were the Fund costs for the Period?Based on a hypothetical $10,000 investment.
Class |
Costs of a $10,000 investment |
Costs paid as a percentage of a $10,000 investment |
P |
$67 |
0.64% | |
| Expenses Paid, Amount |
$ 67
|
| Expense Ratio, Percent |
0.64%
|
| Factors Affecting Performance [Text Block] |
How did the Fund perform and what affected its performance?Virtually all asset classes were impacted by U.S. monetary policy, inflation expectations, tariffs, AI, geopolitics, and commodity and currency movements. Hedge funds generally posted positive returns, led by equity long/short strategies. Relative value, global macro and event-driven hedge fund strategies also performed well. |
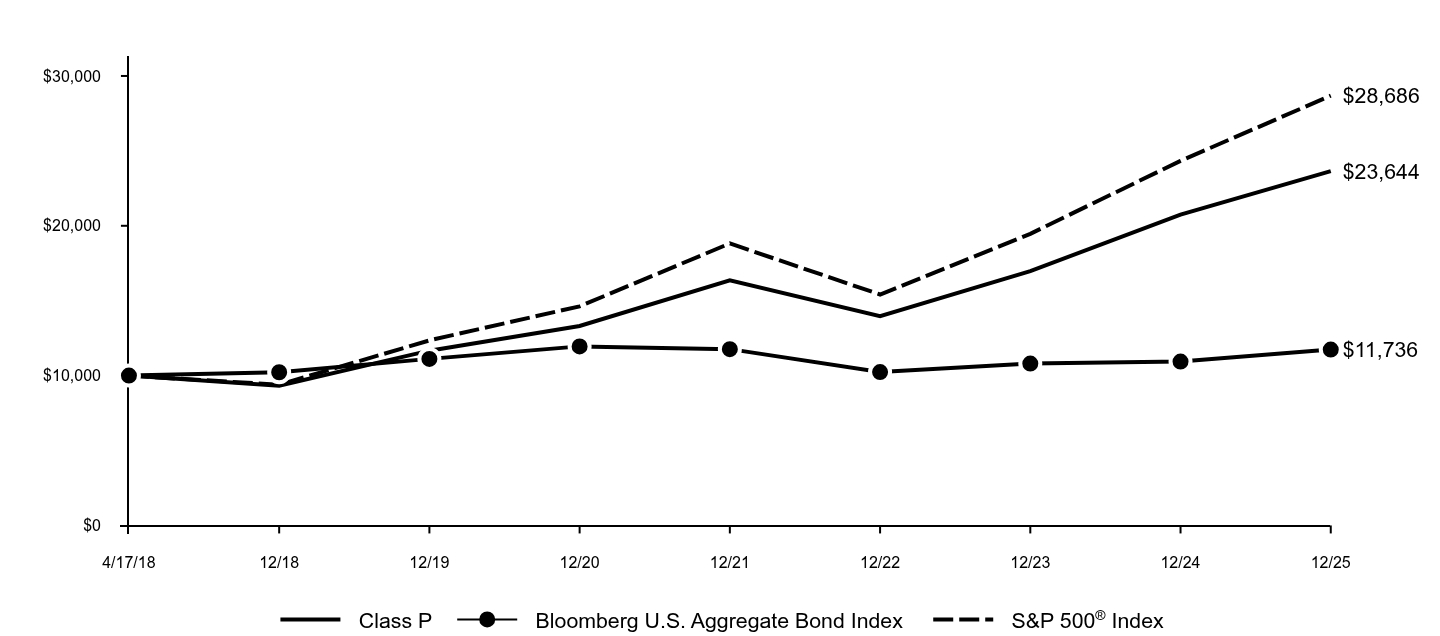
| Performance Past Does Not Indicate Future [Text] |
Performance data quoted above represents past performance. Past performance does not guarantee future results.
|
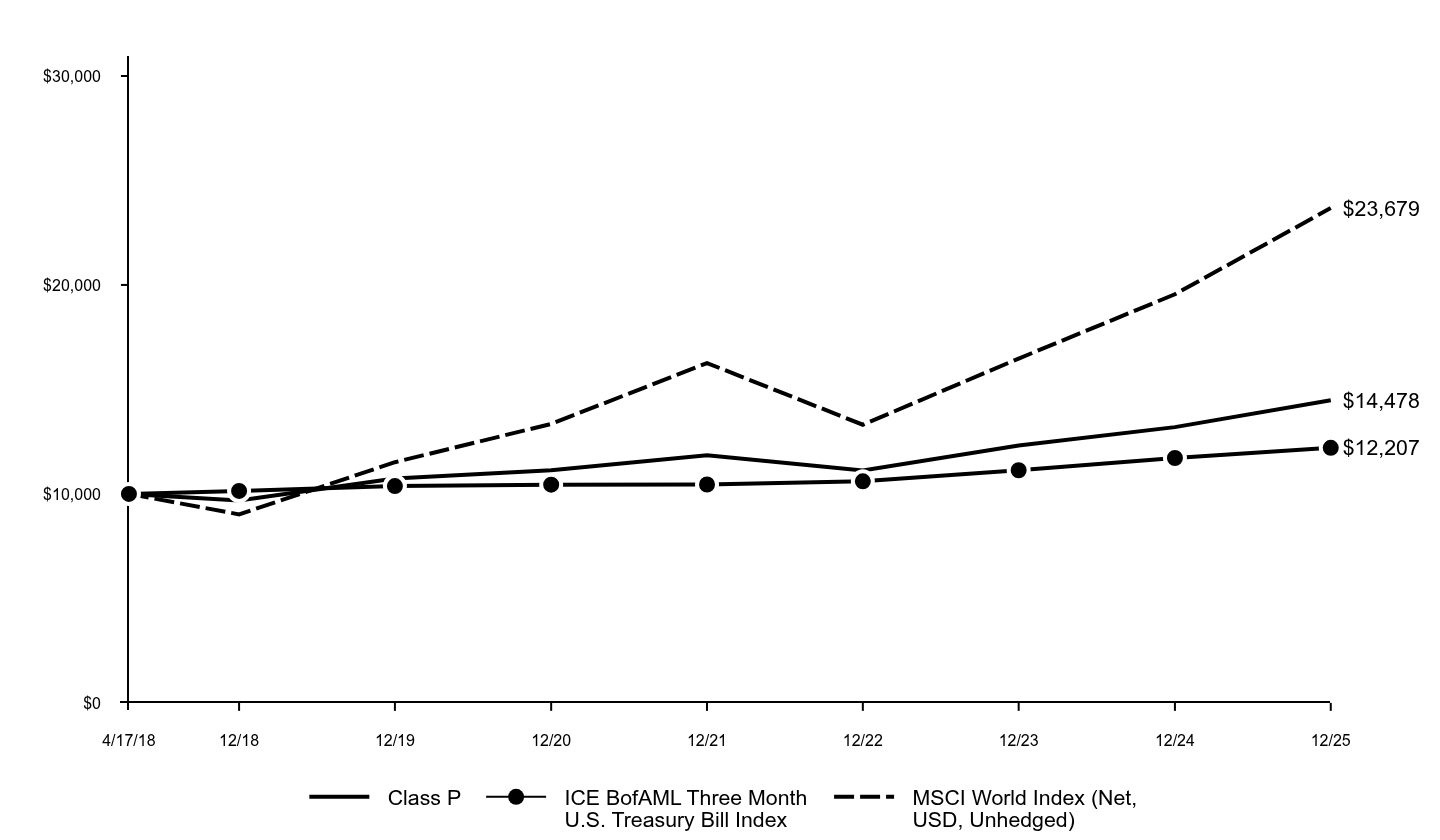
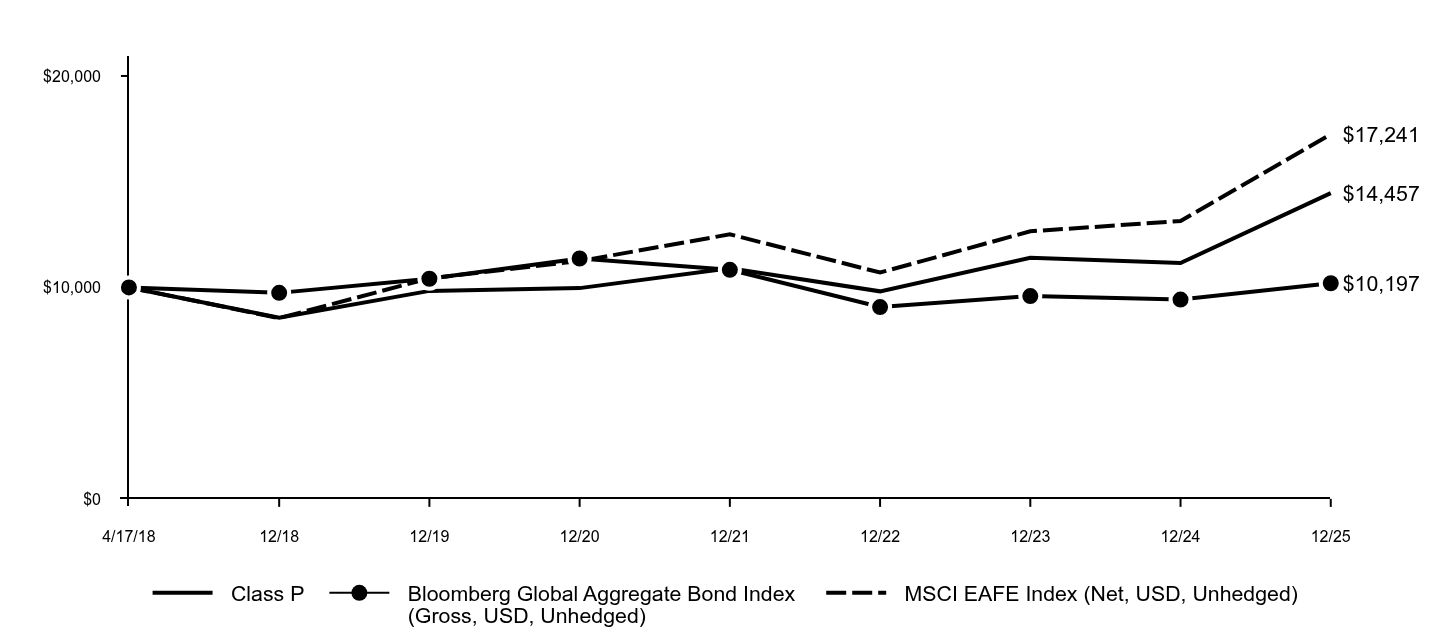
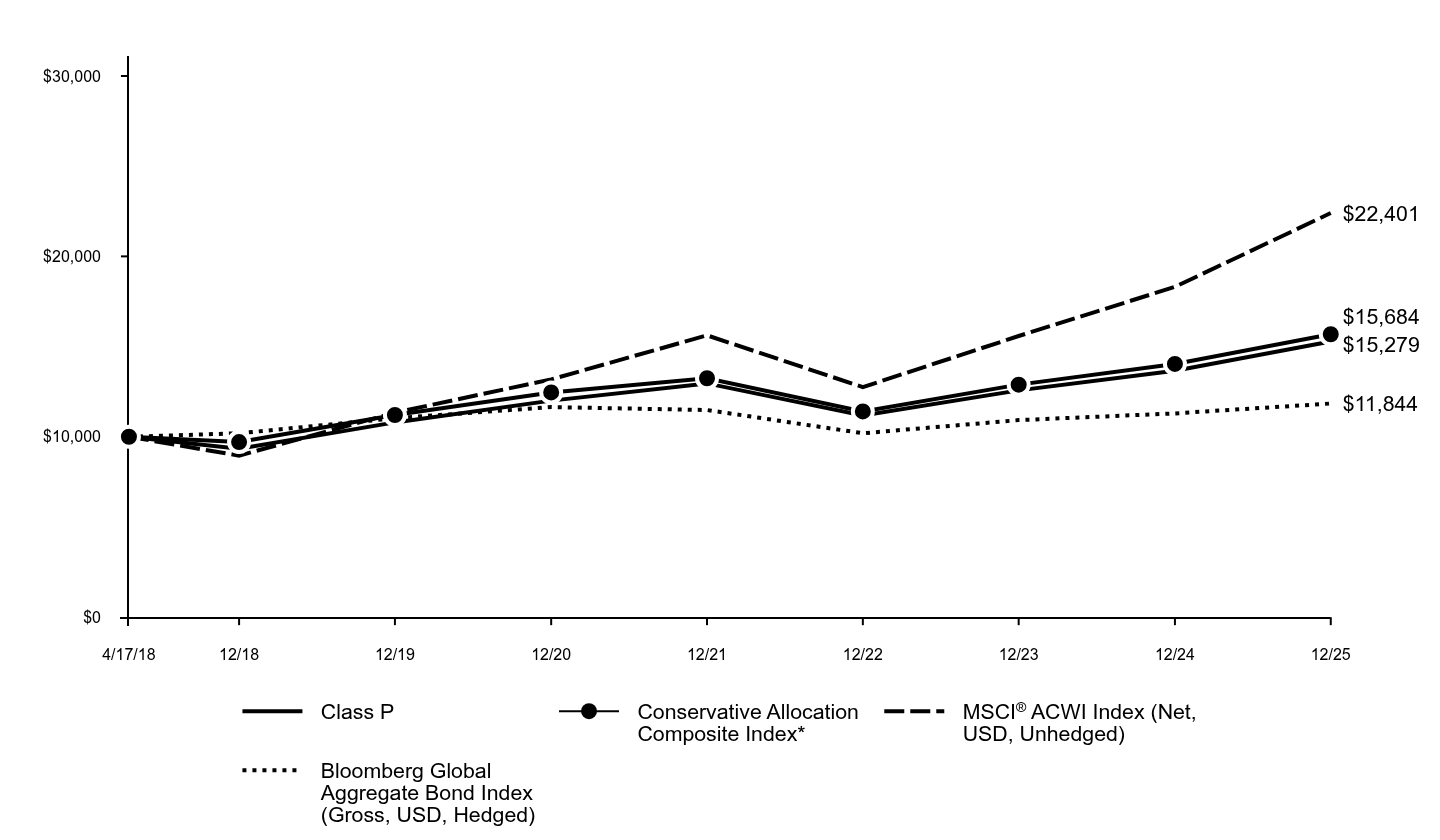
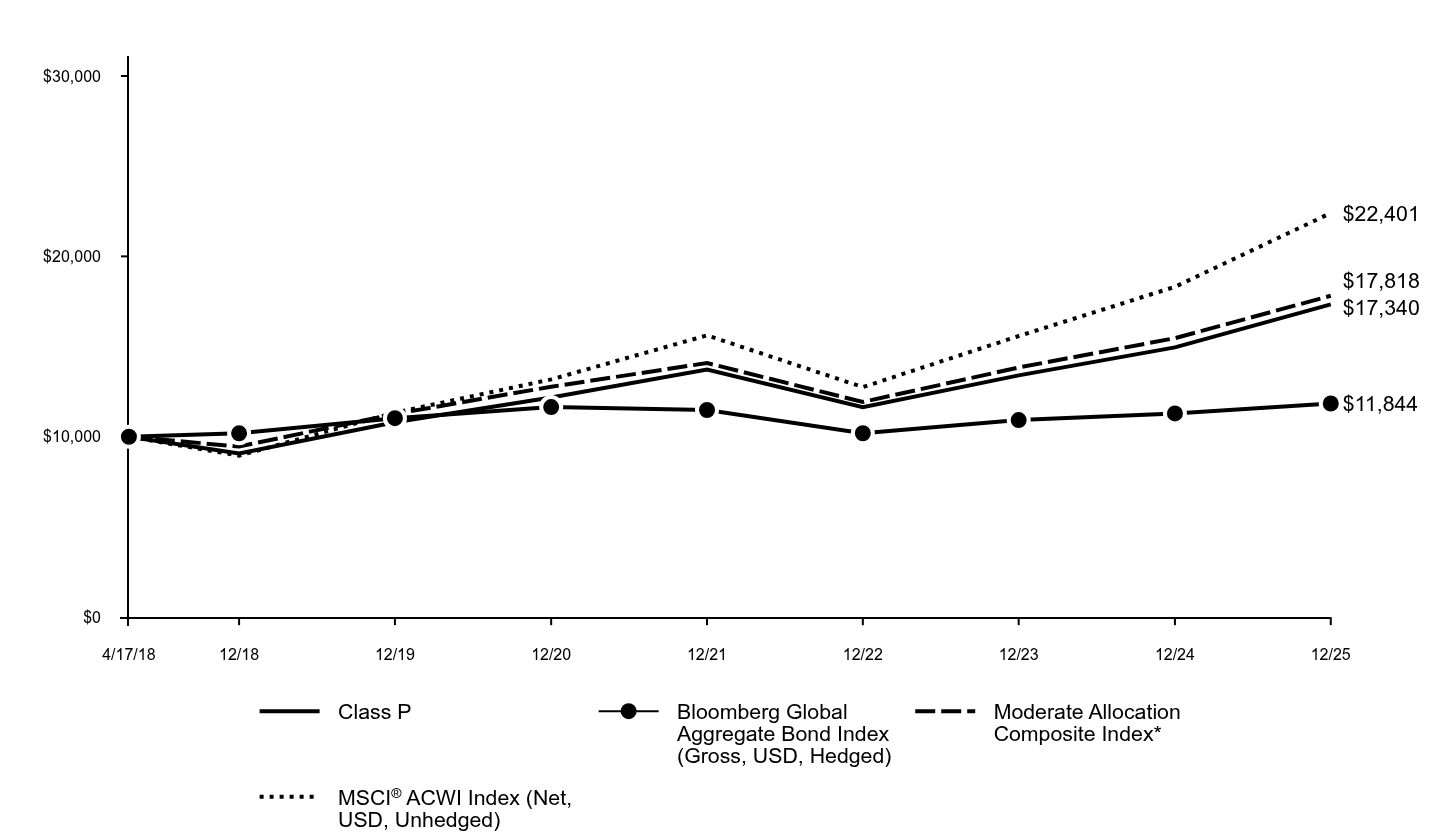
| Line Graph [Table Text Block] |
|
Class P |
ICE BofAML Three Month U.S. Treasury Bill Index |
MSCI World Index (Net, USD, Unhedged) |
4/17/18 |
$10,000 |
$10,000 |
$10,000 |
12/18 |
$9,683 |
$10,144 |
$9,021 |
12/19 |
$10,741 |
$10,375 |
$11,518 |
12/20 |
$11,130 |
$10,444 |
$13,349 |
12/21 |
$11,851 |
$10,449 |
$16,262 |
12/22 |
$11,121 |
$10,601 |
$13,311 |
12/23 |
$12,314 |
$11,133 |
$16,478 |
12/24 |
$13,196 |
$11,717 |
$19,554 |
12/25 |
$14,478 |
$12,207 |
$23,679 |
|
| Average Annual Return [Table Text Block] |
AATR |
1 Year |
5 Years |
Since Inception |
Class P (Commenced April 17, 2018) |
9.71% |
5.40% |
4.91% |
ICE BofAML Three Month U.S. Treasury Bill Index |
4.18% |
3.17% |
2.62% |
MSCI World Index (Net, USD, Unhedged) |
21.09% |
12.14% |
11.82% | |
| Performance Inception Date |
Apr. 17, 2018
|
| AssetsNet |
$ 5,560,131,787
|
| Holdings Count | Holding |
3,137
|
| Advisory Fees Paid, Amount |
$ 29,881,927
|
| InvestmentCompanyPortfolioTurnover |
134.00%
|
| Additional Fund Statistics [Text Block] |
Total Net Assets as of Period End |
$5,560,131,787 |
# of Portfolio Holdings as of Period End |
3,137 |
Portfolio Turnover Rate for the Period |
134% |
Total Net Advisory Fees Paid for the Period |
$29,881,927 | |
| Holdings [Text Block] |
Asset Class Exposure (%)*
Header |
Gross |
Long |
Short |
Net |
Cash and Short-Term Investments |
152.5 |
88.6 |
63.9 |
24.6 |
Commodities |
3.5 |
1.9 |
1.6 |
0.4 |
Convertible Securities |
2.4 |
2.4 |
- |
2.4 |
Credit |
14.5 |
14.5 |
- |
14.5 |
Developed Markets Currency |
2.7 |
1.3 |
1.4 |
-0.1 |
Developed Markets Equity Volatility |
7.5 |
1.8 |
5.7 |
-3.9 |
Developed Markets ex US Equity |
14.8 |
12.2 |
2.6 |
9.6 |
Developed markets FI volatility |
1.5 |
1.5 |
- |
1.5 |
Emerging Markets Currency |
3.8 |
2.0 |
1.7 |
0.3 |
Emerging Markets Equity |
8.4 |
8.4 |
- |
8.4 |
Global Real Estate |
0.2 |
0.2 |
- |
0.2 |
Interest rate |
0.8 |
0.2 |
0.6 |
-0.5 |
Long-Term Fixed Income |
10.2 |
5.0 |
5.2 |
-0.1 |
Medium-Term Fixed Income |
2.0 |
1.4 |
0.6 |
0.8 |
Preferred |
3.1 |
3.1 |
- |
3.1 |
Short-Term Fixed Income |
8.8 |
8.4 |
0.4 |
8.0 |
US Equity |
86.6 |
57.3 |
29.2 |
28.1 | * Asset class exposure includes the impact of derivatives. "Gross Exposure" represents the sum of the absolute value of long and short notional contract values in U.S. dollars of the Fund's positions (for a given asset class), divided by the Fund's net assets exposure within each asset class. "Net Exposure" represents the net exposure within the Fund to a given asset class, calculated as the difference between long and short exposures. The exposure of option contracts is delta-adjusted. Forward foreign currency exchange contracts for individual currency crosses are aggregated by settlement date and counterparty in the determination of gross exposure. Fixed income exposures are duration-adjusted to the 10-year reference rate of each respective country. |
| Material Fund Change [Text Block] |
|
| Updated Prospectus Phone Number |
1-800-621-2550
|
| Updated Prospectus Web Address |
<span style="box-sizing: border-box; color: rgb(0, 0, 0); display: inline; flex-wrap: nowrap; font-size: 12px; font-weight: 400; grid-area: auto; line-height: 18px; margin: 0px; overflow: visible; text-align: left; text-align-last: auto; white-space-collapse: preserve-breaks;">dfinview.com/GoldmanSachs</span>
|
| C000066743 |
|
| Shareholder Report [Line Items] |
|
| Fund Name |
Goldman Sachs Absolute Return Tracker Fund
|
| Class Name |
Class R
|
| Trading Symbol |
GRRTX
|
| Annual or Semi-Annual Statement [Text Block] |
This annual shareholder report contains important information about Goldman Sachs Absolute Return Tracker Fund (the “Fund”) for the period of January 1, 2025 to December 31, 2025 (the “Period”).
|
| Additional Information [Text Block] |
You can find additional information about the Fund at am.gs.com or dfinview.com/GoldmanSachs. You can also request this information by contacting us at 1-800-526-7384.
|
| Additional Information Phone Number |
1-800-526-7384
|
| Additional Information Website |
<span style="box-sizing: border-box; color: rgb(0, 0, 0); display: inline; flex-wrap: nowrap; font-size: 12px; font-weight: 400; grid-area: auto; line-height: 18px; margin: 0px; overflow: visible; text-align: left; text-align-last: auto; white-space-collapse: preserve-breaks;">am.gs.com</span>
|
| Expenses [Text Block] |
What were the Fund costs for the Period?Based on a hypothetical $10,000 investment.
Class |
Costs of a $10,000 investment |
Costs paid as a percentage of a $10,000 investment |
R |
$132 |
1.26% | |
| Expenses Paid, Amount |
$ 132
|
| Expense Ratio, Percent |
1.26%
|
| Factors Affecting Performance [Text Block] |
How did the Fund perform and what affected its performance?Virtually all asset classes were impacted by U.S. monetary policy, inflation expectations, tariffs, AI, geopolitics, and commodity and currency movements. Hedge funds generally posted positive returns, led by equity long/short strategies. Relative value, global macro and event-driven hedge fund strategies also performed well. |
| Performance Past Does Not Indicate Future [Text] |
Performance data quoted above represents past performance. Past performance does not guarantee future results.
|
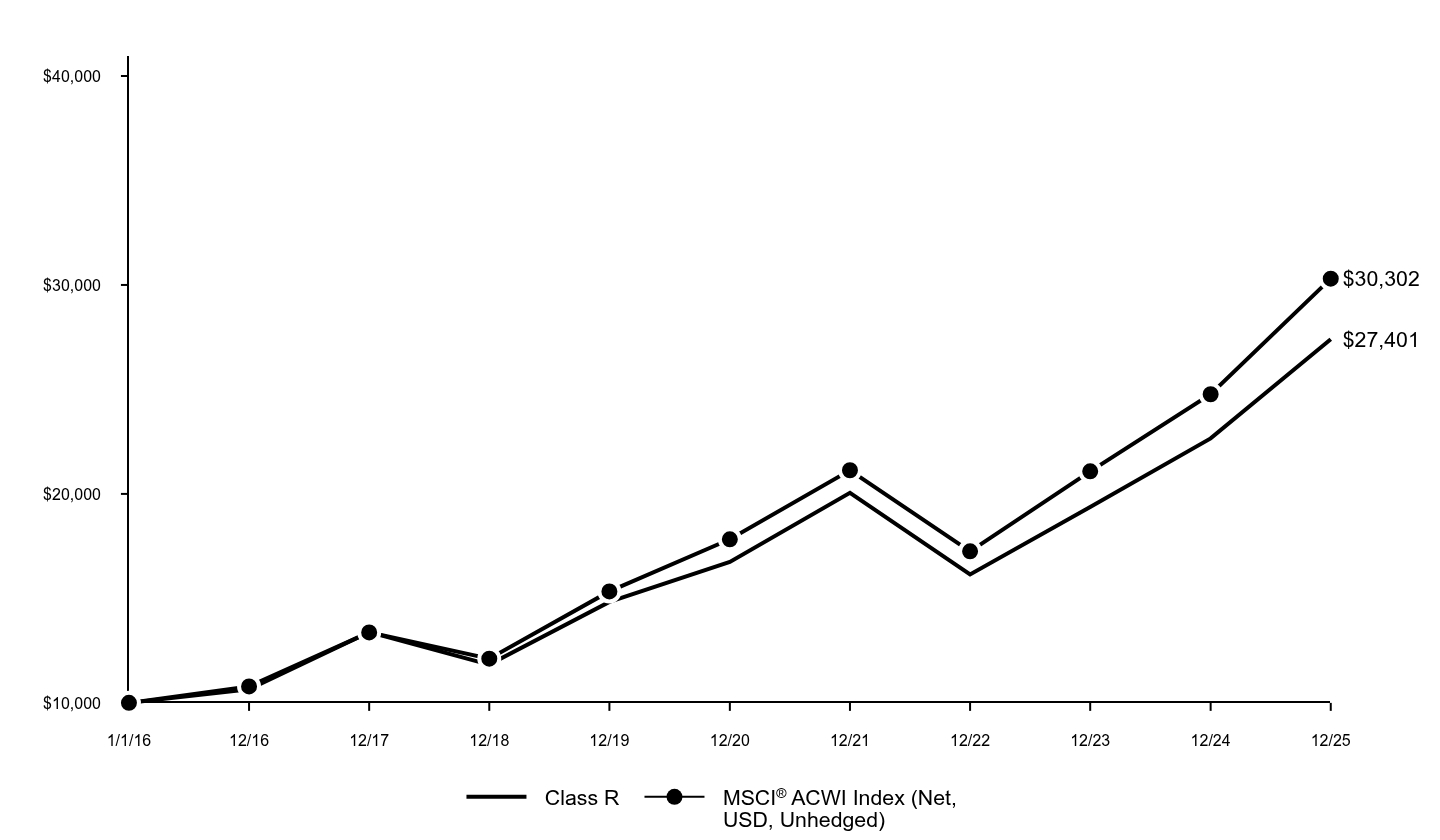
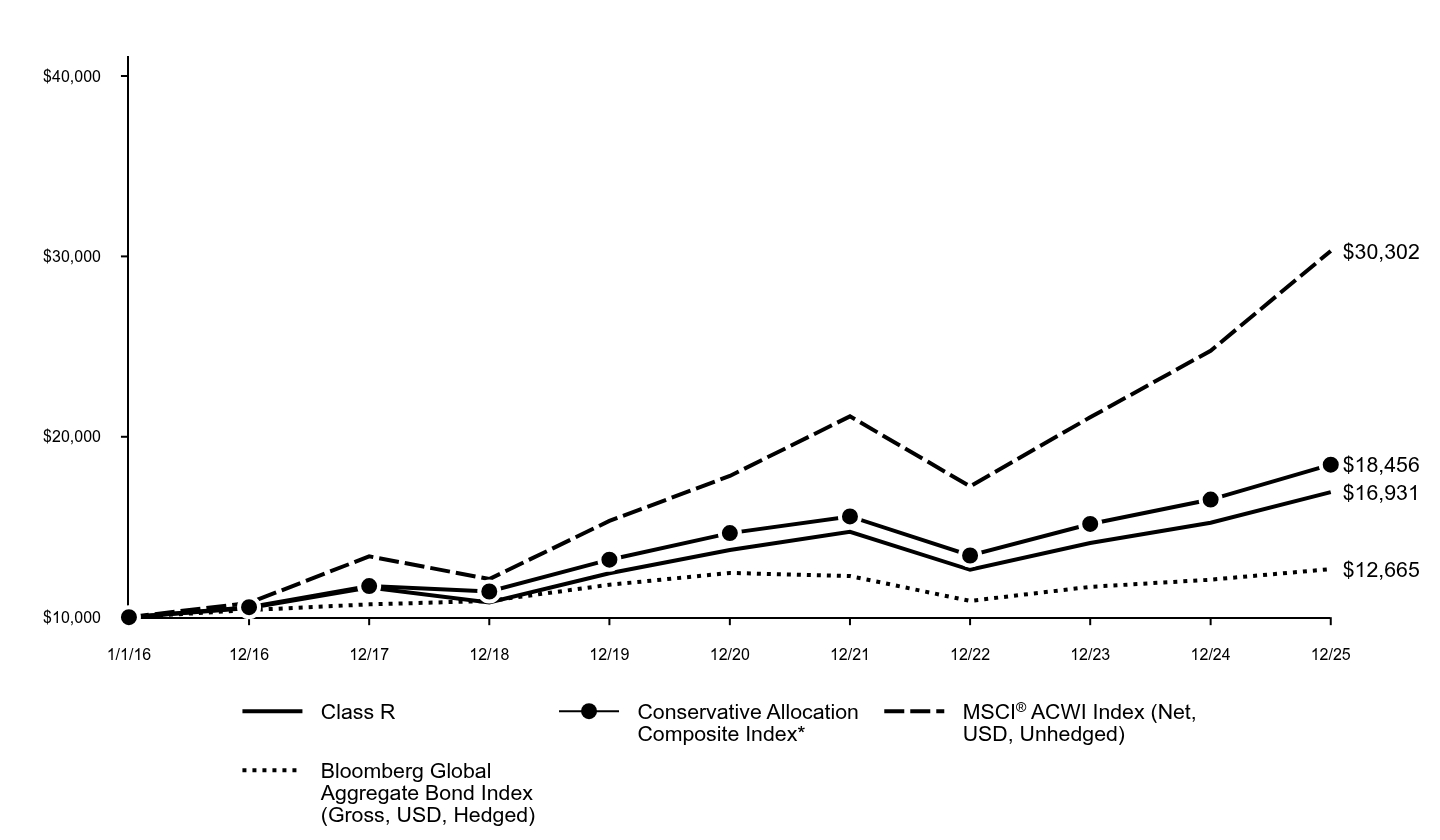
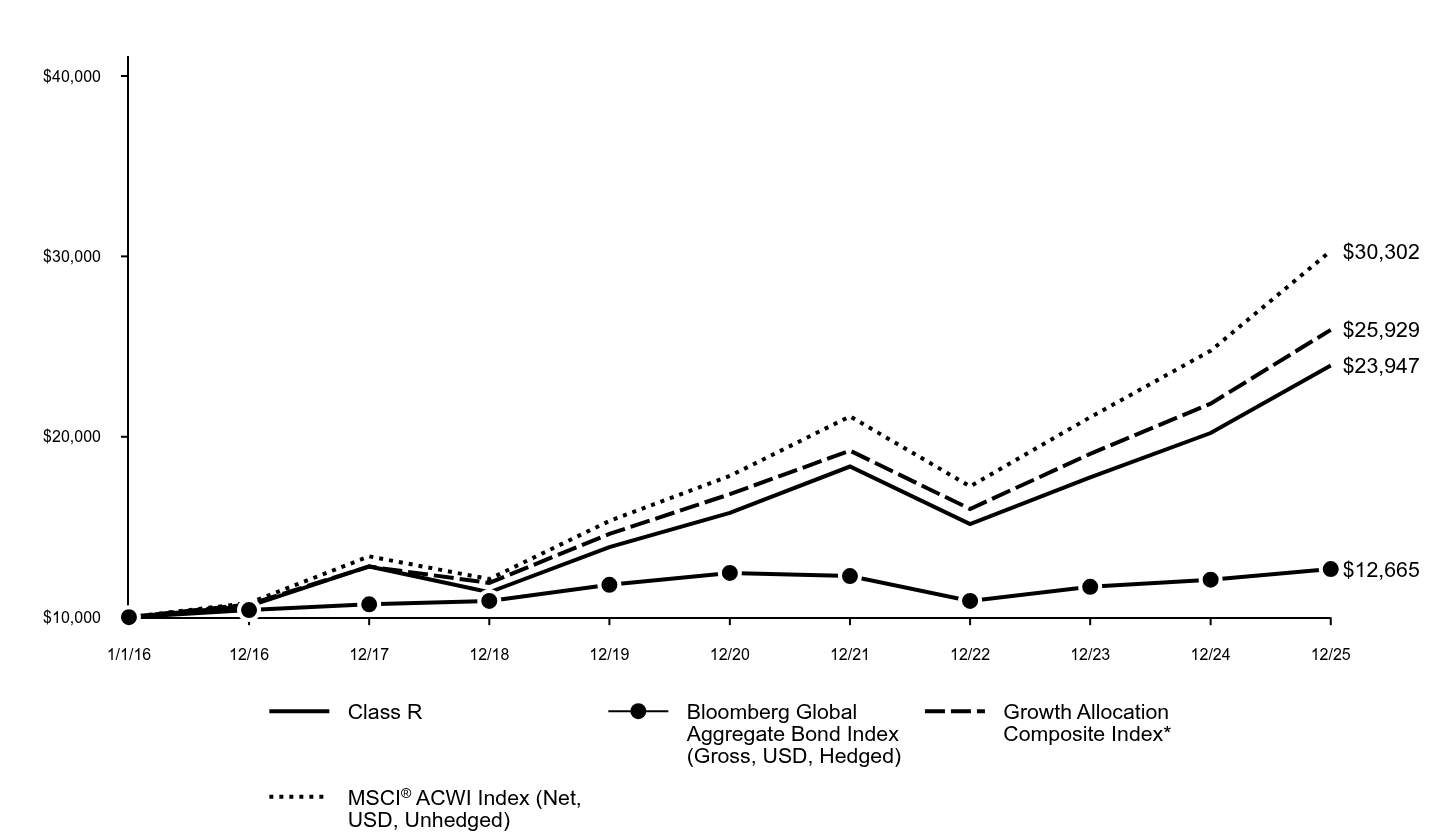
| Line Graph [Table Text Block] |
|
Class R |
ICE BofAML Three Month U.S. Treasury Bill Index |
MSCI World Index (Net, USD, Unhedged) |
1/1/16 |
$10,000 |
$10,000 |
$10,000 |
12/16 |
$10,420 |
$10,033 |
$10,751 |
12/17 |
$11,122 |
$10,119 |
$13,159 |
12/18 |
$10,774 |
$10,308 |
$12,013 |
12/19 |
$11,858 |
$10,543 |
$15,337 |
12/20 |
$12,222 |
$10,613 |
$17,776 |
12/21 |
$12,922 |
$10,619 |
$21,654 |
12/22 |
$12,045 |
$10,773 |
$17,726 |
12/23 |
$13,263 |
$11,314 |
$21,942 |
12/24 |
$14,112 |
$11,908 |
$26,039 |
12/25 |
$15,400 |
$12,405 |
$31,532 |
|
| Average Annual Return [Table Text Block] |
AATR |
1 Year |
5 Years |
10 Years |
Class R |
9.13% |
4.73% |
4.41% |
ICE BofAML Three Month U.S. Treasury Bill Index |
4.18% |
3.17% |
2.18% |
MSCI World Index (Net, USD, Unhedged) |
21.09% |
12.14% |
12.16% | |
| AssetsNet |
$ 5,560,131,787
|
| Holdings Count | Holding |
3,137
|
| Advisory Fees Paid, Amount |
$ 29,881,927
|
| InvestmentCompanyPortfolioTurnover |
134.00%
|
| Additional Fund Statistics [Text Block] |
Total Net Assets as of Period End |
$5,560,131,787 |
# of Portfolio Holdings as of Period End |
3,137 |
Portfolio Turnover Rate for the Period |
134% |
Total Net Advisory Fees Paid for the Period |
$29,881,927 | |
| Holdings [Text Block] |
Asset Class Exposure (%)*
Header |
Gross |
Long |
Short |
Net |
Cash and Short-Term Investments |
152.5 |
88.6 |
63.9 |
24.6 |
Commodities |
3.5 |
1.9 |
1.6 |
0.4 |
Convertible Securities |
2.4 |
2.4 |
- |
2.4 |
Credit |
14.5 |
14.5 |
- |
14.5 |
Developed Markets Currency |
2.7 |
1.3 |
1.4 |
-0.1 |
Developed Markets Equity Volatility |
7.5 |
1.8 |
5.7 |
-3.9 |
Developed Markets ex US Equity |
14.8 |
12.2 |
2.6 |
9.6 |
Developed markets FI volatility |
1.5 |
1.5 |
- |
1.5 |
Emerging Markets Currency |
3.8 |
2.0 |
1.7 |
0.3 |
Emerging Markets Equity |
8.4 |
8.4 |
- |
8.4 |
Global Real Estate |
0.2 |
0.2 |
- |
0.2 |
Interest rate |
0.8 |
0.2 |
0.6 |
-0.5 |
Long-Term Fixed Income |
10.2 |
5.0 |
5.2 |
-0.1 |
Medium-Term Fixed Income |
2.0 |
1.4 |
0.6 |
0.8 |
Preferred |
3.1 |
3.1 |
- |
3.1 |
Short-Term Fixed Income |
8.8 |
8.4 |
0.4 |
8.0 |
US Equity |
86.6 |
57.3 |
29.2 |
28.1 | * Asset class exposure includes the impact of derivatives. "Gross Exposure" represents the sum of the absolute value of long and short notional contract values in U.S. dollars of the Fund's positions (for a given asset class), divided by the Fund's net assets exposure within each asset class. "Net Exposure" represents the net exposure within the Fund to a given asset class, calculated as the difference between long and short exposures. The exposure of option contracts is delta-adjusted. Forward foreign currency exchange contracts for individual currency crosses are aggregated by settlement date and counterparty in the determination of gross exposure. Fixed income exposures are duration-adjusted to the 10-year reference rate of each respective country. |
| Material Fund Change [Text Block] |
|
| Updated Prospectus Phone Number |
1-800-526-7384
|
| Updated Prospectus Web Address |
<span style="box-sizing: border-box; color: rgb(0, 0, 0); display: inline; flex-wrap: nowrap; font-size: 12px; font-weight: 400; grid-area: auto; line-height: 18px; margin: 0px; overflow: visible; text-align: left; text-align-last: auto; white-space-collapse: preserve-breaks;">dfinview.com/GoldmanSachs</span>
|
| C000161524 |
|
| Shareholder Report [Line Items] |
|
| Fund Name |
Goldman Sachs Absolute Return Tracker Fund
|
| Class Name |
Class R6
|
| Trading Symbol |
GARUX
|
| Annual or Semi-Annual Statement [Text Block] |
This annual shareholder report contains important information about Goldman Sachs Absolute Return Tracker Fund (the “Fund”) for the period of January 1, 2025 to December 31, 2025 (the “Period”).
|
| Additional Information [Text Block] |
You can find additional information about the Fund at am.gs.com or dfinview.com/GoldmanSachs. You can also request this information by contacting us at 1-800-621-2550.
|
| Additional Information Phone Number |
1-800-621-2550
|
| Additional Information Website |
<span style="box-sizing: border-box; color: rgb(0, 0, 0); display: inline; flex-wrap: nowrap; font-size: 12px; font-weight: 400; grid-area: auto; line-height: 18px; margin: 0px; overflow: visible; text-align: left; text-align-last: auto; white-space-collapse: preserve-breaks;">am.gs.com</span>
|
| Expenses [Text Block] |
What were the Fund costs for the Period?Based on a hypothetical $10,000 investment.
Class |
Costs of a $10,000 investment |
Costs paid as a percentage of a $10,000 investment |
R6 |
$67 |
0.64% | |
| Expenses Paid, Amount |
$ 67
|
| Expense Ratio, Percent |
0.64%
|
| Factors Affecting Performance [Text Block] |
How did the Fund perform and what affected its performance?Virtually all asset classes were impacted by U.S. monetary policy, inflation expectations, tariffs, AI, geopolitics, and commodity and currency movements. Hedge funds generally posted positive returns, led by equity long/short strategies. Relative value, global macro and event-driven hedge fund strategies also performed well. |
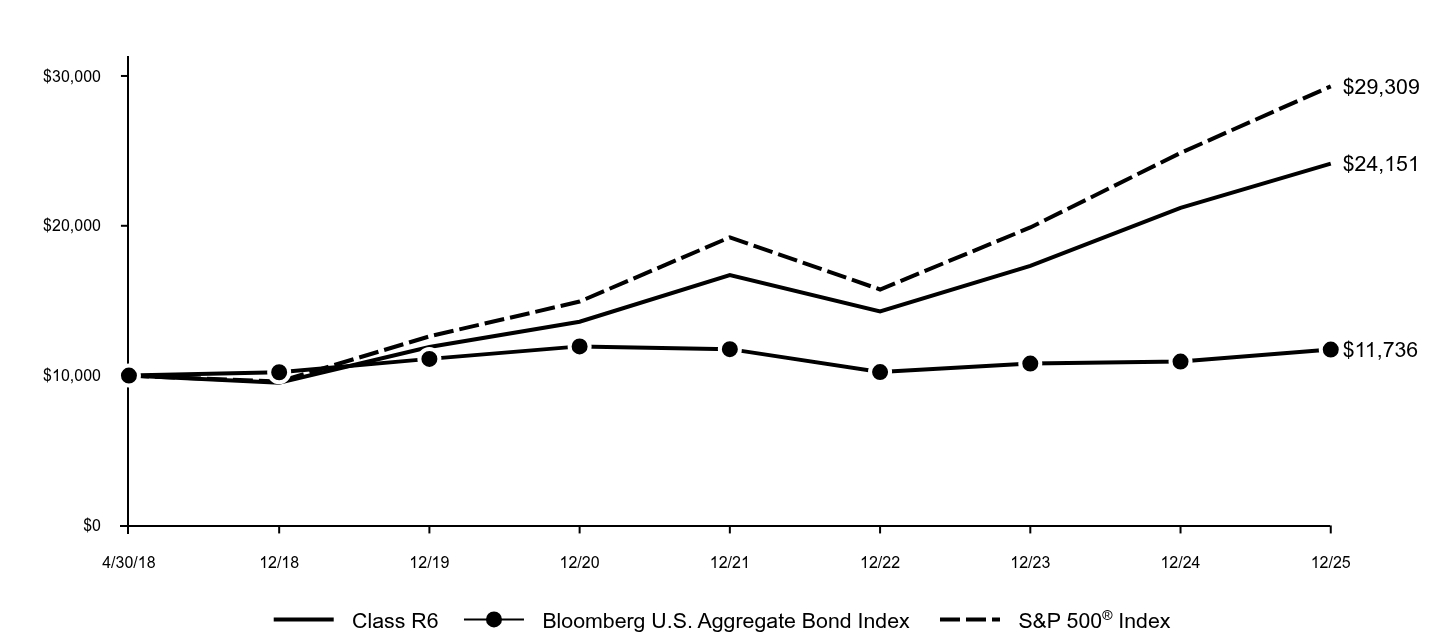
| Performance Past Does Not Indicate Future [Text] |
Performance data quoted above represents past performance. Past performance does not guarantee future results.
|
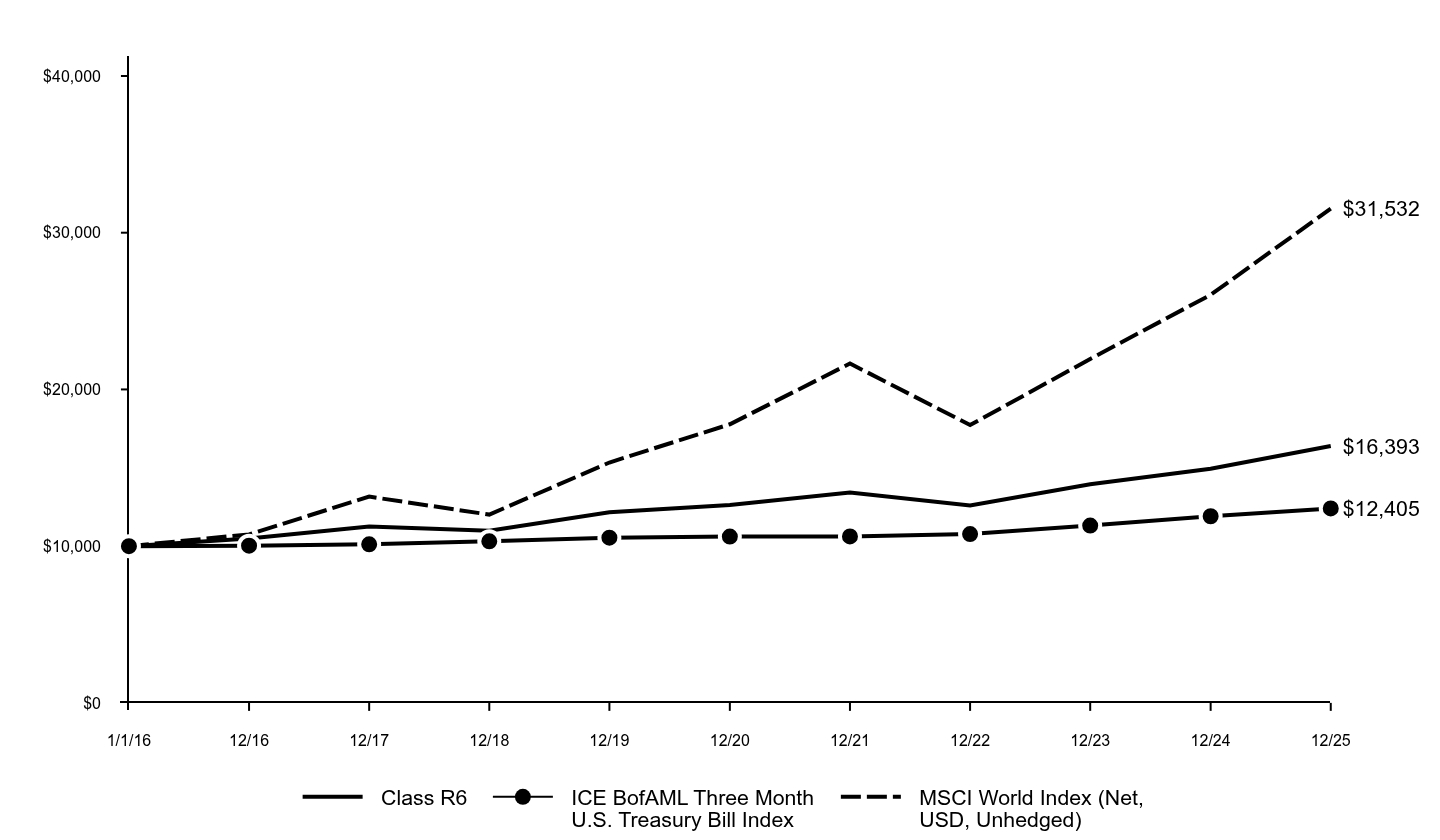
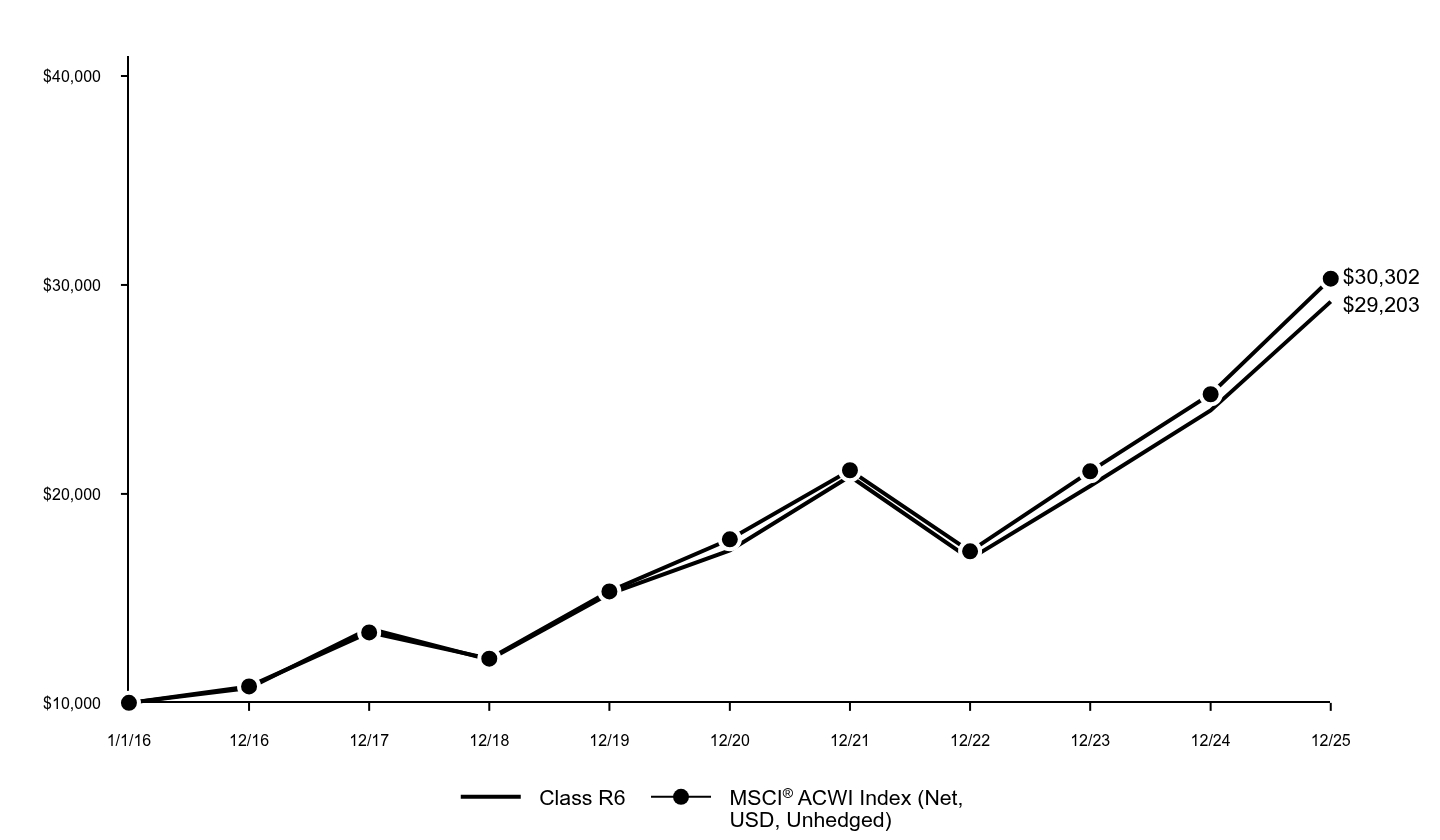
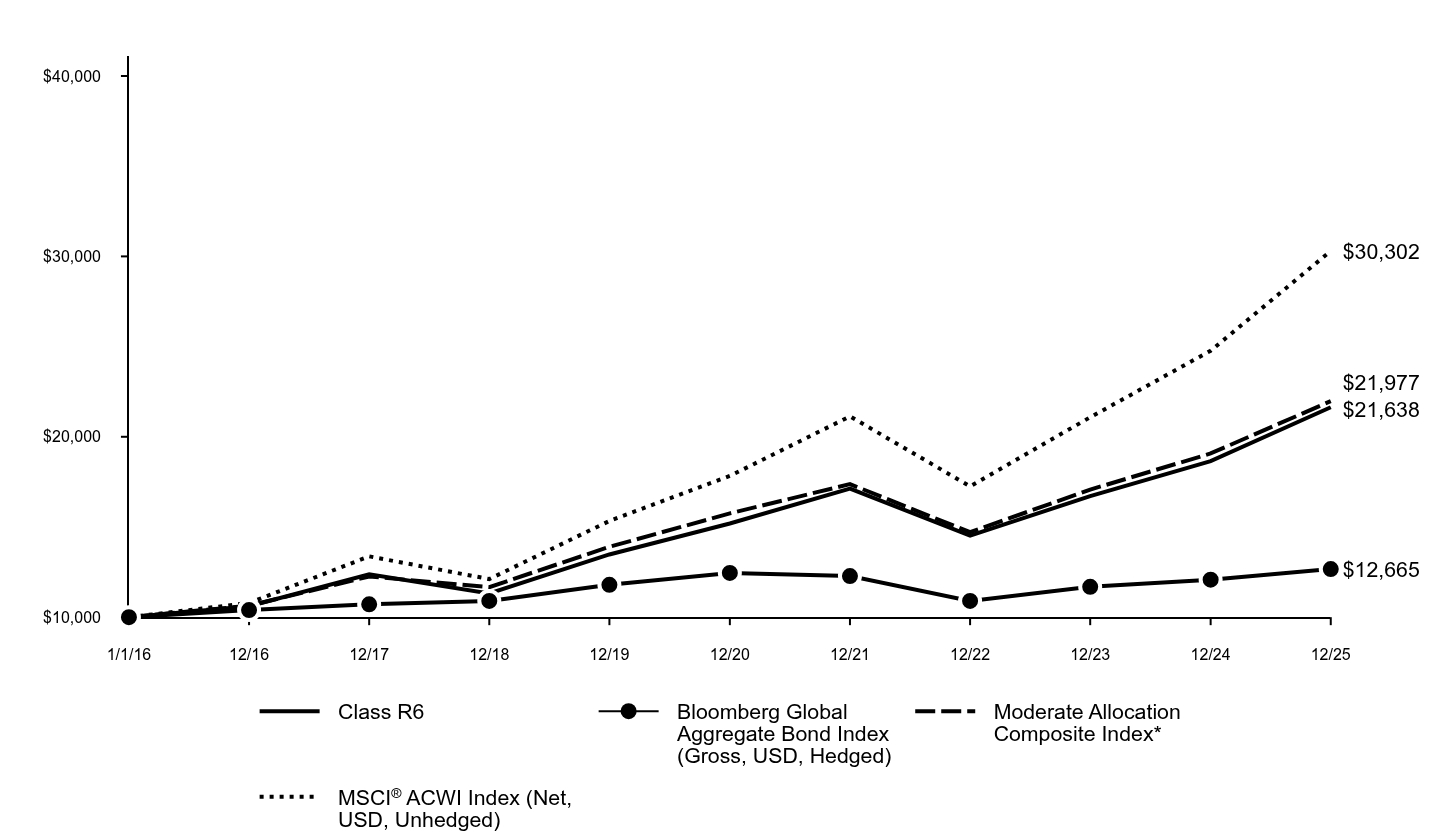
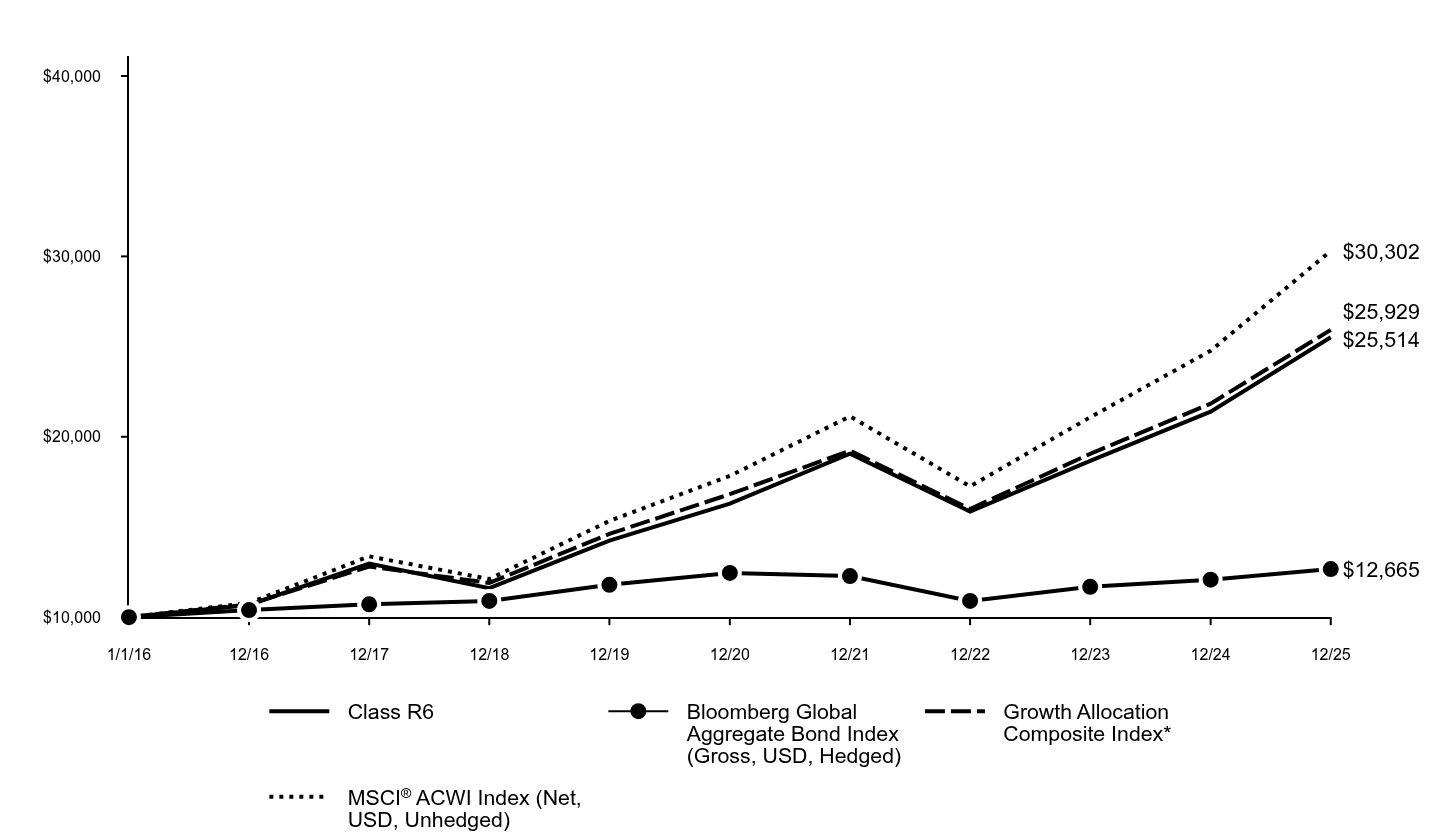
| Line Graph [Table Text Block] |
|
Class R6 |
ICE BofAML Three Month U.S. Treasury Bill Index |
MSCI World Index (Net, USD, Unhedged) |
1/1/16 |
$10,000 |
$10,000 |
$10,000 |
12/16 |
$10,486 |
$10,033 |
$10,751 |
12/17 |
$11,258 |
$10,119 |
$13,159 |
12/18 |
$10,981 |
$10,308 |
$12,013 |
12/19 |
$12,169 |
$10,543 |
$15,337 |
12/20 |
$12,622 |
$10,613 |
$17,776 |
12/21 |
$13,427 |
$10,619 |
$21,654 |
12/22 |
$12,598 |
$10,773 |
$17,726 |
12/23 |
$13,952 |
$11,314 |
$21,942 |
12/24 |
$14,938 |
$11,908 |
$26,039 |
12/25 |
$16,393 |
$12,405 |
$31,532 |
|
| Average Annual Return [Table Text Block] |
AATR |
1 Year |
5 Years |
10 Years |
Class R6 |
9.74% |
5.37% |
5.06% |
ICE BofAML Three Month U.S. Treasury Bill Index |
4.18% |
3.17% |
2.18% |
MSCI World Index (Net, USD, Unhedged) |
21.09% |
12.14% |
12.16% | |
| AssetsNet |
$ 5,560,131,787
|
| Holdings Count | Holding |
3,137
|
| Advisory Fees Paid, Amount |
$ 29,881,927
|
| InvestmentCompanyPortfolioTurnover |
134.00%
|
| Additional Fund Statistics [Text Block] |
Total Net Assets as of Period End |
$5,560,131,787 |
# of Portfolio Holdings as of Period End |
3,137 |
Portfolio Turnover Rate for the Period |
134% |
Total Net Advisory Fees Paid for the Period |
$29,881,927 | |
| Holdings [Text Block] |
Asset Class Exposure (%)*
Header |
Gross |
Long |
Short |
Net |
Cash and Short-Term Investments |
152.5 |
88.6 |
63.9 |
24.6 |
Commodities |
3.5 |
1.9 |
1.6 |
0.4 |
Convertible Securities |
2.4 |
2.4 |
- |
2.4 |
Credit |
14.5 |
14.5 |
- |
14.5 |
Developed Markets Currency |
2.7 |
1.3 |
1.4 |
-0.1 |
Developed Markets Equity Volatility |
7.5 |
1.8 |
5.7 |
-3.9 |
Developed Markets ex US Equity |
14.8 |
12.2 |
2.6 |
9.6 |
Developed markets FI volatility |
1.5 |
1.5 |
- |
1.5 |
Emerging Markets Currency |
3.8 |
2.0 |
1.7 |
0.3 |
Emerging Markets Equity |
8.4 |
8.4 |
- |
8.4 |
Global Real Estate |
0.2 |
0.2 |
- |
0.2 |
Interest rate |
0.8 |
0.2 |
0.6 |
-0.5 |
Long-Term Fixed Income |
10.2 |
5.0 |
5.2 |
-0.1 |
Medium-Term Fixed Income |
2.0 |
1.4 |
0.6 |
0.8 |
Preferred |
3.1 |
3.1 |
- |
3.1 |
Short-Term Fixed Income |
8.8 |
8.4 |
0.4 |
8.0 |
US Equity |
86.6 |
57.3 |
29.2 |
28.1 | * Asset class exposure includes the impact of derivatives. "Gross Exposure" represents the sum of the absolute value of long and short notional contract values in U.S. dollars of the Fund's positions (for a given asset class), divided by the Fund's net assets exposure within each asset class. "Net Exposure" represents the net exposure within the Fund to a given asset class, calculated as the difference between long and short exposures. The exposure of option contracts is delta-adjusted. Forward foreign currency exchange contracts for individual currency crosses are aggregated by settlement date and counterparty in the determination of gross exposure. Fixed income exposures are duration-adjusted to the 10-year reference rate of each respective country. |
| Material Fund Change [Text Block] |
|
| Updated Prospectus Phone Number |
1-800-621-2550
|
| Updated Prospectus Web Address |
<span style="box-sizing: border-box; color: rgb(0, 0, 0); display: inline; flex-wrap: nowrap; font-size: 12px; font-weight: 400; grid-area: auto; line-height: 18px; margin: 0px; overflow: visible; text-align: left; text-align-last: auto; white-space-collapse: preserve-breaks;">dfinview.com/GoldmanSachs</span>
|
| C000057078 |
|
| Shareholder Report [Line Items] |
|
| Fund Name |
Goldman Sachs Absolute Return Tracker Fund
|
| Class Name |
Institutional Class
|
| Trading Symbol |
GJRTX
|
| Annual or Semi-Annual Statement [Text Block] |
This annual shareholder report contains important information about Goldman Sachs Absolute Return Tracker Fund (the “Fund”) for the period of January 1, 2025 to December 31, 2025 (the “Period”).
|
| Additional Information [Text Block] |
You can find additional information about the Fund at am.gs.com or dfinview.com/GoldmanSachs. You can also request this information by contacting us at 1-800-621-2550.
|
| Additional Information Phone Number |
1-800-621-2550
|
| Additional Information Website |
<span style="box-sizing: border-box; color: rgb(0, 0, 0); display: inline; flex-wrap: nowrap; font-size: 12px; font-weight: 400; grid-area: auto; line-height: 18px; margin: 0px; overflow: visible; text-align: left; text-align-last: auto; white-space-collapse: preserve-breaks;">am.gs.com</span>
|
| Expenses [Text Block] |
What were the Fund costs for the Period?Based on a hypothetical $10,000 investment.
Class |
Costs of a $10,000 investment |
Costs paid as a percentage of a $10,000 investment |
Institutional |
$68 |
0.65% | |
| Expenses Paid, Amount |
$ 68
|
| Expense Ratio, Percent |
0.65%
|
| Factors Affecting Performance [Text Block] |
How did the Fund perform and what affected its performance?Virtually all asset classes were impacted by U.S. monetary policy, inflation expectations, tariffs, AI, geopolitics, and commodity and currency movements. Hedge funds generally posted positive returns, led by equity long/short strategies. Relative value, global macro and event-driven hedge fund strategies also performed well. |
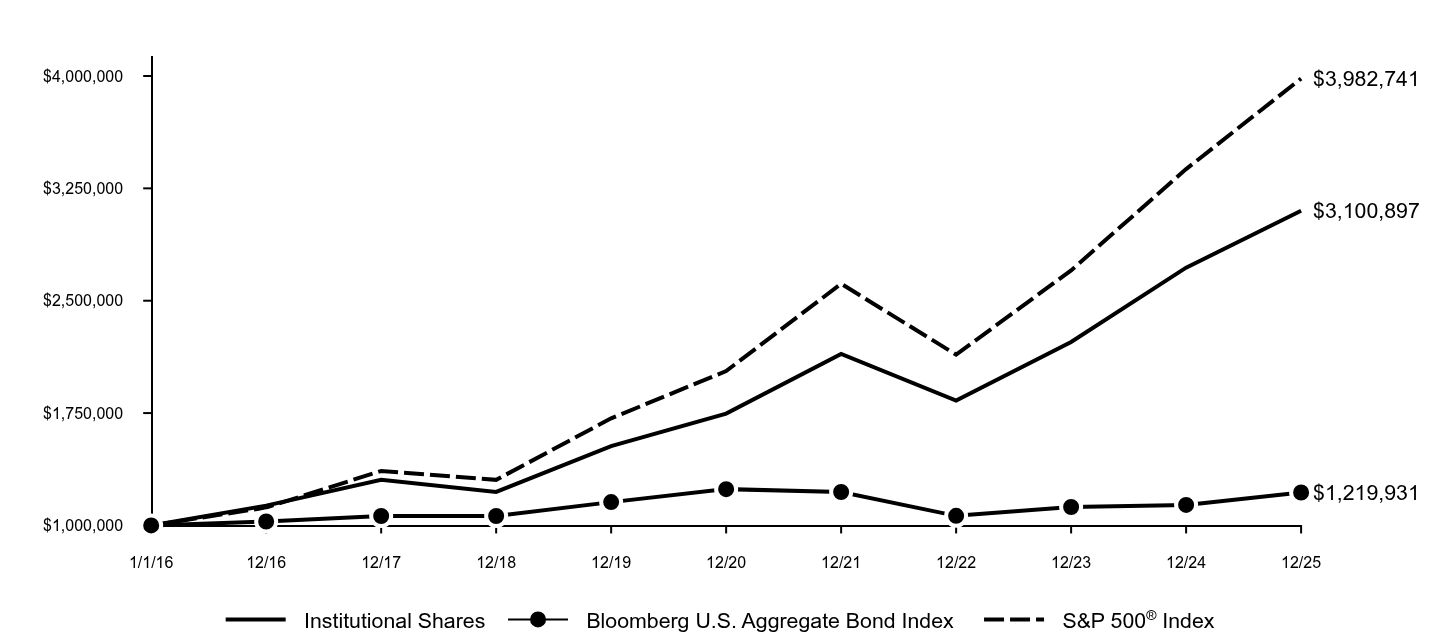
| Performance Past Does Not Indicate Future [Text] |
Performance data quoted above represents past performance. Past performance does not guarantee future results.
|
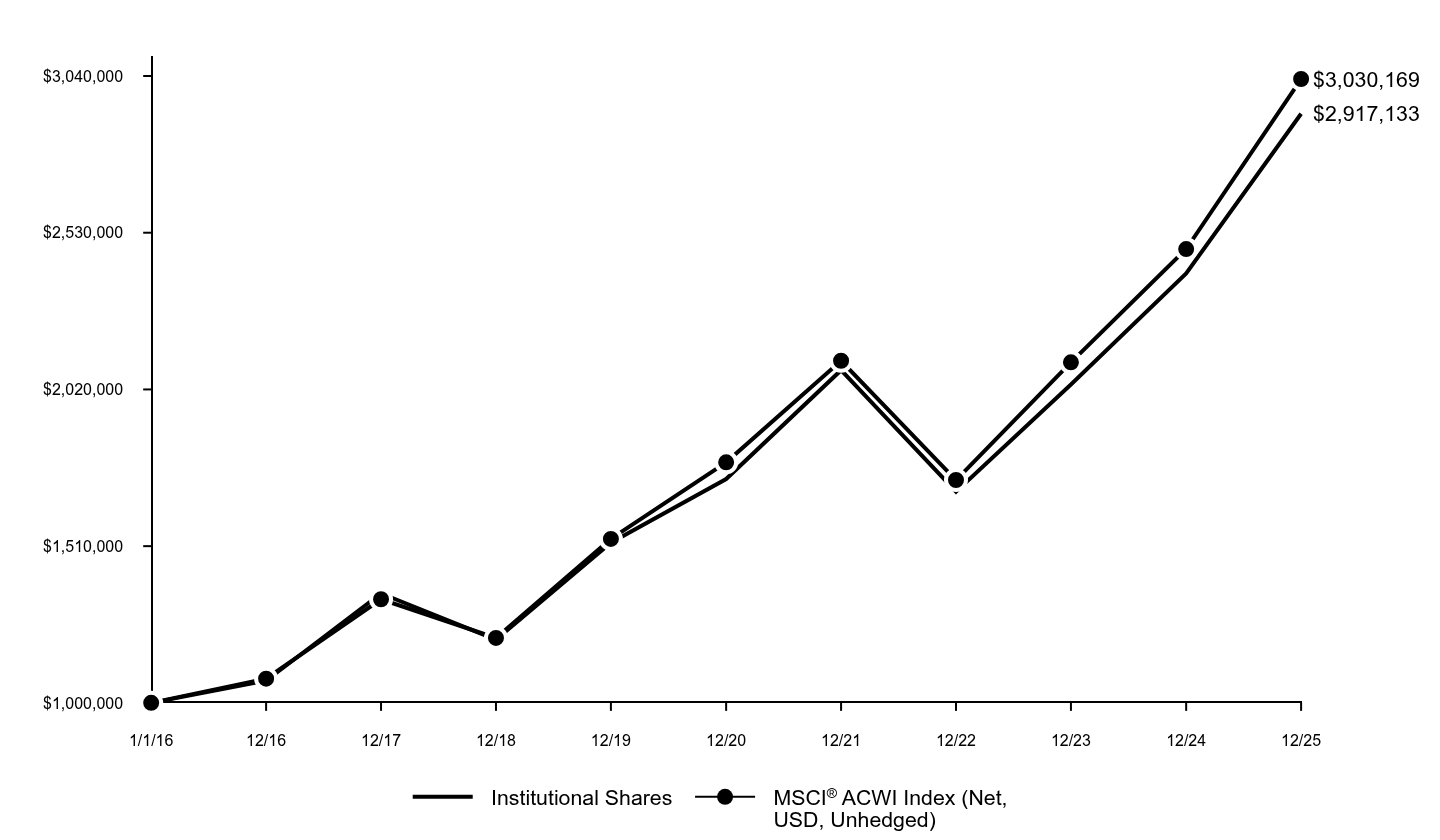
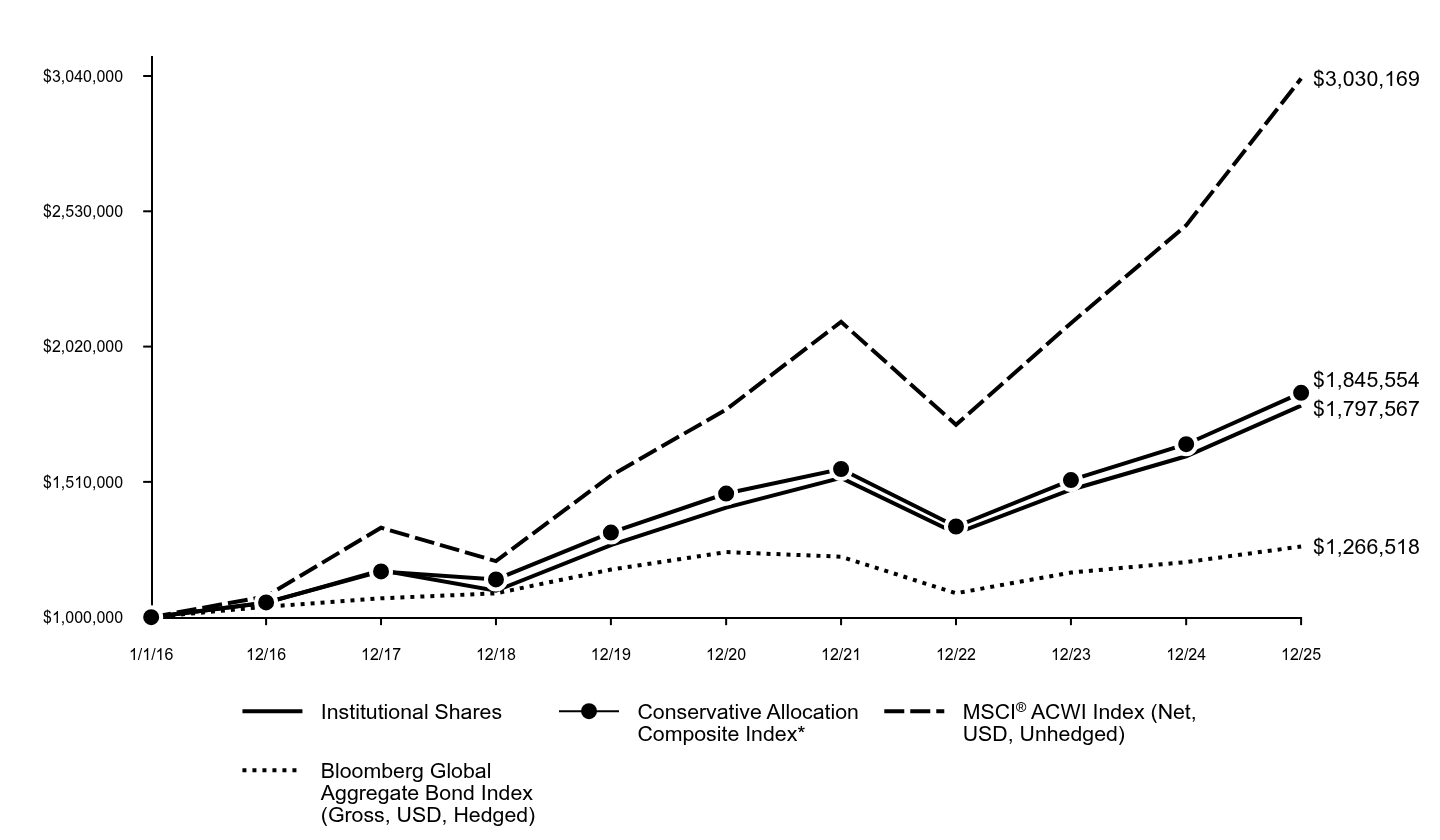
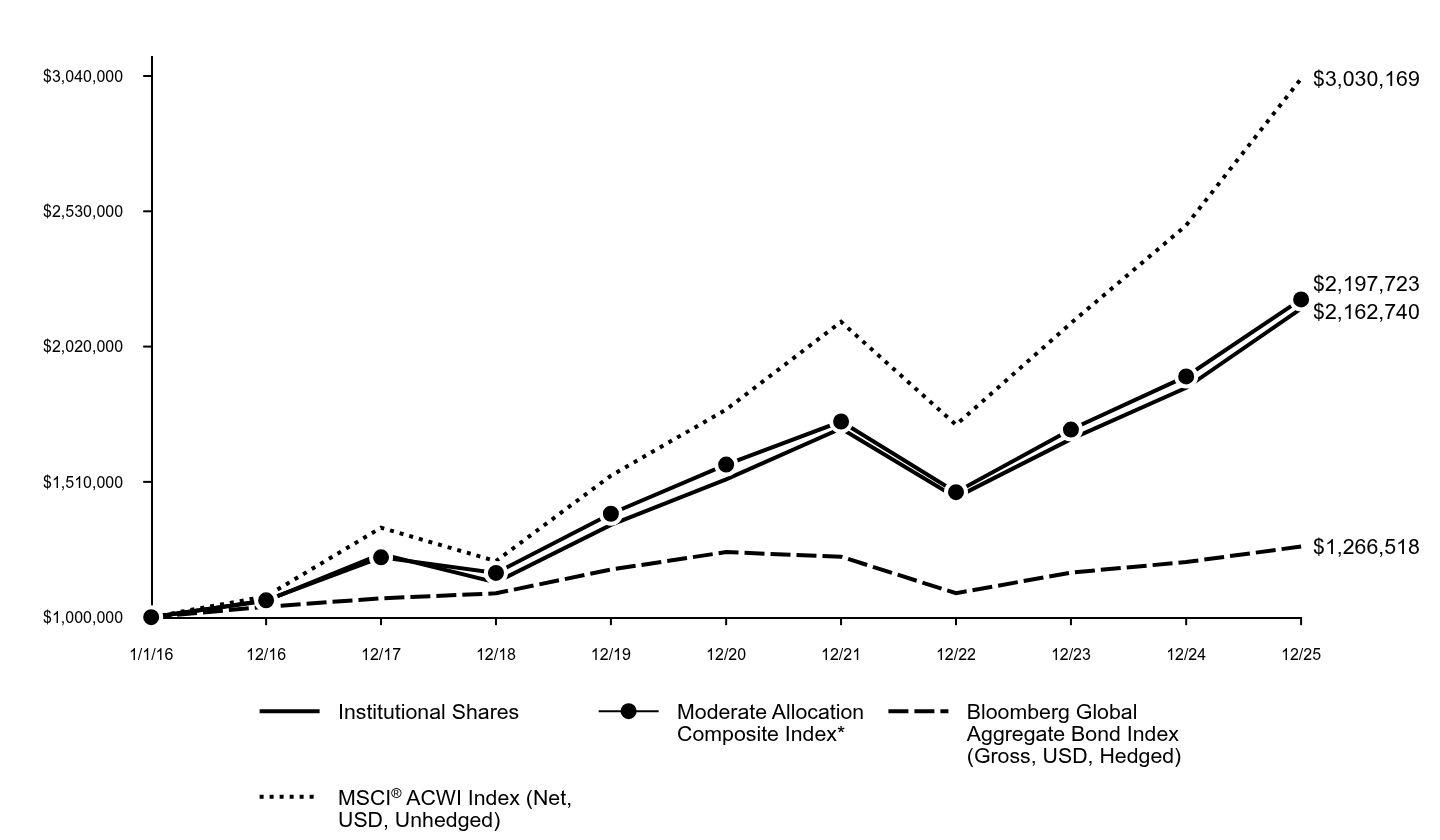
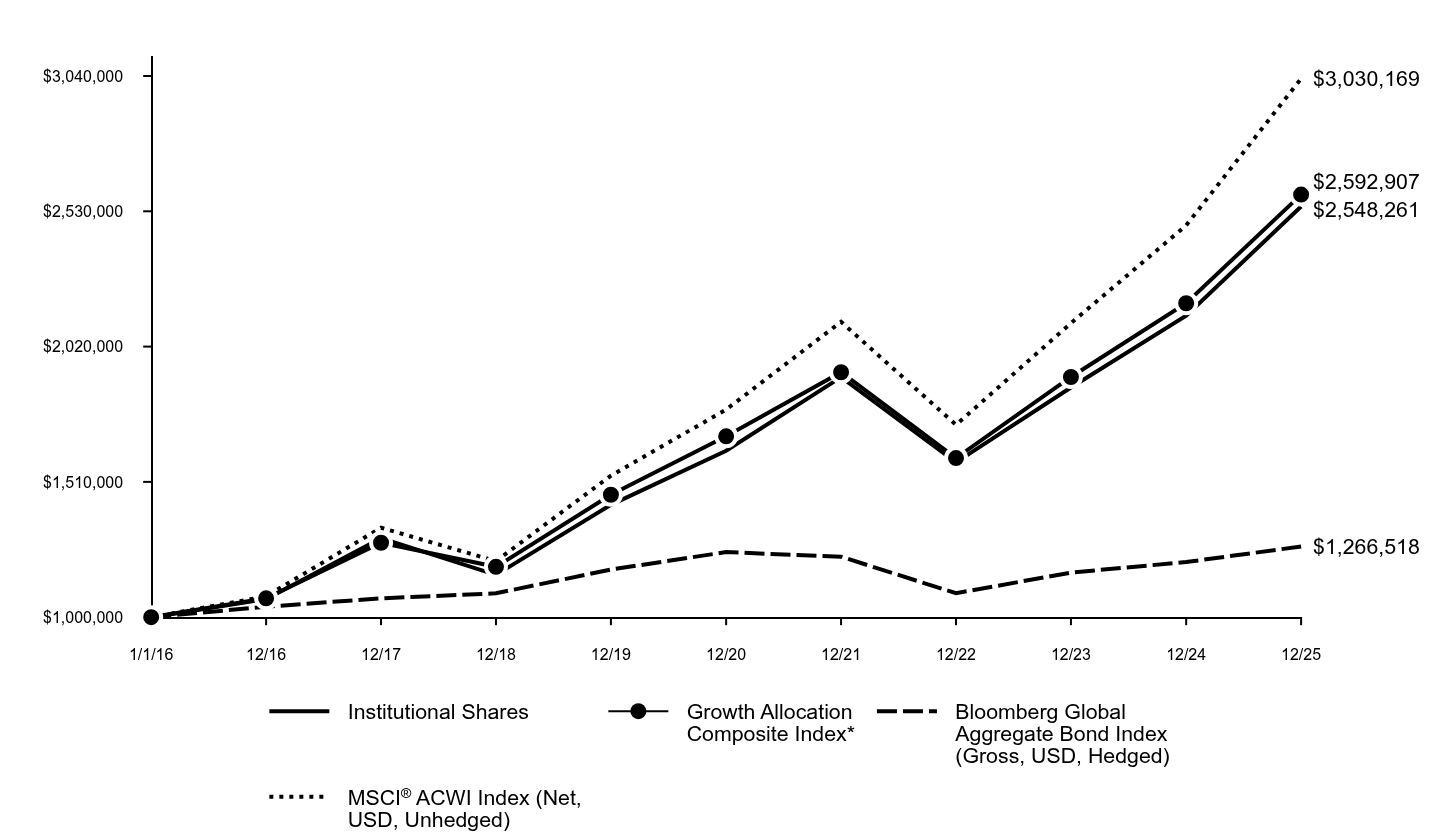
| Line Graph [Table Text Block] |
|
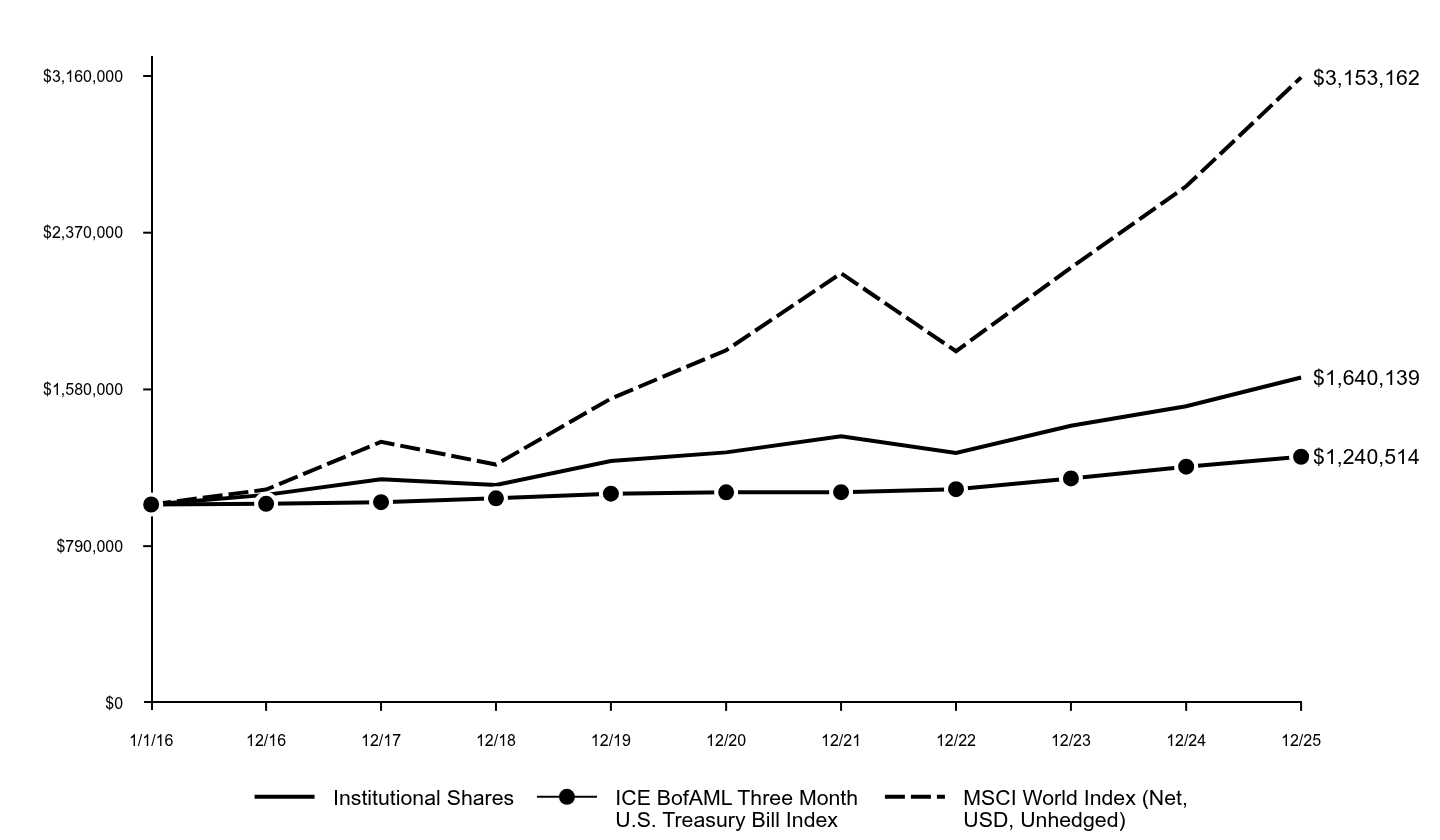
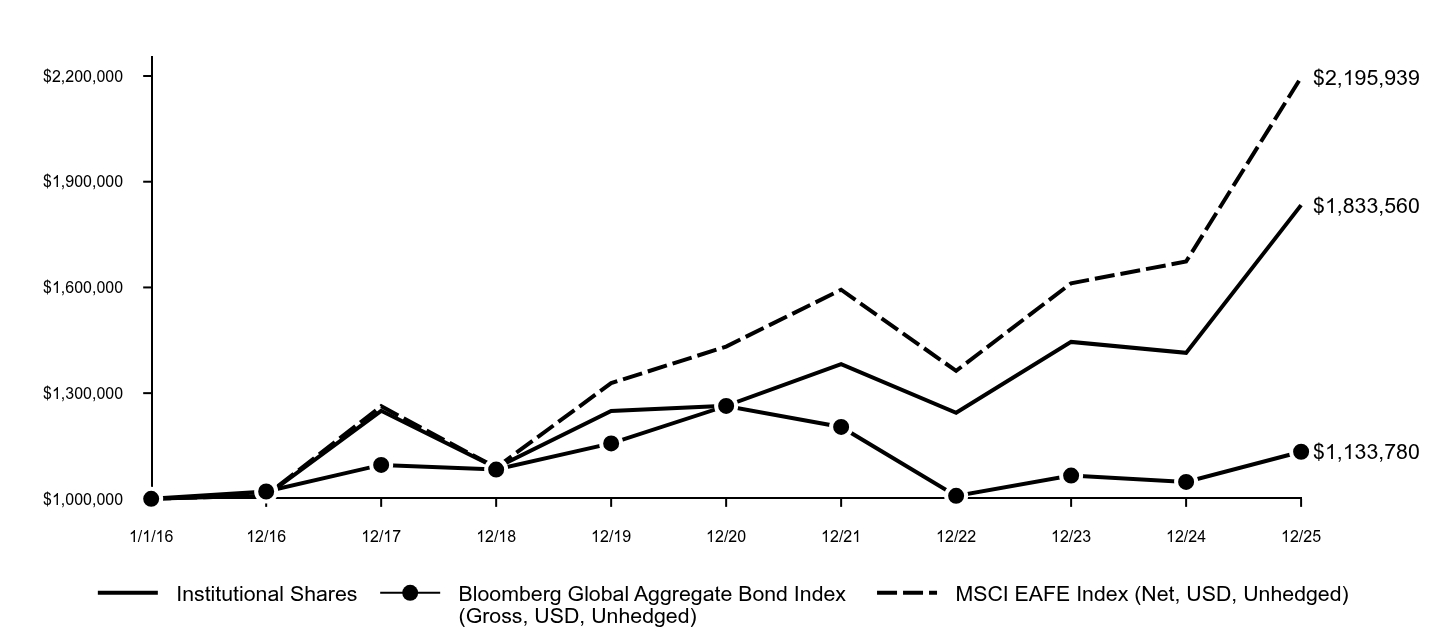
Institutional Shares |
ICE BofAML Three Month U.S. Treasury Bill Index |
MSCI World Index (Net, USD, Unhedged) |
1/1/16 |
$1,000,000 |
$1,000,000 |
$1,000,000 |
12/16 |
$1,048,400 |
$1,003,271 |
$1,075,105 |
12/17 |
$1,126,611 |
$1,011,859 |
$1,315,932 |
12/18 |
$1,098,783 |
$1,030,826 |
$1,201,295 |
12/19 |
$1,218,661 |
$1,054,316 |
$1,533,694 |
12/20 |
$1,262,654 |
$1,061,349 |
$1,777,589 |
12/21 |
$1,344,474 |
$1,061,871 |
$2,165,410 |
12/22 |
$1,260,176 |
$1,077,326 |
$1,772,570 |
12/23 |
$1,396,653 |
$1,131,354 |
$2,194,214 |
12/24 |
$1,494,977 |
$1,190,771 |
$2,603,894 |
12/25 |
$1,640,139 |
$1,240,514 |
$3,153,162 |
|
| Average Annual Return [Table Text Block] |
AATR |
1 Year |
5 Years |
10 Years |
Institutional Shares |
9.71% |
5.37% |
5.07% |
ICE BofAML Three Month U.S. Treasury Bill Index |
4.18% |
3.17% |
2.18% |
MSCI World Index (Net, USD, Unhedged) |
21.09% |
12.14% |
12.16% | |
| AssetsNet |
$ 5,560,131,787
|
| Holdings Count | Holding |
3,137
|
| Advisory Fees Paid, Amount |
$ 29,881,927
|
| InvestmentCompanyPortfolioTurnover |
134.00%
|
| Additional Fund Statistics [Text Block] |
Total Net Assets as of Period End |
$5,560,131,787 |
# of Portfolio Holdings as of Period End |
3,137 |
Portfolio Turnover Rate for the Period |
134% |
Total Net Advisory Fees Paid for the Period |
$29,881,927 | |
| Holdings [Text Block] |
Asset Class Exposure (%)*
Header |
Gross |
Long |
Short |
Net |
Cash and Short-Term Investments |
152.5 |
88.6 |
63.9 |
24.6 |
Commodities |
3.5 |
1.9 |
1.6 |
0.4 |
Convertible Securities |
2.4 |
2.4 |
- |
2.4 |
Credit |
14.5 |
14.5 |
- |
14.5 |
Developed Markets Currency |
2.7 |
1.3 |
1.4 |
-0.1 |
Developed Markets Equity Volatility |
7.5 |
1.8 |
5.7 |
-3.9 |
Developed Markets ex US Equity |
14.8 |
12.2 |
2.6 |
9.6 |
Developed markets FI volatility |
1.5 |
1.5 |
- |
1.5 |
Emerging Markets Currency |
3.8 |
2.0 |
1.7 |
0.3 |
Emerging Markets Equity |
8.4 |
8.4 |
- |
8.4 |
Global Real Estate |
0.2 |
0.2 |
- |
0.2 |
Interest rate |
0.8 |
0.2 |
0.6 |
-0.5 |
Long-Term Fixed Income |
10.2 |
5.0 |
5.2 |
-0.1 |
Medium-Term Fixed Income |
2.0 |
1.4 |
0.6 |
0.8 |
Preferred |
3.1 |
3.1 |
- |
3.1 |
Short-Term Fixed Income |
8.8 |
8.4 |
0.4 |
8.0 |
US Equity |
86.6 |
57.3 |
29.2 |
28.1 | * Asset class exposure includes the impact of derivatives. "Gross Exposure" represents the sum of the absolute value of long and short notional contract values in U.S. dollars of the Fund's positions (for a given asset class), divided by the Fund's net assets exposure within each asset class. "Net Exposure" represents the net exposure within the Fund to a given asset class, calculated as the difference between long and short exposures. The exposure of option contracts is delta-adjusted. Forward foreign currency exchange contracts for individual currency crosses are aggregated by settlement date and counterparty in the determination of gross exposure. Fixed income exposures are duration-adjusted to the 10-year reference rate of each respective country. |
| Material Fund Change [Text Block] |
|
| Updated Prospectus Phone Number |
1-800-621-2550
|
| Updated Prospectus Web Address |
<span style="box-sizing: border-box; color: rgb(0, 0, 0); display: inline; flex-wrap: nowrap; font-size: 12px; font-weight: 400; grid-area: auto; line-height: 18px; margin: 0px; overflow: visible; text-align: left; text-align-last: auto; white-space-collapse: preserve-breaks;">dfinview.com/GoldmanSachs</span>
|
| C000066744 |
|
| Shareholder Report [Line Items] |
|
| Fund Name |
Goldman Sachs Absolute Return Tracker Fund
|
| Class Name |
Investor Class
|
| Trading Symbol |
GSRTX
|
| Annual or Semi-Annual Statement [Text Block] |
This annual shareholder report contains important information about Goldman Sachs Absolute Return Tracker Fund (the “Fund”) for the period of January 1, 2025 to December 31, 2025 (the “Period”).
|
| Additional Information [Text Block] |
You can find additional information about the Fund at am.gs.com or dfinview.com/GoldmanSachs. You can also request this information by contacting us at 1-800-526-7384.
|
| Additional Information Phone Number |
1-800-526-7384
|
| Additional Information Website |
<span style="box-sizing: border-box; color: rgb(0, 0, 0); display: inline; flex-wrap: nowrap; font-size: 12px; font-weight: 400; grid-area: auto; line-height: 18px; margin: 0px; overflow: visible; text-align: left; text-align-last: auto; white-space-collapse: preserve-breaks;">am.gs.com</span>
|
| Expenses [Text Block] |
What were the Fund costs for the Period?Based on a hypothetical $10,000 investment.
Class |
Costs of a $10,000 investment |
Costs paid as a percentage of a $10,000 investment |
Investor |
$80 |
0.76% | |
| Expenses Paid, Amount |
$ 80
|
| Expense Ratio, Percent |
0.76%
|
| Factors Affecting Performance [Text Block] |
How did the Fund perform and what affected its performance?Virtually all asset classes were impacted by U.S. monetary policy, inflation expectations, tariffs, AI, geopolitics, and commodity and currency movements. Hedge funds generally posted positive returns, led by equity long/short strategies. Relative value, global macro and event-driven hedge fund strategies also performed well. |
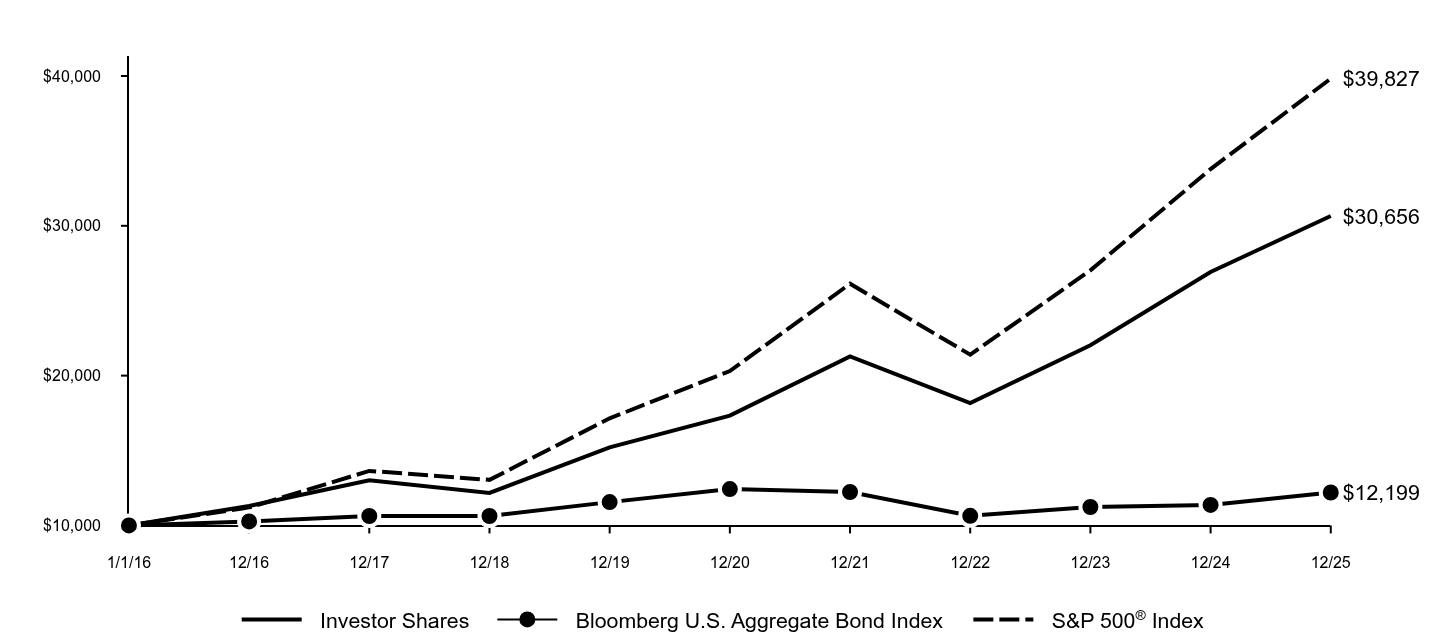
| Performance Past Does Not Indicate Future [Text] |
Performance data quoted above represents past performance. Past performance does not guarantee future results.
|
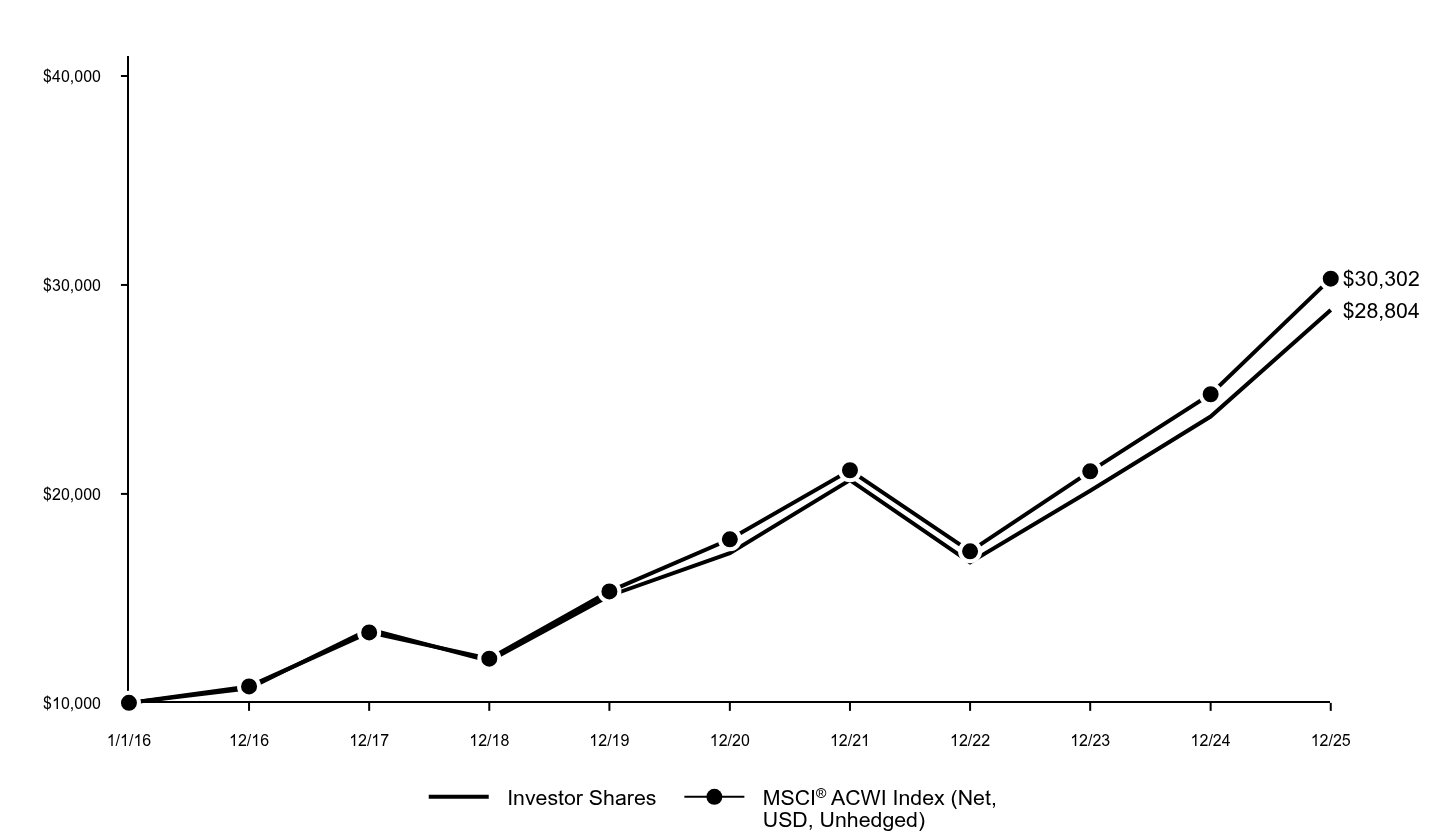
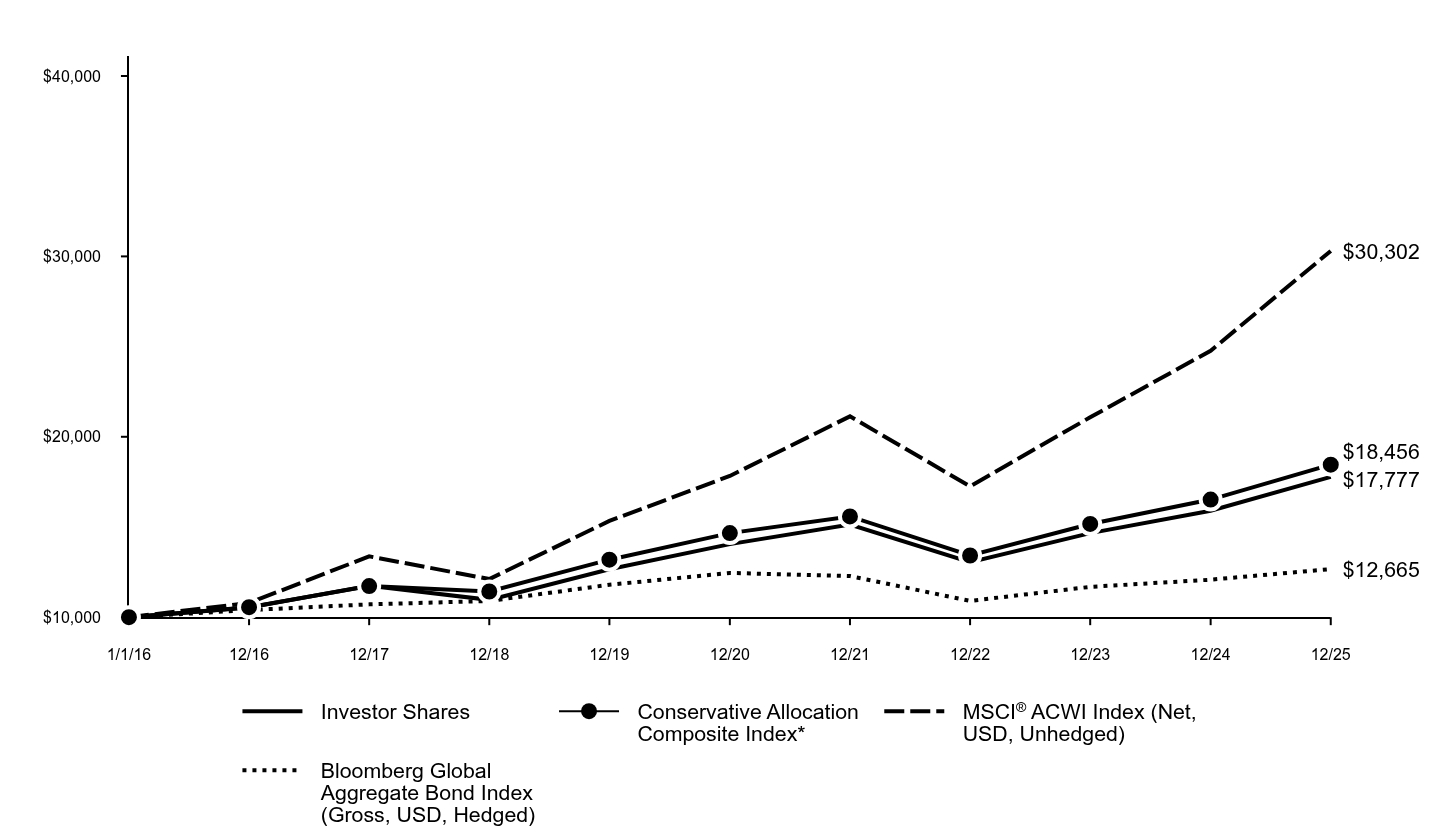
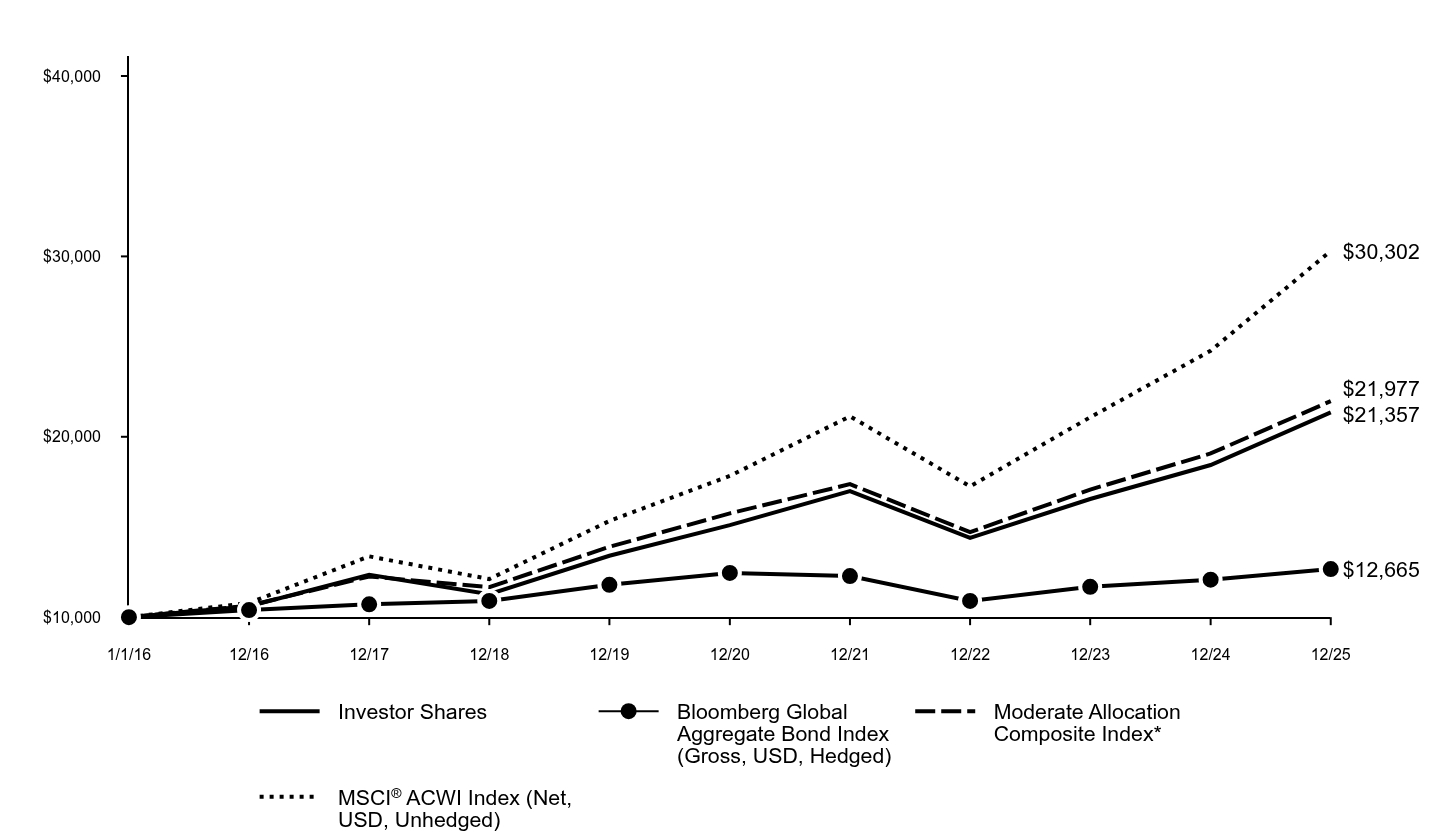
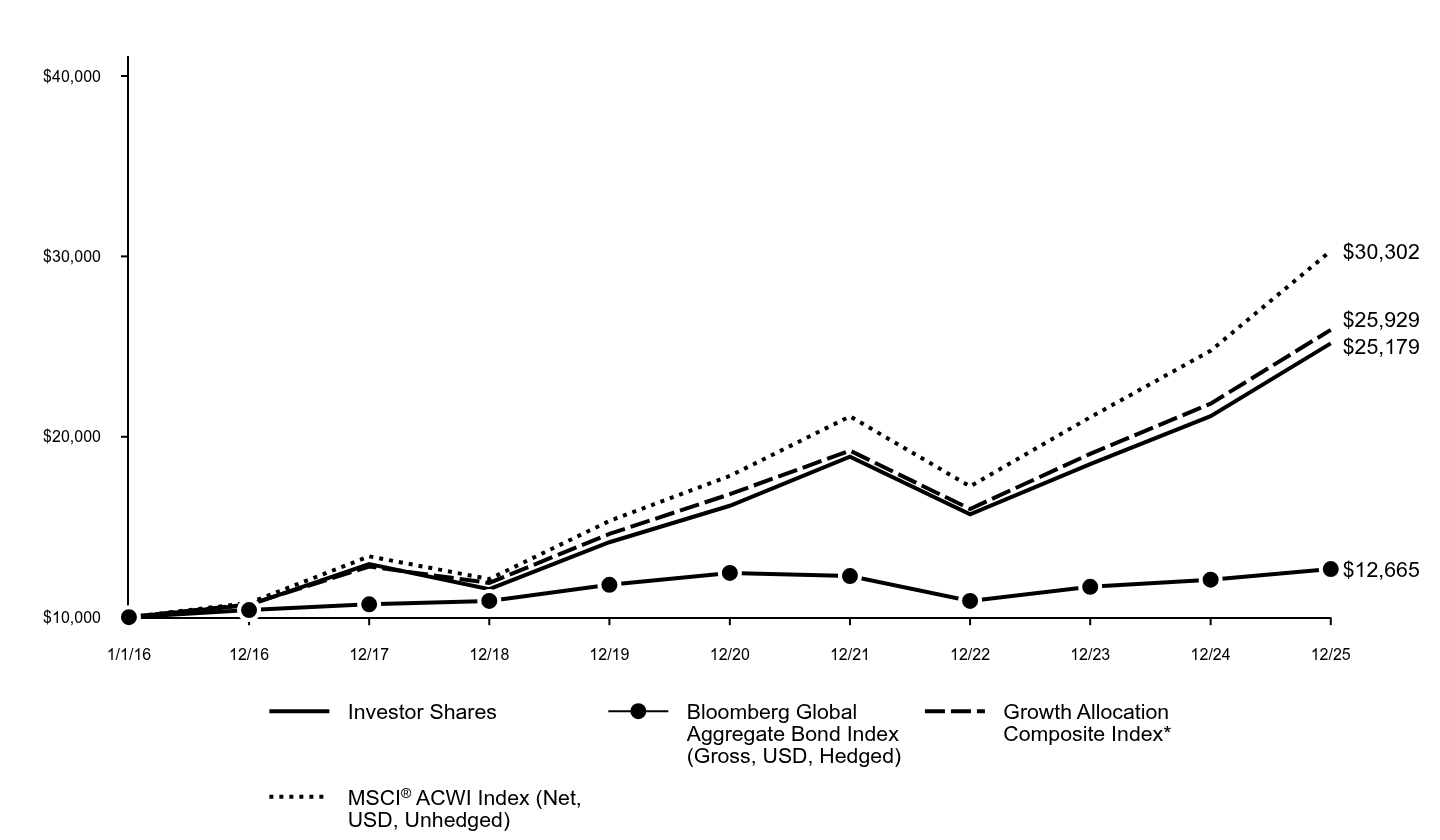
| Line Graph [Table Text Block] |
|
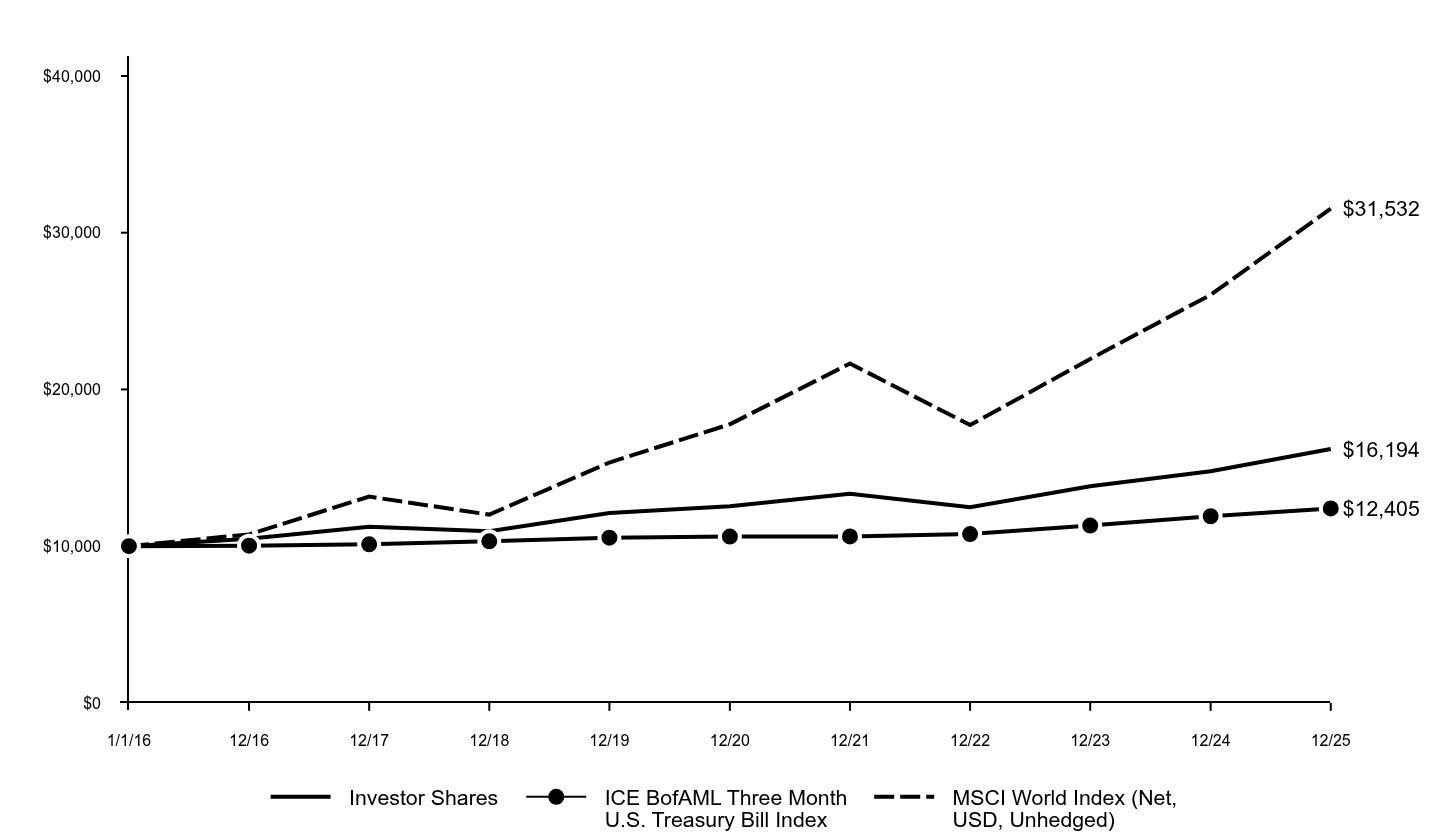
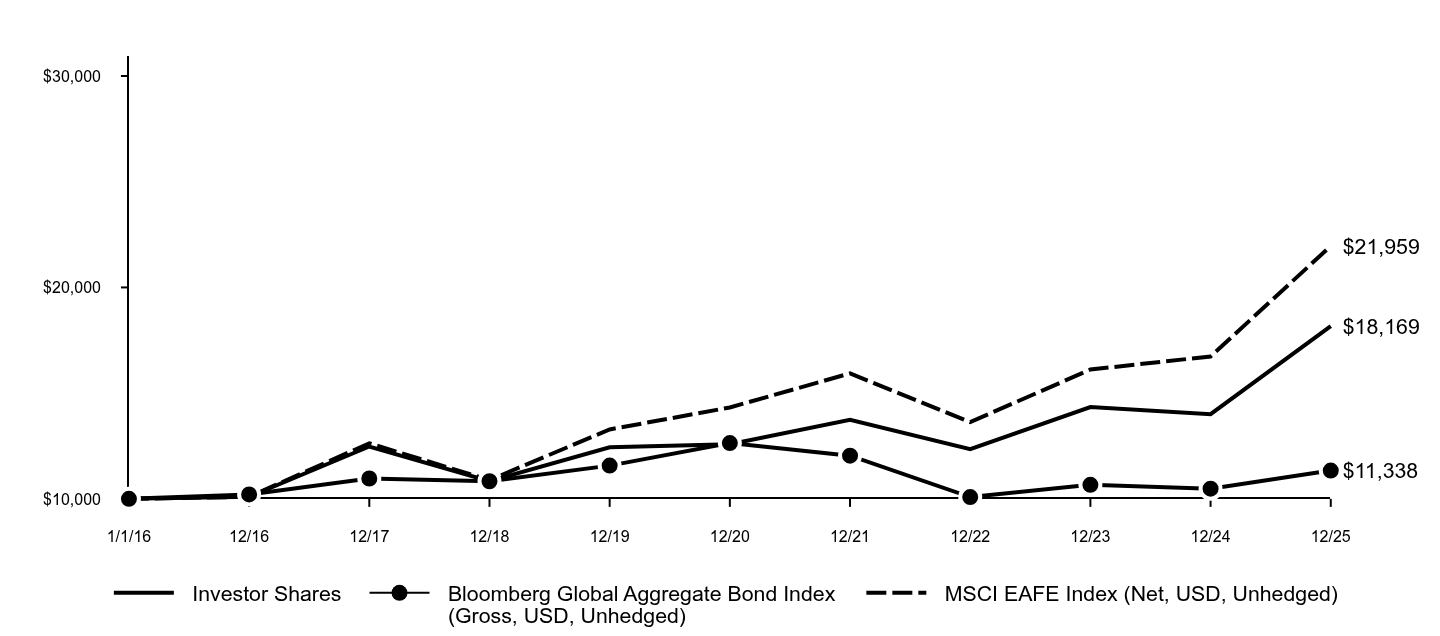
Investor Shares |
ICE BofAML Three Month U.S. Treasury Bill Index |
MSCI World Index (Net, USD, Unhedged) |
1/1/16 |
$10,000 |
$10,000 |
$10,000 |
12/16 |
$10,477 |
$10,033 |
$10,751 |
12/17 |
$11,237 |
$10,119 |
$13,159 |
12/18 |
$10,947 |
$10,308 |
$12,013 |
12/19 |
$12,114 |
$10,543 |
$15,337 |
12/20 |
$12,544 |
$10,613 |
$17,776 |
12/21 |
$13,340 |
$10,619 |
$21,654 |
12/22 |
$12,490 |
$10,773 |
$17,726 |
12/23 |
$13,824 |
$11,314 |
$21,942 |
12/24 |
$14,782 |
$11,908 |
$26,039 |
12/25 |
$16,194 |
$12,405 |
$31,532 |
|
| Average Annual Return [Table Text Block] |
AATR |
1 Year |
5 Years |
10 Years |
Investor Shares |
9.55% |
5.24% |
4.94% |
ICE BofAML Three Month U.S. Treasury Bill Index |
4.18% |
3.17% |
2.18% |
MSCI World Index (Net, USD, Unhedged) |
21.09% |
12.14% |
12.16% | |
| AssetsNet |
$ 5,560,131,787
|
| Holdings Count | Holding |
3,137
|
| Advisory Fees Paid, Amount |
$ 29,881,927
|
| InvestmentCompanyPortfolioTurnover |
134.00%
|
| Additional Fund Statistics [Text Block] |
Total Net Assets as of Period End |
$5,560,131,787 |
# of Portfolio Holdings as of Period End |
3,137 |
Portfolio Turnover Rate for the Period |
134% |
Total Net Advisory Fees Paid for the Period |
$29,881,927 | |
| Holdings [Text Block] |
Asset Class Exposure (%)*
Header |
Gross |
Long |
Short |
Net |
Cash and Short-Term Investments |
152.5 |
88.6 |
63.9 |
24.6 |
Commodities |
3.5 |
1.9 |
1.6 |
0.4 |
Convertible Securities |
2.4 |
2.4 |
- |
2.4 |
Credit |
14.5 |
14.5 |
- |
14.5 |
Developed Markets Currency |
2.7 |
1.3 |
1.4 |
-0.1 |
Developed Markets Equity Volatility |
7.5 |
1.8 |
5.7 |
-3.9 |
Developed Markets ex US Equity |
14.8 |
12.2 |
2.6 |
9.6 |
Developed markets FI volatility |
1.5 |
1.5 |
- |
1.5 |
Emerging Markets Currency |
3.8 |
2.0 |
1.7 |
0.3 |
Emerging Markets Equity |
8.4 |
8.4 |
- |
8.4 |
Global Real Estate |
0.2 |
0.2 |
- |
0.2 |
Interest rate |
0.8 |
0.2 |
0.6 |
-0.5 |
Long-Term Fixed Income |
10.2 |
5.0 |
5.2 |
-0.1 |
Medium-Term Fixed Income |
2.0 |
1.4 |
0.6 |
0.8 |
Preferred |
3.1 |
3.1 |
- |
3.1 |
Short-Term Fixed Income |
8.8 |
8.4 |
0.4 |
8.0 |
US Equity |
86.6 |
57.3 |
29.2 |
28.1 | * Asset class exposure includes the impact of derivatives. "Gross Exposure" represents the sum of the absolute value of long and short notional contract values in U.S. dollars of the Fund's positions (for a given asset class), divided by the Fund's net assets exposure within each asset class. "Net Exposure" represents the net exposure within the Fund to a given asset class, calculated as the difference between long and short exposures. The exposure of option contracts is delta-adjusted. Forward foreign currency exchange contracts for individual currency crosses are aggregated by settlement date and counterparty in the determination of gross exposure. Fixed income exposures are duration-adjusted to the 10-year reference rate of each respective country. |
| Material Fund Change [Text Block] |
|
| Updated Prospectus Phone Number |
1-800-526-7384
|
| Updated Prospectus Web Address |
<span style="box-sizing: border-box; color: rgb(0, 0, 0); display: inline; flex-wrap: nowrap; font-size: 12px; font-weight: 400; grid-area: auto; line-height: 18px; margin: 0px; overflow: visible; text-align: left; text-align-last: auto; white-space-collapse: preserve-breaks;">dfinview.com/GoldmanSachs</span>
|
| C000043358 |
|
| Shareholder Report [Line Items] |
|
| Fund Name |
Goldman Sachs Commodity Strategy Fund
|
| Class Name |
Class A
|
| Trading Symbol |
GSCAX
|
| Annual or Semi-Annual Statement [Text Block] |
This annual shareholder report contains important information about Goldman Sachs Commodity Strategy Fund (the “Fund”) for the period of January 1, 2025 to December 31, 2025 (the “Period”).
|
| Additional Information [Text Block] |
You can find additional information about the Fund at am.gs.com or dfinview.com/GoldmanSachs. You can also request this information by contacting us at 1-800-526-7384.
|
| Material Fund Change Notice [Text Block] |
This report describes changes to the Fund that occurred during the Period.
|
| Additional Information Phone Number |
1-800-526-7384
|
| Additional Information Website |
<span style="box-sizing: border-box; color: rgb(0, 0, 0); display: inline; flex-wrap: nowrap; font-size: 12px; font-weight: 400; grid-area: auto; line-height: 18px; margin: 0px; overflow: visible; text-align: left; text-align-last: auto; white-space-collapse: preserve-breaks;">am.gs.com</span>
|
| Expenses [Text Block] |
What were the Fund costs for the Period?Based on a hypothetical $10,000 investment.
Class |
Costs of a $10,000 investment |
Costs paid as a percentage of a $10,000 investment |
A |
$100 |
0.93% | |
| Expenses Paid, Amount |
$ 100
|
| Expense Ratio, Percent |
0.93%
|
| Factors Affecting Performance [Text Block] |
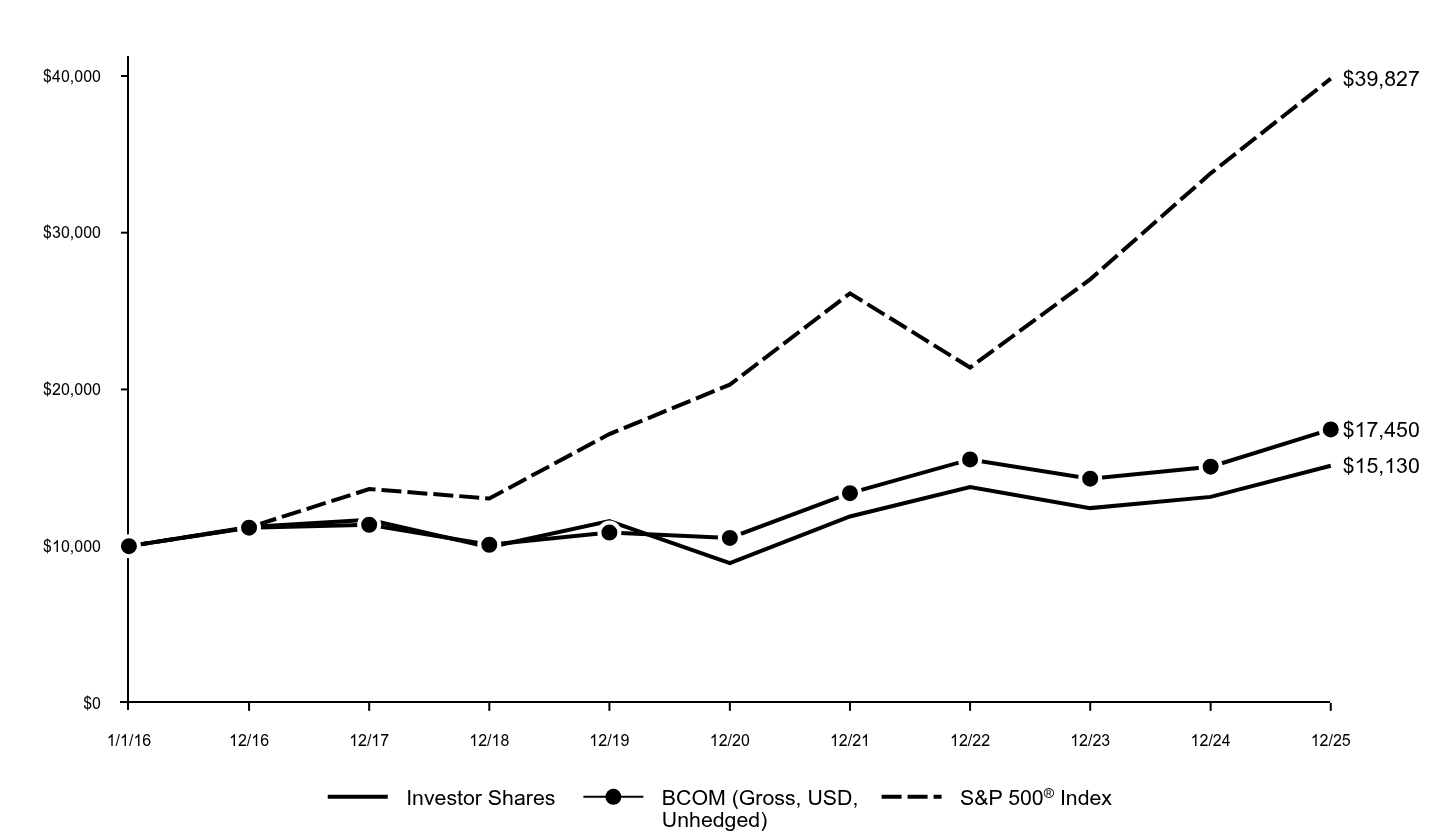
How did the Fund perform and what affected its performance?Aggressive U.S. trade policies, tariffs, deregulation, supply/demand shocks and constraints, U.S. and international monetary policy, currency dynamics, China’s economic trajectory, geopolitical developments and weather anomalies led to bifurcated commodities markets in 2025 wherein gains in metals and livestock offset weakness in energy and agriculture. |
| Performance Past Does Not Indicate Future [Text] |
Performance data quoted above represents past performance. Past performance does not guarantee future results.
|
| Line Graph [Table Text Block] |
|
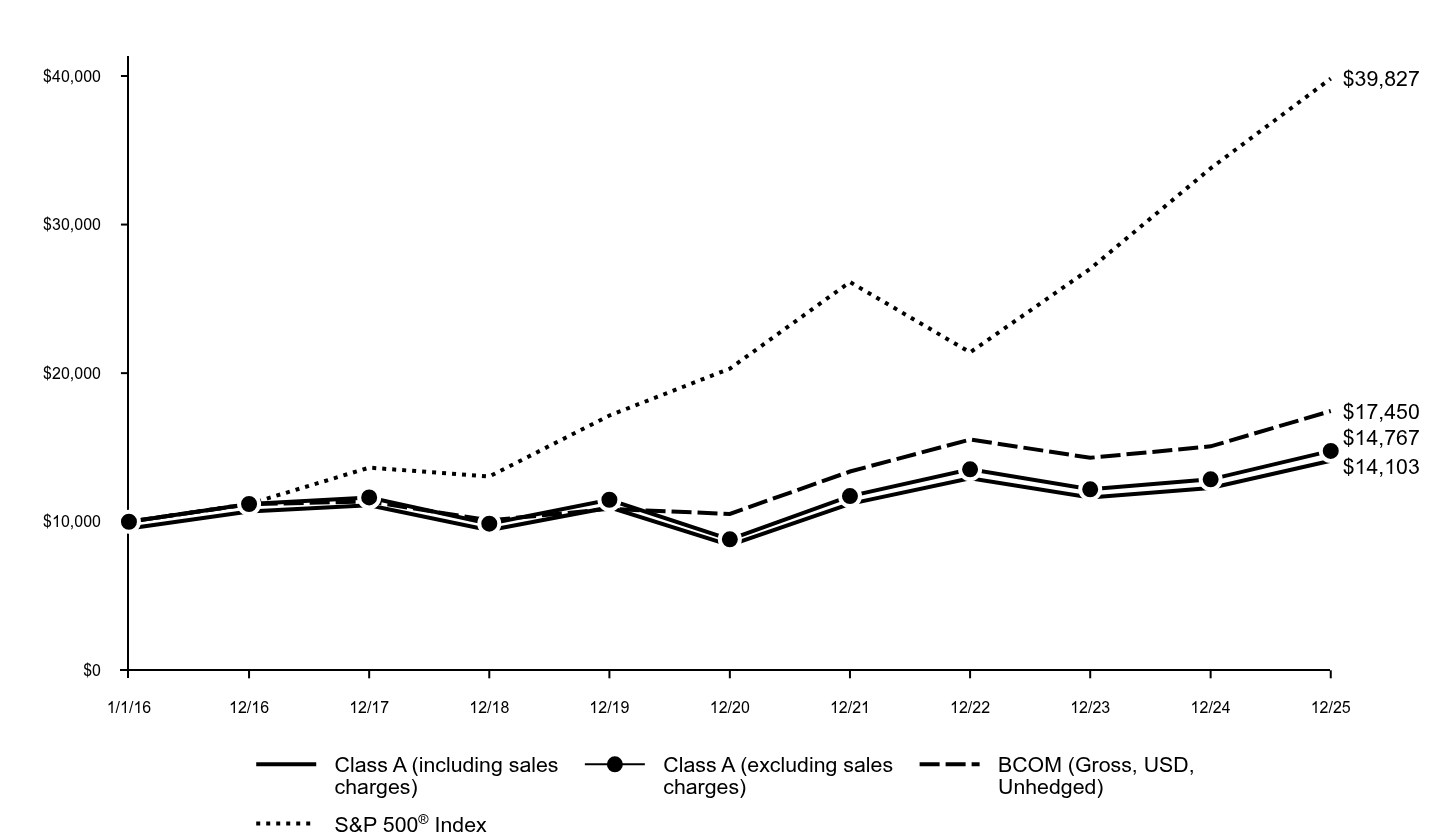
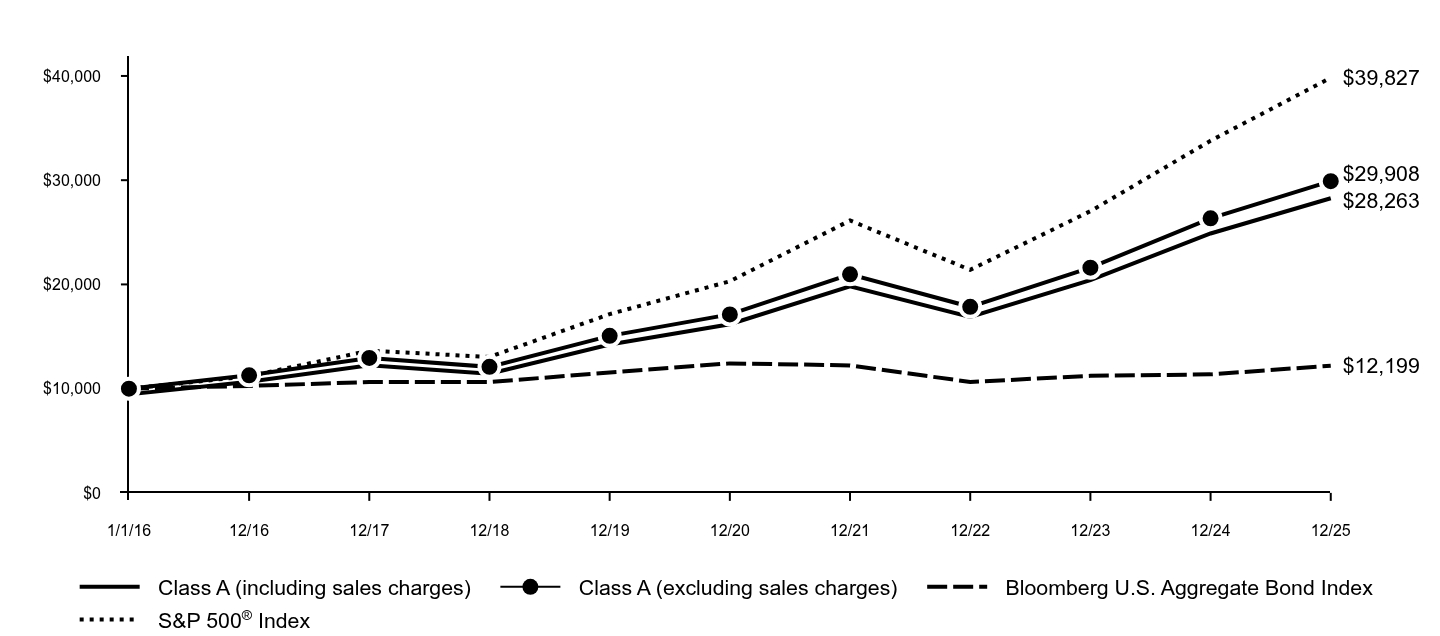
Class A (including sales charges) |
Class A (excluding sales charges) |
BCOM (Gross, USD, Unhedged) |
S&P 500® Index |
1/1/16 |
$9,550 |
$10,000 |
$10,000 |
$10,000 |
12/16 |
$10,690 |
$11,194 |
$11,177 |
$11,196 |
12/17 |
$11,111 |
$11,635 |
$11,367 |
$13,640 |
12/18 |
$9,426 |
$9,870 |
$10,089 |
$13,042 |
12/19 |
$10,963 |
$11,480 |
$10,865 |
$17,149 |
12/20 |
$8,419 |
$8,815 |
$10,525 |
$20,304 |
12/21 |
$11,199 |
$11,727 |
$13,379 |
$26,132 |
12/22 |
$12,920 |
$13,528 |
$15,532 |
$21,399 |
12/23 |
$11,634 |
$12,182 |
$14,303 |
$27,025 |
12/24 |
$12,274 |
$12,852 |
$15,072 |
$33,786 |
12/25 |
$14,103 |
$14,767 |
$17,450 |
$39,827 |
|
| Average Annual Return [Table Text Block] |
AATR |
1 Year |
5 Years |
10 Years |
Class A |
14.90% |
10.86% |
3.97% |
Class A including sales charges |
9.68% |
9.84% |
3.50% |
BCOM (Gross, USD, Unhedged) |
15.77% |
10.63% |
5.72% |
S&P 500® Index |
17.88% |
14.42% |
14.81% | |
| AssetsNet |
$ 337,225,710
|
| Holdings Count | Holding |
73
|
| Advisory Fees Paid, Amount |
$ 1,659,455
|
| InvestmentCompanyPortfolioTurnover |
0.00%
|
| Additional Fund Statistics [Text Block] |
Total Net Assets as of Period End |
$337,225,710 |
# of Portfolio Holdings as of Period End |
73 |
Portfolio Turnover Rate for the Period |
0% |
Total Net Advisory Fees Paid for the Period |
$1,659,455 | |
| Holdings [Text Block] |
Header |
Gross |
Long |
Short |
Net |
Energy |
34.3 |
29.3 |
-5.0 |
24.3 |
Agriculture |
28.7 |
28.0 |
-0.7 |
27.3 |
Precious Metals |
28.2 |
28.2 |
- |
28.2 |
Industrial Metals |
16.1 |
15.7 |
-0.4 |
15.2 |
Livestock |
5.0 |
5.0 |
- |
5.0 | * Sector exposure includes the impact of derivatives. "Gross Exposure" represents the sum of the absolute value of long and short notional contract values in U.S. dollars of the Fund's positions (for a given sector), divided by the Fund's net assets exposure within each sector. "Net Exposure" represents the net exposure within the Fund to a given sector, calculated as the difference between long and short exposures. Short-term Investments include money market funds and U.S. Treasury Bills and generally represent the collateral for Fund's derivative positions. |
| Material Fund Change [Text Block] |
This is a summary of certain changes to the Fund for the Period. For more complete information, you may review the Fund's next prospectus, which we expect to be available by April 30, 2026 at dfinview.com/GoldmanSachs or upon request at 1-800-526-7384. Effective April 30, 2025, the Fund’s Investment Adviser agreed to reduce or limit “Other Expenses” (excluding acquired fund fees and expenses, transfer agency fees and expenses, service fees, taxes, dividend and interest expenses on short sales, interest, broker fees, expenses of shareholder meetings, litigation and indemnification, and extraordinary expenses) to 0.074% of the Fund’s average daily net assets. |
| Material Fund Change Expenses [Text Block] |
Effective April 30, 2025, the Fund’s Investment Adviser agreed to reduce or limit “Other Expenses” (excluding acquired fund fees and expenses, transfer agency fees and expenses, service fees, taxes, dividend and interest expenses on short sales, interest, broker fees, expenses of shareholder meetings, litigation and indemnification, and extraordinary expenses) to 0.074% of the Fund’s average daily net assets.
|
| Summary of Change Legend [Text Block] |
This is a summary of certain changes to the Fund for the Period. For more complete information, you may review the Fund's next prospectus, which we expect to be available by April 30, 2026 at dfinview.com/GoldmanSachs or upon request at 1-800-526-7384.
|
| Updated Prospectus Phone Number |
1-800-526-7384
|
| Updated Prospectus Web Address |
<span style="box-sizing: border-box; color: rgb(0, 0, 0); display: inline; flex-wrap: nowrap; font-size: 12px; font-weight: 400; grid-area: auto; line-height: 18px; margin: 0px; overflow: visible; text-align: left; text-align-last: auto; white-space-collapse: preserve-breaks;">dfinview.com/GoldmanSachs</span>
|
| C000043359 |
|
| Shareholder Report [Line Items] |
|
| Fund Name |
Goldman Sachs Commodity Strategy Fund
|
| Class Name |
Class C
|
| Trading Symbol |
GSCCX
|
| Annual or Semi-Annual Statement [Text Block] |
This annual shareholder report contains important information about Goldman Sachs Commodity Strategy Fund (the “Fund”) for the period of January 1, 2025 to December 31, 2025 (the “Period”).
|
| Additional Information [Text Block] |
You can find additional information about the Fund at am.gs.com or dfinview.com/GoldmanSachs. You can also request this information by contacting us at 1-800-526-7384.
|
| Material Fund Change Notice [Text Block] |
This report describes changes to the Fund that occurred during the Period.
|
| Additional Information Phone Number |
1-800-526-7384
|
| Additional Information Website |
<span style="box-sizing: border-box; color: rgb(0, 0, 0); display: inline; flex-wrap: nowrap; font-size: 12px; font-weight: 400; grid-area: auto; line-height: 18px; margin: 0px; overflow: visible; text-align: left; text-align-last: auto; white-space-collapse: preserve-breaks;">am.gs.com</span>
|
| Expenses [Text Block] |
What were the Fund costs for the Period?Based on a hypothetical $10,000 investment.
Class |
Costs of a $10,000 investment |
Costs paid as a percentage of a $10,000 investment |
C |
$180 |
1.68% | |
| Expenses Paid, Amount |
$ 180
|
| Expense Ratio, Percent |
1.68%
|
| Factors Affecting Performance [Text Block] |
How did the Fund perform and what affected its performance?Aggressive U.S. trade policies, tariffs, deregulation, supply/demand shocks and constraints, U.S. and international monetary policy, currency dynamics, China’s economic trajectory, geopolitical developments and weather anomalies led to bifurcated commodities markets in 2025 wherein gains in metals and livestock offset weakness in energy and agriculture. |
| Performance Past Does Not Indicate Future [Text] |
Performance data quoted above represents past performance. Past performance does not guarantee future results.
|
| Line Graph [Table Text Block] |
|
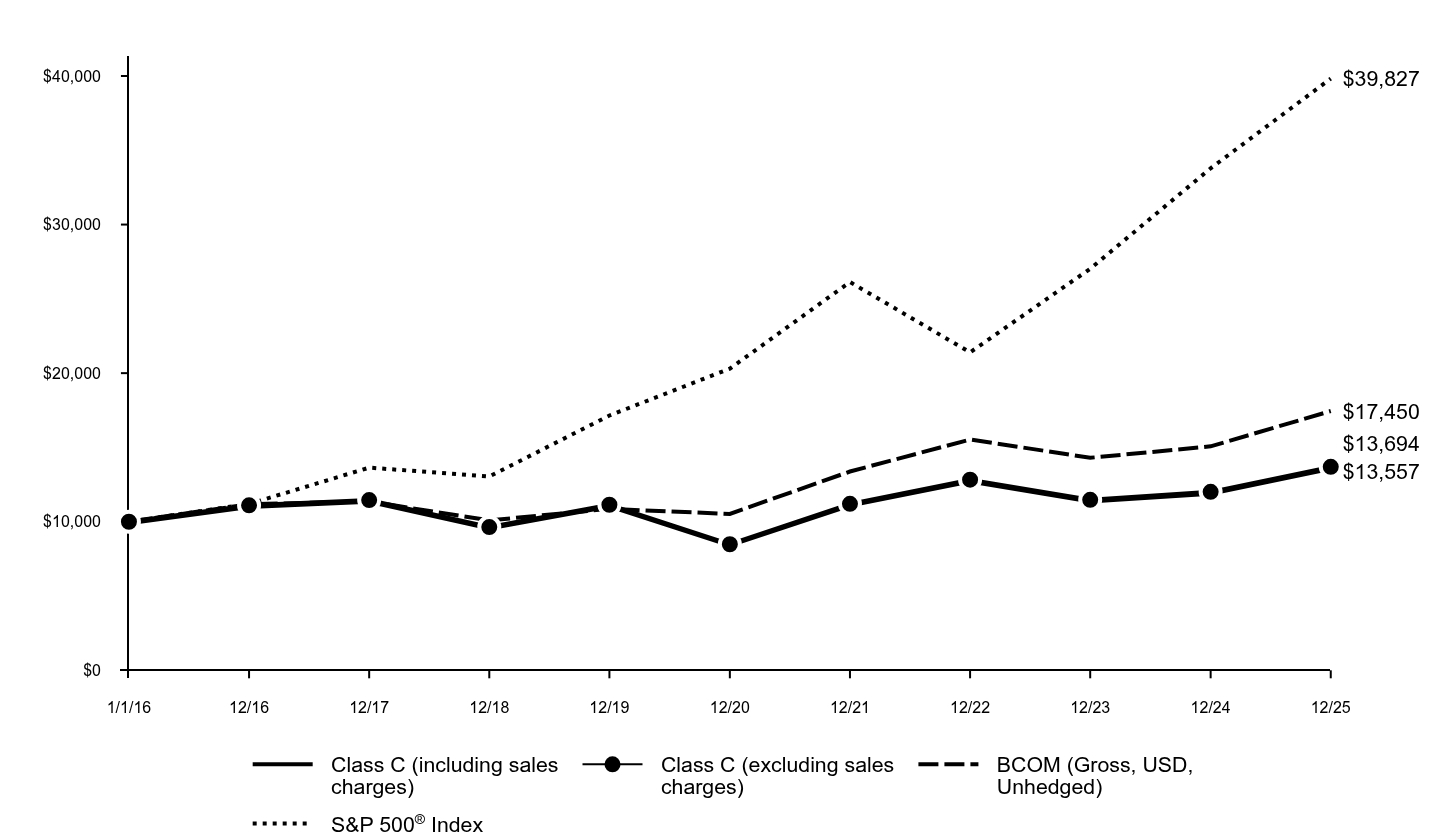
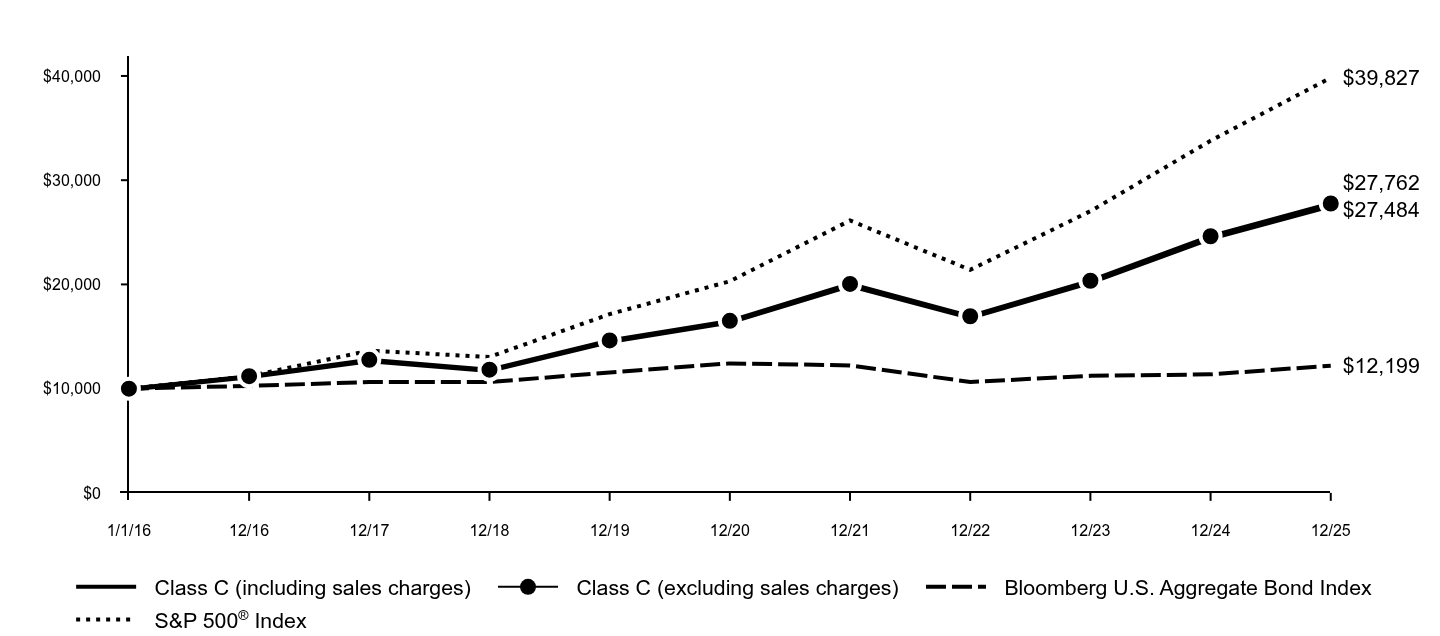
Class C (including sales charges) |
Class C (excluding sales charges) |
BCOM (Gross, USD, Unhedged) |
S&P 500® Index |
1/1/16 |
$9,900 |
$10,000 |
$10,000 |
$10,000 |
12/16 |
$10,995 |
$11,106 |
$11,177 |
$11,196 |
12/17 |
$11,342 |
$11,457 |
$11,367 |
$13,640 |
12/18 |
$9,546 |
$9,642 |
$10,089 |
$13,042 |
12/19 |
$11,029 |
$11,141 |
$10,865 |
$17,149 |
12/20 |
$8,401 |
$8,486 |
$10,525 |
$20,304 |
12/21 |
$11,093 |
$11,205 |
$13,379 |
$26,132 |
12/22 |
$12,702 |
$12,830 |
$15,532 |
$21,399 |
12/23 |
$11,358 |
$11,473 |
$14,303 |
$27,025 |
12/24 |
$11,890 |
$12,010 |
$15,072 |
$33,786 |
12/25 |
$13,557 |
$13,694 |
$17,450 |
$39,827 |
|
| Average Annual Return [Table Text Block] |
AATR |
1 Year |
5 Years |
10 Years |
Class C |
14.02% |
10.04% |
3.19% |
Class C including sales charges |
12.88% |
10.04% |
3.19% |
BCOM (Gross, USD, Unhedged) |
15.77% |
10.63% |
5.72% |
S&P 500® Index |
17.88% |
14.42% |
14.81% | |
| AssetsNet |
$ 337,225,710
|
| Holdings Count | Holding |
73
|
| Advisory Fees Paid, Amount |
$ 1,659,455
|
| InvestmentCompanyPortfolioTurnover |
0.00%
|
| Additional Fund Statistics [Text Block] |
Total Net Assets as of Period End |
$337,225,710 |
# of Portfolio Holdings as of Period End |
73 |
Portfolio Turnover Rate for the Period |
0% |
Total Net Advisory Fees Paid for the Period |
$1,659,455 | |
| Holdings [Text Block] |
Header |
Gross |
Long |
Short |
Net |
Energy |
34.3 |
29.3 |
-5.0 |
24.3 |
Agriculture |
28.7 |
28.0 |
-0.7 |
27.3 |
Precious Metals |
28.2 |
28.2 |
- |
28.2 |
Industrial Metals |
16.1 |
15.7 |
-0.4 |
15.2 |
Livestock |
5.0 |
5.0 |
- |
5.0 | * Sector exposure includes the impact of derivatives. "Gross Exposure" represents the sum of the absolute value of long and short notional contract values in U.S. dollars of the Fund's positions (for a given sector), divided by the Fund's net assets exposure within each sector. "Net Exposure" represents the net exposure within the Fund to a given sector, calculated as the difference between long and short exposures. Short-term Investments include money market funds and U.S. Treasury Bills and generally represent the collateral for Fund's derivative positions. |
| Material Fund Change [Text Block] |
This is a summary of certain changes to the Fund for the Period. For more complete information, you may review the Fund's next prospectus, which we expect to be available by April 30, 2026 at dfinview.com/GoldmanSachs or upon request at 1-800-526-7384. Effective April 30, 2025, the Fund’s Investment Adviser agreed to reduce or limit “Other Expenses” (excluding acquired fund fees and expenses, transfer agency fees and expenses, service fees, taxes, dividend and interest expenses on short sales, interest, broker fees, expenses of shareholder meetings, litigation and indemnification, and extraordinary expenses) to 0.074% of the Fund’s average daily net assets. |
| Material Fund Change Expenses [Text Block] |
Effective April 30, 2025, the Fund’s Investment Adviser agreed to reduce or limit “Other Expenses” (excluding acquired fund fees and expenses, transfer agency fees and expenses, service fees, taxes, dividend and interest expenses on short sales, interest, broker fees, expenses of shareholder meetings, litigation and indemnification, and extraordinary expenses) to 0.074% of the Fund’s average daily net assets.
|
| Summary of Change Legend [Text Block] |
This is a summary of certain changes to the Fund for the Period. For more complete information, you may review the Fund's next prospectus, which we expect to be available by April 30, 2026 at dfinview.com/GoldmanSachs or upon request at 1-800-526-7384.
|
| Updated Prospectus Phone Number |
1-800-526-7384
|
| Updated Prospectus Web Address |
<span style="box-sizing: border-box; color: rgb(0, 0, 0); display: inline; flex-wrap: nowrap; font-size: 12px; font-weight: 400; grid-area: auto; line-height: 18px; margin: 0px; overflow: visible; text-align: left; text-align-last: auto; white-space-collapse: preserve-breaks;">dfinview.com/GoldmanSachs</span>
|
| C000201770 |
|
| Shareholder Report [Line Items] |
|
| Fund Name |
Goldman Sachs Commodity Strategy Fund
|
| Class Name |
Class P
|
| Trading Symbol |
GGRPX
|
| Annual or Semi-Annual Statement [Text Block] |
This annual shareholder report contains important information about Goldman Sachs Commodity Strategy Fund (the “Fund”) for the period of January 1, 2025 to December 31, 2025 (the “Period”).
|
| Additional Information [Text Block] |
You can find additional information about the Fund at am.gs.com or dfinview.com/GoldmanSachs. You can also request this information by contacting us at 1-800-621-2550.
|
| Material Fund Change Notice [Text Block] |
This report describes changes to the Fund that occurred during the Period.
|
| Additional Information Phone Number |
1-800-621-2550
|
| Additional Information Website |
<span style="box-sizing: border-box; color: rgb(0, 0, 0); display: inline; flex-wrap: nowrap; font-size: 12px; font-weight: 400; grid-area: auto; line-height: 18px; margin: 0px; overflow: visible; text-align: left; text-align-last: auto; white-space-collapse: preserve-breaks;">am.gs.com</span>
|
| Expenses [Text Block] |
What were the Fund costs for the Period?Based on a hypothetical $10,000 investment.
Class |
Costs of a $10,000 investment |
Costs paid as a percentage of a $10,000 investment |
P |
$63 |
0.59% | |
| Expenses Paid, Amount |
$ 63
|
| Expense Ratio, Percent |
0.59%
|
| Factors Affecting Performance [Text Block] |
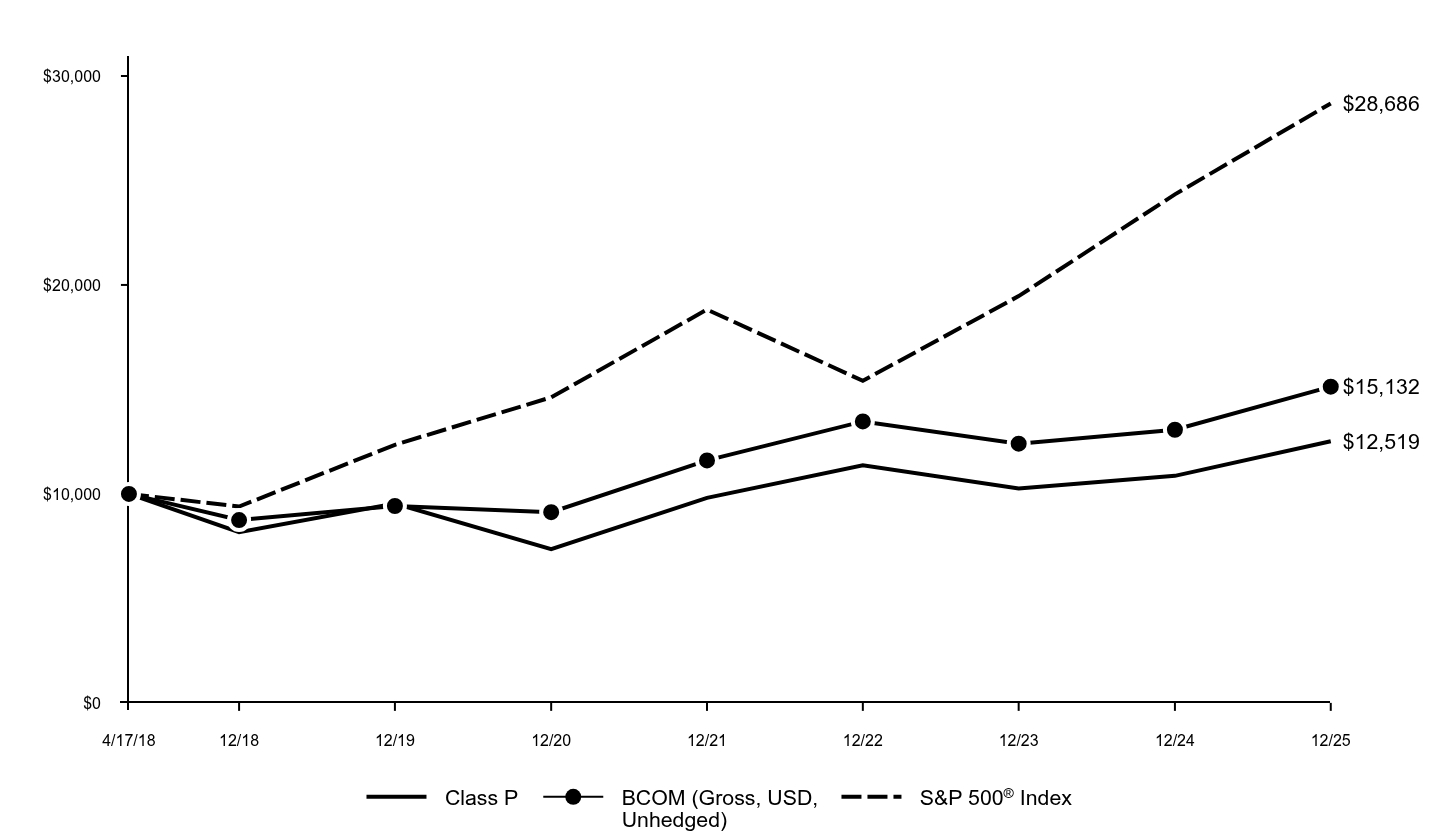
How did the Fund perform and what affected its performance?Aggressive U.S. trade policies, tariffs, deregulation, supply/demand shocks and constraints, U.S. and international monetary policy, currency dynamics, China’s economic trajectory, geopolitical developments and weather anomalies led to bifurcated commodities markets in 2025 wherein gains in metals and livestock offset weakness in energy and agriculture. |
| Performance Past Does Not Indicate Future [Text] |
Performance data quoted above represents past performance. Past performance does not guarantee future results.
|
| Line Graph [Table Text Block] |
|
Class P |
BCOM (Gross, USD, Unhedged) |
S&P 500® Index |
4/17/18 |
$10,000 |
$10,000 |
$10,000 |
12/18 |
$8,169 |
$8,749 |
$9,394 |
12/19 |
$9,536 |
$9,422 |
$12,351 |
12/20 |
$7,352 |
$9,127 |
$14,624 |
12/21 |
$9,812 |
$11,602 |
$18,822 |
12/22 |
$11,366 |
$13,469 |
$15,413 |
12/23 |
$10,261 |
$12,403 |
$19,465 |
12/24 |
$10,865 |
$13,070 |
$24,335 |
12/25 |
$12,519 |
$15,132 |
$28,686 |
|
| Average Annual Return [Table Text Block] |
AATR |
1 Year |
5 Years |
Since Inception |
Class P (Commenced April 17, 2018) |
15.23% |
11.23% |
2.96% |
BCOM (Gross, USD, Unhedged) |
15.77% |
10.63% |
5.52% |
S&P 500® Index |
17.88% |
14.42% |
14.64% | |
| Performance Inception Date |
Apr. 17, 2018
|
| AssetsNet |
$ 337,225,710
|
| Holdings Count | Holding |
73
|
| Advisory Fees Paid, Amount |
$ 1,659,455
|
| InvestmentCompanyPortfolioTurnover |
0.00%
|
| Additional Fund Statistics [Text Block] |
Total Net Assets as of Period End |
$337,225,710 |
# of Portfolio Holdings as of Period End |
73 |
Portfolio Turnover Rate for the Period |
0% |
Total Net Advisory Fees Paid for the Period |
$1,659,455 | |
| Holdings [Text Block] |
Header |
Gross |
Long |
Short |
Net |
Energy |
34.3 |
29.3 |
-5.0 |
24.3 |
Agriculture |
28.7 |
28.0 |
-0.7 |
27.3 |
Precious Metals |
28.2 |
28.2 |
- |
28.2 |
Industrial Metals |
16.1 |
15.7 |
-0.4 |
15.2 |
Livestock |
5.0 |
5.0 |
- |
5.0 | * Sector exposure includes the impact of derivatives. "Gross Exposure" represents the sum of the absolute value of long and short notional contract values in U.S. dollars of the Fund's positions (for a given sector), divided by the Fund's net assets exposure within each sector. "Net Exposure" represents the net exposure within the Fund to a given sector, calculated as the difference between long and short exposures. Short-term Investments include money market funds and U.S. Treasury Bills and generally represent the collateral for Fund's derivative positions. |
| Material Fund Change [Text Block] |
This is a summary of certain changes to the Fund for the Period. For more complete information, you may review the Fund's next prospectus, which we expect to be available by April 30, 2026 at dfinview.com/GoldmanSachs or upon request at 1-800-621-2550. Effective April 30, 2025, the Fund’s Investment Adviser agreed to reduce or limit “Other Expenses” (excluding acquired fund fees and expenses, transfer agency fees and expenses, service fees, taxes, dividend and interest expenses on short sales, interest, broker fees, expenses of shareholder meetings, litigation and indemnification, and extraordinary expenses) to 0.074% of the Fund’s average daily net assets. |
| Material Fund Change Expenses [Text Block] |
Effective April 30, 2025, the Fund’s Investment Adviser agreed to reduce or limit “Other Expenses” (excluding acquired fund fees and expenses, transfer agency fees and expenses, service fees, taxes, dividend and interest expenses on short sales, interest, broker fees, expenses of shareholder meetings, litigation and indemnification, and extraordinary expenses) to 0.074% of the Fund’s average daily net assets.
|
| Summary of Change Legend [Text Block] |
This is a summary of certain changes to the Fund for the Period. For more complete information, you may review the Fund's next prospectus, which we expect to be available by April 30, 2026 at dfinview.com/GoldmanSachs or upon request at 1-800-621-2550.
|
| Updated Prospectus Phone Number |
1-800-621-2550
|
| Updated Prospectus Web Address |
<span style="box-sizing: border-box; color: rgb(0, 0, 0); display: inline; flex-wrap: nowrap; font-size: 12px; font-weight: 400; grid-area: auto; line-height: 18px; margin: 0px; overflow: visible; text-align: left; text-align-last: auto; white-space-collapse: preserve-breaks;">dfinview.com/GoldmanSachs</span>
|
| C000058992 |
|
| Shareholder Report [Line Items] |
|
| Fund Name |
Goldman Sachs Commodity Strategy Fund
|
| Class Name |
Class R
|
| Trading Symbol |
GCCRX
|
| Annual or Semi-Annual Statement [Text Block] |
This annual shareholder report contains important information about Goldman Sachs Commodity Strategy Fund (the “Fund”) for the period of January 1, 2025 to December 31, 2025 (the “Period”).
|
| Additional Information [Text Block] |
You can find additional information about the Fund at am.gs.com or dfinview.com/GoldmanSachs. You can also request this information by contacting us at 1-800-526-7384.
|
| Material Fund Change Notice [Text Block] |
This report describes changes to the Fund that occurred during the Period.
|
| Additional Information Phone Number |
1-800-526-7384
|
| Additional Information Website |
<span style="box-sizing: border-box; color: rgb(0, 0, 0); display: inline; flex-wrap: nowrap; font-size: 12px; font-weight: 400; grid-area: auto; line-height: 18px; margin: 0px; overflow: visible; text-align: left; text-align-last: auto; white-space-collapse: preserve-breaks;">am.gs.com</span>
|
| Expenses [Text Block] |
What were the Fund costs for the Period?Based on a hypothetical $10,000 investment.
Class |
Costs of a $10,000 investment |
Costs paid as a percentage of a $10,000 investment |
R |
$127 |
1.18% | |
| Expenses Paid, Amount |
$ 127
|
| Expense Ratio, Percent |
1.18%
|
| Factors Affecting Performance [Text Block] |
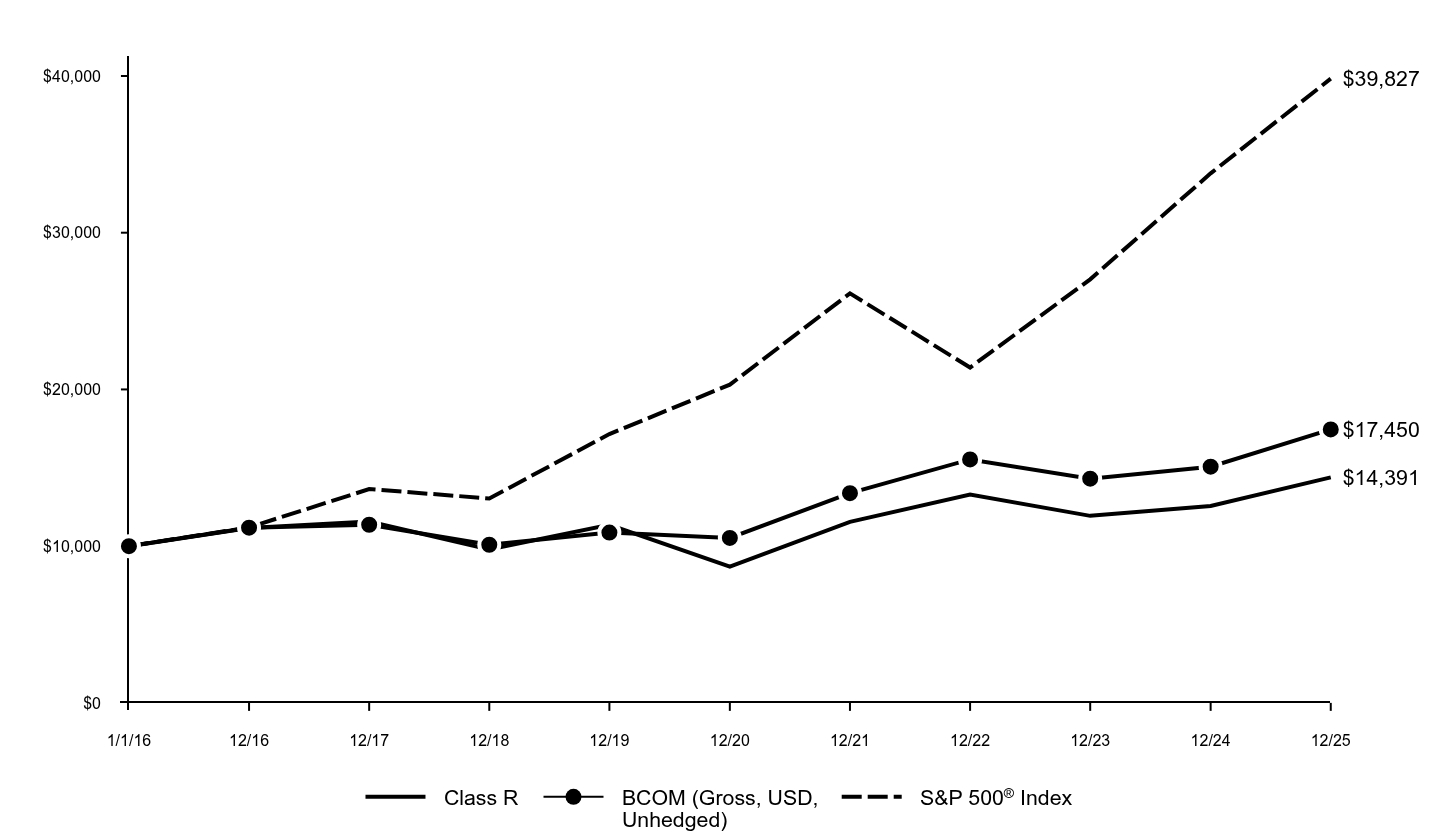
How did the Fund perform and what affected its performance?Aggressive U.S. trade policies, tariffs, deregulation, supply/demand shocks and constraints, U.S. and international monetary policy, currency dynamics, China’s economic trajectory, geopolitical developments and weather anomalies led to bifurcated commodities markets in 2025 wherein gains in metals and livestock offset weakness in energy and agriculture. |
| Performance Past Does Not Indicate Future [Text] |
Performance data quoted above represents past performance. Past performance does not guarantee future results.
|
| Line Graph [Table Text Block] |
|
Class R |
BCOM (Gross, USD, Unhedged) |
S&P 500® Index |
1/1/16 |
$10,000 |
$10,000 |
$10,000 |
12/16 |
$11,163 |
$11,177 |
$11,196 |
12/17 |
$11,565 |
$11,367 |
$13,640 |
12/18 |
$9,784 |
$10,089 |
$13,042 |
12/19 |
$11,360 |
$10,865 |
$17,149 |
12/20 |
$8,700 |
$10,525 |
$20,304 |
12/21 |
$11,547 |
$13,379 |
$26,132 |
12/22 |
$13,287 |
$15,532 |
$21,399 |
12/23 |
$11,933 |
$14,303 |
$27,025 |
12/24 |
$12,561 |
$15,072 |
$33,786 |
12/25 |
$14,391 |
$17,450 |
$39,827 |
|
| Average Annual Return [Table Text Block] |
AATR |
1 Year |
5 Years |
10 Years |
Class R |
14.57% |
10.58% |
3.70% |
BCOM (Gross, USD, Unhedged) |
15.77% |
10.63% |
5.72% |
S&P 500® Index |
17.88% |
14.42% |
14.81% | |
| AssetsNet |
$ 337,225,710
|
| Holdings Count | Holding |
73
|
| Advisory Fees Paid, Amount |
$ 1,659,455
|
| InvestmentCompanyPortfolioTurnover |
0.00%
|
| Additional Fund Statistics [Text Block] |
Total Net Assets as of Period End |
$337,225,710 |
# of Portfolio Holdings as of Period End |
73 |
Portfolio Turnover Rate for the Period |
0% |
Total Net Advisory Fees Paid for the Period |
$1,659,455 | |
| Holdings [Text Block] |
Header |
Gross |
Long |
Short |
Net |
Energy |
34.3 |
29.3 |
-5.0 |
24.3 |
Agriculture |
28.7 |
28.0 |
-0.7 |
27.3 |
Precious Metals |
28.2 |
28.2 |
- |
28.2 |
Industrial Metals |
16.1 |
15.7 |
-0.4 |
15.2 |
Livestock |
5.0 |
5.0 |
- |
5.0 | * Sector exposure includes the impact of derivatives. "Gross Exposure" represents the sum of the absolute value of long and short notional contract values in U.S. dollars of the Fund's positions (for a given sector), divided by the Fund's net assets exposure within each sector. "Net Exposure" represents the net exposure within the Fund to a given sector, calculated as the difference between long and short exposures. Short-term Investments include money market funds and U.S. Treasury Bills and generally represent the collateral for Fund's derivative positions. |
| Material Fund Change [Text Block] |
This is a summary of certain changes to the Fund for the Period. For more complete information, you may review the Fund's next prospectus, which we expect to be available by April 30, 2026 at dfinview.com/GoldmanSachs or upon request at 1-800-526-7384. Effective April 30, 2025, the Fund’s Investment Adviser agreed to reduce or limit “Other Expenses” (excluding acquired fund fees and expenses, transfer agency fees and expenses, service fees, taxes, dividend and interest expenses on short sales, interest, broker fees, expenses of shareholder meetings, litigation and indemnification, and extraordinary expenses) to 0.074% of the Fund’s average daily net assets. |
| Material Fund Change Expenses [Text Block] |
Effective April 30, 2025, the Fund’s Investment Adviser agreed to reduce or limit “Other Expenses” (excluding acquired fund fees and expenses, transfer agency fees and expenses, service fees, taxes, dividend and interest expenses on short sales, interest, broker fees, expenses of shareholder meetings, litigation and indemnification, and extraordinary expenses) to 0.074% of the Fund’s average daily net assets.
|
| Summary of Change Legend [Text Block] |
This is a summary of certain changes to the Fund for the Period. For more complete information, you may review the Fund's next prospectus, which we expect to be available by April 30, 2026 at dfinview.com/GoldmanSachs or upon request at 1-800-526-7384.
|
| Updated Prospectus Phone Number |
1-800-526-7384
|
| Updated Prospectus Web Address |
<span style="box-sizing: border-box; color: rgb(0, 0, 0); display: inline; flex-wrap: nowrap; font-size: 12px; font-weight: 400; grid-area: auto; line-height: 18px; margin: 0px; overflow: visible; text-align: left; text-align-last: auto; white-space-collapse: preserve-breaks;">dfinview.com/GoldmanSachs</span>
|
| C000161523 |
|
| Shareholder Report [Line Items] |
|
| Fund Name |
Goldman Sachs Commodity Strategy Fund
|
| Class Name |
Class R6
|
| Trading Symbol |
GCCUX
|
| Annual or Semi-Annual Statement [Text Block] |
This annual shareholder report contains important information about Goldman Sachs Commodity Strategy Fund (the “Fund”) for the period of January 1, 2025 to December 31, 2025 (the “Period”).
|
| Additional Information [Text Block] |
You can find additional information about the Fund at am.gs.com or dfinview.com/GoldmanSachs. You can also request this information by contacting us at 1-800-621-2550.
|
| Material Fund Change Notice [Text Block] |
This report describes changes to the Fund that occurred during the Period.
|
| Additional Information Phone Number |
1-800-621-2550
|
| Additional Information Website |
<span style="box-sizing: border-box; color: rgb(0, 0, 0); display: inline; flex-wrap: nowrap; font-size: 12px; font-weight: 400; grid-area: auto; line-height: 18px; margin: 0px; overflow: visible; text-align: left; text-align-last: auto; white-space-collapse: preserve-breaks;">am.gs.com</span>
|
| Expenses [Text Block] |
What were the Fund costs for the Period?Based on a hypothetical $10,000 investment.
Class |
Costs of a $10,000 investment |
Costs paid as a percentage of a $10,000 investment |
R6 |
$64 |
0.59% | |
| Expenses Paid, Amount |
$ 64
|
| Expense Ratio, Percent |
0.59%
|
| Factors Affecting Performance [Text Block] |
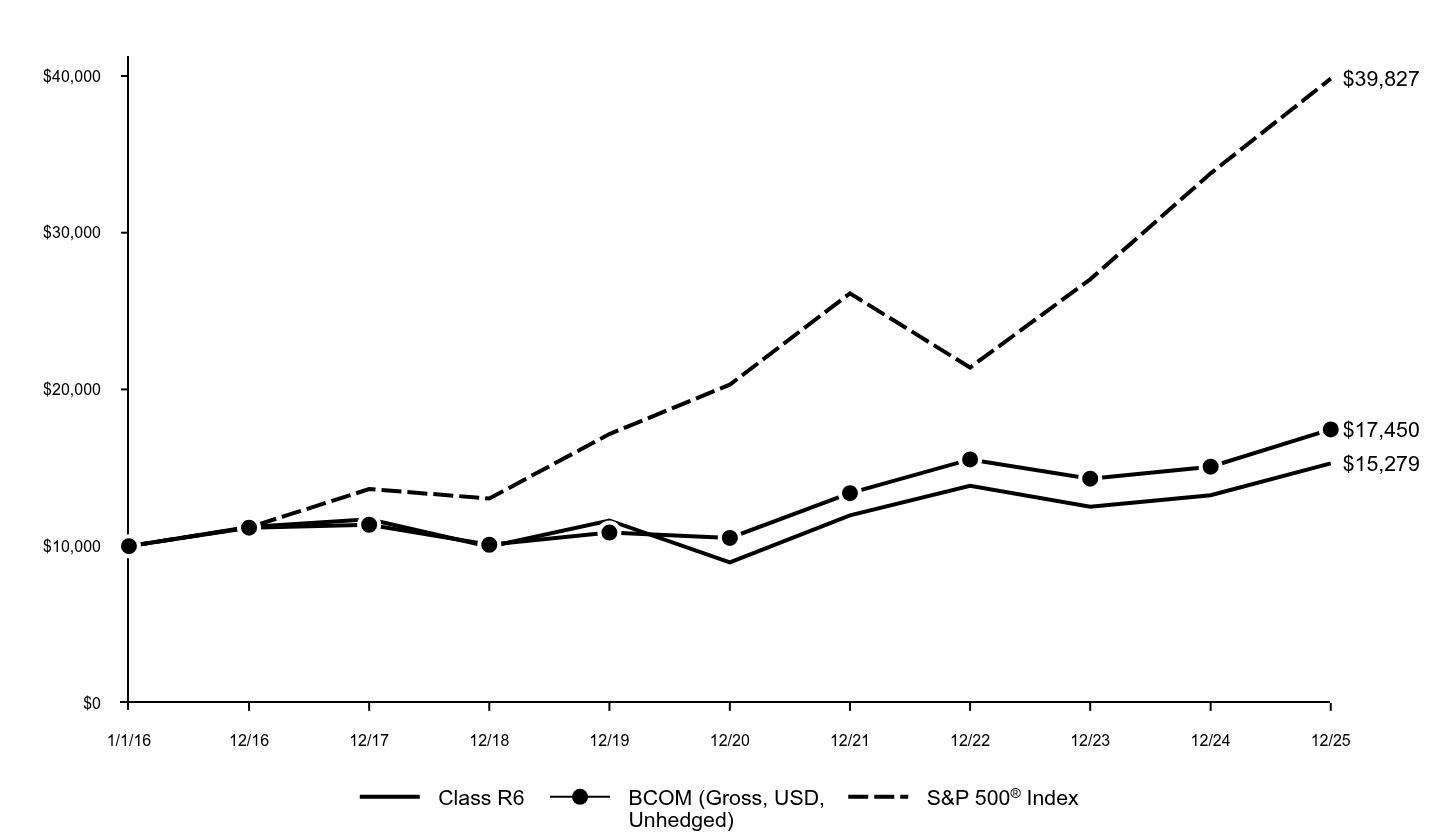
How did the Fund perform and what affected its performance?Aggressive U.S. trade policies, tariffs, deregulation, supply/demand shocks and constraints, U.S. and international monetary policy, currency dynamics, China’s economic trajectory, geopolitical developments and weather anomalies led to bifurcated commodities markets in 2025 wherein gains in metals and livestock offset weakness in energy and agriculture. |
| Performance Past Does Not Indicate Future [Text] |
Performance data quoted above represents past performance. Past performance does not guarantee future results.
|
| Line Graph [Table Text Block] |
|
Class R6 |
BCOM (Gross, USD, Unhedged) |
S&P 500® Index |
1/1/16 |
$10,000 |
$10,000 |
$10,000 |
12/16 |
$11,228 |
$11,177 |
$11,196 |
12/17 |
$11,710 |
$11,367 |
$13,640 |
12/18 |
$9,958 |
$10,089 |
$13,042 |
12/19 |
$11,638 |
$10,865 |
$17,149 |
12/20 |
$8,965 |
$10,525 |
$20,304 |
12/21 |
$11,962 |
$13,379 |
$26,132 |
12/22 |
$13,857 |
$15,532 |
$21,399 |
12/23 |
$12,512 |
$14,303 |
$27,025 |
12/24 |
$13,246 |
$15,072 |
$33,786 |
12/25 |
$15,279 |
$17,450 |
$39,827 |
|
| Average Annual Return [Table Text Block] |
AATR |
1 Year |
5 Years |
10 Years |
Class R6 |
15.35% |
11.25% |
4.33% |
BCOM (Gross, USD, Unhedged) |
15.77% |
10.63% |
5.72% |
S&P 500® Index |
17.88% |
14.42% |
14.81% | |
| AssetsNet |
$ 337,225,710
|
| Holdings Count | Holding |
73
|
| Advisory Fees Paid, Amount |
$ 1,659,455
|
| InvestmentCompanyPortfolioTurnover |
0.00%
|
| Additional Fund Statistics [Text Block] |
Total Net Assets as of Period End |
$337,225,710 |
# of Portfolio Holdings as of Period End |
73 |
Portfolio Turnover Rate for the Period |
0% |
Total Net Advisory Fees Paid for the Period |
$1,659,455 | |
| Holdings [Text Block] |
Header |
Gross |
Long |
Short |
Net |
Energy |
34.3 |
29.3 |
-5.0 |
24.3 |
Agriculture |
28.7 |
28.0 |
-0.7 |
27.3 |
Precious Metals |
28.2 |
28.2 |
- |
28.2 |
Industrial Metals |
16.1 |
15.7 |
-0.4 |
15.2 |
Livestock |
5.0 |
5.0 |
- |
5.0 | * Sector exposure includes the impact of derivatives. "Gross Exposure" represents the sum of the absolute value of long and short notional contract values in U.S. dollars of the Fund's positions (for a given sector), divided by the Fund's net assets exposure within each sector. "Net Exposure" represents the net exposure within the Fund to a given sector, calculated as the difference between long and short exposures. Short-term Investments include money market funds and U.S. Treasury Bills and generally represent the collateral for Fund's derivative positions. |
| Material Fund Change [Text Block] |
This is a summary of certain changes to the Fund for the Period. For more complete information, you may review the Fund's next prospectus, which we expect to be available by April 30, 2026 at dfinview.com/GoldmanSachs or upon request at 1-800-621-2550. Effective April 30, 2025, the Fund’s Investment Adviser agreed to reduce or limit “Other Expenses” (excluding acquired fund fees and expenses, transfer agency fees and expenses, service fees, taxes, dividend and interest expenses on short sales, interest, broker fees, expenses of shareholder meetings, litigation and indemnification, and extraordinary expenses) to 0.074% of the Fund’s average daily net assets. |
| Material Fund Change Expenses [Text Block] |
Effective April 30, 2025, the Fund’s Investment Adviser agreed to reduce or limit “Other Expenses” (excluding acquired fund fees and expenses, transfer agency fees and expenses, service fees, taxes, dividend and interest expenses on short sales, interest, broker fees, expenses of shareholder meetings, litigation and indemnification, and extraordinary expenses) to 0.074% of the Fund’s average daily net assets.
|
| Summary of Change Legend [Text Block] |
This is a summary of certain changes to the Fund for the Period. For more complete information, you may review the Fund's next prospectus, which we expect to be available by April 30, 2026 at dfinview.com/GoldmanSachs or upon request at 1-800-621-2550.
|
| Updated Prospectus Phone Number |
1-800-621-2550
|
| Updated Prospectus Web Address |
<span style="box-sizing: border-box; color: rgb(0, 0, 0); display: inline; flex-wrap: nowrap; font-size: 12px; font-weight: 400; grid-area: auto; line-height: 18px; margin: 0px; overflow: visible; text-align: left; text-align-last: auto; white-space-collapse: preserve-breaks;">dfinview.com/GoldmanSachs</span>
|
| C000043360 |
|
| Shareholder Report [Line Items] |
|
| Fund Name |
Goldman Sachs Commodity Strategy Fund
|
| Class Name |
Institutional Class
|
| Trading Symbol |
GCCIX
|
| Annual or Semi-Annual Statement [Text Block] |
This annual shareholder report contains important information about Goldman Sachs Commodity Strategy Fund (the “Fund”) for the period of January 1, 2025 to December 31, 2025 (the “Period”).
|
| Additional Information [Text Block] |
You can find additional information about the Fund at am.gs.com or dfinview.com/GoldmanSachs. You can also request this information by contacting us at 1-800-621-2550.
|
| Material Fund Change Notice [Text Block] |
This report describes changes to the Fund that occurred during the Period.
|
| Additional Information Phone Number |
1-800-621-2550
|
| Additional Information Website |
<span style="box-sizing: border-box; color: rgb(0, 0, 0); display: inline; flex-wrap: nowrap; font-size: 12px; font-weight: 400; grid-area: auto; line-height: 18px; margin: 0px; overflow: visible; text-align: left; text-align-last: auto; white-space-collapse: preserve-breaks;">am.gs.com</span>
|
| Expenses [Text Block] |
What were the Fund costs for the Period?Based on a hypothetical $10,000 investment.
Class |
Costs of a $10,000 investment |
Costs paid as a percentage of a $10,000 investment |
Institutional |
$65 |
0.60% | |
| Expenses Paid, Amount |
$ 65
|
| Expense Ratio, Percent |
0.60%
|
| Factors Affecting Performance [Text Block] |
How did the Fund perform and what affected its performance?Aggressive U.S. trade policies, tariffs, deregulation, supply/demand shocks and constraints, U.S. and international monetary policy, currency dynamics, China’s economic trajectory, geopolitical developments and weather anomalies led to bifurcated commodities markets in 2025 wherein gains in metals and livestock offset weakness in energy and agriculture. |
| Performance Past Does Not Indicate Future [Text] |
Performance data quoted above represents past performance. Past performance does not guarantee future results.
|
| Line Graph [Table Text Block] |
|
Institutional Shares |
BCOM (Gross, USD, Unhedged) |
S&P 500® Index |
1/1/16 |
$1,000,000 |
$1,000,000 |
$1,000,000 |
12/16 |
$1,123,600 |
$1,117,667 |
$1,119,599 |
12/17 |
$1,171,690 |
$1,136,714 |
$1,364,025 |
12/18 |
$997,225 |
$1,008,885 |
$1,304,222 |
12/19 |
$1,164,460 |
$1,086,478 |
$1,714,874 |
12/20 |
$896,401 |
$1,052,538 |
$2,030,390 |
12/21 |
$1,196,875 |
$1,337,873 |
$2,613,222 |
12/22 |
$1,385,383 |
$1,553,179 |
$2,139,945 |
12/23 |
$1,251,694 |
$1,430,283 |
$2,702,486 |
12/24 |
$1,325,293 |
$1,507,243 |
$3,378,640 |
12/25 |
$1,527,533 |
$1,744,967 |
$3,982,741 |
|
| Average Annual Return [Table Text Block] |
AATR |
1 Year |
5 Years |
10 Years |
Institutional Shares |
15.26% |
11.24% |
4.32% |
BCOM (Gross, USD, Unhedged) |
15.77% |
10.63% |
5.72% |
S&P 500® Index |
17.88% |
14.42% |
14.81% | |
| AssetsNet |
$ 337,225,710
|
| Holdings Count | Holding |
73
|
| Advisory Fees Paid, Amount |
$ 1,659,455
|
| InvestmentCompanyPortfolioTurnover |
0.00%
|
| Additional Fund Statistics [Text Block] |
Total Net Assets as of Period End |
$337,225,710 |
# of Portfolio Holdings as of Period End |
73 |
Portfolio Turnover Rate for the Period |
0% |
Total Net Advisory Fees Paid for the Period |
$1,659,455 | |
| Holdings [Text Block] |
Header |
Gross |
Long |
Short |
Net |
Energy |
34.3 |
29.3 |
-5.0 |
24.3 |
Agriculture |
28.7 |
28.0 |
-0.7 |
27.3 |
Precious Metals |
28.2 |
28.2 |
- |
28.2 |
Industrial Metals |
16.1 |
15.7 |
-0.4 |
15.2 |
Livestock |
5.0 |
5.0 |
- |
5.0 | * Sector exposure includes the impact of derivatives. "Gross Exposure" represents the sum of the absolute value of long and short notional contract values in U.S. dollars of the Fund's positions (for a given sector), divided by the Fund's net assets exposure within each sector. "Net Exposure" represents the net exposure within the Fund to a given sector, calculated as the difference between long and short exposures. Short-term Investments include money market funds and U.S. Treasury Bills and generally represent the collateral for Fund's derivative positions. |
| Material Fund Change [Text Block] |
This is a summary of certain changes to the Fund for the Period. For more complete information, you may review the Fund's next prospectus, which we expect to be available by April 30, 2026 at dfinview.com/GoldmanSachs or upon request at 1-800-621-2550. Effective April 30, 2025, the Fund’s Investment Adviser agreed to reduce or limit “Other Expenses” (excluding acquired fund fees and expenses, transfer agency fees and expenses, service fees, taxes, dividend and interest expenses on short sales, interest, broker fees, expenses of shareholder meetings, litigation and indemnification, and extraordinary expenses) to 0.074% of the Fund’s average daily net assets. |
| Material Fund Change Expenses [Text Block] |
Effective April 30, 2025, the Fund’s Investment Adviser agreed to reduce or limit “Other Expenses” (excluding acquired fund fees and expenses, transfer agency fees and expenses, service fees, taxes, dividend and interest expenses on short sales, interest, broker fees, expenses of shareholder meetings, litigation and indemnification, and extraordinary expenses) to 0.074% of the Fund’s average daily net assets.
|
| Summary of Change Legend [Text Block] |
This is a summary of certain changes to the Fund for the Period. For more complete information, you may review the Fund's next prospectus, which we expect to be available by April 30, 2026 at dfinview.com/GoldmanSachs or upon request at 1-800-621-2550.
|
| Updated Prospectus Phone Number |
1-800-621-2550
|
| Updated Prospectus Web Address |
<span style="box-sizing: border-box; color: rgb(0, 0, 0); display: inline; flex-wrap: nowrap; font-size: 12px; font-weight: 400; grid-area: auto; line-height: 18px; margin: 0px; overflow: visible; text-align: left; text-align-last: auto; white-space-collapse: preserve-breaks;">dfinview.com/GoldmanSachs</span>
|
| C000058993 |
|
| Shareholder Report [Line Items] |
|
| Fund Name |
Goldman Sachs Commodity Strategy Fund
|
| Class Name |
Investor Class
|
| Trading Symbol |
GCCTX
|
| Annual or Semi-Annual Statement [Text Block] |
This annual shareholder report contains important information about Goldman Sachs Commodity Strategy Fund (the “Fund”) for the period of January 1, 2025 to December 31, 2025 (the “Period”).
|
| Additional Information [Text Block] |
You can find additional information about the Fund at am.gs.com or dfinview.com/GoldmanSachs. You can also request this information by contacting us at 1-800-526-7384.
|
| Material Fund Change Notice [Text Block] |
This report describes changes to the Fund that occurred during the Period.
|
| Additional Information Phone Number |
1-800-526-7384
|
| Additional Information Website |
<span style="box-sizing: border-box; color: rgb(0, 0, 0); display: inline; flex-wrap: nowrap; font-size: 12px; font-weight: 400; grid-area: auto; line-height: 18px; margin: 0px; overflow: visible; text-align: left; text-align-last: auto; white-space-collapse: preserve-breaks;">am.gs.com</span>
|
| Expenses [Text Block] |
What were the Fund costs for the Period?Based on a hypothetical $10,000 investment.
Class |
Costs of a $10,000 investment |
Costs paid as a percentage of a $10,000 investment |
Investor |
$73 |
0.68% | |
| Expenses Paid, Amount |
$ 73
|
| Expense Ratio, Percent |
0.68%
|
| Factors Affecting Performance [Text Block] |
How did the Fund perform and what affected its performance?Aggressive U.S. trade policies, tariffs, deregulation, supply/demand shocks and constraints, U.S. and international monetary policy, currency dynamics, China’s economic trajectory, geopolitical developments and weather anomalies led to bifurcated commodities markets in 2025 wherein gains in metals and livestock offset weakness in energy and agriculture. |
| Performance Past Does Not Indicate Future [Text] |
Performance data quoted above represents past performance. Past performance does not guarantee future results.
|
| Line Graph [Table Text Block] |
|
Investor Shares |
BCOM (Gross, USD, Unhedged) |
S&P 500® Index |
1/1/16 |
$10,000 |
$10,000 |
$10,000 |
12/16 |
$11,224 |
$11,177 |
$11,196 |
12/17 |
$11,682 |
$11,367 |
$13,640 |
12/18 |
$9,933 |
$10,089 |
$13,042 |
12/19 |
$11,595 |
$10,865 |
$17,149 |
12/20 |
$8,922 |
$10,525 |
$20,304 |
12/21 |
$11,896 |
$13,379 |
$26,132 |
12/22 |
$13,775 |
$15,532 |
$21,399 |
12/23 |
$12,427 |
$14,303 |
$27,025 |
12/24 |
$13,143 |
$15,072 |
$33,786 |
12/25 |
$15,130 |
$17,450 |
$39,827 |
|
| Average Annual Return [Table Text Block] |
AATR |
1 Year |
5 Years |
10 Years |
Investor Shares |
15.12% |
11.13% |
4.23% |
BCOM (Gross, USD, Unhedged) |
15.77% |
10.63% |
5.72% |
S&P 500® Index |
17.88% |
14.42% |
14.81% | |
| AssetsNet |
$ 337,225,710
|
| Holdings Count | Holding |
73
|
| Advisory Fees Paid, Amount |
$ 1,659,455
|
| InvestmentCompanyPortfolioTurnover |
0.00%
|
| Additional Fund Statistics [Text Block] |
Total Net Assets as of Period End |
$337,225,710 |
# of Portfolio Holdings as of Period End |
73 |
Portfolio Turnover Rate for the Period |
0% |
Total Net Advisory Fees Paid for the Period |
$1,659,455 | |
| Holdings [Text Block] |
Header |
Gross |
Long |
Short |
Net |
Energy |
34.3 |
29.3 |
-5.0 |
24.3 |
Agriculture |
28.7 |
28.0 |
-0.7 |
27.3 |
Precious Metals |
28.2 |
28.2 |
- |
28.2 |
Industrial Metals |
16.1 |
15.7 |
-0.4 |
15.2 |
Livestock |
5.0 |
5.0 |
- |
5.0 | * Sector exposure includes the impact of derivatives. "Gross Exposure" represents the sum of the absolute value of long and short notional contract values in U.S. dollars of the Fund's positions (for a given sector), divided by the Fund's net assets exposure within each sector. "Net Exposure" represents the net exposure within the Fund to a given sector, calculated as the difference between long and short exposures. Short-term Investments include money market funds and U.S. Treasury Bills and generally represent the collateral for Fund's derivative positions. |
| Material Fund Change [Text Block] |
This is a summary of certain changes to the Fund for the Period. For more complete information, you may review the Fund's next prospectus, which we expect to be available by April 30, 2026 at dfinview.com/GoldmanSachs or upon request at 1-800-526-7384. Effective April 30, 2025, the Fund’s Investment Adviser agreed to reduce or limit “Other Expenses” (excluding acquired fund fees and expenses, transfer agency fees and expenses, service fees, taxes, dividend and interest expenses on short sales, interest, broker fees, expenses of shareholder meetings, litigation and indemnification, and extraordinary expenses) to 0.074% of the Fund’s average daily net assets. |
| Material Fund Change Expenses [Text Block] |
Effective April 30, 2025, the Fund’s Investment Adviser agreed to reduce or limit “Other Expenses” (excluding acquired fund fees and expenses, transfer agency fees and expenses, service fees, taxes, dividend and interest expenses on short sales, interest, broker fees, expenses of shareholder meetings, litigation and indemnification, and extraordinary expenses) to 0.074% of the Fund’s average daily net assets.
|
| Summary of Change Legend [Text Block] |
This is a summary of certain changes to the Fund for the Period. For more complete information, you may review the Fund's next prospectus, which we expect to be available by April 30, 2026 at dfinview.com/GoldmanSachs or upon request at 1-800-526-7384.
|
| Updated Prospectus Phone Number |
1-800-526-7384
|
| Updated Prospectus Web Address |
<span style="box-sizing: border-box; color: rgb(0, 0, 0); display: inline; flex-wrap: nowrap; font-size: 12px; font-weight: 400; grid-area: auto; line-height: 18px; margin: 0px; overflow: visible; text-align: left; text-align-last: auto; white-space-collapse: preserve-breaks;">dfinview.com/GoldmanSachs</span>
|
| C000025591 |
|
| Shareholder Report [Line Items] |
|
| Fund Name |
Goldman Sachs Dynamic Global Equity Fund
|
| Class Name |
Class A
|
| Trading Symbol |
GAPAX
|
| Annual or Semi-Annual Statement [Text Block] |
This annual shareholder report contains important information about Goldman Sachs Dynamic Global Equity Fund (the “Fund”) for the period of January 1, 2025 to December 31, 2025 (the “Period”).
|
| Additional Information [Text Block] |
You can find additional information about the Fund at am.gs.com or dfinview.com/GoldmanSachs. You can also request this information by contacting us at 1-800-526-7384.
|
| Additional Information Phone Number |
1-800-526-7384
|
| Additional Information Website |
<span style="box-sizing: border-box; color: rgb(0, 0, 0); display: inline; flex-wrap: nowrap; font-size: 12px; font-weight: 400; grid-area: auto; line-height: 18px; margin: 0px; overflow: visible; text-align: left; text-align-last: auto; white-space-collapse: preserve-breaks;">am.gs.com</span>
|
| Expenses [Text Block] |
What were the Fund costs for the Period?Based on a hypothetical $10,000 investment.
Class |
Costs of a $10,000 investment |
Costs paid as a percentage of a $10,000 investment |
A |
$61 |
0.55% | |
| Expenses Paid, Amount |
$ 61
|
| Expense Ratio, Percent |
0.55%
|
| Factors Affecting Performance [Text Block] |
How did the Fund perform and what affected its performance?The broad international equity market was volatile but strong amid tariff uncertainty and geopolitical tensions. Further boosting sentiment was an improving economic outlook in Europe, central bank rate cuts, increased defense spending, rising commodity prices, resilient corporate earnings and enthusiasm for technology/AI. |
| Performance Past Does Not Indicate Future [Text] |
Performance data quoted above represents past performance. Past performance does not guarantee future results.
|
| Line Graph [Table Text Block] |
|
Class A (including sales charges) |
Class A (excluding sales charges) |
MSCI® ACWI Index (Net, USD, Unhedged) |
1/1/16 |
$9,450 |
$10,000 |
$10,000 |
12/16 |
$10,095 |
$10,683 |
$10,786 |
12/17 |
$12,716 |
$13,456 |
$13,372 |
12/18 |
$11,267 |
$11,922 |
$12,113 |
12/19 |
$14,158 |
$14,982 |
$15,335 |
12/20 |
$16,025 |
$16,958 |
$17,828 |
12/21 |
$19,241 |
$20,361 |
$21,133 |
12/22 |
$15,526 |
$16,429 |
$17,252 |
12/23 |
$18,665 |
$19,751 |
$21,082 |
12/24 |
$21,903 |
$23,178 |
$24,769 |
12/25 |
$26,556 |
$28,101 |
$30,302 |
|
| Average Annual Return [Table Text Block] |
AATR |
1 Year |
5 Years |
10 Years |
Class A |
21.24% |
10.62% |
10.88% |
Class A including sales charges |
14.60% |
9.38% |
10.25% |
MSCI® ACWI Index (Net, USD, Unhedged) |
22.34% |
11.19% |
11.71% | |
| AssetsNet |
$ 441,124,147
|
| Holdings Count | Holding |
17
|
| Advisory Fees Paid, Amount |
$ 610,086
|
| InvestmentCompanyPortfolioTurnover |
36.00%
|
| Additional Fund Statistics [Text Block] |
Total Net Assets as of Period End |
$441,124,147 |
# of Portfolio Holdings as of Period End |
17 |
Portfolio Turnover Rate for the Period |
36% |
Total Net Advisory Fees Paid for the Period |
$610,086 | |
| Holdings [Text Block] |
Equity |
55.5% |
Exchange-Traded Funds |
38.2% |
Investment Companies |
2.3% | |
| Material Fund Change [Text Block] |
|
| Updated Prospectus Phone Number |
1-800-526-7384
|
| Updated Prospectus Web Address |
<span style="box-sizing: border-box; color: rgb(0, 0, 0); display: inline; flex-wrap: nowrap; font-size: 12px; font-weight: 400; grid-area: auto; line-height: 18px; margin: 0px; overflow: visible; text-align: left; text-align-last: auto; white-space-collapse: preserve-breaks;">dfinview.com/GoldmanSachs</span>
|
| C000025593 |
|
| Shareholder Report [Line Items] |
|
| Fund Name |
Goldman Sachs Dynamic Global Equity Fund
|
| Class Name |
Class C
|
| Trading Symbol |
GAXCX
|
| Annual or Semi-Annual Statement [Text Block] |
This annual shareholder report contains important information about Goldman Sachs Dynamic Global Equity Fund (the “Fund”) for the period of January 1, 2025 to December 31, 2025 (the “Period”).
|
| Additional Information [Text Block] |
You can find additional information about the Fund at am.gs.com or dfinview.com/GoldmanSachs. You can also request this information by contacting us at 1-800-526-7384.
|
| Additional Information Phone Number |
1-800-526-7384
|
| Additional Information Website |
<span style="box-sizing: border-box; color: rgb(0, 0, 0); display: inline; flex-wrap: nowrap; font-size: 12px; font-weight: 400; grid-area: auto; line-height: 18px; margin: 0px; overflow: visible; text-align: left; text-align-last: auto; white-space-collapse: preserve-breaks;">am.gs.com</span>
|
| Expenses [Text Block] |
What were the Fund costs for the Period?Based on a hypothetical $10,000 investment.
Class |
Costs of a $10,000 investment |
Costs paid as a percentage of a $10,000 investment |
C |
$143 |
1.30% | |
| Expenses Paid, Amount |
$ 143
|
| Expense Ratio, Percent |
1.30%
|
| Factors Affecting Performance [Text Block] |
How did the Fund perform and what affected its performance?The broad international equity market was volatile but strong amid tariff uncertainty and geopolitical tensions. Further boosting sentiment was an improving economic outlook in Europe, central bank rate cuts, increased defense spending, rising commodity prices, resilient corporate earnings and enthusiasm for technology/AI. |
| Performance Past Does Not Indicate Future [Text] |
Performance data quoted above represents past performance. Past performance does not guarantee future results.
|
| Line Graph [Table Text Block] |
|
Class C (including sales charges) |
Class C (excluding sales charges) |
MSCI® ACWI Index (Net, USD, Unhedged) |
1/1/16 |
$9,900 |
$10,000 |
$10,000 |
12/16 |
$10,491 |
$10,597 |
$10,786 |
12/17 |
$13,122 |
$13,255 |
$13,372 |
12/18 |
$11,542 |
$11,659 |
$12,113 |
12/19 |
$14,396 |
$14,541 |
$15,335 |
12/20 |
$16,170 |
$16,334 |
$17,828 |
12/21 |
$19,274 |
$19,468 |
$21,133 |
12/22 |
$15,436 |
$15,592 |
$17,252 |
12/23 |
$18,426 |
$18,612 |
$21,082 |
12/24 |
$21,454 |
$21,670 |
$24,769 |
12/25 |
$25,815 |
$26,076 |
$30,302 |
|
| Average Annual Return [Table Text Block] |
AATR |
1 Year |
5 Years |
10 Years |
Class C |
20.33% |
9.80% |
10.05% |
Class C including sales charges |
19.12% |
9.80% |
10.05% |
MSCI® ACWI Index (Net, USD, Unhedged) |
22.34% |
11.19% |
11.71% | |
| AssetsNet |
$ 441,124,147
|
| Holdings Count | Holding |
17
|
| Advisory Fees Paid, Amount |
$ 610,086
|
| InvestmentCompanyPortfolioTurnover |
36.00%
|
| Additional Fund Statistics [Text Block] |
Total Net Assets as of Period End |
$441,124,147 |
# of Portfolio Holdings as of Period End |
17 |
Portfolio Turnover Rate for the Period |
36% |
Total Net Advisory Fees Paid for the Period |
$610,086 | |
| Holdings [Text Block] |
Equity |
55.5% |
Exchange-Traded Funds |
38.2% |
Investment Companies |
2.3% | |
| Material Fund Change [Text Block] |
|
| Updated Prospectus Phone Number |
1-800-526-7384
|
| Updated Prospectus Web Address |
<span style="box-sizing: border-box; color: rgb(0, 0, 0); display: inline; flex-wrap: nowrap; font-size: 12px; font-weight: 400; grid-area: auto; line-height: 18px; margin: 0px; overflow: visible; text-align: left; text-align-last: auto; white-space-collapse: preserve-breaks;">dfinview.com/GoldmanSachs</span>
|
| C000201786 |
|
| Shareholder Report [Line Items] |
|
| Fund Name |
Goldman Sachs Dynamic Global Equity Fund
|
| Class Name |
Class P
|
| Trading Symbol |
GADPX
|
| Annual or Semi-Annual Statement [Text Block] |
This annual shareholder report contains important information about Goldman Sachs Dynamic Global Equity Fund (the “Fund”) for the period of January 1, 2025 to December 31, 2025 (the “Period”).
|
| Additional Information [Text Block] |
You can find additional information about the Fund at am.gs.com or dfinview.com/GoldmanSachs. You can also request this information by contacting us at 1-800-621-2550.
|
| Additional Information Phone Number |
1-800-621-2550
|
| Additional Information Website |
<span style="box-sizing: border-box; color: rgb(0, 0, 0); display: inline; flex-wrap: nowrap; font-size: 12px; font-weight: 400; grid-area: auto; line-height: 18px; margin: 0px; overflow: visible; text-align: left; text-align-last: auto; white-space-collapse: preserve-breaks;">am.gs.com</span>
|
| Expenses [Text Block] |
What were the Fund costs for the Period?Based on a hypothetical $10,000 investment.
Class |
Costs of a $10,000 investment |
Costs paid as a percentage of a $10,000 investment |
P |
$20 |
0.18% | |
| Expenses Paid, Amount |
$ 20
|
| Expense Ratio, Percent |
0.18%
|
| Factors Affecting Performance [Text Block] |
How did the Fund perform and what affected its performance?The broad international equity market was volatile but strong amid tariff uncertainty and geopolitical tensions. Further boosting sentiment was an improving economic outlook in Europe, central bank rate cuts, increased defense spending, rising commodity prices, resilient corporate earnings and enthusiasm for technology/AI. |
| Performance Past Does Not Indicate Future [Text] |
Performance data quoted above represents past performance. Past performance does not guarantee future results.
|
| Line Graph [Table Text Block] |
|
Class P |
MSCI® ACWI Index (Net, USD, Unhedged) |
4/17/18 |
$10,000 |
$10,000 |
12/18 |
$8,720 |
$8,955 |
12/19 |
$11,004 |
$11,337 |
12/20 |
$12,501 |
$13,179 |
12/21 |
$15,069 |
$15,622 |
12/22 |
$12,206 |
$12,753 |
12/23 |
$14,734 |
$15,585 |
12/24 |
$17,349 |
$18,311 |
12/25 |
$21,109 |
$22,401 |
|
| Average Annual Return [Table Text Block] |
AATR |
1 Year |
5 Years |
Since Inception |
Class P (Commenced April 17, 2018) |
21.67% |
11.04% |
10.17% |
MSCI® ACWI Index (Net, USD, Unhedged) |
22.34% |
11.19% |
11.02% | |
| Performance Inception Date |
Apr. 17, 2018
|
| AssetsNet |
$ 441,124,147
|
| Holdings Count | Holding |
17
|
| Advisory Fees Paid, Amount |
$ 610,086
|
| InvestmentCompanyPortfolioTurnover |
36.00%
|
| Additional Fund Statistics [Text Block] |
Total Net Assets as of Period End |
$441,124,147 |
# of Portfolio Holdings as of Period End |
17 |
Portfolio Turnover Rate for the Period |
36% |
Total Net Advisory Fees Paid for the Period |
$610,086 | |
| Holdings [Text Block] |
Equity |
55.5% |
Exchange-Traded Funds |
38.2% |
Investment Companies |
2.3% | |
| Material Fund Change [Text Block] |
|
| Updated Prospectus Phone Number |
1-800-621-2550
|
| Updated Prospectus Web Address |
<span style="box-sizing: border-box; color: rgb(0, 0, 0); display: inline; flex-wrap: nowrap; font-size: 12px; font-weight: 400; grid-area: auto; line-height: 18px; margin: 0px; overflow: visible; text-align: left; text-align-last: auto; white-space-collapse: preserve-breaks;">dfinview.com/GoldmanSachs</span>
|
| C000058975 |
|
| Shareholder Report [Line Items] |
|
| Fund Name |
Goldman Sachs Dynamic Global Equity Fund
|
| Class Name |
Class R
|
| Trading Symbol |
GAPRX
|
| Annual or Semi-Annual Statement [Text Block] |
This annual shareholder report contains important information about Goldman Sachs Dynamic Global Equity Fund (the “Fund”) for the period of January 1, 2025 to December 31, 2025 (the “Period”).
|
| Additional Information [Text Block] |
You can find additional information about the Fund at am.gs.com or dfinview.com/GoldmanSachs. You can also request this information by contacting us at 1-800-526-7384.
|
| Additional Information Phone Number |
1-800-526-7384
|
| Additional Information Website |
<span style="box-sizing: border-box; color: rgb(0, 0, 0); display: inline; flex-wrap: nowrap; font-size: 12px; font-weight: 400; grid-area: auto; line-height: 18px; margin: 0px; overflow: visible; text-align: left; text-align-last: auto; white-space-collapse: preserve-breaks;">am.gs.com</span>
|
| Expenses [Text Block] |
What were the Fund costs for the Period?Based on a hypothetical $10,000 investment.
Class |
Costs of a $10,000 investment |
Costs paid as a percentage of a $10,000 investment |
R |
$88 |
0.80% | |
| Expenses Paid, Amount |
$ 88
|
| Expense Ratio, Percent |
0.80%
|
| Factors Affecting Performance [Text Block] |
How did the Fund perform and what affected its performance?The broad international equity market was volatile but strong amid tariff uncertainty and geopolitical tensions. Further boosting sentiment was an improving economic outlook in Europe, central bank rate cuts, increased defense spending, rising commodity prices, resilient corporate earnings and enthusiasm for technology/AI. |
| Performance Past Does Not Indicate Future [Text] |
Performance data quoted above represents past performance. Past performance does not guarantee future results.
|
| Line Graph [Table Text Block] |
|
Class R |
MSCI® ACWI Index (Net, USD, Unhedged) |
1/1/16 |
$10,000 |
$10,000 |
12/16 |
$10,650 |
$10,786 |
12/17 |
$13,387 |
$13,372 |
12/18 |
$11,830 |
$12,113 |
12/19 |
$14,830 |
$15,335 |
12/20 |
$16,746 |
$17,828 |
12/21 |
$20,055 |
$21,133 |
12/22 |
$16,147 |
$17,252 |
12/23 |
$19,368 |
$21,082 |
12/24 |
$22,658 |
$24,769 |
12/25 |
$27,401 |
$30,302 |
|
| Average Annual Return [Table Text Block] |
AATR |
1 Year |
5 Years |
10 Years |
Class R |
20.93% |
10.34% |
10.60% |
MSCI® ACWI Index (Net, USD, Unhedged) |
22.34% |
11.19% |
11.71% | |
| AssetsNet |
$ 441,124,147
|
| Holdings Count | Holding |
17
|
| Advisory Fees Paid, Amount |
$ 610,086
|
| InvestmentCompanyPortfolioTurnover |
36.00%
|
| Additional Fund Statistics [Text Block] |
Total Net Assets as of Period End |
$441,124,147 |
# of Portfolio Holdings as of Period End |
17 |
Portfolio Turnover Rate for the Period |
36% |
Total Net Advisory Fees Paid for the Period |
$610,086 | |
| Holdings [Text Block] |
Equity |
55.5% |
Exchange-Traded Funds |
38.2% |
Investment Companies |
2.3% | |
| Material Fund Change [Text Block] |
|
| Updated Prospectus Phone Number |
1-800-526-7384
|
| Updated Prospectus Web Address |
<span style="box-sizing: border-box; color: rgb(0, 0, 0); display: inline; flex-wrap: nowrap; font-size: 12px; font-weight: 400; grid-area: auto; line-height: 18px; margin: 0px; overflow: visible; text-align: left; text-align-last: auto; white-space-collapse: preserve-breaks;">dfinview.com/GoldmanSachs</span>
|
| C000161534 |
|
| Shareholder Report [Line Items] |
|
| Fund Name |
Goldman Sachs Dynamic Global Equity Fund
|
| Class Name |
Class R6
|
| Trading Symbol |
GAPUX
|
| Annual or Semi-Annual Statement [Text Block] |
This annual shareholder report contains important information about Goldman Sachs Dynamic Global Equity Fund (the “Fund”) for the period of January 1, 2025 to December 31, 2025 (the “Period”).
|
| Additional Information [Text Block] |
You can find additional information about the Fund at am.gs.com or dfinview.com/GoldmanSachs. You can also request this information by contacting us at 1-800-621-2550.
|
| Additional Information Phone Number |
1-800-621-2550
|
| Additional Information Website |
<span style="box-sizing: border-box; color: rgb(0, 0, 0); display: inline; flex-wrap: nowrap; font-size: 12px; font-weight: 400; grid-area: auto; line-height: 18px; margin: 0px; overflow: visible; text-align: left; text-align-last: auto; white-space-collapse: preserve-breaks;">am.gs.com</span>
|
| Expenses [Text Block] |
What were the Fund costs for the Period?Based on a hypothetical $10,000 investment.
Class |
Costs of a $10,000 investment |
Costs paid as a percentage of a $10,000 investment |
R6 |
$20 |
0.18% | |
| Expenses Paid, Amount |
$ 20
|
| Expense Ratio, Percent |
0.18%
|
| Factors Affecting Performance [Text Block] |
How did the Fund perform and what affected its performance?The broad international equity market was volatile but strong amid tariff uncertainty and geopolitical tensions. Further boosting sentiment was an improving economic outlook in Europe, central bank rate cuts, increased defense spending, rising commodity prices, resilient corporate earnings and enthusiasm for technology/AI. |
| Performance Past Does Not Indicate Future [Text] |
Performance data quoted above represents past performance. Past performance does not guarantee future results.
|
| Line Graph [Table Text Block] |
|
Class R6 |
MSCI® ACWI Index (Net, USD, Unhedged) |
1/1/16 |
$10,000 |
$10,000 |
12/16 |
$10,714 |
$10,786 |
12/17 |
$13,557 |
$13,372 |
12/18 |
$12,066 |
$12,113 |
12/19 |
$15,220 |
$15,335 |
12/20 |
$17,292 |
$17,828 |
12/21 |
$20,845 |
$21,133 |
12/22 |
$16,887 |
$17,252 |
12/23 |
$20,375 |
$21,082 |
12/24 |
$23,994 |
$24,769 |
12/25 |
$29,203 |
$30,302 |
|
| Average Annual Return [Table Text Block] |
AATR |
1 Year |
5 Years |
10 Years |
Class R6 |
21.71% |
11.04% |
11.30% |
MSCI® ACWI Index (Net, USD, Unhedged) |
22.34% |
11.19% |
11.71% | |
| AssetsNet |
$ 441,124,147
|
| Holdings Count | Holding |
17
|
| Advisory Fees Paid, Amount |
$ 610,086
|
| InvestmentCompanyPortfolioTurnover |
36.00%
|
| Additional Fund Statistics [Text Block] |
Total Net Assets as of Period End |
$441,124,147 |
# of Portfolio Holdings as of Period End |
17 |
Portfolio Turnover Rate for the Period |
36% |
Total Net Advisory Fees Paid for the Period |
$610,086 | |
| Holdings [Text Block] |
Equity |
55.5% |
Exchange-Traded Funds |
38.2% |
Investment Companies |
2.3% | |
| Material Fund Change [Text Block] |
|
| Updated Prospectus Phone Number |
1-800-621-2550
|
| Updated Prospectus Web Address |
<span style="box-sizing: border-box; color: rgb(0, 0, 0); display: inline; flex-wrap: nowrap; font-size: 12px; font-weight: 400; grid-area: auto; line-height: 18px; margin: 0px; overflow: visible; text-align: left; text-align-last: auto; white-space-collapse: preserve-breaks;">dfinview.com/GoldmanSachs</span>
|
| C000025589 |
|
| Shareholder Report [Line Items] |
|
| Fund Name |
Goldman Sachs Dynamic Global Equity Fund
|
| Class Name |
Institutional Class
|
| Trading Symbol |
GAPIX
|
| Annual or Semi-Annual Statement [Text Block] |
This annual shareholder report contains important information about Goldman Sachs Dynamic Global Equity Fund (the “Fund”) for the period of January 1, 2025 to December 31, 2025 (the “Period”).
|
| Additional Information [Text Block] |
You can find additional information about the Fund at am.gs.com or dfinview.com/GoldmanSachs. You can also request this information by contacting us at 1-800-621-2550.
|
| Additional Information Phone Number |
1-800-621-2550
|
| Additional Information Website |
<span style="box-sizing: border-box; color: rgb(0, 0, 0); display: inline; flex-wrap: nowrap; font-size: 12px; font-weight: 400; grid-area: auto; line-height: 18px; margin: 0px; overflow: visible; text-align: left; text-align-last: auto; white-space-collapse: preserve-breaks;">am.gs.com</span>
|
| Expenses [Text Block] |
What were the Fund costs for the Period?Based on a hypothetical $10,000 investment.
Class |
Costs of a $10,000 investment |
Costs paid as a percentage of a $10,000 investment |
Institutional |
$21 |
0.19% | |
| Expenses Paid, Amount |
$ 21
|
| Expense Ratio, Percent |
0.19%
|
| Factors Affecting Performance [Text Block] |
How did the Fund perform and what affected its performance?The broad international equity market was volatile but strong amid tariff uncertainty and geopolitical tensions. Further boosting sentiment was an improving economic outlook in Europe, central bank rate cuts, increased defense spending, rising commodity prices, resilient corporate earnings and enthusiasm for technology/AI. |
| Performance Past Does Not Indicate Future [Text] |
Performance data quoted above represents past performance. Past performance does not guarantee future results.
|
| Line Graph [Table Text Block] |
|
Institutional Shares |
MSCI® ACWI Index (Net, USD, Unhedged) |
1/1/16 |
$1,000,000 |
$1,000,000 |
12/16 |
$1,072,000 |
$1,078,643 |
12/17 |
$1,355,866 |
$1,337,216 |
12/18 |
$1,205,771 |
$1,211,325 |
12/19 |
$1,521,442 |
$1,533,506 |
12/20 |
$1,728,358 |
$1,782,776 |
12/21 |
$2,082,672 |
$2,113,255 |
12/22 |
$1,687,381 |
$1,725,177 |
12/23 |
$2,035,825 |
$2,108,199 |
12/24 |
$2,397,184 |
$2,476,895 |
12/25 |
$2,917,133 |
$3,030,169 |
|
| Average Annual Return [Table Text Block] |
AATR |
1 Year |
5 Years |
10 Years |
Institutional Shares |
21.69% |
11.03% |
11.29% |
MSCI® ACWI Index (Net, USD, Unhedged) |
22.34% |
11.19% |
11.71% | |
| AssetsNet |
$ 441,124,147
|
| Holdings Count | Holding |
17
|
| Advisory Fees Paid, Amount |
$ 610,086
|
| InvestmentCompanyPortfolioTurnover |
36.00%
|
| Additional Fund Statistics [Text Block] |
Total Net Assets as of Period End |
$441,124,147 |
# of Portfolio Holdings as of Period End |
17 |
Portfolio Turnover Rate for the Period |
36% |
Total Net Advisory Fees Paid for the Period |
$610,086 | |
| Holdings [Text Block] |
Equity |
55.5% |
Exchange-Traded Funds |
38.2% |
Investment Companies |
2.3% | |
| Material Fund Change [Text Block] |
|
| Updated Prospectus Phone Number |
1-800-621-2550
|
| Updated Prospectus Web Address |
<span style="box-sizing: border-box; color: rgb(0, 0, 0); display: inline; flex-wrap: nowrap; font-size: 12px; font-weight: 400; grid-area: auto; line-height: 18px; margin: 0px; overflow: visible; text-align: left; text-align-last: auto; white-space-collapse: preserve-breaks;">dfinview.com/GoldmanSachs</span>
|
| C000058976 |
|
| Shareholder Report [Line Items] |
|
| Fund Name |
Goldman Sachs Dynamic Global Equity Fund
|
| Class Name |
Investor Class
|
| Trading Symbol |
GAPTX
|
| Annual or Semi-Annual Statement [Text Block] |
This annual shareholder report contains important information about Goldman Sachs Dynamic Global Equity Fund (the “Fund”) for the period of January 1, 2025 to December 31, 2025 (the “Period”).
|
| Additional Information [Text Block] |
You can find additional information about the Fund at am.gs.com or dfinview.com/GoldmanSachs. You can also request this information by contacting us at 1-800-526-7384.
|
| Additional Information Phone Number |
1-800-526-7384
|
| Additional Information Website |
<span style="box-sizing: border-box; color: rgb(0, 0, 0); display: inline; flex-wrap: nowrap; font-size: 12px; font-weight: 400; grid-area: auto; line-height: 18px; margin: 0px; overflow: visible; text-align: left; text-align-last: auto; white-space-collapse: preserve-breaks;">am.gs.com</span>
|
| Expenses [Text Block] |
What were the Fund costs for the Period?Based on a hypothetical $10,000 investment.
Class |
Costs of a $10,000 investment |
Costs paid as a percentage of a $10,000 investment |
Investor |
$33 |
0.30% | |
| Expenses Paid, Amount |
$ 33
|
| Expense Ratio, Percent |
0.30%
|
| Factors Affecting Performance [Text Block] |
How did the Fund perform and what affected its performance?The broad international equity market was volatile but strong amid tariff uncertainty and geopolitical tensions. Further boosting sentiment was an improving economic outlook in Europe, central bank rate cuts, increased defense spending, rising commodity prices, resilient corporate earnings and enthusiasm for technology/AI. |
| Performance Past Does Not Indicate Future [Text] |
Performance data quoted above represents past performance. Past performance does not guarantee future results.
|
| Line Graph [Table Text Block] |
|
Investor Shares |
MSCI® ACWI Index (Net, USD, Unhedged) |
1/1/16 |
$10,000 |
$10,000 |
12/16 |
$10,701 |
$10,786 |
12/17 |
$13,521 |
$13,372 |
12/18 |
$12,009 |
$12,113 |
12/19 |
$15,128 |
$15,335 |
12/20 |
$17,167 |
$17,828 |
12/21 |
$20,662 |
$21,133 |
12/22 |
$16,720 |
$17,252 |
12/23 |
$20,151 |
$21,082 |
12/24 |
$23,703 |
$24,769 |
12/25 |
$28,804 |
$30,302 |
|
| Average Annual Return [Table Text Block] |
AATR |
1 Year |
5 Years |
10 Years |
Investor Shares |
21.52% |
10.90% |
11.15% |
MSCI® ACWI Index (Net, USD, Unhedged) |
22.34% |
11.19% |
11.71% | |
| AssetsNet |
$ 441,124,147
|
| Holdings Count | Holding |
17
|
| Advisory Fees Paid, Amount |
$ 610,086
|
| InvestmentCompanyPortfolioTurnover |
36.00%
|
| Additional Fund Statistics [Text Block] |
Total Net Assets as of Period End |
$441,124,147 |
# of Portfolio Holdings as of Period End |
17 |
Portfolio Turnover Rate for the Period |
36% |
Total Net Advisory Fees Paid for the Period |
$610,086 | |
| Holdings [Text Block] |
Equity |
55.5% |
Exchange-Traded Funds |
38.2% |
Investment Companies |
2.3% | |
| Material Fund Change [Text Block] |
|
| Updated Prospectus Phone Number |
1-800-526-7384
|
| Updated Prospectus Web Address |
<span style="box-sizing: border-box; color: rgb(0, 0, 0); display: inline; flex-wrap: nowrap; font-size: 12px; font-weight: 400; grid-area: auto; line-height: 18px; margin: 0px; overflow: visible; text-align: left; text-align-last: auto; white-space-collapse: preserve-breaks;">dfinview.com/GoldmanSachs</span>
|
| C000025590 |
|
| Shareholder Report [Line Items] |
|
| Fund Name |
Goldman Sachs Dynamic Global Equity Fund
|
| Class Name |
Service Class
|
| Trading Symbol |
GAPSX
|
| Annual or Semi-Annual Statement [Text Block] |
This annual shareholder report contains important information about Goldman Sachs Dynamic Global Equity Fund (the “Fund”) for the period of January 1, 2025 to December 31, 2025 (the “Period”).
|
| Additional Information [Text Block] |
You can find additional information about the Fund at am.gs.com or dfinview.com/GoldmanSachs. You can also request this information by contacting us at 1-800-621-2550.
|
| Additional Information Phone Number |
1-800-621-2550
|
| Additional Information Website |
<span style="box-sizing: border-box; color: rgb(0, 0, 0); display: inline; flex-wrap: nowrap; font-size: 12px; font-weight: 400; grid-area: auto; line-height: 18px; margin: 0px; overflow: visible; text-align: left; text-align-last: auto; white-space-collapse: preserve-breaks;">am.gs.com</span>
|
| Expenses [Text Block] |
What were the Fund costs for the Period?Based on a hypothetical $10,000 investment.
Class |
Costs of a $10,000 investment |
Costs paid as a percentage of a $10,000 investment |
Service |
$76 |
0.69% | |
| Expenses Paid, Amount |
$ 76
|
| Expense Ratio, Percent |
0.69%
|
| Factors Affecting Performance [Text Block] |
How did the Fund perform and what affected its performance?The broad international equity market was volatile but strong amid tariff uncertainty and geopolitical tensions. Further boosting sentiment was an improving economic outlook in Europe, central bank rate cuts, increased defense spending, rising commodity prices, resilient corporate earnings and enthusiasm for technology/AI. |
| Performance Past Does Not Indicate Future [Text] |
Performance data quoted above represents past performance. Past performance does not guarantee future results.
|
| Line Graph [Table Text Block] |
|
Service Shares |
MSCI® ACWI Index (Net, USD, Unhedged) |
1/1/16 |
$10,000 |
$10,000 |
12/16 |
$10,668 |
$10,786 |
12/17 |
$13,419 |
$13,372 |
12/18 |
$11,879 |
$12,113 |
12/19 |
$14,907 |
$15,335 |
12/20 |
$16,856 |
$17,828 |
12/21 |
$20,211 |
$21,133 |
12/22 |
$16,292 |
$17,252 |
12/23 |
$19,565 |
$21,082 |
12/24 |
$22,918 |
$24,769 |
12/25 |
$27,743 |
$30,302 |
|
| Average Annual Return [Table Text Block] |
AATR |
1 Year |
5 Years |
10 Years |
Service Shares |
21.05% |
10.47% |
10.73% |
MSCI® ACWI Index (Net, USD, Unhedged) |
22.34% |
11.19% |
11.71% | |
| AssetsNet |
$ 441,124,147
|
| Holdings Count | Holding |
17
|
| Advisory Fees Paid, Amount |
$ 610,086
|
| InvestmentCompanyPortfolioTurnover |
36.00%
|
| Additional Fund Statistics [Text Block] |
Total Net Assets as of Period End |
$441,124,147 |
# of Portfolio Holdings as of Period End |
17 |
Portfolio Turnover Rate for the Period |
36% |
Total Net Advisory Fees Paid for the Period |
$610,086 | |
| Holdings [Text Block] |
Equity |
55.5% |
Exchange-Traded Funds |
38.2% |
Investment Companies |
2.3% | |
| Material Fund Change [Text Block] |
|
| Updated Prospectus Phone Number |
1-800-621-2550
|
| Updated Prospectus Web Address |
<span style="box-sizing: border-box; color: rgb(0, 0, 0); display: inline; flex-wrap: nowrap; font-size: 12px; font-weight: 400; grid-area: auto; line-height: 18px; margin: 0px; overflow: visible; text-align: left; text-align-last: auto; white-space-collapse: preserve-breaks;">dfinview.com/GoldmanSachs</span>
|
| C000050447 |
|
| Shareholder Report [Line Items] |
|
| Fund Name |
Goldman Sachs International Equity Dividend and Premium Fund
|
| Class Name |
Class A
|
| Trading Symbol |
GIDAX
|
| Annual or Semi-Annual Statement [Text Block] |
This annual shareholder report contains important information about Goldman Sachs International Equity Dividend and Premium Fund (the “Fund”) for the period of January 1, 2025 to December 31, 2025 (the “Period”).
|
| Additional Information [Text Block] |
You can find additional information about the Fund at am.gs.com or dfinview.com/GoldmanSachs. You can also request this information by contacting us at 1-800-526-7384.
|
| Additional Information Phone Number |
1-800-526-7384
|
| Additional Information Website |
<span style="box-sizing: border-box; color: rgb(0, 0, 0); display: inline; flex-wrap: nowrap; font-size: 12px; font-weight: 400; grid-area: auto; line-height: 18px; margin: 0px; overflow: visible; text-align: left; text-align-last: auto; white-space-collapse: preserve-breaks;">am.gs.com</span>
|
| Expenses [Text Block] |
What were the Fund costs for the Period?Based on a hypothetical $10,000 investment.
Class |
Costs of a $10,000 investment |
Costs paid as a percentage of a $10,000 investment |
A |
$136 |
1.19% | |
| Expenses Paid, Amount |
$ 136
|
| Expense Ratio, Percent |
1.19%
|
| Factors Affecting Performance [Text Block] |
How did the Fund perform and what affected its performance?The broad international equity market was volatile but strong amid tariff uncertainty and geopolitical tensions. The market advance was supported by an improving economic outlook in Europe, central bank rate cuts, increased defense spending, rising commodity prices, resilient corporate earnings and enthusiasm for technology/AI. |
| Performance Past Does Not Indicate Future [Text] |
Performance data quoted above represents past performance. Past performance does not guarantee future results.
|
| Line Graph [Table Text Block] |
|
Class A (including sales charges) |
Class A (excluding sales charges) |
Bloomberg Global Aggregate Bond Index (Gross, USD, Unhedged) |
MSCI EAFE Index (Net, USD, Unhedged) |
1/1/16 |
$9,450 |
$10,000 |
$10,000 |
$10,000 |
12/16 |
$9,512 |
$10,066 |
$10,209 |
$10,100 |
12/17 |
$11,734 |
$12,417 |
$10,964 |
$12,628 |
12/18 |
$10,169 |
$10,761 |
$10,832 |
$10,887 |
12/19 |
$11,635 |
$12,313 |
$11,573 |
$13,284 |
12/20 |
$11,744 |
$12,427 |
$12,637 |
$14,322 |
12/21 |
$12,794 |
$13,538 |
$12,042 |
$15,935 |
12/22 |
$11,477 |
$12,145 |
$10,085 |
$13,632 |
12/23 |
$13,303 |
$14,077 |
$10,662 |
$16,118 |
12/24 |
$12,967 |
$13,721 |
$10,482 |
$16,735 |
12/25 |
$16,745 |
$17,720 |
$11,338 |
$21,959 |
|
| Average Annual Return [Table Text Block] |
AATR |
1 Year |
5 Years |
10 Years |
Class A |
29.14% |
7.35% |
5.88% |
Class A including sales charges |
22.11% |
6.13% |
5.29% |
Bloomberg Global Aggregate Bond Index (Gross, USD, Unhedged) |
8.17% |
-2.14% |
1.26% |
MSCI EAFE Index (Net, USD, Unhedged) |
31.22% |
8.92% |
8.18% | |
| AssetsNet |
$ 152,534,131
|
| Holdings Count | Holding |
277
|
| Advisory Fees Paid, Amount |
$ 1,192,812
|
| InvestmentCompanyPortfolioTurnover |
16.00%
|
| Additional Fund Statistics [Text Block] |
Total Net Assets as of Period End |
$152,534,131 |
# of Portfolio Holdings as of Period End |
277 |
Portfolio Turnover Rate for the Period |
16% |
Total Net Advisory Fees Paid for the Period |
$1,192,812 | |
| Holdings [Text Block] |
Financials |
26.5% |
Industrials |
19.7% |
Health Care |
10.4% |
Consumer Discretionary |
9.3% |
Information Technology |
7.6% |
Consumer Staples |
6.6% |
Materials |
5.8% |
Communication Services |
5.0% |
Utilities |
4.5% |
Other |
4.5% | |
| Material Fund Change [Text Block] |
|
| Updated Prospectus Phone Number |
1-800-526-7384
|
| Updated Prospectus Web Address |
<span style="box-sizing: border-box; color: rgb(0, 0, 0); display: inline; flex-wrap: nowrap; font-size: 12px; font-weight: 400; grid-area: auto; line-height: 18px; margin: 0px; overflow: visible; text-align: left; text-align-last: auto; white-space-collapse: preserve-breaks;">dfinview.com/GoldmanSachs</span>
|
| C000050448 |
|
| Shareholder Report [Line Items] |
|
| Fund Name |
Goldman Sachs International Equity Dividend and Premium Fund
|
| Class Name |
Class C
|
| Trading Symbol |
GIDCX
|
| Annual or Semi-Annual Statement [Text Block] |
This annual shareholder report contains important information about Goldman Sachs International Equity Dividend and Premium Fund (the “Fund”) for the period of January 1, 2025 to December 31, 2025 (the “Period”).
|
| Additional Information [Text Block] |
You can find additional information about the Fund at am.gs.com or dfinview.com/GoldmanSachs. You can also request this information by contacting us at 1-800-526-7384.
|
| Additional Information Phone Number |
1-800-526-7384
|
| Additional Information Website |
<span style="box-sizing: border-box; color: rgb(0, 0, 0); display: inline; flex-wrap: nowrap; font-size: 12px; font-weight: 400; grid-area: auto; line-height: 18px; margin: 0px; overflow: visible; text-align: left; text-align-last: auto; white-space-collapse: preserve-breaks;">am.gs.com</span>
|
| Expenses [Text Block] |
What were the Fund costs for the Period?Based on a hypothetical $10,000 investment.
Class |
Costs of a $10,000 investment |
Costs paid as a percentage of a $10,000 investment |
C |
$223 |
1.95% | |
| Expenses Paid, Amount |
$ 223
|
| Expense Ratio, Percent |
1.95%
|
| Factors Affecting Performance [Text Block] |
How did the Fund perform and what affected its performance?The broad international equity market was volatile but strong amid tariff uncertainty and geopolitical tensions. The market advance was supported by an improving economic outlook in Europe, central bank rate cuts, increased defense spending, rising commodity prices, resilient corporate earnings and enthusiasm for technology/AI. |
| Performance Past Does Not Indicate Future [Text] |
Performance data quoted above represents past performance. Past performance does not guarantee future results.
|
| Line Graph [Table Text Block] |
|
Class C (including sales charges) |
Class C (excluding sales charges) |
Bloomberg Global Aggregate Bond Index (Gross, USD, Unhedged) |
MSCI EAFE Index (Net, USD, Unhedged) |
1/1/16 |
$9,900 |
$10,000 |
$10,000 |
$10,000 |
12/16 |
$9,879 |
$9,979 |
$10,209 |
$10,100 |
12/17 |
$12,102 |
$12,224 |
$10,964 |
$12,628 |
12/18 |
$10,407 |
$10,512 |
$10,832 |
$10,887 |
12/19 |
$11,816 |
$11,935 |
$11,573 |
$13,284 |
12/20 |
$11,837 |
$11,956 |
$12,637 |
$14,322 |
12/21 |
$12,810 |
$12,939 |
$12,042 |
$15,935 |
12/22 |
$11,402 |
$11,517 |
$10,085 |
$13,632 |
12/23 |
$13,111 |
$13,244 |
$10,662 |
$16,118 |
12/24 |
$12,686 |
$12,815 |
$10,482 |
$16,735 |
12/25 |
$16,272 |
$16,436 |
$11,338 |
$21,959 |
|
| Average Annual Return [Table Text Block] |
AATR |
1 Year |
5 Years |
10 Years |
Class C |
28.26% |
6.57% |
5.09% |
Class C including sales charges |
27.24% |
6.57% |
5.09% |
Bloomberg Global Aggregate Bond Index (Gross, USD, Unhedged) |
8.17% |
-2.14% |
1.26% |
MSCI EAFE Index (Net, USD, Unhedged) |
31.22% |
8.92% |
8.18% | |
| AssetsNet |
$ 152,534,131
|
| Holdings Count | Holding |
277
|
| Advisory Fees Paid, Amount |
$ 1,192,812
|
| InvestmentCompanyPortfolioTurnover |
16.00%
|
| Additional Fund Statistics [Text Block] |
Total Net Assets as of Period End |
$152,534,131 |
# of Portfolio Holdings as of Period End |
277 |
Portfolio Turnover Rate for the Period |
16% |
Total Net Advisory Fees Paid for the Period |
$1,192,812 | |
| Holdings [Text Block] |
Financials |
26.5% |
Industrials |
19.7% |
Health Care |
10.4% |
Consumer Discretionary |
9.3% |
Information Technology |
7.6% |
Consumer Staples |
6.6% |
Materials |
5.8% |
Communication Services |
5.0% |
Utilities |
4.5% |
Other |
4.5% | |
| Material Fund Change [Text Block] |
|
| Updated Prospectus Phone Number |
1-800-526-7384
|
| Updated Prospectus Web Address |
<span style="box-sizing: border-box; color: rgb(0, 0, 0); display: inline; flex-wrap: nowrap; font-size: 12px; font-weight: 400; grid-area: auto; line-height: 18px; margin: 0px; overflow: visible; text-align: left; text-align-last: auto; white-space-collapse: preserve-breaks;">dfinview.com/GoldmanSachs</span>
|
| C000201772 |
|
| Shareholder Report [Line Items] |
|
| Fund Name |
Goldman Sachs International Equity Dividend and Premium Fund
|
| Class Name |
Class P
|
| Trading Symbol |
GGHPX
|
| Annual or Semi-Annual Statement [Text Block] |
This annual shareholder report contains important information about Goldman Sachs International Equity Dividend and Premium Fund (the “Fund”) for the period of January 1, 2025 to December 31, 2025 (the “Period”).
|
| Additional Information [Text Block] |
You can find additional information about the Fund at am.gs.com or dfinview.com/GoldmanSachs. You can also request this information by contacting us at 1-800-621-2550.
|
| Additional Information Phone Number |
1-800-621-2550
|
| Additional Information Website |
<span style="box-sizing: border-box; color: rgb(0, 0, 0); display: inline; flex-wrap: nowrap; font-size: 12px; font-weight: 400; grid-area: auto; line-height: 18px; margin: 0px; overflow: visible; text-align: left; text-align-last: auto; white-space-collapse: preserve-breaks;">am.gs.com</span>
|
| Expenses [Text Block] |
What were the Fund costs for the Period?Based on a hypothetical $10,000 investment.
Class |
Costs of a $10,000 investment |
Costs paid as a percentage of a $10,000 investment |
P |
$101 |
0.88% | |
| Expenses Paid, Amount |
$ 101
|
| Expense Ratio, Percent |
0.88%
|
| Factors Affecting Performance [Text Block] |
How did the Fund perform and what affected its performance?The broad international equity market was volatile but strong amid tariff uncertainty and geopolitical tensions. The market advance was supported by an improving economic outlook in Europe, central bank rate cuts, increased defense spending, rising commodity prices, resilient corporate earnings and enthusiasm for technology/AI. |
| Performance Past Does Not Indicate Future [Text] |
Performance data quoted above represents past performance. Past performance does not guarantee future results.
|
| Line Graph [Table Text Block] |
|
Class P |
Bloomberg Global Aggregate Bond Index (Gross, USD, Unhedged) |
MSCI EAFE Index (Net, USD, Unhedged) |
4/17/18 |
$10,000 |
$10,000 |
$10,000 |
12/18 |
$8,565 |
$9,742 |
$8,548 |
12/19 |
$9,835 |
$10,409 |
$10,430 |
12/20 |
$9,967 |
$11,366 |
$11,245 |
12/21 |
$10,901 |
$10,831 |
$12,511 |
12/22 |
$9,814 |
$9,071 |
$10,703 |
12/23 |
$11,398 |
$9,589 |
$12,655 |
12/24 |
$11,154 |
$9,427 |
$13,139 |
12/25 |
$14,457 |
$10,197 |
$17,241 |
|
| Average Annual Return [Table Text Block] |
AATR |
1 Year |
5 Years |
Since Inception |
Class P (Commenced April 17, 2018) |
29.61% |
7.72% |
4.89% |
Bloomberg Global Aggregate Bond Index (Gross, USD, Unhedged) |
8.17% |
-2.14% |
0.25% |
MSCI EAFE Index (Net, USD, Unhedged) |
31.22% |
8.92% |
7.32% | |
| Performance Inception Date |
Apr. 17, 2018
|
| AssetsNet |
$ 152,534,131
|
| Holdings Count | Holding |
277
|
| Advisory Fees Paid, Amount |
$ 1,192,812
|
| InvestmentCompanyPortfolioTurnover |
16.00%
|
| Additional Fund Statistics [Text Block] |
Total Net Assets as of Period End |
$152,534,131 |
# of Portfolio Holdings as of Period End |
277 |
Portfolio Turnover Rate for the Period |
16% |
Total Net Advisory Fees Paid for the Period |
$1,192,812 | |
| Holdings [Text Block] |
Financials |
26.5% |
Industrials |
19.7% |
Health Care |
10.4% |
Consumer Discretionary |
9.3% |
Information Technology |
7.6% |
Consumer Staples |
6.6% |
Materials |
5.8% |
Communication Services |
5.0% |
Utilities |
4.5% |
Other |
4.5% | |
| Material Fund Change [Text Block] |
|
| Updated Prospectus Phone Number |
1-800-621-2550
|
| Updated Prospectus Web Address |
<span style="box-sizing: border-box; color: rgb(0, 0, 0); display: inline; flex-wrap: nowrap; font-size: 12px; font-weight: 400; grid-area: auto; line-height: 18px; margin: 0px; overflow: visible; text-align: left; text-align-last: auto; white-space-collapse: preserve-breaks;">dfinview.com/GoldmanSachs</span>
|
| C000200309 |
|
| Shareholder Report [Line Items] |
|
| Fund Name |
Goldman Sachs International Equity Dividend and Premium Fund
|
| Class Name |
Class R6
|
| Trading Symbol |
GIDUX
|
| Annual or Semi-Annual Statement [Text Block] |
This annual shareholder report contains important information about Goldman Sachs International Equity Dividend and Premium Fund (the “Fund”) for the period of January 1, 2025 to December 31, 2025 (the “Period”).
|
| Additional Information [Text Block] |
You can find additional information about the Fund at am.gs.com or dfinview.com/GoldmanSachs. You can also request this information by contacting us at 1-800-621-2550.
|
| Additional Information Phone Number |
1-800-621-2550
|
| Additional Information Website |
<span style="box-sizing: border-box; color: rgb(0, 0, 0); display: inline; flex-wrap: nowrap; font-size: 12px; font-weight: 400; grid-area: auto; line-height: 18px; margin: 0px; overflow: visible; text-align: left; text-align-last: auto; white-space-collapse: preserve-breaks;">am.gs.com</span>
|
| Expenses [Text Block] |
What were the Fund costs for the Period?Based on a hypothetical $10,000 investment.
Class |
Costs of a $10,000 investment |
Costs paid as a percentage of a $10,000 investment |
R6 |
$101 |
0.88% | |
| Expenses Paid, Amount |
$ 101
|
| Expense Ratio, Percent |
0.88%
|
| Factors Affecting Performance [Text Block] |
How did the Fund perform and what affected its performance?The broad international equity market was volatile but strong amid tariff uncertainty and geopolitical tensions. The market advance was supported by an improving economic outlook in Europe, central bank rate cuts, increased defense spending, rising commodity prices, resilient corporate earnings and enthusiasm for technology/AI. |
| Performance Past Does Not Indicate Future [Text] |
Performance data quoted above represents past performance. Past performance does not guarantee future results.
|
| Line Graph [Table Text Block] |
|
Class R6 |
Bloomberg Global Aggregate Bond Index (Gross, USD, Unhedged) |
MSCI EAFE Index (Net, USD, Unhedged) |
4/30/18 |
$10,000 |
$10,000 |
$10,000 |
12/18 |
$8,675 |
$9,906 |
$8,560 |
12/19 |
$9,963 |
$10,584 |
$10,444 |
12/20 |
$10,097 |
$11,557 |
$11,260 |
12/21 |
$11,044 |
$11,013 |
$12,529 |
12/22 |
$9,941 |
$9,223 |
$10,718 |
12/23 |
$11,548 |
$9,750 |
$12,673 |
12/24 |
$11,301 |
$9,586 |
$13,157 |
12/25 |
$14,651 |
$10,369 |
$17,265 |
|
| Average Annual Return [Table Text Block] |
AATR |
1 Year |
5 Years |
Since Inception |
Class R6 (Commenced April 30, 2018) |
29.65% |
7.73% |
5.10% |
Bloomberg Global Aggregate Bond Index (Gross, USD, Unhedged) |
8.17% |
-2.14% |
0.47% |
MSCI EAFE Index (Net, USD, Unhedged) |
31.22% |
8.92% |
7.37% | |
| Performance Inception Date |
Apr. 30, 2018
|
| AssetsNet |
$ 152,534,131
|
| Holdings Count | Holding |
277
|
| Advisory Fees Paid, Amount |
$ 1,192,812
|
| InvestmentCompanyPortfolioTurnover |
16.00%
|
| Additional Fund Statistics [Text Block] |
Total Net Assets as of Period End |
$152,534,131 |
# of Portfolio Holdings as of Period End |
277 |
Portfolio Turnover Rate for the Period |
16% |
Total Net Advisory Fees Paid for the Period |
$1,192,812 | |
| Holdings [Text Block] |
Financials |
26.5% |
Industrials |
19.7% |
Health Care |
10.4% |
Consumer Discretionary |
9.3% |
Information Technology |
7.6% |
Consumer Staples |
6.6% |
Materials |
5.8% |
Communication Services |
5.0% |
Utilities |
4.5% |
Other |
4.5% | |
| Material Fund Change [Text Block] |
|
| Updated Prospectus Phone Number |
1-800-621-2550
|
| Updated Prospectus Web Address |
<span style="box-sizing: border-box; color: rgb(0, 0, 0); display: inline; flex-wrap: nowrap; font-size: 12px; font-weight: 400; grid-area: auto; line-height: 18px; margin: 0px; overflow: visible; text-align: left; text-align-last: auto; white-space-collapse: preserve-breaks;">dfinview.com/GoldmanSachs</span>
|
| C000050446 |
|
| Shareholder Report [Line Items] |
|
| Fund Name |
Goldman Sachs International Equity Dividend and Premium Fund
|
| Class Name |
Institutional Class
|
| Trading Symbol |
GIDHX
|
| Annual or Semi-Annual Statement [Text Block] |
This annual shareholder report contains important information about Goldman Sachs International Equity Dividend and Premium Fund (the “Fund”) for the period of January 1, 2025 to December 31, 2025 (the “Period”).
|
| Additional Information [Text Block] |
You can find additional information about the Fund at am.gs.com or dfinview.com/GoldmanSachs. You can also request this information by contacting us at 1-800-621-2550.
|
| Additional Information Phone Number |
1-800-621-2550
|
| Additional Information Website |
<span style="box-sizing: border-box; color: rgb(0, 0, 0); display: inline; flex-wrap: nowrap; font-size: 12px; font-weight: 400; grid-area: auto; line-height: 18px; margin: 0px; overflow: visible; text-align: left; text-align-last: auto; white-space-collapse: preserve-breaks;">am.gs.com</span>
|
| Expenses [Text Block] |
What were the Fund costs for the Period?Based on a hypothetical $10,000 investment.
Class |
Costs of a $10,000 investment |
Costs paid as a percentage of a $10,000 investment |
Institutional |
$102 |
0.89% | |
| Expenses Paid, Amount |
$ 102
|
| Expense Ratio, Percent |
0.89%
|
| Factors Affecting Performance [Text Block] |
How did the Fund perform and what affected its performance?The broad international equity market was volatile but strong amid tariff uncertainty and geopolitical tensions. The market advance was supported by an improving economic outlook in Europe, central bank rate cuts, increased defense spending, rising commodity prices, resilient corporate earnings and enthusiasm for technology/AI. |
| Performance Past Does Not Indicate Future [Text] |
Performance data quoted above represents past performance. Past performance does not guarantee future results.
|
| Line Graph [Table Text Block] |
|
Institutional Shares |
Bloomberg Global Aggregate Bond Index (Gross, USD, Unhedged) |
MSCI EAFE Index (Net, USD, Unhedged) |
1/1/16 |
$1,000,000 |
$1,000,000 |
$1,000,000 |
12/16 |
$1,009,200 |
$1,020,859 |
$1,010,002 |
12/17 |
$1,249,894 |
$1,096,351 |
$1,262,849 |
12/18 |
$1,087,908 |
$1,083,197 |
$1,088,699 |
12/19 |
$1,249,136 |
$1,157,283 |
$1,328,371 |
12/20 |
$1,264,001 |
$1,263,681 |
$1,432,193 |
12/21 |
$1,382,564 |
$1,204,201 |
$1,593,506 |
12/22 |
$1,244,446 |
$1,008,536 |
$1,363,217 |
12/23 |
$1,445,424 |
$1,066,175 |
$1,611,840 |
12/24 |
$1,414,347 |
$1,048,167 |
$1,673,463 |
12/25 |
$1,833,560 |
$1,133,780 |
$2,195,939 |
|
| Average Annual Return [Table Text Block] |
AATR |
1 Year |
5 Years |
10 Years |
Institutional Shares |
29.64% |
7.72% |
6.24% |
Bloomberg Global Aggregate Bond Index (Gross, USD, Unhedged) |
8.17% |
-2.14% |
1.26% |
MSCI EAFE Index (Net, USD, Unhedged) |
31.22% |
8.92% |
8.18% | |
| AssetsNet |
$ 152,534,131
|
| Holdings Count | Holding |
277
|
| Advisory Fees Paid, Amount |
$ 1,192,812
|
| InvestmentCompanyPortfolioTurnover |
16.00%
|
| Additional Fund Statistics [Text Block] |
Total Net Assets as of Period End |
$152,534,131 |
# of Portfolio Holdings as of Period End |
277 |
Portfolio Turnover Rate for the Period |
16% |
Total Net Advisory Fees Paid for the Period |
$1,192,812 | |
| Holdings [Text Block] |
Financials |
26.5% |
Industrials |
19.7% |
Health Care |
10.4% |
Consumer Discretionary |
9.3% |
Information Technology |
7.6% |
Consumer Staples |
6.6% |
Materials |
5.8% |
Communication Services |
5.0% |
Utilities |
4.5% |
Other |
4.5% | |
| Material Fund Change [Text Block] |
|
| Updated Prospectus Phone Number |
1-800-621-2550
|
| Updated Prospectus Web Address |
<span style="box-sizing: border-box; color: rgb(0, 0, 0); display: inline; flex-wrap: nowrap; font-size: 12px; font-weight: 400; grid-area: auto; line-height: 18px; margin: 0px; overflow: visible; text-align: left; text-align-last: auto; white-space-collapse: preserve-breaks;">dfinview.com/GoldmanSachs</span>
|
| C000091966 |
|
| Shareholder Report [Line Items] |
|
| Fund Name |
Goldman Sachs International Equity Dividend and Premium Fund
|
| Class Name |
Investor Class
|
| Trading Symbol |
GIRVX
|
| Annual or Semi-Annual Statement [Text Block] |
This annual shareholder report contains important information about Goldman Sachs International Equity Dividend and Premium Fund (the “Fund”) for the period of January 1, 2025 to December 31, 2025 (the “Period”).
|
| Additional Information [Text Block] |
You can find additional information about the Fund at am.gs.com or dfinview.com/GoldmanSachs. You can also request this information by contacting us at 1-800-526-7384.
|
| Additional Information Phone Number |
1-800-526-7384
|
| Additional Information Website |
<span style="box-sizing: border-box; color: rgb(0, 0, 0); display: inline; flex-wrap: nowrap; font-size: 12px; font-weight: 400; grid-area: auto; line-height: 18px; margin: 0px; overflow: visible; text-align: left; text-align-last: auto; white-space-collapse: preserve-breaks;">am.gs.com</span>
|
| Expenses [Text Block] |
What were the Fund costs for the Period?Based on a hypothetical $10,000 investment.
Class |
Costs of a $10,000 investment |
Costs paid as a percentage of a $10,000 investment |
Investor |
$108 |
0.94% | |
| Expenses Paid, Amount |
$ 108
|
| Expense Ratio, Percent |
0.94%
|
| Factors Affecting Performance [Text Block] |
How did the Fund perform and what affected its performance?The broad international equity market was volatile but strong amid tariff uncertainty and geopolitical tensions. The market advance was supported by an improving economic outlook in Europe, central bank rate cuts, increased defense spending, rising commodity prices, resilient corporate earnings and enthusiasm for technology/AI. |
| Performance Past Does Not Indicate Future [Text] |
Performance data quoted above represents past performance. Past performance does not guarantee future results.
|
| Line Graph [Table Text Block] |
|
Investor Shares |
Bloomberg Global Aggregate Bond Index (Gross, USD, Unhedged) |
MSCI EAFE Index (Net, USD, Unhedged) |
1/1/16 |
$10,000 |
$10,000 |
$10,000 |
12/16 |
$10,096 |
$10,209 |
$10,100 |
12/17 |
$12,477 |
$10,964 |
$12,628 |
12/18 |
$10,842 |
$10,832 |
$10,887 |
12/19 |
$12,437 |
$11,573 |
$13,284 |
12/20 |
$12,586 |
$12,637 |
$14,322 |
12/21 |
$13,738 |
$12,042 |
$15,935 |
12/22 |
$12,352 |
$10,085 |
$13,632 |
12/23 |
$14,344 |
$10,662 |
$16,118 |
12/24 |
$14,007 |
$10,482 |
$16,735 |
12/25 |
$18,169 |
$11,338 |
$21,959 |
|
| Average Annual Return [Table Text Block] |
AATR |
1 Year |
5 Years |
10 Years |
Investor Shares |
29.71% |
7.61% |
6.15% |
Bloomberg Global Aggregate Bond Index (Gross, USD, Unhedged) |
8.17% |
-2.14% |
1.26% |
MSCI EAFE Index (Net, USD, Unhedged) |
31.22% |
8.92% |
8.18% | |
| AssetsNet |
$ 152,534,131
|
| Holdings Count | Holding |
277
|
| Advisory Fees Paid, Amount |
$ 1,192,812
|
| InvestmentCompanyPortfolioTurnover |
16.00%
|
| Additional Fund Statistics [Text Block] |
Total Net Assets as of Period End |
$152,534,131 |
# of Portfolio Holdings as of Period End |
277 |
Portfolio Turnover Rate for the Period |
16% |
Total Net Advisory Fees Paid for the Period |
$1,192,812 | |
| Holdings [Text Block] |
Financials |
26.5% |
Industrials |
19.7% |
Health Care |
10.4% |
Consumer Discretionary |
9.3% |
Information Technology |
7.6% |
Consumer Staples |
6.6% |
Materials |
5.8% |
Communication Services |
5.0% |
Utilities |
4.5% |
Other |
4.5% | |
| Material Fund Change [Text Block] |
|
| Updated Prospectus Phone Number |
1-800-526-7384
|
| Updated Prospectus Web Address |
<span style="box-sizing: border-box; color: rgb(0, 0, 0); display: inline; flex-wrap: nowrap; font-size: 12px; font-weight: 400; grid-area: auto; line-height: 18px; margin: 0px; overflow: visible; text-align: left; text-align-last: auto; white-space-collapse: preserve-breaks;">dfinview.com/GoldmanSachs</span>
|
| C000025508 |
|
| Shareholder Report [Line Items] |
|
| Fund Name |
Goldman Sachs U.S. Equity Dividend and Premium Fund
|
| Class Name |
Class A
|
| Trading Symbol |
GSPAX
|
| Annual or Semi-Annual Statement [Text Block] |
This annual shareholder report contains important information about Goldman Sachs U.S. Equity Dividend and Premium Fund (the “Fund”) for the period of January 1, 2025 to December 31, 2025 (the “Period”).
|
| Additional Information [Text Block] |
You can find additional information about the Fund at am.gs.com or dfinview.com/GoldmanSachs. You can also request this information by contacting us at 1-800-526-7384.
|
| Additional Information Phone Number |
1-800-526-7384
|
| Additional Information Website |
<span style="box-sizing: border-box; color: rgb(0, 0, 0); display: inline; flex-wrap: nowrap; font-size: 12px; font-weight: 400; grid-area: auto; line-height: 18px; margin: 0px; overflow: visible; text-align: left; text-align-last: auto; white-space-collapse: preserve-breaks;">am.gs.com</span>
|
| Expenses [Text Block] |
What were the Fund costs for the Period?Based on a hypothetical $10,000 investment.
Class |
Costs of a $10,000 investment |
Costs paid as a percentage of a $10,000 investment |
A |
$107 |
1.00% | |
| Expenses Paid, Amount |
$ 107
|
| Expense Ratio, Percent |
1.00%
|
| Factors Affecting Performance [Text Block] |
How did the Fund perform and what affected its performance?The broad U.S. equity market was volatile but strong amid tariff uncertainty, mixed economic data, elevated valuations and a government shutdown. The market advance was supported by easing trade tensions, corporate earnings results, better inflation data, resilient consumer spending, AI growth optimism and the Fed’s monetary easing. |
| Performance Past Does Not Indicate Future [Text] |
Performance data quoted above represents past performance. Past performance does not guarantee future results.
|
| Line Graph [Table Text Block] |
|
Class A (including sales charges) |
Class A (excluding sales charges) |
Bloomberg U.S. Aggregate Bond Index |
S&P 500® Index |
1/1/16 |
$9,450 |
$10,000 |
$10,000 |
$10,000 |
12/16 |
$10,656 |
$11,276 |
$10,265 |
$11,196 |
12/17 |
$12,236 |
$12,948 |
$10,628 |
$13,640 |
12/18 |
$11,425 |
$12,090 |
$10,630 |
$13,042 |
12/19 |
$14,238 |
$15,066 |
$11,556 |
$17,149 |
12/20 |
$16,182 |
$17,124 |
$12,424 |
$20,304 |
12/21 |
$19,811 |
$20,964 |
$12,232 |
$26,132 |
12/22 |
$16,871 |
$17,853 |
$10,641 |
$21,399 |
12/23 |
$20,420 |
$21,609 |
$11,229 |
$27,025 |
12/24 |
$24,888 |
$26,337 |
$11,369 |
$33,786 |
12/25 |
$28,263 |
$29,908 |
$12,199 |
$39,827 |
|
| Average Annual Return [Table Text Block] |
AATR |
1 Year |
5 Years |
10 Years |
Class A |
13.56% |
11.79% |
11.57% |
Class A including sales charges |
7.34% |
10.53% |
10.94% |
Bloomberg U.S. Aggregate Bond Index |
7.30% |
-0.36% |
2.01% |
S&P 500® Index |
17.88% |
14.42% |
14.81% | |
| AssetsNet |
$ 3,701,649,154
|
| Holdings Count | Holding |
186
|
| Advisory Fees Paid, Amount |
$ 22,687,419
|
| InvestmentCompanyPortfolioTurnover |
29.00%
|
| Additional Fund Statistics [Text Block] |
Total Net Assets as of Period End |
$3,701,649,154 |
# of Portfolio Holdings as of Period End |
186 |
Portfolio Turnover Rate for the Period |
29% |
Total Net Advisory Fees Paid for the Period |
$22,687,419 | |
| Holdings [Text Block] |
Information Technology |
35.2% |
Financials |
12.9% |
Communication Services |
11.2% |
Consumer Discretionary |
9.8% |
Health Care |
9.5% |
Industrials |
7.7% |
Consumer Staples |
4.9% |
Energy |
3.6% |
Utilities |
2.2% |
Other |
3.3% | |
| Material Fund Change [Text Block] |
|
| Updated Prospectus Phone Number |
1-800-526-7384
|
| Updated Prospectus Web Address |
<span style="box-sizing: border-box; color: rgb(0, 0, 0); display: inline; flex-wrap: nowrap; font-size: 12px; font-weight: 400; grid-area: auto; line-height: 18px; margin: 0px; overflow: visible; text-align: left; text-align-last: auto; white-space-collapse: preserve-breaks;">dfinview.com/GoldmanSachs</span>
|
| C000025509 |
|
| Shareholder Report [Line Items] |
|
| Fund Name |
Goldman Sachs U.S. Equity Dividend and Premium Fund
|
| Class Name |
Class C
|
| Trading Symbol |
GSPQX
|
| Annual or Semi-Annual Statement [Text Block] |
This annual shareholder report contains important information about Goldman Sachs U.S. Equity Dividend and Premium Fund (the “Fund”) for the period of January 1, 2025 to December 31, 2025 (the “Period”).
|
| Additional Information [Text Block] |
You can find additional information about the Fund at am.gs.com or dfinview.com/GoldmanSachs. You can also request this information by contacting us at 1-800-526-7384.
|
| Additional Information Phone Number |
1-800-526-7384
|
| Additional Information Website |
<span style="box-sizing: border-box; color: rgb(0, 0, 0); display: inline; flex-wrap: nowrap; font-size: 12px; font-weight: 400; grid-area: auto; line-height: 18px; margin: 0px; overflow: visible; text-align: left; text-align-last: auto; white-space-collapse: preserve-breaks;">am.gs.com</span>
|
| Expenses [Text Block] |
What were the Fund costs for the Period?Based on a hypothetical $10,000 investment.
Class |
Costs of a $10,000 investment |
Costs paid as a percentage of a $10,000 investment |
C |
$186 |
1.75% | |
| Expenses Paid, Amount |
$ 186
|
| Expense Ratio, Percent |
1.75%
|
| Factors Affecting Performance [Text Block] |
How did the Fund perform and what affected its performance?The broad U.S. equity market was volatile but strong amid tariff uncertainty, mixed economic data, elevated valuations and a government shutdown. The market advance was supported by easing trade tensions, corporate earnings results, better inflation data, resilient consumer spending, AI growth optimism and the Fed’s monetary easing. |
| Performance Past Does Not Indicate Future [Text] |
Performance data quoted above represents past performance. Past performance does not guarantee future results.
|
| Line Graph [Table Text Block] |
|
Class C (including sales charges) |
Class C (excluding sales charges) |
Bloomberg U.S. Aggregate Bond Index |
S&P 500® Index |
1/1/16 |
$9,900 |
$10,000 |
$10,000 |
$10,000 |
12/16 |
$11,083 |
$11,195 |
$10,265 |
$11,196 |
12/17 |
$12,634 |
$12,761 |
$10,628 |
$13,640 |
12/18 |
$11,701 |
$11,819 |
$10,630 |
$13,042 |
12/19 |
$14,477 |
$14,623 |
$11,556 |
$17,149 |
12/20 |
$16,338 |
$16,503 |
$12,424 |
$20,304 |
12/21 |
$19,848 |
$20,048 |
$12,232 |
$26,132 |
12/22 |
$16,775 |
$16,945 |
$10,641 |
$21,399 |
12/23 |
$20,151 |
$20,354 |
$11,229 |
$27,025 |
12/24 |
$24,374 |
$24,621 |
$11,369 |
$33,786 |
12/25 |
$27,484 |
$27,762 |
$12,199 |
$39,827 |
|
| Average Annual Return [Table Text Block] |
AATR |
1 Year |
5 Years |
10 Years |
Class C |
12.76% |
10.96% |
10.74% |
Class C including sales charges |
11.70% |
10.96% |
10.74% |
Bloomberg U.S. Aggregate Bond Index |
7.30% |
-0.36% |
2.01% |
S&P 500® Index |
17.88% |
14.42% |
14.81% | |
| AssetsNet |
$ 3,701,649,154
|
| Holdings Count | Holding |
186
|
| Advisory Fees Paid, Amount |
$ 22,687,419
|
| InvestmentCompanyPortfolioTurnover |
29.00%
|
| Additional Fund Statistics [Text Block] |
Total Net Assets as of Period End |
$3,701,649,154 |
# of Portfolio Holdings as of Period End |
186 |
Portfolio Turnover Rate for the Period |
29% |
Total Net Advisory Fees Paid for the Period |
$22,687,419 | |
| Holdings [Text Block] |
Information Technology |
35.2% |
Financials |
12.9% |
Communication Services |
11.2% |
Consumer Discretionary |
9.8% |
Health Care |
9.5% |
Industrials |
7.7% |
Consumer Staples |
4.9% |
Energy |
3.6% |
Utilities |
2.2% |
Other |
3.3% | |
| Material Fund Change [Text Block] |
|
| Updated Prospectus Phone Number |
1-800-526-7384
|
| Updated Prospectus Web Address |
<span style="box-sizing: border-box; color: rgb(0, 0, 0); display: inline; flex-wrap: nowrap; font-size: 12px; font-weight: 400; grid-area: auto; line-height: 18px; margin: 0px; overflow: visible; text-align: left; text-align-last: auto; white-space-collapse: preserve-breaks;">dfinview.com/GoldmanSachs</span>
|
| C000201766 |
|
| Shareholder Report [Line Items] |
|
| Fund Name |
Goldman Sachs U.S. Equity Dividend and Premium Fund
|
| Class Name |
Class P
|
| Trading Symbol |
GSFPX
|
| Annual or Semi-Annual Statement [Text Block] |
This annual shareholder report contains important information about Goldman Sachs U.S. Equity Dividend and Premium Fund (the “Fund”) for the period of January 1, 2025 to December 31, 2025 (the “Period”).
|
| Additional Information [Text Block] |
You can find additional information about the Fund at am.gs.com or dfinview.com/GoldmanSachs. You can also request this information by contacting us at 1-800-621-2550.
|
| Additional Information Phone Number |
1-800-621-2550
|
| Additional Information Website |
<span style="box-sizing: border-box; color: rgb(0, 0, 0); display: inline; flex-wrap: nowrap; font-size: 12px; font-weight: 400; grid-area: auto; line-height: 18px; margin: 0px; overflow: visible; text-align: left; text-align-last: auto; white-space-collapse: preserve-breaks;">am.gs.com</span>
|
| Expenses [Text Block] |
What were the Fund costs for the Period?Based on a hypothetical $10,000 investment.
Class |
Costs of a $10,000 investment |
Costs paid as a percentage of a $10,000 investment |
P |
$72 |
0.67% | |
| Expenses Paid, Amount |
$ 72
|
| Expense Ratio, Percent |
0.67%
|
| Factors Affecting Performance [Text Block] |
How did the Fund perform and what affected its performance?The broad U.S. equity market was volatile but strong amid tariff uncertainty, mixed economic data, elevated valuations and a government shutdown. The market advance was supported by easing trade tensions, corporate earnings results, better inflation data, resilient consumer spending, AI growth optimism and the Fed’s monetary easing. |
| Performance Past Does Not Indicate Future [Text] |
Performance data quoted above represents past performance. Past performance does not guarantee future results.
|
| Line Graph [Table Text Block] |
|
Class P |
Bloomberg U.S. Aggregate Bond Index |
S&P 500® Index |
4/17/18 |
$10,000 |
$10,000 |
$10,000 |
12/18 |
$9,327 |
$10,225 |
$9,394 |
12/19 |
$11,665 |
$11,117 |
$12,351 |
12/20 |
$13,309 |
$11,951 |
$14,624 |
12/21 |
$16,361 |
$11,767 |
$18,822 |
12/22 |
$13,974 |
$10,236 |
$15,413 |
12/23 |
$16,970 |
$10,802 |
$19,465 |
12/24 |
$20,740 |
$10,937 |
$24,335 |
12/25 |
$23,644 |
$11,736 |
$28,686 |
|
| Average Annual Return [Table Text Block] |
AATR |
1 Year |
5 Years |
Since Inception |
Class P (Commenced April 17, 2018) |
14.00% |
12.17% |
11.80% |
Bloomberg U.S. Aggregate Bond Index |
7.30% |
-0.36% |
2.10% |
S&P 500® Index |
17.88% |
14.42% |
14.64% | |
| Performance Inception Date |
Apr. 17, 2018
|
| AssetsNet |
$ 3,701,649,154
|
| Holdings Count | Holding |
186
|
| Advisory Fees Paid, Amount |
$ 22,687,419
|
| InvestmentCompanyPortfolioTurnover |
29.00%
|
| Additional Fund Statistics [Text Block] |
Total Net Assets as of Period End |
$3,701,649,154 |
# of Portfolio Holdings as of Period End |
186 |
Portfolio Turnover Rate for the Period |
29% |
Total Net Advisory Fees Paid for the Period |
$22,687,419 | |
| Holdings [Text Block] |
Information Technology |
35.2% |
Financials |
12.9% |
Communication Services |
11.2% |
Consumer Discretionary |
9.8% |
Health Care |
9.5% |
Industrials |
7.7% |
Consumer Staples |
4.9% |
Energy |
3.6% |
Utilities |
2.2% |
Other |
3.3% | |
| Material Fund Change [Text Block] |
|
| Updated Prospectus Phone Number |
1-800-621-2550
|
| Updated Prospectus Web Address |
<span style="box-sizing: border-box; color: rgb(0, 0, 0); display: inline; flex-wrap: nowrap; font-size: 12px; font-weight: 400; grid-area: auto; line-height: 18px; margin: 0px; overflow: visible; text-align: left; text-align-last: auto; white-space-collapse: preserve-breaks;">dfinview.com/GoldmanSachs</span>
|
| C000200306 |
|
| Shareholder Report [Line Items] |
|
| Fund Name |
Goldman Sachs U.S. Equity Dividend and Premium Fund
|
| Class Name |
Class R6
|
| Trading Symbol |
GIDWX
|
| Annual or Semi-Annual Statement [Text Block] |
This annual shareholder report contains important information about Goldman Sachs U.S. Equity Dividend and Premium Fund (the “Fund”) for the period of January 1, 2025 to December 31, 2025 (the “Period”).
|
| Additional Information [Text Block] |
You can find additional information about the Fund at am.gs.com or dfinview.com/GoldmanSachs. You can also request this information by contacting us at 1-800-621-2550.
|
| Additional Information Phone Number |
1-800-621-2550
|
| Additional Information Website |
<span style="box-sizing: border-box; color: rgb(0, 0, 0); display: inline; flex-wrap: nowrap; font-size: 12px; font-weight: 400; grid-area: auto; line-height: 18px; margin: 0px; overflow: visible; text-align: left; text-align-last: auto; white-space-collapse: preserve-breaks;">am.gs.com</span>
|
| Expenses [Text Block] |
What were the Fund costs for the Period?Based on a hypothetical $10,000 investment.
Class |
Costs of a $10,000 investment |
Costs paid as a percentage of a $10,000 investment |
R6 |
$72 |
0.67% | |
| Expenses Paid, Amount |
$ 72
|
| Expense Ratio, Percent |
0.67%
|
| Factors Affecting Performance [Text Block] |
How did the Fund perform and what affected its performance?The broad U.S. equity market was volatile but strong amid tariff uncertainty, mixed economic data, elevated valuations and a government shutdown. The market advance was supported by easing trade tensions, corporate earnings results, better inflation data, resilient consumer spending, AI growth optimism and the Fed’s monetary easing. |
| Performance Past Does Not Indicate Future [Text] |
Performance data quoted above represents past performance. Past performance does not guarantee future results.
|
| Line Graph [Table Text Block] |
|
Class R6 |
Bloomberg U.S. Aggregate Bond Index |
S&P 500® Index |
4/30/18 |
$10,000 |
$10,000 |
$10,000 |
12/18 |
$9,522 |
$10,225 |
$9,598 |
12/19 |
$11,911 |
$11,117 |
$12,620 |
12/20 |
$13,600 |
$11,951 |
$14,942 |
12/21 |
$16,708 |
$11,767 |
$19,231 |
12/22 |
$14,280 |
$10,236 |
$15,748 |
12/23 |
$17,330 |
$10,802 |
$19,888 |
12/24 |
$21,197 |
$10,937 |
$24,864 |
12/25 |
$24,151 |
$11,736 |
$29,309 |
|
| Average Annual Return [Table Text Block] |
AATR |
1 Year |
5 Years |
Since Inception |
Class R6 (Commenced April 30, 2018) |
13.94% |
12.16% |
12.17% |
Bloomberg U.S. Aggregate Bond Index |
7.30% |
-0.36% |
2.11% |
S&P 500® Index |
17.88% |
14.42% |
15.03% | |
| Performance Inception Date |
Apr. 30, 2018
|
| AssetsNet |
$ 3,701,649,154
|
| Holdings Count | Holding |
186
|
| Advisory Fees Paid, Amount |
$ 22,687,419
|
| InvestmentCompanyPortfolioTurnover |
29.00%
|
| Additional Fund Statistics [Text Block] |
Total Net Assets as of Period End |
$3,701,649,154 |
# of Portfolio Holdings as of Period End |
186 |
Portfolio Turnover Rate for the Period |
29% |
Total Net Advisory Fees Paid for the Period |
$22,687,419 | |
| Holdings [Text Block] |
Information Technology |
35.2% |
Financials |
12.9% |
Communication Services |
11.2% |
Consumer Discretionary |
9.8% |
Health Care |
9.5% |
Industrials |
7.7% |
Consumer Staples |
4.9% |
Energy |
3.6% |
Utilities |
2.2% |
Other |
3.3% | |
| Material Fund Change [Text Block] |
|
| Updated Prospectus Phone Number |
1-800-621-2550
|
| Updated Prospectus Web Address |
<span style="box-sizing: border-box; color: rgb(0, 0, 0); display: inline; flex-wrap: nowrap; font-size: 12px; font-weight: 400; grid-area: auto; line-height: 18px; margin: 0px; overflow: visible; text-align: left; text-align-last: auto; white-space-collapse: preserve-breaks;">dfinview.com/GoldmanSachs</span>
|
| C000025507 |
|
| Shareholder Report [Line Items] |
|
| Fund Name |
Goldman Sachs U.S. Equity Dividend and Premium Fund
|
| Class Name |
Institutional Class
|
| Trading Symbol |
GSPKX
|
| Annual or Semi-Annual Statement [Text Block] |
This annual shareholder report contains important information about Goldman Sachs U.S. Equity Dividend and Premium Fund (the “Fund”) for the period of January 1, 2025 to December 31, 2025 (the “Period”).
|
| Additional Information [Text Block] |
You can find additional information about the Fund at am.gs.com or dfinview.com/GoldmanSachs. You can also request this information by contacting us at 1-800-621-2550.
|
| Additional Information Phone Number |
1-800-621-2550
|
| Additional Information Website |
<span style="box-sizing: border-box; color: rgb(0, 0, 0); display: inline; flex-wrap: nowrap; font-size: 12px; font-weight: 400; grid-area: auto; line-height: 18px; margin: 0px; overflow: visible; text-align: left; text-align-last: auto; white-space-collapse: preserve-breaks;">am.gs.com</span>
|
| Expenses [Text Block] |
What were the Fund costs for the Period?Based on a hypothetical $10,000 investment.
Class |
Costs of a $10,000 investment |
Costs paid as a percentage of a $10,000 investment |
Institutional |
$73 |
0.68% | |
| Expenses Paid, Amount |
$ 73
|
| Expense Ratio, Percent |
0.68%
|
| Factors Affecting Performance [Text Block] |
How did the Fund perform and what affected its performance?The broad U.S. equity market was volatile but strong amid tariff uncertainty, mixed economic data, elevated valuations and a government shutdown. The market advance was supported by easing trade tensions, corporate earnings results, better inflation data, resilient consumer spending, AI growth optimism and the Fed’s monetary easing. |
| Performance Past Does Not Indicate Future [Text] |
Performance data quoted above represents past performance. Past performance does not guarantee future results.
|
| Line Graph [Table Text Block] |
|
Institutional Shares |
Bloomberg U.S. Aggregate Bond Index |
S&P 500® Index |
1/1/16 |
$1,000,000 |
$1,000,000 |
$1,000,000 |
12/16 |
$1,132,100 |
$1,026,475 |
$1,119,599 |
12/17 |
$1,305,425 |
$1,062,831 |
$1,364,025 |
12/18 |
$1,223,444 |
$1,062,952 |
$1,304,222 |
12/19 |
$1,530,039 |
$1,155,606 |
$1,714,874 |
12/20 |
$1,746,692 |
$1,242,353 |
$2,030,390 |
12/21 |
$2,145,288 |
$1,223,195 |
$2,613,222 |
12/22 |
$1,833,577 |
$1,064,056 |
$2,139,945 |
12/23 |
$2,224,863 |
$1,122,886 |
$2,702,486 |
12/24 |
$2,720,562 |
$1,136,925 |
$3,378,640 |
12/25 |
$3,100,897 |
$1,219,931 |
$3,982,741 |
|
| Average Annual Return [Table Text Block] |
AATR |
1 Year |
5 Years |
10 Years |
Institutional Shares |
13.98% |
12.16% |
11.97% |
Bloomberg U.S. Aggregate Bond Index |
7.30% |
-0.36% |
2.01% |
S&P 500® Index |
17.88% |
14.42% |
14.81% | |
| AssetsNet |
$ 3,701,649,154
|
| Holdings Count | Holding |
186
|
| Advisory Fees Paid, Amount |
$ 22,687,419
|
| InvestmentCompanyPortfolioTurnover |
29.00%
|
| Additional Fund Statistics [Text Block] |
Total Net Assets as of Period End |
$3,701,649,154 |
# of Portfolio Holdings as of Period End |
186 |
Portfolio Turnover Rate for the Period |
29% |
Total Net Advisory Fees Paid for the Period |
$22,687,419 | |
| Holdings [Text Block] |
Information Technology |
35.2% |
Financials |
12.9% |
Communication Services |
11.2% |
Consumer Discretionary |
9.8% |
Health Care |
9.5% |
Industrials |
7.7% |
Consumer Staples |
4.9% |
Energy |
3.6% |
Utilities |
2.2% |
Other |
3.3% | |
| Material Fund Change [Text Block] |
|
| Updated Prospectus Phone Number |
1-800-621-2550
|
| Updated Prospectus Web Address |
<span style="box-sizing: border-box; color: rgb(0, 0, 0); display: inline; flex-wrap: nowrap; font-size: 12px; font-weight: 400; grid-area: auto; line-height: 18px; margin: 0px; overflow: visible; text-align: left; text-align-last: auto; white-space-collapse: preserve-breaks;">dfinview.com/GoldmanSachs</span>
|
| C000091963 |
|
| Shareholder Report [Line Items] |
|
| Fund Name |
Goldman Sachs U.S. Equity Dividend and Premium Fund
|
| Class Name |
Investor Class
|
| Trading Symbol |
GVIRX
|
| Annual or Semi-Annual Statement [Text Block] |
This annual shareholder report contains important information about Goldman Sachs U.S. Equity Dividend and Premium Fund (the “Fund”) for the period of January 1, 2025 to December 31, 2025 (the “Period”).
|
| Additional Information [Text Block] |
You can find additional information about the Fund at am.gs.com or dfinview.com/GoldmanSachs. You can also request this information by contacting us at 1-800-526-7384.
|
| Additional Information Phone Number |
1-800-526-7384
|
| Additional Information Website |
<span style="box-sizing: border-box; color: rgb(0, 0, 0); display: inline; flex-wrap: nowrap; font-size: 12px; font-weight: 400; grid-area: auto; line-height: 18px; margin: 0px; overflow: visible; text-align: left; text-align-last: auto; white-space-collapse: preserve-breaks;">am.gs.com</span>
|
| Expenses [Text Block] |
What were the Fund costs for the Period?Based on a hypothetical $10,000 investment.
Class |
Costs of a $10,000 investment |
Costs paid as a percentage of a $10,000 investment |
Investor |
$80 |
0.75% | |
| Expenses Paid, Amount |
$ 80
|
| Expense Ratio, Percent |
0.75%
|
| Factors Affecting Performance [Text Block] |
How did the Fund perform and what affected its performance?The broad U.S. equity market was volatile but strong amid tariff uncertainty, mixed economic data, elevated valuations and a government shutdown. The market advance was supported by easing trade tensions, corporate earnings results, better inflation data, resilient consumer spending, AI growth optimism and the Fed’s monetary easing. |
| Performance Past Does Not Indicate Future [Text] |
Performance data quoted above represents past performance. Past performance does not guarantee future results.
|
| Line Graph [Table Text Block] |
|
Investor Shares |
Bloomberg U.S. Aggregate Bond Index |
S&P 500® Index |
1/1/16 |
$10,000 |
$10,000 |
$10,000 |
12/16 |
$11,296 |
$10,265 |
$11,196 |
12/17 |
$13,011 |
$10,628 |
$13,640 |
12/18 |
$12,169 |
$10,630 |
$13,042 |
12/19 |
$15,211 |
$11,556 |
$17,149 |
12/20 |
$17,332 |
$12,424 |
$20,304 |
12/21 |
$21,280 |
$12,232 |
$26,132 |
12/22 |
$18,173 |
$10,641 |
$21,399 |
12/23 |
$22,031 |
$11,229 |
$27,025 |
12/24 |
$26,917 |
$11,369 |
$33,786 |
12/25 |
$30,656 |
$12,199 |
$39,827 |
|
| Average Annual Return [Table Text Block] |
AATR |
1 Year |
5 Years |
10 Years |
Investor Shares |
13.89% |
12.07% |
11.84% |
Bloomberg U.S. Aggregate Bond Index |
7.30% |
-0.36% |
2.01% |
S&P 500® Index |
17.88% |
14.42% |
14.81% | |
| AssetsNet |
$ 3,701,649,154
|
| Holdings Count | Holding |
186
|
| Advisory Fees Paid, Amount |
$ 22,687,419
|
| InvestmentCompanyPortfolioTurnover |
29.00%
|
| Additional Fund Statistics [Text Block] |
Total Net Assets as of Period End |
$3,701,649,154 |
# of Portfolio Holdings as of Period End |
186 |
Portfolio Turnover Rate for the Period |
29% |
Total Net Advisory Fees Paid for the Period |
$22,687,419 | |
| Holdings [Text Block] |
Information Technology |
35.2% |
Financials |
12.9% |
Communication Services |
11.2% |
Consumer Discretionary |
9.8% |
Health Care |
9.5% |
Industrials |
7.7% |
Consumer Staples |
4.9% |
Energy |
3.6% |
Utilities |
2.2% |
Other |
3.3% | |
| Material Fund Change [Text Block] |
|
| Updated Prospectus Phone Number |
1-800-526-7384
|
| Updated Prospectus Web Address |
<span style="box-sizing: border-box; color: rgb(0, 0, 0); display: inline; flex-wrap: nowrap; font-size: 12px; font-weight: 400; grid-area: auto; line-height: 18px; margin: 0px; overflow: visible; text-align: left; text-align-last: auto; white-space-collapse: preserve-breaks;">dfinview.com/GoldmanSachs</span>
|
| C000025449 |
|
| Shareholder Report [Line Items] |
|
| Fund Name |
Goldman Sachs Conservative Allocation Fund
|
| Class Name |
Class A
|
| Trading Symbol |
GIPAX
|
| Annual or Semi-Annual Statement [Text Block] |
This annual shareholder report contains important information about Goldman Sachs Conservative Allocation Fund (formerly, Goldman Sachs Balanced Strategy Portfolio) (the “Fund”) for the period of January 1, 2025 to December 31, 2025 (the “Period”).
|
| Additional Information [Text Block] |
You can find additional information about the Fund at am.gs.com or dfinview.com/GoldmanSachs. You can also request this information by contacting us at 1-800-526-7384.
|
| Material Fund Change Notice [Text Block] |
This report describes changes to the Fund that occurred during the Period.
|
| Additional Information Phone Number |
1-800-526-7384
|
| Additional Information Website |
<span style="box-sizing: border-box; color: rgb(0, 0, 0); display: inline; flex-wrap: nowrap; font-size: 12px; font-weight: 400; grid-area: auto; line-height: 18px; margin: 0px; overflow: visible; text-align: left; text-align-last: auto; white-space-collapse: preserve-breaks;">am.gs.com</span>
|
| Expenses [Text Block] |
What were the Fund costs for the Period?Based on a hypothetical $10,000 investment.
Class |
Costs of a $10,000 investment |
Costs paid as a percentage of a $10,000 investment |
A |
$58 |
0.55% | |
| Expenses Paid, Amount |
$ 58
|
| Expense Ratio, Percent |
0.55%
|
| Factors Affecting Performance [Text Block] |
How did the Fund perform and what affected its performance?Easing trade tensions, robust corporate earnings results, better than consensus anticipated inflation data, resilient consumer spending, enthusiasm for technology/AI and central bank monetary policy influenced capital markets most. Both global equity and fixed income markets broadly generated positive returns. |
| Performance Past Does Not Indicate Future [Text] |
Performance data quoted above represents past performance. Past performance does not guarantee future results.
|
| Line Graph [Table Text Block] |
|
Class A (including sales charges) |
Class A (excluding sales charges) |
Conservative Allocation Composite Index* |
MSCI® ACWI Index (Net, USD, Unhedged) |
Bloomberg Global Aggregate Bond Index (Gross, USD, Hedged) |
1/1/16 |
$9,450 |
$10,000 |
$10,000 |
$10,000 |
$10,000 |
12/16 |
$9,927 |
$10,505 |
$10,555 |
$10,786 |
$10,395 |
12/17 |
$11,038 |
$11,681 |
$11,724 |
$13,372 |
$10,710 |
12/18 |
$10,276 |
$10,875 |
$11,423 |
$12,113 |
$10,899 |
12/19 |
$11,843 |
$12,532 |
$13,187 |
$15,335 |
$11,795 |
12/20 |
$13,114 |
$13,878 |
$14,660 |
$17,828 |
$12,453 |
12/21 |
$14,102 |
$14,923 |
$15,585 |
$21,133 |
$12,280 |
12/22 |
$12,115 |
$12,820 |
$13,418 |
$17,252 |
$10,902 |
12/23 |
$13,577 |
$14,368 |
$15,168 |
$21,082 |
$11,681 |
12/24 |
$14,693 |
$15,549 |
$16,520 |
$24,769 |
$12,078 |
12/25 |
$16,380 |
$17,334 |
$18,456 |
$30,302 |
$12,665 |
|
| Average Annual Return [Table Text Block] |
AATR |
1 Year |
5 Years |
10 Years |
Class A |
11.48% |
4.54% |
5.65% |
Class A including sales charges |
5.36% |
3.36% |
5.05% |
Conservative Allocation Composite Index* |
11.72% |
4.71% |
6.31% |
MSCI® ACWI Index (Net, USD, Unhedged) |
22.34% |
11.19% |
11.71% |
Bloomberg Global Aggregate Bond Index (Gross, USD, Hedged) |
4.86% |
0.34% |
2.39% | |
| AssetsNet |
$ 609,340,655
|
| Holdings Count | Holding |
27
|
| Advisory Fees Paid, Amount |
$ 848,220
|
| InvestmentCompanyPortfolioTurnover |
24.00%
|
| Additional Fund Statistics [Text Block] |
Total Net Assets as of Period End |
$609,340,655 |
# of Portfolio Holdings as of Period End |
27 |
Portfolio Turnover Rate for the Period |
24% |
Total Net Advisory Fees Paid for the Period |
$848,220 | |
| Holdings [Text Block] |
Fixed Income |
45.2% |
Exchange-Traded Funds |
26.6% |
Equity |
22.7% |
Investment Companies |
1.3% |
Dynamic |
0.9% | |
| Material Fund Change [Text Block] |
This is a summary of certain changes to the Fund for the Period. For more complete information, you may review the Fund's next prospectus, which we expect to be available by April 30, 2026 at dfinview.com/GoldmanSachs or upon request at 1-800-526-7384. Effective February 13, 2026, the Fund changed its name from the Goldman Sachs Balanced Strategy Portfolio to the Goldman Sachs Conservative Allocation Fund. The Fund also changed its principal investment strategy reflecting that the Fund will operate as a fund-of-funds investing in underlying fixed income, equity, and alternative funds, with increased fixed income and equity allocations, along with the option to invest in alternative asset classes and monthly rebalancing. |
| Material Fund Change Name [Text Block] |
Effective February 13, 2026, the Fund changed its name from the Goldman Sachs Balanced Strategy Portfolio to the Goldman Sachs Conservative Allocation Fund.
|
| Material Fund Change Strategies [Text Block] |
The Fund also changed its principal investment strategy reflecting that the Fund will operate as a fund-of-funds investing in underlying fixed income, equity, and alternative funds, with increased fixed income and equity allocations, along with the option to invest in alternative asset classes and monthly rebalancing.
|
| Summary of Change Legend [Text Block] |
This is a summary of certain changes to the Fund for the Period. For more complete information, you may review the Fund's next prospectus, which we expect to be available by April 30, 2026 at dfinview.com/GoldmanSachs or upon request at 1-800-526-7384.
|
| Updated Prospectus Phone Number |
1-800-526-7384
|
| Updated Prospectus Web Address |
<span style="box-sizing: border-box; color: rgb(0, 0, 0); display: inline; flex-wrap: nowrap; font-size: 12px; font-weight: 400; grid-area: auto; line-height: 18px; margin: 0px; overflow: visible; text-align: left; text-align-last: auto; white-space-collapse: preserve-breaks;">dfinview.com/GoldmanSachs</span>
|
| C000025451 |
|
| Shareholder Report [Line Items] |
|
| Fund Name |
Goldman Sachs Conservative Allocation Fund
|
| Class Name |
Class C
|
| Trading Symbol |
GIPCX
|
| Annual or Semi-Annual Statement [Text Block] |
This annual shareholder report contains important information about Goldman Sachs Conservative Allocation Fund (formerly, Goldman Sachs Balanced Strategy Portfolio) (the “Fund”) for the period of January 1, 2025 to December 31, 2025 (the “Period”).
|
| Additional Information [Text Block] |
You can find additional information about the Fund at am.gs.com or dfinview.com/GoldmanSachs. You can also request this information by contacting us at 1-800-526-7384.
|
| Material Fund Change Notice [Text Block] |
This report describes changes to the Fund that occurred during the Period.
|
| Additional Information Phone Number |
1-800-526-7384
|
| Additional Information Website |
<span style="box-sizing: border-box; color: rgb(0, 0, 0); display: inline; flex-wrap: nowrap; font-size: 12px; font-weight: 400; grid-area: auto; line-height: 18px; margin: 0px; overflow: visible; text-align: left; text-align-last: auto; white-space-collapse: preserve-breaks;">am.gs.com</span>
|
| Expenses [Text Block] |
What were the Fund costs for the Period?Based on a hypothetical $10,000 investment.
Class |
Costs of a $10,000 investment |
Costs paid as a percentage of a $10,000 investment |
C |
$137 |
1.30% | |
| Expenses Paid, Amount |
$ 137
|
| Expense Ratio, Percent |
1.30%
|
| Factors Affecting Performance [Text Block] |
How did the Fund perform and what affected its performance?Easing trade tensions, robust corporate earnings results, better than consensus anticipated inflation data, resilient consumer spending, enthusiasm for technology/AI and central bank monetary policy influenced capital markets most. Both global equity and fixed income markets broadly generated positive returns. |
| Performance Past Does Not Indicate Future [Text] |
Performance data quoted above represents past performance. Past performance does not guarantee future results.
|
| Line Graph [Table Text Block] |
|
Class C (including sales charges) |
Class C (excluding sales charges) |
Conservative Allocation Composite Index* |
MSCI® ACWI Index (Net, USD, Unhedged) |
Bloomberg Global Aggregate Bond Index (Gross, USD, Hedged) |
1/1/16 |
$9,900 |
$10,000 |
$10,000 |
$10,000 |
$10,000 |
12/16 |
$10,321 |
$10,425 |
$10,555 |
$10,786 |
$10,395 |
12/17 |
$11,384 |
$11,499 |
$11,724 |
$13,372 |
$10,710 |
12/18 |
$10,521 |
$10,627 |
$11,423 |
$12,113 |
$10,899 |
12/19 |
$12,025 |
$12,147 |
$13,187 |
$15,335 |
$11,795 |
12/20 |
$13,220 |
$13,353 |
$14,660 |
$17,828 |
$12,453 |
12/21 |
$14,109 |
$14,252 |
$15,585 |
$21,133 |
$12,280 |
12/22 |
$12,035 |
$12,157 |
$13,418 |
$17,252 |
$10,902 |
12/23 |
$13,388 |
$13,523 |
$15,168 |
$21,082 |
$11,681 |
12/24 |
$14,373 |
$14,518 |
$16,520 |
$24,769 |
$12,078 |
12/25 |
$15,913 |
$16,073 |
$18,456 |
$30,302 |
$12,665 |
|
| Average Annual Return [Table Text Block] |
AATR |
1 Year |
5 Years |
10 Years |
Class C |
10.71% |
3.78% |
4.86% |
Class C including sales charges |
9.62% |
3.78% |
4.86% |
Conservative Allocation Composite Index* |
11.72% |
4.71% |
6.31% |
MSCI® ACWI Index (Net, USD, Unhedged) |
22.34% |
11.19% |
11.71% |
Bloomberg Global Aggregate Bond Index (Gross, USD, Hedged) |
4.86% |
0.34% |
2.39% | |
| AssetsNet |
$ 609,340,655
|
| Holdings Count | Holding |
27
|
| Advisory Fees Paid, Amount |
$ 848,220
|
| InvestmentCompanyPortfolioTurnover |
24.00%
|
| Additional Fund Statistics [Text Block] |
Total Net Assets as of Period End |
$609,340,655 |
# of Portfolio Holdings as of Period End |
27 |
Portfolio Turnover Rate for the Period |
24% |
Total Net Advisory Fees Paid for the Period |
$848,220 | |
| Holdings [Text Block] |
Fixed Income |
45.2% |
Exchange-Traded Funds |
26.6% |
Equity |
22.7% |
Investment Companies |
1.3% |
Dynamic |
0.9% | |
| Material Fund Change [Text Block] |
This is a summary of certain changes to the Fund for the Period. For more complete information, you may review the Fund's next prospectus, which we expect to be available by April 30, 2026 at dfinview.com/GoldmanSachs or upon request at 1-800-526-7384. Effective February 13, 2026, the Fund changed its name from the Goldman Sachs Balanced Strategy Portfolio to the Goldman Sachs Conservative Allocation Fund. The Fund also changed its principal investment strategy reflecting that the Fund will operate as a fund-of-funds investing in underlying fixed income, equity, and alternative funds, with increased fixed income and equity allocations, along with the option to invest in alternative asset classes and monthly rebalancing. |
| Material Fund Change Name [Text Block] |
Effective February 13, 2026, the Fund changed its name from the Goldman Sachs Balanced Strategy Portfolio to the Goldman Sachs Conservative Allocation Fund.
|
| Material Fund Change Strategies [Text Block] |
The Fund also changed its principal investment strategy reflecting that the Fund will operate as a fund-of-funds investing in underlying fixed income, equity, and alternative funds, with increased fixed income and equity allocations, along with the option to invest in alternative asset classes and monthly rebalancing.
|
| Summary of Change Legend [Text Block] |
This is a summary of certain changes to the Fund for the Period. For more complete information, you may review the Fund's next prospectus, which we expect to be available by April 30, 2026 at dfinview.com/GoldmanSachs or upon request at 1-800-526-7384.
|
| Updated Prospectus Phone Number |
1-800-526-7384
|
| Updated Prospectus Web Address |
<span style="box-sizing: border-box; color: rgb(0, 0, 0); display: inline; flex-wrap: nowrap; font-size: 12px; font-weight: 400; grid-area: auto; line-height: 18px; margin: 0px; overflow: visible; text-align: left; text-align-last: auto; white-space-collapse: preserve-breaks;">dfinview.com/GoldmanSachs</span>
|
| C000201783 |
|
| Shareholder Report [Line Items] |
|
| Fund Name |
Goldman Sachs Conservative Allocation Fund
|
| Class Name |
Class P
|
| Trading Symbol |
GAOPX
|
| Annual or Semi-Annual Statement [Text Block] |
This annual shareholder report contains important information about Goldman Sachs Conservative Allocation Fund (formerly, Goldman Sachs Balanced Strategy Portfolio) (the “Fund”) for the period of January 1, 2025 to December 31, 2025 (the “Period”).
|
| Additional Information [Text Block] |
You can find additional information about the Fund at am.gs.com or dfinview.com/GoldmanSachs. You can also request this information by contacting us at 1-800-621-2550.
|
| Material Fund Change Notice [Text Block] |
This report describes changes to the Fund that occurred during the Period.
|
| Additional Information Phone Number |
1-800-621-2550
|
| Additional Information Website |
<span style="box-sizing: border-box; color: rgb(0, 0, 0); display: inline; flex-wrap: nowrap; font-size: 12px; font-weight: 400; grid-area: auto; line-height: 18px; margin: 0px; overflow: visible; text-align: left; text-align-last: auto; white-space-collapse: preserve-breaks;">am.gs.com</span>
|
| Expenses [Text Block] |
What were the Fund costs for the Period?Based on a hypothetical $10,000 investment.
Class |
Costs of a $10,000 investment |
Costs paid as a percentage of a $10,000 investment |
P |
$19 |
0.18% | |
| Expenses Paid, Amount |
$ 19
|
| Expense Ratio, Percent |
0.18%
|
| Factors Affecting Performance [Text Block] |
How did the Fund perform and what affected its performance?Easing trade tensions, robust corporate earnings results, better than consensus anticipated inflation data, resilient consumer spending, enthusiasm for technology/AI and central bank monetary policy influenced capital markets most. Both global equity and fixed income markets broadly generated positive returns. |
| Performance Past Does Not Indicate Future [Text] |
Performance data quoted above represents past performance. Past performance does not guarantee future results.
|
| Line Graph [Table Text Block] |
|
Class P |
Conservative Allocation Composite Index* |
MSCI® ACWI Index (Net, USD, Unhedged) |
Bloomberg Global Aggregate Bond Index (Gross, USD, Hedged) |
4/17/18 |
$10,000 |
$10,000 |
$10,000 |
$10,000 |
12/18 |
$9,333 |
$9,707 |
$8,955 |
$10,193 |
12/19 |
$10,797 |
$11,207 |
$11,337 |
$11,030 |
12/20 |
$12,004 |
$12,458 |
$13,179 |
$11,646 |
12/21 |
$12,958 |
$13,244 |
$15,622 |
$11,484 |
12/22 |
$11,176 |
$11,403 |
$12,753 |
$10,196 |
12/23 |
$12,572 |
$12,890 |
$15,585 |
$10,924 |
12/24 |
$13,656 |
$14,039 |
$18,311 |
$11,295 |
12/25 |
$15,279 |
$15,684 |
$22,401 |
$11,844 |
|
| Average Annual Return [Table Text Block] |
AATR |
1 Year |
5 Years |
Since Inception |
Class P (Commenced April 17, 2018) |
11.89% |
4.94% |
5.65% |
Conservative Allocation Composite Index* |
11.72% |
4.71% |
6.01% |
MSCI® ACWI Index (Net, USD, Unhedged) |
22.34% |
11.19% |
11.02% |
Bloomberg Global Aggregate Bond Index (Gross, USD, Hedged) |
4.86% |
0.34% |
2.22% | |
| Performance Inception Date |
Apr. 17, 2018
|
| AssetsNet |
$ 609,340,655
|
| Holdings Count | Holding |
27
|
| Advisory Fees Paid, Amount |
$ 848,220
|
| InvestmentCompanyPortfolioTurnover |
24.00%
|
| Additional Fund Statistics [Text Block] |
Total Net Assets as of Period End |
$609,340,655 |
# of Portfolio Holdings as of Period End |
27 |
Portfolio Turnover Rate for the Period |
24% |
Total Net Advisory Fees Paid for the Period |
$848,220 | |
| Holdings [Text Block] |
Fixed Income |
45.2% |
Exchange-Traded Funds |
26.6% |
Equity |
22.7% |
Investment Companies |
1.3% |
Dynamic |
0.9% | |
| Material Fund Change [Text Block] |
This is a summary of certain changes to the Fund for the Period. For more complete information, you may review the Fund's next prospectus, which we expect to be available by April 30, 2026 at dfinview.com/GoldmanSachs or upon request at 1-800-621-2550. Effective February 13, 2026, the Fund changed its name from the Goldman Sachs Balanced Strategy Portfolio to the Goldman Sachs Conservative Allocation Fund. The Fund also changed its principal investment strategy reflecting that the Fund will operate as a fund-of-funds investing in underlying fixed income, equity, and alternative funds, with increased fixed income and equity allocations, along with the option to invest in alternative asset classes and monthly rebalancing. |
| Material Fund Change Name [Text Block] |
Effective February 13, 2026, the Fund changed its name from the Goldman Sachs Balanced Strategy Portfolio to the Goldman Sachs Conservative Allocation Fund.
|
| Material Fund Change Strategies [Text Block] |
The Fund also changed its principal investment strategy reflecting that the Fund will operate as a fund-of-funds investing in underlying fixed income, equity, and alternative funds, with increased fixed income and equity allocations, along with the option to invest in alternative asset classes and monthly rebalancing.
|
| Summary of Change Legend [Text Block] |
This is a summary of certain changes to the Fund for the Period. For more complete information, you may review the Fund's next prospectus, which we expect to be available by April 30, 2026 at dfinview.com/GoldmanSachs or upon request at 1-800-621-2550.
|
| Updated Prospectus Phone Number |
1-800-621-2550
|
| Updated Prospectus Web Address |
<span style="box-sizing: border-box; color: rgb(0, 0, 0); display: inline; flex-wrap: nowrap; font-size: 12px; font-weight: 400; grid-area: auto; line-height: 18px; margin: 0px; overflow: visible; text-align: left; text-align-last: auto; white-space-collapse: preserve-breaks;">dfinview.com/GoldmanSachs</span>
|
| C000058959 |
|
| Shareholder Report [Line Items] |
|
| Fund Name |
Goldman Sachs Conservative Allocation Fund
|
| Class Name |
Class R
|
| Trading Symbol |
GIPRX
|
| Annual or Semi-Annual Statement [Text Block] |
This annual shareholder report contains important information about Goldman Sachs Conservative Allocation Fund (formerly, Goldman Sachs Balanced Strategy Portfolio) (the “Fund”) for the period of January 1, 2025 to December 31, 2025 (the “Period”).
|
| Additional Information [Text Block] |
You can find additional information about the Fund at am.gs.com or dfinview.com/GoldmanSachs. You can also request this information by contacting us at 1-800-526-7384.
|
| Material Fund Change Notice [Text Block] |
This report describes changes to the Fund that occurred during the Period.
|
| Additional Information Phone Number |
1-800-526-7384
|
| Additional Information Website |
<span style="box-sizing: border-box; color: rgb(0, 0, 0); display: inline; flex-wrap: nowrap; font-size: 12px; font-weight: 400; grid-area: auto; line-height: 18px; margin: 0px; overflow: visible; text-align: left; text-align-last: auto; white-space-collapse: preserve-breaks;">am.gs.com</span>
|
| Expenses [Text Block] |
What were the Fund costs for the Period?Based on a hypothetical $10,000 investment.
Class |
Costs of a $10,000 investment |
Costs paid as a percentage of a $10,000 investment |
R |
$84 |
0.80% | |
| Expenses Paid, Amount |
$ 84
|
| Expense Ratio, Percent |
0.80%
|
| Factors Affecting Performance [Text Block] |
How did the Fund perform and what affected its performance?Easing trade tensions, robust corporate earnings results, better than consensus anticipated inflation data, resilient consumer spending, enthusiasm for technology/AI and central bank monetary policy influenced capital markets most. Both global equity and fixed income markets broadly generated positive returns. |
| Performance Past Does Not Indicate Future [Text] |
Performance data quoted above represents past performance. Past performance does not guarantee future results.
|
| Line Graph [Table Text Block] |
|
Class R |
Conservative Allocation Composite Index* |
MSCI® ACWI Index (Net, USD, Unhedged) |
Bloomberg Global Aggregate Bond Index (Gross, USD, Hedged) |
1/1/16 |
$10,000 |
$10,000 |
$10,000 |
$10,000 |
12/16 |
$10,504 |
$10,555 |
$10,786 |
$10,395 |
12/17 |
$11,639 |
$11,724 |
$13,372 |
$10,710 |
12/18 |
$10,817 |
$11,423 |
$12,113 |
$10,899 |
12/19 |
$12,433 |
$13,187 |
$15,335 |
$11,795 |
12/20 |
$13,728 |
$14,660 |
$17,828 |
$12,453 |
12/21 |
$14,733 |
$15,585 |
$21,133 |
$12,280 |
12/22 |
$12,626 |
$13,418 |
$17,252 |
$10,902 |
12/23 |
$14,112 |
$15,168 |
$21,082 |
$11,681 |
12/24 |
$15,237 |
$16,520 |
$24,769 |
$12,078 |
12/25 |
$16,931 |
$18,456 |
$30,302 |
$12,665 |
|
| Average Annual Return [Table Text Block] |
AATR |
1 Year |
5 Years |
10 Years |
Class R |
11.12% |
4.28% |
5.40% |
Conservative Allocation Composite Index* |
11.72% |
4.71% |
6.31% |
MSCI® ACWI Index (Net, USD, Unhedged) |
22.34% |
11.19% |
11.71% |
Bloomberg Global Aggregate Bond Index (Gross, USD, Hedged) |
4.86% |
0.34% |
2.39% | |
| AssetsNet |
$ 609,340,655
|
| Holdings Count | Holding |
27
|
| Advisory Fees Paid, Amount |
$ 848,220
|
| InvestmentCompanyPortfolioTurnover |
24.00%
|
| Additional Fund Statistics [Text Block] |
Total Net Assets as of Period End |
$609,340,655 |
# of Portfolio Holdings as of Period End |
27 |
Portfolio Turnover Rate for the Period |
24% |
Total Net Advisory Fees Paid for the Period |
$848,220 | |
| Holdings [Text Block] |
Fixed Income |
45.2% |
Exchange-Traded Funds |
26.6% |
Equity |
22.7% |
Investment Companies |
1.3% |
Dynamic |
0.9% | |
| Material Fund Change [Text Block] |
This is a summary of certain changes to the Fund for the Period. For more complete information, you may review the Fund's next prospectus, which we expect to be available by April 30, 2026 at dfinview.com/GoldmanSachs or upon request at 1-800-526-7384. Effective February 13, 2026, the Fund changed its name from the Goldman Sachs Balanced Strategy Portfolio to the Goldman Sachs Conservative Allocation Fund. The Fund also changed its principal investment strategy reflecting that the Fund will operate as a fund-of-funds investing in underlying fixed income, equity, and alternative funds, with increased fixed income and equity allocations, along with the option to invest in alternative asset classes and monthly rebalancing. |
| Material Fund Change Name [Text Block] |
Effective February 13, 2026, the Fund changed its name from the Goldman Sachs Balanced Strategy Portfolio to the Goldman Sachs Conservative Allocation Fund.
|
| Material Fund Change Strategies [Text Block] |
The Fund also changed its principal investment strategy reflecting that the Fund will operate as a fund-of-funds investing in underlying fixed income, equity, and alternative funds, with increased fixed income and equity allocations, along with the option to invest in alternative asset classes and monthly rebalancing.
|
| Summary of Change Legend [Text Block] |
This is a summary of certain changes to the Fund for the Period. For more complete information, you may review the Fund's next prospectus, which we expect to be available by April 30, 2026 at dfinview.com/GoldmanSachs or upon request at 1-800-526-7384.
|
| Updated Prospectus Phone Number |
1-800-526-7384
|
| Updated Prospectus Web Address |
<span style="box-sizing: border-box; color: rgb(0, 0, 0); display: inline; flex-wrap: nowrap; font-size: 12px; font-weight: 400; grid-area: auto; line-height: 18px; margin: 0px; overflow: visible; text-align: left; text-align-last: auto; white-space-collapse: preserve-breaks;">dfinview.com/GoldmanSachs</span>
|
| C000161531 |
|
| Shareholder Report [Line Items] |
|
| Fund Name |
Goldman Sachs Conservative Allocation Fund
|
| Class Name |
Class R6
|
| Trading Symbol |
GIPUX
|
| Annual or Semi-Annual Statement [Text Block] |
This annual shareholder report contains important information about Goldman Sachs Conservative Allocation Fund (formerly, Goldman Sachs Balanced Strategy Portfolio) (the “Fund”) for the period of January 1, 2025 to December 31, 2025 (the “Period”).
|
| Additional Information [Text Block] |
You can find additional information about the Fund at am.gs.com or dfinview.com/GoldmanSachs. You can also request this information by contacting us at 1-800-621-2550.
|
| Material Fund Change Notice [Text Block] |
This report describes changes to the Fund that occurred during the Period.
|
| Additional Information Phone Number |
1-800-621-2550
|
| Additional Information Website |
<span style="box-sizing: border-box; color: rgb(0, 0, 0); display: inline; flex-wrap: nowrap; font-size: 12px; font-weight: 400; grid-area: auto; line-height: 18px; margin: 0px; overflow: visible; text-align: left; text-align-last: auto; white-space-collapse: preserve-breaks;">am.gs.com</span>
|
| Expenses [Text Block] |
What were the Fund costs for the Period?Based on a hypothetical $10,000 investment.
Class |
Costs of a $10,000 investment |
Costs paid as a percentage of a $10,000 investment |
R6 |
$19 |
0.18% | |
| Expenses Paid, Amount |
$ 19
|
| Expense Ratio, Percent |
0.18%
|
| Factors Affecting Performance [Text Block] |
How did the Fund perform and what affected its performance?Easing trade tensions, robust corporate earnings results, better than consensus anticipated inflation data, resilient consumer spending, enthusiasm for technology/AI and central bank monetary policy influenced capital markets most. Both global equity and fixed income markets broadly generated positive returns. |
| Performance Past Does Not Indicate Future [Text] |
Performance data quoted above represents past performance. Past performance does not guarantee future results.
|
| Line Graph [Table Text Block] |
|
Class R6 |
Conservative Allocation Composite Index* |
MSCI® ACWI Index (Net, USD, Unhedged) |
Bloomberg Global Aggregate Bond Index (Gross, USD, Hedged) |
1/1/16 |
$10,000 |
$10,000 |
$10,000 |
$10,000 |
12/16 |
$10,548 |
$10,555 |
$10,786 |
$10,395 |
12/17 |
$11,765 |
$11,724 |
$13,372 |
$10,710 |
12/18 |
$10,998 |
$11,423 |
$12,113 |
$10,899 |
12/19 |
$12,725 |
$13,187 |
$15,335 |
$11,795 |
12/20 |
$14,136 |
$14,660 |
$17,828 |
$12,453 |
12/21 |
$15,267 |
$15,585 |
$21,133 |
$12,280 |
12/22 |
$13,181 |
$13,418 |
$17,252 |
$10,902 |
12/23 |
$14,813 |
$15,168 |
$21,082 |
$11,681 |
12/24 |
$16,089 |
$16,520 |
$24,769 |
$12,078 |
12/25 |
$18,002 |
$18,456 |
$30,302 |
$12,665 |
|
| Average Annual Return [Table Text Block] |
AATR |
1 Year |
5 Years |
10 Years |
Class R6 |
11.89% |
4.95% |
6.05% |
Conservative Allocation Composite Index* |
11.72% |
4.71% |
6.31% |
MSCI® ACWI Index (Net, USD, Unhedged) |
22.34% |
11.19% |
11.71% |
Bloomberg Global Aggregate Bond Index (Gross, USD, Hedged) |
4.86% |
0.34% |
2.39% | |
| AssetsNet |
$ 609,340,655
|
| Holdings Count | Holding |
27
|
| Advisory Fees Paid, Amount |
$ 848,220
|
| InvestmentCompanyPortfolioTurnover |
24.00%
|
| Additional Fund Statistics [Text Block] |
Total Net Assets as of Period End |
$609,340,655 |
# of Portfolio Holdings as of Period End |
27 |
Portfolio Turnover Rate for the Period |
24% |
Total Net Advisory Fees Paid for the Period |
$848,220 | |
| Holdings [Text Block] |
Fixed Income |
45.2% |
Exchange-Traded Funds |
26.6% |
Equity |
22.7% |
Investment Companies |
1.3% |
Dynamic |
0.9% | |
| Material Fund Change [Text Block] |
This is a summary of certain changes to the Fund for the Period. For more complete information, you may review the Fund's next prospectus, which we expect to be available by April 30, 2026 at dfinview.com/GoldmanSachs or upon request at 1-800-621-2550. Effective February 13, 2026, the Fund changed its name from the Goldman Sachs Balanced Strategy Portfolio to the Goldman Sachs Conservative Allocation Fund. The Fund also changed its principal investment strategy reflecting that the Fund will operate as a fund-of-funds investing in underlying fixed income, equity, and alternative funds, with increased fixed income and equity allocations, along with the option to invest in alternative asset classes and monthly rebalancing. |
| Material Fund Change Name [Text Block] |
Effective February 13, 2026, the Fund changed its name from the Goldman Sachs Balanced Strategy Portfolio to the Goldman Sachs Conservative Allocation Fund.
|
| Material Fund Change Strategies [Text Block] |
The Fund also changed its principal investment strategy reflecting that the Fund will operate as a fund-of-funds investing in underlying fixed income, equity, and alternative funds, with increased fixed income and equity allocations, along with the option to invest in alternative asset classes and monthly rebalancing.
|
| Summary of Change Legend [Text Block] |
This is a summary of certain changes to the Fund for the Period. For more complete information, you may review the Fund's next prospectus, which we expect to be available by April 30, 2026 at dfinview.com/GoldmanSachs or upon request at 1-800-621-2550.
|
| Updated Prospectus Phone Number |
1-800-621-2550
|
| Updated Prospectus Web Address |
<span style="box-sizing: border-box; color: rgb(0, 0, 0); display: inline; flex-wrap: nowrap; font-size: 12px; font-weight: 400; grid-area: auto; line-height: 18px; margin: 0px; overflow: visible; text-align: left; text-align-last: auto; white-space-collapse: preserve-breaks;">dfinview.com/GoldmanSachs</span>
|
| C000025447 |
|
| Shareholder Report [Line Items] |
|
| Fund Name |
Goldman Sachs Conservative Allocation Fund
|
| Class Name |
Institutional Class
|
| Trading Symbol |
GIPIX
|
| Annual or Semi-Annual Statement [Text Block] |
This annual shareholder report contains important information about Goldman Sachs Conservative Allocation Fund (formerly, Goldman Sachs Balanced Strategy Portfolio) (the “Fund”) for the period of January 1, 2025 to December 31, 2025 (the “Period”).
|
| Additional Information [Text Block] |
You can find additional information about the Fund at am.gs.com or dfinview.com/GoldmanSachs. You can also request this information by contacting us at 1-800-621-2550.
|
| Material Fund Change Notice [Text Block] |
This report describes changes to the Fund that occurred during the Period.
|
| Additional Information Phone Number |
1-800-621-2550
|
| Additional Information Website |
<span style="box-sizing: border-box; color: rgb(0, 0, 0); display: inline; flex-wrap: nowrap; font-size: 12px; font-weight: 400; grid-area: auto; line-height: 18px; margin: 0px; overflow: visible; text-align: left; text-align-last: auto; white-space-collapse: preserve-breaks;">am.gs.com</span>
|
| Expenses [Text Block] |
What were the Fund costs for the Period?Based on a hypothetical $10,000 investment.
Class |
Costs of a $10,000 investment |
Costs paid as a percentage of a $10,000 investment |
Institutional |
$20 |
0.19% | |
| Expenses Paid, Amount |
$ 20
|
| Expense Ratio, Percent |
0.19%
|
| Factors Affecting Performance [Text Block] |
How did the Fund perform and what affected its performance?Easing trade tensions, robust corporate earnings results, better than consensus anticipated inflation data, resilient consumer spending, enthusiasm for technology/AI and central bank monetary policy influenced capital markets most. Both global equity and fixed income markets broadly generated positive returns. |
| Performance Past Does Not Indicate Future [Text] |
Performance data quoted above represents past performance. Past performance does not guarantee future results.
|
| Line Graph [Table Text Block] |
|
Institutional Shares |
Conservative Allocation Composite Index* |
MSCI® ACWI Index (Net, USD, Unhedged) |
Bloomberg Global Aggregate Bond Index (Gross, USD, Hedged) |
1/1/16 |
$1,000,000 |
$1,000,000 |
$1,000,000 |
$1,000,000 |
12/16 |
$1,053,800 |
$1,055,549 |
$1,078,643 |
$1,039,485 |
12/17 |
$1,176,357 |
$1,172,392 |
$1,337,216 |
$1,071,042 |
12/18 |
$1,099,541 |
$1,142,261 |
$1,211,325 |
$1,089,922 |
12/19 |
$1,271,949 |
$1,318,745 |
$1,533,506 |
$1,179,472 |
12/20 |
$1,412,881 |
$1,465,995 |
$1,782,776 |
$1,245,293 |
12/21 |
$1,524,922 |
$1,558,472 |
$2,113,255 |
$1,227,966 |
12/22 |
$1,316,160 |
$1,341,846 |
$1,725,177 |
$1,090,199 |
12/23 |
$1,480,417 |
$1,516,784 |
$2,108,199 |
$1,168,110 |
12/24 |
$1,606,549 |
$1,652,007 |
$2,476,895 |
$1,207,774 |
12/25 |
$1,797,567 |
$1,845,554 |
$3,030,169 |
$1,266,518 |
|
| Average Annual Return [Table Text Block] |
AATR |
1 Year |
5 Years |
10 Years |
Institutional Shares |
11.89% |
4.93% |
6.03% |
Conservative Allocation Composite Index* |
11.72% |
4.71% |
6.31% |
MSCI® ACWI Index (Net, USD, Unhedged) |
22.34% |
11.19% |
11.71% |
Bloomberg Global Aggregate Bond Index (Gross, USD, Hedged) |
4.86% |
0.34% |
2.39% | |
| AssetsNet |
$ 609,340,655
|
| Holdings Count | Holding |
27
|
| Advisory Fees Paid, Amount |
$ 848,220
|
| InvestmentCompanyPortfolioTurnover |
24.00%
|
| Additional Fund Statistics [Text Block] |
Total Net Assets as of Period End |
$609,340,655 |
# of Portfolio Holdings as of Period End |
27 |
Portfolio Turnover Rate for the Period |
24% |
Total Net Advisory Fees Paid for the Period |
$848,220 | |
| Holdings [Text Block] |
Fixed Income |
45.2% |
Exchange-Traded Funds |
26.6% |
Equity |
22.7% |
Investment Companies |
1.3% |
Dynamic |
0.9% | |
| Material Fund Change [Text Block] |
This is a summary of certain changes to the Fund for the Period. For more complete information, you may review the Fund's next prospectus, which we expect to be available by April 30, 2026 at dfinview.com/GoldmanSachs or upon request at 1-800-621-2550. Effective February 13, 2026, the Fund changed its name from the Goldman Sachs Balanced Strategy Portfolio to the Goldman Sachs Conservative Allocation Fund. The Fund also changed its principal investment strategy reflecting that the Fund will operate as a fund-of-funds investing in underlying fixed income, equity, and alternative funds, with increased fixed income and equity allocations, along with the option to invest in alternative asset classes and monthly rebalancing. |
| Material Fund Change Name [Text Block] |
Effective February 13, 2026, the Fund changed its name from the Goldman Sachs Balanced Strategy Portfolio to the Goldman Sachs Conservative Allocation Fund.
|
| Material Fund Change Strategies [Text Block] |
The Fund also changed its principal investment strategy reflecting that the Fund will operate as a fund-of-funds investing in underlying fixed income, equity, and alternative funds, with increased fixed income and equity allocations, along with the option to invest in alternative asset classes and monthly rebalancing.
|
| Summary of Change Legend [Text Block] |
This is a summary of certain changes to the Fund for the Period. For more complete information, you may review the Fund's next prospectus, which we expect to be available by April 30, 2026 at dfinview.com/GoldmanSachs or upon request at 1-800-621-2550.
|
| Updated Prospectus Phone Number |
1-800-621-2550
|
| Updated Prospectus Web Address |
<span style="box-sizing: border-box; color: rgb(0, 0, 0); display: inline; flex-wrap: nowrap; font-size: 12px; font-weight: 400; grid-area: auto; line-height: 18px; margin: 0px; overflow: visible; text-align: left; text-align-last: auto; white-space-collapse: preserve-breaks;">dfinview.com/GoldmanSachs</span>
|
| C000058960 |
|
| Shareholder Report [Line Items] |
|
| Fund Name |
Goldman Sachs Conservative Allocation Fund
|
| Class Name |
Investor Class
|
| Trading Symbol |
GIPTX
|
| Annual or Semi-Annual Statement [Text Block] |
This annual shareholder report contains important information about Goldman Sachs Conservative Allocation Fund (formerly, Goldman Sachs Balanced Strategy Portfolio) (the “Fund”) for the period of January 1, 2025 to December 31, 2025 (the “Period”).
|
| Additional Information [Text Block] |
You can find additional information about the Fund at am.gs.com or dfinview.com/GoldmanSachs. You can also request this information by contacting us at 1-800-526-7384.
|
| Material Fund Change Notice [Text Block] |
This report describes changes to the Fund that occurred during the Period.
|
| Additional Information Phone Number |
1-800-526-7384
|
| Additional Information Website |
<span style="box-sizing: border-box; color: rgb(0, 0, 0); display: inline; flex-wrap: nowrap; font-size: 12px; font-weight: 400; grid-area: auto; line-height: 18px; margin: 0px; overflow: visible; text-align: left; text-align-last: auto; white-space-collapse: preserve-breaks;">am.gs.com</span>
|
| Expenses [Text Block] |
What were the Fund costs for the Period?Based on a hypothetical $10,000 investment.
Class |
Costs of a $10,000 investment |
Costs paid as a percentage of a $10,000 investment |
Investor |
$32 |
0.30% | |
| Expenses Paid, Amount |
$ 32
|
| Expense Ratio, Percent |
0.30%
|
| Factors Affecting Performance [Text Block] |
How did the Fund perform and what affected its performance?Easing trade tensions, robust corporate earnings results, better than consensus anticipated inflation data, resilient consumer spending, enthusiasm for technology/AI and central bank monetary policy influenced capital markets most. Both global equity and fixed income markets broadly generated positive returns. |
| Performance Past Does Not Indicate Future [Text] |
Performance data quoted above represents past performance. Past performance does not guarantee future results.
|
| Line Graph [Table Text Block] |
|
Investor Shares |
Conservative Allocation Composite Index* |
MSCI® ACWI Index (Net, USD, Unhedged) |
Bloomberg Global Aggregate Bond Index (Gross, USD, Hedged) |
1/1/16 |
$10,000 |
$10,000 |
$10,000 |
$10,000 |
12/16 |
$10,534 |
$10,555 |
$10,786 |
$10,395 |
12/17 |
$11,736 |
$11,724 |
$13,372 |
$10,710 |
12/18 |
$10,960 |
$11,423 |
$12,113 |
$10,899 |
12/19 |
$12,658 |
$13,187 |
$15,335 |
$11,795 |
12/20 |
$14,050 |
$14,660 |
$17,828 |
$12,453 |
12/21 |
$15,139 |
$15,585 |
$21,133 |
$12,280 |
12/22 |
$13,051 |
$13,418 |
$17,252 |
$10,902 |
12/23 |
$14,659 |
$15,168 |
$21,082 |
$11,681 |
12/24 |
$15,897 |
$16,520 |
$24,769 |
$12,078 |
12/25 |
$17,777 |
$18,456 |
$30,302 |
$12,665 |
|
| Average Annual Return [Table Text Block] |
AATR |
1 Year |
5 Years |
10 Years |
Investor Shares |
11.83% |
4.81% |
5.92% |
Conservative Allocation Composite Index* |
11.72% |
4.71% |
6.31% |
MSCI® ACWI Index (Net, USD, Unhedged) |
22.34% |
11.19% |
11.71% |
Bloomberg Global Aggregate Bond Index (Gross, USD, Hedged) |
4.86% |
0.34% |
2.39% | |
| AssetsNet |
$ 609,340,655
|
| Holdings Count | Holding |
27
|
| Advisory Fees Paid, Amount |
$ 848,220
|
| InvestmentCompanyPortfolioTurnover |
24.00%
|
| Additional Fund Statistics [Text Block] |
Total Net Assets as of Period End |
$609,340,655 |
# of Portfolio Holdings as of Period End |
27 |
Portfolio Turnover Rate for the Period |
24% |
Total Net Advisory Fees Paid for the Period |
$848,220 | |
| Holdings [Text Block] |
Fixed Income |
45.2% |
Exchange-Traded Funds |
26.6% |
Equity |
22.7% |
Investment Companies |
1.3% |
Dynamic |
0.9% | |
| Material Fund Change [Text Block] |
This is a summary of certain changes to the Fund for the Period. For more complete information, you may review the Fund's next prospectus, which we expect to be available by April 30, 2026 at dfinview.com/GoldmanSachs or upon request at 1-800-526-7384. Effective February 13, 2026, the Fund changed its name from the Goldman Sachs Balanced Strategy Portfolio to the Goldman Sachs Conservative Allocation Fund. The Fund also changed its principal investment strategy reflecting that the Fund will operate as a fund-of-funds investing in underlying fixed income, equity, and alternative funds, with increased fixed income and equity allocations, along with the option to invest in alternative asset classes and monthly rebalancing. |
| Material Fund Change Name [Text Block] |
Effective February 13, 2026, the Fund changed its name from the Goldman Sachs Balanced Strategy Portfolio to the Goldman Sachs Conservative Allocation Fund.
|
| Material Fund Change Strategies [Text Block] |
The Fund also changed its principal investment strategy reflecting that the Fund will operate as a fund-of-funds investing in underlying fixed income, equity, and alternative funds, with increased fixed income and equity allocations, along with the option to invest in alternative asset classes and monthly rebalancing.
|
| Summary of Change Legend [Text Block] |
This is a summary of certain changes to the Fund for the Period. For more complete information, you may review the Fund's next prospectus, which we expect to be available by April 30, 2026 at dfinview.com/GoldmanSachs or upon request at 1-800-526-7384.
|
| Updated Prospectus Phone Number |
1-800-526-7384
|
| Updated Prospectus Web Address |
<span style="box-sizing: border-box; color: rgb(0, 0, 0); display: inline; flex-wrap: nowrap; font-size: 12px; font-weight: 400; grid-area: auto; line-height: 18px; margin: 0px; overflow: visible; text-align: left; text-align-last: auto; white-space-collapse: preserve-breaks;">dfinview.com/GoldmanSachs</span>
|
| C000025448 |
|
| Shareholder Report [Line Items] |
|
| Fund Name |
Goldman Sachs Conservative Allocation Fund
|
| Class Name |
Service Class
|
| Trading Symbol |
GIPSX
|
| Annual or Semi-Annual Statement [Text Block] |
This annual shareholder report contains important information about Goldman Sachs Conservative Allocation Fund (formerly, Goldman Sachs Balanced Strategy Portfolio) (the “Fund”) for the period of January 1, 2025 to December 31, 2025 (the “Period”).
|
| Additional Information [Text Block] |
You can find additional information about the Fund at am.gs.com or dfinview.com/GoldmanSachs. You can also request this information by contacting us at 1-800-621-2550.
|
| Material Fund Change Notice [Text Block] |
This report describes changes to the Fund that occurred during the Period.
|
| Additional Information Phone Number |
1-800-621-2550
|
| Additional Information Website |
<span style="box-sizing: border-box; color: rgb(0, 0, 0); display: inline; flex-wrap: nowrap; font-size: 12px; font-weight: 400; grid-area: auto; line-height: 18px; margin: 0px; overflow: visible; text-align: left; text-align-last: auto; white-space-collapse: preserve-breaks;">am.gs.com</span>
|
| Expenses [Text Block] |
What were the Fund costs for the Period?Based on a hypothetical $10,000 investment.
Class |
Costs of a $10,000 investment |
Costs paid as a percentage of a $10,000 investment |
Service |
$73 |
0.69% | |
| Expenses Paid, Amount |
$ 73
|
| Expense Ratio, Percent |
0.69%
|
| Factors Affecting Performance [Text Block] |
How did the Fund perform and what affected its performance?Easing trade tensions, robust corporate earnings results, better than consensus anticipated inflation data, resilient consumer spending, enthusiasm for technology/AI and central bank monetary policy influenced capital markets most. Both global equity and fixed income markets broadly generated positive returns. |
| Performance Past Does Not Indicate Future [Text] |
Performance data quoted above represents past performance. Past performance does not guarantee future results.
|
| Line Graph [Table Text Block] |
|
Service Shares |
Conservative Allocation Composite Index* |
MSCI® ACWI Index (Net, USD, Unhedged) |
Bloomberg Global Aggregate Bond Index (Gross, USD, Hedged) |
1/1/16 |
$10,000 |
$10,000 |
$10,000 |
$10,000 |
12/16 |
$10,569 |
$10,555 |
$10,786 |
$10,395 |
12/17 |
$11,736 |
$11,724 |
$13,372 |
$10,710 |
12/18 |
$10,923 |
$11,423 |
$12,113 |
$10,899 |
12/19 |
$12,560 |
$13,187 |
$15,335 |
$11,795 |
12/20 |
$13,885 |
$14,660 |
$17,828 |
$12,453 |
12/21 |
$14,918 |
$15,585 |
$21,133 |
$12,280 |
12/22 |
$12,803 |
$13,418 |
$17,252 |
$10,902 |
12/23 |
$14,331 |
$15,168 |
$21,082 |
$11,681 |
12/24 |
$15,478 |
$16,520 |
$24,769 |
$12,078 |
12/25 |
$17,230 |
$18,456 |
$30,302 |
$12,665 |
|
| Average Annual Return [Table Text Block] |
AATR |
1 Year |
5 Years |
10 Years |
Service Shares |
11.32% |
4.41% |
5.59% |
Conservative Allocation Composite Index* |
11.72% |
4.71% |
6.31% |
MSCI® ACWI Index (Net, USD, Unhedged) |
22.34% |
11.19% |
11.71% |
Bloomberg Global Aggregate Bond Index (Gross, USD, Hedged) |
4.86% |
0.34% |
2.39% | |
| AssetsNet |
$ 609,340,655
|
| Holdings Count | Holding |
27
|
| Advisory Fees Paid, Amount |
$ 848,220
|
| InvestmentCompanyPortfolioTurnover |
24.00%
|
| Additional Fund Statistics [Text Block] |
Total Net Assets as of Period End |
$609,340,655 |
# of Portfolio Holdings as of Period End |
27 |
Portfolio Turnover Rate for the Period |
24% |
Total Net Advisory Fees Paid for the Period |
$848,220 | |
| Holdings [Text Block] |
Fixed Income |
45.2% |
Exchange-Traded Funds |
26.6% |
Equity |
22.7% |
Investment Companies |
1.3% |
Dynamic |
0.9% | |
| Material Fund Change [Text Block] |
This is a summary of certain changes to the Fund for the Period. For more complete information, you may review the Fund's next prospectus, which we expect to be available by April 30, 2026 at dfinview.com/GoldmanSachs or upon request at 1-800-621-2550. Effective February 13, 2026, the Fund changed its name from the Goldman Sachs Balanced Strategy Portfolio to the Goldman Sachs Conservative Allocation Fund. The Fund also changed its principal investment strategy reflecting that the Fund will operate as a fund-of-funds investing in underlying fixed income, equity, and alternative funds, with increased fixed income and equity allocations, along with the option to invest in alternative asset classes and monthly rebalancing. |
| Material Fund Change Name [Text Block] |
Effective February 13, 2026, the Fund changed its name from the Goldman Sachs Balanced Strategy Portfolio to the Goldman Sachs Conservative Allocation Fund.
|
| Material Fund Change Strategies [Text Block] |
The Fund also changed its principal investment strategy reflecting that the Fund will operate as a fund-of-funds investing in underlying fixed income, equity, and alternative funds, with increased fixed income and equity allocations, along with the option to invest in alternative asset classes and monthly rebalancing.
|
| Summary of Change Legend [Text Block] |
This is a summary of certain changes to the Fund for the Period. For more complete information, you may review the Fund's next prospectus, which we expect to be available by April 30, 2026 at dfinview.com/GoldmanSachs or upon request at 1-800-621-2550.
|
| Updated Prospectus Phone Number |
1-800-621-2550
|
| Updated Prospectus Web Address |
<span style="box-sizing: border-box; color: rgb(0, 0, 0); display: inline; flex-wrap: nowrap; font-size: 12px; font-weight: 400; grid-area: auto; line-height: 18px; margin: 0px; overflow: visible; text-align: left; text-align-last: auto; white-space-collapse: preserve-breaks;">dfinview.com/GoldmanSachs</span>
|
| C000025513 |
|
| Shareholder Report [Line Items] |
|
| Fund Name |
Goldman Sachs Moderate Allocation Fund
|
| Class Name |
Class A
|
| Trading Symbol |
GOIAX
|
| Annual or Semi-Annual Statement [Text Block] |
This annual shareholder report contains important information about Goldman Sachs Moderate Allocation Fund (formerly, Goldman Sachs Growth & Income Strategy Portfolio) (the “Fund”) for the period of January 1, 2025 to December 31, 2025 (the “Period”).
|
| Additional Information [Text Block] |
You can find additional information about the Fund at am.gs.com or dfinview.com/GoldmanSachs. You can also request this information by contacting us at 1-800-526-7384.
|
| Material Fund Change Notice [Text Block] |
This report describes changes to the Fund that occurred during the Period.
|
| Additional Information Phone Number |
1-800-526-7384
|
| Additional Information Website |
<span style="box-sizing: border-box; color: rgb(0, 0, 0); display: inline; flex-wrap: nowrap; font-size: 12px; font-weight: 400; grid-area: auto; line-height: 18px; margin: 0px; overflow: visible; text-align: left; text-align-last: auto; white-space-collapse: preserve-breaks;">am.gs.com</span>
|
| Expenses [Text Block] |
What were the Fund costs for the Period?Based on a hypothetical $10,000 investment.
Class |
Costs of a $10,000 investment |
Costs paid as a percentage of a $10,000 investment |
A |
$59 |
0.55% | |
| Expenses Paid, Amount |
$ 59
|
| Expense Ratio, Percent |
0.55%
|
| Factors Affecting Performance [Text Block] |
How did the Fund perform and what affected its performance?Easing trade tensions, robust corporate earnings results, better than consensus anticipated inflation data, resilient consumer spending, enthusiasm for technology/AI and central bank monetary policy influenced capital markets most. Both global equity and fixed income markets broadly generated positive returns. |
| Performance Past Does Not Indicate Future [Text] |
Performance data quoted above represents past performance. Past performance does not guarantee future results.
|
| Line Graph [Table Text Block] |
|
Class A (including sales charges) |
Class A (excluding sales charges) |
Bloomberg Global Aggregate Bond Index (Gross, USD, Hedged) |
Moderate Allocation Composite Index* |
MSCI® ACWI Index (Net, USD, Unhedged) |
1/1/16 |
$9,450 |
$10,000 |
$10,000 |
$10,000 |
$10,000 |
12/16 |
$9,994 |
$10,576 |
$10,395 |
$10,634 |
$10,786 |
12/17 |
$11,612 |
$12,288 |
$10,710 |
$12,256 |
$13,372 |
12/18 |
$10,574 |
$11,190 |
$10,899 |
$11,667 |
$12,113 |
12/19 |
$12,541 |
$13,271 |
$11,795 |
$13,899 |
$15,335 |
12/20 |
$14,087 |
$14,907 |
$12,453 |
$15,754 |
$17,828 |
12/21 |
$15,816 |
$16,736 |
$12,280 |
$17,375 |
$21,133 |
12/22 |
$13,364 |
$14,142 |
$10,902 |
$14,711 |
$17,252 |
12/23 |
$15,329 |
$16,221 |
$11,681 |
$17,072 |
$21,082 |
12/24 |
$17,037 |
$18,028 |
$12,078 |
$19,076 |
$24,769 |
12/25 |
$19,693 |
$20,839 |
$12,665 |
$21,977 |
$30,302 |
|
| Average Annual Return [Table Text Block] |
AATR |
1 Year |
5 Years |
10 Years |
Class A |
15.59% |
6.92% |
7.61% |
Class A including sales charges |
9.22% |
5.72% |
7.00% |
Moderate Allocation Composite Index* |
15.21% |
6.88% |
8.19% |
Bloomberg Global Aggregate Bond Index (Gross, USD, Hedged) |
4.86% |
0.34% |
2.39% |
MSCI® ACWI Index (Net, USD, Unhedged) |
22.34% |
11.19% |
11.71% | |
| AssetsNet |
$ 1,064,953,637
|
| Holdings Count | Holding |
27
|
| Advisory Fees Paid, Amount |
$ 1,472,959
|
| InvestmentCompanyPortfolioTurnover |
19.00%
|
| Additional Fund Statistics [Text Block] |
Total Net Assets as of Period End |
$1,064,953,637 |
# of Portfolio Holdings as of Period End |
27 |
Portfolio Turnover Rate for the Period |
19% |
Total Net Advisory Fees Paid for the Period |
$1,472,959 | |
| Holdings [Text Block] |
Equity |
32.9% |
Exchange-Traded Funds |
30.8% |
Fixed Income |
30.4% |
Investment Companies |
1.7% |
Dynamic |
0.9% | |
| Material Fund Change [Text Block] |
This is a summary of certain changes to the Fund for the Period. For more complete information, you may review the Fund's next prospectus, which we expect to be available by April 30, 2026 at dfinview.com/GoldmanSachs or upon request at 1-800-526-7384. Effective February 13, 2026, the Fund changed its name from the Goldman Sachs Growth and Income Strategy Portfolio to the Goldman Sachs Moderate Allocation Fund. The Fund also changed its principal investment strategy reflecting that the Fund will operate as a fund-of-funds investing in underlying equity, fixed income, and alternative funds, with increased equity and fixed income allocations, along with the option to invest in alternative asset classes and monthly rebalancing. |
| Material Fund Change Name [Text Block] |
Effective February 13, 2026, the Fund changed its name from the Goldman Sachs Growth and Income Strategy Portfolio to the Goldman Sachs Moderate Allocation Fund.
|
| Material Fund Change Strategies [Text Block] |
The Fund also changed its principal investment strategy reflecting that the Fund will operate as a fund-of-funds investing in underlying equity, fixed income, and alternative funds, with increased equity and fixed income allocations, along with the option to invest in alternative asset classes and monthly rebalancing.
|
| Summary of Change Legend [Text Block] |
This is a summary of certain changes to the Fund for the Period. For more complete information, you may review the Fund's next prospectus, which we expect to be available by April 30, 2026 at dfinview.com/GoldmanSachs or upon request at 1-800-526-7384.
|
| Updated Prospectus Phone Number |
1-800-526-7384
|
| Updated Prospectus Web Address |
<span style="box-sizing: border-box; color: rgb(0, 0, 0); display: inline; flex-wrap: nowrap; font-size: 12px; font-weight: 400; grid-area: auto; line-height: 18px; margin: 0px; overflow: visible; text-align: left; text-align-last: auto; white-space-collapse: preserve-breaks;">dfinview.com/GoldmanSachs</span>
|
| C000025515 |
|
| Shareholder Report [Line Items] |
|
| Fund Name |
Goldman Sachs Moderate Allocation Fund
|
| Class Name |
Class C
|
| Trading Symbol |
GOICX
|
| Annual or Semi-Annual Statement [Text Block] |
This annual shareholder report contains important information about Goldman Sachs Moderate Allocation Fund (formerly, Goldman Sachs Growth & Income Strategy Portfolio) (the “Fund”) for the period of January 1, 2025 to December 31, 2025 (the “Period”).
|
| Additional Information [Text Block] |
You can find additional information about the Fund at am.gs.com or dfinview.com/GoldmanSachs. You can also request this information by contacting us at 1-800-526-7384.
|
| Material Fund Change Notice [Text Block] |
This report describes changes to the Fund that occurred during the Period.
|
| Additional Information Phone Number |
1-800-526-7384
|
| Additional Information Website |
<span style="box-sizing: border-box; color: rgb(0, 0, 0); display: inline; flex-wrap: nowrap; font-size: 12px; font-weight: 400; grid-area: auto; line-height: 18px; margin: 0px; overflow: visible; text-align: left; text-align-last: auto; white-space-collapse: preserve-breaks;">am.gs.com</span>
|
| Expenses [Text Block] |
What were the Fund costs for the Period?Based on a hypothetical $10,000 investment.
Class |
Costs of a $10,000 investment |
Costs paid as a percentage of a $10,000 investment |
C |
$140 |
1.30% | |
| Expenses Paid, Amount |
$ 140
|
| Expense Ratio, Percent |
1.30%
|
| Factors Affecting Performance [Text Block] |
How did the Fund perform and what affected its performance?Easing trade tensions, robust corporate earnings results, better than consensus anticipated inflation data, resilient consumer spending, enthusiasm for technology/AI and central bank monetary policy influenced capital markets most. Both global equity and fixed income markets broadly generated positive returns. |
| Performance Past Does Not Indicate Future [Text] |
Performance data quoted above represents past performance. Past performance does not guarantee future results.
|
| Line Graph [Table Text Block] |
|
Class C (including sales charges) |
Class C (excluding sales charges) |
Bloomberg Global Aggregate Bond Index (Gross, USD, Hedged) |
Moderate Allocation Composite Index* |
MSCI® ACWI Index (Net, USD, Unhedged) |
1/1/16 |
$9,900 |
$10,000 |
$10,000 |
$10,000 |
$10,000 |
12/16 |
$10,382 |
$10,487 |
$10,395 |
$10,634 |
$10,786 |
12/17 |
$11,972 |
$12,093 |
$10,710 |
$12,256 |
$13,372 |
12/18 |
$10,820 |
$10,929 |
$10,899 |
$11,667 |
$12,113 |
12/19 |
$12,744 |
$12,872 |
$11,795 |
$13,899 |
$15,335 |
12/20 |
$14,207 |
$14,350 |
$12,453 |
$15,754 |
$17,828 |
12/21 |
$15,832 |
$15,992 |
$12,280 |
$17,375 |
$21,133 |
12/22 |
$13,274 |
$13,408 |
$10,902 |
$14,711 |
$17,252 |
12/23 |
$15,116 |
$15,269 |
$11,681 |
$17,072 |
$21,082 |
12/24 |
$16,674 |
$16,843 |
$12,078 |
$19,076 |
$24,769 |
12/25 |
$19,130 |
$19,324 |
$12,665 |
$21,977 |
$30,302 |
|
| Average Annual Return [Table Text Block] |
AATR |
1 Year |
5 Years |
10 Years |
Class C |
14.73% |
6.13% |
6.80% |
Class C including sales charges |
13.59% |
6.13% |
6.80% |
Moderate Allocation Composite Index* |
15.21% |
6.88% |
8.19% |
Bloomberg Global Aggregate Bond Index (Gross, USD, Hedged) |
4.86% |
0.34% |
2.39% |
MSCI® ACWI Index (Net, USD, Unhedged) |
22.34% |
11.19% |
11.71% | |
| AssetsNet |
$ 1,064,953,637
|
| Holdings Count | Holding |
27
|
| Advisory Fees Paid, Amount |
$ 1,472,959
|
| InvestmentCompanyPortfolioTurnover |
19.00%
|
| Additional Fund Statistics [Text Block] |
Total Net Assets as of Period End |
$1,064,953,637 |
# of Portfolio Holdings as of Period End |
27 |
Portfolio Turnover Rate for the Period |
19% |
Total Net Advisory Fees Paid for the Period |
$1,472,959 | |
| Holdings [Text Block] |
Equity |
32.9% |
Exchange-Traded Funds |
30.8% |
Fixed Income |
30.4% |
Investment Companies |
1.7% |
Dynamic |
0.9% | |
| Material Fund Change [Text Block] |
This is a summary of certain changes to the Fund for the Period. For more complete information, you may review the Fund's next prospectus, which we expect to be available by April 30, 2026 at dfinview.com/GoldmanSachs or upon request at 1-800-526-7384. Effective February 13, 2026, the Fund changed its name from the Goldman Sachs Growth and Income Strategy Portfolio to the Goldman Sachs Moderate Allocation Fund. The Fund also changed its principal investment strategy reflecting that the Fund will operate as a fund-of-funds investing in underlying equity, fixed income, and alternative funds, with increased equity and fixed income allocations, along with the option to invest in alternative asset classes and monthly rebalancing. |
| Material Fund Change Name [Text Block] |
Effective February 13, 2026, the Fund changed its name from the Goldman Sachs Growth and Income Strategy Portfolio to the Goldman Sachs Moderate Allocation Fund.
|
| Material Fund Change Strategies [Text Block] |
The Fund also changed its principal investment strategy reflecting that the Fund will operate as a fund-of-funds investing in underlying equity, fixed income, and alternative funds, with increased equity and fixed income allocations, along with the option to invest in alternative asset classes and monthly rebalancing.
|
| Summary of Change Legend [Text Block] |
This is a summary of certain changes to the Fund for the Period. For more complete information, you may review the Fund's next prospectus, which we expect to be available by April 30, 2026 at dfinview.com/GoldmanSachs or upon request at 1-800-526-7384.
|
| Updated Prospectus Phone Number |
1-800-526-7384
|
| Updated Prospectus Web Address |
<span style="box-sizing: border-box; color: rgb(0, 0, 0); display: inline; flex-wrap: nowrap; font-size: 12px; font-weight: 400; grid-area: auto; line-height: 18px; margin: 0px; overflow: visible; text-align: left; text-align-last: auto; white-space-collapse: preserve-breaks;">dfinview.com/GoldmanSachs</span>
|
| C000201784 |
|
| Shareholder Report [Line Items] |
|
| Fund Name |
Goldman Sachs Moderate Allocation Fund
|
| Class Name |
Class P
|
| Trading Symbol |
GGSPX
|
| Annual or Semi-Annual Statement [Text Block] |
This annual shareholder report contains important information about Goldman Sachs Moderate Allocation Fund (formerly, Goldman Sachs Growth & Income Strategy Portfolio) (the “Fund”) for the period of January 1, 2025 to December 31, 2025 (the “Period”).
|
| Additional Information [Text Block] |
You can find additional information about the Fund at am.gs.com or dfinview.com/GoldmanSachs. You can also request this information by contacting us at 1-800-621-2550.
|
| Material Fund Change Notice [Text Block] |
This report describes changes to the Fund that occurred during the Period.
|
| Additional Information Phone Number |
1-800-621-2550
|
| Additional Information Website |
<span style="box-sizing: border-box; color: rgb(0, 0, 0); display: inline; flex-wrap: nowrap; font-size: 12px; font-weight: 400; grid-area: auto; line-height: 18px; margin: 0px; overflow: visible; text-align: left; text-align-last: auto; white-space-collapse: preserve-breaks;">am.gs.com</span>
|
| Expenses [Text Block] |
What were the Fund costs for the Period?Based on a hypothetical $10,000 investment.
Class |
Costs of a $10,000 investment |
Costs paid as a percentage of a $10,000 investment |
P |
$19 |
0.18% | |
| Expenses Paid, Amount |
$ 19
|
| Expense Ratio, Percent |
0.18%
|
| Factors Affecting Performance [Text Block] |
How did the Fund perform and what affected its performance?Easing trade tensions, robust corporate earnings results, better than consensus anticipated inflation data, resilient consumer spending, enthusiasm for technology/AI and central bank monetary policy influenced capital markets most. Both global equity and fixed income markets broadly generated positive returns. |
| Performance Past Does Not Indicate Future [Text] |
Performance data quoted above represents past performance. Past performance does not guarantee future results.
|
| Line Graph [Table Text Block] |
|
Class P |
Bloomberg Global Aggregate Bond Index (Gross, USD, Hedged) |
Moderate Allocation Composite Index* |
MSCI® ACWI Index (Net, USD, Unhedged) |
4/17/18 |
$10,000 |
$10,000 |
$10,000 |
$10,000 |
12/18 |
$9,071 |
$10,193 |
$9,459 |
$8,955 |
12/19 |
$10,804 |
$11,030 |
$11,269 |
$11,337 |
12/20 |
$12,180 |
$11,646 |
$12,773 |
$13,179 |
12/21 |
$13,722 |
$11,484 |
$14,088 |
$15,622 |
12/22 |
$11,638 |
$10,196 |
$11,928 |
$12,753 |
12/23 |
$13,403 |
$10,924 |
$13,842 |
$15,585 |
12/24 |
$14,955 |
$11,295 |
$15,465 |
$18,311 |
12/25 |
$17,340 |
$11,844 |
$17,818 |
$22,401 |
|
| Average Annual Return [Table Text Block] |
AATR |
1 Year |
5 Years |
Since Inception |
Class P (Commenced April 17, 2018) |
15.95% |
7.32% |
7.39% |
Moderate Allocation Composite Index* |
15.21% |
6.88% |
7.77% |
Bloomberg Global Aggregate Bond Index (Gross, USD, Hedged) |
4.86% |
0.34% |
2.22% |
MSCI® ACWI Index (Net, USD, Unhedged) |
22.34% |
11.19% |
11.02% | |
| Performance Inception Date |
Apr. 17, 2018
|
| AssetsNet |
$ 1,064,953,637
|
| Holdings Count | Holding |
27
|
| Advisory Fees Paid, Amount |
$ 1,472,959
|
| InvestmentCompanyPortfolioTurnover |
19.00%
|
| Additional Fund Statistics [Text Block] |
Total Net Assets as of Period End |
$1,064,953,637 |
# of Portfolio Holdings as of Period End |
27 |
Portfolio Turnover Rate for the Period |
19% |
Total Net Advisory Fees Paid for the Period |
$1,472,959 | |
| Holdings [Text Block] |
Equity |
32.9% |
Exchange-Traded Funds |
30.8% |
Fixed Income |
30.4% |
Investment Companies |
1.7% |
Dynamic |
0.9% | |
| Material Fund Change [Text Block] |
This is a summary of certain changes to the Fund for the Period. For more complete information, you may review the Fund's next prospectus, which we expect to be available by April 30, 2026 at dfinview.com/GoldmanSachs or upon request at 1-800-621-2550. Effective February 13, 2026, the Fund changed its name from the Goldman Sachs Growth and Income Strategy Portfolio to the Goldman Sachs Moderate Allocation Fund. The Fund also changed its principal investment strategy reflecting that the Fund will operate as a fund-of-funds investing in underlying equity, fixed income, and alternative funds, with increased equity and fixed income allocations, along with the option to invest in alternative asset classes and monthly rebalancing. |
| Material Fund Change Name [Text Block] |
Effective February 13, 2026, the Fund changed its name from the Goldman Sachs Growth and Income Strategy Portfolio to the Goldman Sachs Moderate Allocation Fund.
|
| Material Fund Change Strategies [Text Block] |
The Fund also changed its principal investment strategy reflecting that the Fund will operate as a fund-of-funds investing in underlying equity, fixed income, and alternative funds, with increased equity and fixed income allocations, along with the option to invest in alternative asset classes and monthly rebalancing.
|
| Summary of Change Legend [Text Block] |
This is a summary of certain changes to the Fund for the Period. For more complete information, you may review the Fund's next prospectus, which we expect to be available by April 30, 2026 at dfinview.com/GoldmanSachs or upon request at 1-800-621-2550.
|
| Updated Prospectus Phone Number |
1-800-621-2550
|
| Updated Prospectus Web Address |
<span style="box-sizing: border-box; color: rgb(0, 0, 0); display: inline; flex-wrap: nowrap; font-size: 12px; font-weight: 400; grid-area: auto; line-height: 18px; margin: 0px; overflow: visible; text-align: left; text-align-last: auto; white-space-collapse: preserve-breaks;">dfinview.com/GoldmanSachs</span>
|
| C000058961 |
|
| Shareholder Report [Line Items] |
|
| Fund Name |
Goldman Sachs Moderate Allocation Fund
|
| Class Name |
Class R
|
| Trading Symbol |
GPIRX
|
| Annual or Semi-Annual Statement [Text Block] |
This annual shareholder report contains important information about Goldman Sachs Moderate Allocation Fund (formerly, Goldman Sachs Growth & Income Strategy Portfolio) (the “Fund”) for the period of January 1, 2025 to December 31, 2025 (the “Period”).
|
| Additional Information [Text Block] |
You can find additional information about the Fund at am.gs.com or dfinview.com/GoldmanSachs. You can also request this information by contacting us at 1-800-526-7384.
|
| Material Fund Change Notice [Text Block] |
This report describes changes to the Fund that occurred during the Period.
|
| Additional Information Phone Number |
1-800-526-7384
|
| Additional Information Website |
<span style="box-sizing: border-box; color: rgb(0, 0, 0); display: inline; flex-wrap: nowrap; font-size: 12px; font-weight: 400; grid-area: auto; line-height: 18px; margin: 0px; overflow: visible; text-align: left; text-align-last: auto; white-space-collapse: preserve-breaks;">am.gs.com</span>
|
| Expenses [Text Block] |
What were the Fund costs for the Period?Based on a hypothetical $10,000 investment.
Class |
Costs of a $10,000 investment |
Costs paid as a percentage of a $10,000 investment |
R |
$86 |
0.80% | |
| Expenses Paid, Amount |
$ 86
|
| Expense Ratio, Percent |
0.80%
|
| Factors Affecting Performance [Text Block] |
How did the Fund perform and what affected its performance?Easing trade tensions, robust corporate earnings results, better than consensus anticipated inflation data, resilient consumer spending, enthusiasm for technology/AI and central bank monetary policy influenced capital markets most. Both global equity and fixed income markets broadly generated positive returns. |
| Performance Past Does Not Indicate Future [Text] |
Performance data quoted above represents past performance. Past performance does not guarantee future results.
|
| Line Graph [Table Text Block] |
|
Class R |
Bloomberg Global Aggregate Bond Index (Gross, USD, Hedged) |
Moderate Allocation Composite Index* |
MSCI® ACWI Index (Net, USD, Unhedged) |
1/1/16 |
$10,000 |
$10,000 |
$10,000 |
$10,000 |
12/16 |
$10,542 |
$10,395 |
$10,634 |
$10,786 |
12/17 |
$12,211 |
$10,710 |
$12,256 |
$13,372 |
12/18 |
$11,100 |
$10,899 |
$11,667 |
$12,113 |
12/19 |
$13,131 |
$11,795 |
$13,899 |
$15,335 |
12/20 |
$14,717 |
$12,453 |
$15,754 |
$17,828 |
12/21 |
$16,474 |
$12,280 |
$17,375 |
$21,133 |
12/22 |
$13,883 |
$10,902 |
$14,711 |
$17,252 |
12/23 |
$15,881 |
$11,681 |
$17,072 |
$21,082 |
12/24 |
$17,615 |
$12,078 |
$19,076 |
$24,769 |
12/25 |
$20,306 |
$12,665 |
$21,977 |
$30,302 |
|
| Average Annual Return [Table Text Block] |
AATR |
1 Year |
5 Years |
10 Years |
Class R |
15.28% |
6.65% |
7.33% |
Moderate Allocation Composite Index* |
15.21% |
6.88% |
8.19% |
Bloomberg Global Aggregate Bond Index (Gross, USD, Hedged) |
4.86% |
0.34% |
2.39% |
MSCI® ACWI Index (Net, USD, Unhedged) |
22.34% |
11.19% |
11.71% | |
| AssetsNet |
$ 1,064,953,637
|
| Holdings Count | Holding |
27
|
| Advisory Fees Paid, Amount |
$ 1,472,959
|
| InvestmentCompanyPortfolioTurnover |
19.00%
|
| Additional Fund Statistics [Text Block] |
Total Net Assets as of Period End |
$1,064,953,637 |
# of Portfolio Holdings as of Period End |
27 |
Portfolio Turnover Rate for the Period |
19% |
Total Net Advisory Fees Paid for the Period |
$1,472,959 | |
| Holdings [Text Block] |
Equity |
32.9% |
Exchange-Traded Funds |
30.8% |
Fixed Income |
30.4% |
Investment Companies |
1.7% |
Dynamic |
0.9% | |
| Material Fund Change [Text Block] |
This is a summary of certain changes to the Fund for the Period. For more complete information, you may review the Fund's next prospectus, which we expect to be available by April 30, 2026 at dfinview.com/GoldmanSachs or upon request at 1-800-526-7384. Effective February 13, 2026, the Fund changed its name from the Goldman Sachs Growth and Income Strategy Portfolio to the Goldman Sachs Moderate Allocation Fund. The Fund also changed its principal investment strategy reflecting that the Fund will operate as a fund-of-funds investing in underlying equity, fixed income, and alternative funds, with increased equity and fixed income allocations, along with the option to invest in alternative asset classes and monthly rebalancing. |
| Material Fund Change Name [Text Block] |
Effective February 13, 2026, the Fund changed its name from the Goldman Sachs Growth and Income Strategy Portfolio to the Goldman Sachs Moderate Allocation Fund.
|
| Material Fund Change Strategies [Text Block] |
The Fund also changed its principal investment strategy reflecting that the Fund will operate as a fund-of-funds investing in underlying equity, fixed income, and alternative funds, with increased equity and fixed income allocations, along with the option to invest in alternative asset classes and monthly rebalancing.
|
| Summary of Change Legend [Text Block] |
This is a summary of certain changes to the Fund for the Period. For more complete information, you may review the Fund's next prospectus, which we expect to be available by April 30, 2026 at dfinview.com/GoldmanSachs or upon request at 1-800-526-7384.
|
| Updated Prospectus Phone Number |
1-800-526-7384
|
| Updated Prospectus Web Address |
<span style="box-sizing: border-box; color: rgb(0, 0, 0); display: inline; flex-wrap: nowrap; font-size: 12px; font-weight: 400; grid-area: auto; line-height: 18px; margin: 0px; overflow: visible; text-align: left; text-align-last: auto; white-space-collapse: preserve-breaks;">dfinview.com/GoldmanSachs</span>
|
| C000161532 |
|
| Shareholder Report [Line Items] |
|
| Fund Name |
Goldman Sachs Moderate Allocation Fund
|
| Class Name |
Class R6
|
| Trading Symbol |
GOIUX
|
| Annual or Semi-Annual Statement [Text Block] |
This annual shareholder report contains important information about Goldman Sachs Moderate Allocation Fund (formerly, Goldman Sachs Growth & Income Strategy Portfolio) (the “Fund”) for the period of January 1, 2025 to December 31, 2025 (the “Period”).
|
| Additional Information [Text Block] |
You can find additional information about the Fund at am.gs.com or dfinview.com/GoldmanSachs. You can also request this information by contacting us at 1-800-621-2550.
|
| Material Fund Change Notice [Text Block] |
This report describes changes to the Fund that occurred during the Period.
|
| Additional Information Phone Number |
1-800-621-2550
|
| Additional Information Website |
<span style="box-sizing: border-box; color: rgb(0, 0, 0); display: inline; flex-wrap: nowrap; font-size: 12px; font-weight: 400; grid-area: auto; line-height: 18px; margin: 0px; overflow: visible; text-align: left; text-align-last: auto; white-space-collapse: preserve-breaks;">am.gs.com</span>
|
| Expenses [Text Block] |
What were the Fund costs for the Period?Based on a hypothetical $10,000 investment.
Class |
Costs of a $10,000 investment |
Costs paid as a percentage of a $10,000 investment |
R6 |
$19 |
0.18% | |
| Expenses Paid, Amount |
$ 19
|
| Expense Ratio, Percent |
0.18%
|
| Factors Affecting Performance [Text Block] |
How did the Fund perform and what affected its performance?Easing trade tensions, robust corporate earnings results, better than consensus anticipated inflation data, resilient consumer spending, enthusiasm for technology/AI and central bank monetary policy influenced capital markets most. Both global equity and fixed income markets broadly generated positive returns. |
| Performance Past Does Not Indicate Future [Text] |
Performance data quoted above represents past performance. Past performance does not guarantee future results.
|
| Line Graph [Table Text Block] |
|
Class R6 |
Bloomberg Global Aggregate Bond Index (Gross, USD, Hedged) |
Moderate Allocation Composite Index* |
MSCI® ACWI Index (Net, USD, Unhedged) |
1/1/16 |
$10,000 |
$10,000 |
$10,000 |
$10,000 |
12/16 |
$10,609 |
$10,395 |
$10,634 |
$10,786 |
12/17 |
$12,382 |
$10,710 |
$12,256 |
$13,372 |
12/18 |
$11,316 |
$10,899 |
$11,667 |
$12,113 |
12/19 |
$13,477 |
$11,795 |
$13,899 |
$15,335 |
12/20 |
$15,194 |
$12,453 |
$15,754 |
$17,828 |
12/21 |
$17,122 |
$12,280 |
$17,375 |
$21,133 |
12/22 |
$14,525 |
$10,902 |
$14,711 |
$17,252 |
12/23 |
$16,715 |
$11,681 |
$17,072 |
$21,082 |
12/24 |
$18,651 |
$12,078 |
$19,076 |
$24,769 |
12/25 |
$21,638 |
$12,665 |
$21,977 |
$30,302 |
|
| Average Annual Return [Table Text Block] |
AATR |
1 Year |
5 Years |
10 Years |
Class R6 |
16.02% |
7.32% |
8.02% |
Moderate Allocation Composite Index* |
15.21% |
6.88% |
8.19% |
Bloomberg Global Aggregate Bond Index (Gross, USD, Hedged) |
4.86% |
0.34% |
2.39% |
MSCI® ACWI Index (Net, USD, Unhedged) |
22.34% |
11.19% |
11.71% | |
| AssetsNet |
$ 1,064,953,637
|
| Holdings Count | Holding |
27
|
| Advisory Fees Paid, Amount |
$ 1,472,959
|
| InvestmentCompanyPortfolioTurnover |
19.00%
|
| Additional Fund Statistics [Text Block] |
Total Net Assets as of Period End |
$1,064,953,637 |
# of Portfolio Holdings as of Period End |
27 |
Portfolio Turnover Rate for the Period |
19% |
Total Net Advisory Fees Paid for the Period |
$1,472,959 | |
| Holdings [Text Block] |
Equity |
32.9% |
Exchange-Traded Funds |
30.8% |
Fixed Income |
30.4% |
Investment Companies |
1.7% |
Dynamic |
0.9% | |
| Material Fund Change [Text Block] |
This is a summary of certain changes to the Fund for the Period. For more complete information, you may review the Fund's next prospectus, which we expect to be available by April 30, 2026 at dfinview.com/GoldmanSachs or upon request at 1-800-621-2550. Effective February 13, 2026, the Fund changed its name from the Goldman Sachs Growth and Income Strategy Portfolio to the Goldman Sachs Moderate Allocation Fund. The Fund also changed its principal investment strategy reflecting that the Fund will operate as a fund-of-funds investing in underlying equity, fixed income, and alternative funds, with increased equity and fixed income allocations, along with the option to invest in alternative asset classes and monthly rebalancing. |
| Material Fund Change Name [Text Block] |
Effective February 13, 2026, the Fund changed its name from the Goldman Sachs Growth and Income Strategy Portfolio to the Goldman Sachs Moderate Allocation Fund.
|
| Material Fund Change Strategies [Text Block] |
The Fund also changed its principal investment strategy reflecting that the Fund will operate as a fund-of-funds investing in underlying equity, fixed income, and alternative funds, with increased equity and fixed income allocations, along with the option to invest in alternative asset classes and monthly rebalancing.
|
| Summary of Change Legend [Text Block] |
This is a summary of certain changes to the Fund for the Period. For more complete information, you may review the Fund's next prospectus, which we expect to be available by April 30, 2026 at dfinview.com/GoldmanSachs or upon request at 1-800-621-2550.
|
| Updated Prospectus Phone Number |
1-800-621-2550
|
| Updated Prospectus Web Address |
<span style="box-sizing: border-box; color: rgb(0, 0, 0); display: inline; flex-wrap: nowrap; font-size: 12px; font-weight: 400; grid-area: auto; line-height: 18px; margin: 0px; overflow: visible; text-align: left; text-align-last: auto; white-space-collapse: preserve-breaks;">dfinview.com/GoldmanSachs</span>
|
| C000025511 |
|
| Shareholder Report [Line Items] |
|
| Fund Name |
Goldman Sachs Moderate Allocation Fund
|
| Class Name |
Institutional Class
|
| Trading Symbol |
GOIIX
|
| Annual or Semi-Annual Statement [Text Block] |
This annual shareholder report contains important information about Goldman Sachs Moderate Allocation Fund (formerly, Goldman Sachs Growth & Income Strategy Portfolio) (the “Fund”) for the period of January 1, 2025 to December 31, 2025 (the “Period”).
|
| Additional Information [Text Block] |
You can find additional information about the Fund at am.gs.com or dfinview.com/GoldmanSachs. You can also request this information by contacting us at 1-800-621-2550.
|
| Material Fund Change Notice [Text Block] |
This report describes changes to the Fund that occurred during the Period.
|
| Additional Information Phone Number |
1-800-621-2550
|
| Additional Information Website |
<span style="box-sizing: border-box; color: rgb(0, 0, 0); display: inline; flex-wrap: nowrap; font-size: 12px; font-weight: 400; grid-area: auto; line-height: 18px; margin: 0px; overflow: visible; text-align: left; text-align-last: auto; white-space-collapse: preserve-breaks;">am.gs.com</span>
|
| Expenses [Text Block] |
What were the Fund costs for the Period?Based on a hypothetical $10,000 investment.
Class |
Costs of a $10,000 investment |
Costs paid as a percentage of a $10,000 investment |
Institutional |
$21 |
0.19% | |
| Expenses Paid, Amount |
$ 21
|
| Expense Ratio, Percent |
0.19%
|
| Factors Affecting Performance [Text Block] |
How did the Fund perform and what affected its performance?Easing trade tensions, robust corporate earnings results, better than consensus anticipated inflation data, resilient consumer spending, enthusiasm for technology/AI and central bank monetary policy influenced capital markets most. Both global equity and fixed income markets broadly generated positive returns. |
| Performance Past Does Not Indicate Future [Text] |
Performance data quoted above represents past performance. Past performance does not guarantee future results.
|
| Line Graph [Table Text Block] |
|
Institutional Shares |
Moderate Allocation Composite Index* |
Bloomberg Global Aggregate Bond Index (Gross, USD, Hedged) |
MSCI® ACWI Index (Net, USD, Unhedged) |
1/1/16 |
$1,000,000 |
$1,000,000 |
$1,000,000 |
$1,000,000 |
12/16 |
$1,061,700 |
$1,063,382 |
$1,039,485 |
$1,078,643 |
12/17 |
$1,237,942 |
$1,225,597 |
$1,071,042 |
$1,337,216 |
12/18 |
$1,131,108 |
$1,166,699 |
$1,089,922 |
$1,211,325 |
12/19 |
$1,347,941 |
$1,389,862 |
$1,179,472 |
$1,533,506 |
12/20 |
$1,519,399 |
$1,575,366 |
$1,245,293 |
$1,782,776 |
12/21 |
$1,711,451 |
$1,737,522 |
$1,227,966 |
$2,113,255 |
12/22 |
$1,451,482 |
$1,471,150 |
$1,090,199 |
$1,725,177 |
12/23 |
$1,671,236 |
$1,707,242 |
$1,168,110 |
$2,108,199 |
12/24 |
$1,864,431 |
$1,907,562 |
$1,207,774 |
$2,476,895 |
12/25 |
$2,162,740 |
$2,197,723 |
$1,266,518 |
$3,030,169 |
|
| Average Annual Return [Table Text Block] |
AATR |
1 Year |
5 Years |
10 Years |
Institutional Shares |
16.00% |
7.31% |
8.01% |
Moderate Allocation Composite Index* |
15.21% |
6.88% |
8.19% |
Bloomberg Global Aggregate Bond Index (Gross, USD, Hedged) |
4.86% |
0.34% |
2.39% |
MSCI® ACWI Index (Net, USD, Unhedged) |
22.34% |
11.19% |
11.71% | |
| AssetsNet |
$ 1,064,953,637
|
| Holdings Count | Holding |
27
|
| Advisory Fees Paid, Amount |
$ 1,472,959
|
| InvestmentCompanyPortfolioTurnover |
19.00%
|
| Additional Fund Statistics [Text Block] |
Total Net Assets as of Period End |
$1,064,953,637 |
# of Portfolio Holdings as of Period End |
27 |
Portfolio Turnover Rate for the Period |
19% |
Total Net Advisory Fees Paid for the Period |
$1,472,959 | |
| Holdings [Text Block] |
Equity |
32.9% |
Exchange-Traded Funds |
30.8% |
Fixed Income |
30.4% |
Investment Companies |
1.7% |
Dynamic |
0.9% | |
| Material Fund Change [Text Block] |
This is a summary of certain changes to the Fund for the Period. For more complete information, you may review the Fund's next prospectus, which we expect to be available by April 30, 2026 at dfinview.com/GoldmanSachs or upon request at 1-800-621-2550. Effective February 13, 2026, the Fund changed its name from the Goldman Sachs Growth and Income Strategy Portfolio to the Goldman Sachs Moderate Allocation Fund. The Fund also changed its principal investment strategy reflecting that the Fund will operate as a fund-of-funds investing in underlying equity, fixed income, and alternative funds, with increased equity and fixed income allocations, along with the option to invest in alternative asset classes and monthly rebalancing. |
| Material Fund Change Name [Text Block] |
Effective February 13, 2026, the Fund changed its name from the Goldman Sachs Growth and Income Strategy Portfolio to the Goldman Sachs Moderate Allocation Fund.
|
| Material Fund Change Strategies [Text Block] |
The Fund also changed its principal investment strategy reflecting that the Fund will operate as a fund-of-funds investing in underlying equity, fixed income, and alternative funds, with increased equity and fixed income allocations, along with the option to invest in alternative asset classes and monthly rebalancing.
|
| Summary of Change Legend [Text Block] |
This is a summary of certain changes to the Fund for the Period. For more complete information, you may review the Fund's next prospectus, which we expect to be available by April 30, 2026 at dfinview.com/GoldmanSachs or upon request at 1-800-621-2550.
|
| Updated Prospectus Phone Number |
1-800-621-2550
|
| Updated Prospectus Web Address |
<span style="box-sizing: border-box; color: rgb(0, 0, 0); display: inline; flex-wrap: nowrap; font-size: 12px; font-weight: 400; grid-area: auto; line-height: 18px; margin: 0px; overflow: visible; text-align: left; text-align-last: auto; white-space-collapse: preserve-breaks;">dfinview.com/GoldmanSachs</span>
|
| C000058962 |
|
| Shareholder Report [Line Items] |
|
| Fund Name |
Goldman Sachs Moderate Allocation Fund
|
| Class Name |
Investor Class
|
| Trading Symbol |
GPITX
|
| Annual or Semi-Annual Statement [Text Block] |
This annual shareholder report contains important information about Goldman Sachs Moderate Allocation Fund (formerly, Goldman Sachs Growth & Income Strategy Portfolio) (the “Fund”) for the period of January 1, 2025 to December 31, 2025 (the “Period”).
|
| Additional Information [Text Block] |
You can find additional information about the Fund at am.gs.com or dfinview.com/GoldmanSachs. You can also request this information by contacting us at 1-800-526-7384.
|
| Material Fund Change Notice [Text Block] |
This report describes changes to the Fund that occurred during the Period.
|
| Additional Information Phone Number |
1-800-526-7384
|
| Additional Information Website |
<span style="box-sizing: border-box; color: rgb(0, 0, 0); display: inline; flex-wrap: nowrap; font-size: 12px; font-weight: 400; grid-area: auto; line-height: 18px; margin: 0px; overflow: visible; text-align: left; text-align-last: auto; white-space-collapse: preserve-breaks;">am.gs.com</span>
|
| Expenses [Text Block] |
What were the Fund costs for the Period?Based on a hypothetical $10,000 investment.
Class |
Costs of a $10,000 investment |
Costs paid as a percentage of a $10,000 investment |
Investor |
$32 |
0.30% | |
| Expenses Paid, Amount |
$ 32
|
| Expense Ratio, Percent |
0.30%
|
| Factors Affecting Performance [Text Block] |
How did the Fund perform and what affected its performance?Easing trade tensions, robust corporate earnings results, better than consensus anticipated inflation data, resilient consumer spending, enthusiasm for technology/AI and central bank monetary policy influenced capital markets most. Both global equity and fixed income markets broadly generated positive returns. |
| Performance Past Does Not Indicate Future [Text] |
Performance data quoted above represents past performance. Past performance does not guarantee future results.
|
| Line Graph [Table Text Block] |
|
Investor Shares |
Bloomberg Global Aggregate Bond Index (Gross, USD, Hedged) |
Moderate Allocation Composite Index* |
MSCI® ACWI Index (Net, USD, Unhedged) |
1/1/16 |
$10,000 |
$10,000 |
$10,000 |
$10,000 |
12/16 |
$10,606 |
$10,395 |
$10,634 |
$10,786 |
12/17 |
$12,344 |
$10,710 |
$12,256 |
$13,372 |
12/18 |
$11,273 |
$10,899 |
$11,667 |
$12,113 |
12/19 |
$13,405 |
$11,795 |
$13,899 |
$15,335 |
12/20 |
$15,104 |
$12,453 |
$15,754 |
$17,828 |
12/21 |
$16,989 |
$12,280 |
$17,375 |
$21,133 |
12/22 |
$14,390 |
$10,902 |
$14,711 |
$17,252 |
12/23 |
$16,550 |
$11,681 |
$17,072 |
$21,082 |
12/24 |
$18,436 |
$12,078 |
$19,076 |
$24,769 |
12/25 |
$21,357 |
$12,665 |
$21,977 |
$30,302 |
|
| Average Annual Return [Table Text Block] |
AATR |
1 Year |
5 Years |
10 Years |
Investor Shares |
15.84% |
7.17% |
7.88% |
Moderate Allocation Composite Index* |
15.21% |
6.88% |
8.19% |
Bloomberg Global Aggregate Bond Index (Gross, USD, Hedged) |
4.86% |
0.34% |
2.39% |
MSCI® ACWI Index (Net, USD, Unhedged) |
22.34% |
11.19% |
11.71% | |
| AssetsNet |
$ 1,064,953,637
|
| Holdings Count | Holding |
27
|
| Advisory Fees Paid, Amount |
$ 1,472,959
|
| InvestmentCompanyPortfolioTurnover |
19.00%
|
| Additional Fund Statistics [Text Block] |
Total Net Assets as of Period End |
$1,064,953,637 |
# of Portfolio Holdings as of Period End |
27 |
Portfolio Turnover Rate for the Period |
19% |
Total Net Advisory Fees Paid for the Period |
$1,472,959 | |
| Holdings [Text Block] |
Equity |
32.9% |
Exchange-Traded Funds |
30.8% |
Fixed Income |
30.4% |
Investment Companies |
1.7% |
Dynamic |
0.9% | |
| Material Fund Change [Text Block] |
This is a summary of certain changes to the Fund for the Period. For more complete information, you may review the Fund's next prospectus, which we expect to be available by April 30, 2026 at dfinview.com/GoldmanSachs or upon request at 1-800-526-7384. Effective February 13, 2026, the Fund changed its name from the Goldman Sachs Growth and Income Strategy Portfolio to the Goldman Sachs Moderate Allocation Fund. The Fund also changed its principal investment strategy reflecting that the Fund will operate as a fund-of-funds investing in underlying equity, fixed income, and alternative funds, with increased equity and fixed income allocations, along with the option to invest in alternative asset classes and monthly rebalancing. |
| Material Fund Change Name [Text Block] |
Effective February 13, 2026, the Fund changed its name from the Goldman Sachs Growth and Income Strategy Portfolio to the Goldman Sachs Moderate Allocation Fund.
|
| Material Fund Change Strategies [Text Block] |
The Fund also changed its principal investment strategy reflecting that the Fund will operate as a fund-of-funds investing in underlying equity, fixed income, and alternative funds, with increased equity and fixed income allocations, along with the option to invest in alternative asset classes and monthly rebalancing.
|
| Summary of Change Legend [Text Block] |
This is a summary of certain changes to the Fund for the Period. For more complete information, you may review the Fund's next prospectus, which we expect to be available by April 30, 2026 at dfinview.com/GoldmanSachs or upon request at 1-800-526-7384.
|
| Updated Prospectus Phone Number |
1-800-526-7384
|
| Updated Prospectus Web Address |
<span style="box-sizing: border-box; color: rgb(0, 0, 0); display: inline; flex-wrap: nowrap; font-size: 12px; font-weight: 400; grid-area: auto; line-height: 18px; margin: 0px; overflow: visible; text-align: left; text-align-last: auto; white-space-collapse: preserve-breaks;">dfinview.com/GoldmanSachs</span>
|
| C000025512 |
|
| Shareholder Report [Line Items] |
|
| Fund Name |
Goldman Sachs Moderate Allocation Fund
|
| Class Name |
Service Class
|
| Trading Symbol |
GOISX
|
| Annual or Semi-Annual Statement [Text Block] |
This annual shareholder report contains important information about Goldman Sachs Moderate Allocation Fund (formerly, Goldman Sachs Growth & Income Strategy Portfolio) (the “Fund”) for the period of January 1, 2025 to December 31, 2025 (the “Period”).
|
| Additional Information [Text Block] |
You can find additional information about the Fund at am.gs.com or dfinview.com/GoldmanSachs. You can also request this information by contacting us at 1-800-621-2550.
|
| Material Fund Change Notice [Text Block] |
This report describes changes to the Fund that occurred during the Period.
|
| Additional Information Phone Number |
1-800-621-2550
|
| Additional Information Website |
<span style="box-sizing: border-box; color: rgb(0, 0, 0); display: inline; flex-wrap: nowrap; font-size: 12px; font-weight: 400; grid-area: auto; line-height: 18px; margin: 0px; overflow: visible; text-align: left; text-align-last: auto; white-space-collapse: preserve-breaks;">am.gs.com</span>
|
| Expenses [Text Block] |
What were the Fund costs for the Period?Based on a hypothetical $10,000 investment.
Class |
Costs of a $10,000 investment |
Costs paid as a percentage of a $10,000 investment |
Service |
$74 |
0.69% | |
| Expenses Paid, Amount |
$ 74
|
| Expense Ratio, Percent |
0.69%
|
| Factors Affecting Performance [Text Block] |
How did the Fund perform and what affected its performance?Easing trade tensions, robust corporate earnings results, better than consensus anticipated inflation data, resilient consumer spending, enthusiasm for technology/AI and central bank monetary policy influenced capital markets most. Both global equity and fixed income markets broadly generated positive returns. |
| Performance Past Does Not Indicate Future [Text] |
Performance data quoted above represents past performance. Past performance does not guarantee future results.
|
| Line Graph [Table Text Block] |
|
Service Shares |
Bloomberg Global Aggregate Bond Index (Gross, USD, Hedged) |
Moderate Allocation Composite Index* |
MSCI® ACWI Index (Net, USD, Unhedged) |
1/1/16 |
$10,000 |
$10,000 |
$10,000 |
$10,000 |
12/16 |
$10,560 |
$10,395 |
$10,634 |
$10,786 |
12/17 |
$12,253 |
$10,710 |
$12,256 |
$13,372 |
12/18 |
$11,150 |
$10,899 |
$11,667 |
$12,113 |
12/19 |
$13,214 |
$11,795 |
$13,899 |
$15,335 |
12/20 |
$14,827 |
$12,453 |
$15,754 |
$17,828 |
12/21 |
$16,611 |
$12,280 |
$17,375 |
$21,133 |
12/22 |
$14,020 |
$10,902 |
$14,711 |
$17,252 |
12/23 |
$16,064 |
$11,681 |
$17,072 |
$21,082 |
12/24 |
$17,834 |
$12,078 |
$19,076 |
$24,769 |
12/25 |
$20,580 |
$12,665 |
$21,977 |
$30,302 |
|
| Average Annual Return [Table Text Block] |
AATR |
1 Year |
5 Years |
10 Years |
Service Shares |
15.40% |
6.77% |
7.48% |
Moderate Allocation Composite Index* |
15.21% |
6.88% |
8.19% |
Bloomberg Global Aggregate Bond Index (Gross, USD, Hedged) |
4.86% |
0.34% |
2.39% |
MSCI® ACWI Index (Net, USD, Unhedged) |
22.34% |
11.19% |
11.71% | |
| AssetsNet |
$ 1,064,953,637
|
| Holdings Count | Holding |
27
|
| Advisory Fees Paid, Amount |
$ 1,472,959
|
| InvestmentCompanyPortfolioTurnover |
19.00%
|
| Additional Fund Statistics [Text Block] |
Total Net Assets as of Period End |
$1,064,953,637 |
# of Portfolio Holdings as of Period End |
27 |
Portfolio Turnover Rate for the Period |
19% |
Total Net Advisory Fees Paid for the Period |
$1,472,959 | |
| Holdings [Text Block] |
Equity |
32.9% |
Exchange-Traded Funds |
30.8% |
Fixed Income |
30.4% |
Investment Companies |
1.7% |
Dynamic |
0.9% | |
| Material Fund Change [Text Block] |
This is a summary of certain changes to the Fund for the Period. For more complete information, you may review the Fund's next prospectus, which we expect to be available by April 30, 2026 at dfinview.com/GoldmanSachs or upon request at 1-800-621-2550. Effective February 13, 2026, the Fund changed its name from the Goldman Sachs Growth and Income Strategy Portfolio to the Goldman Sachs Moderate Allocation Fund. The Fund also changed its principal investment strategy reflecting that the Fund will operate as a fund-of-funds investing in underlying equity, fixed income, and alternative funds, with increased equity and fixed income allocations, along with the option to invest in alternative asset classes and monthly rebalancing. |
| Material Fund Change Name [Text Block] |
Effective February 13, 2026, the Fund changed its name from the Goldman Sachs Growth and Income Strategy Portfolio to the Goldman Sachs Moderate Allocation Fund.
|
| Material Fund Change Strategies [Text Block] |
The Fund also changed its principal investment strategy reflecting that the Fund will operate as a fund-of-funds investing in underlying equity, fixed income, and alternative funds, with increased equity and fixed income allocations, along with the option to invest in alternative asset classes and monthly rebalancing.
|
| Summary of Change Legend [Text Block] |
This is a summary of certain changes to the Fund for the Period. For more complete information, you may review the Fund's next prospectus, which we expect to be available by April 30, 2026 at dfinview.com/GoldmanSachs or upon request at 1-800-621-2550.
|
| Updated Prospectus Phone Number |
1-800-621-2550
|
| Updated Prospectus Web Address |
<span style="box-sizing: border-box; color: rgb(0, 0, 0); display: inline; flex-wrap: nowrap; font-size: 12px; font-weight: 400; grid-area: auto; line-height: 18px; margin: 0px; overflow: visible; text-align: left; text-align-last: auto; white-space-collapse: preserve-breaks;">dfinview.com/GoldmanSachs</span>
|
| C000025579 |
|
| Shareholder Report [Line Items] |
|
| Fund Name |
Goldman Sachs Growth Allocation Fund
|
| Class Name |
Class A
|
| Trading Symbol |
GGSAX
|
| Annual or Semi-Annual Statement [Text Block] |
This annual shareholder report contains important information about Goldman Sachs Growth Allocation Fund (formerly, Goldman Sachs Growth Strategy Portfolio) (the “Fund”) for the period of January 1, 2025 to December 31, 2025 (the “Period”).
|
| Additional Information [Text Block] |
You can find additional information about the Fund at am.gs.com or dfinview.com/GoldmanSachs. You can also request this information by contacting us at 1-800-526-7384.
|
| Material Fund Change Notice [Text Block] |
This report describes changes to the Fund that occurred during the Period.
|
| Additional Information Phone Number |
1-800-526-7384
|
| Additional Information Website |
<span style="box-sizing: border-box; color: rgb(0, 0, 0); display: inline; flex-wrap: nowrap; font-size: 12px; font-weight: 400; grid-area: auto; line-height: 18px; margin: 0px; overflow: visible; text-align: left; text-align-last: auto; white-space-collapse: preserve-breaks;">am.gs.com</span>
|
| Expenses [Text Block] |
What were the Fund costs for the Period?Based on a hypothetical $10,000 investment.
Class |
Costs of a $10,000 investment |
Costs paid as a percentage of a $10,000 investment |
A |
$60 |
0.55% | |
| Expenses Paid, Amount |
$ 60
|
| Expense Ratio, Percent |
0.55%
|
| Factors Affecting Performance [Text Block] |
How did the Fund perform and what affected its performance?Easing trade tensions, robust corporate earnings results, better than consensus anticipated inflation data, resilient consumer spending, enthusiasm for technology/AI and central bank monetary policy influenced capital markets most. Both global equity and fixed income markets broadly generated positive returns. |
| Performance Past Does Not Indicate Future [Text] |
Performance data quoted above represents past performance. Past performance does not guarantee future results.
|
| Line Graph [Table Text Block] |
|
Class A (including sales charges) |
Class A (excluding sales charges) |
Bloomberg Global Aggregate Bond Index (Gross, USD, Hedged) |
Growth Allocation Composite Index* |
MSCI® ACWI Index (Net, USD, Unhedged) |
1/1/16 |
$9,450 |
$10,000 |
$10,000 |
$10,000 |
$10,000 |
12/16 |
$10,055 |
$10,640 |
$10,395 |
$10,711 |
$10,786 |
12/17 |
$12,168 |
$12,877 |
$10,710 |
$12,805 |
$13,372 |
12/18 |
$10,832 |
$11,463 |
$10,899 |
$11,898 |
$12,113 |
12/19 |
$13,241 |
$14,012 |
$11,795 |
$14,616 |
$15,335 |
12/20 |
$15,095 |
$15,974 |
$12,453 |
$16,817 |
$17,828 |
12/21 |
$17,592 |
$18,616 |
$12,280 |
$19,233 |
$21,133 |
12/22 |
$14,577 |
$15,425 |
$10,902 |
$15,998 |
$17,252 |
12/23 |
$17,103 |
$18,098 |
$11,681 |
$19,054 |
$21,082 |
12/24 |
$19,516 |
$20,652 |
$12,078 |
$21,835 |
$24,769 |
12/25 |
$23,191 |
$24,540 |
$12,665 |
$25,929 |
$30,302 |
|
| Average Annual Return [Table Text Block] |
AATR |
1 Year |
5 Years |
10 Years |
Class A |
18.83% |
8.96% |
9.39% |
Class A including sales charges |
12.26% |
7.74% |
8.77% |
Growth Allocation Composite Index* |
18.75% |
9.04% |
9.99% |
Bloomberg Global Aggregate Bond Index (Gross, USD, Hedged) |
4.86% |
0.34% |
2.39% |
MSCI® ACWI Index (Net, USD, Unhedged) |
22.34% |
11.19% |
11.71% | |
| AssetsNet |
$ 1,116,666,389
|
| Holdings Count | Holding |
26
|
| Advisory Fees Paid, Amount |
$ 1,522,121
|
| InvestmentCompanyPortfolioTurnover |
20.00%
|
| Additional Fund Statistics [Text Block] |
Total Net Assets as of Period End |
$1,116,666,389 |
# of Portfolio Holdings as of Period End |
26 |
Portfolio Turnover Rate for the Period |
20% |
Total Net Advisory Fees Paid for the Period |
$1,522,121 | |
| Holdings [Text Block] |
Exchange-Traded Funds |
45.0% |
Equity |
42.5% |
Fixed Income |
5.4% |
Investment Companies |
1.6% |
Dynamic |
0.9% | |
| Material Fund Change [Text Block] |
This is a summary of certain changes to the Fund for the Period. For more complete information, you may review the Fund's next prospectus, which we expect to be available by April 30, 2026 at dfinview.com/GoldmanSachs or upon request at 1-800-526-7384. Effective February 13, 2026, the Fund changed its name from the Goldman Sachs Growth Strategy Portfolio to the Goldman Sachs Growth Allocation Fund. The Fund also changed its principal investment strategy reflecting that the Fund will operate as a fund-of-funds investing in underlying equity, fixed income, and alternative funds, with increased equity and fixed income allocations, along with the option to invest in alternative asset classes and monthly rebalancing. |
| Material Fund Change Name [Text Block] |
Effective February 13, 2026, the Fund changed its name from the Goldman Sachs Growth Strategy Portfolio to the Goldman Sachs Growth Allocation Fund.
|
| Material Fund Change Strategies [Text Block] |
The Fund also changed its principal investment strategy reflecting that the Fund will operate as a fund-of-funds investing in underlying equity, fixed income, and alternative funds, with increased equity and fixed income allocations, along with the option to invest in alternative asset classes and monthly rebalancing.
|
| Summary of Change Legend [Text Block] |
This is a summary of certain changes to the Fund for the Period. For more complete information, you may review the Fund's next prospectus, which we expect to be available by April 30, 2026 at dfinview.com/GoldmanSachs or upon request at 1-800-526-7384.
|
| Updated Prospectus Phone Number |
1-800-526-7384
|
| Updated Prospectus Web Address |
<span style="box-sizing: border-box; color: rgb(0, 0, 0); display: inline; flex-wrap: nowrap; font-size: 12px; font-weight: 400; grid-area: auto; line-height: 18px; margin: 0px; overflow: visible; text-align: left; text-align-last: auto; white-space-collapse: preserve-breaks;">dfinview.com/GoldmanSachs</span>
|
| C000025581 |
|
| Shareholder Report [Line Items] |
|
| Fund Name |
Goldman Sachs Growth Allocation Fund
|
| Class Name |
Class C
|
| Trading Symbol |
GGSCX
|
| Annual or Semi-Annual Statement [Text Block] |
This annual shareholder report contains important information about Goldman Sachs Growth Allocation Fund (formerly, Goldman Sachs Growth Strategy Portfolio) (the “Fund”) for the period of January 1, 2025 to December 31, 2025 (the “Period”).
|
| Additional Information [Text Block] |
You can find additional information about the Fund at am.gs.com or dfinview.com/GoldmanSachs. You can also request this information by contacting us at 1-800-526-7384.
|
| Material Fund Change Notice [Text Block] |
This report describes changes to the Fund that occurred during the Period.
|
| Additional Information Phone Number |
1-800-526-7384
|
| Additional Information Website |
<span style="box-sizing: border-box; color: rgb(0, 0, 0); display: inline; flex-wrap: nowrap; font-size: 12px; font-weight: 400; grid-area: auto; line-height: 18px; margin: 0px; overflow: visible; text-align: left; text-align-last: auto; white-space-collapse: preserve-breaks;">am.gs.com</span>
|
| Expenses [Text Block] |
What were the Fund costs for the Period?Based on a hypothetical $10,000 investment.
Class |
Costs of a $10,000 investment |
Costs paid as a percentage of a $10,000 investment |
C |
$142 |
1.30% | |
| Expenses Paid, Amount |
$ 142
|
| Expense Ratio, Percent |
1.30%
|
| Factors Affecting Performance [Text Block] |
How did the Fund perform and what affected its performance?Easing trade tensions, robust corporate earnings results, better than consensus anticipated inflation data, resilient consumer spending, enthusiasm for technology/AI and central bank monetary policy influenced capital markets most. Both global equity and fixed income markets broadly generated positive returns. |
| Performance Past Does Not Indicate Future [Text] |
Performance data quoted above represents past performance. Past performance does not guarantee future results.
|
| Line Graph [Table Text Block] |
|
Class C (including sales charges) |
Class C (excluding sales charges) |
Bloomberg Global Aggregate Bond Index (Gross, USD, Hedged) |
Growth Allocation Composite Index* |
MSCI® ACWI Index (Net, USD, Unhedged) |
1/1/16 |
$9,900 |
$10,000 |
$10,000 |
$10,000 |
$10,000 |
12/16 |
$10,452 |
$10,558 |
$10,395 |
$10,711 |
$10,786 |
12/17 |
$12,551 |
$12,678 |
$10,710 |
$12,805 |
$13,372 |
12/18 |
$11,099 |
$11,211 |
$10,899 |
$11,898 |
$12,113 |
12/19 |
$13,464 |
$13,600 |
$11,795 |
$14,616 |
$15,335 |
12/20 |
$15,234 |
$15,387 |
$12,453 |
$16,817 |
$17,828 |
12/21 |
$17,621 |
$17,799 |
$12,280 |
$19,233 |
$21,133 |
12/22 |
$14,491 |
$14,638 |
$10,902 |
$15,998 |
$17,252 |
12/23 |
$16,878 |
$17,048 |
$11,681 |
$19,054 |
$21,082 |
12/24 |
$19,118 |
$19,311 |
$12,078 |
$21,835 |
$24,769 |
12/25 |
$22,553 |
$22,781 |
$12,665 |
$25,929 |
$30,302 |
|
| Average Annual Return [Table Text Block] |
AATR |
1 Year |
5 Years |
10 Years |
Class C |
17.97% |
8.16% |
8.57% |
Class C including sales charges |
16.77% |
8.16% |
8.57% |
Growth Allocation Composite Index* |
18.75% |
9.04% |
9.99% |
Bloomberg Global Aggregate Bond Index (Gross, USD, Hedged) |
4.86% |
0.34% |
2.39% |
MSCI® ACWI Index (Net, USD, Unhedged) |
22.34% |
11.19% |
11.71% | |
| AssetsNet |
$ 1,116,666,389
|
| Holdings Count | Holding |
26
|
| Advisory Fees Paid, Amount |
$ 1,522,121
|
| InvestmentCompanyPortfolioTurnover |
20.00%
|
| Additional Fund Statistics [Text Block] |
Total Net Assets as of Period End |
$1,116,666,389 |
# of Portfolio Holdings as of Period End |
26 |
Portfolio Turnover Rate for the Period |
20% |
Total Net Advisory Fees Paid for the Period |
$1,522,121 | |
| Holdings [Text Block] |
Exchange-Traded Funds |
45.0% |
Equity |
42.5% |
Fixed Income |
5.4% |
Investment Companies |
1.6% |
Dynamic |
0.9% | |
| Material Fund Change [Text Block] |
This is a summary of certain changes to the Fund for the Period. For more complete information, you may review the Fund's next prospectus, which we expect to be available by April 30, 2026 at dfinview.com/GoldmanSachs or upon request at 1-800-526-7384. Effective February 13, 2026, the Fund changed its name from the Goldman Sachs Growth Strategy Portfolio to the Goldman Sachs Growth Allocation Fund. The Fund also changed its principal investment strategy reflecting that the Fund will operate as a fund-of-funds investing in underlying equity, fixed income, and alternative funds, with increased equity and fixed income allocations, along with the option to invest in alternative asset classes and monthly rebalancing. |
| Material Fund Change Name [Text Block] |
Effective February 13, 2026, the Fund changed its name from the Goldman Sachs Growth Strategy Portfolio to the Goldman Sachs Growth Allocation Fund.
|
| Material Fund Change Strategies [Text Block] |
The Fund also changed its principal investment strategy reflecting that the Fund will operate as a fund-of-funds investing in underlying equity, fixed income, and alternative funds, with increased equity and fixed income allocations, along with the option to invest in alternative asset classes and monthly rebalancing.
|
| Summary of Change Legend [Text Block] |
This is a summary of certain changes to the Fund for the Period. For more complete information, you may review the Fund's next prospectus, which we expect to be available by April 30, 2026 at dfinview.com/GoldmanSachs or upon request at 1-800-526-7384.
|
| Updated Prospectus Phone Number |
1-800-526-7384
|
| Updated Prospectus Web Address |
<span style="box-sizing: border-box; color: rgb(0, 0, 0); display: inline; flex-wrap: nowrap; font-size: 12px; font-weight: 400; grid-area: auto; line-height: 18px; margin: 0px; overflow: visible; text-align: left; text-align-last: auto; white-space-collapse: preserve-breaks;">dfinview.com/GoldmanSachs</span>
|
| C000201785 |
|
| Shareholder Report [Line Items] |
|
| Fund Name |
Goldman Sachs Growth Allocation Fund
|
| Class Name |
Class P
|
| Trading Symbol |
GGPPX
|
| Annual or Semi-Annual Statement [Text Block] |
This annual shareholder report contains important information about Goldman Sachs Growth Allocation Fund (formerly, Goldman Sachs Growth Strategy Portfolio) (the “Fund”) for the period of January 1, 2025 to December 31, 2025 (the “Period”).
|
| Additional Information [Text Block] |
You can find additional information about the Fund at am.gs.com or dfinview.com/GoldmanSachs. You can also request this information by contacting us at 1-800-621-2550.
|
| Material Fund Change Notice [Text Block] |
This report describes changes to the Fund that occurred during the Period.
|
| Additional Information Phone Number |
1-800-621-2550
|
| Additional Information Website |
<span style="box-sizing: border-box; color: rgb(0, 0, 0); display: inline; flex-wrap: nowrap; font-size: 12px; font-weight: 400; grid-area: auto; line-height: 18px; margin: 0px; overflow: visible; text-align: left; text-align-last: auto; white-space-collapse: preserve-breaks;">am.gs.com</span>
|
| Expenses [Text Block] |
What were the Fund costs for the Period?Based on a hypothetical $10,000 investment.
Class |
Costs of a $10,000 investment |
Costs paid as a percentage of a $10,000 investment |
P |
$20 |
0.18% | |
| Expenses Paid, Amount |
$ 20
|
| Expense Ratio, Percent |
0.18%
|
| Factors Affecting Performance [Text Block] |
How did the Fund perform and what affected its performance?Easing trade tensions, robust corporate earnings results, better than consensus anticipated inflation data, resilient consumer spending, enthusiasm for technology/AI and central bank monetary policy influenced capital markets most. Both global equity and fixed income markets broadly generated positive returns. |
| Performance Past Does Not Indicate Future [Text] |
Performance data quoted above represents past performance. Past performance does not guarantee future results.
|
| Line Graph [Table Text Block] |
|
Class P |
Bloomberg Global Aggregate Bond Index (Gross, USD, Hedged) |
Growth Allocation Composite Index* |
MSCI® ACWI Index (Net, USD, Unhedged) |
4/13/18 |
$10,000 |
$10,000 |
$10,000 |
$10,000 |
12/18 |
$8,861 |
$10,193 |
$9,209 |
$8,955 |
12/19 |
$10,874 |
$11,030 |
$11,312 |
$11,337 |
12/20 |
$12,441 |
$11,646 |
$13,016 |
$13,179 |
12/21 |
$14,560 |
$11,484 |
$14,886 |
$15,622 |
12/22 |
$12,107 |
$10,196 |
$12,382 |
$12,753 |
12/23 |
$14,265 |
$10,924 |
$14,748 |
$15,585 |
12/24 |
$16,336 |
$11,295 |
$16,898 |
$18,311 |
12/25 |
$19,485 |
$11,844 |
$20,067 |
$22,401 |
|
| Average Annual Return [Table Text Block] |
AATR |
1 Year |
5 Years |
Since Inception |
Class P (Commenced April 17, 2018) |
19.27% |
9.38% |
9.03% |
Growth Allocation Composite Index* |
18.75% |
9.04% |
9.45% |
Bloomberg Global Aggregate Bond Index (Gross, USD, Hedged) |
4.86% |
0.34% |
2.22% |
MSCI® ACWI Index (Net, USD, Unhedged) |
22.34% |
11.19% |
11.02% | |
| Performance Inception Date |
Apr. 17, 2018
|
| AssetsNet |
$ 1,116,666,389
|
| Holdings Count | Holding |
26
|
| Advisory Fees Paid, Amount |
$ 1,522,121
|
| InvestmentCompanyPortfolioTurnover |
20.00%
|
| Additional Fund Statistics [Text Block] |
Total Net Assets as of Period End |
$1,116,666,389 |
# of Portfolio Holdings as of Period End |
26 |
Portfolio Turnover Rate for the Period |
20% |
Total Net Advisory Fees Paid for the Period |
$1,522,121 | |
| Holdings [Text Block] |
Exchange-Traded Funds |
45.0% |
Equity |
42.5% |
Fixed Income |
5.4% |
Investment Companies |
1.6% |
Dynamic |
0.9% | |
| Material Fund Change [Text Block] |
This is a summary of certain changes to the Fund for the Period. For more complete information, you may review the Fund's next prospectus, which we expect to be available by April 30, 2026 at dfinview.com/GoldmanSachs or upon request at 1-800-621-2550. Effective February 13, 2026, the Fund changed its name from the Goldman Sachs Growth Strategy Portfolio to the Goldman Sachs Growth Allocation Fund. The Fund also changed its principal investment strategy reflecting that the Fund will operate as a fund-of-funds investing in underlying equity, fixed income, and alternative funds, with increased equity and fixed income allocations, along with the option to invest in alternative asset classes and monthly rebalancing. |
| Material Fund Change Name [Text Block] |
Effective February 13, 2026, the Fund changed its name from the Goldman Sachs Growth Strategy Portfolio to the Goldman Sachs Growth Allocation Fund.
|
| Material Fund Change Strategies [Text Block] |
The Fund also changed its principal investment strategy reflecting that the Fund will operate as a fund-of-funds investing in underlying equity, fixed income, and alternative funds, with increased equity and fixed income allocations, along with the option to invest in alternative asset classes and monthly rebalancing.
|
| Summary of Change Legend [Text Block] |
This is a summary of certain changes to the Fund for the Period. For more complete information, you may review the Fund's next prospectus, which we expect to be available by April 30, 2026 at dfinview.com/GoldmanSachs or upon request at 1-800-621-2550.
|
| Updated Prospectus Phone Number |
1-800-621-2550
|
| Updated Prospectus Web Address |
<span style="box-sizing: border-box; color: rgb(0, 0, 0); display: inline; flex-wrap: nowrap; font-size: 12px; font-weight: 400; grid-area: auto; line-height: 18px; margin: 0px; overflow: visible; text-align: left; text-align-last: auto; white-space-collapse: preserve-breaks;">dfinview.com/GoldmanSachs</span>
|
| C000058973 |
|
| Shareholder Report [Line Items] |
|
| Fund Name |
Goldman Sachs Growth Allocation Fund
|
| Class Name |
Class R
|
| Trading Symbol |
GGSRX
|
| Annual or Semi-Annual Statement [Text Block] |
This annual shareholder report contains important information about Goldman Sachs Growth Allocation Fund (formerly, Goldman Sachs Growth Strategy Portfolio) (the “Fund”) for the period of January 1, 2025 to December 31, 2025 (the “Period”).
|
| Additional Information [Text Block] |
You can find additional information about the Fund at am.gs.com or dfinview.com/GoldmanSachs. You can also request this information by contacting us at 1-800-526-7384.
|
| Material Fund Change Notice [Text Block] |
This report describes changes to the Fund that occurred during the Period.
|
| Additional Information Phone Number |
1-800-526-7384
|
| Additional Information Website |
<span style="box-sizing: border-box; color: rgb(0, 0, 0); display: inline; flex-wrap: nowrap; font-size: 12px; font-weight: 400; grid-area: auto; line-height: 18px; margin: 0px; overflow: visible; text-align: left; text-align-last: auto; white-space-collapse: preserve-breaks;">am.gs.com</span>
|
| Expenses [Text Block] |
What were the Fund costs for the Period?Based on a hypothetical $10,000 investment.
Class |
Costs of a $10,000 investment |
Costs paid as a percentage of a $10,000 investment |
R |
$87 |
0.80% | |
| Expenses Paid, Amount |
$ 87
|
| Expense Ratio, Percent |
0.80%
|
| Factors Affecting Performance [Text Block] |
How did the Fund perform and what affected its performance?Easing trade tensions, robust corporate earnings results, better than consensus anticipated inflation data, resilient consumer spending, enthusiasm for technology/AI and central bank monetary policy influenced capital markets most. Both global equity and fixed income markets broadly generated positive returns. |
| Performance Past Does Not Indicate Future [Text] |
Performance data quoted above represents past performance. Past performance does not guarantee future results.
|
| Line Graph [Table Text Block] |
|
Class R |
Bloomberg Global Aggregate Bond Index (Gross, USD, Hedged) |
Growth Allocation Composite Index* |
MSCI® ACWI Index (Net, USD, Unhedged) |
1/1/16 |
$10,000 |
$10,000 |
$10,000 |
$10,000 |
12/16 |
$10,618 |
$10,395 |
$10,711 |
$10,786 |
12/17 |
$12,813 |
$10,710 |
$12,805 |
$13,372 |
12/18 |
$11,380 |
$10,899 |
$11,898 |
$12,113 |
12/19 |
$13,882 |
$11,795 |
$14,616 |
$15,335 |
12/20 |
$15,777 |
$12,453 |
$16,817 |
$17,828 |
12/21 |
$18,350 |
$12,280 |
$19,233 |
$21,133 |
12/22 |
$15,160 |
$10,902 |
$15,998 |
$17,252 |
12/23 |
$17,748 |
$11,681 |
$19,054 |
$21,082 |
12/24 |
$20,207 |
$12,078 |
$21,835 |
$24,769 |
12/25 |
$23,947 |
$12,665 |
$25,929 |
$30,302 |
|
| Average Annual Return [Table Text Block] |
AATR |
1 Year |
5 Years |
10 Years |
Class R |
18.51% |
8.70% |
9.12% |
Growth Allocation Composite Index* |
18.75% |
9.04% |
9.99% |
Bloomberg Global Aggregate Bond Index (Gross, USD, Hedged) |
4.86% |
0.34% |
2.39% |
MSCI® ACWI Index (Net, USD, Unhedged) |
22.34% |
11.19% |
11.71% | |
| AssetsNet |
$ 1,116,666,389
|
| Holdings Count | Holding |
26
|
| Advisory Fees Paid, Amount |
$ 1,522,121
|
| InvestmentCompanyPortfolioTurnover |
20.00%
|
| Additional Fund Statistics [Text Block] |
Total Net Assets as of Period End |
$1,116,666,389 |
# of Portfolio Holdings as of Period End |
26 |
Portfolio Turnover Rate for the Period |
20% |
Total Net Advisory Fees Paid for the Period |
$1,522,121 | |
| Holdings [Text Block] |
Exchange-Traded Funds |
45.0% |
Equity |
42.5% |
Fixed Income |
5.4% |
Investment Companies |
1.6% |
Dynamic |
0.9% | |
| Material Fund Change [Text Block] |
This is a summary of certain changes to the Fund for the Period. For more complete information, you may review the Fund's next prospectus, which we expect to be available by April 30, 2026 at dfinview.com/GoldmanSachs or upon request at 1-800-526-7384. Effective February 13, 2026, the Fund changed its name from the Goldman Sachs Growth Strategy Portfolio to the Goldman Sachs Growth Allocation Fund. The Fund also changed its principal investment strategy reflecting that the Fund will operate as a fund-of-funds investing in underlying equity, fixed income, and alternative funds, with increased equity and fixed income allocations, along with the option to invest in alternative asset classes and monthly rebalancing. |
| Material Fund Change Name [Text Block] |
Effective February 13, 2026, the Fund changed its name from the Goldman Sachs Growth Strategy Portfolio to the Goldman Sachs Growth Allocation Fund.
|
| Material Fund Change Strategies [Text Block] |
The Fund also changed its principal investment strategy reflecting that the Fund will operate as a fund-of-funds investing in underlying equity, fixed income, and alternative funds, with increased equity and fixed income allocations, along with the option to invest in alternative asset classes and monthly rebalancing.
|
| Summary of Change Legend [Text Block] |
This is a summary of certain changes to the Fund for the Period. For more complete information, you may review the Fund's next prospectus, which we expect to be available by April 30, 2026 at dfinview.com/GoldmanSachs or upon request at 1-800-526-7384.
|
| Updated Prospectus Phone Number |
1-800-526-7384
|
| Updated Prospectus Web Address |
<span style="box-sizing: border-box; color: rgb(0, 0, 0); display: inline; flex-wrap: nowrap; font-size: 12px; font-weight: 400; grid-area: auto; line-height: 18px; margin: 0px; overflow: visible; text-align: left; text-align-last: auto; white-space-collapse: preserve-breaks;">dfinview.com/GoldmanSachs</span>
|
| C000161533 |
|
| Shareholder Report [Line Items] |
|
| Fund Name |
Goldman Sachs Growth Allocation Fund
|
| Class Name |
Class R6
|
| Trading Symbol |
GGSUX
|
| Annual or Semi-Annual Statement [Text Block] |
This annual shareholder report contains important information about Goldman Sachs Growth Allocation Fund (formerly, Goldman Sachs Growth Strategy Portfolio) (the “Fund”) for the period of January 1, 2025 to December 31, 2025 (the “Period”).
|
| Additional Information [Text Block] |
You can find additional information about the Fund at am.gs.com or dfinview.com/GoldmanSachs. You can also request this information by contacting us at 1-800-621-2550.
|
| Material Fund Change Notice [Text Block] |
This report describes changes to the Fund that occurred during the Period.
|
| Additional Information Phone Number |
1-800-621-2550
|
| Additional Information Website |
<span style="box-sizing: border-box; color: rgb(0, 0, 0); display: inline; flex-wrap: nowrap; font-size: 12px; font-weight: 400; grid-area: auto; line-height: 18px; margin: 0px; overflow: visible; text-align: left; text-align-last: auto; white-space-collapse: preserve-breaks;">am.gs.com</span>
|
| Expenses [Text Block] |
What were the Fund costs for the Period?Based on a hypothetical $10,000 investment.
Class |
Costs of a $10,000 investment |
Costs paid as a percentage of a $10,000 investment |
R6 |
$20 |
0.18% | |
| Expenses Paid, Amount |
$ 20
|
| Expense Ratio, Percent |
0.18%
|
| Factors Affecting Performance [Text Block] |
How did the Fund perform and what affected its performance?Easing trade tensions, robust corporate earnings results, better than consensus anticipated inflation data, resilient consumer spending, enthusiasm for technology/AI and central bank monetary policy influenced capital markets most. Both global equity and fixed income markets broadly generated positive returns. |
| Performance Past Does Not Indicate Future [Text] |
Performance data quoted above represents past performance. Past performance does not guarantee future results.
|
| Line Graph [Table Text Block] |
|
Class R6 |
Bloomberg Global Aggregate Bond Index (Gross, USD, Hedged) |
Growth Allocation Composite Index* |
MSCI® ACWI Index (Net, USD, Unhedged) |
1/1/16 |
$10,000 |
$10,000 |
$10,000 |
$10,000 |
12/16 |
$10,678 |
$10,395 |
$10,711 |
$10,786 |
12/17 |
$12,975 |
$10,710 |
$12,805 |
$13,372 |
12/18 |
$11,606 |
$10,899 |
$11,898 |
$12,113 |
12/19 |
$14,243 |
$11,795 |
$14,616 |
$15,335 |
12/20 |
$16,292 |
$12,453 |
$16,817 |
$17,828 |
12/21 |
$19,065 |
$12,280 |
$19,233 |
$21,133 |
12/22 |
$15,853 |
$10,902 |
$15,998 |
$17,252 |
12/23 |
$18,668 |
$11,681 |
$19,054 |
$21,082 |
12/24 |
$21,392 |
$12,078 |
$21,835 |
$24,769 |
12/25 |
$25,514 |
$12,665 |
$25,929 |
$30,302 |
|
| Average Annual Return [Table Text Block] |
AATR |
1 Year |
5 Years |
10 Years |
Class R6 |
19.27% |
9.38% |
9.81% |
Growth Allocation Composite Index* |
18.75% |
9.04% |
9.99% |
Bloomberg Global Aggregate Bond Index (Gross, USD, Hedged) |
4.86% |
0.34% |
2.39% |
MSCI® ACWI Index (Net, USD, Unhedged) |
22.34% |
11.19% |
11.71% | |
| AssetsNet |
$ 1,116,666,389
|
| Holdings Count | Holding |
26
|
| Advisory Fees Paid, Amount |
$ 1,522,121
|
| InvestmentCompanyPortfolioTurnover |
20.00%
|
| Additional Fund Statistics [Text Block] |
Total Net Assets as of Period End |
$1,116,666,389 |
# of Portfolio Holdings as of Period End |
26 |
Portfolio Turnover Rate for the Period |
20% |
Total Net Advisory Fees Paid for the Period |
$1,522,121 | |
| Holdings [Text Block] |
Exchange-Traded Funds |
45.0% |
Equity |
42.5% |
Fixed Income |
5.4% |
Investment Companies |
1.6% |
Dynamic |
0.9% | |
| Material Fund Change [Text Block] |
This is a summary of certain changes to the Fund for the Period. For more complete information, you may review the Fund's next prospectus, which we expect to be available by April 30, 2026 at dfinview.com/GoldmanSachs or upon request at 1-800-621-2550. Effective February 13, 2026, the Fund changed its name from the Goldman Sachs Growth Strategy Portfolio to the Goldman Sachs Growth Allocation Fund. The Fund also changed its principal investment strategy reflecting that the Fund will operate as a fund-of-funds investing in underlying equity, fixed income, and alternative funds, with increased equity and fixed income allocations, along with the option to invest in alternative asset classes and monthly rebalancing. |
| Material Fund Change Name [Text Block] |
Effective February 13, 2026, the Fund changed its name from the Goldman Sachs Growth Strategy Portfolio to the Goldman Sachs Growth Allocation Fund.
|
| Material Fund Change Strategies [Text Block] |
The Fund also changed its principal investment strategy reflecting that the Fund will operate as a fund-of-funds investing in underlying equity, fixed income, and alternative funds, with increased equity and fixed income allocations, along with the option to invest in alternative asset classes and monthly rebalancing.
|
| Summary of Change Legend [Text Block] |
This is a summary of certain changes to the Fund for the Period. For more complete information, you may review the Fund's next prospectus, which we expect to be available by April 30, 2026 at dfinview.com/GoldmanSachs or upon request at 1-800-621-2550.
|
| Updated Prospectus Phone Number |
1-800-621-2550
|
| Updated Prospectus Web Address |
<span style="box-sizing: border-box; color: rgb(0, 0, 0); display: inline; flex-wrap: nowrap; font-size: 12px; font-weight: 400; grid-area: auto; line-height: 18px; margin: 0px; overflow: visible; text-align: left; text-align-last: auto; white-space-collapse: preserve-breaks;">dfinview.com/GoldmanSachs</span>
|
| C000025577 |
|
| Shareholder Report [Line Items] |
|
| Fund Name |
Goldman Sachs Growth Allocation Fund
|
| Class Name |
Institutional Class
|
| Trading Symbol |
GGSIX
|
| Annual or Semi-Annual Statement [Text Block] |
This annual shareholder report contains important information about Goldman Sachs Growth Allocation Fund (formerly, Goldman Sachs Growth Strategy Portfolio) (the “Fund”) for the period of January 1, 2025 to December 31, 2025 (the “Period”).
|
| Additional Information [Text Block] |
You can find additional information about the Fund at am.gs.com or dfinview.com/GoldmanSachs. You can also request this information by contacting us at 1-800-621-2550.
|
| Material Fund Change Notice [Text Block] |
This report describes changes to the Fund that occurred during the Period.
|
| Additional Information Phone Number |
1-800-621-2550
|
| Additional Information Website |
<span style="box-sizing: border-box; color: rgb(0, 0, 0); display: inline; flex-wrap: nowrap; font-size: 12px; font-weight: 400; grid-area: auto; line-height: 18px; margin: 0px; overflow: visible; text-align: left; text-align-last: auto; white-space-collapse: preserve-breaks;">am.gs.com</span>
|
| Expenses [Text Block] |
What were the Fund costs for the Period?Based on a hypothetical $10,000 investment.
Class |
Costs of a $10,000 investment |
Costs paid as a percentage of a $10,000 investment |
Institutional |
$21 |
0.19% | |
| Expenses Paid, Amount |
$ 21
|
| Expense Ratio, Percent |
0.19%
|
| Factors Affecting Performance [Text Block] |
How did the Fund perform and what affected its performance?Easing trade tensions, robust corporate earnings results, better than consensus anticipated inflation data, resilient consumer spending, enthusiasm for technology/AI and central bank monetary policy influenced capital markets most. Both global equity and fixed income markets broadly generated positive returns. |
| Performance Past Does Not Indicate Future [Text] |
Performance data quoted above represents past performance. Past performance does not guarantee future results.
|
| Line Graph [Table Text Block] |
|
Institutional Shares |
Growth Allocation Composite Index* |
Bloomberg Global Aggregate Bond Index (Gross, USD, Hedged) |
MSCI® ACWI Index (Net, USD, Unhedged) |
1/1/16 |
$1,000,000 |
$1,000,000 |
$1,000,000 |
$1,000,000 |
12/16 |
$1,067,800 |
$1,071,081 |
$1,039,485 |
$1,078,643 |
12/17 |
$1,297,697 |
$1,280,529 |
$1,071,042 |
$1,337,216 |
12/18 |
$1,159,493 |
$1,189,776 |
$1,089,922 |
$1,211,325 |
12/19 |
$1,423,509 |
$1,461,565 |
$1,179,472 |
$1,533,506 |
12/20 |
$1,627,498 |
$1,681,664 |
$1,245,293 |
$1,782,776 |
12/21 |
$1,904,661 |
$1,923,309 |
$1,227,966 |
$2,113,255 |
12/22 |
$1,583,344 |
$1,599,824 |
$1,090,199 |
$1,725,177 |
12/23 |
$1,865,655 |
$1,905,440 |
$1,168,110 |
$2,108,199 |
12/24 |
$2,136,548 |
$2,183,468 |
$1,207,774 |
$2,476,895 |
12/25 |
$2,548,261 |
$2,592,907 |
$1,266,518 |
$3,030,169 |
|
| Average Annual Return [Table Text Block] |
AATR |
1 Year |
5 Years |
10 Years |
Institutional Shares |
19.27% |
9.38% |
9.80% |
Growth Allocation Composite Index* |
18.75% |
9.04% |
9.99% |
Bloomberg Global Aggregate Bond Index (Gross, USD, Hedged) |
4.86% |
0.34% |
2.39% |
MSCI® ACWI Index (Net, USD, Unhedged) |
22.34% |
11.19% |
11.71% | |
| AssetsNet |
$ 1,116,666,389
|
| Holdings Count | Holding |
26
|
| Advisory Fees Paid, Amount |
$ 1,522,121
|
| InvestmentCompanyPortfolioTurnover |
20.00%
|
| Additional Fund Statistics [Text Block] |
Total Net Assets as of Period End |
$1,116,666,389 |
# of Portfolio Holdings as of Period End |
26 |
Portfolio Turnover Rate for the Period |
20% |
Total Net Advisory Fees Paid for the Period |
$1,522,121 | |
| Holdings [Text Block] |
Exchange-Traded Funds |
45.0% |
Equity |
42.5% |
Fixed Income |
5.4% |
Investment Companies |
1.6% |
Dynamic |
0.9% | |
| Material Fund Change [Text Block] |
This is a summary of certain changes to the Fund for the Period. For more complete information, you may review the Fund's next prospectus, which we expect to be available by April 30, 2026 at dfinview.com/GoldmanSachs or upon request at 1-800-621-2550. Effective February 13, 2026, the Fund changed its name from the Goldman Sachs Growth Strategy Portfolio to the Goldman Sachs Growth Allocation Fund. The Fund also changed its principal investment strategy reflecting that the Fund will operate as a fund-of-funds investing in underlying equity, fixed income, and alternative funds, with increased equity and fixed income allocations, along with the option to invest in alternative asset classes and monthly rebalancing. |
| Material Fund Change Name [Text Block] |
Effective February 13, 2026, the Fund changed its name from the Goldman Sachs Growth Strategy Portfolio to the Goldman Sachs Growth Allocation Fund.
|
| Material Fund Change Strategies [Text Block] |
The Fund also changed its principal investment strategy reflecting that the Fund will operate as a fund-of-funds investing in underlying equity, fixed income, and alternative funds, with increased equity and fixed income allocations, along with the option to invest in alternative asset classes and monthly rebalancing.
|
| Summary of Change Legend [Text Block] |
This is a summary of certain changes to the Fund for the Period. For more complete information, you may review the Fund's next prospectus, which we expect to be available by April 30, 2026 at dfinview.com/GoldmanSachs or upon request at 1-800-621-2550.
|
| Updated Prospectus Phone Number |
1-800-621-2550
|
| Updated Prospectus Web Address |
<span style="box-sizing: border-box; color: rgb(0, 0, 0); display: inline; flex-wrap: nowrap; font-size: 12px; font-weight: 400; grid-area: auto; line-height: 18px; margin: 0px; overflow: visible; text-align: left; text-align-last: auto; white-space-collapse: preserve-breaks;">dfinview.com/GoldmanSachs</span>
|
| C000058974 |
|
| Shareholder Report [Line Items] |
|
| Fund Name |
Goldman Sachs Growth Allocation Fund
|
| Class Name |
Investor Class
|
| Trading Symbol |
GGSTX
|
| Annual or Semi-Annual Statement [Text Block] |
This annual shareholder report contains important information about Goldman Sachs Growth Allocation Fund (formerly, Goldman Sachs Growth Strategy Portfolio) (the “Fund”) for the period of January 1, 2025 to December 31, 2025 (the “Period”).
|
| Additional Information [Text Block] |
You can find additional information about the Fund at am.gs.com or dfinview.com/GoldmanSachs. You can also request this information by contacting us at 1-800-526-7384.
|
| Material Fund Change Notice [Text Block] |
This report describes changes to the Fund that occurred during the Period.
|
| Additional Information Phone Number |
1-800-526-7384
|
| Additional Information Website |
<span style="box-sizing: border-box; color: rgb(0, 0, 0); display: inline; flex-wrap: nowrap; font-size: 12px; font-weight: 400; grid-area: auto; line-height: 18px; margin: 0px; overflow: visible; text-align: left; text-align-last: auto; white-space-collapse: preserve-breaks;">am.gs.com</span>
|
| Expenses [Text Block] |
What were the Fund costs for the Period?Based on a hypothetical $10,000 investment.
Class |
Costs of a $10,000 investment |
Costs paid as a percentage of a $10,000 investment |
Investor |
$33 |
0.30% | |
| Expenses Paid, Amount |
$ 33
|
| Expense Ratio, Percent |
0.30%
|
| Factors Affecting Performance [Text Block] |
How did the Fund perform and what affected its performance?Easing trade tensions, robust corporate earnings results, better than consensus anticipated inflation data, resilient consumer spending, enthusiasm for technology/AI and central bank monetary policy influenced capital markets most. Both global equity and fixed income markets broadly generated positive returns. |
| Performance Past Does Not Indicate Future [Text] |
Performance data quoted above represents past performance. Past performance does not guarantee future results.
|
| Line Graph [Table Text Block] |
|
Investor Shares |
Bloomberg Global Aggregate Bond Index (Gross, USD, Hedged) |
Growth Allocation Composite Index* |
MSCI® ACWI Index (Net, USD, Unhedged) |
1/1/16 |
$10,000 |
$10,000 |
$10,000 |
$10,000 |
12/16 |
$10,672 |
$10,395 |
$10,711 |
$10,786 |
12/17 |
$12,945 |
$10,710 |
$12,805 |
$13,372 |
12/18 |
$11,555 |
$10,899 |
$11,898 |
$12,113 |
12/19 |
$14,155 |
$11,795 |
$14,616 |
$15,335 |
12/20 |
$16,176 |
$12,453 |
$16,817 |
$17,828 |
12/21 |
$18,903 |
$12,280 |
$19,233 |
$21,133 |
12/22 |
$15,705 |
$10,902 |
$15,998 |
$17,252 |
12/23 |
$18,480 |
$11,681 |
$19,054 |
$21,082 |
12/24 |
$21,141 |
$12,078 |
$21,835 |
$24,769 |
12/25 |
$25,179 |
$12,665 |
$25,929 |
$30,302 |
|
| Average Annual Return [Table Text Block] |
AATR |
1 Year |
5 Years |
10 Years |
Investor Shares |
19.10% |
9.25% |
9.67% |
Growth Allocation Composite Index* |
18.75% |
9.04% |
9.99% |
Bloomberg Global Aggregate Bond Index (Gross, USD, Hedged) |
4.86% |
0.34% |
2.39% |
MSCI® ACWI Index (Net, USD, Unhedged) |
22.34% |
11.19% |
11.71% | |
| AssetsNet |
$ 1,116,666,389
|
| Holdings Count | Holding |
26
|
| Advisory Fees Paid, Amount |
$ 1,522,121
|
| InvestmentCompanyPortfolioTurnover |
20.00%
|
| Additional Fund Statistics [Text Block] |
Total Net Assets as of Period End |
$1,116,666,389 |
# of Portfolio Holdings as of Period End |
26 |
Portfolio Turnover Rate for the Period |
20% |
Total Net Advisory Fees Paid for the Period |
$1,522,121 | |
| Holdings [Text Block] |
Exchange-Traded Funds |
45.0% |
Equity |
42.5% |
Fixed Income |
5.4% |
Investment Companies |
1.6% |
Dynamic |
0.9% | |
| Material Fund Change [Text Block] |
This is a summary of certain changes to the Fund for the Period. For more complete information, you may review the Fund's next prospectus, which we expect to be available by April 30, 2026 at dfinview.com/GoldmanSachs or upon request at 1-800-526-7384. Effective February 13, 2026, the Fund changed its name from the Goldman Sachs Growth Strategy Portfolio to the Goldman Sachs Growth Allocation Fund. The Fund also changed its principal investment strategy reflecting that the Fund will operate as a fund-of-funds investing in underlying equity, fixed income, and alternative funds, with increased equity and fixed income allocations, along with the option to invest in alternative asset classes and monthly rebalancing. |
| Material Fund Change Name [Text Block] |
Effective February 13, 2026, the Fund changed its name from the Goldman Sachs Growth Strategy Portfolio to the Goldman Sachs Growth Allocation Fund.
|
| Material Fund Change Strategies [Text Block] |
The Fund also changed its principal investment strategy reflecting that the Fund will operate as a fund-of-funds investing in underlying equity, fixed income, and alternative funds, with increased equity and fixed income allocations, along with the option to invest in alternative asset classes and monthly rebalancing.
|
| Summary of Change Legend [Text Block] |
This is a summary of certain changes to the Fund for the Period. For more complete information, you may review the Fund's next prospectus, which we expect to be available by April 30, 2026 at dfinview.com/GoldmanSachs or upon request at 1-800-526-7384.
|
| Updated Prospectus Phone Number |
1-800-526-7384
|
| Updated Prospectus Web Address |
<span style="box-sizing: border-box; color: rgb(0, 0, 0); display: inline; flex-wrap: nowrap; font-size: 12px; font-weight: 400; grid-area: auto; line-height: 18px; margin: 0px; overflow: visible; text-align: left; text-align-last: auto; white-space-collapse: preserve-breaks;">dfinview.com/GoldmanSachs</span>
|
| C000025578 |
|
| Shareholder Report [Line Items] |
|
| Fund Name |
Goldman Sachs Growth Allocation Fund
|
| Class Name |
Service Class
|
| Trading Symbol |
GGSSX
|
| Annual or Semi-Annual Statement [Text Block] |
This annual shareholder report contains important information about Goldman Sachs Growth Allocation Fund (formerly, Goldman Sachs Growth Strategy Portfolio) (the “Fund”) for the period of January 1, 2025 to December 31, 2025 (the “Period”).
|
| Additional Information [Text Block] |
You can find additional information about the Fund at am.gs.com or dfinview.com/GoldmanSachs. You can also request this information by contacting us at 1-800-621-2550.
|
| Material Fund Change Notice [Text Block] |
This report describes changes to the Fund that occurred during the Period.
|
| Additional Information Phone Number |
1-800-621-2550
|
| Additional Information Website |
<span style="box-sizing: border-box; color: rgb(0, 0, 0); display: inline; flex-wrap: nowrap; font-size: 12px; font-weight: 400; grid-area: auto; line-height: 18px; margin: 0px; overflow: visible; text-align: left; text-align-last: auto; white-space-collapse: preserve-breaks;">am.gs.com</span>
|
| Expenses [Text Block] |
What were the Fund costs for the Period?Based on a hypothetical $10,000 investment.
Class |
Costs of a $10,000 investment |
Costs paid as a percentage of a $10,000 investment |
Service |
$75 |
0.69% | |
| Expenses Paid, Amount |
$ 75
|
| Expense Ratio, Percent |
0.69%
|
| Factors Affecting Performance [Text Block] |
How did the Fund perform and what affected its performance?Easing trade tensions, robust corporate earnings results, better than consensus anticipated inflation data, resilient consumer spending, enthusiasm for technology/AI and central bank monetary policy influenced capital markets most. Both global equity and fixed income markets broadly generated positive returns. |
| Performance Past Does Not Indicate Future [Text] |
Performance data quoted above represents past performance. Past performance does not guarantee future results.
|
| Line Graph [Table Text Block] |
|
Service Shares |
Bloomberg Global Aggregate Bond Index (Gross, USD, Hedged) |
Growth Allocation Composite Index* |
MSCI® ACWI Index (Net, USD, Unhedged) |
1/1/16 |
$10,000 |
$10,000 |
$10,000 |
$10,000 |
12/16 |
$10,627 |
$10,395 |
$10,711 |
$10,786 |
12/17 |
$12,846 |
$10,710 |
$12,805 |
$13,372 |
12/18 |
$11,425 |
$10,899 |
$11,898 |
$12,113 |
12/19 |
$13,950 |
$11,795 |
$14,616 |
$15,335 |
12/20 |
$15,882 |
$12,453 |
$16,817 |
$17,828 |
12/21 |
$18,488 |
$12,280 |
$19,233 |
$21,133 |
12/22 |
$15,296 |
$10,902 |
$15,998 |
$17,252 |
12/23 |
$17,931 |
$11,681 |
$19,054 |
$21,082 |
12/24 |
$20,427 |
$12,078 |
$21,835 |
$24,769 |
12/25 |
$24,239 |
$12,665 |
$25,929 |
$30,302 |
|
| Average Annual Return [Table Text Block] |
AATR |
1 Year |
5 Years |
10 Years |
Service Shares |
18.66% |
8.82% |
9.25% |
Growth Allocation Composite Index* |
18.75% |
9.04% |
9.99% |
Bloomberg Global Aggregate Bond Index (Gross, USD, Hedged) |
4.86% |
0.34% |
2.39% |
MSCI® ACWI Index (Net, USD, Unhedged) |
22.34% |
11.19% |
11.71% | |
| AssetsNet |
$ 1,116,666,389
|
| Holdings Count | Holding |
26
|
| Advisory Fees Paid, Amount |
$ 1,522,121
|
| InvestmentCompanyPortfolioTurnover |
20.00%
|
| Additional Fund Statistics [Text Block] |
Total Net Assets as of Period End |
$1,116,666,389 |
# of Portfolio Holdings as of Period End |
26 |
Portfolio Turnover Rate for the Period |
20% |
Total Net Advisory Fees Paid for the Period |
$1,522,121 | |
| Holdings [Text Block] |
Exchange-Traded Funds |
45.0% |
Equity |
42.5% |
Fixed Income |
5.4% |
Investment Companies |
1.6% |
Dynamic |
0.9% | |
| Material Fund Change [Text Block] |
This is a summary of certain changes to the Fund for the Period. For more complete information, you may review the Fund's next prospectus, which we expect to be available by April 30, 2026 at dfinview.com/GoldmanSachs or upon request at 1-800-621-2550. Effective February 13, 2026, the Fund changed its name from the Goldman Sachs Growth Strategy Portfolio to the Goldman Sachs Growth Allocation Fund. The Fund also changed its principal investment strategy reflecting that the Fund will operate as a fund-of-funds investing in underlying equity, fixed income, and alternative funds, with increased equity and fixed income allocations, along with the option to invest in alternative asset classes and monthly rebalancing. |
| Material Fund Change Name [Text Block] |
Effective February 13, 2026, the Fund changed its name from the Goldman Sachs Growth Strategy Portfolio to the Goldman Sachs Growth Allocation Fund.
|
| Material Fund Change Strategies [Text Block] |
The Fund also changed its principal investment strategy reflecting that the Fund will operate as a fund-of-funds investing in underlying equity, fixed income, and alternative funds, with increased equity and fixed income allocations, along with the option to invest in alternative asset classes and monthly rebalancing.
|
| Summary of Change Legend [Text Block] |
This is a summary of certain changes to the Fund for the Period. For more complete information, you may review the Fund's next prospectus, which we expect to be available by April 30, 2026 at dfinview.com/GoldmanSachs or upon request at 1-800-621-2550.
|
| Updated Prospectus Phone Number |
1-800-621-2550
|
| Updated Prospectus Web Address |
<span style="box-sizing: border-box; color: rgb(0, 0, 0); display: inline; flex-wrap: nowrap; font-size: 12px; font-weight: 400; grid-area: auto; line-height: 18px; margin: 0px; overflow: visible; text-align: left; text-align-last: auto; white-space-collapse: preserve-breaks;">dfinview.com/GoldmanSachs</span>
|