Shareholder Report
Dec. 31, 2025
USD ($)
Holding
This annual shareholder report contains important information about the Class I shares of PSF Global Portfolio (the “Portfolio”) for the period of
January 1, 2025 to December 31, 2025.
You can find additional information about the Portfolio at
www.prudential.com/variableinsuranceportfolios
. You can also request this
information by contacting us at (800) 346-3778.
WHAT WERE THE PORTFOLIO COSTS FOR THE LAST YEAR?
(Based on a hypothetical $10,000 investment)
Costs of a $10,000 investment |
Costs paid as a percentage of a $10,000 investment | |
PSF Global Portfolio—Class I |
$65 |
0.59% |
WHAT AFFECTED THE PORTFOLIO’S PERFORMANCE DURING THE REPORTING PERIOD?
■
The Portfolio’s strongest contribution to performance compared to its benchmark came from a few key areas. The Global Core 1% Tracking
Error sleeve sub-advised by PGIM Quantitative Solutions (PQS) delivered particularly impressive results relative to the MSCI World Index
(GD) and served as the main driver of outperformance during the reporting period. Growth-focused exposures—including the State Street
SPDR S&P 500 Growth ETF and the Vanguard S&P 500 Growth ETF—also added meaningful value, as growth-oriented companies continued
to lead the market. In addition, PSF PGIM Jennison Value Portfolio contributed to performance, benefiting from its ability to identify attractive
opportunities within the value segment.
■
Strategic asset allocation tilts detracted modestly from the Portfolio’s return during the reporting period. Within manager and security selection,
the Vanguard Dividend Appreciation ETF struggled in the “risk on” environment that prevailed for much of the reporting period. The PSF PGIM
Jennison Growth Portfolio lagged the MSCI USA Large Growth Index, reflecting the continued dominance of mega cap stocks within the
benchmark. Allocations to S&P 500 Value ETFs detracted from performance as well. The PSF Small-Cap Stock Index Portfolio
underperformed due to its higher quality bias as the market saw a rally in lower quality, non-earning small companies. Finally, the PGIM
Jennison International Opportunities Fund lagged the MSCI EAFE Growth Index, as value-oriented stocks led the international equity market
during the reporting period.
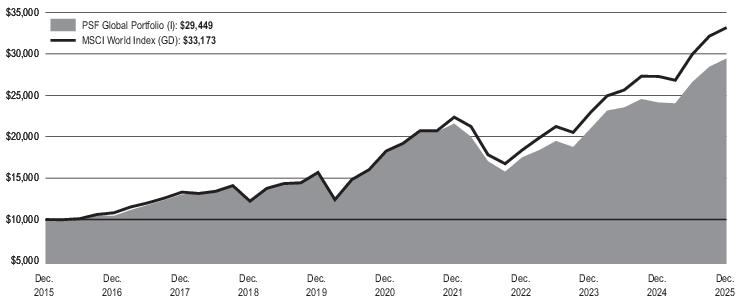
Average Annual Total Returns as of December 31, 2025 | |||
One Year (%) |
Five Years (%) |
Ten Years (%) | |
Portfolio |
22.03% |
10.04% |
11.41% |
MSCI World Index (GD) |
21.60% |
12.66% |
12.74% |
The returns do not reflect the deduction
of applicable taxes, if any, that a shareholder would pay on Portfolio distributions or redemption of Portfolio shares.
WHAT ARE SOME KEY PORTFOLIO STATISTICS AS OF 12/31/2025?
Portfolio’s net assets |
$ 1,068,341,241 |
Number of portfolio holdings |
537 |
Total advisory fees paid for the year |
$ 5,177,112 |
Portfolio turnover rate for the year |
123% |
WHAT ARE SOME CHARACTERISTICS OF THE PORTFOLIO’S HOLDINGS AS OF 12/31/2025?
Industry Classification |
% of Net Assets |
Affiliated Mutual Fund - Short-Term Investment (1.2% represents investments purchased with collateral from securities on loan) |
32.8% |
Unaffiliated Exchange-Traded Funds - Equity |
12.3% |
Semiconductors & Semiconductor Equipment |
6.2% |
Software |
4.3% |
Banks |
4.2% |
Interactive Media & Services |
3.4% |
Technology Hardware, Storage & Peripherals |
2.9% |
Pharmaceuticals |
2.3% |
Capital Markets |
2.0% |
Financial Services |
1.7% |
Broadline Retail |
1.7% |
Oil, Gas & Consumable Fuels |
1.6% |
Aerospace & Defense |
1.6% |
Insurance |
1.5% |
Automobiles |
1.4% |
Machinery |
1.2% |
Metals & Mining |
1.0% |
Health Care Equipment & Supplies |
1.0% |
Industry Classification |
% of Net Assets |
Consumer Staples Distribution & Retail |
1.0% |
Biotechnology |
1.0% |
Health Care Providers & Services |
1.0% |
IT Services |
1.0% |
Specialty Retail |
0.8% |
Electronic Equipment, Instruments & Components |
0.8% |
Food Products |
0.7% |
Electrical Equipment |
0.7% |
Electric Utilities |
0.7% |
Hotels, Restaurants & Leisure |
0.6% |
Diversified Telecommunication Services |
0.5% |
Entertainment |
0.5% |
Industrial Conglomerates |
0.5% |
Others* |
8.2% |
101.1% | |
Liabilities in excess of other assets |
(1.1)% |
100.0% |
* |
Consists of Industries that each make up less than 0.5% of the Portfolio's net assets |
WERE THERE ANY SIGNIFICANT CHANGES TO THE PORTFOLIO THIS YEAR?
The following is a summary of certain changes to the Portfolio since January 1, 2025.
■
Effective May 1, 2025, the Board of Trustees of Advanced Series Trust approved removing LSV Asset Management, Massachusetts Financial
Services Company, T. Rowe Price Associates, Inc. and William Blair Investment Management, LLC as subadvisers to the Portfolio. In
connection with these changes certain revisions were made to the Portfolio’s principal investment strategies to reflect the different mix of
subadvisers of the Portfolio, and the Portfolio’s principal risk disclosure was revised to include Exchange-Traded Funds (ETF) Risk and Fund of
Funds Risk as principal risks of the Portfolio.
■
PGIM Investments LLC, the investment manager of the Portfolio (the “Manager”), agreed to contractually waive 0.0465% of its investment
management fee through April 30, 2025. This arrangement was terminated after completion of this term. Effective May 1, 2025, the Manager
agreed to contractually limit expenses to 0.705% through June 30, 2026.
For more complete information, you should review the Portfolio’s current prospectus including any applicable supplements, and the Portfolio’s next
prospectus, which we expect to be available by May 1, 2026, at
www.prudential.com/variableinsuranceportfolios
or by request at
(800) 346-3778.
This annual shareholder report contains important information about the Class III shares of PSF Global Portfolio (the “Portfolio”) for the period of
January 1, 2025 to December 31, 2025.
You can find additional information about the Portfolio at
www.prudential.com/variableinsuranceportfolios
. You can also request this
information by contacting us at (800) 346-3778.
WHAT WERE THE PORTFOLIO COSTS FOR THE LAST YEAR?
(Based on a hypothetical $10,000 investment)
Costs of a $10,000 investment |
Costs paid as a percentage of a $10,000 investment | |
PSF Global Portfolio—Class III |
$92 |
0.83% |
WHAT AFFECTED THE PORTFOLIO’S PERFORMANCE DURING THE REPORTING PERIOD?
■
The Portfolio’s strongest contribution to performance compared to its benchmark came from a few key areas. The Global Core 1% Tracking
Error sleeve sub-advised by PGIM Quantitative Solutions (PQS) delivered particularly impressive results relative to the MSCI World Index
(GD) and served as the main driver of outperformance during the reporting period. Growth-focused exposures—including the State Street
SPDR S&P 500 Growth ETF and the Vanguard S&P 500 Growth ETF—also added meaningful value, as growth-oriented companies continued
to lead the market. In addition, PSF PGIM Jennison Value Portfolio contributed to performance, benefiting from its ability to identify attractive
opportunities within the value segment.
■
Strategic asset allocation tilts detracted modestly from the Portfolio’s return during the reporting period. Within manager and security selection,
the Vanguard Dividend Appreciation ETF struggled in the “risk on” environment that prevailed for much of the reporting period. The PSF PGIM
Jennison Growth Portfolio lagged the MSCI USA Large Growth Index, reflecting the continued dominance of mega cap stocks within the
benchmark. Allocations to S&P 500 Value ETFs detracted from performance as well. The PSF Small-Cap Stock Index Portfolio
underperformed due to its higher quality bias as the market saw a rally in lower quality, non-earning small companies. Finally, the PGIM
Jennison International Opportunities Fund lagged the MSCI EAFE Growth Index, as value-oriented stocks led the international equity market
during the reporting period.
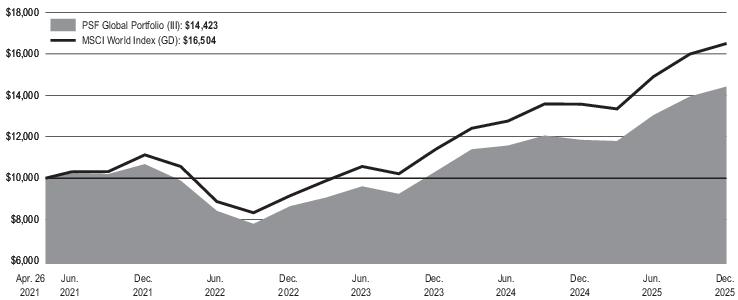
Average Annual Total Returns as of December 31, 2025 | ||
One Year (%) |
Since Inception (%) | |
Portfolio |
21.73% |
8.13% |
MSCI World Index (GD) |
21.60% |
11.33% |
Portfolio Inception: 04/26/2021.
Since Inception returns are provided because the Portfolio has less than 10 fiscal years of returns. Since Inception returns for the Indexes are
measured from the closest month-end to the Portfolio’s inception date.
The returns do not reflect the deduction
of applicable taxes, if any, that a shareholder would pay on Portfolio distributions or redemption of Portfolio shares.
WHAT ARE SOME KEY PORTFOLIO STATISTICS AS OF 12/31/2025?
Portfolio’s net assets |
$ 1,068,341,241 |
Number of portfolio holdings |
537 |
Total advisory fees paid for the year |
$ 5,177,112 |
Portfolio turnover rate for the year |
123% |
WHAT ARE SOME CHARACTERISTICS OF THE PORTFOLIO’S HOLDINGS AS OF 12/31/2025?
Industry Classification |
% of Net Assets |
Affiliated Mutual Fund - Short-Term Investment (1.2% represents investments purchased with collateral from securities on loan) |
32.8% |
Unaffiliated Exchange-Traded Funds - Equity |
12.3% |
Semiconductors & Semiconductor Equipment |
6.2% |
Software |
4.3% |
Banks |
4.2% |
Interactive Media & Services |
3.4% |
Technology Hardware, Storage & Peripherals |
2.9% |
Pharmaceuticals |
2.3% |
Capital Markets |
2.0% |
Financial Services |
1.7% |
Broadline Retail |
1.7% |
Oil, Gas & Consumable Fuels |
1.6% |
Aerospace & Defense |
1.6% |
Insurance |
1.5% |
Automobiles |
1.4% |
Machinery |
1.2% |
Metals & Mining |
1.0% |
Health Care Equipment & Supplies |
1.0% |
Industry Classification |
% of Net Assets |
Consumer Staples Distribution & Retail |
1.0% |
Biotechnology |
1.0% |
Health Care Providers & Services |
1.0% |
IT Services |
1.0% |
Specialty Retail |
0.8% |
Electronic Equipment, Instruments & Components |
0.8% |
Food Products |
0.7% |
Electrical Equipment |
0.7% |
Electric Utilities |
0.7% |
Hotels, Restaurants & Leisure |
0.6% |
Diversified Telecommunication Services |
0.5% |
Entertainment |
0.5% |
Industrial Conglomerates |
0.5% |
Others* |
8.2% |
101.1% | |
Liabilities in excess of other assets |
(1.1)% |
100.0% |
* |
Consists of Industries that each make up less than 0.5% of the Portfolio's net assets |
WERE THERE ANY SIGNIFICANT CHANGES TO THE PORTFOLIO THIS YEAR?
The following is a summary of certain changes to the Portfolio since January 1, 2025.
■
Effective May 1, 2025, the Board of Trustees of Advanced Series Trust approved removing LSV Asset Management, Massachusetts Financial
Services Company, T. Rowe Price Associates, Inc. and William Blair Investment Management, LLC as subadvisers to the Portfolio. In
connection with these changes certain revisions were made to the Portfolio’s principal investment strategies to reflect the different mix of
subadvisers of the Portfolio, and the Portfolio’s principal risk disclosure was revised to include Exchange-Traded Funds (ETF) Risk and Fund of
Funds Risk as principal risks of the Portfolio.
■
PGIM Investments LLC, the investment manager of the Portfolio (the “Manager”), agreed to contractually waive 0.0465% of its investment
management fee through April 30, 2025. This arrangement was terminated after completion of this term. Effective May 1, 2025, the Manager
agreed to contractually limit expenses to 0.705% through June 30, 2026.
For more complete information, you should review the Portfolio’s current prospectus including any applicable supplements, and the Portfolio’s next
prospectus, which we expect to be available by May 1, 2026, at
www.prudential.com/variableinsuranceportfolios
or by request at
(800) 346-3778.
This annual shareholder report contains important information about the Class I shares of PSF PGIM 50/50 Balanced Portfolio (the “Portfolio”)
for
the period of January 1, 2025 to December 31, 2025.
You can find additional information about the Portfolio at
www.prudential.com/variableinsuranceportfolios
. You can also request this
information by contacting us at (800) 346-3778.
WHAT WERE THE PORTFOLIO COSTS FOR THE LAST YEAR?
(Based on a hypothetical $10,000 investment)
Costs of a $10,000 investment |
Costs paid as a percentage of a $10,000 investment | |
PSF PGIM 50/50 Balanced Portfolio—Class I |
$62 |
0.58% |
WHAT AFFECTED THE PORTFOLIO’S PERFORMANCE DURING THE REPORTING PERIOD?
■
Robust earnings growth and expectations that the artificial intelligence (AI) boom would fuel future growth helped boost US stocks during the
reporting period. The announcement of “Liberation Day” tariffs in April 2025 triggered a sharp sell-off, but equity markets recovered and gained
additional ground after the US administration softened its position on its trade and tariff policies.
■
Three Federal Reserve policy rate cuts positively impacted US stocks during the reporting period. Fixed income assets also posted gains
following the interest rate cuts but were much more modest than the returns posted by risk assets.
■
An overweight allocation to equities contributed to the Portfolio’s performance relative to its Custom Blended Index during the reporting period.
The Portfolio was broadly overweight equities, with this weight increasing in the second half of the reporting period at the expense of
fixed income.
■
The underweight allocation to fixed income also contributed to performance, as fixed income lagged risk assets over the reporting period.
■
Non-US stocks outperformed US equities during the reporting period. This benefitted the Portfolio’s off-benchmark position in international
equities, which steadily increased during the reporting period. The Portfolio held a very modest position in S&P 500 Index futures, which
provided flexibility to manage equity exposure and had a slightly positive impact on performance.
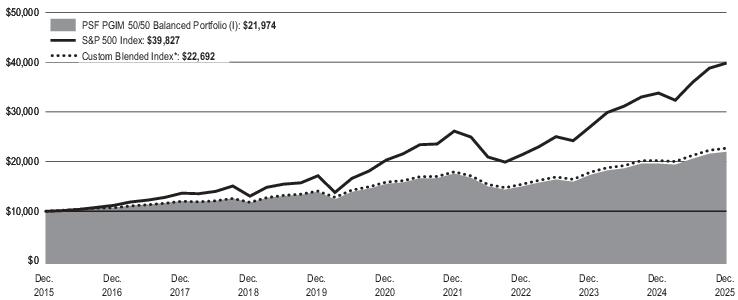
Average Annual Total Returns as of December 31, 2025 | |||
One Year (%) |
Five Years (%) |
Ten Years (%) | |
Portfolio |
12.16% |
7.20% |
8.19% |
S&P 500 Index |
17.88% |
14.42% |
14.82% |
Custom Blended Index* |
12.34% |
7.41% |
8.54% |
*The Portfolio’s Custom Blended Index is a model portfolio consisting of the S&P 500 Index (50%), Bloomberg US Aggregate Bond Index (40%), and FTSE 3-Month US Treasury
Bill
Index (10%).
The returns do not reflect the deduction
of applicable taxes, if any, that a shareholder would pay on Portfolio distributions or redemption of Portfolio shares.
WHAT ARE SOME KEY PORTFOLIO STATISTICS AS OF 12/31/2025?
Portfolio’s net assets |
$ 2,837,935,068 |
Number of portfolio holdings |
1,725 |
Total advisory fees paid for the year |
$ 14,980,771 |
Portfolio turnover rate for the year |
54% |
WHAT ARE SOME CHARACTERISTICS OF THE PORTFOLIO’S HOLDINGS AS OF 12/31/2025?
Industry Classification |
% of Net Assets |
Affiliated Mutual Fund - Short-Term Investment (1.6% represents investments purchased with collateral from securities on loan) |
12.8% |
U.S. Government Agency Obligations |
10.0% |
Semiconductors & Semiconductor Equipment |
7.4% |
Software |
5.4% |
Banks |
5.1% |
Interactive Media & Services |
4.2% |
Collateralized Loan Obligations |
4.0% |
Technology Hardware, Storage & Peripherals |
3.8% |
Commercial Mortgage-Backed Securities |
3.7% |
Automobiles |
3.1% |
Pharmaceuticals |
2.1% |
Broadline Retail |
2.0% |
Financial Services |
2.0% |
Affiliated Exchange-Traded Funds - Fixed Income |
1.9% |
Capital Markets |
1.8% |
Aerospace & Defense |
1.4% |
Oil, Gas & Consumable Fuels |
1.3% |
U.S. Treasury Obligations |
1.2% |
Insurance |
1.1% |
Health Care Equipment & Supplies |
1.0% |
Residential Mortgage-Backed Securities |
1.0% |
Electric |
1.0% |
Hotels, Restaurants & Leisure |
0.9% |
Consumer Staples Distribution & Retail |
0.9% |
Industry Classification |
% of Net Assets |
Specialty Retail |
0.9% |
Biotechnology |
0.9% |
Health Care Providers & Services |
0.8% |
Machinery |
0.8% |
Pipelines |
0.8% |
Electric Utilities |
0.8% |
Telecommunications |
0.7% |
Entertainment |
0.7% |
Chemicals |
0.6% |
Beverages |
0.6% |
Sovereign Bonds |
0.5% |
IT Services |
0.5% |
Media |
0.5% |
Life Sciences Tools & Services |
0.5% |
Communications Equipment |
0.5% |
Others* |
12.2% |
Options Purchased |
0.0%** |
Options Written |
(0.0)%** |
101.4% | |
Liabilities in excess of other assets |
(1.4)% |
100.0% |
* |
Consists of Industries that each make up less than 0.5% of the Portfolio's net assets |
** |
Less than 0.05% |
This annual shareholder report contains important information about the Class III shares of PSF PGIM 50/50 Balanced Portfolio (the “Portfolio”)
for the period of January 1, 2025 to December 31, 2025.
You can find additional information about the Portfolio at
www.prudential.com/variableinsuranceportfolios
. You can also request
this
information by contacting us at (800) 346-3778.
WHAT WERE THE PORTFOLIO COSTS FOR THE LAST YEAR?
(Based on a hypothetical $10,000 investment)
Costs of a $10,000 investment |
Costs paid as a percentage of a $10,000 investment | |
PSF PGIM 50/50 Balanced Portfolio—Class III |
$88 |
0.83% |
WHAT AFFECTED THE PORTFOLIO’S PERFORMANCE DURING THE REPORTING PERIOD?
■
Robust earnings growth and expectations that the artificial intelligence (AI) boom would fuel future growth helped boost US stocks during the
reporting period. The announcement of “Liberation Day” tariffs in April 2025 triggered a sharp sell-off, but equity markets recovered and gained
additional ground after the US administration softened its position on its trade and tariff policies.
■
Three Federal Reserve policy rate cuts positively impacted US stocks during the reporting period. Fixed income assets also posted gains
following the interest rate cuts but were much more modest than the returns posted by risk assets.
■
An overweight allocation to equities contributed to the Portfolio’s performance relative to its Custom Blended Index during the reporting period.
The Portfolio was broadly overweight equities, with this weight increasing in the second half of the reporting period at the expense of
fixed income.
■
The underweight allocation to fixed income also contributed to performance, as fixed income lagged risk assets over the reporting period.
■
Non-US stocks outperformed US equities during the reporting period. This benefitted the Portfolio’s off-benchmark position in international
equities, which steadily increased during the reporting period. The Portfolio held a very modest position in S&P 500 Index futures, which
provided flexibility to manage equity exposure and had a slightly positive impact on performance.
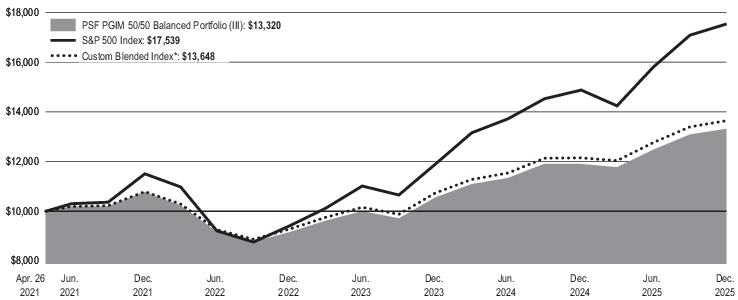
Average Annual Total Returns as of December 31, 2025 | ||
One Year (%) |
Since Inception (%) | |
Portfolio |
11.89% |
6.31% |
S&P 500 Index |
17.88% |
12.79% |
Custom Blended Index* |
12.34% |
6.89% |
Portfolio Inception: 04/26/2021.
Since Inception returns are provided because the Portfolio has less than 10 fiscal years of returns. Since Inception returns for the Indexes are
measured from the closest month-end to the Portfolio’s inception date.
*The Portfolio’s Custom Blended Index is a model portfolio consisting of the S&P 500 Index (50%), Bloomberg US Aggregate Bond Index (40%), and FTSE 3-Month US Treasury Bill
Index (10%).
The returns do not reflect the deduction
of applicable taxes, if any, that a shareholder would pay on Portfolio distributions or redemption of Portfolio shares.
WHAT ARE SOME KEY PORTFOLIO STATISTICS AS OF 12/31/2025?
Portfolio’s net assets |
$ 2,837,935,068 |
Number of portfolio holdings |
1,725 |
Total advisory fees paid for the year |
$ 14,980,771 |
Portfolio turnover rate for the year |
54% |
WHAT ARE SOME CHARACTERISTICS OF THE PORTFOLIO’S HOLDINGS AS OF 12/31/2025?
Industry Classification |
% of Net Assets |
Affiliated Mutual Fund - Short-Term Investment (1.6% represents investments purchased with collateral from securities on loan) |
12.8% |
U.S. Government Agency Obligations |
10.0% |
Semiconductors & Semiconductor Equipment |
7.4% |
Software |
5.4% |
Banks |
5.1% |
Interactive Media & Services |
4.2% |
Collateralized Loan Obligations |
4.0% |
Technology Hardware, Storage & Peripherals |
3.8% |
Commercial Mortgage-Backed Securities |
3.7% |
Automobiles |
3.1% |
Pharmaceuticals |
2.1% |
Broadline Retail |
2.0% |
Financial Services |
2.0% |
Affiliated Exchange-Traded Funds - Fixed Income |
1.9% |
Capital Markets |
1.8% |
Aerospace & Defense |
1.4% |
Oil, Gas & Consumable Fuels |
1.3% |
U.S. Treasury Obligations |
1.2% |
Insurance |
1.1% |
Health Care Equipment & Supplies |
1.0% |
Residential Mortgage-Backed Securities |
1.0% |
Electric |
1.0% |
Hotels, Restaurants & Leisure |
0.9% |
Consumer Staples Distribution & Retail |
0.9% |
Industry Classification |
% of Net Assets |
Specialty Retail |
0.9% |
Biotechnology |
0.9% |
Health Care Providers & Services |
0.8% |
Machinery |
0.8% |
Pipelines |
0.8% |
Electric Utilities |
0.8% |
Telecommunications |
0.7% |
Entertainment |
0.7% |
Chemicals |
0.6% |
Beverages |
0.6% |
Sovereign Bonds |
0.5% |
IT Services |
0.5% |
Media |
0.5% |
Life Sciences Tools & Services |
0.5% |
Communications Equipment |
0.5% |
Others* |
12.2% |
Options Purchased |
0.0%** |
Options Written |
(0.0)%** |
101.4% | |
Liabilities in excess of other assets |
(1.4)% |
100.0% |
* |
Consists of Industries that each make up less than 0.5% of the Portfolio's net assets |
** |
Less than 0.05% |
This annual shareholder report contains important information about the Class I shares of PSF PGIM Ballast Portfolio (the “Portfolio”) for
the
period of June 18, 2025 to December 31, 2025.
You can find additional information about the Portfolio at
www.prudential.com/variableinsuranceportfolios
. You can also request this
information by contacting us at (800) 346-3778.
WHAT WERE THE PORTFOLIO COSTS FOR THE LAST YEAR?
(Based on a hypothetical $10,000 investment)
Costs of a $10,000 investment |
Costs paid as a percentage of a $10,000 investment | |
PSF PGIM Ballast Portfolio—Class I |
$39 |
0.70% |
WHAT AFFECTED THE PORTFOLIO’S PERFORMANCE DURING THE REPORTING PERIOD?
■
During the reporting period, global financial markets posted strong gains driven by robust artificial intelligence (AI) and technology demand,
solid corporate earnings, and a series of interest rate cuts. The Bloomberg US Aggregate Bond Index continued to climb in the fourth quarter,
building on upward momentum from earlier in 2025. While returns were more muted in US Treasuries, yields were supported by the three rate
cuts in September, October, and December 2025, as the Federal Open Market Committee (FOMC) determined that labor market weakness
warranted easing despite sticky inflation.
■
The Portfolio benefited from higher average equity exposure of 67% compared to its baseline of 60%, as the S&P 500 Index was up
meaningfully during the reporting period. Call option prices were also positively impacted by increases in implied volatility. Average portfolio
duration was shorter relative to the Bloomberg US Intermediate Government Bond Index over the reporting period, but interest rate exposure
also added relative value.
■
A decrease in interest rates, increases in the implied dividend yield, and option time decay had a negative impact on call option prices over the
reporting period. Option time decay is the reduction in the value of an option as the time to the expiration date of the option
contract approaches.
■
Call options on the S&P 500 are a key component of the Portfolio, and how it generates equity exposure and aims to achieve the targeted
convex payoff profile. During the reporting period, exposure to S&P 500 Index call options had a positive impact on the Portfolio’s performance.
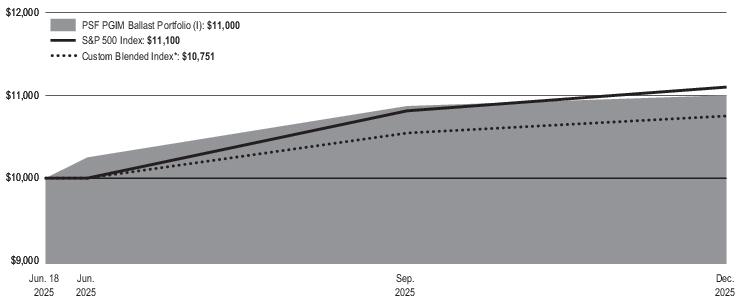
Total Returns as of December 31, 2025 | |
Since Inception (%) | |
Portfolio |
10.00% |
S&P 500 Index |
11.00% |
Custom Blended Index* |
7.51% |
Portfolio Inception: 06/18/2025
Since Inception returns are provided because the Portfolio has less than 10 fiscal years of returns. Since Inception returns for the Indexes are
measured from the closest month-end to the Portfolio’s inception date.
*The Portfolio’s Custom Blended Index is a model portfolio consisting of the S&P 500 Index (60%) and Bloomberg US Government Bond Index (40%).
The returns do not reflect the deduction
of applicable taxes, if any, that a shareholder would pay on Portfolio distributions or redemption of Portfolio shares.
WHAT ARE SOME KEY PORTFOLIO STATISTICS AS OF 12/31/2025?
Portfolio’s net assets |
$ 5,558,088 |
Number of portfolio holdings |
10 |
Total advisory fees paid for the year |
$ 0 |
Portfolio turnover rate for the year |
0% |
WHAT ARE SOME CHARACTERISTICS OF THE PORTFOLIO’S HOLDINGS AS OF 12/31/2025?
Industry Classification |
% of Net Assets |
U.S. Treasury Obligations |
40.2% |
Options Purchased |
25.4% |
U.S. Government Agency Obligations |
18.8% |
Affiliated Mutual Fund - Short-Term Investment |
12.6% |
Unaffiliated Exchange-Traded Funds - Equity |
2.8% |
99.8% | |
Other assets in excess of liabilities |
0.2% |
100.0% |
This annual shareholder report contains important information about the Class I shares of PSF PGIM Flexible Managed Portfolio (the “Portfolio”)
for the period of January 1, 2025 to December 31, 2025.
You can find additional information about the Portfolio at
www.prudential.com/variableinsuranceportfolios
. You can also request
this
information by contacting us at (800) 346-3778.
WHAT WERE THE PORTFOLIO COSTS FOR THE LAST YEAR?
(Based on a hypothetical $10,000 investment)
Costs of a $10,000 investment |
Costs paid as a percentage of a $10,000 investment | |
PSF PGIM Flexible Managed Portfolio—Class I |
$66 |
0.62% |
WHAT AFFECTED THE PORTFOLIO’S PERFORMANCE DURING THE REPORTING PERIOD?
■
Robust earnings growth and expectations that the artificial intelligence (AI) boom would fuel future growth helped boost US stocks during the
reporting period. The announcement of “Liberation Day” tariffs in April 2025 triggered a sharp sell-off, but equity markets recovered and gained
additional ground after the US administration softened its position on its trade and tariff policies.
■
Three Federal Reserve policy rate cuts positively impacted US stocks during the reporting period. Fixed income assets also posted gains
following the interest rate cuts but were much more modest than the returns posted by risk assets.
■
An overweight allocation to equities contributed to the Portfolio’s performance relative to its Custom Blended Index during the reporting period.
The Portfolio was broadly overweight equities, with this weight increasing in the second half of the reporting period at the expense of
fixed income.
■
The underweight allocation to fixed income also contributed to performance as fixed income lagged risk assets over the reporting period.
■
Non-US stocks outperformed US equities during the reporting period. This benefited the Portfolio’s off-benchmark position in international
equities, which steadily increased during the reporting period. The Portfolio held a very modest position in S&P 500 Index futures, which
provided flexibility to manage equity exposure and had a slightly positive impact on performance.
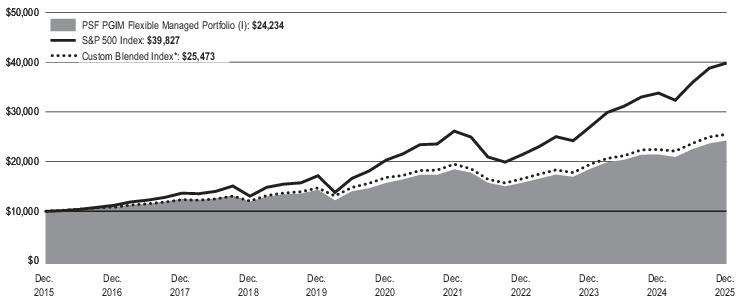
Average Annual Total Returns as of December 31, 2025 | |||
One Year (%) |
Five Years (%) |
Ten Years (%) | |
Portfolio |
13.16% |
9.06% |
9.26% |
S&P 500 Index |
17.88% |
14.42% |
14.82% |
Custom Blended Index* |
13.55% |
8.68% |
9.80% |
*The Portfolio’s Custom Blended Index is a model portfolio consisting of the S&P 500 Index (60%), Bloomberg US Aggregate Bond Index (35%), and FTSE 3-Month US Treasury Bill
Index (5%).
The returns do not reflect the deduction
of applicable taxes, if any, that a shareholder would pay on Portfolio distributions or redemption of Portfolio shares.
WHAT ARE SOME KEY PORTFOLIO STATISTICS AS OF 12/31/2025?
Portfolio’s net assets |
$ 5,270,831,176 |
Number of portfolio holdings |
1,679 |
Total advisory fees paid for the year |
$ 30,222,762 |
Portfolio turnover rate for the year |
117% |
WHAT ARE SOME CHARACTERISTICS OF THE PORTFOLIO’S HOLDINGS AS OF 12/31/2025?
Industry Classification |
% of Net Assets |
Semiconductors & Semiconductor Equipment |
8.9% |
U.S. Government Agency Obligations |
8.7% |
Affiliated Mutual Fund - Short-Term Investment (1.9% represents investments purchased with collateral from securities on loan) |
7.6% |
Software |
6.5% |
Interactive Media & Services |
4.9% |
Banks |
4.7% |
Technology Hardware, Storage & Peripherals |
4.7% |
Collateralized Loan Obligations |
4.1% |
Commercial Mortgage-Backed Securities |
3.2% |
Automobiles |
3.2% |
Pharmaceuticals |
2.5% |
Broadline Retail |
2.4% |
Financial Services |
2.3% |
Capital Markets |
2.2% |
Oil, Gas & Consumable Fuels |
1.8% |
Aerospace & Defense |
1.7% |
Insurance |
1.4% |
Consumer Staples Distribution & Retail |
1.2% |
Affiliated Exchange-Traded Funds - Fixed Income |
1.2% |
Health Care Providers & Services |
1.2% |
Biotechnology |
1.2% |
Health Care Equipment & Supplies |
1.2% |
Machinery |
1.1% |
Hotels, Restaurants & Leisure |
1.0% |
Specialty Retail |
1.0% |
Electric Utilities |
1.0% |
Industry Classification |
% of Net Assets |
Electric |
0.9% |
Residential Mortgage-Backed Securities |
0.8% |
U.S. Treasury Obligations |
0.8% |
Entertainment |
0.8% |
Pipelines |
0.7% |
IT Services |
0.7% |
Chemicals |
0.7% |
Electrical Equipment |
0.7% |
Telecommunications |
0.6% |
Beverages |
0.6% |
Ground Transportation |
0.6% |
Consumer Finance |
0.5% |
Electronic Equipment, Instruments & Components |
0.5% |
Life Sciences Tools & Services |
0.5% |
Diversified Telecommunication Services |
0.5% |
Oil & Gas |
0.5% |
Communications Equipment |
0.5% |
Media |
0.5% |
Others* |
9.4% |
Options Purchased |
0.0%** |
Options Written |
(0.0)%** |
101.7% | |
Liabilities in excess of other assets |
(1.7)% |
100.0% |
* |
Consists of Industries that each make up less than 0.5% of the Portfolio's net assets |
** |
Less than 0.05% |
WERE THERE ANY SIGNIFICANT CHANGES TO THE PORTFOLIO THIS YEAR?
The following is a summary of certain changes to the Portfolio since January 1, 2025.
■
PGIM Investments LLC, the investment manager of the Portfolio, agreed to contractually limit expenses to 0.62% through June 30, 2025. This
arrangement was terminated after completion of this term and its termination did not have an impact on the Portfolio’s total annual operating
expenses during the period.
For more complete information, you should review the Portfolio’s current prospectus including any applicable supplements, and the Portfolio’s next
prospectus, which we expect to be available by May 1, 2026, at
www.prudential.com/variableinsuranceportfolios
or by request at
(800) 346-3778.
PGIM Investments LLC, the investment manager of the Portfolio, agreed to contractually limit expenses to 0.62% through June 30, 2025. This
arrangement was terminated after completion of this term and its termination did not have an impact on the Portfolio’s total annual operating
expenses during the period.
This annual shareholder report contains important information about the Class III shares of PSF PGIM Flexible Managed Portfolio (the “Portfolio”)
for the period of January 1, 2025 to December 31, 2025.
You can find additional information about the Portfolio at
www.prudential.com/variableinsuranceportfolios
. You can also request
this
information by contacting us at (800) 346-3778.
WHAT WERE THE PORTFOLIO COSTS FOR THE LAST YEAR?
(Based on a hypothetical $10,000 investment)
Costs of a $10,000 investment |
Costs paid as a percentage of a $10,000 investment | |
PSF PGIM Flexible Managed Portfolio—Class III |
$93 |
0.87% |
WHAT AFFECTED THE PORTFOLIO’S PERFORMANCE DURING THE REPORTING PERIOD?
■
Robust earnings growth and expectations that the artificial intelligence (AI) boom would fuel future growth helped boost US stocks during the
reporting period. The announcement of “Liberation Day” tariffs in April 2025 triggered a sharp sell-off, but equity markets recovered and gained
additional ground after the US administration softened its position on its trade and tariff policies.
■
Three Federal Reserve policy rate cuts positively impacted US stocks during the reporting period. Fixed income assets also posted gains
following the interest rate cuts but were much more modest than the returns posted by risk assets.
■
An overweight allocation to equities contributed to the Portfolio’s performance relative to its Custom Blended Index during the reporting period.
The Portfolio was broadly overweight equities, with this weight increasing in the second half of the reporting period at the expense of
fixed income.
■
The underweight allocation to fixed income also contributed to performance as fixed income lagged risk assets over the reporting period.
■
Non-US stocks outperformed US equities during the reporting period. This benefited the Portfolio’s off-benchmark position in international
equities, which steadily increased during the reporting period. The Portfolio held a very modest position in S&P 500 Index futures, which
provided flexibility to manage equity exposure and had a slightly positive impact on performance.
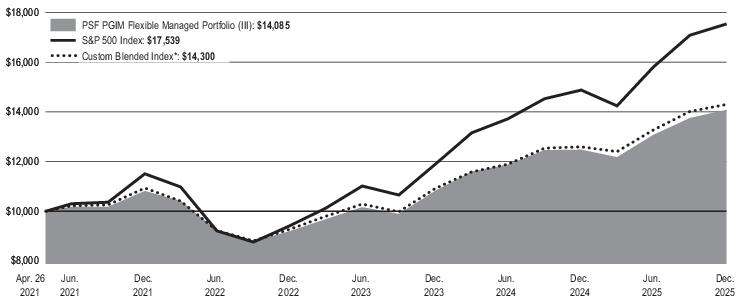
Average Annual Total Returns as of December 31, 2025 | ||
One Year (%) |
Since Inception (%) | |
Portfolio |
12.87% |
7.59% |
S&P 500 Index |
17.88% |
12.79% |
Custom Blended Index* |
13.55% |
7.97% |
Portfolio Inception: 04/26/2021.
Since Inception returns are provided because the Portfolio has less than 10 fiscal years of returns. Since Inception returns for the Indexes are
measured from the closest month-end to the Portfolio’s inception date.
*The Portfolio’s Custom Blended Index is a model portfolio consisting of the S&P 500 Index (60%), Bloomberg US Aggregate Bond Index (35%), and FTSE 3-Month US Treasury Bill
Index (5%).
The returns do not reflect the deduction
of applicable taxes, if any, that a shareholder would pay on Portfolio distributions or redemption of Portfolio shares.
WHAT ARE SOME KEY PORTFOLIO STATISTICS AS OF 12/31/2025?
Portfolio’s net assets |
$ 5,270,831,176 |
Number of portfolio holdings |
1,679 |
Total advisory fees paid for the year |
$ 30,222,762 |
Portfolio turnover rate for the year |
117% |
WHAT ARE SOME CHARACTERISTICS OF THE PORTFOLIO’S HOLDINGS AS OF 12/31/2025?
Industry Classification |
% of Net Assets |
Semiconductors & Semiconductor Equipment |
8.9% |
U.S. Government Agency Obligations |
8.7% |
Affiliated Mutual Fund - Short-Term Investment (1.9% represents investments purchased with collateral from securities on loan) |
7.6% |
Software |
6.5% |
Interactive Media & Services |
4.9% |
Banks |
4.7% |
Technology Hardware, Storage & Peripherals |
4.7% |
Collateralized Loan Obligations |
4.1% |
Commercial Mortgage-Backed Securities |
3.2% |
Automobiles |
3.2% |
Pharmaceuticals |
2.5% |
Broadline Retail |
2.4% |
Financial Services |
2.3% |
Capital Markets |
2.2% |
Oil, Gas & Consumable Fuels |
1.8% |
Aerospace & Defense |
1.7% |
Insurance |
1.4% |
Consumer Staples Distribution & Retail |
1.2% |
Affiliated Exchange-Traded Funds - Fixed Income |
1.2% |
Health Care Providers & Services |
1.2% |
Biotechnology |
1.2% |
Health Care Equipment & Supplies |
1.2% |
Machinery |
1.1% |
Hotels, Restaurants & Leisure |
1.0% |
Specialty Retail |
1.0% |
Electric Utilities |
1.0% |
Industry Classification |
% of Net Assets |
Electric |
0.9% |
Residential Mortgage-Backed Securities |
0.8% |
U.S. Treasury Obligations |
0.8% |
Entertainment |
0.8% |
Pipelines |
0.7% |
IT Services |
0.7% |
Chemicals |
0.7% |
Electrical Equipment |
0.7% |
Telecommunications |
0.6% |
Beverages |
0.6% |
Ground Transportation |
0.6% |
Consumer Finance |
0.5% |
Electronic Equipment, Instruments & Components |
0.5% |
Life Sciences Tools & Services |
0.5% |
Diversified Telecommunication Services |
0.5% |
Oil & Gas |
0.5% |
Communications Equipment |
0.5% |
Media |
0.5% |
Others* |
9.4% |
Options Purchased |
0.0%** |
Options Written |
(0.0)%** |
101.7% | |
Liabilities in excess of other assets |
(1.7)% |
100.0% |
* |
Consists of Industries that each make up less than 0.5% of the Portfolio's net assets |
** |
Less than 0.05% |
WERE THERE ANY SIGNIFICANT CHANGES TO THE PORTFOLIO THIS YEAR?
The following is a summary of certain changes to the Portfolio since January 1, 2025.
■
PGIM Investments LLC, the investment manager of the Portfolio, agreed to contractually limit expenses to 0.62% through June 30, 2025. This
arrangement was terminated after completion of this term and its termination did not have an impact on the Portfolio’s total annual operating
expenses during the period.
For more complete information, you should review the Portfolio’s current prospectus including any applicable supplements, and the Portfolio’s next
prospectus, which we expect to be available by May 1, 2026, at
www.prudential.com/variableinsuranceportfolios
or by request at
(800) 346-3778.
PGIM Investments LLC, the investment manager of the Portfolio, agreed to contractually limit expenses to 0.62% through June 30, 2025. This
arrangement was terminated after completion of this term and its termination did not have an impact on the Portfolio’s total annual operating
expenses during the period.
This annual shareholder report contains important information about the Class I shares of PSF PGIM Government Money Market Portfolio (the
“Portfolio”) for the period of January 1, 2025 to December 31, 2025.
You can find additional information about the Portfolio at
www.prudential.com/variableinsuranceportfolios
. You can also request this
information by contacting us at (800) 346-3778.
WHAT WERE THE PORTFOLIO COSTS FOR THE LAST YEAR?
(Based on a hypothetical $10,000 investment)
Costs of a $10,000 investment |
Costs paid as a percentage of a $10,000 investment | |
PSF PGIM Government Money Market Portfolio—Class I |
$33 |
0.32% |
WHAT ARE SOME KEY PORTFOLIO STATISTICS AS OF 12/31/2025?
Portfolio’s net assets |
$ 1,440,313,777 |
Number of portfolio holdings |
88 |
Total advisory fees paid for the year |
$ 4,350,676 |
WHAT ARE SOME CHARACTERISTICS OF THE PORTFOLIO’S HOLDINGS AS OF 12/31/2025?
Sector Classification |
% of Net Assets |
Repurchase Agreements |
39.5% |
U.S. Government Agency Obligations |
34.2% |
U.S. Treasury Obligations |
28.4% |
102.1% | |
Liabilities in excess of other assets |
(2.1)% |
100.0% |
This annual shareholder report contains important information about the Class III shares of PSF PGIM Government Money Market Portfolio (the
“Portfolio”) for the period of January 1, 2025 to December 31, 2025.
You can find additional information about the Portfolio at
www.prudential.com/variableinsuranceportfolios
. You can also request this
information by contacting us at (800) 346-3778.
WHAT WERE THE PORTFOLIO COSTS FOR THE LAST YEAR?
(Based on a hypothetical $10,000 investment)
Costs of a $10,000 investment |
Costs paid as a percentage of a $10,000 investment | |
PSF PGIM Government Money Market Portfolio—Class III |
$58 |
0.57% |
WHAT ARE SOME KEY PORTFOLIO STATISTICS AS OF 12/31/2025?
Portfolio’s net assets |
$ 1,440,313,777 |
Number of portfolio holdings |
88 |
Total advisory fees paid for the year |
$ 4,350,676 |
WHAT ARE SOME CHARACTERISTICS OF THE PORTFOLIO’S HOLDINGS AS OF 12/31/2025?
Sector Classification |
% of Net Assets |
Repurchase Agreements |
39.5% |
U.S. Government Agency Obligations |
34.2% |
U.S. Treasury Obligations |
28.4% |
102.1% | |
Liabilities in excess of other assets |
(2.1)% |
100.0% |
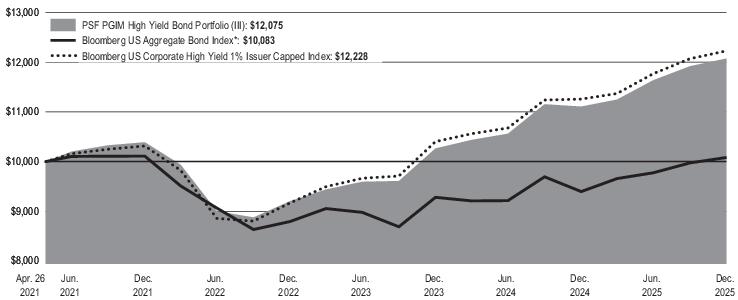
This annual shareholder report contains important information about the Class I shares of PSF PGIM High Yield Bond Portfolio (the “Portfolio”) for
the period of January 1, 2025 to December 31, 2025.
You can find additional information about the Portfolio at
www.prudential.com/variableinsuranceportfolios
. You can also request this
information by contacting us at (800) 346-3778.
WHAT WERE THE PORTFOLIO COSTS FOR THE LAST YEAR?
(Based on a hypothetical $10,000 investment)
Costs of a $10,000 investment |
Costs paid as a percentage of a $10,000 investment | |
PSF PGIM High Yield Bond Portfolio—Class I |
$60 |
0.57% |
WHAT AFFECTED THE PORTFOLIO’S PERFORMANCE DURING THE REPORTING PERIOD?
■
US high yield bonds posted solid total returns over the reporting period amid resilient economic growth, stable corporate earnings, and light net
new supply compared with inflows of approximately $18.2 billion into high yield bond mutual funds and exchange-traded funds. Higher-quality
bonds generally outperformed lower-quality bonds, with BB-rated bonds outperforming both B-rated and CCC-rated bonds.
■
During the reporting period, security selection in the telecom, health care & pharmaceutical, and retailers & restaurants sectors contributed to
returns relative to the Bloomberg US Corporate High Yield 1% Issuer Capped Index. Overweights to the cable & satellite and midstream energy
sectors, as well as an underweight to the technology sector also contributed to the Portfolio’s performance, as did an overweight to the
emerging markets high yield bond sector.
■
Security selection in the chemicals, consumer non-cyclical, and automotive sectors detracted from performance, as did underweights to the
media & entertainment, retailers & restaurants, and automotive sectors. An underweight allocation to the U.S. high yield bond market and an
overweight to the U.S. bank loan market also detracted from performance during the reporting period.
■
During the reporting period, the Portfolio used U.S. Treasury futures and total
return
swaps to manage interest rate risk, which we believe is a more efficient way of managing interest rate risk than through the purchase and sale of bonds. The impact of futures and swaps detracted from
performance. The Portfolio also used credit derivatives in the form of the credit default swap index (CDX) and credit default swaps to manage
the overall risk profile of the Portfolio, which had a positive impact on performance.
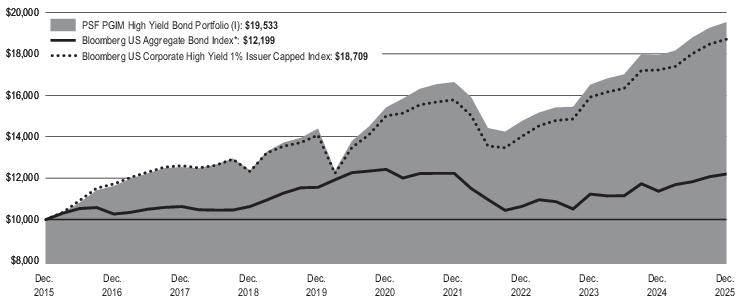
Average Annual Total Returns as of December 31, 2025 | |||
One Year (%) |
Five Years (%) |
Ten Years (%) | |
Portfolio |
8.90% |
4.85% |
6.92% |
Bloomberg US Aggregate Bond Index* |
7.30% |
-0.36% |
2.01% |
Bloomberg US Corporate High Yield 1% Issuer Capped Index |
8.62% |
4.51% |
6.46% |
*The Portfolio compares its performance against this broad-based index in response to regulatory requirements.
The returns do not reflect the deduction
of applicable taxes, if any, that a shareholder would pay on Portfolio distributions or redemption of Portfolio shares.
WHAT ARE SOME KEY PORTFOLIO STATISTICS AS OF 12/31/2025?
Portfolio’s net assets |
$ 685,718,179 |
Number of portfolio holdings |
799 |
Total advisory fees paid for the year |
$ 3,684,522 |
Portfolio turnover rate for the year |
77% |
WHAT ARE SOME CHARACTERISTICS OF THE PORTFOLIO’S HOLDINGS AS OF 12/31/2025?
Credit Quality |
% of Total Investments |
AAA |
0.7 |
AA |
5.2 |
BBB |
2.7 |
BB |
39.5 |
B |
32.9 |
CCC and Below |
15.0 |
NR |
3.1 |
Cash/Cash Equivalents |
0.9 |
Total Investments |
100.0 |
Credit quality ratings shown above reflect the middle rating assigned by a nationally recognized statistical rating organization (NRSRO) such as Moody’s Investor Service, Inc.
(Moody’s), S&P Global Ratings (S&P), or Fitch, Inc. (Fitch) if ratings differ. Where applicable, ratings are converted to the comparable S&P/Fitch rating category to illustrate credit
rating breakdowns. These NRSROs are independent and are widely used. The Not Rated (NR) category consists of securities that have not been rated by a NRSRO. Unrated
investments do not necessarily indicate low credit quality. The ratings category may include derivative instruments that could have a negative value. Credit quality ratings are subject to
change. Values may not sum to 100.0% due to rounding.
This annual shareholder report contains important information about the Class III shares of PSF PGIM High Yield Bond Portfolio (the “Portfolio”)
for the period of January 1, 2025 to December 31, 2025.
You can find additional information about the Portfolio at
www.prudential.com/variableinsuranceportfolios
. You can also request this
information by contacting us at (800) 346-3778.
WHAT WERE THE PORTFOLIO COSTS FOR THE LAST YEAR?
(Based on a hypothetical $10,000 investment)
Costs of a $10,000 investment |
Costs paid as a percentage of a $10,000 investment | |
PSF PGIM High Yield Bond Portfolio—Class III |
$86 |
0.82% |
WHAT AFFECTED THE PORTFOLIO’S PERFORMANCE DURING THE REPORTING PERIOD?
■
US high yield bonds posted solid total returns over the reporting period amid resilient economic growth, stable corporate earnings, and light net
new supply compared with inflows of approximately $18.2 billion into high yield bond mutual funds and exchange-traded funds. Higher-quality
bonds generally outperformed lower-quality bonds, with BB-rated bonds outperforming both B-rated and CCC-rated bonds.
■
During the reporting period, security selection in the telecom, health care & pharmaceutical, and retailers & restaurants sectors contributed to
returns relative to the Bloomberg US Corporate High Yield 1% Issuer Capped Index. Overweights to the cable & satellite and midstream energy
sectors, as well as an underweight to the technology sector also contributed to the Portfolio’s performance, as did an overweight to the
emerging markets high yield bond sector.
■
Security selection in the chemicals, consumer non-cyclical, and automotive sectors detracted from performance, as did underweights to the
media & entertainment, retailers & restaurants, and automotive sectors. An underweight allocation to the U.S. high yield bond market and an
overweight to the U.S. bank loan market also detracted from performance during the reporting period.
■
During the reporting period, the Portfolio used U.S. Treasury futures and total return swaps to manage interest rate risk, which we believe is a
more efficient way of managing interest rate risk than through the purchase and sale of bonds. The impact of futures and swaps detracted from
performance. The Portfolio also used credit derivatives in the form of the credit default swap index (CDX) and credit default swaps to manage
the overall risk profile of the Portfolio, which had a positive impact on performance.
Average Annual Total Returns as of December 31, 2025 | ||
One Year (%) |
Since Inception (%) | |
Portfolio |
8.71% |
4.11% |
Bloomberg US Aggregate Bond Index* |
7.30% |
0.18% |
Bloomberg US Corporate High Yield 1% Issuer Capped Index |
8.62% |
4.40% |
Portfolio Inception: 04/26/2021.
Since Inception returns are provided because the Portfolio has less than 10 fiscal
years
of returns. Since Inception returns for the Indexes are measured from the closest month-end to the Portfolio’s inception date.
*The Portfolio compares its performance against this broad-based index in response to regulatory requirements.
The returns do not reflect the deduction
of applicable taxes, if any, that a shareholder would pay on Portfolio distributions or redemption of Portfolio shares.
WHAT ARE SOME KEY PORTFOLIO STATISTICS AS OF 12/31/2025?
Portfolio’s net assets |
$ 685,718,179 |
Number of portfolio holdings |
799 |
Total advisory fees paid for the year |
$ 3,684,522 |
Portfolio turnover rate for the year |
77% |
WHAT ARE SOME CHARACTERISTICS OF THE PORTFOLIO’S HOLDINGS AS OF 12/31/2025?
Credit Quality |
% of Total Investments |
AAA |
0.7 |
AA |
5.2 |
BBB |
2.7 |
BB |
39.5 |
B |
32.9 |
CCC and Below |
15.0 |
NR |
3.1 |
Cash/Cash Equivalents |
0.9 |
Total Investments |
100.0 |
Credit quality ratings shown above reflect the middle rating assigned by a nationally recognized statistical rating organization (NRSRO) such as Moody’s Investor Service, Inc.
(Moody’s), S&P Global Ratings (S&P), or Fitch, Inc. (Fitch) if ratings differ. Where applicable, ratings are converted to the comparable S&P/Fitch rating category to illustrate credit
rating breakdowns. These NRSROs are independent and are widely used. The Not Rated (NR) category consists of securities that have not been rated by a NRSRO. Unrated
investments do not necessarily indicate low credit quality. The ratings category may include derivative instruments that could have a negative value. Credit quality ratings are subject to
change. Values may not sum to 100.0% due to rounding.
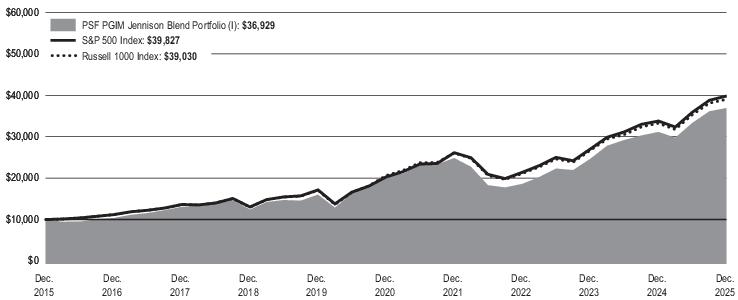
This annual shareholder report contains important information about the Class I shares of PSF PGIM Jennison Blend Portfolio (the “Portfolio”) for
the period of January 1, 2025 to December 31, 2025.
You can find additional information about the Portfolio at
www.prudential.com/variableinsuranceportfolios
. You can also request this
information by contacting us at (800) 346-3778.
WHAT WERE THE PORTFOLIO COSTS FOR THE LAST YEAR?
(Based on a hypothetical $10,000 investment)
Costs of a $10,000 investment |
Costs paid as a percentage of a $10,000 investment | |
PSF PGIM Jennison Blend Portfolio—Class I |
$50 |
0.46% |
WHAT AFFECTED THE PORTFOLIO’S PERFORMANCE DURING THE REPORTING PERIOD?
■
US equities generally posted solid gains for the reporting period, supported by investor enthusiasm around artificial intelligence (AI), resilient
corporate earnings, and three Federal Reserve rate cuts later in the period. Investor confidence remained robust, even as volatility and policy
uncertainty persisted throughout the reporting period. In broad terms, large cap stocks, represented by the Russell 1000 Index, outperformed
small cap stocks, represented by the Russell 2000 Index. Meanwhile, growth stocks, represented by the Russell 1000 Growth Index,
outperformed value stocks, represented by the Russell 1000 Value Index.
■
Positions in information technology, communication services, industrials, consumer discretionary, and financials sectors drove the Portfolio’s
solid absolute performance during the reporting period. The Portfolio outperformed its benchmark, the S&P 500 Index, for the reporting period
largely due to security selection within industrials, communication services, and consumer discretionary sectors.
■
On the downside, the Portfolio’s security selection in financials and healthcare sectors, along with an underweight to the information technology
sector, were the largest headwinds to performance relative to its S&P 500 benchmark.
Average Annual Total Returns as of December 31, 2025 | |||
One Year (%) |
Five Years (%) |
Ten Years (%) | |
Portfolio |
18.52% |
12.33% |
13.96% |
S&P 500 Index |
17.88% |
14.42% |
14.82% |
Russell 1000 Index |
17.37% |
13.59% |
14.59% |
The returns do not reflect the deduction
of applicable taxes, if any, that a shareholder would pay on Portfolio distributions or redemption of Portfolio shares.
WHAT ARE SOME KEY PORTFOLIO STATISTICS AS OF 12/31/2025?
Portfolio’s net assets |
$ 7,924,509,446 |
Number of portfolio holdings |
92 |
Total advisory fees paid for the year |
$ 32,112,759 |
Portfolio turnover rate for the year |
95% |
WHAT ARE SOME CHARACTERISTICS OF THE
PORTFOLIO’S
HOLDINGS AS OF 12/31/2025?Industry Classification |
% of Net Assets |
Semiconductors & Semiconductor Equipment |
13.3% |
Interactive Media & Services |
9.3% |
Banks |
8.9% |
Software |
7.6% |
Technology Hardware, Storage & Peripherals |
7.3% |
Aerospace & Defense |
4.8% |
Broadline Retail |
4.0% |
Pharmaceuticals |
3.9% |
Affiliated Mutual Fund - Short-Term Investment (3.2% represents investments purchased with collateral from securities on loan) |
3.9% |
Oil, Gas & Consumable Fuels |
3.8% |
Insurance |
3.5% |
Biotechnology |
2.8% |
Specialty Retail |
2.6% |
Ground Transportation |
2.5% |
Automobiles |
2.3% |
Financial Services |
2.2% |
Electric Utilities |
2.0% |
Communications Equipment |
2.0% |
Capital Markets |
1.7% |
Industry Classification |
% of Net Assets |
IT Services |
1.6% |
Diversified Telecommunication Services |
1.4% |
Consumer Staples Distribution & Retail |
1.2% |
Electronic Equipment, Instruments & Components |
1.1% |
Entertainment |
1.0% |
Multi-Utilities |
1.0% |
Electrical Equipment |
0.8% |
Machinery |
0.8% |
Health Care Providers & Services |
0.7% |
Textiles, Apparel & Luxury Goods |
0.7% |
Industrial REITs |
0.7% |
Energy Equipment & Services |
0.5% |
Specialized REITs |
0.5% |
Health Care Technology |
0.5% |
Others* |
2.3% |
103.2% | |
Liabilities in excess of other assets |
(3.2)% |
100.0% |
* |
Consists of Industries that each make up less than 0.5% of the Portfolio's net assets |
WERE THERE ANY SIGNIFICANT CHANGES TO THE PORTFOLIO THIS YEAR?
The following is a summary of certain changes to the Portfolio since January 1, 2025.
■
Effective April 12, 2025, PGIM Investments LLC, the investment manager of the Portfolio, agreed to contractually waive 0.012% of its
investment management fee through June 30, 2026.
■
At a meeting of the shareholders of PSF Natural Resources Portfolio (the “Target Portfolio”) held on March 25, 2025, shareholders of the
Target Portfolio approved the reorganization of the Target Portfolio into the Portfolio (the “Reorganization”). The Reorganization was completed
on April 11, 2025.
For more complete information, you should review the Portfolio’s current prospectus including any applicable supplements, and the Portfolio’s next
prospectus, which we expect to be available by May 1, 2026, at
www.prudential.com/variableinsuranceportfolios
or by request at
(800) 346-3778.
At a meeting of the shareholders of PSF Natural Resources Portfolio (the “Target Portfolio”) held on March 25, 2025, shareholders of the
Target Portfolio approved the reorganization of the Target Portfolio into the Portfolio (the “Reorganization”). The Reorganization was completed
on April 11, 2025.
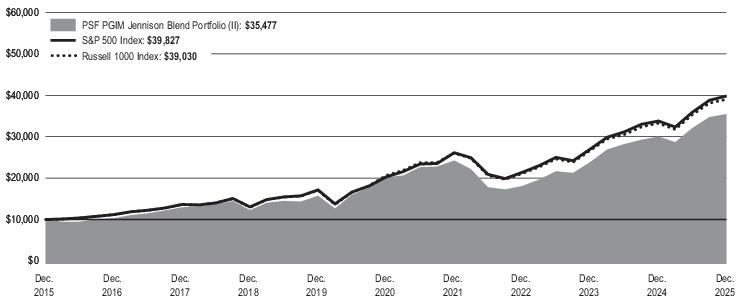
This annual shareholder report contains important information about the Class II shares of PSF PGIM Jennison Blend Portfolio (the “Portfolio”) for
the period of January 1, 2025 to December 31, 2025.
You can find additional information about the Portfolio at
www.prudential.com/variableinsuranceportfolios
. You can also request this
information by contacting us at (800) 346-3778.
WHAT WERE THE PORTFOLIO COSTS FOR THE LAST YEAR?
(Based on a hypothetical $10,000 investment)
Costs of a $10,000 investment |
Costs paid as a percentage of a $10,000 investment | |
PSF PGIM Jennison Blend Portfolio—Class II |
$94 |
0.86% |
WHAT AFFECTED THE PORTFOLIO’S PERFORMANCE DURING THE REPORTING PERIOD?
■
US equities generally posted solid gains for the reporting period, supported by investor enthusiasm around artificial intelligence (AI), resilient
corporate earnings, and three Federal Reserve rate cuts later in the period. Investor confidence remained robust, even as volatility and policy
uncertainty persisted throughout the reporting period. In broad terms, large cap stocks, represented by the Russell 1000 Index, outperformed
small cap stocks, represented by the Russell 2000 Index. Meanwhile, growth stocks, represented by the Russell 1000 Growth Index,
outperformed value stocks, represented by the Russell 1000 Value Index.
■
Positions in information technology, communication services, industrials, consumer discretionary, and financials sectors drove the Portfolio’s
solid absolute performance during the reporting period. The Portfolio outperformed its benchmark, the S&P 500 Index, for the reporting period
largely due to security selection within industrials, communication services, and consumer discretionary sectors.
■
On the downside, the Portfolio’s security selection in financials and healthcare sectors, along with an underweight to the information technology
sector, were the largest headwinds to performance relative to its S&P 500 benchmark.
Average Annual Total Returns as of December 31, 2025 | |||
One Year (%) |
Five Years (%) |
Ten Years (%) | |
Portfolio |
18.05% |
11.88% |
13.50% |
S&P 500 Index |
17.88% |
14.42% |
14.82% |
Russell 1000 Index |
17.37% |
13.59% |
14.59% |
The returns do not reflect the deduction
of applicable taxes, if any, that a shareholder would pay on Portfolio distributions or redemption of Portfolio shares.
WHAT ARE SOME KEY PORTFOLIO STATISTICS AS OF 12/31/2025?
Portfolio’s net assets |
$ 7,924,509,446 |
Number of portfolio holdings |
92 |
Total advisory fees paid for the year |
$ 32,112,759 |
Portfolio turnover rate for the year |
95% |
WHAT ARE SOME CHARACTERISTICS OF THE PORTFOLIO’S HOLDINGS AS OF 12/31/2025?
Industry Classification |
% of Net Assets |
Semiconductors & Semiconductor Equipment |
13.3% |
Interactive Media & Services |
9.3% |
Banks |
8.9% |
Software |
7.6% |
Technology Hardware, Storage & Peripherals |
7.3% |
Aerospace & Defense |
4.8% |
Broadline Retail |
4.0% |
Pharmaceuticals |
3.9% |
Affiliated Mutual Fund - Short-Term Investment (3.2% represents investments purchased with collateral from securities on loan) |
3.9% |
Oil, Gas & Consumable Fuels |
3.8% |
Insurance |
3.5% |
Biotechnology |
2.8% |
Specialty Retail |
2.6% |
Ground Transportation |
2.5% |
Automobiles |
2.3% |
Financial Services |
2.2% |
Electric Utilities |
2.0% |
Communications Equipment |
2.0% |
Capital Markets |
1.7% |
Industry Classification |
% of Net Assets |
IT Services |
1.6% |
Diversified Telecommunication Services |
1.4% |
Consumer Staples Distribution & Retail |
1.2% |
Electronic Equipment, Instruments & Components |
1.1% |
Entertainment |
1.0% |
Multi-Utilities |
1.0% |
Electrical Equipment |
0.8% |
Machinery |
0.8% |
Health Care Providers & Services |
0.7% |
Textiles, Apparel & Luxury Goods |
0.7% |
Industrial REITs |
0.7% |
Energy Equipment & Services |
0.5% |
Specialized REITs |
0.5% |
Health Care Technology |
0.5% |
Others* |
2.3% |
103.2% | |
Liabilities in excess of other assets |
(3.2)% |
100.0% |
* |
Consists of Industries that each make up less than 0.5% of the Portfolio's net assets |
WERE THERE ANY SIGNIFICANT CHANGES TO THE PORTFOLIO THIS YEAR?
The following is a summary of certain changes to the Portfolio since January 1, 2025.
■
Effective April 12, 2025, PGIM Investments LLC, the investment manager of the Portfolio, agreed to contractually waive 0.012% of its
investment management fee through June 30, 2026.
■
At a meeting of the shareholders of PSF Natural Resources Portfolio (the “Target Portfolio”) held on March 25, 2025, shareholders of the
Target Portfolio approved the reorganization of the Target Portfolio into the Portfolio (the “Reorganization”). The Reorganization was completed
on April 11, 2025.
For more complete information, you should review the Portfolio’s current prospectus including any applicable supplements, and the Portfolio’s next
prospectus, which we expect to be
available
by May 1, 2026, at www.prudential.com/variableinsuranceportfolios
or by request at
(800) 346-3778.
At a meeting of the shareholders of PSF Natural Resources Portfolio (the “Target Portfolio”) held on March 25, 2025, shareholders of the
Target Portfolio approved the reorganization of the Target Portfolio into the Portfolio (the “Reorganization”). The Reorganization was completed
on April 11, 2025.
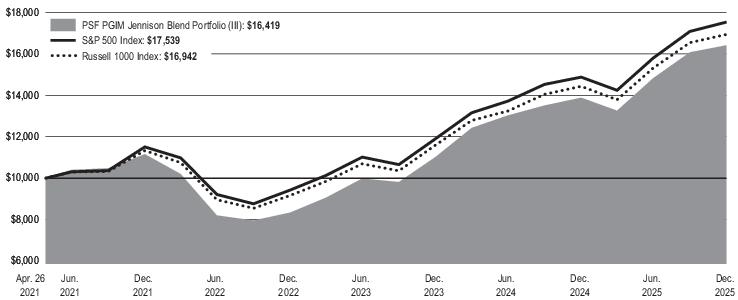
This annual shareholder report contains important information about the Class III shares of PSF PGIM Jennison Blend Portfolio (the “Portfolio”)
for the period of January 1, 2025 to December 31, 2025.
You can find additional information about the Portfolio at
www.prudential.com/variableinsuranceportfolios
. You can also request this
information by contacting us at (800) 346-3778.
WHAT WERE THE PORTFOLIO COSTS FOR THE LAST YEAR?
(Based on a hypothetical $10,000 investment)
Costs of a $10,000 investment |
Costs paid as a percentage of a $10,000 investment | |
PSF PGIM Jennison Blend Portfolio—Class III |
$77 |
0.71% |
WHAT AFFECTED THE PORTFOLIO’S PERFORMANCE DURING THE REPORTING PERIOD?
■
US equities generally posted solid gains for the reporting period, supported by investor enthusiasm around artificial intelligence (AI), resilient
corporate earnings, and three Federal Reserve rate cuts later in the period. Investor confidence remained robust, even as volatility and policy
uncertainty persisted throughout the reporting period. In broad terms, large cap stocks, represented by the Russell 1000 Index, outperformed
small cap stocks, represented by the Russell 2000 Index. Meanwhile, growth stocks, represented by the Russell 1000 Growth Index,
outperformed value stocks, represented by the Russell 1000 Value Index.
■
Positions in information technology, communication services, industrials, consumer discretionary, and financials sectors drove the Portfolio’s
solid absolute performance during the reporting period. The Portfolio outperformed its benchmark, the S&P 500 Index, for the reporting period
largely due to security selection within industrials, communication services, and consumer discretionary sectors.
■
On the downside, the Portfolio’s security selection in financials and healthcare sectors, along with an underweight to the information technology
sector, were the largest headwinds to performance relative to its S&P 500 benchmark.
Average Annual Total Returns as of December 31, 2025 | ||
One Year (%) |
Since Inception (%) | |
Portfolio |
18.23% |
11.16% |
S&P 500 Index |
17.88% |
12.79% |
Russell 1000 Index |
17.37% |
11.96% |
Portfolio Inception: 04/26/2021.
Since Inception returns are provided because the Portfolio has less than 10 fiscal years of returns. Since Inception returns for the Indexes are
measured from the closest month-end to the Portfolio’s inception date.
The returns do not reflect the deduction
of applicable taxes, if any, that a shareholder would pay on Portfolio distributions or redemption of Portfolio shares.
WHAT ARE SOME KEY PORTFOLIO STATISTICS AS OF 12/31/2025?
Portfolio’s net assets |
$ 7,924,509,446 |
Number of portfolio holdings |
92 |
Total advisory fees paid for the year |
$ 32,112,759 |
Portfolio turnover rate for the year |
95% |
WHAT ARE SOME CHARACTERISTICS OF THE PORTFOLIO’S HOLDINGS AS OF 12/31/2025?
Industry Classification |
% of Net Assets |
Semiconductors & Semiconductor Equipment |
13.3% |
Interactive Media & Services |
9.3% |
Banks |
8.9% |
Software |
7.6% |
Technology Hardware, Storage & Peripherals |
7.3% |
Aerospace & Defense |
4.8% |
Broadline Retail |
4.0% |
Pharmaceuticals |
3.9% |
Affiliated Mutual Fund - Short-Term Investment (3.2% represents investments purchased with collateral from securities on loan) |
3.9% |
Oil, Gas & Consumable Fuels |
3.8% |
Insurance |
3.5% |
Biotechnology |
2.8% |
Specialty Retail |
2.6% |
Ground Transportation |
2.5% |
Automobiles |
2.3% |
Financial Services |
2.2% |
Electric Utilities |
2.0% |
Communications Equipment |
2.0% |
Capital Markets |
1.7% |
Industry Classification |
% of Net Assets |
IT Services |
1.6% |
Diversified Telecommunication Services |
1.4% |
Consumer Staples Distribution & Retail |
1.2% |
Electronic Equipment, Instruments & Components |
1.1% |
Entertainment |
1.0% |
Multi-Utilities |
1.0% |
Electrical Equipment |
0.8% |
Machinery |
0.8% |
Health Care Providers & Services |
0.7% |
Textiles, Apparel & Luxury Goods |
0.7% |
Industrial REITs |
0.7% |
Energy Equipment & Services |
0.5% |
Specialized REITs |
0.5% |
Health Care Technology |
0.5% |
Others* |
2.3% |
103.2% | |
Liabilities in excess of other assets |
(3.2)% |
100.0% |
* |
Consists of Industries that each make up less than 0.5% of the Portfolio's net assets |
WERE THERE ANY SIGNIFICANT CHANGES TO THE PORTFOLIO THIS YEAR?
The following is a summary of certain changes to the Portfolio since January 1, 2025.
■
Effective April 12, 2025, PGIM Investments LLC, the investment manager of the Portfolio, agreed to contractually waive 0.012% of its
investment management fee through June 30, 2026.
■
At a meeting of the shareholders of PSF Natural Resources Portfolio (the “Target Portfolio”) held on March 25, 2025, shareholders of the
Target Portfolio approved the reorganization of the Target Portfolio into the Portfolio (the “Reorganization”). The Reorganization was completed
on April 11, 2025.
For more complete information, you should review the
Portfolio’s
current prospectus including any applicable supplements, and the Portfolio’s next prospectus, which we expect to be available by May 1, 2026, at
www.prudential.com/variableinsuranceportfolios
or by request at
(800) 346-3778.
At a meeting of the shareholders of PSF Natural Resources Portfolio (the “Target Portfolio”) held on March 25, 2025, shareholders of the
Target Portfolio approved the reorganization of the Target Portfolio into the Portfolio (the “Reorganization”). The Reorganization was completed
on April 11, 2025.
This annual shareholder report contains important information about the Class I shares of PSF PGIM Jennison Growth Portfolio (the “Portfolio”)
for the period of January 1, 2025 to December 31, 2025.
You can find additional information about the Portfolio at
www.prudential.com/variableinsuranceportfolios
. You can also request this
information by contacting us at (800) 346-3778.
WHAT WERE THE PORTFOLIO COSTS FOR THE LAST YEAR?
(Based on a hypothetical $10,000 investment)
Costs of a $10,000 investment |
Costs paid as a percentage of a $10,000 investment | |
PSF PGIM Jennison Growth Portfolio—Class I |
$65 |
0.61% |
WHAT AFFECTED THE PORTFOLIO’S PERFORMANCE DURING THE REPORTING PERIOD?
■
US equities posted solid gains for the reporting period, supported by investor enthusiasm around artificial intelligence (AI), resilient corporate
earnings, and three Federal Reserve rate cuts later in the period. Volatility picked up late in the year amid renewed questions about AI-related
investment and elevated valuations, but moderating economic growth and ongoing adoption of AI technologies helped sustain investor
confidence and risk appetite.
■
Positions in the information technology, communication services, and industrials sectors were the largest contributors to the Portfolio’s solid
absolute performance during the reporting period. Relative to the Russell 1000 Growth Index, security selection within the industrials and
consumer staples sectors added the most value. The Portfolio’s overweight allocation to the communication services sector also benefited
relative Portfolio performance.
■
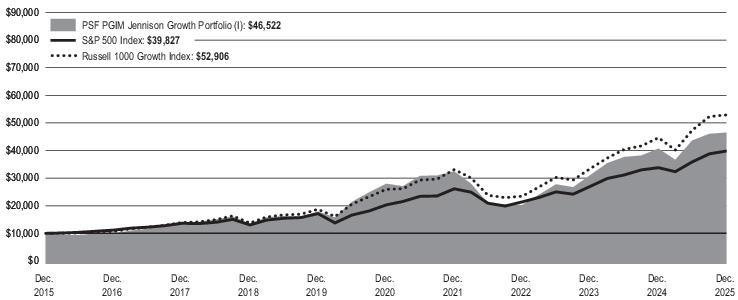
While the Portfolio delivered solid absolute performance in 2025, returns lagged the Russell 1000 Growth Index for the reporting period.
Relative underperformance was largely driven by stock selection in the information technology, communication services, and healthcare
sectors. The Portfolio’s underweight allocation to the technology sector and overweight allocation to the consumer discretionary sector also
acted as headwinds to relative returns during the reporting period.
Average Annual Total Returns as of December 31, 2025 | |||
One Year (%) |
Five Years (%) |
Ten Years (%) | |
Portfolio |
14.27% |
10.69% |
16.62% |
S&P 500 Index |
17.88% |
14.42% |
14.82% |
Russell 1000 Growth Index |
18.56% |
15.32% |
18.13% |
The returns do not reflect the deduction
of applicable taxes, if any, that a shareholder would pay on Portfolio distributions or redemption of Portfolio shares.
WHAT ARE SOME KEY PORTFOLIO STATISTICS AS OF 12/31/2025?
Portfolio’s net assets |
$ 4,667,442,797 |
Number of portfolio holdings |
48 |
Total advisory fees paid for the year |
$ 25,148,316 |
Portfolio turnover rate for the year |
34% |
WHAT ARE SOME CHARACTERISTICS OF THE PORTFOLIO’S HOLDINGS AS OF 12/31/2025?
Industry Classification |
% of Net Assets |
Semiconductors & Semiconductor Equipment |
19.4% |
Software |
14.1% |
Interactive Media & Services |
11.2% |
Broadline Retail |
7.9% |
Technology Hardware, Storage & Peripherals |
5.8% |
Financial Services |
5.3% |
Entertainment |
5.1% |
Pharmaceuticals |
4.7% |
Aerospace & Defense |
4.2% |
Automobiles |
4.0% |
Consumer Staples Distribution & Retail |
3.2% |
IT Services |
3.1% |
Health Care Equipment & Supplies |
3.0% |
Electric Utilities |
1.8% |
Industry Classification |
% of Net Assets |
Affiliated Mutual Fund - Short-Term Investment (0.8% represents investments purchased with collateral from securities on loan) |
1.6% |
Specialty Retail |
1.6% |
Capital Markets |
1.3% |
Biotechnology |
1.2% |
Electronic Equipment, Instruments & Components |
1.1% |
Hotels, Restaurants & Leisure |
0.9% |
Others* |
0.3% |
100.8% | |
Liabilities in excess of other assets |
(0.8)% |
100.0% |
* |
Consists of Industries that each make up less than 0.5% of the Portfolio's net assets |
WERE THERE ANY SIGNIFICANT CHANGES TO THE PORTFOLIO THIS YEAR?
The following is a summary of certain changes to the Portfolio since January 1, 2025.
■
Effective April 12, 2025, PGIM Investments LLC, the investment manager of the Portfolio, agreed to contractually waive 0.015% of its
investment management fee through June 30, 2026.
■
At a meeting of the shareholders of PSF Mid-Cap Growth Portfolio (the “Target Portfolio”) held on March 25, 2025, shareholders of the Target
Portfolio approved the reorganization of the Target Portfolio into the Portfolio (the “Reorganization”). The Reorganization was completed on
April 11, 2025.
For more complete information, you should review the Portfolio’s current prospectus including any applicable supplements, and the Portfolio’s next
prospectus, which we expect to be available by May 1, 2026, at
www.prudential.com/variableinsuranceportfolios
or by request at
(800) 346-3778.
At a meeting of the shareholders of PSF Mid-Cap Growth Portfolio (the “Target Portfolio”) held on March 25, 2025, shareholders of the Target
Portfolio approved the reorganization of the Target Portfolio into the Portfolio (the “Reorganization”). The Reorganization was completed on
April 11, 2025.
This annual shareholder report contains important information about the Class II shares of PSF PGIM Jennison Growth Portfolio (the “Portfolio”)
for the period of January 1, 2025 to December 31, 2025.
You can find additional information about the Portfolio at
www.prudential.com/variableinsuranceportfolios
. You can also request this
information by contacting us at (800) 346-3778.
WHAT WERE THE PORTFOLIO COSTS FOR THE LAST YEAR?
(Based on a hypothetical $10,000 investment)
Costs of a $10,000 investment |
Costs paid as a percentage of a $10,000 investment | |
PSF PGIM Jennison Growth Portfolio—Class II |
$108 |
1.01% |
WHAT AFFECTED THE PORTFOLIO’S PERFORMANCE DURING THE REPORTING PERIOD?
■
US equities posted solid gains for the reporting period, supported by investor enthusiasm around artificial intelligence (AI), resilient corporate
earnings, and three Federal Reserve rate cuts later in the period. Volatility picked up late in the year amid renewed questions about AI-related
investment and elevated valuations, but moderating economic growth and ongoing adoption of AI technologies helped sustain investor
confidence and risk appetite.
■
Positions in the information technology, communication services, and industrials sectors were the largest contributors to the Portfolio’s solid
absolute performance during the reporting period. Relative to the Russell 1000 Growth Index, security selection within the industrials and
consumer staples sectors added the most value. The Portfolio’s overweight allocation to the communication services sector also benefited
relative Portfolio performance.
■
While the Portfolio delivered solid absolute performance in 2025, returns lagged the Russell 1000 Growth Index for the reporting period.
Relative underperformance was largely driven by stock selection in the information technology, communication services, and healthcare
sectors. The Portfolio’s underweight allocation to the technology sector and overweight allocation to the consumer discretionary sector also
acted as headwinds to relative returns during the reporting period.
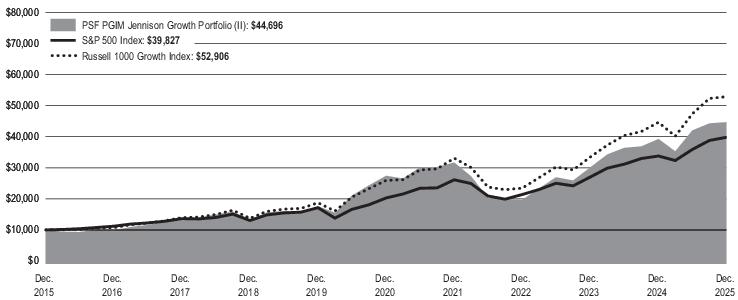
Average Annual Total Returns as of December 31, 2025 | |||
One Year (%) |
Five Years (%) |
Ten Years (%) | |
Portfolio |
13.81% |
10.25% |
16.15% |
S&P 500 Index |
17.88% |
14.42% |
14.82% |
Russell 1000 Growth Index |
18.56% |
15.32% |
18.13% |
The returns do not reflect the deduction
of applicable taxes, if any, that a shareholder would pay on Portfolio distributions or redemption of Portfolio shares.
WHAT ARE SOME KEY PORTFOLIO STATISTICS AS OF 12/31/2025?
Portfolio’s net assets |
$ 4,667,442,797 |
Number of portfolio holdings |
48 |
Total advisory fees paid for the year |
$ 25,148,316 |
Portfolio turnover rate for the year |
34% |
WHAT ARE SOME CHARACTERISTICS OF THE PORTFOLIO’S HOLDINGS AS OF 12/31/2025?
Industry Classification |
% of Net Assets |
Semiconductors & Semiconductor Equipment |
19.4% |
Software |
14.1% |
Interactive Media & Services |
11.2% |
Broadline Retail |
7.9% |
Technology Hardware, Storage & Peripherals |
5.8% |
Financial Services |
5.3% |
Entertainment |
5.1% |
Pharmaceuticals |
4.7% |
Aerospace & Defense |
4.2% |
Automobiles |
4.0% |
Consumer Staples Distribution & Retail |
3.2% |
IT Services |
3.1% |
Health Care Equipment & Supplies |
3.0% |
Electric Utilities |
1.8% |
Industry Classification |
% of Net Assets |
Affiliated Mutual Fund - Short-Term Investment (0.8% represents investments purchased with collateral from securities on loan) |
1.6% |
Specialty Retail |
1.6% |
Capital Markets |
1.3% |
Biotechnology |
1.2% |
Electronic Equipment, Instruments & Components |
1.1% |
Hotels, Restaurants & Leisure |
0.9% |
Others* |
0.3% |
100.8% | |
Liabilities in excess of other assets |
(0.8)% |
100.0% |
* |
Consists of Industries that each make up less than 0.5% of the Portfolio's net assets |
WERE THERE ANY SIGNIFICANT CHANGES TO THE PORTFOLIO THIS YEAR?
The following is a summary of certain changes to the Portfolio since
January 1, 2025
.■
Effective April 12, 2025, PGIM Investments LLC, the investment manager of the Portfolio, agreed to contractually waive 0.015% of its
investment management fee through June 30, 2026.
■
At a meeting of the shareholders of PSF Mid-Cap Growth Portfolio (the “Target Portfolio”) held on March 25, 2025, shareholders of the Target
Portfolio approved the reorganization of the Target Portfolio into the Portfolio (the “Reorganization”). The Reorganization was completed on
April 11, 2025.
For more complete information, you should review the Portfolio’s current prospectus including any applicable supplements, and the Portfolio’s next
prospectus, which we expect to be available by May 1, 2026, at
www.prudential.com/variableinsuranceportfolios
or by request at
(800) 346-3778.
At a meeting of the shareholders of PSF Mid-Cap Growth Portfolio (the “Target Portfolio”) held on March 25, 2025, shareholders of the Target
Portfolio approved the reorganization of the Target Portfolio into the Portfolio (the “Reorganization”). The Reorganization was completed on
April 11, 2025.
This annual shareholder report contains important information about the Class III shares of PSF PGIM Jennison Growth Portfolio (the “Portfolio”)
for the period of January 1, 2025 to December 31, 2025.
You can find additional information about the Portfolio at
www.prudential.com/variableinsuranceportfolios
. You can also request this
information by contacting us at (800) 346-3778.
WHAT WERE THE PORTFOLIO COSTS FOR THE LAST YEAR?
(Based on a hypothetical $10,000 investment)
Costs of a $10,000 investment |
Costs paid as a percentage of a $10,000 investment | |
PSF PGIM Jennison Growth Portfolio—Class III |
$92 |
0.86% |
WHAT AFFECTED THE PORTFOLIO’S PERFORMANCE DURING THE REPORTING PERIOD?
■
US equities posted solid gains for the reporting period, supported by investor enthusiasm around artificial intelligence (AI), resilient corporate
earnings, and three Federal Reserve rate cuts later in the period. Volatility picked up late in the year amid renewed questions about AI-related
investment and elevated valuations, but moderating economic growth and ongoing adoption of AI technologies helped sustain investor
confidence and risk appetite.
■
Positions in the information technology, communication services, and industrials sectors were the largest contributors to the Portfolio’s solid
absolute performance during the reporting period. Relative to the Russell 1000 Growth Index, security selection within the industrials and
consumer staples sectors added the most value. The Portfolio’s overweight allocation to the communication services sector also benefited
relative Portfolio performance.
■
While the Portfolio delivered solid absolute performance in 2025, returns lagged the Russell 1000 Growth Index for the reporting period.
Relative underperformance was largely driven by stock selection in the information technology, communication services, and healthcare
sectors. The Portfolio’s underweight allocation to the technology sector and overweight allocation to the consumer discretionary sector also
acted as headwinds to relative returns during the reporting period.
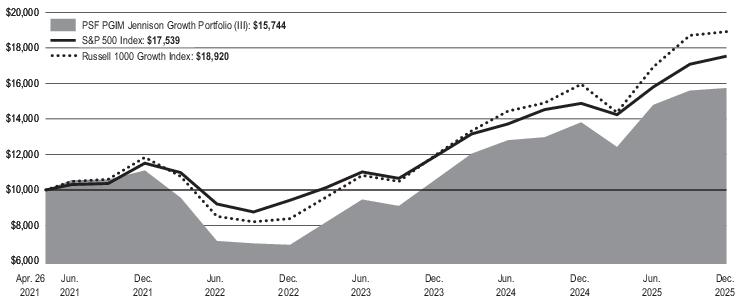
Average Annual Total Returns as of December 31, 2025 | ||
One Year (%) |
Since Inception (%) | |
Portfolio |
13.98% |
10.17% |
S&P 500 Index |
17.88% |
12.79% |
Russell 1000 Growth Index |
18.56% |
14.64% |
Portfolio Inception: 04/26/2021.
Since Inception returns are provided because the Portfolio has less than 10 fiscal years of returns. Since Inception returns for the Indexes are
measured from the closest month-end to the Portfolio’s inception date.
The returns do not reflect the deduction
of applicable taxes, if any, that a shareholder would pay on Portfolio distributions or redemption of Portfolio shares.
WHAT ARE SOME KEY PORTFOLIO STATISTICS AS OF 12/31/2025?
Portfolio’s net assets |
$ 4,667,442,797 |
Number of portfolio holdings |
48 |
Total advisory fees paid for the year |
$ 25,148,316 |
Portfolio turnover rate for the year |
34% |
WHAT ARE SOME CHARACTERISTICS OF THE PORTFOLIO’S HOLDINGS AS OF 12/31/2025?
Industry Classification |
% of Net Assets |
Semiconductors & Semiconductor Equipment |
19.4% |
Software |
14.1% |
Interactive Media & Services |
11.2% |
Broadline Retail |
7.9% |
Technology Hardware, Storage & Peripherals |
5.8% |
Financial Services |
5.3% |
Entertainment |
5.1% |
Pharmaceuticals |
4.7% |
Aerospace & Defense |
4.2% |
Automobiles |
4.0% |
Consumer Staples Distribution & Retail |
3.2% |
IT Services |
3.1% |
Health Care Equipment & Supplies |
3.0% |
Electric Utilities |
1.8% |
Industry Classification |
% of Net Assets |
Affiliated Mutual Fund - Short-Term Investment (0.8% represents investments purchased with collateral from securities on loan) |
1.6% |
Specialty Retail |
1.6% |
Capital Markets |
1.3% |
Biotechnology |
1.2% |
Electronic Equipment, Instruments & Components |
1.1% |
Hotels, Restaurants & Leisure |
0.9% |
Others* |
0.3% |
100.8% | |
Liabilities in excess of other assets |
(0.8)% |
100.0% |
* |
Consists of Industries that each make up less than 0.5% of the Portfolio's net assets |
WERE THERE ANY SIGNIFICANT CHANGES TO THE PORTFOLIO THIS YEAR?
The following is a summary of certain changes to the Portfolio since January 1, 2025.
■
Effective April 12, 2025, PGIM Investments LLC, the investment manager of the Portfolio, agreed to contractually waive 0.015% of its
investment management fee through June 30, 2026.
■
At a meeting of the shareholders of PSF Mid-Cap Growth Portfolio (the “Target Portfolio”) held on March 25, 2025, shareholders of the Target
Portfolio approved the reorganization of the Target Portfolio into the Portfolio (the “Reorganization”). The Reorganization was completed on
April 11, 2025.
For more complete information, you should review the Portfolio’s current prospectus including any applicable supplements, and the Portfolio’s next
prospectus, which we expect to be available by May 1, 2026, at
www.prudential.com/variableinsuranceportfolios
or by request at
(800) 346-3778.
At a meeting of the shareholders of PSF Mid-Cap Growth Portfolio (the “Target Portfolio”) held on March 25, 2025, shareholders of the Target
Portfolio approved the reorganization of the Target Portfolio into the Portfolio (the “Reorganization”). The Reorganization was completed on
April 11, 2025.
This annual shareholder report contains important information about the Class I shares of PSF PGIM Jennison Value Portfolio (the “Portfolio”) for
the period of January 1, 2025 to December 31, 2025.
You can find additional information about the Portfolio at
www.prudential.com/variableinsuranceportfolios
. You can also request this
information by contacting us at (800) 346-3778.
WHAT WERE THE PORTFOLIO COSTS FOR THE LAST YEAR?
(Based on a hypothetical $10,000 investment)
Costs of a $10,000 investment |
Costs paid as a percentage of a $10,000 investment | |
PSF PGIM Jennison Value Portfolio—Class I |
$47 |
0.43% |
WHAT AFFECTED THE PORTFOLIO’S PERFORMANCE DURING THE REPORTING PERIOD?
■
US equities generally posted strong gains for the reporting period, supported by investor enthusiasm regarding artificial intelligence
(AI) investment, resilient corporate earnings, and three Federal Reserve rate cuts late in the period. Investor confidence and risk appetite
remained robust, even as volatility and policy uncertainty persisted. For the year, the Russell 1000 Value Index posted solid gains but lagged
the Russell 1000 Growth Index.
■
Security selection in the industrials, financials, information technology, and consumer sectors was the main contributor to absolute
performance. The Portfolio outperformed the Russell 1000 Value Index, driven by positions in the industrials and consumer sectors.
■
On the downside, the Portfolio’s security selection in the information technology and utilities sectors detracted most from relative performance.
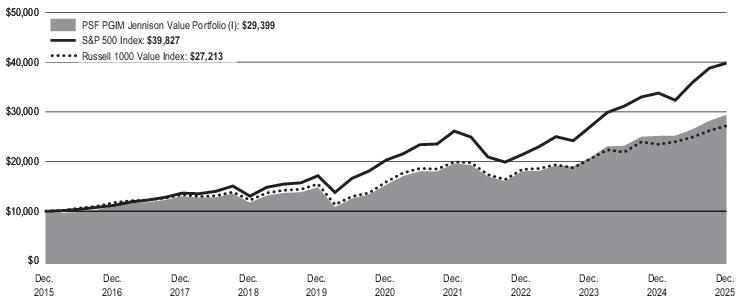
Average Annual Total Returns as of December 31, 2025 | |||
One Year (%) |
Five Years (%) |
Ten Years (%) | |
Portfolio |
16.88% |
13.90% |
11.39% |
S&P 500 Index |
17.88% |
14.42% |
14.82% |
Russell 1000 Value Index |
15.91% |
11.33% |
10.53% |
The returns do not reflect the deduction
of applicable taxes, if any, that a shareholder would pay on Portfolio distributions or redemption of Portfolio shares.
WHAT ARE SOME KEY PORTFOLIO STATISTICS AS OF 12/31/2025?
Portfolio’s net assets |
$ 2,052,594,529 |
Number of portfolio holdings |
67 |
Total advisory fees paid for the year |
$ 7,575,141 |
Portfolio turnover rate for the year |
38% |
WHAT ARE SOME CHARACTERISTICS OF THE PORTFOLIO’S HOLDINGS AS OF 12/31/2025?
Industry Classification |
% of Net Assets |
Banks |
12.3% |
Oil, Gas & Consumable Fuels |
7.8% |
Aerospace & Defense |
7.3% |
Semiconductors & Semiconductor Equipment |
6.5% |
Pharmaceuticals |
5.3% |
Multi-Utilities |
5.2% |
Insurance |
5.0% |
Interactive Media & Services |
5.0% |
Affiliated Mutual Fund - Short-Term Investment (3.9% represents investments purchased with collateral from securities on loan) |
4.8% |
Consumer Staples Distribution & Retail |
3.6% |
Capital Markets |
3.6% |
Machinery |
3.0% |
Automobiles |
2.4% |
Software |
2.3% |
Communications Equipment |
2.2% |
Personal Care Products |
2.2% |
Chemicals |
2.0% |
Building Products |
1.9% |
Industrial Conglomerates |
1.7% |
Entertainment |
1.7% |
Industry Classification |
% of Net Assets |
Residential REITs |
1.6% |
Broadline Retail |
1.5% |
Household Durables |
1.4% |
Ground Transportation |
1.3% |
Specialized REITs |
1.3% |
Biotechnology |
1.3% |
Technology Hardware, Storage & Peripherals |
1.2% |
Specialty Retail |
1.2% |
Industrial REITs |
1.2% |
Trading Companies & Distributors |
1.1% |
Hotels, Restaurants & Leisure |
1.0% |
Health Care Providers & Services |
0.9% |
Health Care Equipment & Supplies |
0.9% |
IT Services |
0.8% |
Electric Utilities |
0.7% |
Beverages |
0.7% |
103.9% | |
Liabilities in excess of other assets |
(3.9)% |
100.0% |
This annual shareholder report contains important information about the Class II shares of PSF PGIM Jennison Value Portfolio (the “Portfolio”) for
the period of January 1, 2025 to December 31, 2025.
You can find additional information about the Portfolio at
www.prudential.com/variableinsuranceportfolios
. You can also request this
information by contacting us at (800) 346-3778.
WHAT WERE THE PORTFOLIO COSTS FOR THE LAST YEAR?
(Based on a hypothetical $10,000 investment)
Costs of a $10,000 investment |
Costs paid as a percentage of a $10,000 investment | |
PSF PGIM Jennison Value Portfolio—Class II |
$90 |
0.83% |
WHAT AFFECTED THE PORTFOLIO’S PERFORMANCE DURING THE REPORTING PERIOD?
■
US equities generally posted strong gains for the reporting period, supported by investor enthusiasm regarding artificial intelligence
(AI) investment, resilient corporate earnings, and three Federal Reserve rate cuts late in the period. Investor confidence and risk appetite
remained robust, even as volatility and policy uncertainty persisted. For the year, the Russell 1000 Value Index posted solid gains but lagged
the Russell 1000 Growth Index.
■
Security selection in the industrials, financials, information technology, and consumer sectors was the main contributor to absolute
performance. The Portfolio outperformed the Russell 1000 Value Index, driven by positions in the industrials and consumer sectors.
■
On the downside, the Portfolio’s security selection in the information technology and utilities sectors detracted most from relative performance.

Average Annual Total Returns as of December 31, 2025 | |||
One Year (%) |
Five Years (%) |
Ten Years (%) | |
Portfolio |
16.41% |
13.45% |
10.94% |
S&P 500 Index |
17.88% |
14.42% |
14.82% |
Russell 1000 Value Index |
15.91% |
11.33% |
10.53% |
The returns do not reflect the deduction
of applicable taxes, if any, that a shareholder would pay on Portfolio distributions or redemption of Portfolio shares.
WHAT ARE SOME KEY PORTFOLIO STATISTICS AS OF 12/31/2025?
Portfolio’s net assets |
$ 2,052,594,529 |
Number of portfolio holdings |
67 |
Total advisory fees paid for the year |
$ 7,575,141 |
Portfolio turnover rate for the year |
38% |
WHAT ARE SOME CHARACTERISTICS OF THE PORTFOLIO’S HOLDINGS AS OF 12/31/2025?
Industry Classification |
% of Net Assets |
Banks |
12.3% |
Oil, Gas & Consumable Fuels |
7.8% |
Aerospace & Defense |
7.3% |
Semiconductors & Semiconductor Equipment |
6.5% |
Pharmaceuticals |
5.3% |
Multi-Utilities |
5.2% |
Insurance |
5.0% |
Interactive Media & Services |
5.0% |
Affiliated Mutual Fund - Short-Term Investment (3.9% represents investments purchased with collateral from securities on loan) |
4.8% |
Consumer Staples Distribution & Retail |
3.6% |
Capital Markets |
3.6% |
Machinery |
3.0% |
Automobiles |
2.4% |
Software |
2.3% |
Communications Equipment |
2.2% |
Personal Care Products |
2.2% |
Chemicals |
2.0% |
Building Products |
1.9% |
Industrial Conglomerates |
1.7% |
Entertainment |
1.7% |
Industry Classification |
% of Net Assets |
Residential REITs |
1.6% |
Broadline Retail |
1.5% |
Household Durables |
1.4% |
Ground Transportation |
1.3% |
Specialized REITs |
1.3% |
Biotechnology |
1.3% |
Technology Hardware, Storage & Peripherals |
1.2% |
Specialty Retail |
1.2% |
Industrial REITs |
1.2% |
Trading Companies & Distributors |
1.1% |
Hotels, Restaurants & Leisure |
1.0% |
Health Care Providers & Services |
0.9% |
Health Care Equipment & Supplies |
0.9% |
IT Services |
0.8% |
Electric Utilities |
0.7% |
Beverages |
0.7% |
103.9% | |
Liabilities in excess of other assets |
(3.9)% |
100.0% |
This annual shareholder report contains important information about the Class III shares of PSF PGIM Jennison Value Portfolio (the “Portfolio”)
for the period of January 1, 2025 to December 31, 2025.
You can find additional information about the Portfolio at
www.prudential.com/variableinsuranceportfolios
. You can also request this
information by contacting us at (800) 346-3778.
WHAT WERE THE PORTFOLIO COSTS FOR THE LAST YEAR?
(Based on a hypothetical $10,000 investment)
| |
Costs of a $10,000 investment |
Costs paid as a percentage of a $10,000 investment |
| PSF PGIM Jennison Value Portfolio—Class III |
$74 |
0.68% |
WHAT AFFECTED THE PORTFOLIO’S PERFORMANCE DURING THE REPORTING PERIOD?
■
US equities generally posted strong gains for the reporting period, supported by investor enthusiasm regarding artificial intelligence
(AI) investment, resilient corporate earnings, and three Federal Reserve rate cuts late in the period. Investor confidence and risk appetite
remained robust, even as volatility and policy uncertainty persisted. For the year, the Russell 1000 Value Index posted solid gains but lagged
the Russell 1000 Growth Index.
■
Security selection in the industrials, financials, information technology, and consumer sectors was the main contributor to absolute
performance. The Portfolio outperformed the Russell 1000 Value Index, driven by positions in the industrials and consumer sectors.
■
On the downside, the Portfolio’s security selection in the information technology and utilities sectors detracted most from relative performance.
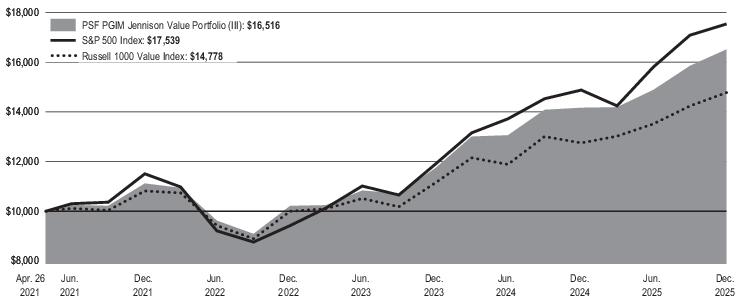
| Average Annual Total Returns as of December 31, 2025 | ||
| |
One Year (%) |
Since Inception (%) |
Portfolio |
16.59% |
11.30% |
S&P 500 Index |
17.88% |
12.79% |
Russell 1000 Value Index |
15.91% |
8.73% |
Portfolio Inception: 04/26/2021.
Since Inception returns are provided because the Portfolio has less than 10 fiscal years of returns. Since Inception returns for the Indexes are
measured from the closest month-end to the Portfolio’s inception date.
The returns do not reflect the deduction
of applicable taxes, if any, that a shareholder would pay on Portfolio distributions or redemption of Portfolio shares.
WHAT ARE SOME KEY PORTFOLIO STATISTICS AS OF 12/31/2025?
| Portfolio’s net assets |
$ 2,052,594,529 |
| Number of portfolio holdings |
67 |
| Total advisory fees paid for the year |
$ 7,575,141 |
| Portfolio turnover rate for the year |
38% |
WHAT ARE SOME CHARACTERISTICS OF THE PORTFOLIO’S HOLDINGS AS OF 12/31/2025?
| Industry Classification |
% of Net Assets |
| Banks |
12.3% |
| Oil, Gas & Consumable Fuels |
7.8% |
| Aerospace & Defense |
7.3% |
| Semiconductors & Semiconductor Equipment |
6.5% |
| Pharmaceuticals |
5.3% |
| Multi-Utilities |
5.2% |
| Insurance |
5.0% |
| Interactive Media & Services |
5.0% |
| Affiliated Mutual Fund - Short-Term Investment (3.9% represents investments purchased with collateral from securities on loan) |
4.8% |
| Consumer Staples Distribution & Retail |
3.6% |
| Capital Markets |
3.6% |
| Machinery |
3.0% |
| Automobiles |
2.4% |
| Software |
2.3% |
| Communications Equipment |
2.2% |
| Personal Care Products |
2.2% |
| Chemicals |
2.0% |
| Building Products |
1.9% |
| Industrial Conglomerates |
1.7% |
| Entertainment |
1.7% |
| Industry Classification |
% of Net Assets |
| Residential REITs |
1.6% |
| Broadline Retail |
1.5% |
| Household Durables |
1.4% |
| Ground Transportation |
1.3% |
| Specialized REITs |
1.3% |
| Biotechnology |
1.3% |
| Technology Hardware, Storage & Peripherals |
1.2% |
| Specialty Retail |
1.2% |
| Industrial REITs |
1.2% |
| Trading Companies & Distributors |
1.1% |
| Hotels, Restaurants & Leisure |
1.0% |
| Health Care Providers & Services |
0.9% |
| Health Care Equipment & Supplies |
0.9% |
| IT Services |
0.8% |
| Electric Utilities |
0.7% |
| Beverages |
0.7% |
| |
103.9% |
| Liabilities in excess of other assets |
(3.9)% |
| |
100.0% |
This annual shareholder report contains important information about the Class III shares of PSF PGIM Laddered Allocation S&P 500 Buffer 12
Portfolio (the “Portfolio”) for the period of June 18, 2025 to December 31, 2025.
You can find additional information about the Portfolio at
www.prudential.com/variableinsuranceportfolios
. You can also request this
information by contacting us at (800) 346-3778.
WHAT WERE THE PORTFOLIO COSTS FOR THE LAST YEAR?
(Based on a hypothetical $10,000 investment)
Costs of a $10,000 investment |
Costs paid as a percentage of a $10,000 investment | |
PSF PGIM Laddered Allocation S&P 500 Buffer 12 Portfolio—Class III |
$48 |
0.85% |
WHAT AFFECTED THE PORTFOLIO’S PERFORMANCE DURING THE REPORTING PERIOD?
■
The Portfolio buys and holds an equal-weighted portfolio of the 12 PGIM Large-Cap Buffer 12% ETFs (January to December) (each, an
“Underlying ETF”). The Portfolio itself does not directly invest in any derivatives and does not provide any stated buffer against losses. Because
each Underlying ETF invests substantially all of its assets in customized equity or index option contracts known as Flexible Exchange Options
(FLEX Options) on the SPDR S&P 500 ETF Trust (SPY), each Underlying ETF’s performance is primarily driven by the SPY, although other
factors like changes in volatility or interest rates can impact the value of the FLEX Options.
■
Robust earnings growth and expectations that the artificial intelligence (AI) boom would fuel future growth helped boost US stocks during the
reporting period. The announcement of “Liberation Day” tariffs by the US administration in April 2025 triggered a sharp selloff in US stocks.
However, as the administration softened its position on its trade and tariff policies, US equity markets recovered and gained additional ground
through the end of the reporting period. In addition, US equities benefited from the Federal Reserve’s decision to lower policy rates towards the
end of the year.
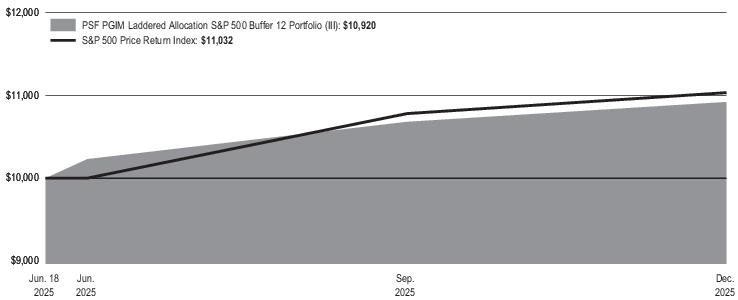
Total Returns as of December 31, 2025 | |
Since Inception (%) | |
Portfolio |
9.20% |
S&P 500 Price Return Index |
10.32% |
Portfolio Inception: 06/18/2025
Since Inception returns are provided because the Portfolio has less than 10 fiscal years of returns. Since Inception returns for the Indexes are
measured from the closest month-end to the Portfolio’s inception date.
The returns do not reflect the deduction
of applicable taxes, if any, that a shareholder would pay on Portfolio distributions or redemption of Portfolio shares.
WHAT ARE SOME KEY PORTFOLIO STATISTICS AS OF 12/31/2025?
Portfolio’s net assets |
$ 517,586 |
Number of portfolio holdings |
13 |
Total advisory fees paid for the year |
$ 0 |
Portfolio turnover rate for the year |
20% |
WHAT ARE SOME CHARACTERISTICS OF THE PORTFOLIO’S HOLDINGS AS OF 12/31/2025?
Industry Classification |
% of Net Assets |
Affiliated Exchange-Traded Funds - Equity |
96.3% |
Affiliated Mutual Fund - Short-Term Investment |
0.2% |
96.5% | |
Other assets in excess of liabilities |
3.5% |
100.0% |
This annual shareholder report contains important information about the Class III shares of PSF PGIM Laddered Allocation S&P 500 Buffer 20
Portfolio (the “Portfolio”) for the period of June 18, 2025 to December 31, 2025.
You can find additional information about the Portfolio at
www.prudential.com/variableinsuranceportfolios
. You can also request this
information by contacting us at (800) 346-3778.
WHAT WERE THE PORTFOLIO COSTS FOR THE LAST YEAR?
(Based on a hypothetical $10,000 investment)
Costs of a $10,000 investment |
Costs paid as a percentage of a $10,000 investment | |
PSF PGIM Laddered Allocation S&P 500 Buffer 20 Portfolio—Class III |
$47 |
0.85% |
WHAT AFFECTED THE PORTFOLIO’S PERFORMANCE DURING THE REPORTING PERIOD?
■
The Portfolio buys and holds an equal-weighted portfolio of the 12 PGIM Large-Cap Buffer 20% ETFs (January to December) (each, an
“Underlying ETF”). The Portfolio itself does not directly invest in any derivatives and does not provide any stated buffer against losses. Because
each Underlying ETF invests substantially all of its assets in customized equity or index option contracts known as Flexible Exchange Options
(FLEX Options) on the SPDR S&P 500 ETF Trust (SPY), each Underlying ETF’s performance is primarily driven by the SPY, although other
factors like changes in volatility or interest rates can impact the value of the FLEX Options.
■
Robust earnings growth and expectations that the artificial intelligence (AI) boom would fuel future growth helped boost US stocks during this
reporting period. The announcement of “Liberation Day” tariffs in April 2025 triggered a sharp selloff in US stocks. However, as the
administration softened its position on its trade and tariff policies, US equity markets recovered and gained additional ground through the end of
the reporting period. In addition, US equities benefited from the Federal Reserve’s decision to lower policy rates towards the end of the year.
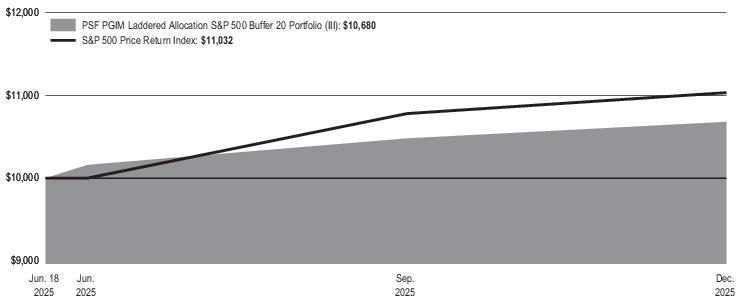
Total Returns as of December 31, 2025 | |
Since Inception (%) | |
Portfolio |
6.80% |
S&P 500 Price Return Index |
10.32% |
Portfolio Inception: 06/18/2025
Since Inception returns are provided because the Portfolio has less than 10 fiscal years of returns. Since Inception returns for the Indexes are
measured from the closest month-end to the Portfolio’s inception date.
The returns do not reflect the deduction
of applicable taxes, if any, that a shareholder would pay on Portfolio distributions or redemption of Portfolio shares.
WHAT ARE SOME KEY PORTFOLIO STATISTICS AS OF 12/31/2025?
Portfolio’s net assets |
$ 600,406 |
Number of portfolio holdings |
13 |
Total advisory fees paid for the year |
$ 0 |
Portfolio turnover rate for the year |
32% |
WHAT ARE SOME CHARACTERISTICS OF THE PORTFOLIO’S HOLDINGS AS OF 12/31/2025?
Industry Classification |
% of Net Assets |
Affiliated Exchange-Traded Funds - Equity |
96.7% |
Affiliated Mutual Fund - Short-Term Investment |
1.0% |
97.7% | |
Other assets in excess of liabilities |
2.3% |
100.0% |
This annual shareholder report contains important information about the Class I shares of PSF PGIM Total Return Bond Portfolio (the “Portfolio”)
for the period of January 1, 2025 to December 31, 2025.
You can find additional information about the Portfolio at
www.prudential.com/variableinsuranceportfolios
. You can also request this
information by contacting us at (800) 346-3778.
WHAT WERE THE PORTFOLIO COSTS FOR THE LAST YEAR?
(Based on a hypothetical $10,000 investment)
Costs of a $10,000 investment |
Costs paid as a percentage of a $10,000 investment | |
PSF PGIM Total Return Bond Portfolio—Class I |
$45 |
0.43% |
WHAT AFFECTED THE PORTFOLIO’S PERFORMANCE DURING THE REPORTING PERIOD?
■
During the reporting period, US Treasury yields declined and the yield curve steepened while credit spreads across a broad range of fixed
income assets generally tightened as demand for yield remained robust. The US Federal Reserve’s easing cycle, which was paused in the first
half of 2025, resumed with 25-basis point (bps) interest rate cuts in September, October, and December.
■
Security selection and sector allocation were the main drivers of the Portfolio’s outperformance versus the Bloomberg US Aggregate Bond
Index during the reporting period. Overweight allocations to, and security selection in, the collateralized loan obligations and non-agency
collateralized mortgage-backed securities (CMBS) sectors contributed to performance. Security selection in the high yield sector, along with
security selection and an underweight allocation to the investment grade corporate bond sector, also contributed to performance. Duration
(duration measures the sensitivity of the price—the value of principal—of a bond to a change in interest rates) and yield curve positioning (a
yield curve is a line graph that illustrates the relationship between the yields and maturities of fixed income securities and is created by plotting
the yields of different maturities for the same type of bonds) contributed to the Portfolio’s performance during the reporting period.
■
Selection in US Treasuries and emerging markets, along with an overweight allocation to the high yield sector, detracted from performance.
■
During the reporting period, the Portfolio used total return swaps, interest rate swaps, and futures to help manage duration and yield curve
exposure, which in aggregate had a negative impact on performance. The Portfolio also used credit derivatives in the form of credit default
swaps and the Credit Default Swap Index to manage credit risk, which contributed to performance.
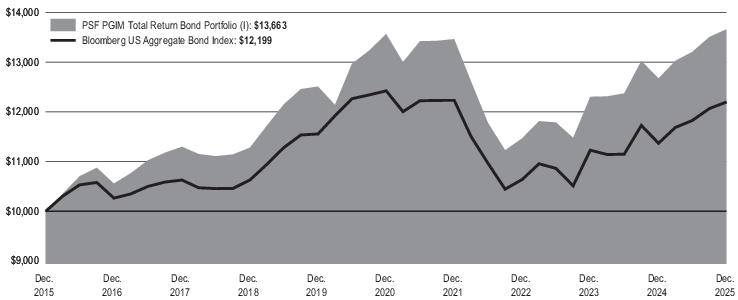
Average Annual Total Returns as of December 31, 2025 | |||
One Year (%) |
Five Years (%) |
Ten Years (%) | |
Portfolio |
7.80% |
0.14% |
3.17% |
Bloomberg US Aggregate Bond Index |
7.30% |
-0.36% |
2.01% |
The returns do not reflect the deduction
of applicable taxes, if any, that a shareholder would pay on Portfolio distributions or redemption of Portfolio shares.
WHAT ARE SOME KEY PORTFOLIO STATISTICS AS OF 12/31/2025?
Portfolio’s net assets |
$ 2,460,240,787 |
Number of portfolio holdings |
1,862 |
Total advisory fees paid for the year |
$ 9,606,239 |
Portfolio turnover rate for the year |
96% |
WHAT ARE SOME CHARACTERISTICS OF THE PORTFOLIO’S HOLDINGS AS OF 12/31/2025?
Credit Quality |
% of Total Investments |
AAA |
27.7 |
AA |
26.7 |
A |
11.9 |
BBB |
14.5 |
BB |
5.8 |
B |
3.4 |
CCC and Below |
1.3 |
NR |
6.5 |
Cash/Cash Equivalents |
2.2 |
Total Investments |
100.0 |
Credit quality ratings shown above reflect the middle rating assigned by a nationally recognized statistical rating organization (NRSRO) such as Moody’s Investor Service, Inc.
(Moody’s), S&P Global Ratings (S&P), or Fitch, Inc. (Fitch) if ratings differ. Where applicable, ratings are converted to the comparable S&P/Fitch rating category to illustrate credit
rating breakdowns. These NRSROs are independent and are widely used. The Not Rated (NR) category consists of securities that have not been rated by a NRSRO. Unrated
investments do not necessarily indicate low credit quality. The ratings category may include derivative instruments that could have a negative value. Credit quality ratings are subject to
change. Values may not sum to 100.0% due to rounding.
WERE THERE ANY SIGNIFICANT CHANGES TO THE PORTFOLIO THIS YEAR?
The following is a summary of certain changes to the Portfolio since January 1, 2025.
■
At a meeting of the shareholders of PSF PGIM Government Income Portfolio (the “Target Portfolio”) held on March 25, 2025, shareholders of
the Target Portfolio approved the reorganization of the Target Portfolio into the Portfolio (the “Reorganization”). The Reorganization was
completed on April 25, 2025.
For more complete information, you should review the Portfolio’s current prospectus including
any applicable supplements, and the Portfolio’s next
prospectus, which we expect to be available by May 1, 2026, at
www.prudential.com/variableinsuranceportfolios
or by request at
(800) 346-3778.
At a meeting of the shareholders of PSF PGIM Government Income Portfolio (the “Target Portfolio”) held on March 25, 2025, shareholders of
the Target Portfolio approved the reorganization of the Target Portfolio into the Portfolio (the “Reorganization”). The Reorganization was
completed on April 25, 2025.
This annual shareholder report contains important information about the Class III shares of PSF PGIM Total Return Bond Portfolio (the “Portfolio”)
for the period of January 1, 2025 to December 31, 2025.
You can find additional information about the Portfolio at
www.prudential.com/variableinsuranceportfolios
. You can also request this
information by contacting us at (800) 346-3778.
WHAT WERE THE PORTFOLIO COSTS FOR THE LAST YEAR?
(Based on a hypothetical $10,000 investment)
Costs of a $10,000 investment |
Costs paid as a percentage of a $10,000 investment | |
PSF PGIM Total Return Bond Portfolio—Class III |
$71 |
0.68% |
WHAT AFFECTED THE PORTFOLIO’S PERFORMANCE DURING THE REPORTING PERIOD?
■
During the reporting period, US Treasury yields declined and the yield curve steepened while credit spreads across a broad range of fixed
income assets generally tightened as demand for yield remained robust. The US Federal Reserve’s easing cycle, which was paused in the first
half of 2025, resumed with 25-basis point (bps) interest rate cuts in September, October, and December.
■
Security selection and sector allocation were the main drivers of the Portfolio’s outperformance versus the Bloomberg US Aggregate Bond
Index during the reporting period. Overweight allocations to, and security selection in, the collateralized loan obligations and non-agency
collateralized mortgage-backed securities (CMBS) sectors contributed to performance. Security selection in the high yield sector, along with
security selection and an underweight allocation to the investment grade corporate bond sector, also contributed to performance. Duration
(duration measures the sensitivity of the price—the value of principal—of a bond to a change in interest rates) and yield curve positioning (a
yield curve is a line graph that illustrates the relationship between the yields and maturities of fixed income securities and is created by plotting
the yields of different maturities for the same type of bonds) contributed to the Portfolio’s performance during the reporting period.
■
Selection in US Treasuries and emerging markets, along with an overweight allocation to the high yield sector, detracted from performance.
■
During the reporting period, the Portfolio used total return swaps, interest rate swaps, and futures to help manage duration and yield curve
exposure, which in aggregate had a negative impact on performance. The Portfolio also used credit derivatives in the form of credit default
swaps and the Credit Default Swap Index to manage credit risk, which contributed to performance.
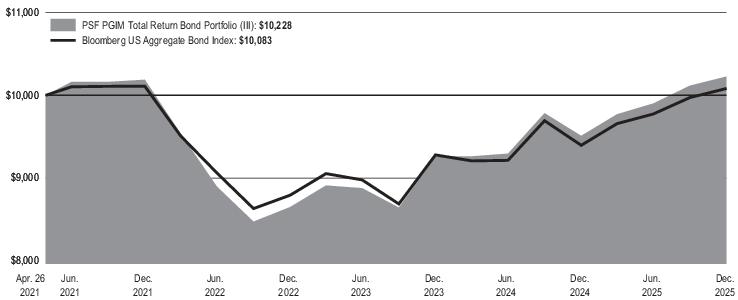
Average Annual Total Returns as of December 31, 2025 | ||
One Year (%) |
Since Inception (%) | |
Portfolio |
7.53% |
0.48% |
Bloomberg US Aggregate Bond Index |
7.30% |
0.18% |
The returns do not reflect the deduction
of applicable taxes, if any, that a shareholder would pay on Portfolio distributions or redemption of Portfolio shares.
WHAT ARE SOME KEY PORTFOLIO STATISTICS AS OF 12/31/2025?
Portfolio’s net assets |
$ 2,460,240,787 |
Number of portfolio holdings |
1,862 |
Total advisory fees paid for the year |
$ 9,606,239 |
Portfolio turnover rate for the year |
96% |
WHAT ARE SOME CHARACTERISTICS OF THE PORTFOLIO’S HOLDINGS AS OF 12/31/2025?
Credit Quality |
% of Total Investments |
AAA |
27.7 |
AA |
26.7 |
A |
11.9 |
BBB |
14.5 |
BB |
5.8 |
B |
3.4 |
CCC and Below |
1.3 |
NR |
6.5 |
Cash/Cash Equivalents |
2.2 |
Total Investments |
100.0 |
Credit quality ratings shown above reflect the middle rating assigned by a nationally recognized statistical rating organization (NRSRO) such as Moody’s Investor Service, Inc.
(Moody’s), S&P Global Ratings (S&P), or Fitch, Inc. (Fitch) if ratings differ. Where applicable, ratings are converted to the comparable S&P/Fitch rating category to illustrate credit
rating breakdowns. These NRSROs are independent and are widely used. The Not Rated (NR) category consists of securities that have not been rated by a NRSRO. Unrated
investments do not necessarily indicate low credit quality. The ratings category may include derivative instruments that could have a negative value. Credit quality ratings are subject to
change. Values may not sum to 100.0% due to rounding.
WERE THERE ANY SIGNIFICANT CHANGES TO THE PORTFOLIO THIS YEAR?
The following is a summary of certain changes to the Portfolio since January 1, 2025.
■
At a meeting of the shareholders of PSF PGIM Government Income Portfolio (the “Target Portfolio”) held on March 25, 2025, shareholders of
the Target Portfolio approved the reorganization of the Target Portfolio into the Portfolio (the “Reorganization”). The Reorganization was
completed on April 25, 2025.
For more complete information, you should review the Portfolio’s current prospectus including any applicable supplements, and the Portfolio’s next
prospectus, which we expect to be available by May 1, 2026, at
www.prudential.com/variableinsuranceportfolios
or by request at
(800) 346-3778.
At a meeting of the shareholders of PSF PGIM Government Income Portfolio (the “Target Portfolio”) held on March 25, 2025, shareholders of
the Target Portfolio approved the reorganization of the Target Portfolio into the Portfolio (the “Reorganization”). The Reorganization was
completed on April 25, 2025.
This
annual shareholder report contains
important information about the Class I shares of PSF Small-Cap Stock Index Portfolio (the “Portfolio”) for the period of January 1, 2025 to December 31, 2025.
You can find additional information about the Portfolio at
www.prudential.com/variableinsuranceportfolios
. You can also request this
information by contacting us at (800) 346-3778.
WHAT WERE THE PORTFOLIO COSTS FOR THE LAST YEAR?
(Based on a hypothetical $10,000 investment)
Costs of a $10,000 investment |
Costs paid as a percentage of a $10,000 investment | |
PSF Small-Cap Stock Index Portfolio—Class I |
$39 |
0.38% |
WHAT AFFECTED THE PORTFOLIO’S PERFORMANCE DURING THE REPORTING PERIOD?
■
In the first quarter, the Trump administration’s tariff policies caused significant disruption to the economic landscape. The uncertain outlook on
the future of the economy negatively affected domestic stocks, particularly small caps.
■
US equities finished the second quarter in positive territory despite a downturn in April 2025 that was precipitated by the Trump administration’s
tariff announcement. Despite inflation worries and rising tensions in the Middle East, US equities rebounded into positive territory after the
President announced a pause on the use of the new tariffs. Large-cap stocks in the US once again outperformed small-cap stocks.
■
US equities posted a strong third quarter. Investor enthusiasm around artificial intelligence, corporate earnings growth, and a September
federal funds rate cut provided momentum for the positive returns and overshadowed concerns about tariffs, trade wars, and an impending
government shutdown.
■
In the face of the longest government shutdown in history and rising job cuts, US equities registered gains in the fourth quarter. US equities
reacted positively to the Federal Reserve lowering interest rates while indicating additional reductions could follow if inflation continues to fall.
The S&P 500 Index ended the year with a 17.88% gain while the S&P 600 rose 6.02%.
■
The Portfolio used stock index futures to equitize cash and enhance Portfolio liquidity, which had a negligible effect on performance during the
reporting period.
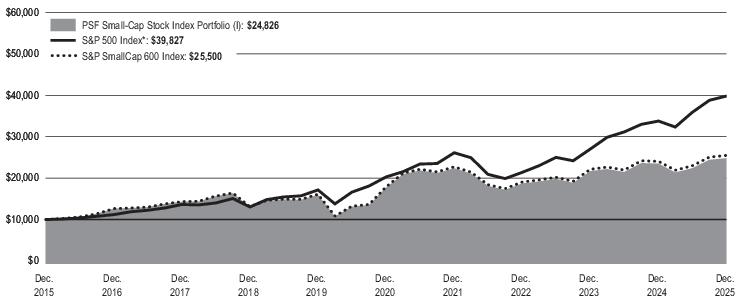
Average Annual Total Returns as of December 31, 2025 | |||
One Year (%) |
Five Years (%) |
Ten Years (%) | |
Portfolio |
5.69% |
6.97% |
9.52% |
S&P 500 Index* |
17.88% |
14.42% |
14.82% |
S&P SmallCap 600 Index |
6.02% |
7.31% |
9.81% |
*The Portfolio compares its performance against this broad-based index in response to regulatory requirements.
The returns do not reflect the deduction
of applicable taxes, if any, that a shareholder would pay on Portfolio distributions or redemption of Portfolio shares.
WHAT ARE SOME KEY PORTFOLIO STATISTICS AS OF 12/31/2025?
Portfolio’s net assets |
$ 1,310,339,674 |
Number of portfolio holdings |
608 |
Total advisory fees paid for the year |
$ 4,322,190 |
Portfolio turnover rate for the year |
28% |
WHAT ARE SOME CHARACTERISTICS OF THE PORTFOLIO’S HOLDINGS AS OF 12/31/2025?
Industry Classification |
% of Net Assets |
Affiliated Mutual Fund - Short-Term Investment (30.5% represents investments purchased with collateral from securities on loan) |
31.2% |
Banks |
8.3% |
Electronic Equipment, Instruments & Components |
4.4% |
Machinery |
4.1% |
Biotechnology |
3.9% |
Semiconductors & Semiconductor Equipment |
3.8% |
Software |
3.7% |
Chemicals |
3.5% |
Specialty Retail |
3.3% |
Capital Markets |
3.2% |
Health Care Equipment & Supplies |
3.2% |
Household Durables |
2.9% |
Building Products |
2.6% |
Insurance |
2.5% |
Commercial Services & Supplies |
2.3% |
Oil, Gas & Consumable Fuels |
2.3% |
Hotels, Restaurants & Leisure |
2.2% |
Financial Services |
2.2% |
Health Care Providers & Services |
2.1% |
Energy Equipment & Services |
2.1% |
Pharmaceuticals |
2.0% |
Unaffiliated Exchange-Traded Funds - Equity |
1.9% |
Construction & Engineering |
1.9% |
Retail REITs |
1.5% |
Professional Services |
1.4% |
Automobile Components |
1.4% |
Communications Equipment |
1.2% |
Trading Companies & Distributors |
1.1% |
Metals & Mining |
1.0% |
Diversified Consumer Services |
1.0% |
Hotel & Resort REITs |
1.0% |
Industry Classification |
% of Net Assets |
Food Products |
1.0% |
Aerospace & Defense |
1.0% |
Mortgage Real Estate Investment Trusts (REITs) |
0.9% |
Interactive Media & Services |
0.9% |
Consumer Finance |
0.8% |
Health Care REITs |
0.8% |
Textiles, Apparel & Luxury Goods |
0.8% |
Diversified Telecommunication Services |
0.8% |
Specialized REITs |
0.7% |
Diversified REITs |
0.7% |
Office REITs |
0.7% |
Industrial REITs |
0.7% |
Consumer Staples Distribution & Retail |
0.7% |
Electrical Equipment |
0.6% |
Gas Utilities |
0.6% |
Real Estate Management & Development |
0.6% |
Ground Transportation |
0.6% |
Containers & Packaging |
0.6% |
Electric Utilities |
0.6% |
Water Utilities |
0.5% |
Broadline Retail |
0.5% |
Distributors |
0.5% |
Passenger Airlines |
0.5% |
Media |
0.5% |
Entertainment |
0.5% |
Household Products |
0.5% |
Others* |
3.7% |
130.5% | |
Liabilities in excess of other assets |
(30.5)% |
100.0% |
* |
Consists of Industries that each make up less than 0.5% of the Portfolio's net assets |
This annual shareholder report contains important information about the Class III shares of PSF Small-Cap Stock Index Portfolio (the “Portfolio”)
for the period of January 1, 2025 to December 31, 2025.
You can find additional information about the Portfolio at
www.prudential.com/variableinsuranceportfolios
. You can also request this
information by contacting us at (800) 346-3778.
WHAT WERE THE PORTFOLIO COSTS FOR THE LAST YEAR?
(Based on a hypothetical $10,000 investment)
Costs of a $10,000 investment |
Costs paid as a percentage of a $10,000 investment | |
PSF Small-Cap Stock Index Portfolio—Class III |
$65 |
0.63% |
WHAT AFFECTED THE PORTFOLIO’S PERFORMANCE DURING THE REPORTING PERIOD?
■
In the first quarter, the Trump administration’s tariff policies caused significant disruption to the economic landscape. The uncertain outlook on
the future of the economy negatively affected domestic stocks, particularly small caps.
■
US equities finished the second quarter in positive territory despite a downturn in April 2025 that was precipitated by the Trump administration’s
tariff announcement. Despite inflation worries and rising tensions in the Middle East, US equities rebounded into positive territory after the
President announced a pause on the use of the new tariffs. Large-cap stocks in the US once again outperformed small-cap stocks.
■
US equities posted a strong third quarter. Investor enthusiasm around artificial intelligence, corporate earnings growth, and a September
federal funds rate cut provided momentum for the positive returns and overshadowed concerns about tariffs, trade wars, and an impending
government shutdown.
■
In the face of the longest government shutdown in history and rising job cuts, US equities registered gains in the fourth quarter. US equities
reacted positively to the Federal Reserve lowering interest rates while indicating additional reductions could follow if inflation continues to fall.
The S&P 500 Index ended the year with a 17.88% gain while the S&P 600 rose 6.02%.
■
The Portfolio used stock index futures to equitize cash and enhance Portfolio liquidity, which had a negligible effect on performance during the
reporting period.
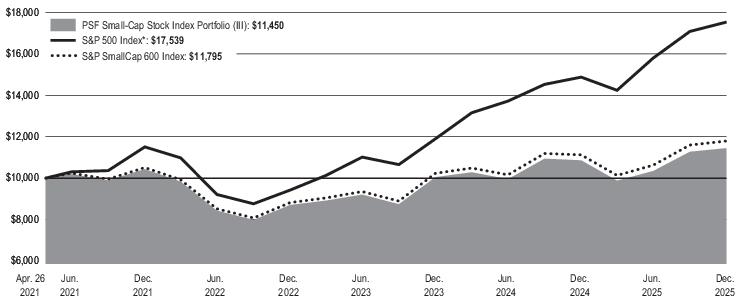
Average Annual Total Returns as of December 31, 2025 | ||
One Year (%) |
Since Inception (%) | |
Portfolio |
5.42% |
2.93% |
S&P 500 Index* |
17.88% |
12.79% |
S&P SmallCap 600 Index |
6.02% |
3.60% |
Portfolio Inception: 04/26/2021.
Since Inception returns are provided because the Portfolio has less than 10 fiscal years of returns. Since Inception returns for the Indexes are
measured from the closest month-end to the Portfolio’s inception date.
*The Portfolio compares its performance against this broad-based index in response to regulatory requirements.
The returns do not reflect the deduction
of applicable taxes, if any, that a shareholder would pay on Portfolio distributions or redemption of Portfolio shares.
WHAT ARE SOME KEY PORTFOLIO STATISTICS AS OF 12/31/2025?
Portfolio’s net assets |
$ 1,310,339,674 |
Number of portfolio holdings |
608 |
Total advisory fees paid for the year |
$ 4,322,190 |
Portfolio turnover rate for the year |
28% |
WHAT ARE SOME CHARACTERISTICS OF THE PORTFOLIO’S HOLDINGS AS OF 12/31/2025?
Industry Classification |
% of Net Assets |
Affiliated Mutual Fund - Short-Term Investment (30.5% represents investments purchased with collateral from securities on loan) |
31.2% |
Banks |
8.3% |
Electronic Equipment, Instruments & Components |
4.4% |
Machinery |
4.1% |
Biotechnology |
3.9% |
Semiconductors & Semiconductor Equipment |
3.8% |
Software |
3.7% |
Chemicals |
3.5% |
Specialty Retail |
3.3% |
Capital Markets |
3.2% |
Health Care Equipment & Supplies |
3.2% |
Household Durables |
2.9% |
Building Products |
2.6% |
Insurance |
2.5% |
Commercial Services & Supplies |
2.3% |
Oil, Gas & Consumable Fuels |
2.3% |
Hotels, Restaurants & Leisure |
2.2% |
Financial Services |
2.2% |
Health Care Providers & Services |
2.1% |
Energy Equipment & Services |
2.1% |
Pharmaceuticals |
2.0% |
Unaffiliated Exchange-Traded Funds - Equity |
1.9% |
Construction & Engineering |
1.9% |
Retail REITs |
1.5% |
Professional Services |
1.4% |
Automobile Components |
1.4% |
Communications Equipment |
1.2% |
Trading Companies & Distributors |
1.1% |
Metals & Mining |
1.0% |
Diversified Consumer Services |
1.0% |
Hotel & Resort REITs |
1.0% |
Industry Classification |
% of Net Assets |
Food Products |
1.0% |
Aerospace & Defense |
1.0% |
Mortgage Real Estate Investment Trusts (REITs) |
0.9% |
Interactive Media & Services |
0.9% |
Consumer Finance |
0.8% |
Health Care REITs |
0.8% |
Textiles, Apparel & Luxury Goods |
0.8% |
Diversified Telecommunication Services |
0.8% |
Specialized REITs |
0.7% |
Diversified REITs |
0.7% |
Office REITs |
0.7% |
Industrial REITs |
0.7% |
Consumer Staples Distribution & Retail |
0.7% |
Electrical Equipment |
0.6% |
Gas Utilities |
0.6% |
Real Estate Management & Development |
0.6% |
Ground Transportation |
0.6% |
Containers & Packaging |
0.6% |
Electric Utilities |
0.6% |
Water Utilities |
0.5% |
Broadline Retail |
0.5% |
Distributors |
0.5% |
Passenger Airlines |
0.5% |
Media |
0.5% |
Entertainment |
0.5% |
Household Products |
0.5% |
Others* |
3.7% |
130.5% | |
Liabilities in excess of other assets |
(30.5)% |
100.0% |
* |
Consists of Industries that each make up less than 0.5% of the Portfolio's net assets |
This annual shareholder report contains important information about the Class I shares of PSF Stock Index Portfolio (the “Portfolio”) for the period
of January 1, 2025 to December 31, 2025.
You can find additional information about the Portfolio at
www.prudential.com/variableinsuranceportfolios
. You can also request this
information by contacting us at (800) 346-3778.
WHAT WERE THE PORTFOLIO COSTS FOR THE LAST YEAR?
(Based on a hypothetical $10,000 investment)
Costs of a $10,000 investment |
Costs paid as a percentage of a $10,000 investment | |
PSF Stock Index Portfolio—Class I |
$27 |
0.25% |
WHAT AFFECTED THE PORTFOLIO’S PERFORMANCE DURING THE REPORTING PERIOD?
■
In the first quarter, the Trump administration’s tariff policies caused significant disruption to the economic landscape. The uncertain outlook on
the future of the economy negatively affected domestic stocks, particularly small caps.
■
US equities finished the second quarter in positive territory despite a downturn in April 2025 that was precipitated by the Trump administration’s
tariff announcement. Despite inflation worries and rising tensions in the Middle East, US equities rebounded into positive territory after the
President announced a pause on the new tariffs. Large-cap stocks in the US once again outperformed small-cap stocks.
■
US equities posted a strong third quarter. Investor enthusiasm around artificial intelligence, corporate earnings growth and a September 2025
federal funds rate cut provided momentum for the positive returns and overshadowed concerns about tariffs, trade wars, and an impending
government shutdown.
■
In the face of the longest government shutdown in history and rising job cuts, US equities registered a gain in the fourth quarter. US equities
reacted positively to the Federal Reserve lowering interest rates while indicating additional reductions could follow if inflation continues to fall.
The S&P 500 Index ended the year with a 17.88% gain while the S&P 600 rose 6.02%.
■
The Portfolio used stock index futures to equitize cash and enhance Portfolio liquidity, which had a negligible effect on performance during the
reporting period.
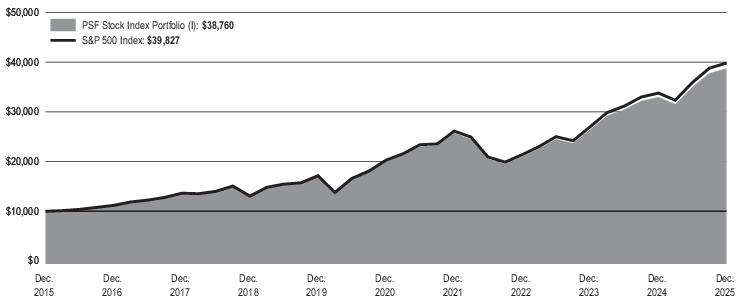
Average Annual Total Returns as of December 31, 2025 | |||
One Year (%) |
Five Years (%) |
Ten Years (%) | |
Portfolio |
17.56% |
14.09% |
14.51% |
S&P 500 Index |
17.88% |
14.42% |
14.82% |
The returns do not reflect the deduction
of applicable taxes, if any, that a shareholder would pay on Portfolio distributions or redemption of Portfolio shares.
WHAT ARE SOME KEY PORTFOLIO STATISTI
C
S AS OF 12/31/2025?Portfolio’s net assets |
$ 10,282,203,043 |
Number of portfolio holdings |
508 |
Total advisory fees paid for the year |
$ 22,364,441 |
Portfolio turnover rate for the year |
2% |
WHAT ARE SOME CHARACTERISTICS OF THE PORTFOLIO’S HOLDINGS AS OF 12/31/2025?
Industry Classification |
% of Net Assets |
Semiconductors & Semiconductor Equipment |
13.7% |
Software |
9.9% |
Interactive Media & Services |
7.8% |
Technology Hardware, Storage & Peripherals |
7.1% |
Affiliated Mutual Fund - Short-Term Investment (3.2% represents investments purchased with collateral from securities on loan) |
5.3% |
Broadline Retail |
3.8% |
Financial Services |
3.7% |
Banks |
3.5% |
Capital Markets |
3.3% |
Pharmaceuticals |
3.2% |
Oil, Gas & Consumable Fuels |
2.5% |
Automobiles |
2.3% |
Aerospace & Defense |
2.1% |
Health Care Equipment & Supplies |
2.0% |
Hotels, Restaurants & Leisure |
1.8% |
Consumer Staples Distribution & Retail |
1.7% |
Insurance |
1.7% |
Specialty Retail |
1.6% |
Biotechnology |
1.6% |
Health Care Providers & Services |
1.6% |
Machinery |
1.5% |
Unaffiliated Exchange-Traded Funds - Equity |
1.5% |
Industry Classification |
% of Net Assets |
Electric Utilities |
1.4% |
Entertainment |
1.3% |
Beverages |
1.0% |
IT Services |
0.9% |
Chemicals |
0.9% |
Life Sciences Tools & Services |
0.9% |
Communications Equipment |
0.9% |
Electrical Equipment |
0.8% |
Ground Transportation |
0.8% |
Household Products |
0.8% |
Electronic Equipment, Instruments & Components |
0.7% |
Specialized REITs |
0.7% |
Consumer Finance |
0.6% |
Diversified Telecommunication Services |
0.6% |
Tobacco |
0.6% |
Multi-Utilities |
0.6% |
Professional Services |
0.5% |
Others* |
6.0% |
103.2% | |
Liabilities in excess of other assets |
(3.2)% |
100.0% |
* |
Consists of Industries that each make up less than 0.5% of the Portfolio's net assets |
This annual shareholder report contains important information about the Class III shares of PSF Stock Index Portfolio (the “Portfolio”) for the
period of January 1, 2025 to December 31, 2025.
You can find additional information about the Portfolio at
www.prudential.com/variableinsuranceportfolios
. You can also request this
information by contacting us at (800) 346-3778.
WHAT WERE THE PORTFOLIO COSTS FOR THE LAST YEAR?
(Based on a hypothetical $10,000 investment)
Costs of a $10,000 investment |
Costs paid as a percentage of a $10,000 investment | |
PSF Stock Index Portfolio—Class III |
$54 |
0.50% |
WHAT AFFECTED THE PORTFOLIO’S PERFORMANCE DURING THE REPORTING PERIOD?
■
In the first quarter, the Trump administration’s tariff policies caused significant disruption to the economic landscape. The uncertain outlook on
the future of the economy negatively affected domestic stocks, particularly small caps.
■
US equities finished the second quarter in positive territory despite a downturn in April 2025 that was precipitated by the Trump administration’s
tariff announcement. Despite inflation worries and rising tensions in the Middle East, US equities rebounded into positive territory after the
President announced a pause on the new tariffs. Large-cap stocks in the US once again outperformed small-cap stocks.
■
US equities posted a strong third quarter. Investor enthusiasm around artificial intelligence, corporate earnings growth and a September 2025
federal funds rate cut provided momentum for the positive returns and overshadowed concerns about tariffs, trade wars, and an impending
government shutdown.
■
In the face of the longest government shutdown in history and rising job cuts, US equities registered a gain in the fourth quarter. US equities
reacted positively to the Federal Reserve lowering interest rates while indicating additional reductions could follow if inflation continues to fall.
The S&P 500 Index ended the year with a 17.88% gain while the S&P 600 rose 6.02%.
■
The Portfolio used stock index futures to equitize cash and enhance Portfolio liquidity, which had a negligible effect on performance during the
reporting period.
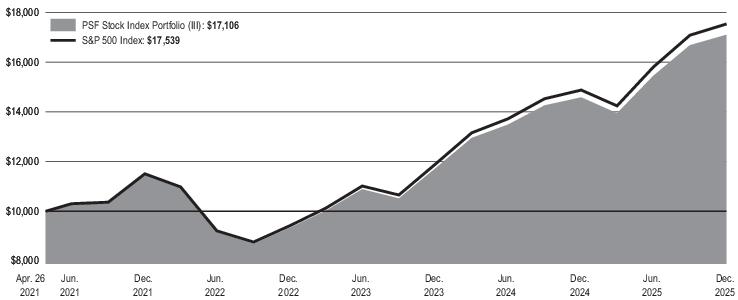
Average Annual Total Returns as of December 31, 2025 | ||
One Year (%) |
Since Inception (%) | |
Portfolio |
17.27% |
12.14% |
S&P 500 Index |
17.88% |
12.79% |
Portfolio Inception: 04/26/2021.
Since Inception returns are provided because the Portfolio has less than 10 fiscal years of returns. Since Inception returns for the Indexes are
measured from the closest month-end to the Portfolio’s inception date.
The returns do not reflect the deduction
of applicable taxes, if any, that a shareholder would pay on Portfolio distributions or redemption of Portfolio shares.
WHAT ARE SOME KEY PORTFOLIO STATISTICS AS OF 12/31/2025?
Portfolio’s net assets |
$ 10,282,203,043 |
Number of portfolio holdings |
508 |
Total advisory fees paid for the year |
$ 22,364,441 |
Portfolio turnover rate for the year |
2% |
WHAT ARE SOME CHA
R
ACTERISTICS OF THE PORTFOLIO’S HOLDINGS AS OF 12/31/2025?Industry Classification |
% of Net Assets |
Semiconductors & Semiconductor Equipment |
13.7% |
Software |
9.9% |
Interactive Media & Services |
7.8% |
Technology Hardware, Storage & Peripherals |
7.1% |
Affiliated Mutual Fund - Short-Term Investment (3.2% represents investments purchased with collateral from securities on loan) |
5.3% |
Broadline Retail |
3.8% |
Financial Services |
3.7% |
Banks |
3.5% |
Capital Markets |
3.3% |
Pharmaceuticals |
3.2% |
Oil, Gas & Consumable Fuels |
2.5% |
Automobiles |
2.3% |
Aerospace & Defense |
2.1% |
Health Care Equipment & Supplies |
2.0% |
Hotels, Restaurants & Leisure |
1.8% |
Consumer Staples Distribution & Retail |
1.7% |
Insurance |
1.7% |
Specialty Retail |
1.6% |
Biotechnology |
1.6% |
Health Care Providers & Services |
1.6% |
Machinery |
1.5% |
Unaffiliated Exchange-Traded Funds - Equity |
1.5% |
Industry Classification |
% of Net Assets |
Electric Utilities |
1.4% |
Entertainment |
1.3% |
Beverages |
1.0% |
IT Services |
0.9% |
Chemicals |
0.9% |
Life Sciences Tools & Services |
0.9% |
Communications Equipment |
0.9% |
Electrical Equipment |
0.8% |
Ground Transportation |
0.8% |
Household Products |
0.8% |
Electronic Equipment, Instruments & Components |
0.7% |
Specialized REITs |
0.7% |
Consumer Finance |
0.6% |
Diversified Telecommunication Services |
0.6% |
Tobacco |
0.6% |
Multi-Utilities |
0.6% |
Professional Services |
0.5% |
Others* |
6.0% |
103.2% | |
Liabilities in excess of other assets |
(3.2)% |
100.0% |
* |
Consists of Industries that each make up less than 0.5% of the Portfolio's net assets |