Pay vs Performance Disclosure - USD ($)
Dec. 31, 2025
Dec. 31, 2024
Dec. 31, 2023
Dec. 31, 2022
Dec. 31, 2021
| Year | Summary Compensation Table Total for CEO ($) | Compensation Actually Paid to CEO ($)(1)(2) | Average Summary Compensation Total for Other NEOs ($)(3) | Average Compensation Actually Paid to Other NEOs ($)(1)(3) | Value of Initial Fixed $100 Investment Based On: | |||||||||||||||||||||||||||||||||||||||||||||
| Moody’s Cumulative TSR ($) | Russell 3000 Financial Services Index Cumulative TSR ($) | Net Income ($millions) | MCO EPS for Compensation Purposes ($)(4) | |||||||||||||||||||||||||||||||||||||||||||||||
2025 | 18,082,565 | 26,294,538 | 4,959,348 | 5,415,758 | 183 | 216 | 2,461 | 14.94 | ||||||||||||||||||||||||||||||||||||||||||
2024 | 16,966,442 | 35,252,457 | 7,127,703 | 9,311,638 | 169 | 187 | 2,058 | 12.47 | ||||||||||||||||||||||||||||||||||||||||||
2023 | 14,387,659 | 23,499,543 | 2,887,540 | 2,635,366 | 138 | 144 | 1,607 | 9.90 | ||||||||||||||||||||||||||||||||||||||||||
2022 | 11,619,773 | (4,692,319) | 3,186,695 | (1,700,521) | 98 | 118 | 1,374 | 8.57 | ||||||||||||||||||||||||||||||||||||||||||
2021 | 9,750,157 | 21,584,082 | 3,056,066 | 7,117,461 | 136 | 138 | 2,214 | 12.29 | ||||||||||||||||||||||||||||||||||||||||||
| 2025 ($) | 2024 ($) | ||||||||||||||||
Reported SCT Total Compensation | 18,082,565 | 16,966,442 | |||||||||||||||
Subtract: Equity Award Values Reported in the SCT | (14,199,983) | (12,699,940) | |||||||||||||||
Add: Year End Fair Value of Equity Awards Granted in the Year | 15,556,905 | 21,059,622 | |||||||||||||||
Add/Subtract: Year over Year Change in Fair Value of Outstanding and Unvested Equity Awards Granted in Prior Years | 6,375,878 | 10,074,983 | |||||||||||||||
Add/Subtract: Change in Fair Value From Prior Year End to Vesting Date of Equity Awards Granted in Prior Years that Vested in the Year | 786,012 | (104,277) | |||||||||||||||
Subtract: Pension Values Reported in the SCT | (514,370) | (240,561) | |||||||||||||||
Add: Pension Service Cost Attributable to Year | 207,531 | 196,188 | |||||||||||||||
Compensation Actually Paid | 26,294,538 | 35,252,457 | |||||||||||||||
The amounts deducted and added in calculating the average “Compensation Actually Paid” for the other NEOs for 2025 and for 2024, which reflects the correction of an inadvertent error calculating the average value of their outstanding equity awards as of the end of 2024, are as follows:
| 2025 ($) | 2024 ($) | ||||||||||||||||
Average Reported SCT Total Compensation | 4,959,348 | 7,127,703 | |||||||||||||||
Subtract: Average Equity Award Values Reported in the SCT | (3,087,325) | (5,205,278) | |||||||||||||||
Add: Average Year End Fair Value of Equity Awards Granted in the Year | 2,423,712 | 6,411,982 | |||||||||||||||
Add/Subtract: Average Year over Year Change in Fair Value of Outstanding and Unvested Equity Awards Granted in Prior Years | 1,637,474 | 1,007,983 | |||||||||||||||
Add/Subtract: Average Change in Fair Value From Prior Year End to Vesting Date of Equity Awards Granted in Prior Years that Vested in the Year | 177,611 | (10,021) | |||||||||||||||
Subtract: Fair Value of Equity Compensation Forfeited in Current Fiscal Year Determined at End of Prior Fiscal Year | (561,100) | — | |||||||||||||||
Subtract: Average Pension Values Reported in the SCT | (181,666) | (54,252) | |||||||||||||||
Add: Average Pension Service Cost Attributable to Year | 47,704 | 33,521 | |||||||||||||||
Average Compensation Actually Paid | 5,415,758 | 9,311,638 | |||||||||||||||
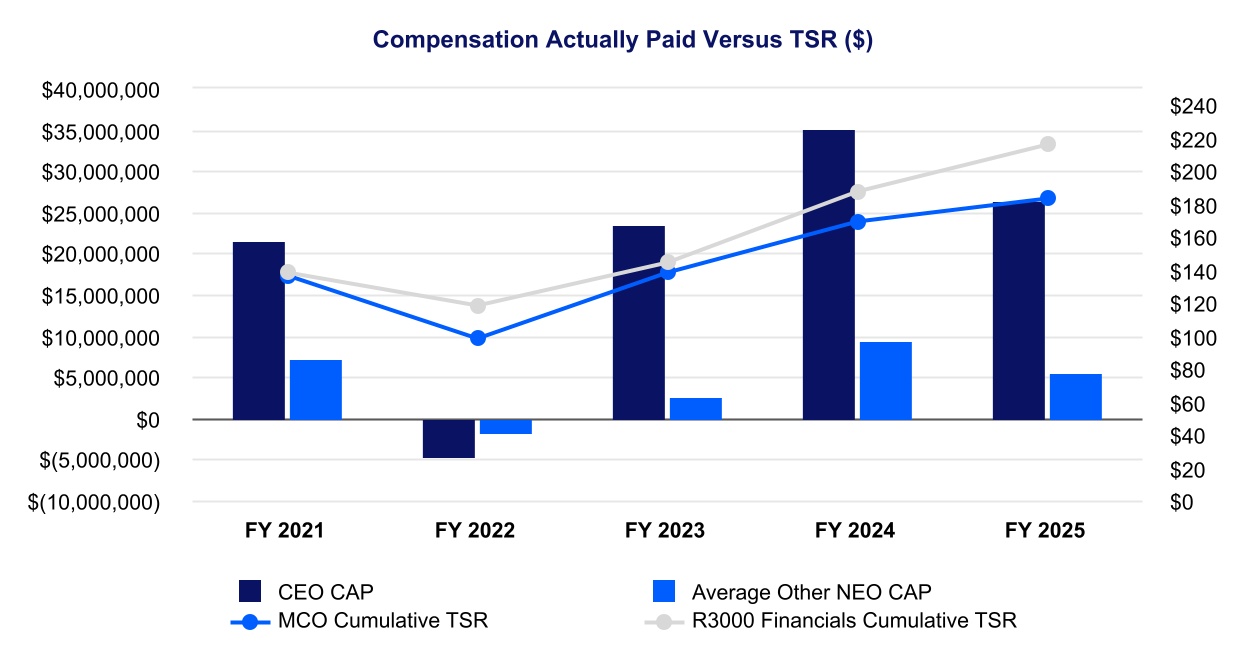
As illustrated in the table above and the charts below, the “Compensation Actually Paid” (calculated as required under SEC rules) for the Company’s NEOs over the past five fiscal years has directionally aligned with the Company’s TSR, net income and MCO EPS for Compensation Purposes. For 2022, “Compensation Actually Paid” is a negative number for both Mr. Fauber and the average of the other NEOs. Principally this reflects the impact of the change in Moody’s share price between December 31, 2021, and December 31, 2022 as well as updates to the anticipated performance share payout factors between fiscal year-ends.
Along with Compensation Actually Paid, the chart below outlines our one-year, two-year, three-year, four-year and five-year TSR as compared to the one-year, two-year, three-year, four-year and five-year TSR of the Russell 3000 Financial Services Index. In each case, TSR is measured starting from December 31, 2021:
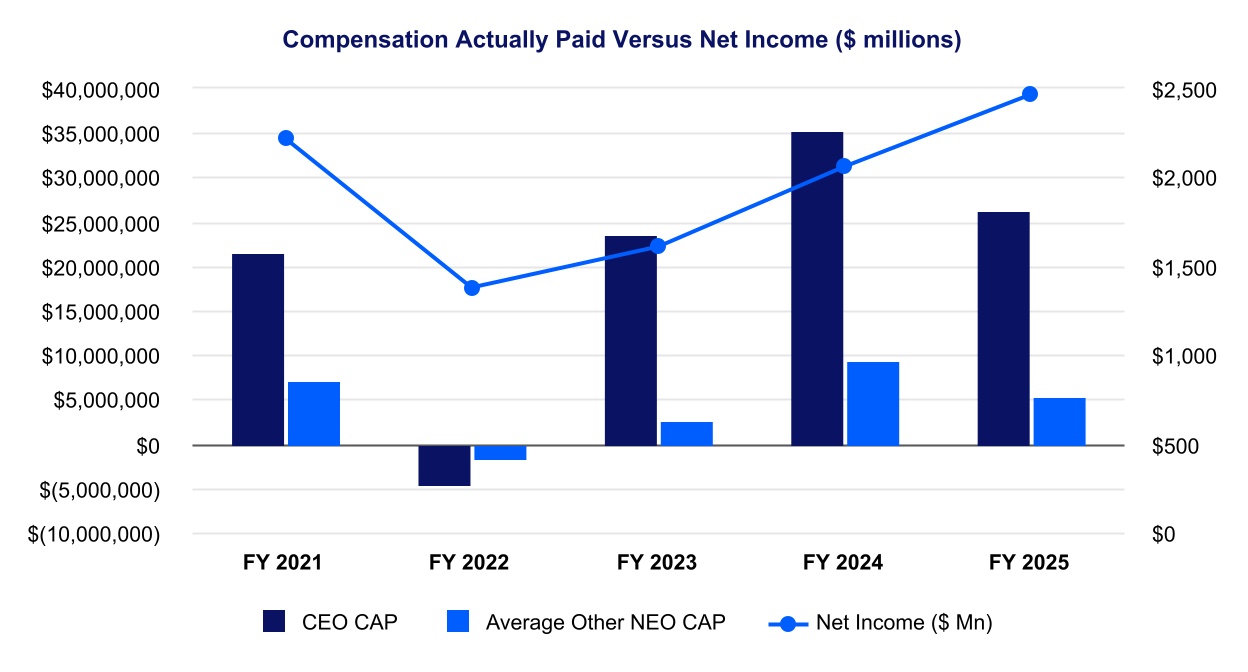
The chart below illustrates the relationship between Compensation Actually Paid and Moody’s net income.
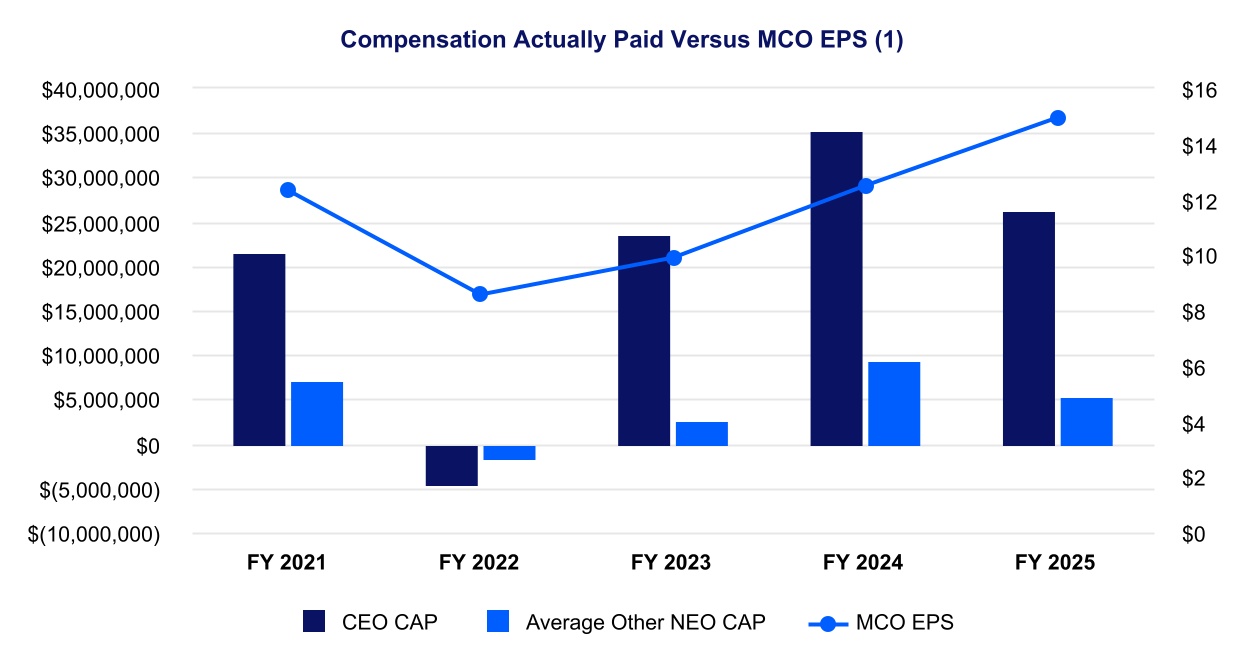
The chart below illustrates the relationship between Compensation Actually Paid and MCO EPS for Compensation Purposes.
As illustrated in the table above and the charts below, the “Compensation Actually Paid” (calculated as required under SEC rules) for the Company’s NEOs over the past five fiscal years has directionally aligned with the Company’s TSR, net income and MCO EPS for Compensation Purposes. For 2022, “Compensation Actually Paid” is a negative number for both Mr. Fauber and the average of the other NEOs. Principally this reflects the impact of the change in Moody’s share price between December 31, 2021, and December 31, 2022 as well as updates to the anticipated performance share payout factors between fiscal year-ends.
Along with Compensation Actually Paid, the chart below outlines our one-year, two-year, three-year, four-year and five-year TSR as compared to the one-year, two-year, three-year, four-year and five-year TSR of the Russell 3000 Financial Services Index. In each case, TSR is measured starting from December 31, 2021:
| Performance Measure | ||
MIS Operating Income | ||
MA Operating Income | ||
MA ARR | ||
MCO EPS for Compensation Purposes | ||
MA Cumulative Revenue | ||
MIS Ratings Performance | ||
As a result, “Compensation Actually Paid” does not reflect the value that was or may actually be realized by the NEOs.
Equity values are calculated in accordance with FASB ASC Topic 718, and the valuation assumptions used to calculate fair values of RSUs did not materially differ from those disclosed at the time of the grant. In calculating the year-over-year change in the value of unvested option awards as well as the change in value to mid-year vesting dates, options were valued at each measurement date using a lattice model with the following inputs.
•Stock price: based on the closing stock price on the measurement date. If a mid-year vesting date was not a trading day, the first trading day following the vesting date was used as the measurement date. If a fiscal year-end date was not a trading day (e.g., December 31, 2023), the most recent trading day prior to the fiscal year-end date was used (e.g., December 29, 2023).
•Expected life: based on the original expected life established at grant date, as used for financial reporting purposes, with adjustments to reflect the amount by which the options were in-the-money / out-of-the-money on the relevant measurement date.
•Stock price volatility: based on historical volatility for a trailing term to match the remaining contractual term as of each measurement date.
•Risk-free rate: based on an interpolated U.S. Constant Maturity Treasury yield as of each measurement date.
•Dividend yield: based on the yield as of each measurement date.
In valuing performance share awards, we calculated the fair value of unearned or earned but unvested awards, based on probable and/or final payout factors, as of the relevant measurement date.