Shareholder Report
Dec. 31, 2025
USD ($)
Holding
This annual shareholder report contains important information about the fund for the period of January 1, 2025, to December 31,
2025.
You can find additional information about the fund at
www.schwabassetmanagement.com/prospectus
.
You can also request
this information by calling
1-866-414-6349
or by sending an email request to
orders@mysummaryprospectus.com
.
FUND COSTS FOR THE LAST year ENDED December 31, 2025
(BASED ON A HYPOTHETICAL $10,000 INVESTMENT)
COSTS OF A $10,000 INVESTMENT |
COSTS PAID AS A PERCENTAGE OF A $10,000 INVESTMENT | |
Schwab Monthly Income Fund – Target Payout* |
$0 |
0.00% |
*
Expenses were reduced by a contractual fee waiver in effect for so long as the investment adviser serves as adviser to the fund. This agreement to limit the total annual
fund operating expenses is limited to the fund’s direct operating expenses and, therefore, does not apply to acquired fund fees and expenses (AFFE), which are indirect
expenses incurred by the fund through its investments in the underlying funds.
MANAGEMENT’S DISCUSSION OF FUND PERFORMANCE
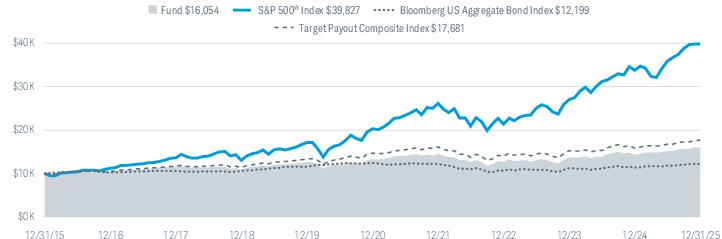
For the 12-month reporting period ended December 31, 2025, the fund returned 12.17%. The S&P 500
®
Index, which provides a
broad measure of equity market performance, and the Bloomberg US Aggregate Bond Index, which provides a broad measure of
bond market performance, returned 17.88% and 7.30%, respectively. The fund’s internally calculated comparative index, the Target
Payout Composite Index (the composite index), returned 11.66%.
■
The fund’s distribution yield (payout) was 4.78%
1
■
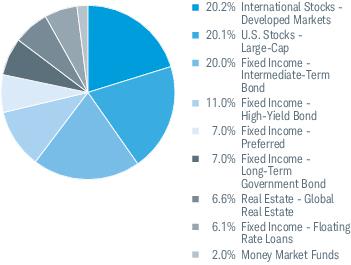
Asset allocations were broadly in line with those of the composite index
■
Top contributors to total return:
●
Schwab International Dividend Equity ETF
●
Schwab U.S. Aggregate Bond Index Fund
■
Over the reporting period, there were no detractors from the return of the fund. However, the smallest contributors to total return
were:
●
BlackRock High Yield Bond Portfolio (Class K)
●
Schwab 5-10 Year Corporate Bond ETF
Portfolio holdings may have changed since the report date.
1
Distributions may exceed income available and may include capital gains or return of capital to help reach the annual payout rate. A return of capital is a distribution from the
shareholder’s investment principal, rather than net profits from the fund’s returns. Shareholders who receive periodic distributions consisting of a return of capital may be
under the impression that they are receiving net profits when they are not. Return of capital reduces your cost basis in the fund’s shares and is not taxable to you until your
cost basis has been reduced to zero. The tax-basis of distributions are finalized at fiscal year-end and may be recharacterized from income distributions to capital gains or
return of capital.
Performance of Hypothetical $10,000 Investment (December 31, 2015 - December 31, 2025)
1
All total returns on this page assume dividends and distributions were reinvested. Index figures do not include trading and management costs, which would lower
performance. Indices are unmanaged and cannot be invested in directly. Performance results less than one year are not annualized.
For index definitions, please see www.schwabassetmanagement.com/glossary.
1
The fund’s routine expenses have been absorbed by the investment adviser and its affiliates. Without these reductions, the fund’s returns would have been lower.
T
hese
returns do not reflect the deduction of taxes that a shareholder would pay on fund distributions or the redemption of fund shares.
Average Annual Total Returns
Fund and Inception Date |
1 Year |
5 Years |
10 Years |
Fund: Schwab Monthly Income Fund – Target Payout (03/28/2008) 1 |
12.17% |
3.82% |
4.85% |
S&P 500 ® Index |
17.88% |
14.42% |
14.82% |
Bloomberg US Aggregate Bond Index |
7.30% |
-0.36% |
2.01% |
Target Payout Composite Index |
11.66% |
3.79% |
5.86% |
All total returns on this page assume dividends and distributions were reinvested. Index figures do not include trading and management costs, which would lower
performance. Indices are unmanaged and cannot be invested in directly. Performance results less than one year are not annualized.
For index definitions, please see www.schwabassetmanagement.com/glossary.
1
The fund’s routine expenses have been absorbed by the investment adviser and its affiliates. Without these reductions, the fund’s returns would have been lower.
T
hese
returns do not reflect the deduction of taxes that a shareholder would pay on fund distributions or the redemption of fund shares.
T
hese
returns do not reflect the deduction of taxes that a shareholder would pay on fund distributions or the redemption of fund shares.
To obtain performance information current to the most recent month end, please
visit
www.schwabassetmanagement.com/prospectus
.
Statistics
Net Assets (millions) |
$53 |
Number of Holdings |
11 |
Portfolio Turnover Rate |
27% |
Advisory Fees Paid by the Fund |
$0 |
12-Month Distribution Yield |
4.78% |
Foreign Tax Paid and Passed Through |
$27,439 |
Gross Income from Foreign Sources |
$372,273 |
Dividends Received Deduction |
19.68% |
Qualified Dividend Income |
$826,390 |
Qualified Business Income (199A) |
$63,878 |
Business Interest Deduction (163j) |
49.76% |
Asset Class Weightings % of Investments
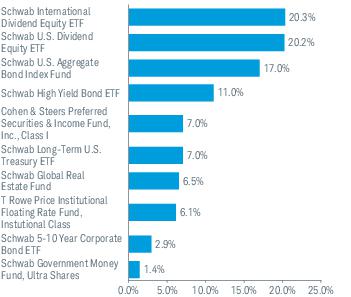
Top Holdings % of Net Assets

Portfolio holdings may have changed since the report date.
Top Holdings % of Net Assets
Portfolio holdings may have changed since the report date.
This annual shareholder report contains important information about the fund for the period of January 1, 2025, to December 31,
2025.
You can find additional information about the fund at
www.schwabassetmanagement.com/prospectus
.
You can also request
this information by calling
1-866-414-6349
or by sending an email request to
orders@mysummaryprospectus.com
.
FUND COSTS FOR THE LAST year ENDED December 31, 2025
(BASED ON A HYPOTHETICAL $10,000 INVESTMENT)
COSTS OF A $10,000 INVESTMENT |
COSTS PAID AS A PERCENTAGE OF A $10,000 INVESTMENT | |
Schwab Monthly Income Fund – Flexible Payout* |
$0 |
0.00% |
*
Expenses were reduced by a contractual fee waiver in effect for so long as the investment adviser serves as adviser to the fund. This agreement to limit the total annual
fund operating expenses is limited to the fund’s direct operating expenses and, therefore, does not apply to acquired fund fees and expenses (AFFE), which are indirect
expenses incurred by the fund through its investments in the underlying funds.
MANAGEMENT’S DISCUSSION OF FUND PERFORMANCE
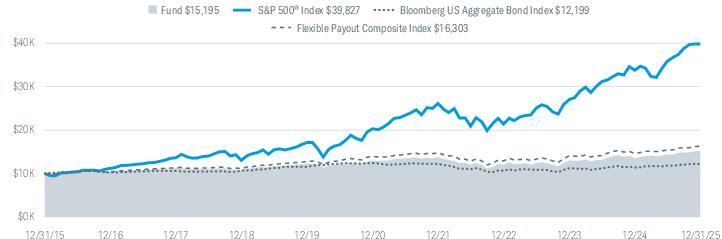
For the 12-month reporting period ended December 31, 2025, the fund returned 12.14%. The S&P 500
®
Index, which provides a
broad measure of equity market performance, and the Bloomberg US Aggregate Bond Index, which provides a broad measure of
bond market performance, returned 17.88% and 7.30%, respectively. The fund’s internally calculated comparative index, the Flexible
Payout Composite Index (the composite index), returned 11.66%.
■
The fund’s distribution yield (payout) was 4.41%
1
■
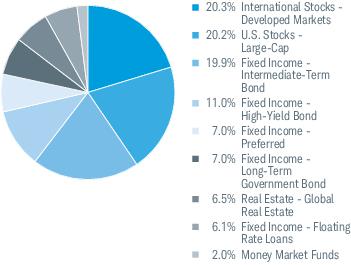
Asset allocations were broadly in line with those of the composite index
■
Top contributors to total return:
●
Schwab International Dividend Equity ETF
●
Schwab U.S. Aggregate Bond Index Fund
■
Over the reporting period, there were no detractors from the return of the fund. However, the smallest contributors to total return
were:
●
BlackRock High Yield Bond Portfolio (Class K)
●
Schwab 5-10 Year Corporate Bond ETF
Portfolio holdings may have changed since the report date.
1
Distributions may exceed income available and may include capital gains or return of capital to help reach the annual payout rate. A return of capital is a distribution from the
shareholder’s investment principal, rather than net profits from the fund’s returns. Shareholders who receive periodic distributions consisting of a return of capital may be
under the impression that they are receiving net profits when they are not. Return of capital reduces your cost basis in the fund’s shares and is not taxable to you until your
cost basis has been reduced to zero. The tax-basis of distributions are finalized at fiscal year-end and may be recharacterized from income distributions to capital gains or
return of capital.
Performance of Hypothetical $10,000 Investment (December 31, 2015 - December 31, 2025)
1
All total returns on this page assume dividends and distributions were reinvested. Index figures do not include trading and management costs, which would lower
performance. Indices are unmanaged and cannot be invested in directly. Performance results less than one year are not annualized.
For index definitions, please see www.schwabassetmanagement.com/glossary.
1
The fund’s routine expenses have been absorbed by the investment adviser and its affiliates. Without these reductions, the fund’s returns would have been lower.
These
returns do not reflect the deduction of taxes that a shareholder would pay on fund distributions or the redemption of fund shares.
Average Annual Total Returns
Fund and Inception Date |
1 Year |
5 Years |
10 Years |
Fund: Schwab Monthly Income Fund – Flexible Payout (03/28/2008) 1 |
12.14% |
3.21% |
4.27% |
S&P 500 ® Index |
17.88% |
14.42% |
14.82% |
Bloomberg US Aggregate Bond Index |
7.30% |
-0.36% |
2.01% |
Flexible Payout Composite Index |
11.66% |
3.19% |
5.01% |
All total returns on this page assume dividends and distributions were reinvested. Index figures do not include trading and management costs, which would lower
performance. Indices are unmanaged and cannot be invested in directly. Performance results less than one year are not annualized.
For index definitions, please see www.schwabassetmanagement.com/glossary.
1
The fund’s routine expenses have been absorbed by the investment adviser and its affiliates. Without these reductions, the fund’s returns would have been lower.
These
returns do not reflect the deduction of taxes that a shareholder would pay on fund distributions or the redemption of fund shares.
These
returns do not reflect the deduction of taxes that a shareholder would pay on fund distributions or the redemption of fund shares.
To obtain performance information current to the most recent month end, please
visit
www.schwabassetmanagement.com/prospectus
.
Statistics
Net Assets (millions) |
$74 |
Number of Holdings |
11 |
Portfolio Turnover Rate |
25% |
Advisory Fees Paid by the Fund |
$0 |
12-Month Distribution Yield |
4.41% |
Foreign Tax Paid and Passed Through |
$42,967 |
Gross Income from Foreign Sources |
$582,942 |
Dividends Received Deduction |
19.61% |
Qualified Dividend Income |
$1,304,411 |
Qualified Business Income (199A) |
$104,678 |
Business Interest Deduction (163j) |
50.68% |
Asset Class Weightings % of Investments
Top Holdings % of Net Assets
Portfolio holdings may have changed since the report date.
Top Holdings % of Net Assets
Portfolio holdings may have changed since the report date.
This annual shareholder report contains important information about the fund for the period of January 1, 2025, to December 31,
2025.
You can find additional information about the fund at
www.schwabassetmanagement.com/prospectus
.
You can also request
this information by calling
1-866-414-6349
or by sending an email request to
orders@mysummaryprospectus.com
.
FUND COSTS FOR THE LAST year ENDED December 31, 2025
(BASED ON A HYPOTHETICAL $10,000 INVESTMENT)
COSTS OF A $10,000 INVESTMENT |
COSTS PAID AS A PERCENTAGE OF A $10,000 INVESTMENT | |
Schwab Monthly Income Fund – Income Payout* |
$0 |
0.00% |
*
Expenses were reduced by a contractual fee waiver in effect for so long as the investment adviser serves as adviser to the fund. This agreement to limit the total annual
fund operating expenses is limited to the fund’s direct operating expenses and, therefore, does not apply to acquired fund fees and expenses (AFFE), which are indirect
expenses incurred by the fund through its investments in the underlying funds.
MANAGEMENT’S DISCUSSION OF FUND PERFORMANCE
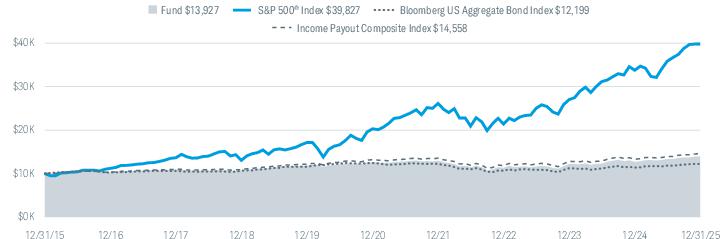
For the 12-month reporting period ended December 31, 2025, the fund returned 9.85%. The S&P 500
®
Index, which provides a
broad measure of equity market performance, and the Bloomberg US Aggregate Bond Index, which provides a broad measure of
bond market performance, returned 17.88% and 7.30%, respectively. The fund’s internally calculated comparative index, the Income
Payout Composite Index (the composite index), returned 9.67%.
■
The fund’s distribution yield (payout) was 4.63%
1
■
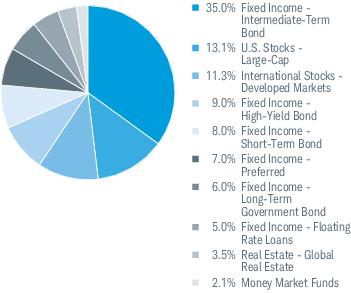
Asset allocations were broadly in line with those of the composite index
■
Top contributors to total return:
●
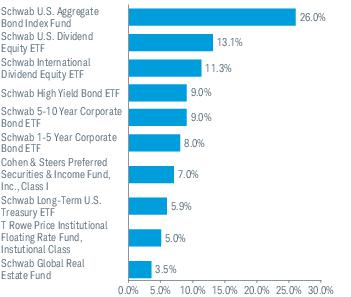
Schwab International Dividend Equity ETF
●
Schwab U.S. Aggregate Bond Index Fund
■
Over the reporting period, there were no detractors from the return of the fund. However, the smallest contributors to total return
were:
●
BlackRock High Yield Bond Portfolio (Class K)
●
Schwab Long-Term U.S. Treasury ETF
Portfolio holdings may have changed since the report date.
1
Does not expect to include capital gains or return of capital to help reach the annual payout rate. A return of capital is a distribution from the shareholder’s investment
principal, rather than net profits from the fund’s returns. Shareholders who receive periodic distributions consisting of a return of capital may be under the impression that
they are receiving net profits when they are not. Return of capital reduces your cost basis in the fund’s shares and is not taxable to you until your cost basis has been reduced
to zero. The tax-basis of distributions are finalized at fiscal year-end and may be recharacterized from income distributions to capital gains or return of capital.
Performance of Hypothetical $10,000 Investment (December 31, 2015 - December 31, 2025)
1
All total returns on this page assume dividends and distributions were reinvested. Index figures do not include trading and management costs, which would lower
performance. Indices are unmanaged and cannot be invested in directly. Performance results less than one year are not annualized.
For index definitions, please see www.schwabassetmanagement.com/glossary.
1
The fund’s routine expenses have been absorbed by the investment adviser and its affiliates. Without these reductions, the fund’s returns would have been lower.
These
returns do not reflect the deduction of taxes that a shareholder would pay on fund distributions or the redemption of fund shares.
Average Annual Total Returns
Fund and Inception Date |
1 Year |
5 Years |
10 Years |
Fund: Schwab Monthly Income Fund – Income Payout (03/28/2008) 1 |
9.85% |
1.97% |
3.37% |
S&P 500 ® Index |
17.88% |
14.42% |
14.82% |
Bloomberg US Aggregate Bond Index |
7.30% |
-0.36% |
2.01% |
Income Payout Composite Index |
9.67% |
2.00% |
3.83% |
All total returns on this page assume dividends and distributions were reinvested. Index figures do not include trading and management costs, which would lower
performance. Indices are unmanaged and cannot be invested in directly. Performance results less than one year are not annualized.
For index definitions, please see www.schwabassetmanagement.com/glossary.
1
The fund’s routine expenses have been absorbed by the investment adviser and its affiliates. Without these reductions, the fund’s returns would have been lower.
These
returns do not reflect the deduction of taxes that a shareholder would pay on fund distributions or the redemption of fund shares.
These
returns do not reflect the deduction of taxes that a shareholder would pay on fund distributions or the redemption of fund shares.
To obtain performance information current to the most recent month end, please
visit
www.schwabassetmanagement.com/prospectus
.
Statistics
Net Assets (millions) |
$66 |
Number of Holdings |
12 |
Portfolio Turnover Rate |
25% |
Advisory Fees Paid by the Fund |
$0 |
12-Month Distribution Yield |
4.63% |
Foreign Tax Paid and Passed Through |
$20,942 |
Gross Income from Foreign Sources |
$284,128 |
Dividends Received Deduction |
13.27% |
Qualified Dividend Income |
$758,708 |
Qualified Business Income (199A) |
$53,212 |
Business Interest Deduction (163j) |
65.64% |
Asset Class Weightings % of Investments
Top Holdings % of Net Assets
Portfolio holdings may have changed since the report date.
Top Holdings % of Net Assets
Portfolio holdings may have changed since the report date.
| [1] | Expenses were reduced by a contractual fee waiver in effect for so long as the investment adviser serves as adviser to the fund. This agreement to limit the total annual fund operating expenses is limited to the fund’s direct operating expenses and, therefore, does not apply to acquired fund fees and expenses (AFFE), which are indirect expenses incurred by the fund through its investments in the underlying funds. |