Shareholder Report
|
12 Months Ended |
|
Dec. 31, 2025
USD ($)
Holding
|
|---|
| Shareholder Report [Line Items] |
|
| Document Type |
N-CSR
|
| Amendment Flag |
false
|
| Registrant Name |
Value Line Larger Companies Focused Fund, Inc.
|
| Entity Central Index Key |
0000102764
|
| Entity Investment Company Type |
N-1A
|
| Document Period End Date |
Dec. 31, 2025
|
| Shareholder Report Annual or Semi-Annual |
Annual Shareholder Report
|
| C000162163 |
|
| Shareholder Report [Line Items] |
|
| Fund Name |
Value Line Larger Companies Focused Fund, Inc.
|
| Class Name |
Institutional
|
| Trading Symbol |
VLLIX
|
| Annual or Semi-Annual Statement [Text Block] |
This annual shareholder report contains important information about Value Line Larger Companies Focused Fund, Inc. (the "Fund") for the period of January 1, 2025 to December 31, 2025.
|
| Additional Information [Text Block] |
You can find additional information about the Fund at www.vlfunds.com. You can also request this information by contacting us at 1-800-243-2729 or investorservices@vlfunds.com.
|
| Additional Information Phone Number |
1-800-243-2729
|
| Additional Information Email |
<span style="box-sizing: border-box; color: rgb(0, 0, 0); display: inline; flex-wrap: nowrap; font-size: 12px; font-weight: 400; grid-area: auto; line-height: 14.4px; margin: 0px; overflow: visible; text-align: left; text-align-last: auto; white-space-collapse: preserve-breaks;">investorservices@vlfunds.com</span>
|
| Additional Information Website |
<span style="box-sizing: border-box; color: rgb(0, 0, 0); display: inline; flex-wrap: nowrap; font-size: 12px; font-weight: 400; grid-area: auto; line-height: 14.4px; margin: 0px; overflow: visible; text-align: left; text-align-last: auto; white-space-collapse: preserve-breaks;">www.vlfunds.com</span>
|
| Expenses [Text Block] |
What were the Fund costs for last year?(based on a hypothetical $10,000 investment)
Class Name |
Costs of a $10,000 investment |
Costs paid as a percentage of a $10,000 investment |
Institutional Class |
$101 |
0.88% | |
| Expenses Paid, Amount |
$ 101
|
| Expense Ratio, Percent |
0.88%
|
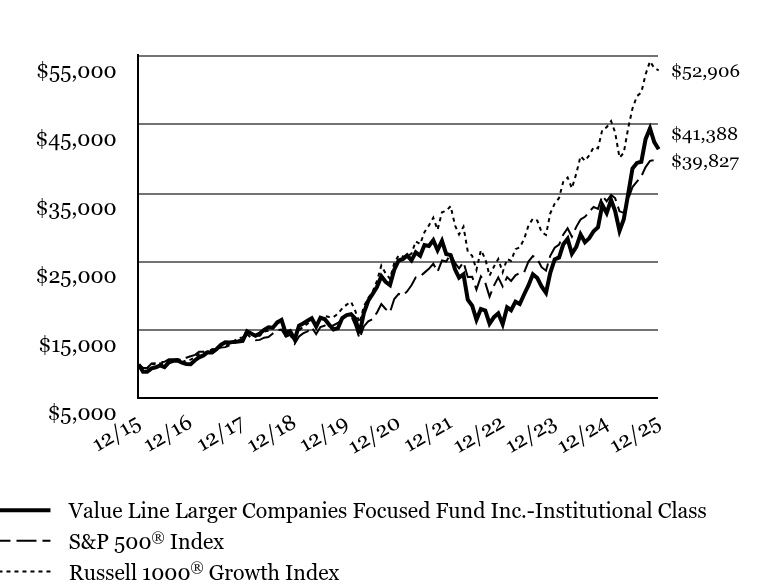
| Factors Affecting Performance [Text Block] |
How did the Fund perform last year? The Fund's Institutional Class generated a total return of 28.92% during the 12 months ended December 31, 2025. • The Fund outperformed the S&P 500® Index (Index) attributable to effective stock selection and sector allocation decisions. The Fund also benefited from its focus on growth companies, which outperformed value-oriented stocks. • Stock selection in financials, health care and industrials contributed most positively. An overweight to information technology also boosted relative results. Stock selection in communication services and energy and an overweight to consumer discretionary detracted. • Individual stocks contributing most positively to the Fund’s relative results were Robinhood Markets, a financial services platform operator; AppLovin, a mobile technology company; and Advanced Micro Devices, a semiconductor company. Robinhood Markets enjoyed a triple-digit share price gain on financial performance, product diversification, market expansion and inclusion in the Index in September 2025. AppLovin, a new Fund position, saw a triple-digit share price gain, reflecting its strategic focus on ad technology, financial performance and market expansion. Shares of Advanced Micro Devices saw a robust double-digit gain on its AI partnerships and demand for the company’s AI accelerators. • Stocks detracting most from the Fund’s relative performance were Strategy, an enterprise analytics software provider that invests in Bitcoin; ServiceNow, a cloud-based solutions provider for digital workflows; and CoreWeave, an AI cloud-computing company—each of which saw a double-digit share price decline. An out-of-Index position in Strategy hurt, reflecting Bitcoin’s price volatility and investor concerns about financing Bitcoin purchases. ServiceNow struggled amid concerns about the impact of AI on its core human resources business and decelerating growth. A new out-of-Index position in CoreWeave was negatively affected by data center delays pressuring its revenue and concerns around its high debt/capital expenditure ratio. |
| Performance Past Does Not Indicate Future [Text] |
<p style="box-sizing: border-box; color: rgb(0, 0, 0); display: block; flex-wrap: nowrap; font-size: 9.33333px; font-weight: 400; grid-area: auto; line-height: 11.2px; margin: 0px; overflow: visible; text-align: justify; text-align-last: left; white-space-collapse: preserve-breaks;">The performance data quoted represent past performance and are no guarantee of future performance. The investment return and principal value of an investment will fluctuate so that an investment, when redeemed, may be worth more or less than its original cost. The performance data includes reinvestments of all dividends and distributions but does not reflect the deduction of taxes that a shareholder would pay on fund distributions or the redemption of fund shares.</p>
|
| Line Graph [Table Text Block] |
|
Value Line Larger Companies Focused Fund Inc.-Institutional Class |
S&P 500® Index |
Russell 1000® Growth Index |
12/15 |
$10,000 |
$10,000 |
$10,000 |
01/16 |
$8,946 |
$9,504 |
$9,442 |
02/16 |
$8,927 |
$9,491 |
$9,438 |
03/16 |
$9,442 |
$10,135 |
$10,074 |
04/16 |
$9,576 |
$10,174 |
$9,982 |
05/16 |
$9,870 |
$10,357 |
$10,176 |
06/16 |
$9,610 |
$10,384 |
$10,136 |
07/16 |
$10,317 |
$10,766 |
$10,615 |
08/16 |
$10,527 |
$10,782 |
$10,562 |
09/16 |
$10,573 |
$10,784 |
$10,600 |
10/16 |
$10,256 |
$10,587 |
$10,351 |
11/16 |
$10,069 |
$10,979 |
$10,577 |
12/16 |
$10,040 |
$11,196 |
$10,708 |
01/17 |
$10,624 |
$11,408 |
$11,068 |
02/17 |
$11,043 |
$11,861 |
$11,528 |
03/17 |
$11,322 |
$11,875 |
$11,662 |
04/17 |
$11,797 |
$11,997 |
$11,928 |
05/17 |
$11,754 |
$12,166 |
$12,238 |
06/17 |
$12,220 |
$12,242 |
$12,206 |
07/17 |
$12,861 |
$12,494 |
$12,531 |
08/17 |
$13,249 |
$12,532 |
$12,760 |
09/17 |
$13,219 |
$12,790 |
$12,926 |
10/17 |
$13,297 |
$13,089 |
$13,427 |
11/17 |
$13,341 |
$13,490 |
$13,835 |
12/17 |
$13,449 |
$13,640 |
$13,943 |
01/18 |
$14,830 |
$14,421 |
$14,930 |
02/18 |
$14,510 |
$13,890 |
$14,539 |
03/18 |
$14,196 |
$13,537 |
$14,140 |
04/18 |
$14,515 |
$13,589 |
$14,189 |
05/18 |
$15,064 |
$13,916 |
$14,811 |
06/18 |
$15,431 |
$14,002 |
$14,954 |
07/18 |
$15,369 |
$14,523 |
$15,393 |
08/18 |
$16,139 |
$14,996 |
$16,235 |
09/18 |
$16,496 |
$15,081 |
$16,325 |
10/18 |
$14,417 |
$14,050 |
$14,865 |
11/18 |
$14,825 |
$14,337 |
$15,023 |
12/18 |
$13,658 |
$13,042 |
$13,732 |
01/19 |
$15,663 |
$14,087 |
$14,966 |
02/19 |
$15,991 |
$14,540 |
$15,501 |
03/19 |
$16,378 |
$14,822 |
$15,943 |
04/19 |
$16,754 |
$15,422 |
$16,663 |
05/19 |
$15,540 |
$14,442 |
$15,610 |
06/19 |
$16,835 |
$15,460 |
$16,682 |
07/19 |
$16,598 |
$15,682 |
$17,059 |
08/19 |
$15,781 |
$15,434 |
$16,928 |
09/19 |
$15,115 |
$15,723 |
$16,930 |
10/19 |
$15,303 |
$16,063 |
$17,408 |
11/19 |
$16,776 |
$16,646 |
$18,180 |
12/19 |
$17,198 |
$17,149 |
$18,729 |
01/20 |
$17,334 |
$17,142 |
$19,147 |
02/20 |
$16,695 |
$15,731 |
$17,843 |
03/20 |
$14,544 |
$13,788 |
$16,088 |
04/20 |
$17,488 |
$15,555 |
$18,468 |
05/20 |
$19,301 |
$16,296 |
$19,708 |
06/20 |
$20,273 |
$16,620 |
$20,567 |
07/20 |
$21,286 |
$17,558 |
$22,149 |
08/20 |
$22,879 |
$18,820 |
$24,434 |
09/20 |
$22,068 |
$18,105 |
$23,285 |
10/20 |
$21,588 |
$17,623 |
$22,494 |
11/20 |
$23,839 |
$19,552 |
$24,797 |
12/20 |
$25,172 |
$20,304 |
$25,938 |
01/21 |
$25,387 |
$20,099 |
$25,746 |
02/21 |
$25,907 |
$20,653 |
$25,740 |
03/21 |
$25,185 |
$21,558 |
$26,182 |
04/21 |
$26,350 |
$22,708 |
$27,963 |
05/21 |
$25,849 |
$22,867 |
$27,577 |
06/21 |
$27,424 |
$23,401 |
$29,307 |
07/21 |
$27,274 |
$23,956 |
$30,273 |
08/21 |
$28,133 |
$24,685 |
$31,404 |
09/21 |
$26,675 |
$23,537 |
$29,646 |
10/21 |
$28,029 |
$25,186 |
$32,213 |
11/21 |
$26,116 |
$25,011 |
$32,410 |
12/21 |
$25,958 |
$26,132 |
$33,096 |
01/22 |
$23,846 |
$24,780 |
$30,255 |
02/22 |
$22,675 |
$24,038 |
$28,970 |
03/22 |
$23,160 |
$24,931 |
$30,103 |
04/22 |
$19,452 |
$22,757 |
$26,468 |
05/22 |
$18,571 |
$22,798 |
$25,853 |
06/22 |
$16,527 |
$20,916 |
$23,805 |
07/22 |
$18,101 |
$22,845 |
$26,662 |
08/22 |
$17,870 |
$21,913 |
$25,420 |
09/22 |
$15,952 |
$19,895 |
$22,949 |
10/22 |
$16,907 |
$21,506 |
$24,290 |
11/22 |
$17,467 |
$22,708 |
$25,397 |
12/22 |
$15,874 |
$21,399 |
$23,453 |
01/23 |
$18,347 |
$22,744 |
$25,407 |
02/23 |
$17,925 |
$22,189 |
$25,106 |
03/23 |
$19,166 |
$23,004 |
$26,822 |
04/23 |
$18,820 |
$23,363 |
$27,086 |
05/23 |
$20,247 |
$23,464 |
$28,321 |
06/23 |
$21,531 |
$25,015 |
$30,258 |
07/23 |
$23,152 |
$25,818 |
$31,277 |
08/23 |
$22,620 |
$25,407 |
$30,996 |
09/23 |
$21,387 |
$24,196 |
$29,310 |
10/23 |
$20,458 |
$23,687 |
$28,893 |
11/23 |
$23,363 |
$25,850 |
$32,043 |
12/23 |
$25,322 |
$27,025 |
$33,462 |
01/24 |
$25,617 |
$27,479 |
$34,296 |
02/24 |
$27,500 |
$28,946 |
$36,636 |
03/24 |
$28,319 |
$29,878 |
$37,281 |
04/24 |
$26,158 |
$28,657 |
$35,700 |
05/24 |
$27,145 |
$30,078 |
$37,837 |
06/24 |
$28,978 |
$31,157 |
$40,388 |
07/24 |
$27,821 |
$31,537 |
$39,701 |
08/24 |
$28,437 |
$32,302 |
$40,528 |
09/24 |
$29,442 |
$32,992 |
$41,677 |
10/24 |
$30,016 |
$32,692 |
$41,539 |
11/24 |
$33,275 |
$34,611 |
$44,233 |
12/24 |
$32,103 |
$33,786 |
$44,623 |
01/25 |
$33,991 |
$34,727 |
$45,506 |
02/25 |
$32,415 |
$34,274 |
$43,871 |
03/25 |
$29,488 |
$32,343 |
$40,175 |
04/25 |
$31,203 |
$32,124 |
$40,887 |
05/25 |
$34,883 |
$34,146 |
$44,505 |
06/25 |
$38,590 |
$35,882 |
$47,342 |
07/25 |
$39,404 |
$36,687 |
$49,129 |
08/25 |
$39,568 |
$37,431 |
$49,679 |
09/25 |
$42,868 |
$38,797 |
$52,318 |
10/25 |
$44,444 |
$39,706 |
$54,218 |
11/25 |
$42,444 |
$39,803 |
$53,236 |
12/25 |
$41,388 |
$39,827 |
$52,906 |
|
| Average Annual Return [Table Text Block] |
AATR |
1 Year |
5 Years |
10 Years |
Institutional Class |
28.92% |
10.46% |
15.26% |
S&P 500® Index |
17.88% |
14.42% |
14.82% |
Russell 1000® Growth Index |
18.56% |
15.32% |
18.13% | |
| AssetsNet |
$ 455,948,461
|
| Holdings Count | Holding |
32
|
| Advisory Fees Paid, Amount |
$ 3,012,473
|
| InvestmentCompanyPortfolioTurnover |
38.00%
|
| Additional Fund Statistics [Text Block] |
Total Net Assets |
$455,948,461 |
# of Portfolio Holdings |
32 |
Portfolio Turnover Rate |
38% |
Total Advisory Fees Paid |
$3,012,473 | |
| Holdings [Text Block] |
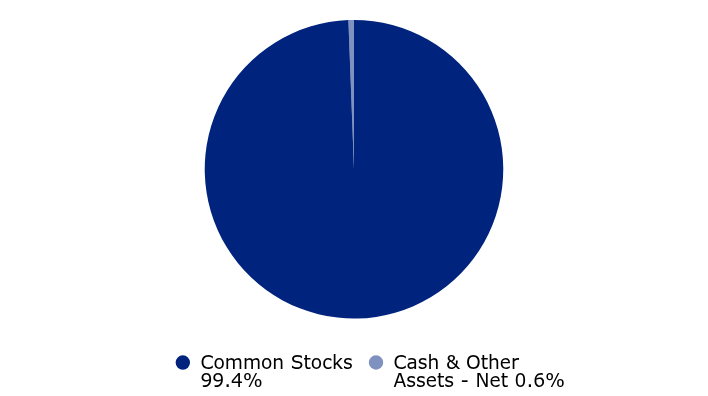
Asset Allocation (% of Net Assets)
Value |
Value |
Common Stocks |
99.4% |
Cash & Other Assets - Net |
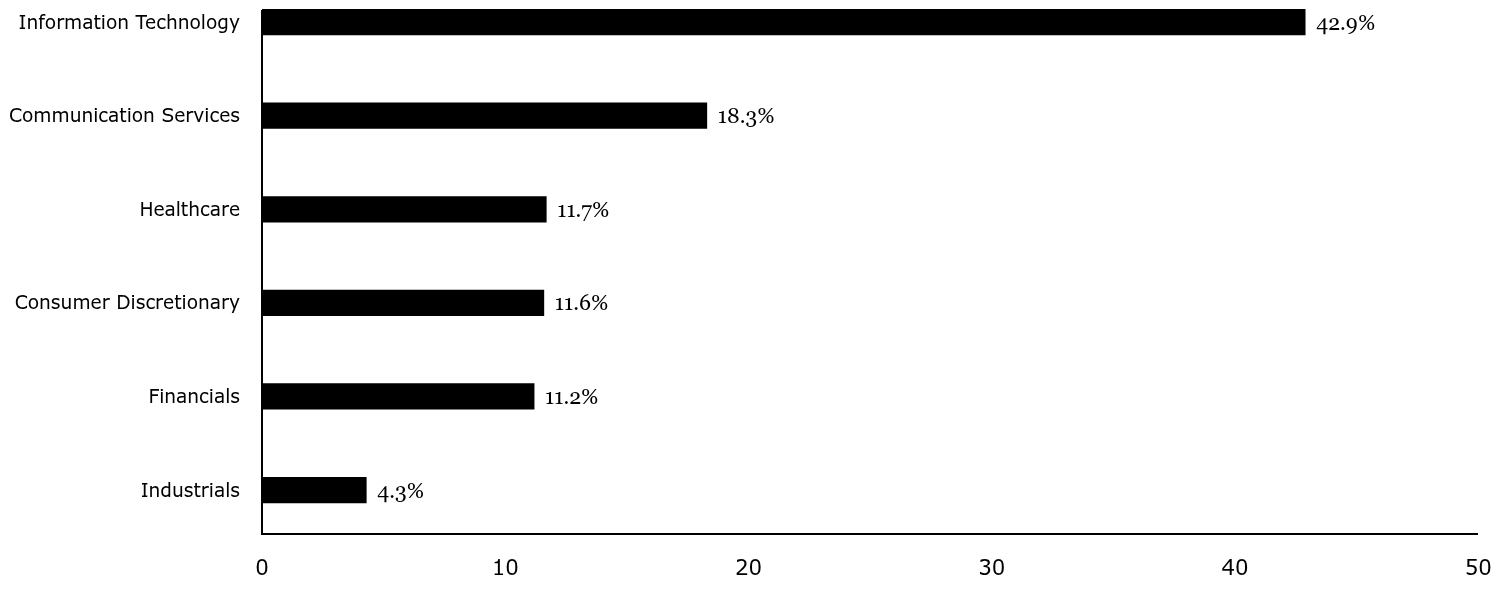
0.6% | Sector Weightings (% of Total Investments In Securities)*
Value |
Value |
Industrials |
4.3% |
Financials |
11.2% |
Consumer Discretionary |
11.6% |
Healthcare |
11.7% |
Communication Services |
18.3% |
Information Technology |
42.9% | * Excludes Short-term Investments, if any. |
| Largest Holdings [Text Block] |
Ten Largest Holdings (% of Net Assets)*
NVIDIA Corp. |
8.4% |
Meta Platforms, Inc. |
6.8% |
Alphabet, Inc. |
5.9% |
AppLovin Corp. |
5.5% |
Advanced Micro Devices, Inc. |
5.2% |
Amazon.com, Inc. |
4.8% |
Robinhood Markets, Inc. |
4.7% |
Uber Technologies, Inc. |
4.3% |
Madrigal Pharmaceuticals, Inc. |
4.0% |
Tesla, Inc. |
3.8% | |
| Material Fund Change [Text Block] |
|
| Updated Prospectus Phone Number |
800-243-2729
|
| Updated Prospectus Email Address |
<span style="box-sizing: border-box; color: rgb(0, 0, 0); display: inline; flex-wrap: nowrap; font-size: 12px; font-weight: 400; grid-area: auto; line-height: 14.4px; margin: 0px; overflow: visible; text-align: left; text-align-last: auto; white-space-collapse: preserve-breaks;">investorservices@vlfunds.com</span>
|
| C000020637 |
|
| Shareholder Report [Line Items] |
|
| Fund Name |
Value Line Larger Companies Focused Fund, Inc.
|
| Class Name |
Investor
|
| Trading Symbol |
VALLX
|
| Annual or Semi-Annual Statement [Text Block] |
This annual shareholder report contains important information about Value Line Larger Companies Focused Fund, Inc. (the "Fund") for the period of January 1, 2025 to December 31, 2025.
|
| Additional Information [Text Block] |
You can find additional information about the Fund at www.vlfunds.com. You can also request this information by contacting us at 1-800-243-2729 or investorservices@vlfunds.com.
|
| Additional Information Phone Number |
1-800-243-2729
|
| Additional Information Email |
<span style="box-sizing: border-box; color: rgb(0, 0, 0); display: inline; flex-wrap: nowrap; font-size: 12px; font-weight: 400; grid-area: auto; line-height: 14.4px; margin: 0px; overflow: visible; text-align: left; text-align-last: auto; white-space-collapse: preserve-breaks;">investorservices@vlfunds.com</span>
|
| Additional Information Website |
<span style="box-sizing: border-box; color: rgb(0, 0, 0); display: inline; flex-wrap: nowrap; font-size: 12px; font-weight: 400; grid-area: auto; line-height: 14.4px; margin: 0px; overflow: visible; text-align: left; text-align-last: auto; white-space-collapse: preserve-breaks;">www.vlfunds.com</span>
|
| Expenses [Text Block] |
What were the Fund costs for last year?(based on a hypothetical $10,000 investment)
Class Name |
Costs of a $10,000 investment |
Costs paid as a percentage of a $10,000 investment |
Investor Class |
$129 |
1.13% | |
| Expenses Paid, Amount |
$ 129
|
| Expense Ratio, Percent |
1.13%
|
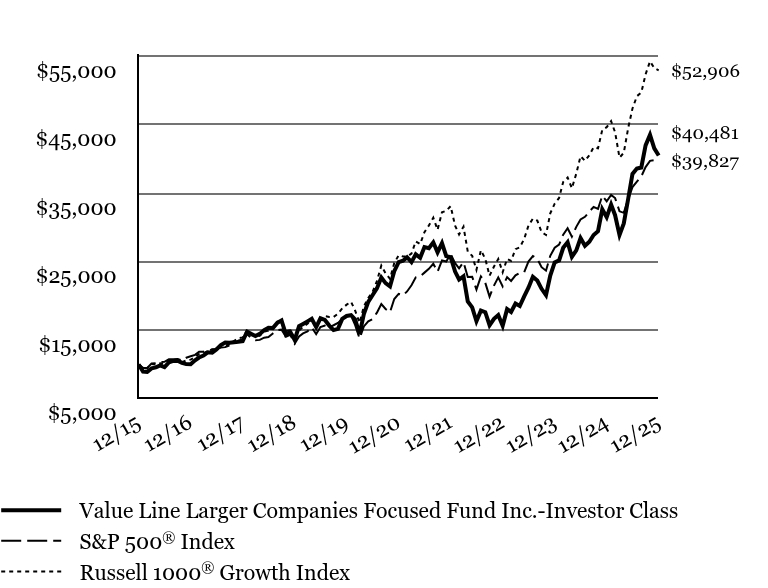
| Factors Affecting Performance [Text Block] |
How did the Fund perform last year? The Fund's Investor Class generated a total return of 28.58% during the 12 months ended December 31, 2025. • The Fund outperformed the S&P 500® Index (Index) attributable to effective stock selection and sector allocation decisions. The Fund also benefited from its focus on growth companies, which outperformed value-oriented stocks. • Stock selection in financials, health care and industrials contributed most positively. An overweight to information technology also boosted relative results. Stock selection in communication services and energy and an overweight to consumer discretionary detracted. • Individual stocks contributing most positively to the Fund’s relative results were Robinhood Markets, a financial services platform operator; AppLovin, a mobile technology company; and Advanced Micro Devices, a semiconductor company. Robinhood Markets enjoyed a triple-digit share price gain on financial performance, product diversification, market expansion and inclusion in the Index in September 2025. AppLovin, a new Fund position, saw a triple-digit share price gain, reflecting its strategic focus on ad technology, financial performance and market expansion. Shares of Advanced Micro Devices saw a robust double-digit gain on its AI partnerships and demand for the company’s AI accelerators. • Stocks detracting most from the Fund’s relative performance were Strategy, an enterprise analytics software provider that invests in Bitcoin; ServiceNow, a cloud-based solutions provider for digital workflows; and CoreWeave, an AI cloud-computing company—each of which saw a double-digit share price decline. An out-of-Index position in Strategy hurt, reflecting Bitcoin’s price volatility and investor concerns about financing Bitcoin purchases. ServiceNow struggled amid concerns about the impact of AI on its core human resources business and decelerating growth. A new out-of-Index position in CoreWeave was negatively affected by data center delays pressuring its revenue and concerns around its high debt/capital expenditure ratio. |
| Performance Past Does Not Indicate Future [Text] |
<p style="box-sizing: border-box; color: rgb(0, 0, 0); display: block; flex-wrap: nowrap; font-size: 9.33333px; font-weight: 400; grid-area: auto; line-height: 11.2px; margin: 0px; overflow: visible; text-align: justify; text-align-last: left; white-space-collapse: preserve-breaks;">The performance data quoted represent past performance and are no guarantee of future performance. The investment return and principal value of an investment will fluctuate so that an investment, when redeemed, may be worth more or less than its original cost. The performance data includes reinvestments of all dividends and distributions but does not reflect the deduction of taxes that a shareholder would pay on fund distributions or the redemption of fund shares.</p>
|
| Line Graph [Table Text Block] |
|
Value Line Larger Companies Focused Fund Inc.-Investor Class |
S&P 500® Index |
Russell 1000® Growth Index |
12/15 |
$10,000 |
$10,000 |
$10,000 |
01/16 |
$8,960 |
$9,504 |
$9,442 |
02/16 |
$8,926 |
$9,491 |
$9,438 |
03/16 |
$9,436 |
$10,135 |
$10,074 |
04/16 |
$9,570 |
$10,174 |
$9,982 |
05/16 |
$9,867 |
$10,357 |
$10,176 |
06/16 |
$9,604 |
$10,384 |
$10,136 |
07/16 |
$10,305 |
$10,766 |
$10,615 |
08/16 |
$10,518 |
$10,782 |
$10,562 |
09/16 |
$10,560 |
$10,784 |
$10,600 |
10/16 |
$10,244 |
$10,587 |
$10,351 |
11/16 |
$10,053 |
$10,979 |
$10,577 |
12/16 |
$10,024 |
$11,196 |
$10,708 |
01/17 |
$10,607 |
$11,408 |
$11,068 |
02/17 |
$11,020 |
$11,861 |
$11,528 |
03/17 |
$11,298 |
$11,875 |
$11,662 |
04/17 |
$11,772 |
$11,997 |
$11,928 |
05/17 |
$11,729 |
$12,166 |
$12,238 |
06/17 |
$12,194 |
$12,242 |
$12,206 |
07/17 |
$12,829 |
$12,494 |
$12,531 |
08/17 |
$13,216 |
$12,532 |
$12,760 |
09/17 |
$13,182 |
$12,790 |
$12,926 |
10/17 |
$13,260 |
$13,089 |
$13,427 |
11/17 |
$13,299 |
$13,490 |
$13,835 |
12/17 |
$13,412 |
$13,640 |
$13,943 |
01/18 |
$14,779 |
$14,421 |
$14,930 |
02/18 |
$14,465 |
$13,890 |
$14,539 |
03/18 |
$14,151 |
$13,537 |
$14,140 |
04/18 |
$14,460 |
$13,589 |
$14,189 |
05/18 |
$15,008 |
$13,916 |
$14,811 |
06/18 |
$15,369 |
$14,002 |
$14,954 |
07/18 |
$15,308 |
$14,523 |
$15,393 |
08/18 |
$16,071 |
$14,996 |
$16,235 |
09/18 |
$16,422 |
$15,081 |
$16,325 |
10/18 |
$14,353 |
$14,050 |
$14,865 |
11/18 |
$14,755 |
$14,337 |
$15,023 |
12/18 |
$13,587 |
$13,042 |
$13,732 |
01/19 |
$15,581 |
$14,087 |
$14,966 |
02/19 |
$15,908 |
$14,540 |
$15,501 |
03/19 |
$16,289 |
$14,822 |
$15,943 |
04/19 |
$16,659 |
$15,422 |
$16,663 |
05/19 |
$15,447 |
$14,442 |
$15,610 |
06/19 |
$16,729 |
$15,460 |
$16,682 |
07/19 |
$16,493 |
$15,682 |
$17,059 |
08/19 |
$15,678 |
$15,434 |
$16,928 |
09/19 |
$15,018 |
$15,723 |
$16,930 |
10/19 |
$15,195 |
$16,063 |
$17,408 |
11/19 |
$16,659 |
$16,646 |
$18,180 |
12/19 |
$17,075 |
$17,149 |
$18,729 |
01/20 |
$17,205 |
$17,142 |
$19,147 |
02/20 |
$16,566 |
$15,731 |
$17,843 |
03/20 |
$14,432 |
$13,788 |
$16,088 |
04/20 |
$17,341 |
$15,555 |
$18,468 |
05/20 |
$19,138 |
$16,296 |
$19,708 |
06/20 |
$20,096 |
$16,620 |
$20,567 |
07/20 |
$21,095 |
$17,558 |
$22,149 |
08/20 |
$22,674 |
$18,820 |
$24,434 |
09/20 |
$21,864 |
$18,105 |
$23,285 |
10/20 |
$21,385 |
$17,623 |
$22,494 |
11/20 |
$23,614 |
$19,552 |
$24,797 |
12/20 |
$24,927 |
$20,304 |
$25,938 |
01/21 |
$25,128 |
$20,099 |
$25,746 |
02/21 |
$25,641 |
$20,653 |
$25,740 |
03/21 |
$24,927 |
$21,558 |
$26,182 |
04/21 |
$26,070 |
$22,708 |
$27,963 |
05/21 |
$25,570 |
$22,867 |
$27,577 |
06/21 |
$27,123 |
$23,401 |
$29,307 |
07/21 |
$26,967 |
$23,956 |
$30,273 |
08/21 |
$27,819 |
$24,685 |
$31,404 |
09/21 |
$26,363 |
$23,537 |
$29,646 |
10/21 |
$27,702 |
$25,186 |
$32,213 |
11/21 |
$25,804 |
$25,011 |
$32,410 |
12/21 |
$25,646 |
$26,132 |
$33,096 |
01/22 |
$23,556 |
$24,780 |
$30,255 |
02/22 |
$22,399 |
$24,038 |
$28,970 |
03/22 |
$22,869 |
$24,931 |
$30,103 |
04/22 |
$19,197 |
$22,757 |
$26,468 |
05/22 |
$18,331 |
$22,798 |
$25,853 |
06/22 |
$16,309 |
$20,916 |
$23,805 |
07/22 |
$17,854 |
$22,845 |
$26,662 |
08/22 |
$17,622 |
$21,913 |
$25,420 |
09/22 |
$15,726 |
$19,895 |
$22,949 |
10/22 |
$16,667 |
$21,506 |
$24,290 |
11/22 |
$17,219 |
$22,708 |
$25,397 |
12/22 |
$15,648 |
$21,399 |
$23,453 |
01/23 |
$18,077 |
$22,744 |
$25,407 |
02/23 |
$17,662 |
$22,189 |
$25,106 |
03/23 |
$18,881 |
$23,004 |
$26,822 |
04/23 |
$18,534 |
$23,363 |
$27,086 |
05/23 |
$19,938 |
$23,464 |
$28,321 |
06/23 |
$21,199 |
$25,015 |
$30,258 |
07/23 |
$22,782 |
$25,818 |
$31,277 |
08/23 |
$22,249 |
$25,407 |
$30,996 |
09/23 |
$21,039 |
$24,196 |
$29,310 |
10/23 |
$20,116 |
$23,687 |
$28,893 |
11/23 |
$22,968 |
$25,850 |
$32,043 |
12/23 |
$24,889 |
$27,025 |
$33,462 |
01/24 |
$25,177 |
$27,479 |
$34,296 |
02/24 |
$27,022 |
$28,946 |
$36,636 |
03/24 |
$27,826 |
$29,878 |
$37,281 |
04/24 |
$25,693 |
$28,657 |
$35,700 |
05/24 |
$26,658 |
$30,078 |
$37,837 |
06/24 |
$28,452 |
$31,157 |
$40,388 |
07/24 |
$27,309 |
$31,537 |
$39,701 |
08/24 |
$27,910 |
$32,302 |
$40,528 |
09/24 |
$28,884 |
$32,992 |
$41,677 |
10/24 |
$29,442 |
$32,692 |
$41,539 |
11/24 |
$32,633 |
$34,611 |
$44,233 |
12/24 |
$31,483 |
$33,786 |
$44,623 |
01/25 |
$33,324 |
$34,727 |
$45,506 |
02/25 |
$31,778 |
$34,274 |
$43,871 |
03/25 |
$28,904 |
$32,343 |
$40,175 |
04/25 |
$30,580 |
$32,124 |
$40,887 |
05/25 |
$34,175 |
$34,146 |
$44,505 |
06/25 |
$37,797 |
$35,882 |
$47,342 |
07/25 |
$38,587 |
$36,687 |
$49,129 |
08/25 |
$38,735 |
$37,431 |
$49,679 |
09/25 |
$41,966 |
$38,797 |
$52,318 |
10/25 |
$43,494 |
$39,706 |
$54,218 |
11/25 |
$41,532 |
$39,803 |
$53,236 |
12/25 |
$40,481 |
$39,827 |
$52,906 |
|
| Average Annual Return [Table Text Block] |
AATR |
1 Year |
5 Years |
10 Years |
Investor Class |
28.58% |
10.18% |
15.01% |
S&P 500® Index |
17.88% |
14.42% |
14.82% |
Russell 1000® Growth Index |
18.56% |
15.32% |
18.13% | |
| AssetsNet |
$ 455,948,461
|
| Holdings Count | Holding |
32
|
| Advisory Fees Paid, Amount |
$ 3,012,473
|
| InvestmentCompanyPortfolioTurnover |
38.00%
|
| Additional Fund Statistics [Text Block] |
Total Net Assets |
$455,948,461 |
# of Portfolio Holdings |
32 |
Portfolio Turnover Rate |
38% |
Total Advisory Fees Paid |
$3,012,473 | |
| Holdings [Text Block] |
Asset Allocation (% of Net Assets)
Value |
Value |
Common Stocks |
99.4% |
Cash & Other Assets - Net |
0.6% | Sector Weightings (% of Total Investments In Securities)*
Value |
Value |
Industrials |
4.3% |
Financials |
11.2% |
Consumer Discretionary |
11.6% |
Healthcare |
11.7% |
Communication Services |
18.3% |
Information Technology |
42.9% | * Excludes Short-term Investments, if any. |
| Largest Holdings [Text Block] |
Ten Largest Holdings (% of Net Assets)*
NVIDIA Corp. |
8.4% |
Meta Platforms, Inc. |
6.8% |
Alphabet, Inc. |
5.9% |
AppLovin Corp. |
5.5% |
Advanced Micro Devices, Inc. |
5.2% |
Amazon.com, Inc. |
4.8% |
Robinhood Markets, Inc. |
4.7% |
Uber Technologies, Inc. |
4.3% |
Madrigal Pharmaceuticals, Inc. |
4.0% |
Tesla, Inc. |
3.8% | |
| Material Fund Change [Text Block] |
|
| Updated Prospectus Phone Number |
800-243-2729
|
| Updated Prospectus Email Address |
<span style="box-sizing: border-box; color: rgb(0, 0, 0); display: inline; flex-wrap: nowrap; font-size: 12px; font-weight: 400; grid-area: auto; line-height: 14.4px; margin: 0px; overflow: visible; text-align: left; text-align-last: auto; white-space-collapse: preserve-breaks;">investorservices@vlfunds.com</span>
|