Shareholder Report
|
12 Months Ended |
|
Dec. 31, 2025
USD ($)
Holding
|
|---|
| Shareholder Report [Line Items] |
|
| Document Type |
N-CSR
|
| Amendment Flag |
false
|
| Registrant Name |
VALUE LINE CAPITAL APPRECIATION FUND INC
|
| Entity Central Index Key |
0000102757
|
| Entity Investment Company Type |
N-1A
|
| Document Period End Date |
Dec. 31, 2025
|
| Shareholder Report Annual or Semi-Annual |
Annual Shareholder Report
|
| C000162171 |
|
| Shareholder Report [Line Items] |
|
| Fund Name |
Value Line Capital Appreciation Fund, Inc.
|
| Class Name |
Institutional
|
| Trading Symbol |
VLIIX
|
| Annual or Semi-Annual Statement [Text Block] |
This annual shareholder report contains important information about Value Line Capital Appreciation Fund, Inc. (the "Fund") for the period of January 1, 2025 to December 31, 2025.
|
| Additional Information [Text Block] |
You can find additional information about the Fund at www.vlfunds.com. You can also request this information by contacting us at 1-800-243-2729 or investorservices@vlfunds.com.
|
| Additional Information Phone Number |
1-800-243-2729
|
| Additional Information Email |
<span style="box-sizing: border-box; color: rgb(0, 0, 0); display: inline; flex-wrap: nowrap; font-size: 12px; font-weight: 400; grid-area: auto; line-height: 14.4px; margin: 0px; overflow: visible; text-align: left; text-align-last: auto; white-space-collapse: preserve-breaks;">investorservices@vlfunds.com</span>
|
| Additional Information Website |
<span style="box-sizing: border-box; color: rgb(0, 0, 0); display: inline; flex-wrap: nowrap; font-size: 12px; font-weight: 400; grid-area: auto; line-height: 14.4px; margin: 0px; overflow: visible; text-align: left; text-align-last: auto; white-space-collapse: preserve-breaks;">www.vlfunds.com</span>
|
| Expenses [Text Block] |
What were the Fund costs for last year?(based on a hypothetical $10,000 investment)
Class Name |
Costs of a $10,000 investment |
Costs paid as a percentage of a $10,000 investment |
Institutional Class |
$92 |
0.83% | |
| Expenses Paid, Amount |
$ 92
|
| Expense Ratio, Percent |
0.83%
|
| Factors Affecting Performance [Text Block] |
How did the Fund perform last year? The Fund's Institutional Class generated a total return of 21.07% during the 12 months ended December 31, 2025. • The Fund outperformed its blended benchmark. Asset Allocation, i.e., being overweight equities and underweight fixed income, helped. The Fund’s equity portfolio outperformed the S&P 500® Index, due to stock selection, sector allocation decisions and growth stocks’ strong performance. The Fund’s fixed income portfolio modestly outperformed the Bloomberg Index. • The Fund’s equity portfolio was boosted most by stock selection in financials, health care and information technology and by an overweight to information technology. The only sector that detracted was energy, wherein stock selection was weak. • Stocks contributing most positively were Micron Technology and Advanced Micro Devices, each a semiconductor company, and Robinhood Markets, a financial services platform operator. Micron Technology benefited from AI-driven demand for its memory chips. Advanced Micro Devices gained on its AI partnerships and demand for its AI accelerators. Robinhood Markets rose on product diversification, market expansion and inclusion in the S&P 500® Index in September 2025 • Detracting most were out-of-Index positions in Strategy and Coinbase Global and an overweight in Chipotle Mexican Grill. Strategy, an enterprise analytics software provider that invests in Bitcoin, was hurt by Bitcoin’s price volatility and investor concerns about financing Bitcoin purchases. Coinbase Global, a crypto exchange and technology company, was affected by broader crypto market declines. Chipotle Mexican Grill, a fast-casual restaurant chain operator, saw increasing costs, margin pressures and weaker traffic trends. We sold the Fund’s position in Chipotle Mexican Grill. • The fixed income portion of the Fund was helped most by sector allocation decisions. Overweights in corporate bonds, particularly BBB-rated bonds, and an underweight to U.S. Treasuries contributed most positively. Yield curve positioning also added value. An underweight to securitized debt and duration positioning modestly detracted. |
| Performance Past Does Not Indicate Future [Text] |
<p style="box-sizing: border-box; color: rgb(0, 0, 0); display: block; flex-wrap: nowrap; font-size: 9.33333px; font-weight: 400; grid-area: auto; line-height: 11.2px; margin: 0px; overflow: visible; text-align: justify; text-align-last: left; white-space-collapse: preserve-breaks;">The performance data quoted represent past performance and are no guarantee of future performance. The investment return and principal value of an investment will fluctuate so that an investment, when redeemed, may be worth more or less than its original cost. The performance data includes reinvestments of all dividends and distributions but does not reflect the deduction of taxes that a shareholder would pay on fund distributions or the redemption of fund shares.</p>
|
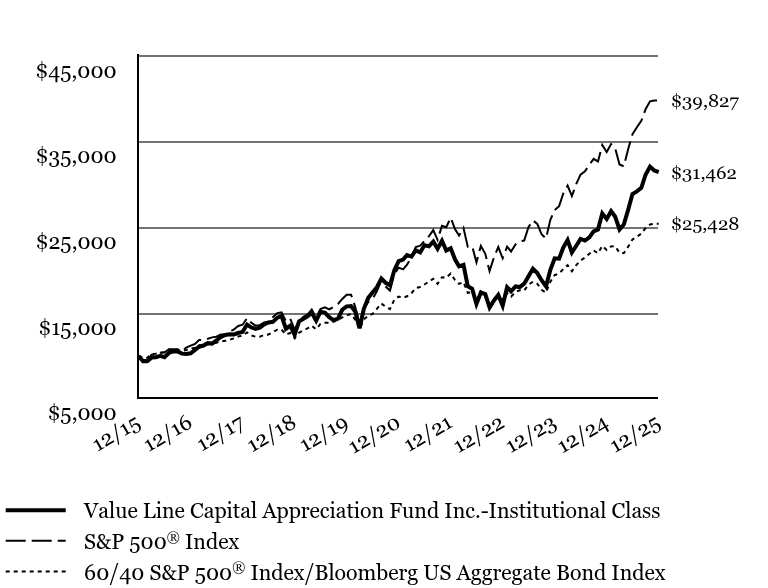
| Line Graph [Table Text Block] |
|
Value Line Capital Appreciation Fund Inc.-Institutional Class |
S&P 500® Index |
60/40 S&P 500® Index/Bloomberg US Aggregate Bond Index |
12/15 |
$10,000 |
$10,000 |
$10,000 |
01/16 |
$9,364 |
$9,504 |
$9,757 |
02/16 |
$9,364 |
$9,491 |
$9,777 |
03/16 |
$9,803 |
$10,135 |
$10,211 |
04/16 |
$9,837 |
$10,174 |
$10,250 |
05/16 |
$10,011 |
$10,357 |
$10,362 |
06/16 |
$9,858 |
$10,384 |
$10,452 |
07/16 |
$10,344 |
$10,766 |
$10,710 |
08/16 |
$10,541 |
$10,782 |
$10,714 |
09/16 |
$10,520 |
$10,784 |
$10,713 |
10/16 |
$10,265 |
$10,587 |
$10,563 |
11/16 |
$10,231 |
$10,979 |
$10,698 |
12/16 |
$10,306 |
$11,196 |
$10,831 |
01/17 |
$10,710 |
$11,408 |
$10,962 |
02/17 |
$11,076 |
$11,861 |
$11,253 |
03/17 |
$11,210 |
$11,875 |
$11,258 |
04/17 |
$11,491 |
$11,997 |
$11,363 |
05/17 |
$11,442 |
$12,166 |
$11,494 |
06/17 |
$11,801 |
$12,242 |
$11,532 |
07/17 |
$12,205 |
$12,494 |
$11,694 |
08/17 |
$12,438 |
$12,532 |
$11,757 |
09/17 |
$12,524 |
$12,790 |
$11,881 |
10/17 |
$12,511 |
$13,089 |
$12,050 |
11/17 |
$12,671 |
$13,490 |
$12,265 |
12/17 |
$12,812 |
$13,640 |
$12,370 |
01/18 |
$13,666 |
$14,421 |
$12,738 |
02/18 |
$13,342 |
$13,890 |
$12,408 |
03/18 |
$13,150 |
$13,537 |
$12,250 |
04/18 |
$13,293 |
$13,589 |
$12,242 |
05/18 |
$13,681 |
$13,916 |
$12,454 |
06/18 |
$13,911 |
$14,002 |
$12,494 |
07/18 |
$13,976 |
$14,523 |
$12,774 |
08/18 |
$14,455 |
$14,996 |
$13,056 |
09/18 |
$14,650 |
$15,081 |
$13,067 |
10/18 |
$13,172 |
$14,050 |
$12,490 |
11/18 |
$13,522 |
$14,337 |
$12,673 |
12/18 |
$12,478 |
$13,042 |
$12,079 |
01/19 |
$14,035 |
$14,087 |
$12,711 |
02/19 |
$14,302 |
$14,540 |
$12,953 |
03/19 |
$14,625 |
$14,822 |
$13,204 |
04/19 |
$15,032 |
$15,422 |
$13,526 |
05/19 |
$14,106 |
$14,442 |
$13,106 |
06/19 |
$15,130 |
$15,460 |
$13,726 |
07/19 |
$15,060 |
$15,682 |
$13,857 |
08/19 |
$14,527 |
$15,434 |
$13,869 |
09/19 |
$14,162 |
$15,723 |
$13,995 |
10/19 |
$14,344 |
$16,063 |
$14,194 |
11/19 |
$15,383 |
$16,646 |
$14,500 |
12/19 |
$15,785 |
$17,149 |
$14,758 |
01/20 |
$15,816 |
$17,142 |
$14,869 |
02/20 |
$15,183 |
$15,731 |
$14,241 |
03/20 |
$13,221 |
$13,788 |
$13,152 |
04/20 |
$15,507 |
$15,555 |
$14,257 |
05/20 |
$16,774 |
$16,296 |
$14,691 |
06/20 |
$17,407 |
$16,620 |
$14,904 |
07/20 |
$18,025 |
$17,558 |
$15,497 |
08/20 |
$19,029 |
$18,820 |
$16,115 |
09/20 |
$18,534 |
$18,105 |
$15,744 |
10/20 |
$18,241 |
$17,623 |
$15,465 |
11/20 |
$19,986 |
$19,552 |
$16,541 |
12/20 |
$21,061 |
$20,304 |
$16,932 |
01/21 |
$21,241 |
$20,099 |
$16,781 |
02/21 |
$21,780 |
$20,653 |
$16,962 |
03/21 |
$21,600 |
$21,558 |
$17,323 |
04/21 |
$22,335 |
$22,708 |
$17,932 |
05/21 |
$22,074 |
$22,867 |
$18,031 |
06/21 |
$22,906 |
$23,401 |
$18,334 |
07/21 |
$22,792 |
$23,956 |
$18,677 |
08/21 |
$23,347 |
$24,685 |
$19,004 |
09/21 |
$22,514 |
$23,537 |
$18,408 |
10/21 |
$23,445 |
$25,186 |
$19,179 |
11/21 |
$22,302 |
$25,011 |
$19,122 |
12/21 |
$22,562 |
$26,132 |
$19,617 |
01/22 |
$21,251 |
$24,780 |
$18,839 |
02/22 |
$20,450 |
$24,038 |
$18,416 |
03/22 |
$20,632 |
$24,931 |
$18,622 |
04/22 |
$18,137 |
$22,757 |
$17,365 |
05/22 |
$17,828 |
$22,798 |
$17,429 |
06/22 |
$16,061 |
$20,916 |
$16,456 |
07/22 |
$17,391 |
$22,845 |
$17,528 |
08/22 |
$17,209 |
$21,913 |
$16,901 |
09/22 |
$15,642 |
$19,895 |
$15,675 |
10/22 |
$16,480 |
$21,506 |
$16,355 |
11/22 |
$17,117 |
$22,708 |
$17,144 |
12/22 |
$15,853 |
$21,399 |
$16,520 |
01/23 |
$18,011 |
$22,744 |
$17,346 |
02/23 |
$17,548 |
$22,189 |
$16,913 |
03/23 |
$18,112 |
$23,004 |
$17,457 |
04/23 |
$18,032 |
$23,363 |
$17,663 |
05/23 |
$18,435 |
$23,464 |
$17,632 |
06/23 |
$19,282 |
$25,015 |
$18,306 |
07/23 |
$20,170 |
$25,818 |
$18,654 |
08/23 |
$19,665 |
$25,407 |
$18,428 |
09/23 |
$18,838 |
$24,196 |
$17,714 |
10/23 |
$18,112 |
$23,687 |
$17,378 |
11/23 |
$20,008 |
$25,850 |
$18,645 |
12/23 |
$21,387 |
$27,025 |
$19,439 |
01/24 |
$21,346 |
$27,479 |
$19,614 |
02/24 |
$22,630 |
$28,946 |
$20,131 |
03/24 |
$23,526 |
$29,878 |
$20,594 |
04/24 |
$22,080 |
$28,657 |
$19,882 |
05/24 |
$22,854 |
$30,078 |
$20,608 |
06/24 |
$23,648 |
$31,157 |
$21,130 |
07/24 |
$23,465 |
$31,537 |
$21,481 |
08/24 |
$23,831 |
$32,302 |
$21,917 |
09/24 |
$24,544 |
$32,992 |
$22,316 |
10/24 |
$24,748 |
$32,692 |
$21,973 |
11/24 |
$26,642 |
$34,611 |
$22,840 |
12/24 |
$25,987 |
$33,786 |
$22,363 |
01/25 |
$26,892 |
$34,727 |
$22,785 |
02/25 |
$26,275 |
$34,274 |
$22,807 |
03/25 |
$24,752 |
$32,343 |
$22,039 |
04/25 |
$25,328 |
$32,124 |
$21,984 |
05/25 |
$27,077 |
$34,146 |
$22,751 |
06/25 |
$28,888 |
$35,882 |
$23,586 |
07/25 |
$29,196 |
$36,687 |
$23,878 |
08/25 |
$29,608 |
$37,431 |
$24,283 |
09/25 |
$31,151 |
$38,797 |
$24,921 |
10/25 |
$32,097 |
$39,706 |
$25,333 |
11/25 |
$31,645 |
$39,803 |
$25,433 |
12/25 |
$31,462 |
$39,827 |
$25,428 |
|
| Average Annual Return [Table Text Block] |
AATR |
1 Year |
5 Years |
10 Years |
Institutional Class |
21.07% |
8.36% |
12.14% |
S&P 500® Index |
17.88% |
14.42% |
14.82% |
60/40 S&P 500® Index/Bloomberg US Aggregate Bond Index |
13.70% |
8.47% |
9.78% | |
| AssetsNet |
$ 532,512,147
|
| Holdings Count | Holding |
212
|
| Advisory Fees Paid, Amount |
$ 3,143,973
|
| InvestmentCompanyPortfolioTurnover |
43.00%
|
| Additional Fund Statistics [Text Block] |
Total Net Assets |
$532,512,147 |
# of Portfolio Holdings |
212 |
Portfolio Turnover Rate |
43% |
Total Advisory Fees Paid |
$3,143,973 | |
| Holdings [Text Block] |
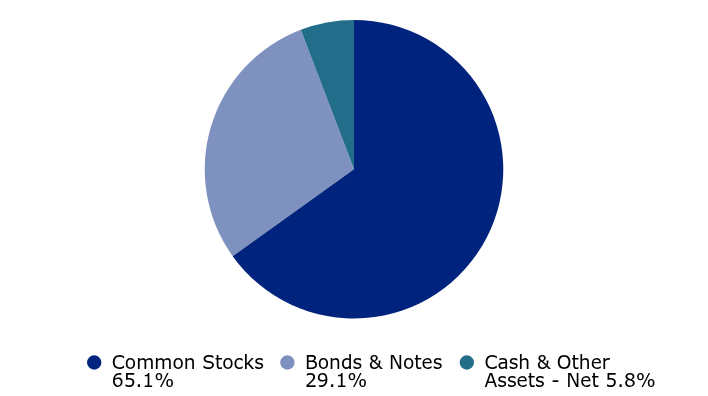
Asset Allocation (% of Net Assets)
Value |
Value |
Common Stocks |
65.1% |
Bonds & Notes |
29.1% |
Cash & Other Assets - Net |
5.8% | Common Stock Sectors (% of Common Stocks)*
Information Technology |
41.0% |
Communication Services |
16.6% |
Financials |
13.3% |
Consumer Discretionary |
13.1% |
Healthcare |
9.6% |
Industrials |
5.4% |
Energy |
1.0% | * Excludes Short-term Investments, if any. Bonds & Notes Sectors (% of Bonds & Notes)*
Government |
43.8% |
Residential Mortgage-Backed Securities |
20.4% |
Financial |
11.1% |
Consumer, Non-cyclical |
5.5% |
Energy |
3.4% |
Communications |
2.9% |
Technology |
2.9% |
Basic Materials |
2.6% |
Consumer, Cyclical |
2.4% |
Utilities |
2.0% |
Industrial |
1.9% |
Commercial Mortgage-Backed Securities |
0.6% |
Collateralized Mortgage Obligations |
0.5% | * Excludes Short-term Investments, if any. |
| Largest Holdings [Text Block] |
Ten Largest Holdings (% of Net Assets)*
NVIDIA Corp. |
4.0% |
Alphabet, Inc. |
3.9% |
Meta Platforms, Inc. |
3.8% |
Advanced Micro Devices, Inc. |
3.4% |
Amazon.com, Inc. |
3.2% |
Micron Technology, Inc. |
2.8% |
Broadcom, Inc. |
2.7% |
Microsoft Corp. |
2.4% |
Uber Technologies, Inc. |
2.1% |
AppLovin Corp. |
2.0% | |
| Material Fund Change [Text Block] |
|
| Updated Prospectus Phone Number |
800-243-2729
|
| Updated Prospectus Email Address |
<span style="box-sizing: border-box; color: rgb(0, 0, 0); display: inline; flex-wrap: nowrap; font-size: 12px; font-weight: 400; grid-area: auto; line-height: 14.4px; margin: 0px; overflow: visible; text-align: left; text-align-last: auto; white-space-collapse: preserve-breaks;">investorservices@vlfunds.com</span>
|
| C000020636 |
|
| Shareholder Report [Line Items] |
|
| Fund Name |
Value Line Capital Appreciation Fund, Inc.
|
| Class Name |
Investor
|
| Trading Symbol |
VALIX
|
| Annual or Semi-Annual Statement [Text Block] |
This annual shareholder report contains important information about Value Line Capital Appreciation Fund, Inc. (the "Fund") for the period of January 1, 2025 to December 31, 2025.
|
| Additional Information [Text Block] |
You can find additional information about the Fund at www.vlfunds.com. You can also request this information by contacting us at 1-800-243-2729 or investorservices@vlfunds.com.
|
| Additional Information Phone Number |
1-800-243-2729
|
| Additional Information Email |
<span style="box-sizing: border-box; color: rgb(0, 0, 0); display: inline; flex-wrap: nowrap; font-size: 12px; font-weight: 400; grid-area: auto; line-height: 14.4px; margin: 0px; overflow: visible; text-align: left; text-align-last: auto; white-space-collapse: preserve-breaks;">investorservices@vlfunds.com</span>
|
| Additional Information Website |
<span style="box-sizing: border-box; color: rgb(0, 0, 0); display: inline; flex-wrap: nowrap; font-size: 12px; font-weight: 400; grid-area: auto; line-height: 14.4px; margin: 0px; overflow: visible; text-align: left; text-align-last: auto; white-space-collapse: preserve-breaks;">www.vlfunds.com</span>
|
| Expenses [Text Block] |
What were the Fund costs for last year?(based on a hypothetical $10,000 investment)
Class Name |
Costs of a $10,000 investment |
Costs paid as a percentage of a $10,000 investment |
Investor Class |
$119 |
1.08% | |
| Expenses Paid, Amount |
$ 119
|
| Expense Ratio, Percent |
1.08%
|
| Factors Affecting Performance [Text Block] |
How did the Fund perform last year? The Fund's Investor Class generated a total return of 20.87% during the 12 months ended December 31, 2025. • The Fund outperformed its blended benchmark. Asset Allocation, i.e., being overweight equities and underweight fixed income, helped. The Fund’s equity portfolio outperformed the S&P 500® Index, due to stock selection, sector allocation decisions and growth stocks’ strong performance. The Fund’s fixed income portfolio modestly outperformed the Bloomberg Index. • The Fund’s equity portfolio was boosted most by stock selection in financials, health care and information technology and by an overweight to information technology. The only sector that detracted was energy, wherein stock selection was weak. • Stocks contributing most positively were Micron Technology and Advanced Micro Devices, each a semiconductor company, and Robinhood Markets, a financial services platform operator. Micron Technology benefited from AI-driven demand for its memory chips. Advanced Micro Devices gained on its AI partnerships and demand for its AI accelerators. Robinhood Markets rose on product diversification, market expansion and inclusion in the S&P 500® Index in September 2025 • Detracting most were out-of-Index positions in Strategy and Coinbase Global and an overweight in Chipotle Mexican Grill. Strategy, an enterprise analytics software provider that invests in Bitcoin, was hurt by Bitcoin’s price volatility and investor concerns about financing Bitcoin purchases. Coinbase Global, a crypto exchange and technology company, was affected by broader crypto market declines. Chipotle Mexican Grill, a fast-casual restaurant chain operator, saw increasing costs, margin pressures and weaker traffic trends. We sold the Fund’s position in Chipotle Mexican Grill. • The fixed income portion of the Fund was helped most by sector allocation decisions. Overweights in corporate bonds, particularly BBB-rated bonds, and an underweight to U.S. Treasuries contributed most positively. Yield curve positioning also added value. An underweight to securitized debt and duration positioning modestly detracted. |
| Performance Past Does Not Indicate Future [Text] |
<p style="box-sizing: border-box; color: rgb(0, 0, 0); display: block; flex-wrap: nowrap; font-size: 9.33333px; font-weight: 400; grid-area: auto; line-height: 11.2px; margin: 0px; overflow: visible; text-align: justify; text-align-last: left; white-space-collapse: preserve-breaks;">The performance data quoted represent past performance and are no guarantee of future performance. The investment return and principal value of an investment will fluctuate so that an investment, when redeemed, may be worth more or less than its original cost. The performance data includes reinvestments of all dividends and distributions but does not reflect the deduction of taxes that a shareholder would pay on fund distributions or the redemption of fund shares.</p>
|
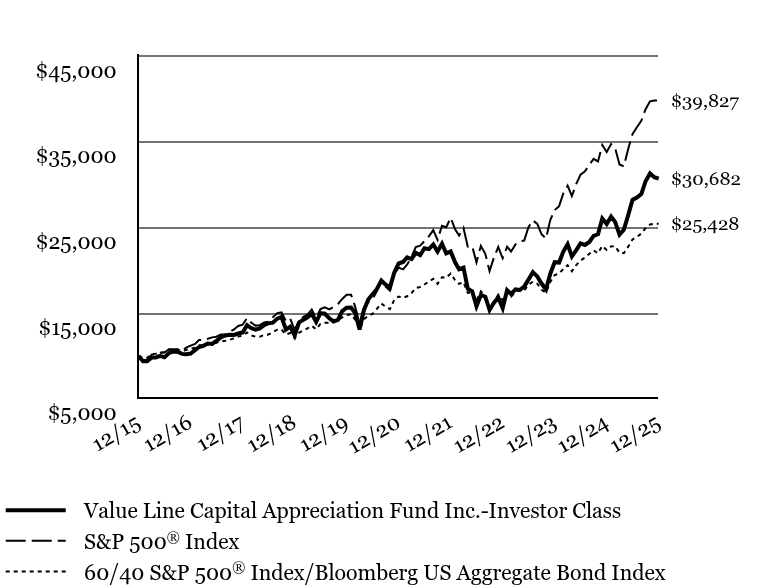
| Line Graph [Table Text Block] |
|
Value Line Capital Appreciation Fund Inc.-Investor Class |
S&P 500® Index |
60/40 S&P 500® Index/Bloomberg US Aggregate Bond Index |
12/15 |
$10,000 |
$10,000 |
$10,000 |
01/16 |
$9,381 |
$9,504 |
$9,757 |
02/16 |
$9,369 |
$9,491 |
$9,777 |
03/16 |
$9,803 |
$10,135 |
$10,211 |
04/16 |
$9,826 |
$10,174 |
$10,250 |
05/16 |
$9,998 |
$10,357 |
$10,362 |
06/16 |
$9,834 |
$10,384 |
$10,452 |
07/16 |
$10,328 |
$10,766 |
$10,710 |
08/16 |
$10,524 |
$10,782 |
$10,714 |
09/16 |
$10,492 |
$10,784 |
$10,713 |
10/16 |
$10,239 |
$10,587 |
$10,563 |
11/16 |
$10,205 |
$10,979 |
$10,698 |
12/16 |
$10,280 |
$11,196 |
$10,831 |
01/17 |
$10,680 |
$11,408 |
$10,962 |
02/17 |
$11,043 |
$11,861 |
$11,253 |
03/17 |
$11,175 |
$11,875 |
$11,258 |
04/17 |
$11,455 |
$11,997 |
$11,363 |
05/17 |
$11,394 |
$12,166 |
$11,494 |
06/17 |
$11,749 |
$12,242 |
$11,532 |
07/17 |
$12,150 |
$12,494 |
$11,694 |
08/17 |
$12,381 |
$12,532 |
$11,757 |
09/17 |
$12,466 |
$12,790 |
$11,881 |
10/17 |
$12,454 |
$13,089 |
$12,050 |
11/17 |
$12,612 |
$13,490 |
$12,265 |
12/17 |
$12,733 |
$13,640 |
$12,370 |
01/18 |
$13,590 |
$14,421 |
$12,738 |
02/18 |
$13,257 |
$13,890 |
$12,408 |
03/18 |
$13,071 |
$13,537 |
$12,250 |
04/18 |
$13,211 |
$13,589 |
$12,242 |
05/18 |
$13,595 |
$13,916 |
$12,454 |
06/18 |
$13,815 |
$14,002 |
$12,494 |
07/18 |
$13,879 |
$14,523 |
$12,774 |
08/18 |
$14,353 |
$14,996 |
$13,056 |
09/18 |
$14,545 |
$15,081 |
$13,067 |
10/18 |
$13,073 |
$14,050 |
$12,490 |
11/18 |
$13,418 |
$14,337 |
$12,673 |
12/18 |
$12,387 |
$13,042 |
$12,079 |
01/19 |
$13,925 |
$14,087 |
$12,711 |
02/19 |
$14,188 |
$14,540 |
$12,953 |
03/19 |
$14,493 |
$14,822 |
$13,204 |
04/19 |
$14,909 |
$15,422 |
$13,526 |
05/19 |
$13,980 |
$14,442 |
$13,106 |
06/19 |
$14,992 |
$15,460 |
$13,726 |
07/19 |
$14,923 |
$15,682 |
$13,857 |
08/19 |
$14,396 |
$15,434 |
$13,869 |
09/19 |
$14,022 |
$15,723 |
$13,995 |
10/19 |
$14,202 |
$16,063 |
$14,194 |
11/19 |
$15,227 |
$16,646 |
$14,500 |
12/19 |
$15,624 |
$17,149 |
$14,758 |
01/20 |
$15,640 |
$17,142 |
$14,869 |
02/20 |
$15,015 |
$15,731 |
$14,241 |
03/20 |
$13,079 |
$13,788 |
$13,152 |
04/20 |
$15,335 |
$15,555 |
$14,257 |
05/20 |
$16,569 |
$16,296 |
$14,691 |
06/20 |
$17,210 |
$16,620 |
$14,904 |
07/20 |
$17,819 |
$17,558 |
$15,497 |
08/20 |
$18,795 |
$18,820 |
$16,115 |
09/20 |
$18,307 |
$18,105 |
$15,744 |
10/20 |
$18,018 |
$17,623 |
$15,465 |
11/20 |
$19,725 |
$19,552 |
$16,541 |
12/20 |
$20,786 |
$20,304 |
$16,932 |
01/21 |
$20,963 |
$20,099 |
$16,781 |
02/21 |
$21,495 |
$20,653 |
$16,962 |
03/21 |
$21,301 |
$21,558 |
$17,323 |
04/21 |
$22,026 |
$22,708 |
$17,932 |
05/21 |
$21,769 |
$22,867 |
$18,031 |
06/21 |
$22,574 |
$23,401 |
$18,334 |
07/21 |
$22,462 |
$23,956 |
$18,677 |
08/21 |
$23,009 |
$24,685 |
$19,004 |
09/21 |
$22,171 |
$23,537 |
$18,408 |
10/21 |
$23,090 |
$25,186 |
$19,179 |
11/21 |
$21,962 |
$25,011 |
$19,122 |
12/21 |
$22,197 |
$26,132 |
$19,617 |
01/22 |
$20,925 |
$24,780 |
$18,839 |
02/22 |
$20,119 |
$24,038 |
$18,416 |
03/22 |
$20,298 |
$24,931 |
$18,622 |
04/22 |
$17,844 |
$22,757 |
$17,365 |
05/22 |
$17,539 |
$22,798 |
$17,429 |
06/22 |
$15,801 |
$20,916 |
$16,456 |
07/22 |
$17,109 |
$22,845 |
$17,528 |
08/22 |
$16,912 |
$21,913 |
$16,901 |
09/22 |
$15,354 |
$19,895 |
$15,675 |
10/22 |
$16,196 |
$21,506 |
$16,355 |
11/22 |
$16,823 |
$22,708 |
$17,144 |
12/22 |
$15,576 |
$21,399 |
$16,520 |
01/23 |
$17,674 |
$22,744 |
$17,346 |
02/23 |
$17,219 |
$22,189 |
$16,913 |
03/23 |
$17,773 |
$23,004 |
$17,457 |
04/23 |
$17,694 |
$23,363 |
$17,663 |
05/23 |
$18,090 |
$23,464 |
$17,632 |
06/23 |
$18,901 |
$25,015 |
$18,306 |
07/23 |
$19,772 |
$25,818 |
$18,654 |
08/23 |
$19,277 |
$25,407 |
$18,428 |
09/23 |
$18,446 |
$24,196 |
$17,714 |
10/23 |
$17,753 |
$23,687 |
$17,378 |
11/23 |
$19,594 |
$25,850 |
$18,645 |
12/23 |
$20,940 |
$27,025 |
$19,439 |
01/24 |
$20,900 |
$27,479 |
$19,614 |
02/24 |
$22,157 |
$28,946 |
$20,131 |
03/24 |
$23,034 |
$29,878 |
$20,594 |
04/24 |
$21,618 |
$28,657 |
$19,882 |
05/24 |
$22,356 |
$30,078 |
$20,608 |
06/24 |
$23,134 |
$31,157 |
$21,130 |
07/24 |
$22,954 |
$31,537 |
$21,481 |
08/24 |
$23,293 |
$32,302 |
$21,917 |
09/24 |
$24,011 |
$32,992 |
$22,316 |
10/24 |
$24,191 |
$32,692 |
$21,973 |
11/24 |
$26,026 |
$34,611 |
$22,840 |
12/24 |
$25,385 |
$33,786 |
$22,363 |
01/25 |
$26,270 |
$34,727 |
$22,785 |
02/25 |
$25,647 |
$34,274 |
$22,807 |
03/25 |
$24,159 |
$32,343 |
$22,039 |
04/25 |
$24,722 |
$32,124 |
$21,984 |
05/25 |
$26,430 |
$34,146 |
$22,751 |
06/25 |
$28,199 |
$35,882 |
$23,586 |
07/25 |
$28,481 |
$36,687 |
$23,878 |
08/25 |
$28,883 |
$37,431 |
$24,283 |
09/25 |
$30,390 |
$38,797 |
$24,921 |
10/25 |
$31,294 |
$39,706 |
$25,333 |
11/25 |
$30,852 |
$39,803 |
$25,433 |
12/25 |
$30,682 |
$39,827 |
$25,428 |
|
| Average Annual Return [Table Text Block] |
AATR |
1 Year |
5 Years |
10 Years |
Investor Class |
20.87% |
8.10% |
11.86% |
S&P 500® Index |
17.88% |
14.42% |
14.82% |
60/40 S&P 500® Index/Bloomberg US Aggregate Bond Index |
13.70% |
8.47% |
9.78% | |
| AssetsNet |
$ 532,512,147
|
| Holdings Count | Holding |
212
|
| Advisory Fees Paid, Amount |
$ 3,143,973
|
| InvestmentCompanyPortfolioTurnover |
43.00%
|
| Additional Fund Statistics [Text Block] |
Total Net Assets |
$532,512,147 |
# of Portfolio Holdings |
212 |
Portfolio Turnover Rate |
43% |
Total Advisory Fees Paid |
$3,143,973 | |
| Holdings [Text Block] |
Asset Allocation (% of Net Assets)
Value |
Value |
Common Stocks |
65.1% |
Bonds & Notes |
29.1% |
Cash & Other Assets - Net |
5.8% | Common Stock Sectors (% of Common Stocks)*
Information Technology |
41.0% |
Communication Services |
16.6% |
Financials |
13.3% |
Consumer Discretionary |
13.1% |
Healthcare |
9.6% |
Industrials |
5.4% |
Energy |
1.0% | * Excludes Short-term Investments, if any. Bonds & Notes Sectors (% of Bonds & Notes)*
Government |
43.8% |
Residential Mortgage-Backed Securities |
20.4% |
Financial |
11.1% |
Consumer, Non-cyclical |
5.5% |
Energy |
3.4% |
Communications |
2.9% |
Technology |
2.9% |
Basic Materials |
2.6% |
Consumer, Cyclical |
2.4% |
Utilities |
2.0% |
Industrial |
1.9% |
Commercial Mortgage-Backed Securities |
0.6% |
Collateralized Mortgage Obligations |
0.5% | * Excludes Short-term Investments, if any. |
| Largest Holdings [Text Block] |
Ten Largest Holdings (% of Net Assets)*
NVIDIA Corp. |
4.0% |
Alphabet, Inc. |
3.9% |
Meta Platforms, Inc. |
3.8% |
Advanced Micro Devices, Inc. |
3.4% |
Amazon.com, Inc. |
3.2% |
Micron Technology, Inc. |
2.8% |
Broadcom, Inc. |
2.7% |
Microsoft Corp. |
2.4% |
Uber Technologies, Inc. |
2.1% |
AppLovin Corp. |
2.0% | |
| Material Fund Change [Text Block] |
|
| Updated Prospectus Phone Number |
800-243-2729
|
| Updated Prospectus Email Address |
<span style="box-sizing: border-box; color: rgb(0, 0, 0); display: inline; flex-wrap: nowrap; font-size: 12px; font-weight: 400; grid-area: auto; line-height: 14.4px; margin: 0px; overflow: visible; text-align: left; text-align-last: auto; white-space-collapse: preserve-breaks;">investorservices@vlfunds.com</span>
|