Pay vs Performance Disclosure - USD ($)
|
12 Months Ended |
Jun. 30, 2025 |
Jun. 30, 2024 |
Jun. 30, 2023 |
Jun. 30, 2022 |
Jun. 30, 2021 |
| Pay vs Performance Disclosure |
|
|
|
|
|
| Pay vs Performance Disclosure, Table |
| | | | | | | | | | | | | | | | | | | | | | | | | | | | | | | | Value of Initial Fixed $100 | | | | | | | | Investment Based On: | | | | Summary | | Average Summary | Average | | Peer Group | | | | Compensation | Compensation | Compensation | Compensation | Total | Total | Net | Rolling 4 Quarter | | Fiscal | Table Total | Actually Paid | Table Total | Actually Paid | Shareholder | Shareholder | Income | Revenue | | Year | for PEO | to PEO | for Non-PEO NEOs | to Non-PEO NEOs | Return | Return | ($M) | ($M) | (a)1 | (b)2 | (c)3 | (d)4 | (e)3 | (f)5 | (g)6 | (h)7 | (i)8 | | 2025 | $442 | $(190,338,364) | $1,723,455 | $(3,417,671) | $1,726.31 | $276.13 | $1,049 | $21,972 | | 2024 | $28,095,227 | $409,423,064 | $5,407,088 | $15,669,511 | $2,886.05 | $243.25 | $1,153 | $14,989 | | 2023 | $1 | $92,123,653 | $1,296,195 | $5,435,046 | $877.95 | $168.27 | $640 | $7,124 | | 2022 | $1 | $3,672,048 | $1,227,705 | $1,076,822 | $142.13 | $122.62 | $285 | $5,196 | | 2021 | $18,098,671 | $20,489,151 | $738,978 | $714,065 | $123.92 | $150.35 | $112 | $3,557 |
|
|
|
|
|
| Company Selected Measure Name |
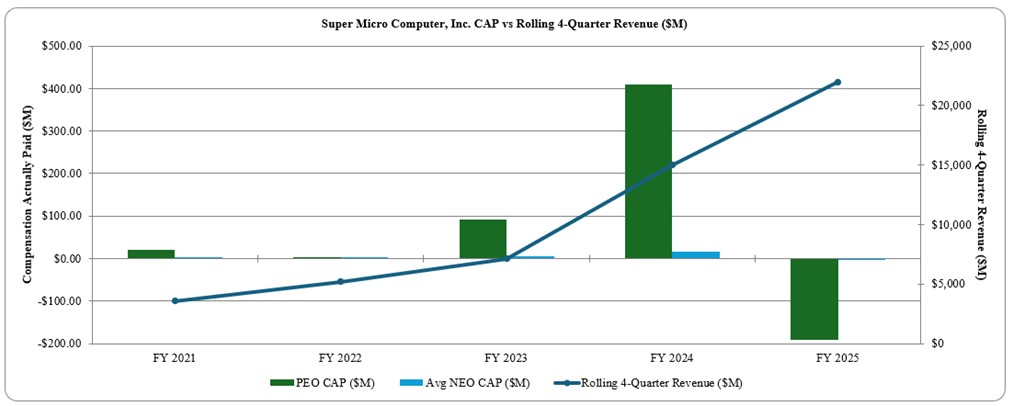
total revenue for the four fiscal quarters during each fiscal year
|
|
|
|
|
| Named Executive Officers, Footnote |
Mr. Liang was our principal executive officer (“PEO”) for the full year for each of the Covered Years. For each of FY2025, FY2024, FY2023 and FY2022, our non-PEO PVP NEOs (“Non-PEO NEOs”) were Messrs. Weigand, Clegg, and Kao. For FY2021, our Non-PEO NEOs were Messrs. Weigand, Clegg, Kao, Alex Hsu and Kevin Bauer (Mr. Hsu served as Senior Vice President, Chief Operating Officer until March 2021, when he transitioned to the role of Senior Chief Executive, Strategic Business, and Mr. Bauer resigned as our Chief Financial Officer in January 2021).
|
|
|
|
|
| Peer Group Issuers, Footnote |
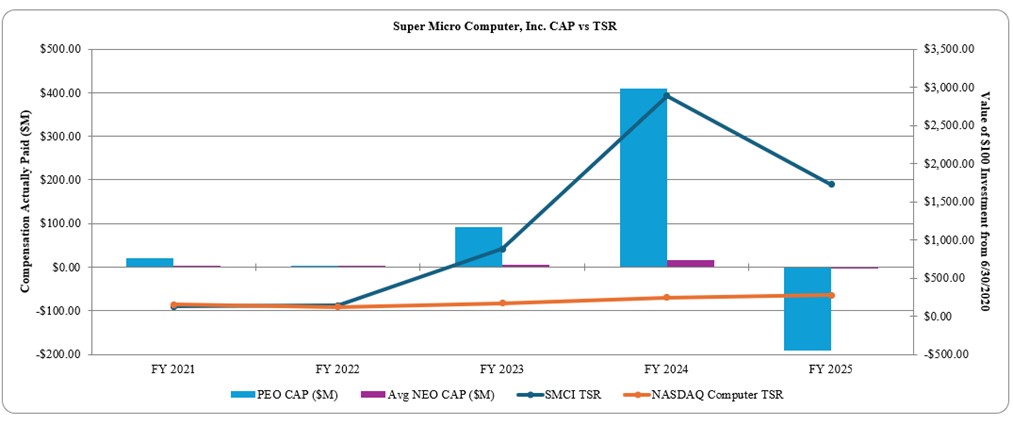
The peer group used to calculate peer group TSR in the PVP Table is the Nasdaq Computer Index. TSR is based on the value of an initial fixed investment of $100 immediately prior to the start of fiscal year 2021, including the re-investment of any dividends.
|
|
|
|
|
| PEO Total Compensation Amount |
$ 442
|
$ 28,095,227
|
$ 1
|
$ 1
|
$ 18,098,671
|
| PEO Actually Paid Compensation Amount |
$ (190,338,364)
|
409,423,064
|
92,123,653
|
3,672,048
|
20,489,151
|
| Adjustment To PEO Compensation, Footnote |
The dollar amounts reported in column (b) are the amounts of total compensation reported, without adjustment, for Mr. Liang for each corresponding fiscal year in the “Total” column of the Summary Compensation Table. See “Executive Compensation - Fiscal Year 2025 Summary Compensation Table” for FY2025, FY2024, FY2023, and FY2022 information and “Executive Compensation - Fiscal Year 2023 Summary Compensation Table” of the proxy statement filed with the SEC on December 8, 2023 for FY2021 information.The dollar amounts reported in column (c) and (e) represent the amount of “Compensation Actually Paid” (otherwise known as CAP), as computed in accordance with SEC rules. The following table details how Compensation Actually Paid was determined: | | | | | | | | | | | | | | | | | | | | | | | | | | | | | | | | | | FY2025 | FY2024 | FY2023 | FY2022 | FY2021 | | PEO ($) | Average for Non-PEO NEO ($) | PEO ($) | Average for Non-PEO NEO ($) | PEO ($) | Average for Non-PEO NEO ($) | PEO ($) | Average for Non-PEO NEO ($) | PEO ($) | Average for Non-PEO NEO ($) | | Summary Compensation Table ("SCT") Total | $ | 442 | | $ | 1,723,455 | | $ | 28,095,227 | | $ | 5,407,088 | | $ | 1 | | $ | 1,296,195 | | $ | 1 | | $ | 1,227,705 | | $ | 18,098,671 | | $ | 738,978 | | | Pension Benefits Changes | $ | — | | $ | — | | $ | — | | $ | — | | $ | — | | $ | — | | $ | — | | $ | — | | $ | — | | $ | — | | | - Grant Date Fair Value of Stock Awards from SCT | $ | — | | $ | 880,521 | | $ | — | | $ | (2,031,800) | | $ | — | | $ | (558,490) | | $ | — | | $ | (179,019) | | $ | — | | $ | (144,471) | | | - Grant Date Fair Value of Option Awards from SCT | $ | — | | $ | 170,305 | | $ | (28,094,976) | | $ | (2,626,330) | | $ | — | | $ | (89,938) | | $ | — | | $ | (390,902) | | $ | (11,616,000) | | $ | (236,357) | | | + Covered Year-End Fair Value of Equity Awards Granted in the Covered Year and Unvested as of Covered Year End | $ | — | | $ | 1,409,314 | | $ | 303,930,000 | | $ | 6,212,734 | | $ | — | | $ | 1,619,698 | | $ | — | | $ | 350,690 | | $ | 13,996,642 | | $ | 154,836 | | +/- Change in Fair Value (From Prior Year-End to Covered Year-End) of Covered Year-End Outstanding and Unvested Awards Granted in Prior Covered Years | $ | (30,850,000) | | $ | (2,795,635) | | $ | — | | $ | 4,082,102 | | $ | 78,971,740 | | $ | 2,496,442 | | $ | 3,672,047 | | $ | 28,175 | | $ | — | | $ | 73,604 | | +/- Change in Fair Value (From Prior Year-End to Vesting Date) of Awards Granted in Prior Covered Years and Vested in Covered Year | $ | (159,488,806) | | $ | (2,703,980) | | $ | 105,492,813 | | $ | 2,897,653 | | $ | 13,151,912 | | $ | 455,744 | | $ | — | | $ | 40,173 | | $ | 9,839 | | $ | 99,189 | | | + Vesting Date Fair Value of Awards Granted in Covered Year and Vested in Covered Year | $ | — | | $ | — | | $ | — | | $ | 1,728,065 | | $ | — | | $ | 215,395 | | $ | — | | $ | — | | $ | — | | $ | 28,287 | | | - Prior Covered Year-End Fair Value of Awards Forfeited During Covered Year | $ | — | | $ | — | | $ | — | | $ | — | | $ | — | | $ | — | | $ | — | | $ | — | | $ | — | | $ | — | | | + Value of Dividend Equivalents Not Already Included in Covered Year CAP | $ | — | | $ | — | | $ | — | | $ | — | | $ | — | | $ | — | | $ | — | | $ | — | | $ | — | | $ | — | | | Compensation Actually Paid | $ | (190,338,364) | | $ | (3,417,671) | | $ | 409,423,064 | | $ | 15,669,511 | | $ | 92,123,653 | | $ | 5,435,046 | | $ | 3,672,048 | | $ | 1,076,822 | | $ | 20,489,151 | | $ | 714,065 | |
|
|
|
|
|
| Non-PEO NEO Average Total Compensation Amount |
$ 1,723,455
|
5,407,088
|
1,296,195
|
1,227,705
|
738,978
|
| Non-PEO NEO Average Compensation Actually Paid Amount |
$ (3,417,671)
|
15,669,511
|
5,435,046
|
1,076,822
|
714,065
|
| Adjustment to Non-PEO NEO Compensation Footnote |
The dollar amounts reported in column (c) and (e) represent the amount of “Compensation Actually Paid” (otherwise known as CAP), as computed in accordance with SEC rules. The following table details how Compensation Actually Paid was determined: | | | | | | | | | | | | | | | | | | | | | | | | | | | | | | | | | | FY2025 | FY2024 | FY2023 | FY2022 | FY2021 | | PEO ($) | Average for Non-PEO NEO ($) | PEO ($) | Average for Non-PEO NEO ($) | PEO ($) | Average for Non-PEO NEO ($) | PEO ($) | Average for Non-PEO NEO ($) | PEO ($) | Average for Non-PEO NEO ($) | | Summary Compensation Table ("SCT") Total | $ | 442 | | $ | 1,723,455 | | $ | 28,095,227 | | $ | 5,407,088 | | $ | 1 | | $ | 1,296,195 | | $ | 1 | | $ | 1,227,705 | | $ | 18,098,671 | | $ | 738,978 | | | Pension Benefits Changes | $ | — | | $ | — | | $ | — | | $ | — | | $ | — | | $ | — | | $ | — | | $ | — | | $ | — | | $ | — | | | - Grant Date Fair Value of Stock Awards from SCT | $ | — | | $ | 880,521 | | $ | — | | $ | (2,031,800) | | $ | — | | $ | (558,490) | | $ | — | | $ | (179,019) | | $ | — | | $ | (144,471) | | | - Grant Date Fair Value of Option Awards from SCT | $ | — | | $ | 170,305 | | $ | (28,094,976) | | $ | (2,626,330) | | $ | — | | $ | (89,938) | | $ | — | | $ | (390,902) | | $ | (11,616,000) | | $ | (236,357) | | | + Covered Year-End Fair Value of Equity Awards Granted in the Covered Year and Unvested as of Covered Year End | $ | — | | $ | 1,409,314 | | $ | 303,930,000 | | $ | 6,212,734 | | $ | — | | $ | 1,619,698 | | $ | — | | $ | 350,690 | | $ | 13,996,642 | | $ | 154,836 | | +/- Change in Fair Value (From Prior Year-End to Covered Year-End) of Covered Year-End Outstanding and Unvested Awards Granted in Prior Covered Years | $ | (30,850,000) | | $ | (2,795,635) | | $ | — | | $ | 4,082,102 | | $ | 78,971,740 | | $ | 2,496,442 | | $ | 3,672,047 | | $ | 28,175 | | $ | — | | $ | 73,604 | | +/- Change in Fair Value (From Prior Year-End to Vesting Date) of Awards Granted in Prior Covered Years and Vested in Covered Year | $ | (159,488,806) | | $ | (2,703,980) | | $ | 105,492,813 | | $ | 2,897,653 | | $ | 13,151,912 | | $ | 455,744 | | $ | — | | $ | 40,173 | | $ | 9,839 | | $ | 99,189 | | | + Vesting Date Fair Value of Awards Granted in Covered Year and Vested in Covered Year | $ | — | | $ | — | | $ | — | | $ | 1,728,065 | | $ | — | | $ | 215,395 | | $ | — | | $ | — | | $ | — | | $ | 28,287 | | | - Prior Covered Year-End Fair Value of Awards Forfeited During Covered Year | $ | — | | $ | — | | $ | — | | $ | — | | $ | — | | $ | — | | $ | — | | $ | — | | $ | — | | $ | — | | | + Value of Dividend Equivalents Not Already Included in Covered Year CAP | $ | — | | $ | — | | $ | — | | $ | — | | $ | — | | $ | — | | $ | — | | $ | — | | $ | — | | $ | — | | | Compensation Actually Paid | $ | (190,338,364) | | $ | (3,417,671) | | $ | 409,423,064 | | $ | 15,669,511 | | $ | 92,123,653 | | $ | 5,435,046 | | $ | 3,672,048 | | $ | 1,076,822 | | $ | 20,489,151 | | $ | 714,065 | |
|
|
|
|
|
| Compensation Actually Paid vs. Total Shareholder Return |
|
|
|
|
|
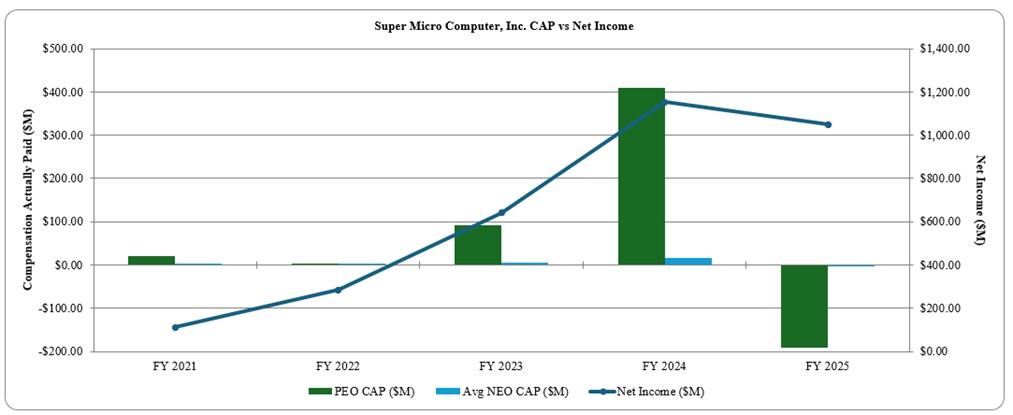
| Compensation Actually Paid vs. Net Income |
|
|
|
|
|
| Compensation Actually Paid vs. Company Selected Measure |
|
|
|
|
|
| Tabular List, Table |
| | | | Revenue Growth | Stock Price | Slow Moving & Excess and Obsolete Inventory(1) | | Long-Term Investors | | Top 3000 Customer Growth | | Top 300 Customer Growth |
|
|
|
|
|
| Total Shareholder Return Amount |
$ 1,726.31
|
2,886.05
|
877.95
|
142.13
|
123.92
|
| Peer Group Total Shareholder Return Amount |
276.13
|
243.25
|
168.27
|
122.62
|
150.35
|
| Net Income (Loss) |
$ 1,049,000,000
|
$ 1,153,000,000
|
$ 640,000,000
|
$ 285,000,000
|
$ 112,000,000
|
| Company Selected Measure Amount |
21,972,000,000
|
14,989,000,000
|
7,124,000,000
|
5,196,000,000
|
3,557,000,000
|
| PEO Name |
Mr. Liang
|
Mr. Liang
|
Mr. Liang
|
Mr. Liang
|
Mr. Liang
|
| Additional 402(v) Disclosure |
Due to the use of revenue as a metric in the 2023 CEO Performance Award in FY2025, we have determined that, pursuant to the SEC’s PVP rules, our total revenue for the four fiscal quarters during each fiscal year should be designated as the “Company-Selected Measure” to be included in the far right column of the PVP Table below because we believe it is the most important financial measure that demonstrates how we sought to link executive pay to performance for FY2025. Our total shareholder return (“TSR”) for each Covered Year is determined based on the value of an initial fixed investment of $100 immediately prior to the start of FY2021, including the reinvestment of any dividends. We have not paid any dividends since the start of fiscal year 2021.These net income results were calculated in accordance with U.S. GAAP.For purposes of this PVP Table, our Revenue results represent our total revenue for the prior four fiscal quarters during each fiscal year and were calculated substantially as described above in our Compensation Discussion and Analysis, including how such measure is calculated from our audited financial statements. See “Executive Compensation - Compensation Discussion and Analysis - Fiscal Year 2025 CEO Compensation - Discussion and Analysis of 2021 CEO Performance Award” and “Executive Compensation - Compensation Discussion and Analysis - Fiscal Year 2025 CEO Compensation - Discussion and Analysis of 2024 CEO Performance Award” for more information on the applicable calculations.As discussed above in “Executive Compensation - Compensation Discussion and Analysis (“CD&A”) - FY2025 Performance Program for Other NEOs - Performance Incentive Award,” the performance measure for this metric was determined to be zero in connection with determining compensation.
|
|
|
|
|
| Measure:: 1 |
|
|
|
|
|
| Pay vs Performance Disclosure |
|
|
|
|
|
| Name |
Revenue Growth
|
|
|
|
|
| Measure:: 2 |
|
|
|
|
|
| Pay vs Performance Disclosure |
|
|
|
|
|
| Name |
Stock Price
|
|
|
|
|
| Measure:: 3 |
|
|
|
|
|
| Pay vs Performance Disclosure |
|
|
|
|
|
| Name |
Slow Moving & Excess and Obsolete Inventory(1)
|
|
|
|
|
| Measure:: 4 |
|
|
|
|
|
| Pay vs Performance Disclosure |
|
|
|
|
|
| Name |
Long-Term Investors
|
|
|
|
|
| Measure:: 5 |
|
|
|
|
|
| Pay vs Performance Disclosure |
|
|
|
|
|
| Name |
Top 3000 Customer Growth
|
|
|
|
|
| Measure:: 6 |
|
|
|
|
|
| Pay vs Performance Disclosure |
|
|
|
|
|
| Name |
Top 300 Customer Growth
|
|
|
|
|
| PEO | Pension Adjustments Service Cost |
|
|
|
|
|
| Pay vs Performance Disclosure |
|
|
|
|
|
| Adjustment to Compensation, Amount |
$ 0
|
$ 0
|
$ 0
|
$ 0
|
$ 0
|
| PEO | Aggregate Grant Date Fair Value of Equity Award Amounts Reported in Summary Compensation Table |
|
|
|
|
|
| Pay vs Performance Disclosure |
|
|
|
|
|
| Adjustment to Compensation, Amount |
0
|
0
|
0
|
0
|
0
|
| PEO | Year-end Fair Value of Equity Awards Granted in Covered Year that are Outstanding and Unvested |
|
|
|
|
|
| Pay vs Performance Disclosure |
|
|
|
|
|
| Adjustment to Compensation, Amount |
0
|
303,930,000
|
0
|
0
|
13,996,642
|
| PEO | Year-over-Year Change in Fair Value of Equity Awards Granted in Prior Years That are Outstanding and Unvested |
|
|
|
|
|
| Pay vs Performance Disclosure |
|
|
|
|
|
| Adjustment to Compensation, Amount |
(30,850,000)
|
0
|
78,971,740
|
3,672,047
|
0
|
| PEO | Vesting Date Fair Value of Equity Awards Granted and Vested in Covered Year |
|
|
|
|
|
| Pay vs Performance Disclosure |
|
|
|
|
|
| Adjustment to Compensation, Amount |
0
|
0
|
0
|
0
|
0
|
| PEO | Change in Fair Value as of Vesting Date of Prior Year Equity Awards Vested in Covered Year |
|
|
|
|
|
| Pay vs Performance Disclosure |
|
|
|
|
|
| Adjustment to Compensation, Amount |
(159,488,806)
|
105,492,813
|
13,151,912
|
0
|
9,839
|
| PEO | Prior Year End Fair Value of Equity Awards Granted in Any Prior Year that Fail to Meet Applicable Vesting Conditions During Covered Year |
|
|
|
|
|
| Pay vs Performance Disclosure |
|
|
|
|
|
| Adjustment to Compensation, Amount |
0
|
0
|
0
|
0
|
0
|
| PEO | Dividends or Other Earnings Paid on Equity Awards not Otherwise Reflected in Total Compensation for Covered Year |
|
|
|
|
|
| Pay vs Performance Disclosure |
|
|
|
|
|
| Adjustment to Compensation, Amount |
0
|
0
|
0
|
0
|
0
|
| PEO | Aggregate Grant Date Fair Value of Option Award Amounts Reported in Summary Compensation Table [Member] |
|
|
|
|
|
| Pay vs Performance Disclosure |
|
|
|
|
|
| Adjustment to Compensation, Amount |
0
|
(28,094,976)
|
0
|
0
|
(11,616,000)
|
| Non-PEO NEO | Pension Adjustments Service Cost |
|
|
|
|
|
| Pay vs Performance Disclosure |
|
|
|
|
|
| Adjustment to Compensation, Amount |
0
|
0
|
0
|
0
|
0
|
| Non-PEO NEO | Aggregate Grant Date Fair Value of Equity Award Amounts Reported in Summary Compensation Table |
|
|
|
|
|
| Pay vs Performance Disclosure |
|
|
|
|
|
| Adjustment to Compensation, Amount |
(880,521)
|
(2,031,800)
|
(558,490)
|
(179,019)
|
(144,471)
|
| Non-PEO NEO | Year-end Fair Value of Equity Awards Granted in Covered Year that are Outstanding and Unvested |
|
|
|
|
|
| Pay vs Performance Disclosure |
|
|
|
|
|
| Adjustment to Compensation, Amount |
1,409,314
|
6,212,734
|
1,619,698
|
350,690
|
154,836
|
| Non-PEO NEO | Year-over-Year Change in Fair Value of Equity Awards Granted in Prior Years That are Outstanding and Unvested |
|
|
|
|
|
| Pay vs Performance Disclosure |
|
|
|
|
|
| Adjustment to Compensation, Amount |
(2,795,635)
|
4,082,102
|
2,496,442
|
28,175
|
73,604
|
| Non-PEO NEO | Vesting Date Fair Value of Equity Awards Granted and Vested in Covered Year |
|
|
|
|
|
| Pay vs Performance Disclosure |
|
|
|
|
|
| Adjustment to Compensation, Amount |
0
|
1,728,065
|
215,395
|
0
|
28,287
|
| Non-PEO NEO | Change in Fair Value as of Vesting Date of Prior Year Equity Awards Vested in Covered Year |
|
|
|
|
|
| Pay vs Performance Disclosure |
|
|
|
|
|
| Adjustment to Compensation, Amount |
(2,703,980)
|
2,897,653
|
455,744
|
40,173
|
99,189
|
| Non-PEO NEO | Prior Year End Fair Value of Equity Awards Granted in Any Prior Year that Fail to Meet Applicable Vesting Conditions During Covered Year |
|
|
|
|
|
| Pay vs Performance Disclosure |
|
|
|
|
|
| Adjustment to Compensation, Amount |
0
|
0
|
0
|
0
|
0
|
| Non-PEO NEO | Dividends or Other Earnings Paid on Equity Awards not Otherwise Reflected in Total Compensation for Covered Year |
|
|
|
|
|
| Pay vs Performance Disclosure |
|
|
|
|
|
| Adjustment to Compensation, Amount |
0
|
0
|
0
|
0
|
0
|
| Non-PEO NEO | Aggregate Grant Date Fair Value of Option Award Amounts Reported in Summary Compensation Table [Member] |
|
|
|
|
|
| Pay vs Performance Disclosure |
|
|
|
|
|
| Adjustment to Compensation, Amount |
$ (170,305)
|
$ (2,626,330)
|
$ (89,938)
|
$ (390,902)
|
$ (236,357)
|