Pay vs Performance Disclosure - USD ($)
Dec. 31, 2025
Dec. 31, 2024
Dec. 31, 2023
Dec. 31, 2022
Dec. 31, 2021
Pay Versus Performance
Year | Summary Compensation Table Total for Matt Salem(1) ($) | Compensation Actually Paid to Matt Salem(2) ($) | Average Summary Compensation Table Total for Non-PEO Named Executive Officers(3)(4) ($) | Average Compensation Actually Paid to Non-PEO Named Executive Officers(3)(4)(5)(6) ($) | Value of Initial Fixed $100 Investment Based On:(7) | Net Income Attributable to Common Stockholders ($ in thousands) | Company Selected Measure: Distributable Earnings ($ in thousands)(9) | |||||||||||||||||
Total Shareholder Return ($) | Peer Group Total Shareholder Return(8) ($) | |||||||||||||||||||||||
2025 | 688,188 | 588,399 | 493,326 | 452,448 | 78 | 112 | (69,885) | 26,324 | ||||||||||||||||
2024 | 915,688 | 650,106 | 564,870 | 453,774 | 86 | 98 | 13,071 | (70,683) | ||||||||||||||||
2023 | 1,027,088 | 1,073,836 | 695,996 | 707,224 | 102 | 98 | (53,919) | 57,558 | ||||||||||||||||
2022 | 1,463,000 | 674,410 | 667,210 | 397,990 | 94 | 85 | 15,371 | 109,614 | ||||||||||||||||
2021 | 1,979,366 | 2,470,598 | 722,166 | 878,242 | 126 | 117 | 125,635 | 92,393 | ||||||||||||||||
(1) | The dollar amounts reported in this column are the amounts of total compensation reported for our Chief Executive Officer (the “PEO”) for each corresponding year, as reported in the “Total” column of the Summary Compensation Table. |
(2) | In accordance with the requirements of Item 402(v)(2)(iii) of Regulation S-K, the following adjustments were made to the amounts reported for Mr. Salem in the Summary Compensation Table. Importantly, the dollar amounts do not reflect the actual amount of compensation earned by or paid to Mr. Salem during the applicable year. |
Description | 2021 ($) | 2022 ($) | 2023 ($) | 2024 ($) | 2025 ($) | ||||||||||
Reported Summary Compensation Total | 1,979,366 | 1,463,000 | 1,027,088 | 915,688 | 688,188 | ||||||||||
Change in Pension Value Deduction(a) | — | — | — | — | — | ||||||||||
Pension Service Cost Addition(a) | — | — | — | — | — | ||||||||||
Prior Pension Service Cost Addition(a) | — | — | — | — | — | ||||||||||
Reported Stock Awards Deduction(b) | (1,979,366) | (1,463,000) | (1,027,088) | (915,688) | (688,188) | ||||||||||
Equity Award Adjustments(c) | 2,470,598 | 674,410 | 1,073,836 | 650,106 | 588,399 | ||||||||||
Compensation Actually Paid | 2,470,598 | 674,410 | 1,073,836 | 650,106 | 588,399 | ||||||||||
(a) | The Company has no pension plans. |
(b) | Total grant date fair value of equity awards reported in the “Stock Awards” column in the Summary Compensation Table for the applicable year. Mr. Salem did not receive option awards in the years shown. |
(c) | For each covered year, the amounts added or deducted in calculated equity award adjustments include: |
Year | Year End Fair Value of Unvested Equity Awards Granted in the Covered Year | Year over Year Change in Fair Value of Outstanding and Unvested Equity Awards | Fair Value as of Vesting Date of Equity Awards Granted and Vested in the Year | Year over Year Change in Fair Value of Equity Awards Granted in Prior Years that Vested in the Year | Fair Value at the End of the Prior Year of Equity Awards that Failed to Meet Vesting Conditions in the Year | Value of Dividends or other Earnings Paid on Stock or Option Awards not Otherwise Reflected in Fair Value or Total Compensation | Total Equity Award Adjustments | ||||||||||||||
2025 | 667,875 | (149,618) | — | (95,276) | — | 165,418 | 588,399 | ||||||||||||||
2024 | 820,625 | (263,446) | — | (114,124) | — | 207,051 | 650,106 | ||||||||||||||
2023 | 1,008,788 | (72,428) | — | (187,408) | — | 324,884 | 1,073,836 | ||||||||||||||
2022 | 1,396,000 | (610,647) | — | (372,519) | — | 261,576 | 674,410 | ||||||||||||||
2021 | 2,034,050 | 211,185 | — | 225,363 | — | — | 2,470,598 | ||||||||||||||
(3) | The dollar amounts reported in this column represent the average of the total amounts reported for our non-PEO named executive officers (the “Other NEOs”) for each corresponding year in the “Total” column of the “Summary Compensation Table” set forth above. |
(4) | For fiscal year 2025, our Other NEOs were: W. Patrick Mattson, our President and Chief Operating Officer, Kendra L. Decious, our Chief Financial Officer and Treasurer and Kelly Galligan, our former General Counsel and Secretary. As previously disclosed, Ms. Galligan resigned from her role as General Counsel and Secretary effective as of January 30, 2026. |
For fiscal year 2024, our Other NEOs were: W. Patrick Mattson, our President and Chief Operating Officer, Kendra L. Decious, our Chief Financial Officer and Treasurer, Kelly Galligan, our General Counsel and Secretary, and Vincent J. Napolitano, our former General Counsel and Secretary. As previously disclosed, Mr. Napolitano stepped down from his role as General Counsel and Secretary effective as of October 22, 2024, and was succeeded by Ms. Galligan.
For fiscal year 2023, our Other NEOs were: W. Patrick Mattson, our President and Chief Operating Officer, Kendra L. Decious, our Chief Financial Officer and Treasurer, and Vincent J. Napolitano, our former General Counsel and Secretary.
For fiscal year 2022, our Other NEOs were: W. Patrick Mattson, our President and Chief Operating Officer; Kendra L. Decious, our Chief Financial Officer and Treasurer; Vincent J. Napolitano, our former General Counsel and Secretary; and Mostafa Nagaty, our former Chief Financial Officer and Treasurer. As previously disclosed, Mostafa Nagaty stepped down from his role as Chief Financial Officer and Treasurer of the Company on March 1, 2022 and was succeeded by Kendra Decious.
For fiscal year 2021, our Other NEOs were: W. Patrick Mattson, our President and Chief Operating Officer; Mostafa Nagaty, our former Chief Financial Officer and Treasurer; and Vincent J. Napolitano, our former General Counsel and Secretary.
(5) | In accordance with the requirements of Item 402(v)(2)(iii) of Regulation S-K, when calculating the “average compensation actually paid” for the Other NEOs, the following adjustments were made to the amounts reported in the Summary Compensation Table. Importantly, the dollar amounts do not reflect the actual average amount of compensation earned by or paid to our Other NEOs as a group during the applicable year. |
Description | 2021 ($) | 2022 ($) | 2023 ($) | 2024 ($) | 2025 ($) | ||||||||||
Average Reported Summary Compensation Total | 722,166 | 667,210 | 695,996 | 564,870 | 493,326 | ||||||||||
Average Change in Pension Value Deduction(a) | — | — | — | — | — | ||||||||||
Average Pension Service Cost Addition(a) | — | — | — | — | — | ||||||||||
Average Prior Pension Service Cost Addition(a) | — | — | — | — | — | ||||||||||
Average Reported Stock Awards Deduction(b) | (466,210) | (461,577) | (471,450) | (413,233) | (293,624) | ||||||||||
Average Equity Award Adjustments(c) | 622,286 | 192,357 | 482,678 | 302,137 | 252,746 | ||||||||||
Average Compensation Actually Paid to Other NEOs | 878,242 | 397,990 | 707,224 | 453,774 | 452,448 | ||||||||||
(a) | The Company has no pension plans. |
(b) | Average total grant date fair value of equity awards reported in the “Stock Awards” column in the Summary Compensation Table for the applicable year. The Other NEOs did not receive option awards in the years shown. |
(c) | For each covered year, the amounts added or deducted in calculated equity award adjustments include: |
Year | Year End Fair Value of Unvested Equity Awards Granted in the Covered Year | Year over Year Change in Fair Value of Outstanding and Unvested Equity Awards | Fair Value as of Vesting Date of Equity Awards Granted and Vested in the Year | Year over Year Change in Fair Value of Equity Awards Granted in Prior Years that Vested in the Year | Fair Value at the End of the Prior Year of Equity Awards that Failed to Meet Vesting Conditions in the Year | Value of Dividends or other Earnings Paid on Stock or Option Awards not Otherwise Reflected in Fair Value or Total Compensation | Total Equity Award Adjustments | ||||||||||||||
2025 | 284,957 | (61,519) | — | (34,459) | — | 63,767 | 252,746 | ||||||||||||||
2024 | 370,333 | (105,953) | — | (39,048) | — | 76,805 | 302,137 | ||||||||||||||
2023 | 463,050 | (21,965) | — | (57,393) | — | 98,986 | 482,678 | ||||||||||||||
2022 | 440,438 | (178,622) | — | (113,102) | (34,140) | 77,783 | 192,357 | ||||||||||||||
2021 | 479,090 | 73,237 | — | 69,959 | — | — | 622,286 | ||||||||||||||
(6) | When calculating amounts of “compensation actually paid” for purposes of this table the fair value of each equity award was estimated as of the relevant valuation date in accordance with FASB ASC Topic 505 and ASC Topic 718, as appropriate, without taking into account estimated forfeitures using the market price of the Company’s common stock on the relevant valuation date. |
(7) | Total shareholder return as calculated based on a fixed investment of one hundred ($100) dollars measured from the market close on December 31, 2020 (the last trading day of 2020) through and including the end of the fiscal year for each year reported in the table as required by the Rule. |
(8) | Total shareholder return for the FTSE NAREIT All Mortgage Capped Index, which we also use for purposes of the stock performance graph required by Item 201(e) of Regulation S-K included in our Annual Report for the year ended December 31, 2025. |
(9) | For purposes of the Rule, we have identified Distributable Earnings as our Company-Selected Metric. We define Distributable Earnings as net income (loss) attributable to our stockholders or, without duplication, owners of our subsidiaries, computed in accordance with GAAP, including realized losses not otherwise included in GAAP net income (loss) and excluding (i) non-cash equity compensation expense, (ii) depreciation and amortization, (iii) any unrealized gains or losses or other similar non-cash items that are included in net income for the applicable reporting period, regardless of whether such items are included in other comprehensive income or loss, or in net income, and (iv) one-time events pursuant to changes in GAAP and certain material non-cash income or expense items agreed upon after discussions between our Manager and our Board of Directors and after approval by a majority of our independent directors. The exclusion of depreciation and amortization from the calculation of Distributable Earnings only applies to debt investments related to real estate to the extent we foreclose upon the property or properties underlying such debt investments. Although Distributable Earnings is one important financial performance measure, among others, that the Compensation Committee considers when making compensation decisions with the intent of aligning compensation with Company performance, the Compensation Committee has not historically, and does not currently, evaluate “compensation actually paid” as calculated pursuant to Item 402(v)(2) of Regulation S-K as part of its executive compensation determinations; accordingly, the Compensation Committee does not actually use any financial performance measure specifically to link executive compensation “actually paid” to Company performance. |
(2) | In accordance with the requirements of Item 402(v)(2)(iii) of Regulation S-K, the following adjustments were made to the amounts reported for Mr. Salem in the Summary Compensation Table. Importantly, the dollar amounts do not reflect the actual amount of compensation earned by or paid to Mr. Salem during the applicable year. |
(4) | For fiscal year 2025, our Other NEOs were: W. Patrick Mattson, our President and Chief Operating Officer, Kendra L. Decious, our Chief Financial Officer and Treasurer and Kelly Galligan, our former General Counsel and Secretary. As previously disclosed, Ms. Galligan resigned from her role as General Counsel and Secretary effective as of January 30, 2026. |
For fiscal year 2024, our Other NEOs were: W. Patrick Mattson, our President and Chief Operating Officer, Kendra L. Decious, our Chief Financial Officer and Treasurer, Kelly Galligan, our General Counsel and Secretary, and Vincent J. Napolitano, our former General Counsel and Secretary. As previously disclosed, Mr. Napolitano stepped down from his role as General Counsel and Secretary effective as of October 22, 2024, and was succeeded by Ms. Galligan.
For fiscal year 2023, our Other NEOs were: W. Patrick Mattson, our President and Chief Operating Officer, Kendra L. Decious, our Chief Financial Officer and Treasurer, and Vincent J. Napolitano, our former General Counsel and Secretary.
For fiscal year 2022, our Other NEOs were: W. Patrick Mattson, our President and Chief Operating Officer; Kendra L. Decious, our Chief Financial Officer and Treasurer; Vincent J. Napolitano, our former General Counsel and Secretary; and Mostafa Nagaty, our former Chief Financial Officer and Treasurer. As previously disclosed, Mostafa Nagaty stepped down from his role as Chief Financial Officer and Treasurer of the Company on March 1, 2022 and was succeeded by Kendra Decious.
For fiscal year 2021, our Other NEOs were: W. Patrick Mattson, our President and Chief Operating Officer; Mostafa Nagaty, our former Chief Financial Officer and Treasurer; and Vincent J. Napolitano, our former General Counsel and Secretary.
(8) | Total shareholder return for the FTSE NAREIT All Mortgage Capped Index, which we also use for purposes of the stock performance graph required by Item 201(e) of Regulation S-K included in our Annual Report for the year ended December 31, 2025. |
(2) | In accordance with the requirements of Item 402(v)(2)(iii) of Regulation S-K, the following adjustments were made to the amounts reported for Mr. Salem in the Summary Compensation Table. Importantly, the dollar amounts do not reflect the actual amount of compensation earned by or paid to Mr. Salem during the applicable year. |
Description | 2021 ($) | 2022 ($) | 2023 ($) | 2024 ($) | 2025 ($) | ||||||||||
Reported Summary Compensation Total | 1,979,366 | 1,463,000 | 1,027,088 | 915,688 | 688,188 | ||||||||||
Change in Pension Value Deduction(a) | — | — | — | — | — | ||||||||||
Pension Service Cost Addition(a) | — | — | — | — | — | ||||||||||
Prior Pension Service Cost Addition(a) | — | — | — | — | — | ||||||||||
Reported Stock Awards Deduction(b) | (1,979,366) | (1,463,000) | (1,027,088) | (915,688) | (688,188) | ||||||||||
Equity Award Adjustments(c) | 2,470,598 | 674,410 | 1,073,836 | 650,106 | 588,399 | ||||||||||
Compensation Actually Paid | 2,470,598 | 674,410 | 1,073,836 | 650,106 | 588,399 | ||||||||||
(a) | The Company has no pension plans. |
(b) | Total grant date fair value of equity awards reported in the “Stock Awards” column in the Summary Compensation Table for the applicable year. Mr. Salem did not receive option awards in the years shown. |
(c) | For each covered year, the amounts added or deducted in calculated equity award adjustments include: |
Year | Year End Fair Value of Unvested Equity Awards Granted in the Covered Year | Year over Year Change in Fair Value of Outstanding and Unvested Equity Awards | Fair Value as of Vesting Date of Equity Awards Granted and Vested in the Year | Year over Year Change in Fair Value of Equity Awards Granted in Prior Years that Vested in the Year | Fair Value at the End of the Prior Year of Equity Awards that Failed to Meet Vesting Conditions in the Year | Value of Dividends or other Earnings Paid on Stock or Option Awards not Otherwise Reflected in Fair Value or Total Compensation | Total Equity Award Adjustments | ||||||||||||||
2025 | 667,875 | (149,618) | — | (95,276) | — | 165,418 | 588,399 | ||||||||||||||
2024 | 820,625 | (263,446) | — | (114,124) | — | 207,051 | 650,106 | ||||||||||||||
2023 | 1,008,788 | (72,428) | — | (187,408) | — | 324,884 | 1,073,836 | ||||||||||||||
2022 | 1,396,000 | (610,647) | — | (372,519) | — | 261,576 | 674,410 | ||||||||||||||
2021 | 2,034,050 | 211,185 | — | 225,363 | — | — | 2,470,598 | ||||||||||||||
(5) | In accordance with the requirements of Item 402(v)(2)(iii) of Regulation S-K, when calculating the “average compensation actually paid” for the Other NEOs, the following adjustments were made to the amounts reported in the Summary Compensation Table. Importantly, the dollar amounts do not reflect the actual average amount of compensation earned by or paid to our Other NEOs as a group during the applicable year. |
Description | 2021 ($) | 2022 ($) | 2023 ($) | 2024 ($) | 2025 ($) | ||||||||||
Average Reported Summary Compensation Total | 722,166 | 667,210 | 695,996 | 564,870 | 493,326 | ||||||||||
Average Change in Pension Value Deduction(a) | — | — | — | — | — | ||||||||||
Average Pension Service Cost Addition(a) | — | — | — | — | — | ||||||||||
Average Prior Pension Service Cost Addition(a) | — | — | — | — | — | ||||||||||
Average Reported Stock Awards Deduction(b) | (466,210) | (461,577) | (471,450) | (413,233) | (293,624) | ||||||||||
Average Equity Award Adjustments(c) | 622,286 | 192,357 | 482,678 | 302,137 | 252,746 | ||||||||||
Average Compensation Actually Paid to Other NEOs | 878,242 | 397,990 | 707,224 | 453,774 | 452,448 | ||||||||||
(a) | The Company has no pension plans. |
(b) | Average total grant date fair value of equity awards reported in the “Stock Awards” column in the Summary Compensation Table for the applicable year. The Other NEOs did not receive option awards in the years shown. |
(c) | For each covered year, the amounts added or deducted in calculated equity award adjustments include: |
Year | Year End Fair Value of Unvested Equity Awards Granted in the Covered Year | Year over Year Change in Fair Value of Outstanding and Unvested Equity Awards | Fair Value as of Vesting Date of Equity Awards Granted and Vested in the Year | Year over Year Change in Fair Value of Equity Awards Granted in Prior Years that Vested in the Year | Fair Value at the End of the Prior Year of Equity Awards that Failed to Meet Vesting Conditions in the Year | Value of Dividends or other Earnings Paid on Stock or Option Awards not Otherwise Reflected in Fair Value or Total Compensation | Total Equity Award Adjustments | ||||||||||||||
2025 | 284,957 | (61,519) | — | (34,459) | — | 63,767 | 252,746 | ||||||||||||||
2024 | 370,333 | (105,953) | — | (39,048) | — | 76,805 | 302,137 | ||||||||||||||
2023 | 463,050 | (21,965) | — | (57,393) | — | 98,986 | 482,678 | ||||||||||||||
2022 | 440,438 | (178,622) | — | (113,102) | (34,140) | 77,783 | 192,357 | ||||||||||||||
2021 | 479,090 | 73,237 | — | 69,959 | — | — | 622,286 | ||||||||||||||
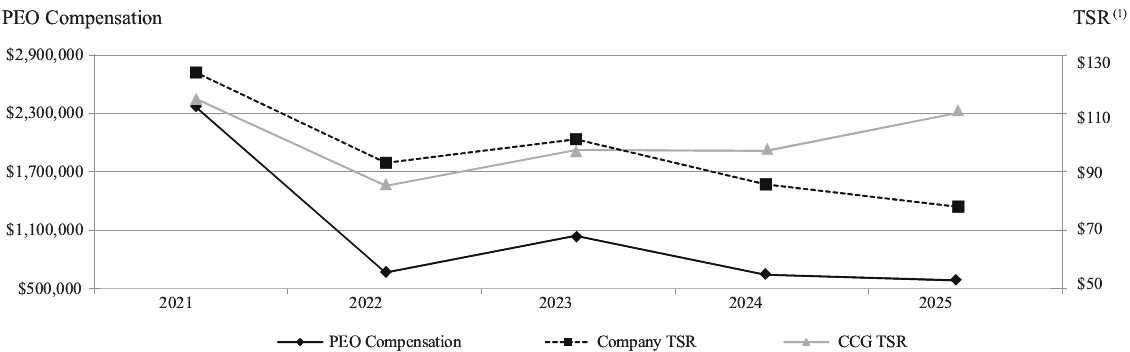
Total Shareholder Return
The following charts show the relationship between (1) the compensation actually paid to our PEO(s) and the average compensation actually paid to the Other NEOs (each as calculated pursuant to Item 402(v)(2)(iii) of Regulation S-K) and (2) the cumulative total shareholder return (“TSR”) of the Company for its last five completed fiscal years. The charts also provide a comparison of the Company’s TSR to the Compensation Comparison Group (“CCG”) TSR for the five-year period.
PEO Compensation vs. Company and CCG TSR
Other NEO Average Compensation vs. Company and CCG TSR
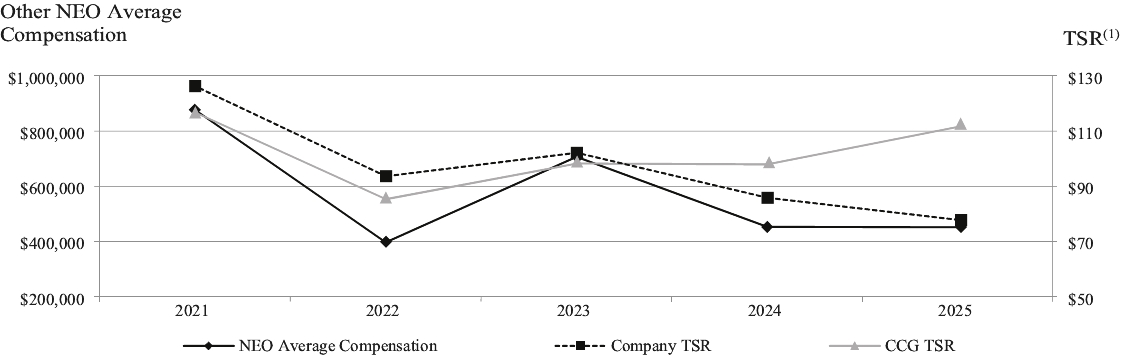
(1) | Calculated based on a fixed investment of one hundred ($100) dollars measured from the market close on December 31, 2020 (the last trading day of 2020) through and including the end of the fiscal year for each year reported in the table as required by the Rule. |
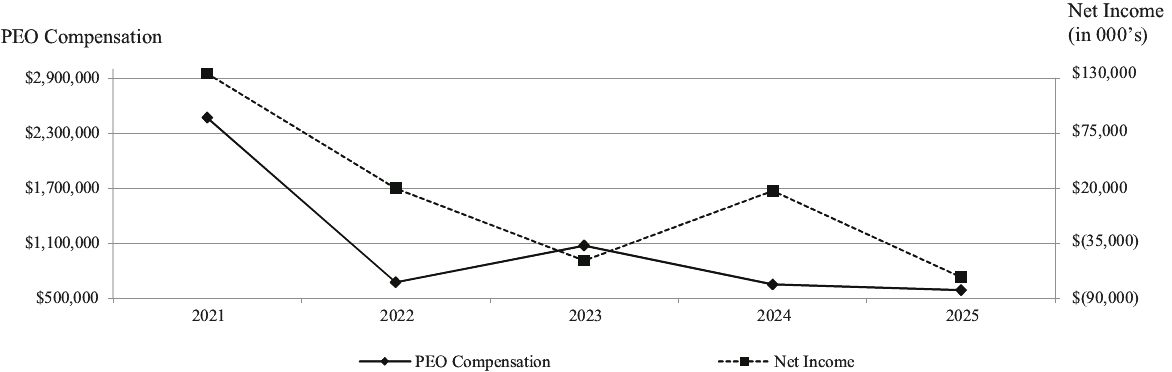
Net Income
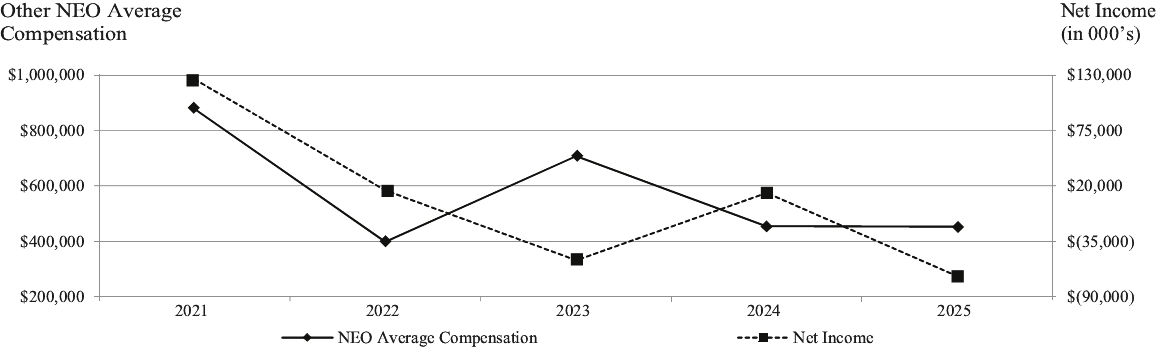
The following charts show the relationship between (1) the compensation actually paid to our PEO and the average compensation actually paid to the Other NEOs (each as calculated pursuant to Item 402(v)(2)(iii) of Regulation S-K) and (2) the net income of the Company for the last five fiscal years.
PEO Compensation vs. Net Income
Other NEO Average Compensation vs. Net Income
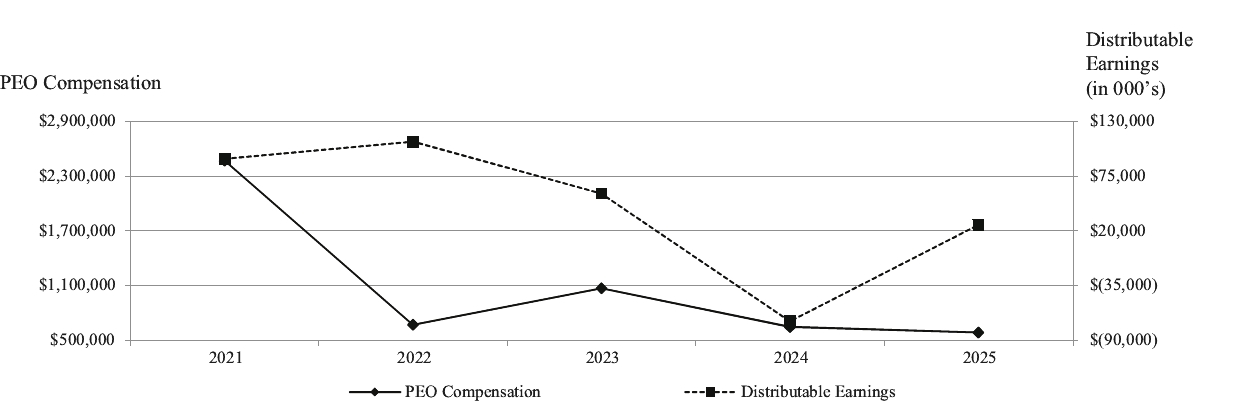
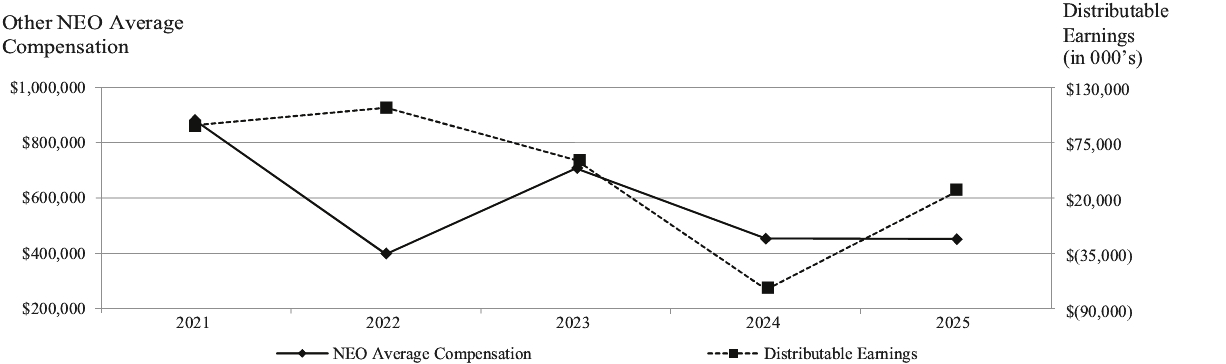
Company-Selected Measure: Distributable Earnings
The following charts show the relationship between (1) the compensation actually paid to our PEO and the average compensation actually paid to the Other NEOs (each as calculated pursuant to Item 402(v)(2)(iii) of Regulation S-K) and (2) distributable earnings for the last five fiscal years.
PEO Compensation vs. Distributable Earnings
Other NEO Average Compensation vs. Distributable Earnings
Total Shareholder Return
The following charts show the relationship between (1) the compensation actually paid to our PEO(s) and the average compensation actually paid to the Other NEOs (each as calculated pursuant to Item 402(v)(2)(iii) of Regulation S-K) and (2) the cumulative total shareholder return (“TSR”) of the Company for its last five completed fiscal years. The charts also provide a comparison of the Company’s TSR to the Compensation Comparison Group (“CCG”) TSR for the five-year period.
PEO Compensation vs. Company and CCG TSR
Other NEO Average Compensation vs. Company and CCG TSR
(1) | Calculated based on a fixed investment of one hundred ($100) dollars measured from the market close on December 31, 2020 (the last trading day of 2020) through and including the end of the fiscal year for each year reported in the table as required by the Rule. |
Tabular List of Financial Performance Measures
For purposes of the Rule, we have identified the following performance measures, which the Compensation Committee considered, among others, when making executive compensation decisions for performance year 2025, in response to the Tabular List disclosure requirement pursuant to Item 402(v)(6) of Regulation S-K.
Most Important Performance Measures | |||
Company Total Shareholder Return | |||
Net Income | |||
Distributable Earnings | |||
As noted above, however, the Compensation Committee has not historically and does not currently evaluate “compensation actually paid” as calculated pursuant to Item 402(v)(2) of Regulation S-K as part of its executive compensation determinations; accordingly, the Compensation Committee does not actually use any financial or non-financial performance measure specifically to link executive compensation “actually paid” to Company performance.
(c) | For each covered year, the amounts added or deducted in calculated equity award adjustments include: |
Year | Year End Fair Value of Unvested Equity Awards Granted in the Covered Year | Year over Year Change in Fair Value of Outstanding and Unvested Equity Awards | Fair Value as of Vesting Date of Equity Awards Granted and Vested in the Year | Year over Year Change in Fair Value of Equity Awards Granted in Prior Years that Vested in the Year | Fair Value at the End of the Prior Year of Equity Awards that Failed to Meet Vesting Conditions in the Year | Value of Dividends or other Earnings Paid on Stock or Option Awards not Otherwise Reflected in Fair Value or Total Compensation | Total Equity Award Adjustments | ||||||||||||||
2025 | 667,875 | (149,618) | — | (95,276) | — | 165,418 | 588,399 | ||||||||||||||
2024 | 820,625 | (263,446) | — | (114,124) | — | 207,051 | 650,106 | ||||||||||||||
2023 | 1,008,788 | (72,428) | — | (187,408) | — | 324,884 | 1,073,836 | ||||||||||||||
2022 | 1,396,000 | (610,647) | — | (372,519) | — | 261,576 | 674,410 | ||||||||||||||
2021 | 2,034,050 | 211,185 | — | 225,363 | — | — | 2,470,598 | ||||||||||||||
(c) | For each covered year, the amounts added or deducted in calculated equity award adjustments include: |
Year | Year End Fair Value of Unvested Equity Awards Granted in the Covered Year | Year over Year Change in Fair Value of Outstanding and Unvested Equity Awards | Fair Value as of Vesting Date of Equity Awards Granted and Vested in the Year | Year over Year Change in Fair Value of Equity Awards Granted in Prior Years that Vested in the Year | Fair Value at the End of the Prior Year of Equity Awards that Failed to Meet Vesting Conditions in the Year | Value of Dividends or other Earnings Paid on Stock or Option Awards not Otherwise Reflected in Fair Value or Total Compensation | Total Equity Award Adjustments | ||||||||||||||
2025 | 284,957 | (61,519) | — | (34,459) | — | 63,767 | 252,746 | ||||||||||||||
2024 | 370,333 | (105,953) | — | (39,048) | — | 76,805 | 302,137 | ||||||||||||||
2023 | 463,050 | (21,965) | — | (57,393) | — | 98,986 | 482,678 | ||||||||||||||
2022 | 440,438 | (178,622) | — | (113,102) | (34,140) | 77,783 | 192,357 | ||||||||||||||
2021 | 479,090 | 73,237 | — | 69,959 | — | — | 622,286 | ||||||||||||||