Pay vs Performance Disclosure - USD ($)
Dec. 28, 2025
Dec. 29, 2024
Dec. 31, 2023
Dec. 25, 2022
Dec. 26, 2021
Dec. 28, 2025
Sep. 02, 2024
Dec. 28, 2025
Pay vs. Performance
The following table summarizes compensation paid to our principal executive officer (“PEO”) as set forth in our Summary Compensation Table, compensation actually paid to our PEO, average compensation paid to our Non-PEO NEOs as set forth in our Summary Compensation Table, and average compensation actually paid to our Non-PEO NEOs, each as calculated in accordance with SEC rules, and certain Company and peer group performance measures for the periods indicated:
| Fiscal Year | Summary Compensation Table Total for PEO (1) | Compensation Actually Paid to PEO (2) | Average Summary Compensation Table Total for Non-PEO NEOs (3) | Average Compensation Actually Paid to Non-PEO NEOs (2) | Value of Initial Fixed $100 | Net Income (Loss) (dollars in millions) | Adjusted Diluted EPS (5) | |||||||||||||||||||||||||||||||||||||||||||||||||||||||
| Total Shareholder Return | Peer Group Total Shareholder Return (4) | |||||||||||||||||||||||||||||||||||||||||||||||||||||||||||||
1st PEO | 2nd PEO | 1st PEO | 2nd PEO | |||||||||||||||||||||||||||||||||||||||||||||||||||||||||||
| 2025 | $ | 5,495,861 | $ | — | $ | 6,450,786 | $ | — | $ | 1,483,550 | $ | 1,189,119 | $ | 42.47 | $ | 165.06 | $ | 13.2 | $ | 1.13 | ||||||||||||||||||||||||||||||||||||||||||
| 2024 | 3,965,019 | 6,339,020 | 3,676,625 | (2,087,085) | 1,523,663 | 477,812 | 72.63 | 148.57 | (122.7) | 1.79 | ||||||||||||||||||||||||||||||||||||||||||||||||||||
| 2023 | — | 6,825,003 | — | 8,305,815 | 1,689,279 | 2,116,313 | 158.45 | 110.43 | 254.4 | 2.78 | ||||||||||||||||||||||||||||||||||||||||||||||||||||
| 2022 | — | 6,251,632 | — | 5,068,922 | 1,561,981 | 1,339,269 | 113.43 | 89.94 | 109.2 | 2.36 | ||||||||||||||||||||||||||||||||||||||||||||||||||||
| 2021 | — | 7,518,278 | — | 11,384,346 | 2,200,145 | 2,598,640 | 110.55 | 112.43 | 222.9 | 2.45 | ||||||||||||||||||||||||||||||||||||||||||||||||||||
__________________
(1)Mr. Spanos (1st PEO) was appointed PEO effective September 3, 2024. Mr. Deno (2nd PEO) was the PEO from the beginning of 2020 through September 2, 2024.
(2)The charts below detail the additions to and deductions from the Summary Compensation Table Totals to calculate the Compensation Actually Paid amounts.
(3)The Non-PEO NEOs are comprised of: 2025 - Messrs. Christel, Healy, Hafner, and Graff, and Mses. Lefferts and Mitory; 2024 - Messrs. Healy, Berenstein, Graff, Meyer and Scarlett and Mses. Lefferts and Isaacs; 2023 - Messrs. Meyer, Scarlett and Patterson and Ms. Lefferts; 2022 - Messrs. Meyer, Scarlett and Murtha and Ms. Lefferts; 2021 - Messrs. Meyer, Scarlett, Murtha and Stutts and Ms. Lefferts.
(4)The peer group is made up of the same 25 companies in our peer group used for executive compensation benchmarking as described on page 59.
(5)Adjusted Diluted EPS was selected as the third metric to be included in the disclosure (as the Company-Selected Measure). A detailed Adjusted Diluted EPS reconciliation can be found within Appendix C.
The following table reconciles the PEO Summary Compensation Table total to Compensation Actually Paid for the periods indicated:
| Fiscal Year | Salary | Bonus and Non-Equity Incentive Compensation | Equity Compensation | All Other Compensation | Summary Compensation Table Total | Deductions from Summary Compensation Table Total (1) | Additions (Deductions) to Compensation Table Total (2) | Compensation Actually Paid | ||||||||||||||||||||||||||||||||||||||||||
| 1st PEO | ||||||||||||||||||||||||||||||||||||||||||||||||||
| 2025 | $ | 1,000,000 | $ | 1,155,000 | $ | 3,333,337 | $ | 7,524 | $ | 5,495,861 | $ | (3,333,337) | $ | 4,288,262 | $ | 6,450,786 | ||||||||||||||||||||||||||||||||||
| 2024 | 303,846 | 158,846 | 2,500,012 | 1,002,315 | 3,965,019 | (2,500,012) | 2,211,618 | 3,676,625 | ||||||||||||||||||||||||||||||||||||||||||
| 2nd PEO | ||||||||||||||||||||||||||||||||||||||||||||||||||
| 2024 | $ | 1,000,000 | $ | 420,000 | $ | 4,900,017 | $ | 19,003 | $ | 6,339,020 | $ | (4,900,017) | $ | (3,526,088) | $ | (2,087,085) | ||||||||||||||||||||||||||||||||||
| 2023 | 1,000,000 | 910,500 | 4,900,025 | 14,478 | 6,825,003 | (4,900,025) | 6,380,837 | 8,305,815 | ||||||||||||||||||||||||||||||||||||||||||
| 2022 | 984,615 | 897,969 | 4,350,033 | 19,015 | 6,251,632 | (4,350,033) | 3,167,323 | 5,068,922 | ||||||||||||||||||||||||||||||||||||||||||
| 2021 | 900,000 | 2,011,500 | 4,600,046 | 6,732 | 7,518,278 | (4,600,046) | 8,466,114 | 11,384,346 | ||||||||||||||||||||||||||||||||||||||||||
__________________
(1)Represents the grant date fair value of equity-based awards granted each year.
(2)Reflects the value of equity calculated in accordance with the SEC methodology for determining Compensation Actually Paid for each period presented (as set forth in Item 402(v)(2) of Regulation S-K). The equity component of compensation actually paid for fiscal year 2025 is further detailed in the supplemental table below.
The following table reconciles the Non-PEO NEOs Average Summary Compensation Table total to Average Compensation Actually Paid for the periods indicated:
| Fiscal Year | Average Salary | Average Bonus and Non-Equity Incentive Compensation | Average Equity Compensation | Average All Other Compensation | Average Summary Compensation Table Total | Deductions from Summary Compensation Table Total (1) | Additions (Deductions) to Compensation Table Total (2) | Average Compensation Actually Paid | ||||||||||||||||||||||||||||||||||||||||||
| 2025 | $ | 375,305 | $ | 274,516 | $ | 518,063 | $ | 315,666 | $ | 1,483,550 | $ | (518,063) | $ | 223,632 | $ | 1,189,119 | ||||||||||||||||||||||||||||||||||
| 2024 | 386,648 | 70,830 | 650,027 | 416,158 | 1,523,663 | (650,027) | (395,824) | 477,812 | ||||||||||||||||||||||||||||||||||||||||||
| 2023 | 570,096 | 353,867 | 759,407 | 5,909 | 1,689,279 | (759,407) | 1,186,441 | 2,116,313 | ||||||||||||||||||||||||||||||||||||||||||
| 2022 | 550,000 | 338,580 | 667,219 | 6,182 | 1,561,981 | (667,219) | 444,507 | 1,339,269 | ||||||||||||||||||||||||||||||||||||||||||
| 2021 | 536,539 | 640,700 | 697,157 | 325,749 | 2,200,145 | (697,157) | 1,095,652 | 2,598,640 | ||||||||||||||||||||||||||||||||||||||||||
__________________
(1)Represents the average grant date fair value of equity-based awards granted each year.
(2)Reflects the average value of equity calculated in accordance with the SEC methodology for determining average compensation actually paid for each period presented (as set forth in Item 402(v)(2) of Regulation S-K). The equity component of average compensation actually paid for fiscal year 2025 is further detailed in the supplemental table below.
The following table includes supplemental data for the additions and deductions resulting in the equity component of PEO Compensation Actually Paid for the periods indicated:
| Fiscal Year | Addition of Fair Value of Current Year Equity Awards at Fiscal Year End | (Deductions) Additions for Change in Value of Prior Years’ Awards Unvested at Fiscal Year End (1) | (Deductions) Additions for Change in Value of Prior Years’ Awards That Vested in Fiscal Year (1) | Equity Value Included in Compensation Actually Paid | ||||||||||||||||||||||||||||||||||||||||||||||
1st PEO | 2nd PEO | 1st PEO | 2nd PEO | 1st PEO | 2nd PEO | 1st PEO | 2nd PEO | |||||||||||||||||||||||||||||||||||||||||||
| 2025 | $ | 5,256,784 | $ | — | $ | (658,499) | $ | — | $ | (310,023) | $ | — | $ | 4,288,262 | $ | — | ||||||||||||||||||||||||||||||||||
| 2024 | 2,211,618 | 1,324,934 | — | (4,409,586) | — | (441,436) | 2,211,618 | (3,526,088) | ||||||||||||||||||||||||||||||||||||||||||
| 2023 | — | 5,194,051 | — | (329,870) | — | 1,516,656 | — | 6,380,837 | ||||||||||||||||||||||||||||||||||||||||||
| 2022 | — | 3,910,236 | — | (1,252,356) | — | 509,443 | — | 3,167,323 | ||||||||||||||||||||||||||||||||||||||||||
| 2021 | — | 3,268,932 | — | 3,748,314 | — | 1,448,868 | — | 8,466,114 | ||||||||||||||||||||||||||||||||||||||||||
__________________
(1)The valuation for PSUs as of the end of each fiscal year reflects the Company’s estimates of the probable outcome of the performance conditions of such awards as of such date, compared to the grant date valuation which reflected a valuation at 100%.
The following table includes supplemental data for the additions and deductions resulting in equity component of Non-PEO NEOs Average Compensation Actually Paid for the periods indicated:
| Fiscal Year | Addition of Average Fair Value of Current Year Equity Awards at Fiscal Year End | (Deductions) Additions for Average Change in Value of Prior Years’ Awards Unvested at Fiscal Year End (1) | (Deductions) Additions for Average Change in Value of Prior Years’ Awards That Vested in Fiscal Year (1) | Fair Value At End of Prior Fiscal Year of Awards Granted in Prior Years That Failed to Meet Vesting Conditions in the Fiscal Year | Average Equity Value Included in Compensation Actually Paid | |||||||||||||||||||||||||||
| 2025 | $ | 459,684 | $ | (39,168) | $ | (69,897) | $ | (126,987) | $ | 223,632 | ||||||||||||||||||||||
| 2024 | 292,356 | (272,941) | (66,203) | (349,036) | (395,824) | |||||||||||||||||||||||||||
| 2023 | 821,094 | (63,284) | 428,631 | — | 1,186,441 | |||||||||||||||||||||||||||
| 2022 | 599,763 | (278,452) | 123,196 | — | 444,507 | |||||||||||||||||||||||||||
| 2021 | 422,722 | 364,276 | 308,654 | — | 1,095,652 | |||||||||||||||||||||||||||
__________________
(1)The valuation for PSUs as of the end of each fiscal year reflects the Company’s estimates of the probable outcome of the performance conditions of such awards as of such date, compared to the grant date valuation which reflected a valuation at 100%.
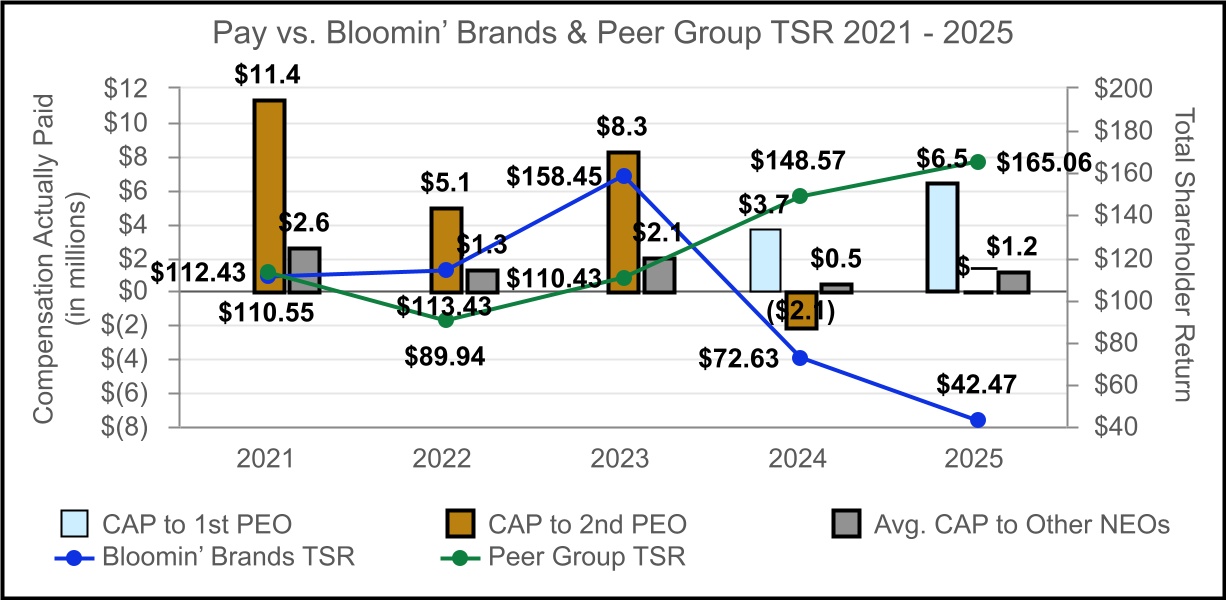
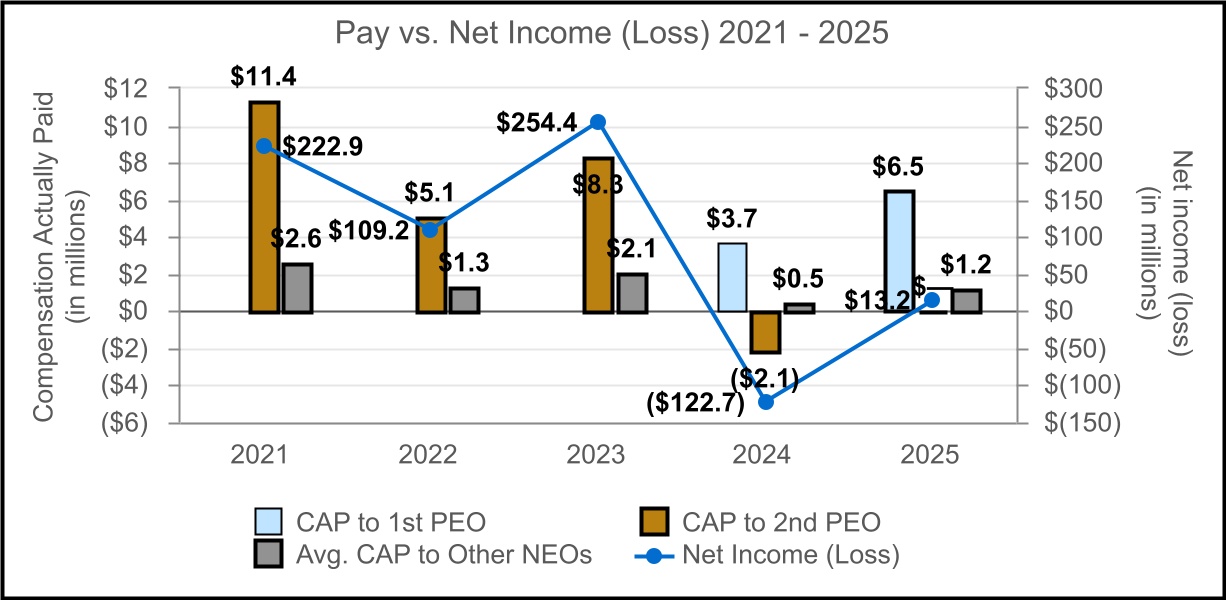
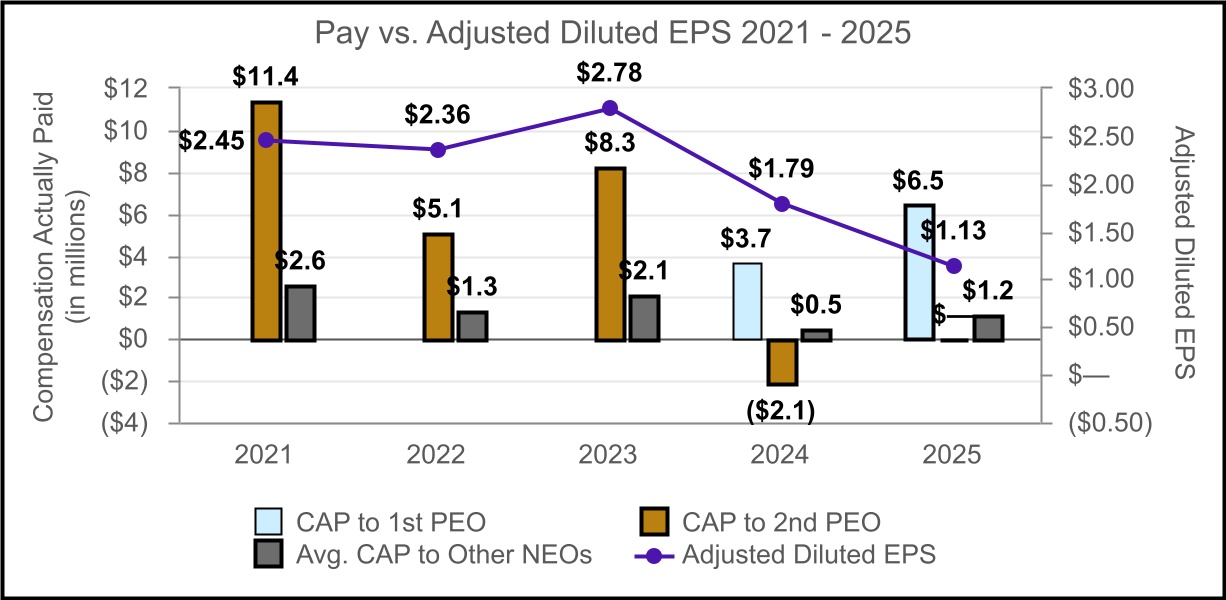
Relationship between Compensation Paid and Performance Measures
As shown in the charts as discussed further below, the relationship between the Compensation Actually Paid (“CAP”) to the PEO and the Average Compensation Actually Paid to the NEOs other than the PEO in fiscal 2021, 2022, 2023, 2024 and 2025 (collectively, “NEO Compensation Actually Paid”) to each of (1) Net income, (2) total shareholder return (“TSR”), and (3) Adjusted Diluted EPS demonstrates that such compensation fluctuates to the extent the Company is achieving its goals and increasing value for stockholders in line with the Company’s compensation philosophy and performance-based objectives.
(2)The charts below detail the additions to and deductions from the Summary Compensation Table Totals to calculate the Compensation Actually Paid amounts.
(3)The Non-PEO NEOs are comprised of: 2025 - Messrs. Christel, Healy, Hafner, and Graff, and Mses. Lefferts and Mitory; 2024 - Messrs. Healy, Berenstein, Graff, Meyer and Scarlett and Mses. Lefferts and Isaacs; 2023 - Messrs. Meyer, Scarlett and Patterson and Ms. Lefferts; 2022 - Messrs. Meyer, Scarlett and Murtha and Ms. Lefferts; 2021 - Messrs. Meyer, Scarlett, Murtha and Stutts and Ms. Lefferts.
The following table reconciles the PEO Summary Compensation Table total to Compensation Actually Paid for the periods indicated:
| Fiscal Year | Salary | Bonus and Non-Equity Incentive Compensation | Equity Compensation | All Other Compensation | Summary Compensation Table Total | Deductions from Summary Compensation Table Total (1) | Additions (Deductions) to Compensation Table Total (2) | Compensation Actually Paid | ||||||||||||||||||||||||||||||||||||||||||
| 1st PEO | ||||||||||||||||||||||||||||||||||||||||||||||||||
| 2025 | $ | 1,000,000 | $ | 1,155,000 | $ | 3,333,337 | $ | 7,524 | $ | 5,495,861 | $ | (3,333,337) | $ | 4,288,262 | $ | 6,450,786 | ||||||||||||||||||||||||||||||||||
| 2024 | 303,846 | 158,846 | 2,500,012 | 1,002,315 | 3,965,019 | (2,500,012) | 2,211,618 | 3,676,625 | ||||||||||||||||||||||||||||||||||||||||||
| 2nd PEO | ||||||||||||||||||||||||||||||||||||||||||||||||||
| 2024 | $ | 1,000,000 | $ | 420,000 | $ | 4,900,017 | $ | 19,003 | $ | 6,339,020 | $ | (4,900,017) | $ | (3,526,088) | $ | (2,087,085) | ||||||||||||||||||||||||||||||||||
| 2023 | 1,000,000 | 910,500 | 4,900,025 | 14,478 | 6,825,003 | (4,900,025) | 6,380,837 | 8,305,815 | ||||||||||||||||||||||||||||||||||||||||||
| 2022 | 984,615 | 897,969 | 4,350,033 | 19,015 | 6,251,632 | (4,350,033) | 3,167,323 | 5,068,922 | ||||||||||||||||||||||||||||||||||||||||||
| 2021 | 900,000 | 2,011,500 | 4,600,046 | 6,732 | 7,518,278 | (4,600,046) | 8,466,114 | 11,384,346 | ||||||||||||||||||||||||||||||||||||||||||
__________________
(1)Represents the grant date fair value of equity-based awards granted each year.
(2)Reflects the value of equity calculated in accordance with the SEC methodology for determining Compensation Actually Paid for each period presented (as set forth in Item 402(v)(2) of Regulation S-K). The equity component of compensation actually paid for fiscal year 2025 is further detailed in the supplemental table below.
The following table reconciles the Non-PEO NEOs Average Summary Compensation Table total to Average Compensation Actually Paid for the periods indicated:
| Fiscal Year | Average Salary | Average Bonus and Non-Equity Incentive Compensation | Average Equity Compensation | Average All Other Compensation | Average Summary Compensation Table Total | Deductions from Summary Compensation Table Total (1) | Additions (Deductions) to Compensation Table Total (2) | Average Compensation Actually Paid | ||||||||||||||||||||||||||||||||||||||||||
| 2025 | $ | 375,305 | $ | 274,516 | $ | 518,063 | $ | 315,666 | $ | 1,483,550 | $ | (518,063) | $ | 223,632 | $ | 1,189,119 | ||||||||||||||||||||||||||||||||||
| 2024 | 386,648 | 70,830 | 650,027 | 416,158 | 1,523,663 | (650,027) | (395,824) | 477,812 | ||||||||||||||||||||||||||||||||||||||||||
| 2023 | 570,096 | 353,867 | 759,407 | 5,909 | 1,689,279 | (759,407) | 1,186,441 | 2,116,313 | ||||||||||||||||||||||||||||||||||||||||||
| 2022 | 550,000 | 338,580 | 667,219 | 6,182 | 1,561,981 | (667,219) | 444,507 | 1,339,269 | ||||||||||||||||||||||||||||||||||||||||||
| 2021 | 536,539 | 640,700 | 697,157 | 325,749 | 2,200,145 | (697,157) | 1,095,652 | 2,598,640 | ||||||||||||||||||||||||||||||||||||||||||
__________________
(1)Represents the average grant date fair value of equity-based awards granted each year.
(2)Reflects the average value of equity calculated in accordance with the SEC methodology for determining average compensation actually paid for each period presented (as set forth in Item 402(v)(2) of Regulation S-K). The equity component of average compensation actually paid for fiscal year 2025 is further detailed in the supplemental table below.
| 1. | Adjusted Diluted EPS | |||||||
| 2. | Revenue | |||||||
| 3. | Adjusted Operating Income | |||||||
4. | Free Cash Flow Conversion | |||||||
| [1] | The Non-PEO NEOs are comprised of: 2025 - Messrs. Christel, Healy, Hafner, and Graff, and Mses. Lefferts and Mitory; 2024 - Messrs. Healy, Berenstein, Graff, Meyer and Scarlett and Mses. Lefferts and Isaacs; 2023 - Messrs. Meyer, Scarlett and Patterson and Ms. Lefferts; 2022 - Messrs. Meyer, Scarlett and Murtha and Ms. Lefferts; 2021 - Messrs. Meyer, Scarlett, Murtha and Stutts and Ms. Lefferts. |
| [2] | The charts below detail the additions to and deductions from the Summary Compensation Table Totals to calculate the Compensation Actually Paid amounts. |
| [3] | The peer group is made up of the same 25 companies in our peer group used for executive compensation benchmarking as described on page 59. |
| [4] | Adjusted Diluted EPS was selected as the third metric to be included in the disclosure (as the Company-Selected Measure). A detailed Adjusted Diluted EPS reconciliation can be found within Appendix C. |
| [5] | Mr. Spanos (1st PEO) was appointed PEO effective September 3, 2024. Mr. Deno (2nd PEO) was the PEO from the beginning of 2020 through September 2, 2024. |
| [6] | Represents the grant date fair value of equity-based awards granted each year. |
| [7] | Reflects the value of equity calculated in accordance with the SEC methodology for determining Compensation Actually Paid for each period presented (as set forth in Item 402(v)(2) of Regulation S-K). The equity component of compensation actually paid for fiscal year 2025 is further detailed in the supplemental table below. |
| [8] | The valuation for PSUs as of the end of each fiscal year reflects the Company’s estimates of the probable outcome of the performance conditions of such awards as of such date, compared to the grant date valuation which reflected a valuation at 100%. |
| [9] | Represents the average grant date fair value of equity-based awards granted each year. |
| [10] | Reflects the average value of equity calculated in accordance with the SEC methodology for determining average compensation actually paid for each period presented (as set forth in Item 402(v)(2) of Regulation S-K). The equity component of average compensation actually paid for fiscal year 2025 is further detailed in the supplemental table below. |
| [11] | The valuation for PSUs as of the end of each fiscal year reflects the Company’s estimates of the probable outcome of the performance conditions of such awards as of such date, compared to the grant date valuation which reflected a valuation at 100%. |