Shareholder Report
|
12 Months Ended |
|
Dec. 31, 2025
USD ($)
Holding
|
|---|
| Shareholder Report [Line Items] |
|
| Document Type |
N-CSR
|
| Amendment Flag |
false
|
| Registrant Name |
BARON SELECT FUNDS
|
| Entity Central Index Key |
0001217673
|
| Entity Investment Company Type |
N-1A
|
| Document Period End Date |
Dec. 31, 2025
|
| Shareholder Report Annual or Semi-Annual |
Annual Shareholder Report
|
| C000001642 |
|
| Shareholder Report [Line Items] |
|
| Fund Name |
Baron Partners Fund
|
| Class Name |
Retail
|
| Trading Symbol |
BPTRX
|
| Annual or Semi-Annual Statement [Text Block] |
This annual shareholder report contains important information about Baron Partners Fund (the Fund) for the period of January 1, 2025 to December 31, 2025.
|
| Additional Information [Text Block] |
You can find additional information about the Fund at BaronCapitalGroup.com. You can also request this information by contacting us at 1.800.99.BARON.
|
| Additional Information Phone Number |
1.800.99.BARON
|
| Additional Information Email |
<span style="box-sizing: border-box; color: rgb(0, 0, 0); display: inline; flex-wrap: nowrap; font-size: 10.6667px; font-weight: 400; grid-area: auto; line-height: 16px; margin: 0px; overflow: visible; text-align: left; text-align-last: auto; white-space-collapse: preserve-breaks;">info@BaronCapitalGroup.com</span>
|
| Additional Information Website |
BaronCapitalGroup.com
|
| Expenses [Text Block] |
What were the Fund costs for the the past 12 months?(based on a hypothetical $10,000 investment)
Class Name |
Cost of a $10,000 investment |
Costs paid as a percentage of a $10,000 investment |
Retail |
$214 |
1.91% | |
| Expenses Paid, Amount |
$ 214
|
| Expense Ratio, Percent |
1.91%
|
| Factors Affecting Performance [Text Block] |
How did the Fund perform last year and what affected its performance?Despite heightened market volatility to begin the year that resulted in a short-lived bear market, U.S. equities rebound sharply from April 8 lows to finish in positive territory for a third consecutive year. The principal catalyst for the market recovery was renewed rate cuts, with the Federal Reserve lowering its policy rate by 25 basis points on three separate occasions. Robust corporate earnings, narrowing trade uncertainties, a resilient consumer, increased M&A/IPO activity, and sustained AI optimism also contributed to market strength during the year. The Fund meaningfully outperformed for a third straight year, with most of the relative gains in 2025 coming from private companies SpaceX and xAI. |
| Performance Past Does Not Indicate Future [Text] |
Past performance is not predictive of future performance
|
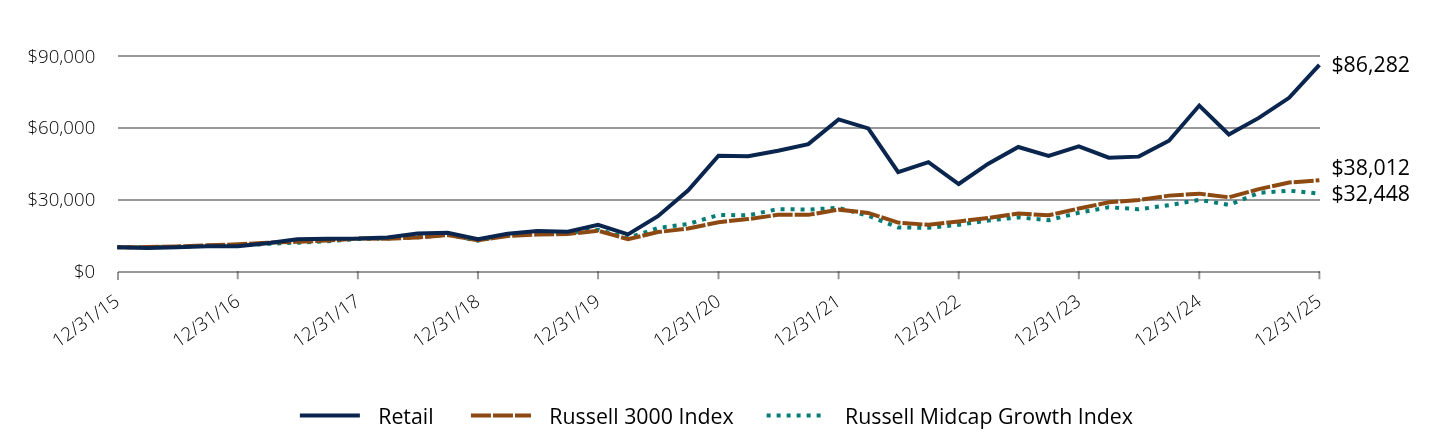
| Line Graph [Table Text Block] |
|
Retail |
Russell 3000 Index |
Russell Midcap Growth Index |
12/31/15 |
$10,000 |
$10,000 |
$10,000 |
03/31/16 |
$9,728 |
$10,097 |
$10,058 |
06/30/16 |
$10,039 |
$10,362 |
$10,215 |
09/30/16 |
$10,407 |
$10,818 |
$10,684 |
12/31/16 |
$10,404 |
$11,274 |
$10,733 |
03/31/17 |
$11,656 |
$11,921 |
$11,473 |
06/30/17 |
$13,360 |
$12,280 |
$11,956 |
09/30/17 |
$13,540 |
$12,842 |
$12,588 |
12/31/17 |
$13,686 |
$13,656 |
$13,445 |
03/31/18 |
$14,155 |
$13,568 |
$13,737 |
06/30/18 |
$15,786 |
$14,095 |
$14,171 |
09/30/18 |
$16,112 |
$15,099 |
$15,244 |
12/31/18 |
$13,411 |
$12,940 |
$12,806 |
03/31/19 |
$15,654 |
$14,757 |
$15,319 |
06/30/19 |
$16,819 |
$15,361 |
$16,146 |
09/30/19 |
$16,531 |
$15,540 |
$16,038 |
12/31/19 |
$19,445 |
$16,954 |
$17,348 |
03/31/20 |
$15,410 |
$13,410 |
$13,872 |
06/30/20 |
$23,016 |
$16,364 |
$18,070 |
09/30/20 |
$33,847 |
$17,871 |
$19,763 |
12/31/20 |
$48,326 |
$20,495 |
$23,522 |
03/31/21 |
$48,111 |
$21,796 |
$23,389 |
06/30/21 |
$50,401 |
$23,592 |
$25,979 |
09/30/21 |
$53,150 |
$23,568 |
$25,781 |
12/31/21 |
$63,495 |
$25,754 |
$26,516 |
03/31/22 |
$59,749 |
$24,395 |
$23,180 |
06/30/22 |
$41,473 |
$20,321 |
$18,296 |
09/30/22 |
$45,587 |
$19,413 |
$18,176 |
12/31/22 |
$36,471 |
$20,808 |
$19,431 |
03/31/23 |
$44,979 |
$22,302 |
$21,206 |
06/30/23 |
$51,936 |
$24,172 |
$22,528 |
09/30/23 |
$48,180 |
$23,386 |
$21,351 |
12/31/23 |
$52,191 |
$26,209 |
$24,457 |
03/31/24 |
$47,460 |
$28,835 |
$26,779 |
06/30/24 |
$47,918 |
$29,762 |
$25,919 |
09/30/24 |
$54,562 |
$31,616 |
$27,614 |
12/31/24 |
$69,276 |
$32,448 |
$29,862 |
03/31/25 |
$57,203 |
$30,916 |
$27,736 |
06/30/25 |
$64,114 |
$34,314 |
$32,785 |
09/30/25 |
$72,508 |
$37,120 |
$33,696 |
12/31/25 |
$86,282 |
$38,012 |
$32,448 |
|
| Average Annual Return [Table Text Block] |
Class/Index Name |
1 Year |
5 Years |
10 Years |
Retail |
24.55% |
12.29% |
24.05% |
Russell Midcap Growth Index |
8.66% |
6.65% |
12.49% |
Russell 3000 Index |
17.15% |
13.15% |
14.29% | |
| No Deduction of Taxes [Text Block] |
The performance data does not reflect the deduction of taxes that a shareholder would pay on Fund distributions or redemption of Fund shares
|
| AssetsNet |
$ 9,687,799,024
|
| Holdings Count | Holding |
22
|
| Advisory Fees Paid, Amount |
$ 76,231,995
|
| InvestmentCompanyPortfolioTurnover |
5.00%
|
| Additional Fund Statistics [Text Block] |
Total Net Assets |
$9,687,799,024 |
# of Issuers |
22 |
Portfolio Turnover Rate |
5% |
Total Advisory Fees Paid |
$76,231,995 | |
| Holdings [Text Block] |
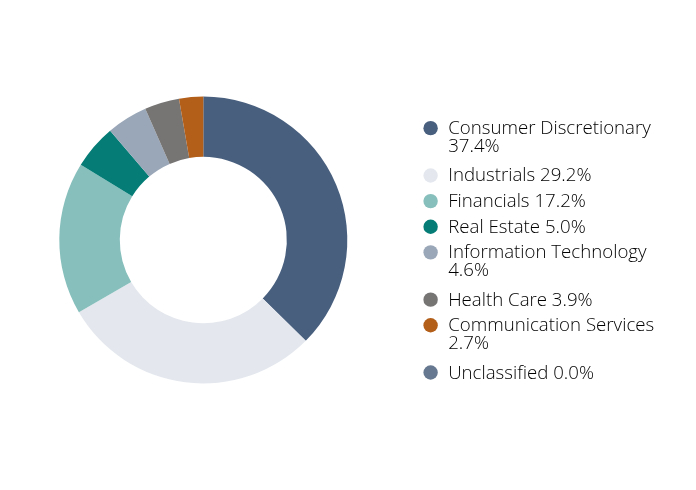
Sector Breakdown(as a % of total investments)Footnote Reference*
Value |
Value |
Consumer Discretionary |
37.4% |
Industrials |
29.2% |
Financials |
17.2% |
Real Estate |
5.0% |
Information Technology |
4.6% |
Health Care |
3.9% |
Communication Services |
2.7% |
Unclassified |
0.0% |
| Footnote |
Description |
Footnote* |
Individual weights may not sum to 100% (or displayed total) due torounding. | |
| Largest Holdings [Text Block] |
Holding |
% of Total Investments (12/31/25)* |
Space Exploration Technologies Corp. |
28.6% |
Tesla, Inc. |
26.7% |
Arch Capital Group Ltd. |
5.4% |
Hyatt Hotels Corp. |
4.9% |
CoStar Group, Inc. |
4.2% |
MSCI, Inc. |
4.2% |
The Charles Schwab Corp. |
4.0% |
IDEXX Laboratories, Inc. |
3.9% |
FactSet Research Systems, Inc. |
3.5% |
Gartner, Inc. |
2.9% |
Total |
88.3% | * Individual weights may not sum to 100% (or displayed total) due to rounding. |
| Material Fund Change [Text Block] |
|
| Updated Prospectus Phone Number |
1.800.99.BARON
|
| Updated Prospectus Web Address |
BaronCapitalGroup.com
|
| C000077805 |
|
| Shareholder Report [Line Items] |
|
| Fund Name |
Baron Partners Fund
|
| Class Name |
Institutional
|
| Trading Symbol |
BPTIX
|
| Annual or Semi-Annual Statement [Text Block] |
This annual shareholder report contains important information about Baron Partners Fund (the Fund) for the period of January 1, 2025 to December 31, 2025.
|
| Additional Information [Text Block] |
You can find additional information about the Fund at BaronCapitalGroup.com. You can also request this information by contacting us at 1.800.99.BARON.
|
| Additional Information Phone Number |
1.800.99.BARON
|
| Additional Information Email |
<span style="box-sizing: border-box; color: rgb(0, 0, 0); display: inline; flex-wrap: nowrap; font-size: 10.6667px; font-weight: 400; grid-area: auto; line-height: 16px; margin: 0px; overflow: visible; text-align: left; text-align-last: auto; white-space-collapse: preserve-breaks;">info@BaronCapitalGroup.com</span>
|
| Additional Information Website |
BaronCapitalGroup.com
|
| Expenses [Text Block] |
What were the Fund costs for the the past 12 months?(based on a hypothetical $10,000 investment)
Class Name |
Cost of a $10,000 investment |
Costs paid as a percentage of a $10,000 investment |
Institutional |
$186 |
1.65% | |
| Expenses Paid, Amount |
$ 186
|
| Expense Ratio, Percent |
1.65%
|
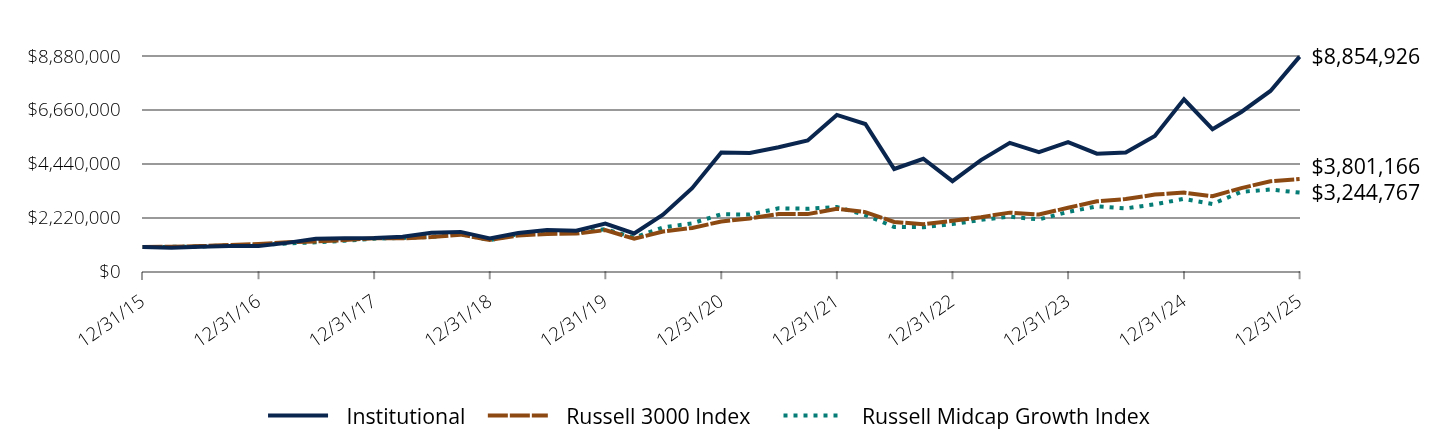
| Factors Affecting Performance [Text Block] |
How did the Fund perform last year and what affected its performance?Despite heightened market volatility to begin the year that resulted in a short-lived bear market, U.S. equities rebound sharply from April 8 lows to finish in positive territory for a third consecutive year. The principal catalyst for the market recovery was renewed rate cuts, with the Federal Reserve lowering its policy rate by 25 basis points on three separate occasions. Robust corporate earnings, narrowing trade uncertainties, a resilient consumer, increased M&A/IPO activity, and sustained AI optimism also contributed to market strength during the year. The Fund meaningfully outperformed for a third straight year, with most of the relative gains in 2025 coming from private companies SpaceX and xAI. |
| Performance Past Does Not Indicate Future [Text] |
Past performance is not predictive of future performance
|
| Line Graph [Table Text Block] |
|
Institutional |
Russell 3000 Index |
Russell Midcap Growth Index |
12/31/15 |
$1,000,000 |
$1,000,000 |
$1,000,000 |
03/31/16 |
$973,444 |
$1,009,683 |
$1,005,789 |
06/30/16 |
$1,005,256 |
$1,036,242 |
$1,021,506 |
09/30/16 |
$1,042,600 |
$1,081,814 |
$1,068,413 |
12/31/16 |
$1,042,877 |
$1,127,351 |
$1,073,286 |
03/31/17 |
$1,169,571 |
$1,192,098 |
$1,147,280 |
06/30/17 |
$1,341,355 |
$1,228,046 |
$1,195,639 |
09/30/17 |
$1,360,166 |
$1,284,185 |
$1,258,804 |
12/31/17 |
$1,375,657 |
$1,365,567 |
$1,344,480 |
03/31/18 |
$1,423,790 |
$1,356,766 |
$1,373,716 |
06/30/18 |
$1,588,935 |
$1,409,528 |
$1,417,093 |
09/30/18 |
$1,622,960 |
$1,509,942 |
$1,524,431 |
12/31/18 |
$1,351,591 |
$1,293,987 |
$1,280,608 |
03/31/19 |
$1,578,700 |
$1,475,708 |
$1,531,881 |
06/30/19 |
$1,697,095 |
$1,536,139 |
$1,614,630 |
09/30/19 |
$1,668,926 |
$1,553,997 |
$1,603,754 |
12/31/19 |
$1,964,977 |
$1,695,370 |
$1,734,838 |
03/31/20 |
$1,558,219 |
$1,341,042 |
$1,387,178 |
06/30/20 |
$2,329,005 |
$1,636,441 |
$1,806,952 |
09/30/20 |
$3,427,188 |
$1,787,117 |
$1,976,326 |
12/31/20 |
$4,896,301 |
$2,049,495 |
$2,352,210 |
03/31/21 |
$4,877,763 |
$2,179,574 |
$2,338,914 |
06/30/21 |
$5,113,251 |
$2,359,167 |
$2,597,879 |
09/30/21 |
$5,395,379 |
$2,356,767 |
$2,578,138 |
12/31/21 |
$6,449,764 |
$2,575,418 |
$2,651,600 |
03/31/22 |
$6,073,332 |
$2,439,475 |
$2,318,020 |
06/30/22 |
$4,218,105 |
$2,032,055 |
$1,829,573 |
09/30/22 |
$4,639,781 |
$1,941,331 |
$1,817,629 |
12/31/22 |
$3,714,454 |
$2,080,759 |
$1,943,071 |
03/31/23 |
$4,583,992 |
$2,230,164 |
$2,120,587 |
06/30/23 |
$5,296,424 |
$2,417,203 |
$2,252,787 |
09/30/23 |
$4,916,482 |
$2,338,552 |
$2,135,103 |
12/31/23 |
$5,329,128 |
$2,620,858 |
$2,445,678 |
03/31/24 |
$4,849,150 |
$2,883,451 |
$2,677,937 |
06/30/24 |
$4,898,847 |
$2,976,182 |
$2,591,881 |
09/30/24 |
$5,581,781 |
$3,161,573 |
$2,761,425 |
12/31/24 |
$7,091,753 |
$3,244,826 |
$2,986,248 |
03/31/25 |
$5,859,766 |
$3,091,607 |
$2,773,626 |
06/30/25 |
$6,571,459 |
$3,431,413 |
$3,278,473 |
09/30/25 |
$7,436,715 |
$3,711,972 |
$3,369,592 |
12/31/25 |
$8,854,926 |
$3,801,166 |
$3,244,767 |
|
| Average Annual Return [Table Text Block] |
Class/Index Name |
1 Year |
5 Years |
10 Years |
Institutional |
24.86% |
12.58% |
24.37% |
Russell Midcap Growth Index |
8.66% |
6.65% |
12.49% |
Russell 3000 Index |
17.15% |
13.15% |
14.29% | |
| No Deduction of Taxes [Text Block] |
The performance data does not reflect the deduction of taxes that a shareholder would pay on Fund distributions or redemption of Fund shares
|
| AssetsNet |
$ 9,687,799,024
|
| Holdings Count | Holding |
22
|
| Advisory Fees Paid, Amount |
$ 76,231,995
|
| InvestmentCompanyPortfolioTurnover |
5.00%
|
| Additional Fund Statistics [Text Block] |
Total Net Assets |
$9,687,799,024 |
# of Issuers |
22 |
Portfolio Turnover Rate |
5% |
Total Advisory Fees Paid |
$76,231,995 | |
| Holdings [Text Block] |
Sector Breakdown(as a % of total investments)Footnote Reference*
Value |
Value |
Consumer Discretionary |
37.4% |
Industrials |
29.2% |
Financials |
17.2% |
Real Estate |
5.0% |
Information Technology |
4.6% |
Health Care |
3.9% |
Communication Services |
2.7% |
Unclassified |
0.0% |
| Footnote |
Description |
Footnote* |
Individual weights may not sum to 100% (or displayed total) due torounding. | |
| Largest Holdings [Text Block] |
Holding |
% of Total Investments (12/31/25)* |
Space Exploration Technologies Corp. |
28.6% |
Tesla, Inc. |
26.7% |
Arch Capital Group Ltd. |
5.4% |
Hyatt Hotels Corp. |
4.9% |
CoStar Group, Inc. |
4.2% |
MSCI, Inc. |
4.2% |
The Charles Schwab Corp. |
4.0% |
IDEXX Laboratories, Inc. |
3.9% |
FactSet Research Systems, Inc. |
3.5% |
Gartner, Inc. |
2.9% |
Total |
88.3% | * Individual weights may not sum to 100% (or displayed total) due to rounding. |
| Material Fund Change [Text Block] |
|
| Updated Prospectus Phone Number |
1.800.99.BARON
|
| Updated Prospectus Web Address |
BaronCapitalGroup.com
|
| C000174760 |
|
| Shareholder Report [Line Items] |
|
| Fund Name |
Baron Partners Fund
|
| Class Name |
R6
|
| Trading Symbol |
BPTUX
|
| Annual or Semi-Annual Statement [Text Block] |
This annual shareholder report contains important information about Baron Partners Fund (the Fund) for the period of January 1, 2025 to December 31, 2025.
|
| Additional Information [Text Block] |
You can find additional information about the Fund at BaronCapitalGroup.com. You can also request this information by contacting us at 1.800.99.BARON.
|
| Additional Information Phone Number |
1.800.99.BARON
|
| Additional Information Email |
<span style="box-sizing: border-box; color: rgb(0, 0, 0); display: inline; flex-wrap: nowrap; font-size: 10.6667px; font-weight: 400; grid-area: auto; line-height: 16px; margin: 0px; overflow: visible; text-align: left; text-align-last: auto; white-space-collapse: preserve-breaks;">info@BaronCapitalGroup.com</span>
|
| Additional Information Website |
BaronCapitalGroup.com
|
| Expenses [Text Block] |
What were the Fund costs for the the past 12 months?(based on a hypothetical $10,000 investment)
Class Name |
Cost of a $10,000 investment |
Costs paid as a percentage of a $10,000 investment |
R6 |
$186 |
1.65% | |
| Expenses Paid, Amount |
$ 186
|
| Expense Ratio, Percent |
1.65%
|
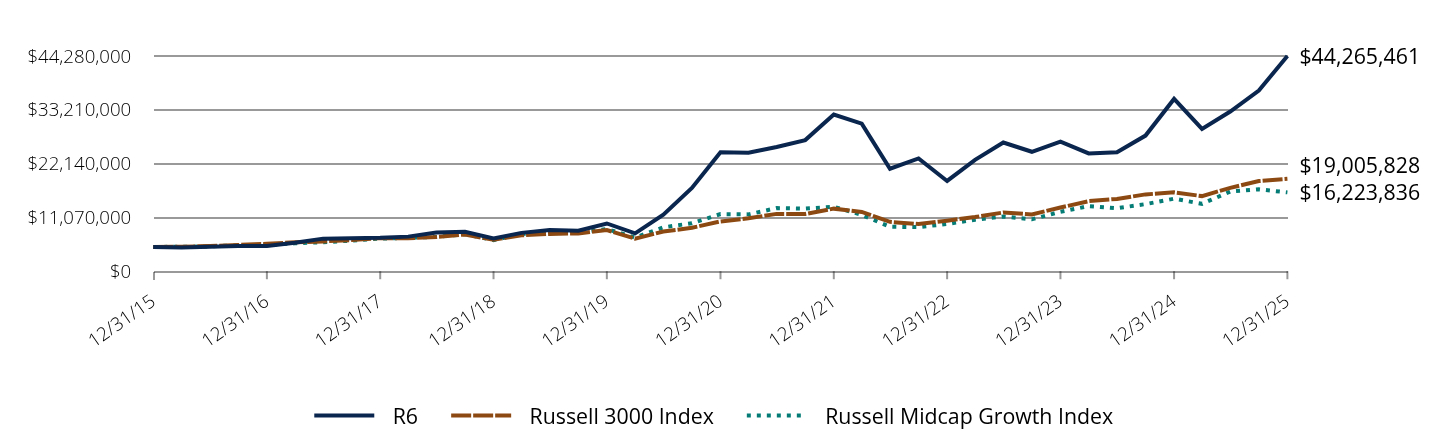
| Factors Affecting Performance [Text Block] |
How did the Fund perform last year and what affected its performance?Despite heightened market volatility to begin the year that resulted in a short-lived bear market, U.S. equities rebound sharply from April 8 lows to finish in positive territory for a third consecutive year. The principal catalyst for the market recovery was renewed rate cuts, with the Federal Reserve lowering its policy rate by 25 basis points on three separate occasions. Robust corporate earnings, narrowing trade uncertainties, a resilient consumer, increased M&A/IPO activity, and sustained AI optimism also contributed to market strength during the year. The Fund meaningfully outperformed for a third straight year, with most of the relative gains in 2025 coming from private companies SpaceX and xAI. |
| Performance Past Does Not Indicate Future [Text] |
Past performance is not predictive of future performance
|
| Line Graph [Table Text Block] |
|
R6 |
Russell 3000 Index |
Russell Midcap Growth Index |
12/31/15 |
$5,000,000 |
$5,000,000 |
$5,000,000 |
03/31/16 |
$4,867,220 |
$5,048,414 |
$5,028,946 |
06/30/16 |
$5,026,279 |
$5,181,212 |
$5,107,528 |
09/30/16 |
$5,213,001 |
$5,409,069 |
$5,342,065 |
12/31/16 |
$5,215,768 |
$5,636,756 |
$5,366,432 |
03/31/17 |
$5,847,856 |
$5,960,489 |
$5,736,399 |
06/30/17 |
$6,706,777 |
$6,140,231 |
$5,978,195 |
09/30/17 |
$6,800,830 |
$6,420,923 |
$6,294,019 |
12/31/17 |
$6,878,285 |
$6,827,836 |
$6,722,400 |
03/31/18 |
$7,118,949 |
$6,783,829 |
$6,868,579 |
06/30/18 |
$7,944,675 |
$7,047,641 |
$7,085,463 |
09/30/18 |
$8,114,799 |
$7,549,711 |
$7,622,156 |
12/31/18 |
$6,757,953 |
$6,469,935 |
$6,403,042 |
03/31/19 |
$7,893,499 |
$7,378,538 |
$7,659,406 |
06/30/19 |
$8,486,860 |
$7,680,695 |
$8,073,149 |
09/30/19 |
$8,346,014 |
$7,769,985 |
$8,018,768 |
12/31/19 |
$9,824,878 |
$8,476,848 |
$8,674,188 |
03/31/20 |
$7,791,092 |
$6,705,212 |
$6,935,891 |
06/30/20 |
$11,645,020 |
$8,182,206 |
$9,034,759 |
09/30/20 |
$17,135,945 |
$8,935,585 |
$9,881,629 |
12/31/20 |
$24,480,119 |
$10,247,474 |
$11,761,051 |
03/31/21 |
$24,387,430 |
$10,897,872 |
$11,694,569 |
06/30/21 |
$25,564,874 |
$11,795,834 |
$12,989,394 |
09/30/21 |
$26,975,515 |
$11,783,835 |
$12,890,692 |
12/31/21 |
$32,247,521 |
$12,877,088 |
$13,258,002 |
03/31/22 |
$30,365,345 |
$12,197,377 |
$11,590,101 |
06/30/22 |
$21,090,699 |
$10,160,274 |
$9,147,863 |
09/30/22 |
$23,197,530 |
$9,706,657 |
$9,088,144 |
12/31/22 |
$18,570,849 |
$10,403,795 |
$9,715,353 |
03/31/23 |
$22,916,980 |
$11,150,818 |
$10,602,937 |
06/30/23 |
$26,479,171 |
$12,086,016 |
$11,263,933 |
09/30/23 |
$24,577,839 |
$11,692,758 |
$10,675,517 |
12/31/23 |
$26,641,089 |
$13,104,290 |
$12,228,391 |
03/31/24 |
$24,242,782 |
$14,417,255 |
$13,389,684 |
06/30/24 |
$24,489,666 |
$14,880,912 |
$12,959,404 |
09/30/24 |
$27,904,369 |
$15,807,865 |
$13,807,127 |
12/31/24 |
$35,452,704 |
$16,224,131 |
$14,931,241 |
03/31/25 |
$29,292,700 |
$15,458,036 |
$13,868,128 |
06/30/25 |
$32,851,204 |
$17,157,066 |
$16,392,365 |
09/30/25 |
$37,175,925 |
$18,559,858 |
$16,847,961 |
12/31/25 |
$44,265,461 |
$19,005,828 |
$16,223,836 |
|
| Average Annual Return [Table Text Block] |
Class/Index Name |
1 Year |
5 Years |
10 Years |
R6 |
24.86% |
12.58% |
24.37% |
Russell Midcap Growth Index |
8.66% |
6.65% |
12.49% |
Russell 3000 Index |
17.15% |
13.15% |
14.29% | |
| No Deduction of Taxes [Text Block] |
The performance data does not reflect the deduction of taxes that a shareholder would pay on Fund distributions or redemption of Fund shares
|
| AssetsNet |
$ 9,687,799,024
|
| Holdings Count | Holding |
22
|
| Advisory Fees Paid, Amount |
$ 76,231,995
|
| InvestmentCompanyPortfolioTurnover |
5.00%
|
| Additional Fund Statistics [Text Block] |
Total Net Assets |
$9,687,799,024 |
# of Issuers |
22 |
Portfolio Turnover Rate |
5% |
Total Advisory Fees Paid |
$76,231,995 | |
| Holdings [Text Block] |
Sector Breakdown(as a % of total investments)Footnote Reference*
Value |
Value |
Consumer Discretionary |
37.4% |
Industrials |
29.2% |
Financials |
17.2% |
Real Estate |
5.0% |
Information Technology |
4.6% |
Health Care |
3.9% |
Communication Services |
2.7% |
Unclassified |
0.0% |
| Footnote |
Description |
Footnote* |
Individual weights may not sum to 100% (or displayed total) due torounding. | |
| Largest Holdings [Text Block] |
Holding |
% of Total Investments (12/31/25)* |
Space Exploration Technologies Corp. |
28.6% |
Tesla, Inc. |
26.7% |
Arch Capital Group Ltd. |
5.4% |
Hyatt Hotels Corp. |
4.9% |
CoStar Group, Inc. |
4.2% |
MSCI, Inc. |
4.2% |
The Charles Schwab Corp. |
4.0% |
IDEXX Laboratories, Inc. |
3.9% |
FactSet Research Systems, Inc. |
3.5% |
Gartner, Inc. |
2.9% |
Total |
88.3% | * Individual weights may not sum to 100% (or displayed total) due to rounding. |
| Material Fund Change [Text Block] |
|
| Updated Prospectus Phone Number |
1.800.99.BARON
|
| Updated Prospectus Web Address |
BaronCapitalGroup.com
|
| C000065146 |
|
| Shareholder Report [Line Items] |
|
| Fund Name |
Baron Focused Growth Fund
|
| Class Name |
Retail
|
| Trading Symbol |
BFGFX
|
| Annual or Semi-Annual Statement [Text Block] |
This annual shareholder report contains important information about Baron Focused Growth Fund (the Fund) for the period of January 1, 2025 to December 31, 2025.
|
| Additional Information [Text Block] |
You can find additional information about the Fund at BaronCapitalGroup.com. You can also request this information by contacting us at 1.800.99.BARON.
|
| Additional Information Phone Number |
1.800.99.BARON
|
| Additional Information Email |
<span style="box-sizing: border-box; color: rgb(0, 0, 0); display: inline; flex-wrap: nowrap; font-size: 10.6667px; font-weight: 400; grid-area: auto; line-height: 16px; margin: 0px; overflow: visible; text-align: left; text-align-last: auto; white-space-collapse: preserve-breaks;">info@BaronCapitalGroup.com</span>
|
| Additional Information Website |
BaronCapitalGroup.com
|
| Expenses [Text Block] |
What were the Fund costs for the the past 12 months?(based on a hypothetical $10,000 investment)
Class Name |
Cost of a $10,000 investment |
Costs paid as a percentage of a $10,000 investment |
Retail |
$145 |
1.31% | |
| Expenses Paid, Amount |
$ 145
|
| Expense Ratio, Percent |
1.31%
|
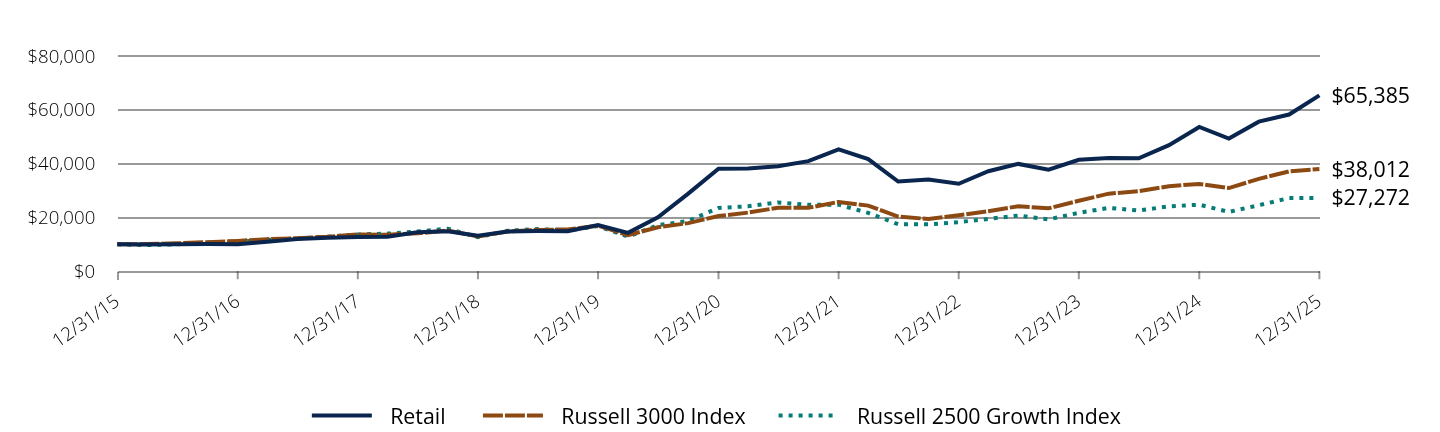
| Factors Affecting Performance [Text Block] |
How did the Fund perform last year and what affected its performance?Despite heightened market volatility to begin the year that resulted in a short-lived bear market, U.S. equities rebound sharply from April 8 lows to finish in positive territory for a third consecutive year. The principal catalyst for the market recovery was renewed rate cuts, with the Federal Reserve lowering its policy rate by 25 basis points on three separate occasions. Robust corporate earnings, narrowing trade uncertainties, a resilient consumer, increased M&A/IPO activity, and sustained AI optimism also contributed to market strength during the year. The Fund meaningfully outperformed for a third straight year, with most of the relative gains in 2025 coming from private companies SpaceX and xAI. |
| Performance Past Does Not Indicate Future [Text] |
Past performance is not predictive of future performance
|
| Line Graph [Table Text Block] |
|
Retail |
Russell 3000 Index |
Russell 2500 Growth Index |
12/31/15 |
$10,000 |
$10,000 |
$10,000 |
03/31/16 |
$9,908 |
$10,097 |
$9,734 |
06/30/16 |
$10,038 |
$10,362 |
$9,997 |
09/30/16 |
$10,138 |
$10,818 |
$10,695 |
12/31/16 |
$10,067 |
$11,274 |
$10,973 |
03/31/17 |
$10,926 |
$11,921 |
$11,659 |
06/30/17 |
$12,019 |
$12,280 |
$12,140 |
09/30/17 |
$12,401 |
$12,842 |
$12,841 |
12/31/17 |
$12,721 |
$13,656 |
$13,656 |
03/31/18 |
$12,845 |
$13,568 |
$13,981 |
06/30/18 |
$14,466 |
$14,095 |
$14,754 |
09/30/18 |
$14,877 |
$15,099 |
$15,811 |
12/31/18 |
$13,199 |
$12,940 |
$12,637 |
03/31/19 |
$14,802 |
$14,757 |
$15,036 |
06/30/19 |
$14,944 |
$15,361 |
$15,659 |
09/30/19 |
$14,877 |
$15,540 |
$15,161 |
12/31/19 |
$17,163 |
$16,954 |
$16,763 |
03/31/20 |
$14,280 |
$13,410 |
$12,871 |
06/30/20 |
$20,080 |
$16,364 |
$17,101 |
09/30/20 |
$28,839 |
$17,871 |
$18,704 |
12/31/20 |
$38,137 |
$20,495 |
$23,547 |
03/31/21 |
$38,145 |
$21,796 |
$24,133 |
06/30/21 |
$39,051 |
$23,592 |
$25,589 |
09/30/21 |
$40,916 |
$23,568 |
$24,685 |
12/31/21 |
$45,319 |
$25,754 |
$24,735 |
03/31/22 |
$41,654 |
$24,395 |
$21,691 |
06/30/22 |
$33,338 |
$20,321 |
$17,450 |
09/30/22 |
$34,050 |
$19,413 |
$17,429 |
12/31/22 |
$32,494 |
$20,808 |
$18,251 |
03/31/23 |
$37,162 |
$22,302 |
$19,446 |
06/30/23 |
$39,887 |
$24,172 |
$20,693 |
09/30/23 |
$37,752 |
$23,386 |
$19,278 |
12/31/23 |
$41,398 |
$26,209 |
$21,706 |
03/31/24 |
$42,068 |
$28,835 |
$23,553 |
06/30/24 |
$41,954 |
$29,762 |
$22,561 |
09/30/24 |
$46,861 |
$31,616 |
$24,137 |
12/31/24 |
$53,618 |
$32,448 |
$24,723 |
03/31/25 |
$49,325 |
$30,916 |
$22,053 |
06/30/25 |
$55,595 |
$34,314 |
$24,548 |
09/30/25 |
$58,241 |
$37,120 |
$27,182 |
12/31/25 |
$65,385 |
$38,012 |
$27,272 |
|
| Average Annual Return [Table Text Block] |
Class/Index Name |
1 Year |
5 Years |
10 Years |
Retail |
21.94% |
11.39% |
20.66% |
Russell 2500 Growth Index |
10.31% |
2.98% |
10.55% |
Russell 3000 Index |
17.15% |
13.15% |
14.29% | |
| No Deduction of Taxes [Text Block] |
The performance data does not reflect the deduction of taxes that a shareholder would pay on Fund distributions or redemption of Fund shares
|
| AssetsNet |
$ 3,418,080,575
|
| Holdings Count | Holding |
28
|
| Advisory Fees Paid, Amount |
$ 25,433,058
|
| InvestmentCompanyPortfolioTurnover |
8.00%
|
| Additional Fund Statistics [Text Block] |
Total Net Assets |
$3,418,080,575 |
# of Issuers |
28 |
Portfolio Turnover Rate |
8% |
Total Advisory Fees Paid |
$25,433,058 | |
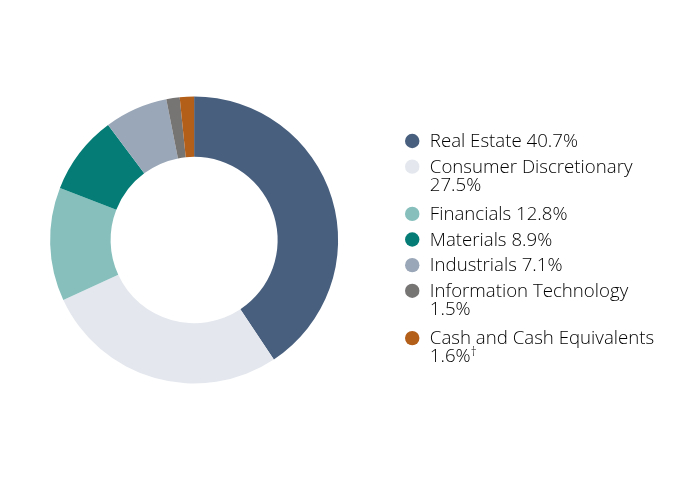
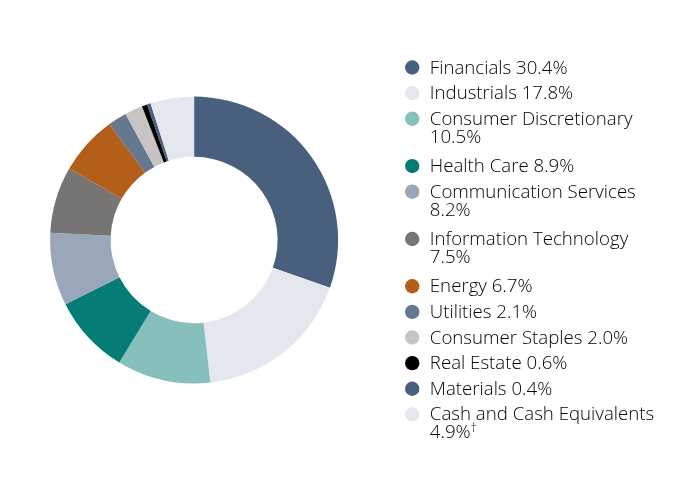
| Holdings [Text Block] |
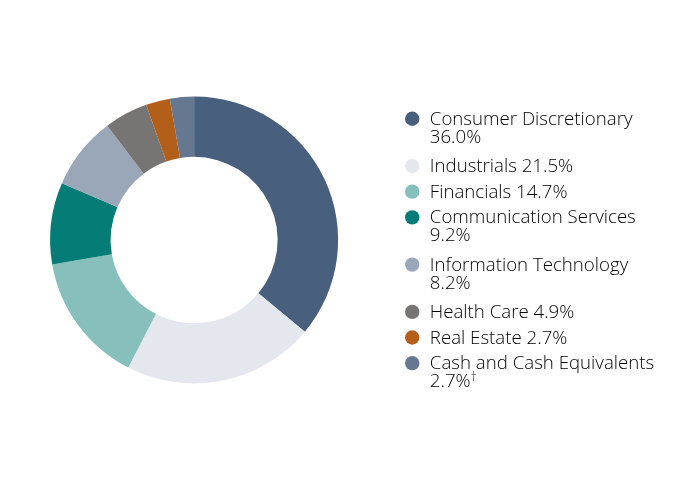
Sector Breakdown(as a % of net assets)*
Value |
Value |
Consumer Discretionary |
36.0% |
Industrials |
21.5% |
Financials |
14.7% |
Communication Services |
9.2% |
Information Technology |
8.2% |
Health Care |
4.9% |
Real Estate |
2.7% |
Cash and Cash Equivalents |
2.7%Footnote Reference† |
| Footnote |
Description |
Footnote† |
Includes other assets and liabilities-net. | |
| Largest Holdings [Text Block] |
Holding |
% of Net Assets (12/31/25)* |
Space Exploration Technologies Corp. |
19.2% |
Tesla, Inc. |
8.1% |
IDEXX Laboratories, Inc. |
4.7% |
Spotify Technology SA |
4.5% |
MSCI, Inc. |
4.3% |
On Holding AG |
4.3% |
Interactive Brokers Group, Inc. |
4.1% |
X.AI Holdings Corp. |
3.7% |
Red Rock Resorts, Inc. |
3.7% |
Hyatt Hotels Corp. |
3.7% |
Total |
60.1% | * Individual weights may not sum to 100% (or displayed total) due to rounding. |
| Material Fund Change [Text Block] |
|
| Updated Prospectus Phone Number |
1.800.99.BARON
|
| Updated Prospectus Web Address |
BaronCapitalGroup.com
|
| C000077806 |
|
| Shareholder Report [Line Items] |
|
| Fund Name |
Baron Focused Growth Fund
|
| Class Name |
Institutional
|
| Trading Symbol |
BFGIX
|
| Annual or Semi-Annual Statement [Text Block] |
This annual shareholder report contains important information about Baron Focused Growth Fund (the Fund) for the period of January 1, 2025 to December 31, 2025.
|
| Additional Information [Text Block] |
You can find additional information about the Fund at BaronCapitalGroup.com. You can also request this information by contacting us at 1.800.99.BARON.
|
| Additional Information Phone Number |
1.800.99.BARON
|
| Additional Information Email |
<span style="box-sizing: border-box; color: rgb(0, 0, 0); display: inline; flex-wrap: nowrap; font-size: 10.6667px; font-weight: 400; grid-area: auto; line-height: 16px; margin: 0px; overflow: visible; text-align: left; text-align-last: auto; white-space-collapse: preserve-breaks;">info@BaronCapitalGroup.com</span>
|
| Additional Information Website |
BaronCapitalGroup.com
|
| Expenses [Text Block] |
What were the Fund costs for the the past 12 months?(based on a hypothetical $10,000 investment)
Class Name |
Cost of a $10,000 investment |
Costs paid as a percentage of a $10,000 investment |
Institutional |
$117 |
1.05% | |
| Expenses Paid, Amount |
$ 117
|
| Expense Ratio, Percent |
1.05%
|
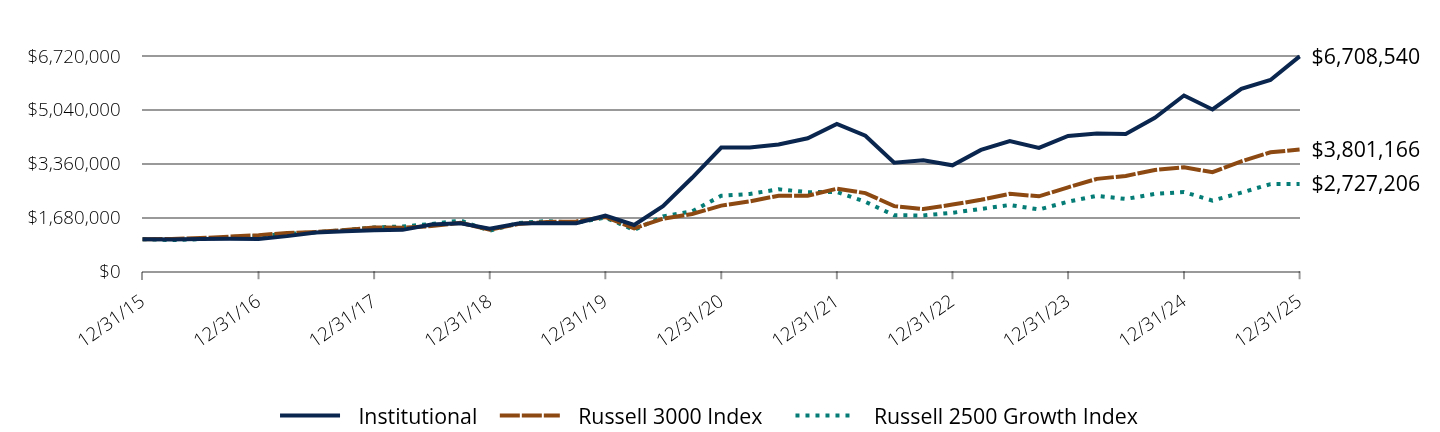
| Factors Affecting Performance [Text Block] |
How did the Fund perform last year and what affected its performance?Despite heightened market volatility to begin the year that resulted in a short-lived bear market, U.S. equities rebound sharply from April 8 lows to finish in positive territory for a third consecutive year. The principal catalyst for the market recovery was renewed rate cuts, with the Federal Reserve lowering its policy rate by 25 basis points on three separate occasions. Robust corporate earnings, narrowing trade uncertainties, a resilient consumer, increased M&A/IPO activity, and sustained AI optimism also contributed to market strength during the year. The Fund meaningfully outperformed for a third straight year, with most of the relative gains in 2025 coming from private companies SpaceX and xAI. |
| Performance Past Does Not Indicate Future [Text] |
Past performance is not predictive of future performance
|
| Line Graph [Table Text Block] |
|
Institutional |
Russell 3000 Index |
Russell 2500 Growth Index |
12/31/15 |
$1,000,000 |
$1,000,000 |
$1,000,000 |
03/31/16 |
$991,698 |
$1,009,683 |
$973,408 |
06/30/16 |
$1,005,283 |
$1,036,242 |
$999,683 |
09/30/16 |
$1,015,849 |
$1,081,814 |
$1,069,507 |
12/31/16 |
$1,009,717 |
$1,127,351 |
$1,097,279 |
03/31/17 |
$1,096,058 |
$1,192,098 |
$1,165,868 |
06/30/17 |
$1,206,384 |
$1,228,046 |
$1,213,971 |
09/30/17 |
$1,245,037 |
$1,284,185 |
$1,284,114 |
12/31/17 |
$1,278,244 |
$1,365,567 |
$1,365,625 |
03/31/18 |
$1,292,120 |
$1,356,766 |
$1,398,108 |
06/30/18 |
$1,456,186 |
$1,409,528 |
$1,475,390 |
09/30/18 |
$1,498,313 |
$1,509,942 |
$1,581,122 |
12/31/18 |
$1,330,277 |
$1,293,987 |
$1,263,658 |
03/31/19 |
$1,491,723 |
$1,475,708 |
$1,503,586 |
06/30/19 |
$1,508,197 |
$1,536,139 |
$1,565,865 |
09/30/19 |
$1,501,607 |
$1,553,997 |
$1,516,067 |
12/31/19 |
$1,733,744 |
$1,695,370 |
$1,676,297 |
03/31/20 |
$1,443,528 |
$1,341,042 |
$1,287,082 |
06/30/20 |
$2,030,669 |
$1,636,441 |
$1,710,141 |
09/30/20 |
$2,917,992 |
$1,787,117 |
$1,870,435 |
12/31/20 |
$3,861,881 |
$2,049,495 |
$2,354,678 |
03/31/21 |
$3,866,214 |
$2,179,574 |
$2,413,253 |
06/30/21 |
$3,959,814 |
$2,359,167 |
$2,558,918 |
09/30/21 |
$4,152,271 |
$2,356,767 |
$2,468,538 |
12/31/21 |
$4,601,907 |
$2,575,418 |
$2,473,458 |
03/31/22 |
$4,232,476 |
$2,439,475 |
$2,169,120 |
06/30/22 |
$3,389,775 |
$2,032,055 |
$1,745,041 |
09/30/22 |
$3,463,546 |
$1,941,331 |
$1,742,916 |
12/31/22 |
$3,307,121 |
$2,080,759 |
$1,825,145 |
03/31/23 |
$3,786,381 |
$2,230,164 |
$1,944,577 |
06/30/23 |
$4,065,950 |
$2,417,203 |
$2,069,322 |
09/30/23 |
$3,850,726 |
$2,338,552 |
$1,927,846 |
12/31/23 |
$4,225,703 |
$2,620,858 |
$2,170,648 |
03/31/24 |
$4,296,705 |
$2,883,451 |
$2,355,331 |
06/30/24 |
$4,287,830 |
$2,976,182 |
$2,256,050 |
09/30/24 |
$4,792,607 |
$3,161,573 |
$2,413,719 |
12/31/24 |
$5,487,091 |
$3,244,826 |
$2,472,341 |
03/31/25 |
$5,051,097 |
$3,091,607 |
$2,205,331 |
06/30/25 |
$5,696,768 |
$3,431,413 |
$2,454,751 |
09/30/25 |
$5,971,899 |
$3,711,972 |
$2,718,237 |
12/31/25 |
$6,708,540 |
$3,801,166 |
$2,727,206 |
|
| Average Annual Return [Table Text Block] |
Class/Index Name |
1 Year |
5 Years |
10 Years |
Institutional |
22.26% |
11.68% |
20.97% |
Russell 2500 Growth Index |
10.31% |
2.98% |
10.55% |
Russell 3000 Index |
17.15% |
13.15% |
14.29% | |
| No Deduction of Taxes [Text Block] |
The performance data does not reflect the deduction of taxes that a shareholder would pay on Fund distributions or redemption of Fund shares
|
| AssetsNet |
$ 3,418,080,575
|
| Holdings Count | Holding |
28
|
| Advisory Fees Paid, Amount |
$ 25,433,058
|
| InvestmentCompanyPortfolioTurnover |
8.00%
|
| Additional Fund Statistics [Text Block] |
Total Net Assets |
$3,418,080,575 |
# of Issuers |
28 |
Portfolio Turnover Rate |
8% |
Total Advisory Fees Paid |
$25,433,058 | |
| Holdings [Text Block] |
Sector Breakdown(as a % of net assets)*
Value |
Value |
Consumer Discretionary |
36.0% |
Industrials |
21.5% |
Financials |
14.7% |
Communication Services |
9.2% |
Information Technology |
8.2% |
Health Care |
4.9% |
Real Estate |
2.7% |
Cash and Cash Equivalents |
2.7%Footnote Reference† |
| Footnote |
Description |
Footnote† |
Includes other assets and liabilities-net. | |
| Largest Holdings [Text Block] |
Holding |
% of Net Assets (12/31/25)* |
Space Exploration Technologies Corp. |
19.2% |
Tesla, Inc. |
8.1% |
IDEXX Laboratories, Inc. |
4.7% |
Spotify Technology SA |
4.5% |
MSCI, Inc. |
4.3% |
On Holding AG |
4.3% |
Interactive Brokers Group, Inc. |
4.1% |
X.AI Holdings Corp. |
3.7% |
Red Rock Resorts, Inc. |
3.7% |
Hyatt Hotels Corp. |
3.7% |
Total |
60.1% | * Individual weights may not sum to 100% (or displayed total) due to rounding. |
| Material Fund Change [Text Block] |
|
| Updated Prospectus Phone Number |
1.800.99.BARON
|
| Updated Prospectus Web Address |
BaronCapitalGroup.com
|
| C000174761 |
|
| Shareholder Report [Line Items] |
|
| Fund Name |
Baron Focused Growth Fund
|
| Class Name |
R6
|
| Trading Symbol |
BFGUX
|
| Annual or Semi-Annual Statement [Text Block] |
This annual shareholder report contains important information about Baron Focused Growth Fund (the Fund) for the period of January 1, 2025 to December 31, 2025.
|
| Additional Information [Text Block] |
You can find additional information about the Fund at BaronCapitalGroup.com. You can also request this information by contacting us at 1.800.99.BARON.
|
| Additional Information Phone Number |
1.800.99.BARON
|
| Additional Information Email |
<span style="box-sizing: border-box; color: rgb(0, 0, 0); display: inline; flex-wrap: nowrap; font-size: 10.6667px; font-weight: 400; grid-area: auto; line-height: 16px; margin: 0px; overflow: visible; text-align: left; text-align-last: auto; white-space-collapse: preserve-breaks;">info@BaronCapitalGroup.com</span>
|
| Additional Information Website |
BaronCapitalGroup.com
|
| Expenses [Text Block] |
What were the Fund costs for the the past 12 months?(based on a hypothetical $10,000 investment)
Class Name |
Cost of a $10,000 investment |
Costs paid as a percentage of a $10,000 investment |
R6 |
$117 |
1.05% | |
| Expenses Paid, Amount |
$ 117
|
| Expense Ratio, Percent |
1.05%
|
| Factors Affecting Performance [Text Block] |
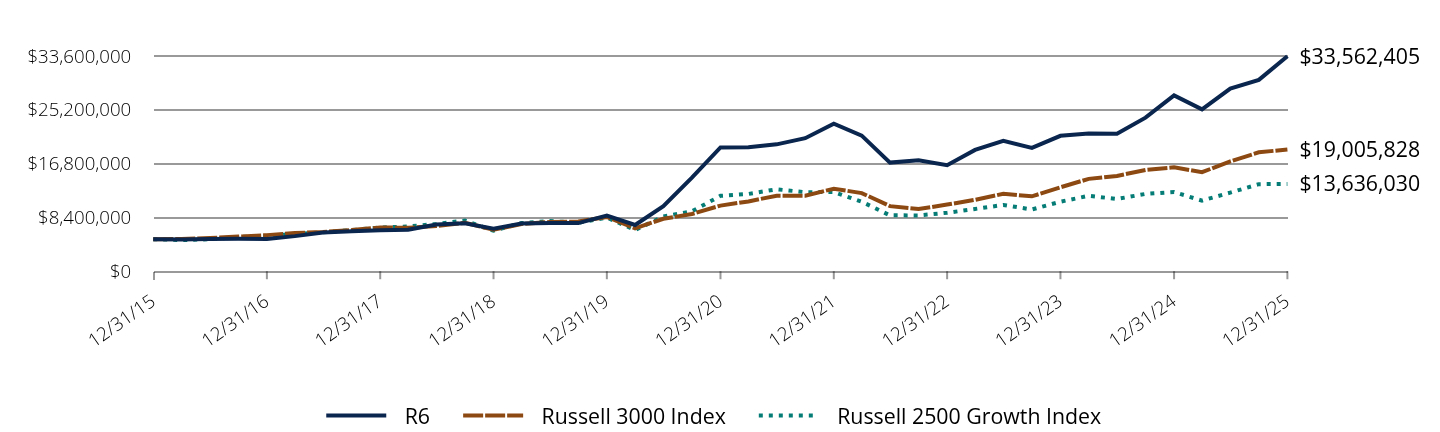
How did the Fund perform last year and what affected its performance?Despite heightened market volatility to begin the year that resulted in a short-lived bear market, U.S. equities rebound sharply from April 8 lows to finish in positive territory for a third consecutive year. The principal catalyst for the market recovery was renewed rate cuts, with the Federal Reserve lowering its policy rate by 25 basis points on three separate occasions. Robust corporate earnings, narrowing trade uncertainties, a resilient consumer, increased M&A/IPO activity, and sustained AI optimism also contributed to market strength during the year. The Fund meaningfully outperformed for a third straight year, with most of the relative gains in 2025 coming from private companies SpaceX and xAI. |
| Performance Past Does Not Indicate Future [Text] |
Past performance is not predictive of future performance
|
| Line Graph [Table Text Block] |
|
R6 |
Russell 3000 Index |
Russell 2500 Growth Index |
12/31/15 |
$5,000,000 |
$5,000,000 |
$5,000,000 |
03/31/16 |
$4,958,491 |
$5,048,414 |
$4,867,040 |
06/30/16 |
$5,026,415 |
$5,181,212 |
$4,998,414 |
09/30/16 |
$5,079,245 |
$5,409,069 |
$5,347,536 |
12/31/16 |
$5,048,359 |
$5,636,756 |
$5,486,397 |
03/31/17 |
$5,480,048 |
$5,960,489 |
$5,829,338 |
06/30/17 |
$6,031,650 |
$6,140,231 |
$6,069,853 |
09/30/17 |
$6,228,907 |
$6,420,923 |
$6,420,571 |
12/31/17 |
$6,394,931 |
$6,827,836 |
$6,828,125 |
03/31/18 |
$6,464,309 |
$6,783,829 |
$6,990,541 |
06/30/18 |
$7,280,509 |
$7,047,641 |
$7,376,951 |
09/30/18 |
$7,495,213 |
$7,549,711 |
$7,905,610 |
12/31/18 |
$6,655,090 |
$6,469,935 |
$6,318,290 |
03/31/19 |
$7,462,267 |
$7,378,538 |
$7,517,932 |
06/30/19 |
$7,540,514 |
$7,680,695 |
$7,829,323 |
09/30/19 |
$7,511,686 |
$7,769,985 |
$7,580,333 |
12/31/19 |
$8,672,292 |
$8,476,848 |
$8,381,484 |
03/31/20 |
$7,221,319 |
$6,705,212 |
$6,435,408 |
06/30/20 |
$10,156,814 |
$8,182,206 |
$8,550,707 |
09/30/20 |
$14,597,300 |
$8,935,585 |
$9,352,175 |
12/31/20 |
$19,320,562 |
$10,247,474 |
$11,773,391 |
03/31/21 |
$19,337,893 |
$10,897,872 |
$12,066,266 |
06/30/21 |
$19,810,183 |
$11,795,834 |
$12,794,592 |
09/30/21 |
$20,772,509 |
$11,783,835 |
$12,342,691 |
12/31/21 |
$23,020,458 |
$12,877,088 |
$12,367,289 |
03/31/22 |
$21,173,630 |
$12,197,377 |
$10,845,598 |
06/30/22 |
$16,955,875 |
$10,160,274 |
$8,725,205 |
09/30/22 |
$17,330,224 |
$9,706,657 |
$8,714,582 |
12/31/22 |
$16,548,284 |
$10,403,795 |
$9,125,726 |
03/31/23 |
$18,944,014 |
$11,150,818 |
$9,722,886 |
06/30/23 |
$20,341,524 |
$12,086,016 |
$10,346,612 |
09/30/23 |
$19,265,663 |
$11,692,758 |
$9,639,231 |
12/31/23 |
$21,140,100 |
$13,104,290 |
$10,853,238 |
03/31/24 |
$21,495,023 |
$14,417,255 |
$11,776,654 |
06/30/24 |
$21,456,204 |
$14,880,912 |
$11,280,251 |
09/30/24 |
$23,979,484 |
$15,807,865 |
$12,068,595 |
12/31/24 |
$27,451,075 |
$16,224,131 |
$12,361,706 |
03/31/25 |
$25,271,626 |
$15,458,036 |
$11,026,657 |
06/30/25 |
$28,499,207 |
$17,157,066 |
$12,273,755 |
09/30/25 |
$29,874,533 |
$18,559,858 |
$13,591,184 |
12/31/25 |
$33,562,405 |
$19,005,828 |
$13,636,030 |
|
| Average Annual Return [Table Text Block] |
Class/Index Name |
1 Year |
5 Years |
10 Years |
R6 |
22.26% |
11.68% |
20.97% |
Russell 2500 Growth Index |
10.31% |
2.98% |
10.55% |
Russell 3000 Index |
17.15% |
13.15% |
14.29% | |
| No Deduction of Taxes [Text Block] |
The performance data does not reflect the deduction of taxes that a shareholder would pay on Fund distributions or redemption of Fund shares
|
| AssetsNet |
$ 3,418,080,575
|
| Holdings Count | Holding |
28
|
| Advisory Fees Paid, Amount |
$ 25,433,058
|
| InvestmentCompanyPortfolioTurnover |
8.00%
|
| Additional Fund Statistics [Text Block] |
Total Net Assets |
$3,418,080,575 |
# of Issuers |
28 |
Portfolio Turnover Rate |
8% |
Total Advisory Fees Paid |
$25,433,058 | |
| Holdings [Text Block] |
Sector Breakdown(as a % of net assets)*
Value |
Value |
Consumer Discretionary |
36.0% |
Industrials |
21.5% |
Financials |
14.7% |
Communication Services |
9.2% |
Information Technology |
8.2% |
Health Care |
4.9% |
Real Estate |
2.7% |
Cash and Cash Equivalents |
2.7%Footnote Reference† |
| Footnote |
Description |
Footnote† |
Includes other assets and liabilities-net. | |
| Largest Holdings [Text Block] |
Holding |
% of Net Assets (12/31/25)* |
Space Exploration Technologies Corp. |
19.2% |
Tesla, Inc. |
8.1% |
IDEXX Laboratories, Inc. |
4.7% |
Spotify Technology SA |
4.5% |
MSCI, Inc. |
4.3% |
On Holding AG |
4.3% |
Interactive Brokers Group, Inc. |
4.1% |
X.AI Holdings Corp. |
3.7% |
Red Rock Resorts, Inc. |
3.7% |
Hyatt Hotels Corp. |
3.7% |
Total |
60.1% | * Individual weights may not sum to 100% (or displayed total) due to rounding. |
| Material Fund Change [Text Block] |
|
| Updated Prospectus Phone Number |
1.800.99.BARON
|
| Updated Prospectus Web Address |
BaronCapitalGroup.com
|
| C000073358 |
|
| Shareholder Report [Line Items] |
|
| Fund Name |
Baron International Growth Fund
|
| Class Name |
Retail
|
| Trading Symbol |
BIGFX
|
| Annual or Semi-Annual Statement [Text Block] |
This annual shareholder report contains important information about Baron International Growth Fund (the Fund) for the period of January 1, 2025 to December 31, 2025.
|
| Additional Information [Text Block] |
You can find additional information about the Fund at BaronCapitalGroup.com. You can also request this information by contacting us at 1.800.99.BARON.
|
| Additional Information Phone Number |
1.800.99.BARON
|
| Additional Information Email |
<span style="box-sizing: border-box; color: rgb(0, 0, 0); display: inline; flex-wrap: nowrap; font-size: 10.6667px; font-weight: 400; grid-area: auto; line-height: 16px; margin: 0px; overflow: visible; text-align: left; text-align-last: auto; white-space-collapse: preserve-breaks;">info@BaronCapitalGroup.com</span>
|
| Additional Information Website |
BaronCapitalGroup.com
|
| Expenses [Text Block] |
What were the Fund costs for the the past 12 months?(based on a hypothetical $10,000 investment)
Class Name |
Cost of a $10,000 investment |
Costs paid as a percentage of a $10,000 investment |
Retail |
$134 |
1.21% | |
| Expenses Paid, Amount |
$ 134
|
| Expense Ratio, Percent |
1.21%
|
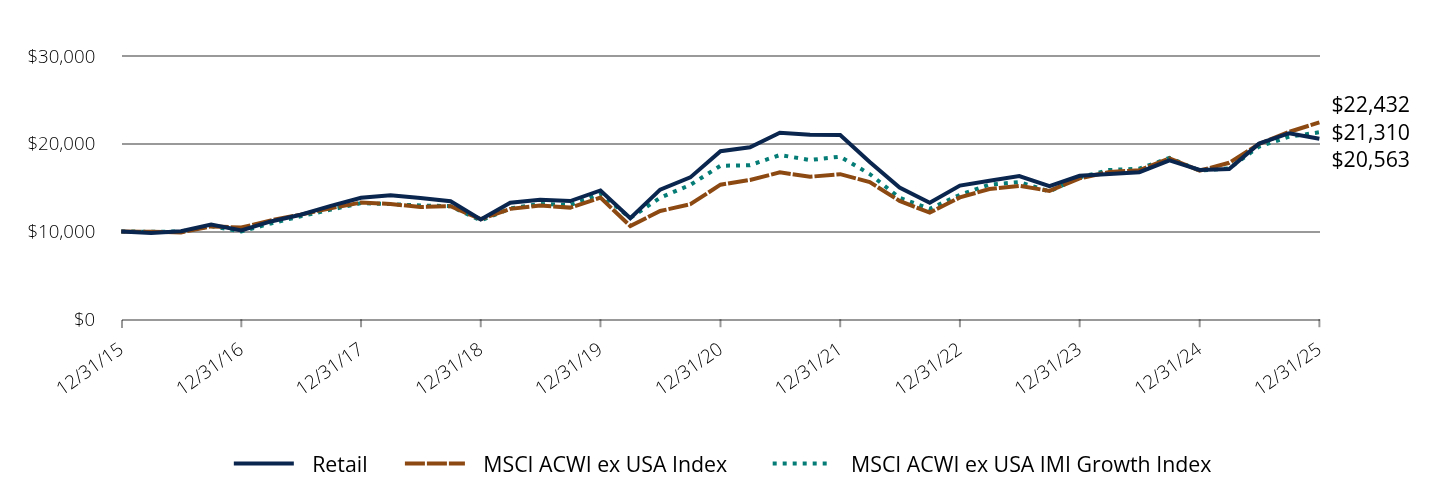
| Factors Affecting Performance [Text Block] |
How did the Fund perform last year and what affected its performance?International and emerging market (EM) equities significantly outperformed their U.S. and global counterparts for first time in several years. The year was marked by a largely unexpected U.S. withdrawal from the decades-long multilateral security and trade equilibrium, which triggered a variety of defensive policy responses around the world. When the U.S. subsequently negotiated new bilateral trade agreements, or relented, and materially diluted tariff and other protectionist measures, the monetary, fiscal and reform stimulus already in the pipeline led to solid global economic growth, ultimately resulting in a much more constructive backdrop for EM and international equities. The Fund failed to keep pace with the Index in what proved to be a difficult year for quality growth investors. Performance was held back by disappointing stock selection in developed (Spain, Israel, Japan, and the U.K.) and emerging (Poland, China, and India) markets. |
| Performance Past Does Not Indicate Future [Text] |
Past performance is not predictive of future performance
|
| Line Graph [Table Text Block] |
|
Retail |
MSCI ACWI ex USA Index |
MSCI ACWI ex USA IMI Growth Index |
12/31/15 |
$10,000 |
$10,000 |
$10,000 |
03/31/16 |
$9,839 |
$9,962 |
$9,968 |
06/30/16 |
$10,022 |
$9,898 |
$9,999 |
09/30/16 |
$10,787 |
$10,582 |
$10,618 |
12/31/16 |
$10,114 |
$10,450 |
$10,006 |
03/31/17 |
$11,143 |
$11,271 |
$10,917 |
06/30/17 |
$11,903 |
$11,922 |
$11,734 |
09/30/17 |
$12,911 |
$12,657 |
$12,487 |
12/31/17 |
$13,851 |
$13,291 |
$13,232 |
03/31/18 |
$14,123 |
$13,134 |
$13,121 |
06/30/18 |
$13,804 |
$12,790 |
$12,958 |
09/30/18 |
$13,451 |
$12,880 |
$12,889 |
12/31/18 |
$11,372 |
$11,404 |
$11,253 |
03/31/19 |
$13,269 |
$12,580 |
$12,627 |
06/30/19 |
$13,610 |
$12,955 |
$13,134 |
09/30/19 |
$13,465 |
$12,722 |
$13,014 |
12/31/19 |
$14,677 |
$13,858 |
$14,288 |
03/31/20 |
$11,520 |
$10,621 |
$11,535 |
06/30/20 |
$14,772 |
$12,333 |
$13,852 |
09/30/20 |
$16,166 |
$13,104 |
$15,312 |
12/31/20 |
$19,156 |
$15,334 |
$17,488 |
03/31/21 |
$19,593 |
$15,869 |
$17,555 |
06/30/21 |
$21,247 |
$16,738 |
$18,718 |
09/30/21 |
$21,019 |
$16,238 |
$18,145 |
12/31/21 |
$21,002 |
$16,533 |
$18,532 |
03/31/22 |
$17,917 |
$15,634 |
$16,546 |
06/30/22 |
$15,002 |
$13,488 |
$13,848 |
09/30/22 |
$13,267 |
$12,151 |
$12,578 |
12/31/22 |
$15,232 |
$13,888 |
$14,179 |
03/31/23 |
$15,789 |
$14,841 |
$15,339 |
06/30/23 |
$16,326 |
$15,203 |
$15,635 |
09/30/23 |
$15,181 |
$14,629 |
$14,568 |
12/31/23 |
$16,348 |
$16,056 |
$16,170 |
03/31/24 |
$16,560 |
$16,784 |
$17,007 |
06/30/24 |
$16,753 |
$16,970 |
$17,157 |
09/30/24 |
$18,096 |
$18,338 |
$18,380 |
12/31/24 |
$17,020 |
$16,944 |
$16,948 |
03/31/25 |
$17,131 |
$17,831 |
$17,195 |
06/30/25 |
$20,012 |
$19,977 |
$19,673 |
09/30/25 |
$21,203 |
$21,354 |
$20,803 |
12/31/25 |
$20,563 |
$22,432 |
$21,310 |
|
| Average Annual Return [Table Text Block] |
Class/Index Name |
1 Year |
5 Years |
10 Years |
Retail |
20.81% |
1.43% |
7.48% |
MSCI ACWI ex USA Index |
32.39% |
7.91% |
8.41% |
MSCI ACWI ex USA IMI Growth Index |
25.74% |
4.03% |
7.86% | |
| No Deduction of Taxes [Text Block] |
The performance data does not reflect the deduction of taxes that a shareholder would pay on Fund distributions or redemption of Fund shares
|
| AssetsNet |
$ 326,915,202
|
| Holdings Count | Holding |
90
|
| Advisory Fees Paid, Amount |
$ 2,853,377
|
| InvestmentCompanyPortfolioTurnover |
31.00%
|
| Additional Fund Statistics [Text Block] |
Total Net Assets |
$326,915,202 |
# of Issuers |
90 |
Portfolio Turnover Rate |
31% |
Total Advisory Fees Paid (Net of fees waived) |
$2,853,377 | |
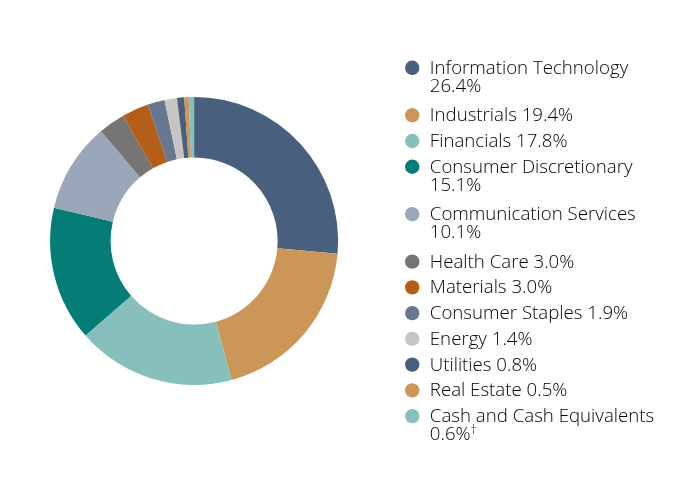
| Holdings [Text Block] |
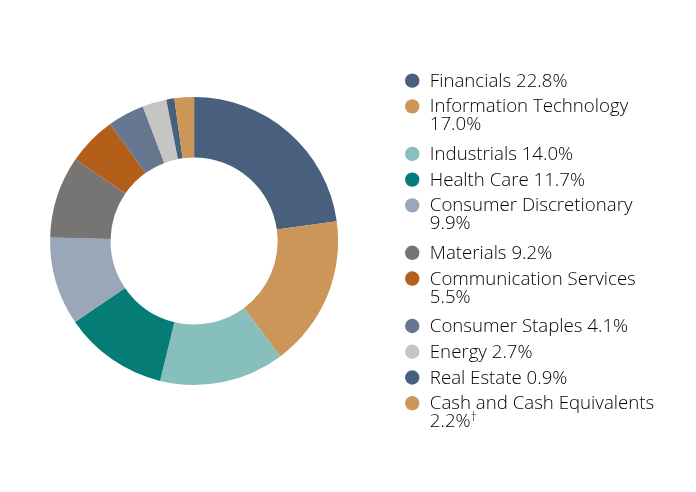
Sector Breakdown(as a % of net assets)*
Value |
Value |
Financials |
22.8% |
Information Technology |
17.0% |
Industrials |
14.0% |
Health Care |
11.7% |
Consumer Discretionary |
9.9% |
Materials |
9.2% |
Communication Services |
5.5% |
Consumer Staples |
4.1% |
Energy |
2.7% |
Real Estate |
0.9% |
Cash and Cash Equivalents |
2.2%Footnote Reference† |
| Footnote |
Description |
Footnote† |
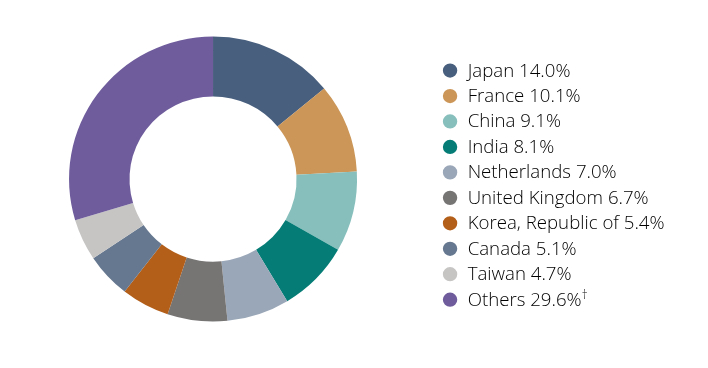
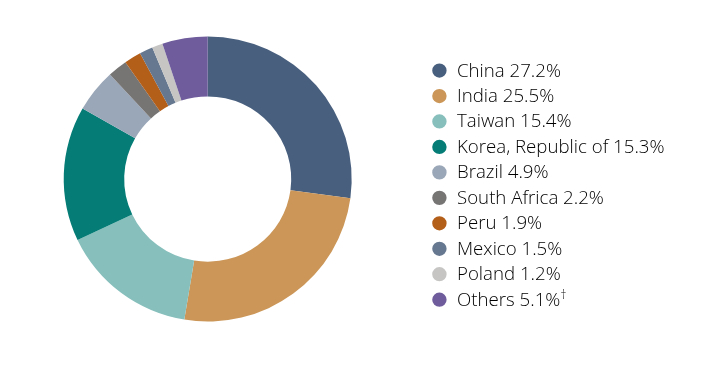
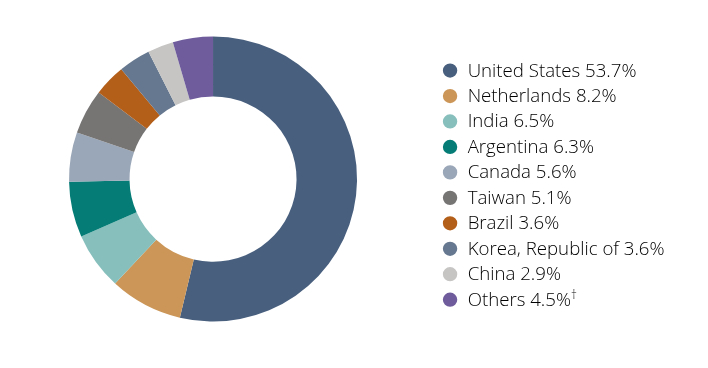
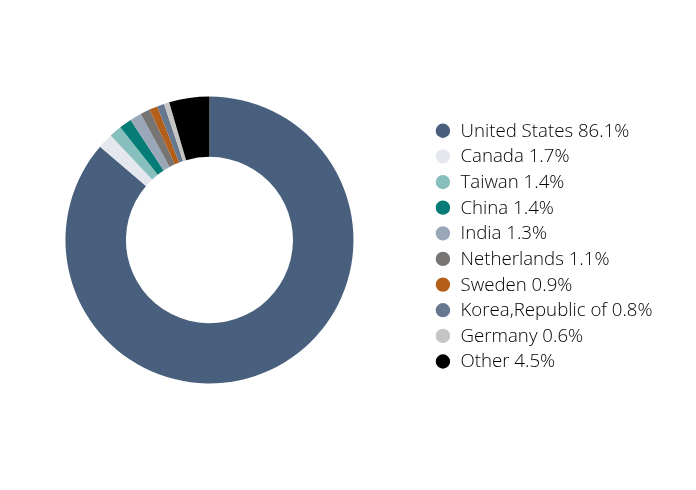
Includes other assets and liabilities-net. | Country Exposures(as a % of net assets)*
Value |
Value |
Japan |
14.0% |
France |
10.1% |
China |
9.1% |
India |
8.1% |
Netherlands |
7.0% |
United Kingdom |
6.7% |
Korea, Republic of |
5.4% |
Canada |
5.1% |
Taiwan |
4.7% |
Others |
29.6%Footnote Reference† |
| Footnote |
Description |
Footnote† |
Includes other assets and liabilities-net. | |
| Largest Holdings [Text Block] |
Holding |
% of Net Assets (12/31/25)* |
Taiwan Semiconductor Manufacturing Co., Ltd. |
4.4% |
argenx SE |
3.4% |
BNP Paribas S.A. |
2.7% |
Lundin Mining Corp. |
2.7% |
Bank of Ireland Group PLC |
2.5% |
Deutsche Bank AG |
2.4% |
Sumitomo Mitsui Financial Group, Inc. |
2.2% |
Arch Capital Group Ltd. |
2.1% |
AstraZeneca PLC |
2.1% |
Mitsubishi UFJ Financial Group, Inc. |
2.1% |
Total |
26.4% | * Individual weights may not sum to 100% (or displayed total) due to rounding. |
| Material Fund Change [Text Block] |
|
| Updated Prospectus Phone Number |
1.800.99.BARON
|
| Updated Prospectus Web Address |
BaronCapitalGroup.com
|
| C000077807 |
|
| Shareholder Report [Line Items] |
|
| Fund Name |
Baron International Growth Fund
|
| Class Name |
Institutional
|
| Trading Symbol |
BINIX
|
| Annual or Semi-Annual Statement [Text Block] |
This annual shareholder report contains important information about Baron International Growth Fund (the Fund) for the period of January 1, 2025 to December 31, 2025.
|
| Additional Information [Text Block] |
You can find additional information about the Fund at BaronCapitalGroup.com. You can also request this information by contacting us at 1.800.99.BARON.
|
| Additional Information Phone Number |
1.800.99.BARON
|
| Additional Information Email |
<span style="box-sizing: border-box; color: rgb(0, 0, 0); display: inline; flex-wrap: nowrap; font-size: 10.6667px; font-weight: 400; grid-area: auto; line-height: 16px; margin: 0px; overflow: visible; text-align: left; text-align-last: auto; white-space-collapse: preserve-breaks;">info@BaronCapitalGroup.com</span>
|
| Additional Information Website |
BaronCapitalGroup.com
|
| Expenses [Text Block] |
What were the Fund costs for the the past 12 months?(based on a hypothetical $10,000 investment)
Class Name |
Cost of a $10,000 investment |
Costs paid as a percentage of a $10,000 investment |
Institutional |
$106 |
0.96% | |
| Expenses Paid, Amount |
$ 106
|
| Expense Ratio, Percent |
0.96%
|
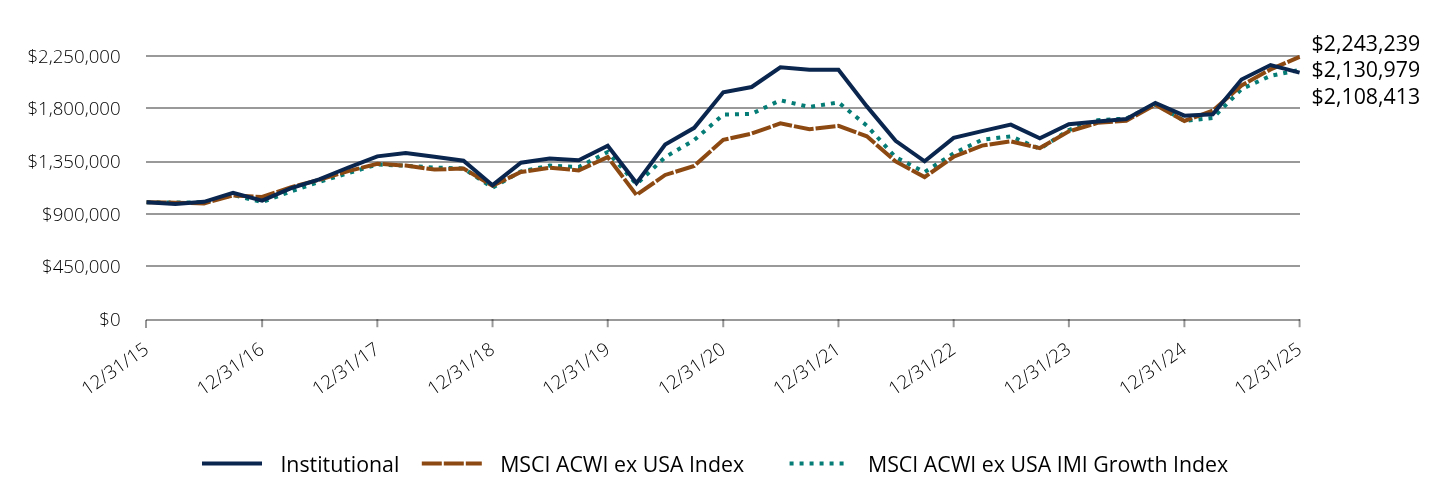
| Factors Affecting Performance [Text Block] |
How did the Fund perform last year and what affected its performance?International and emerging market (EM) equities significantly outperformed their U.S. and global counterparts for first time in several years. The year was marked by a largely unexpected U.S. withdrawal from the decades-long multilateral security and trade equilibrium, which triggered a variety of defensive policy responses around the world. When the U.S. subsequently negotiated new bilateral trade agreements, or relented, and materially diluted tariff and other protectionist measures, the monetary, fiscal and reform stimulus already in the pipeline led to solid global economic growth, ultimately resulting in a much more constructive backdrop for EM and international equities. The Fund failed to keep pace with the Index in what proved to be a difficult year for quality growth investors. Performance was held back by disappointing stock selection in developed (Spain, Israel, Japan, and the U.K.) and emerging (Poland, China, and India) markets. |
| Performance Past Does Not Indicate Future [Text] |
Past performance is not predictive of future performance
|
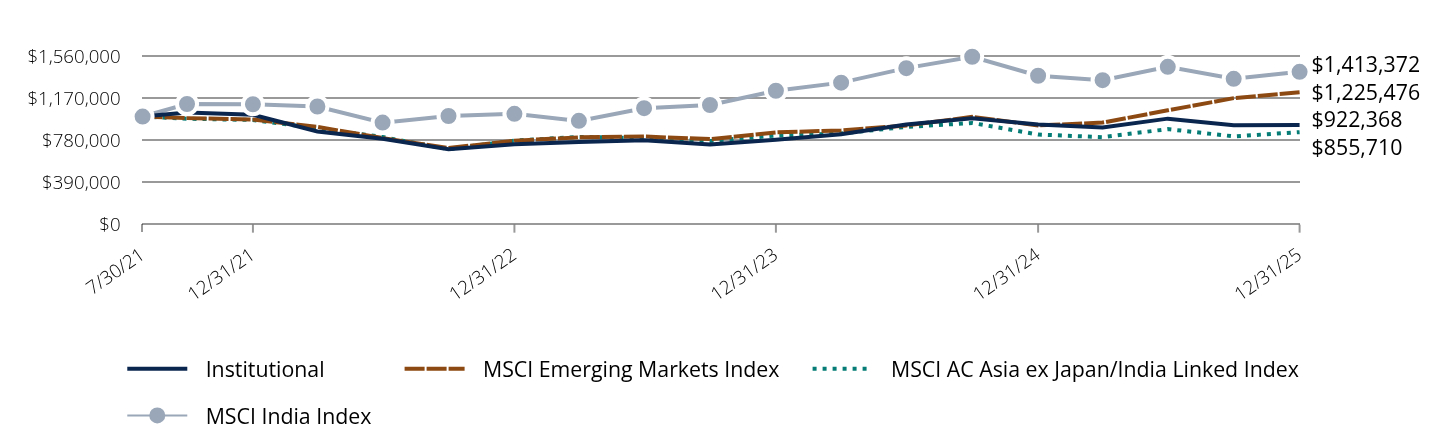
| Line Graph [Table Text Block] |
|
Institutional |
MSCI ACWI ex USA Index |
MSCI ACWI ex USA IMI Growth Index |
12/31/15 |
$1,000,000 |
$1,000,000 |
$1,000,000 |
03/31/16 |
$984,590 |
$996,239 |
$996,776 |
06/30/16 |
$1,003,852 |
$989,824 |
$999,886 |
09/30/16 |
$1,080,903 |
$1,058,238 |
$1,061,828 |
12/31/16 |
$1,013,548 |
$1,044,964 |
$1,000,571 |
03/31/17 |
$1,117,958 |
$1,127,095 |
$1,091,719 |
06/30/17 |
$1,195,154 |
$1,192,246 |
$1,173,357 |
09/30/17 |
$1,296,872 |
$1,265,749 |
$1,248,690 |
12/31/17 |
$1,391,923 |
$1,329,075 |
$1,323,214 |
03/31/18 |
$1,420,119 |
$1,313,368 |
$1,312,058 |
06/30/18 |
$1,389,622 |
$1,279,022 |
$1,295,776 |
09/30/18 |
$1,354,505 |
$1,288,037 |
$1,288,948 |
12/31/18 |
$1,145,819 |
$1,140,424 |
$1,125,301 |
03/31/19 |
$1,337,679 |
$1,258,006 |
$1,262,708 |
06/30/19 |
$1,373,319 |
$1,295,504 |
$1,313,409 |
09/30/19 |
$1,359,191 |
$1,272,219 |
$1,301,407 |
12/31/19 |
$1,482,557 |
$1,385,764 |
$1,428,847 |
03/31/20 |
$1,163,760 |
$1,062,109 |
$1,153,461 |
06/30/20 |
$1,493,879 |
$1,233,284 |
$1,385,194 |
09/30/20 |
$1,636,059 |
$1,310,436 |
$1,531,152 |
12/31/20 |
$1,939,702 |
$1,533,378 |
$1,748,847 |
03/31/21 |
$1,985,047 |
$1,586,914 |
$1,755,542 |
06/30/21 |
$2,153,899 |
$1,673,801 |
$1,871,780 |
09/30/21 |
$2,131,780 |
$1,623,804 |
$1,814,488 |
12/31/21 |
$2,131,426 |
$1,653,338 |
$1,853,186 |
03/31/22 |
$1,819,388 |
$1,563,354 |
$1,654,550 |
06/30/22 |
$1,524,964 |
$1,348,764 |
$1,384,804 |
09/30/22 |
$1,349,442 |
$1,215,143 |
$1,257,772 |
12/31/22 |
$1,549,785 |
$1,388,751 |
$1,417,910 |
03/31/23 |
$1,607,846 |
$1,484,099 |
$1,533,872 |
06/30/23 |
$1,663,355 |
$1,520,270 |
$1,563,478 |
09/30/23 |
$1,547,233 |
$1,462,917 |
$1,456,846 |
12/31/23 |
$1,667,602 |
$1,605,608 |
$1,617,012 |
03/31/24 |
$1,690,068 |
$1,678,392 |
$1,700,705 |
06/30/24 |
$1,711,250 |
$1,696,975 |
$1,715,655 |
09/30/24 |
$1,849,332 |
$1,833,803 |
$1,838,008 |
12/31/24 |
$1,740,168 |
$1,694,431 |
$1,694,799 |
03/31/25 |
$1,752,487 |
$1,783,143 |
$1,719,507 |
06/30/25 |
$2,048,782 |
$1,997,677 |
$1,967,274 |
09/30/25 |
$2,172,617 |
$2,135,391 |
$2,080,316 |
12/31/25 |
$2,108,413 |
$2,243,239 |
$2,130,979 |
|
| Average Annual Return [Table Text Block] |
Class/Index Name |
1 Year |
5 Years |
10 Years |
Institutional |
21.16% |
1.68% |
7.74% |
MSCI ACWI ex USA Index |
32.39% |
7.91% |
8.41% |
MSCI ACWI ex USA IMI Growth Index |
25.74% |
4.03% |
7.86% | |
| No Deduction of Taxes [Text Block] |
The performance data does not reflect the deduction of taxes that a shareholder would pay on Fund distributions or redemption of Fund shares
|
| AssetsNet |
$ 326,915,202
|
| Holdings Count | Holding |
90
|
| Advisory Fees Paid, Amount |
$ 2,853,377
|
| InvestmentCompanyPortfolioTurnover |
31.00%
|
| Additional Fund Statistics [Text Block] |
Total Net Assets |
$326,915,202 |
# of Issuers |
90 |
Portfolio Turnover Rate |
31% |
Total Advisory Fees Paid (Net of fees waived) |
$2,853,377 | |
| Holdings [Text Block] |
Sector Breakdown(as a % of net assets)*
Value |
Value |
Financials |
22.8% |
Information Technology |
17.0% |
Industrials |
14.0% |
Health Care |
11.7% |
Consumer Discretionary |
9.9% |
Materials |
9.2% |
Communication Services |
5.5% |
Consumer Staples |
4.1% |
Energy |
2.7% |
Real Estate |
0.9% |
Cash and Cash Equivalents |
2.2%Footnote Reference† |
| Footnote |
Description |
Footnote† |
Includes other assets and liabilities-net. | Country Exposures(as a % of net assets)*
Value |
Value |
Japan |
14.0% |
France |
10.1% |
China |
9.1% |
India |
8.1% |
Netherlands |
7.0% |
United Kingdom |
6.7% |
Korea, Republic of |
5.4% |
Canada |
5.1% |
Taiwan |
4.7% |
Others |
29.6%Footnote Reference† |
| Footnote |
Description |
Footnote† |
Includes other assets and liabilities-net. | |
| Largest Holdings [Text Block] |
Holding |
% of Net Assets (12/31/25)* |
Taiwan Semiconductor Manufacturing Co., Ltd. |
4.4% |
argenx SE |
3.4% |
BNP Paribas S.A. |
2.7% |
Lundin Mining Corp. |
2.7% |
Bank of Ireland Group PLC |
2.5% |
Deutsche Bank AG |
2.4% |
Sumitomo Mitsui Financial Group, Inc. |
2.2% |
Arch Capital Group Ltd. |
2.1% |
AstraZeneca PLC |
2.1% |
Mitsubishi UFJ Financial Group, Inc. |
2.1% |
Total |
26.4% | * Individual weights may not sum to 100% (or displayed total) due to rounding. |
| Material Fund Change [Text Block] |
|
| Updated Prospectus Phone Number |
1.800.99.BARON
|
| Updated Prospectus Web Address |
BaronCapitalGroup.com
|
| C000174762 |
|
| Shareholder Report [Line Items] |
|
| Fund Name |
Baron International Growth Fund
|
| Class Name |
R6
|
| Trading Symbol |
BIGUX
|
| Annual or Semi-Annual Statement [Text Block] |
This annual shareholder report contains important information about Baron International Growth Fund (the Fund) for the period of January 1, 2025 to December 31, 2025.
|
| Additional Information [Text Block] |
You can find additional information about the Fund at BaronCapitalGroup.com. You can also request this information by contacting us at 1.800.99.BARON.
|
| Additional Information Phone Number |
1.800.99.BARON
|
| Additional Information Email |
<span style="box-sizing: border-box; color: rgb(0, 0, 0); display: inline; flex-wrap: nowrap; font-size: 10.6667px; font-weight: 400; grid-area: auto; line-height: 16px; margin: 0px; overflow: visible; text-align: left; text-align-last: auto; white-space-collapse: preserve-breaks;">info@BaronCapitalGroup.com</span>
|
| Additional Information Website |
BaronCapitalGroup.com
|
| Expenses [Text Block] |
What were the Fund costs for the the past 12 months?(based on a hypothetical $10,000 investment)
Class Name |
Cost of a $10,000 investment |
Costs paid as a percentage of a $10,000 investment |
R6 |
$106 |
0.96% | |
| Expenses Paid, Amount |
$ 106
|
| Expense Ratio, Percent |
0.96%
|
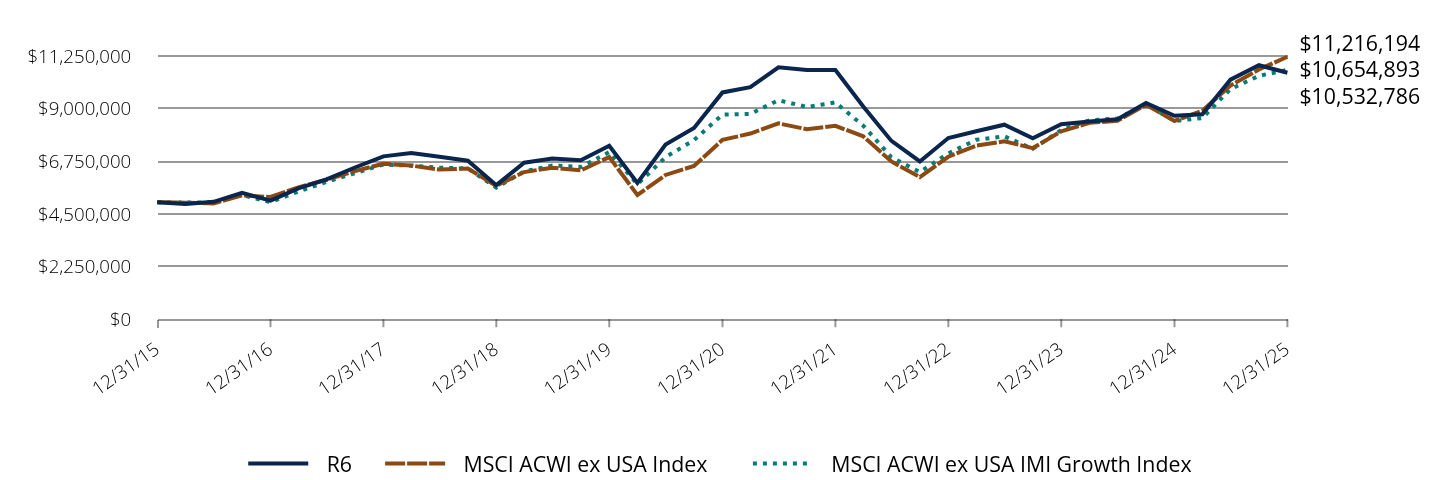
| Factors Affecting Performance [Text Block] |
How did the Fund perform last year and what affected its performance?International and emerging market (EM) equities significantly outperformed their U.S. and global counterparts for first time in several years. The year was marked by a largely unexpected U.S. withdrawal from the decades-long multilateral security and trade equilibrium, which triggered a variety of defensive policy responses around the world. When the U.S. subsequently negotiated new bilateral trade agreements, or relented, and materially diluted tariff and other protectionist measures, the monetary, fiscal and reform stimulus already in the pipeline led to solid global economic growth, ultimately resulting in a much more constructive backdrop for EM and international equities. The Fund failed to keep pace with the Index in what proved to be a difficult year for quality growth investors. Performance was held back by disappointing stock selection in developed (Spain, Israel, Japan, and the U.K.) and emerging (Poland, China, and India) markets. |
| Performance Past Does Not Indicate Future [Text] |
Past performance is not predictive of future performance
|
| Line Graph [Table Text Block] |
|
R6 |
MSCI ACWI ex USA Index |
MSCI ACWI ex USA IMI Growth Index |
12/31/15 |
$5,000,000 |
$5,000,000 |
$5,000,000 |
03/31/16 |
$4,922,950 |
$4,981,196 |
$4,983,880 |
06/30/16 |
$5,019,263 |
$4,949,118 |
$4,999,429 |
09/30/16 |
$5,404,513 |
$5,291,190 |
$5,309,139 |
12/31/16 |
$5,067,742 |
$5,224,822 |
$5,002,853 |
03/31/17 |
$5,589,789 |
$5,635,474 |
$5,458,596 |
06/30/17 |
$5,975,771 |
$5,961,230 |
$5,866,786 |
09/30/17 |
$6,484,358 |
$6,328,743 |
$6,243,450 |
12/31/17 |
$6,959,618 |
$6,645,374 |
$6,616,071 |
03/31/18 |
$7,100,594 |
$6,566,838 |
$6,560,292 |
06/30/18 |
$6,948,109 |
$6,395,111 |
$6,478,882 |
09/30/18 |
$6,772,510 |
$6,440,186 |
$6,444,739 |
12/31/18 |
$5,729,083 |
$5,702,118 |
$5,626,504 |
03/31/19 |
$6,688,385 |
$6,290,028 |
$6,313,542 |
06/30/19 |
$6,866,584 |
$6,477,518 |
$6,567,044 |
09/30/19 |
$6,795,945 |
$6,361,097 |
$6,507,033 |
12/31/19 |
$7,412,772 |
$6,928,820 |
$7,144,236 |
03/31/20 |
$5,821,767 |
$5,310,547 |
$5,767,307 |
06/30/20 |
$7,469,381 |
$6,166,418 |
$6,925,970 |
09/30/20 |
$8,174,319 |
$6,552,182 |
$7,655,758 |
12/31/20 |
$9,692,531 |
$7,666,888 |
$8,744,234 |
03/31/21 |
$9,919,257 |
$7,934,572 |
$8,777,711 |
06/30/21 |
$10,763,512 |
$8,369,006 |
$9,358,898 |
09/30/21 |
$10,652,921 |
$8,119,020 |
$9,072,441 |
12/31/21 |
$10,651,153 |
$8,266,689 |
$9,265,932 |
03/31/22 |
$9,094,059 |
$7,816,769 |
$8,272,751 |
06/30/22 |
$7,621,897 |
$6,743,819 |
$6,924,021 |
09/30/22 |
$6,744,263 |
$6,075,715 |
$6,288,862 |
12/31/22 |
$7,746,013 |
$6,943,753 |
$7,089,551 |
03/31/23 |
$8,033,139 |
$7,420,497 |
$7,669,358 |
06/30/23 |
$8,313,884 |
$7,601,349 |
$7,817,389 |
09/30/23 |
$7,733,252 |
$7,314,584 |
$7,284,231 |
12/31/23 |
$8,335,122 |
$8,028,040 |
$8,085,062 |
03/31/24 |
$8,447,456 |
$8,391,958 |
$8,503,524 |
06/30/24 |
$8,550,160 |
$8,484,874 |
$8,578,276 |
09/30/24 |
$9,240,595 |
$9,169,017 |
$9,190,039 |
12/31/24 |
$8,697,998 |
$8,472,153 |
$8,473,994 |
03/31/25 |
$8,759,593 |
$8,915,713 |
$8,597,535 |
06/30/25 |
$10,237,896 |
$9,988,386 |
$9,836,372 |
09/30/25 |
$10,857,098 |
$10,676,954 |
$10,401,581 |
12/31/25 |
$10,532,786 |
$11,216,194 |
$10,654,893 |
|
| Average Annual Return [Table Text Block] |
Class/Index Name |
1 Year |
5 Years |
10 Years |
R6 |
21.09% |
1.68% |
7.74% |
MSCI ACWI ex USA Index |
32.39% |
7.91% |
8.41% |
MSCI ACWI ex USA IMI Growth Index |
25.74% |
4.03% |
7.86% | |
| No Deduction of Taxes [Text Block] |
The performance data does not reflect the deduction of taxes that a shareholder would pay on Fund distributions or redemption of Fund shares
|
| AssetsNet |
$ 326,915,202
|
| Holdings Count | Holding |
90
|
| Advisory Fees Paid, Amount |
$ 2,853,377
|
| InvestmentCompanyPortfolioTurnover |
31.00%
|
| Additional Fund Statistics [Text Block] |
Total Net Assets |
$326,915,202 |
# of Issuers |
90 |
Portfolio Turnover Rate |
31% |
Total Advisory Fees Paid (Net of fees waived) |
$2,853,377 | |
| Holdings [Text Block] |
Sector Breakdown(as a % of net assets)*
Value |
Value |
Financials |
22.8% |
Information Technology |
17.0% |
Industrials |
14.0% |
Health Care |
11.7% |
Consumer Discretionary |
9.9% |
Materials |
9.2% |
Communication Services |
5.5% |
Consumer Staples |
4.1% |
Energy |
2.7% |
Real Estate |
0.9% |
Cash and Cash Equivalents |
2.2%Footnote Reference† |
| Footnote |
Description |
Footnote† |
Includes other assets and liabilities-net. | Country Exposures(as a % of net assets)*
Value |
Value |
Japan |
14.0% |
France |
10.1% |
China |
9.1% |
India |
8.1% |
Netherlands |
7.0% |
United Kingdom |
6.7% |
Korea, Republic of |
5.4% |
Canada |
5.1% |
Taiwan |
4.7% |
Others |
29.6%Footnote Reference† |
| Footnote |
Description |
Footnote† |
Includes other assets and liabilities-net. | |
| Largest Holdings [Text Block] |
Holding |
% of Net Assets (12/31/25)* |
Taiwan Semiconductor Manufacturing Co., Ltd. |
4.4% |
argenx SE |
3.4% |
BNP Paribas S.A. |
2.7% |
Lundin Mining Corp. |
2.7% |
Bank of Ireland Group PLC |
2.5% |
Deutsche Bank AG |
2.4% |
Sumitomo Mitsui Financial Group, Inc. |
2.2% |
Arch Capital Group Ltd. |
2.1% |
AstraZeneca PLC |
2.1% |
Mitsubishi UFJ Financial Group, Inc. |
2.1% |
Total |
26.4% | * Individual weights may not sum to 100% (or displayed total) due to rounding. |
| Material Fund Change [Text Block] |
|
| Updated Prospectus Phone Number |
1.800.99.BARON
|
| Updated Prospectus Web Address |
BaronCapitalGroup.com
|
| C000082256 |
|
| Shareholder Report [Line Items] |
|
| Fund Name |
Baron Real Estate Fund
|
| Class Name |
Retail
|
| Trading Symbol |
BREFX
|
| Annual or Semi-Annual Statement [Text Block] |
This annual shareholder report contains important information about Baron Real Estate Fund (the Fund) for the period of January 1, 2025 to December 31, 2025.
|
| Additional Information [Text Block] |
You can find additional information about the Fund at BaronCapitalGroup.com. You can also request this information by contacting us at 1.800.99.BARON.
|
| Additional Information Phone Number |
1.800.99.BARON
|
| Additional Information Email |
<span style="box-sizing: border-box; color: rgb(0, 0, 0); display: inline; flex-wrap: nowrap; font-size: 10.6667px; font-weight: 400; grid-area: auto; line-height: 16px; margin: 0px; overflow: visible; text-align: left; text-align-last: auto; white-space-collapse: preserve-breaks;">info@BaronCapitalGroup.com</span>
|
| Additional Information Website |
BaronCapitalGroup.com
|
| Expenses [Text Block] |
What were the Fund costs for the the past 12 months?(based on a hypothetical $10,000 investment)
Class Name |
Cost of a $10,000 investment |
Costs paid as a percentage of a $10,000 investment |
Retail |
$135 |
1.32% | |
| Expenses Paid, Amount |
$ 135
|
| Expense Ratio, Percent |
1.32%
|
| Factors Affecting Performance [Text Block] |
How did the Fund perform last year and what affected its performance?Real Estate trailed the broader U.S. equity market in 2025, as growth-oriented stocks, particularly those at the forefront of the AI boom, led the way. The Fund performed similarly to the Index during the year yet outperformed the MSCI US REIT Index, which was up 1.68%. The Fund failed to distance itself from the Index because solid stock selection in casinos & gaming (Wynn and Red Rock), homebuilders & land developers (Toll Brothers, Installed Building Products, and Champion Homes), and real estate services (Jones Lang LaSalle and CBRE) was mostly offset stock-specific weakness in REITs (Equinix, Vornado, Kilroy, Digital Realty, and Independence Realty Trust) and hotels & leisure (Expedia and Hyatt). |
| Performance Past Does Not Indicate Future [Text] |
Past performance is not predictive of future performance
|
| Line Graph [Table Text Block] |
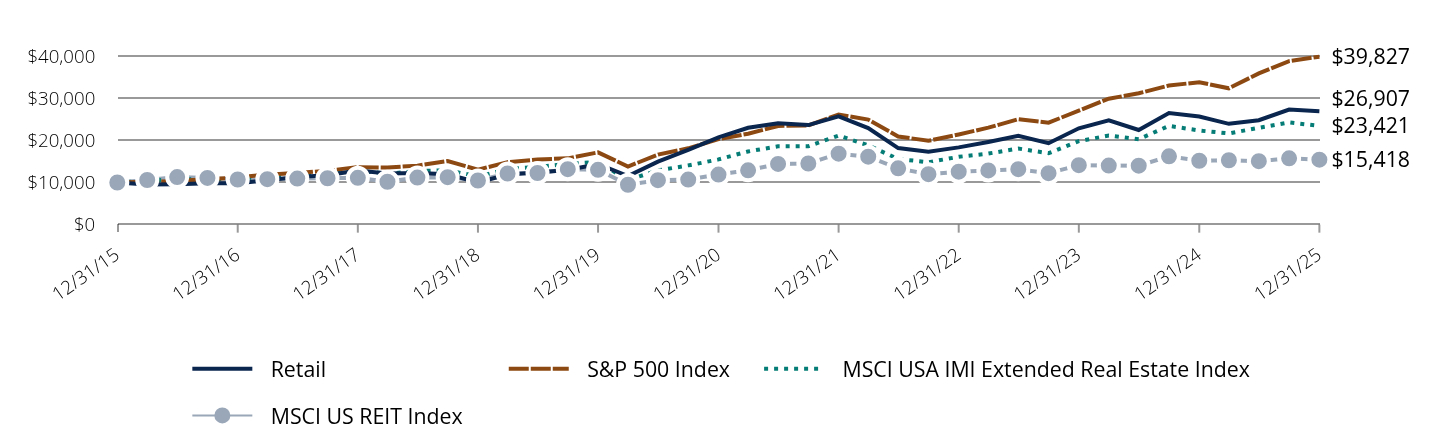
|
Retail |
S&P 500 Index |
MSCI USA IMI Extended Real Estate Index |
MSCI US REIT Index |
12/31/15 |
$10,000 |
$10,000 |
$10,000 |
$10,000 |
03/31/16 |
$9,542 |
$10,135 |
$10,414 |
$10,587 |
06/30/16 |
$9,592 |
$10,384 |
$10,792 |
$11,276 |
09/30/16 |
$9,798 |
$10,784 |
$10,803 |
$11,077 |
12/31/16 |
$9,799 |
$11,196 |
$10,824 |
$10,714 |
03/31/17 |
$10,549 |
$11,875 |
$11,444 |
$10,787 |
06/30/17 |
$11,331 |
$12,242 |
$11,808 |
$10,932 |
09/30/17 |
$11,716 |
$12,790 |
$12,071 |
$11,001 |
12/31/17 |
$12,841 |
$13,640 |
$12,777 |
$11,115 |
03/31/18 |
$12,142 |
$13,537 |
$12,102 |
$10,182 |
06/30/18 |
$12,281 |
$14,002 |
$12,685 |
$11,174 |
09/30/18 |
$11,932 |
$15,081 |
$12,928 |
$11,261 |
12/31/18 |
$9,988 |
$13,042 |
$11,407 |
$10,467 |
03/31/19 |
$11,887 |
$14,822 |
$13,206 |
$12,134 |
06/30/19 |
$12,382 |
$15,460 |
$13,678 |
$12,254 |
09/30/19 |
$12,976 |
$15,723 |
$14,432 |
$13,158 |
12/31/19 |
$14,393 |
$17,149 |
$14,853 |
$13,014 |
03/31/20 |
$11,523 |
$13,788 |
$10,577 |
$9,469 |
06/30/20 |
$14,959 |
$16,620 |
$12,878 |
$10,548 |
09/30/20 |
$17,742 |
$18,105 |
$14,026 |
$10,689 |
12/31/20 |
$20,704 |
$20,304 |
$15,478 |
$11,881 |
03/31/21 |
$22,986 |
$21,558 |
$17,366 |
$12,891 |
06/30/21 |
$24,039 |
$23,401 |
$18,580 |
$14,405 |
09/30/21 |
$23,624 |
$23,537 |
$18,599 |
$14,512 |
12/31/21 |
$25,680 |
$26,132 |
$21,136 |
$16,837 |
03/31/22 |
$22,910 |
$24,931 |
$18,803 |
$16,116 |
06/30/22 |
$18,169 |
$20,916 |
$15,585 |
$13,350 |
09/30/22 |
$17,279 |
$19,895 |
$14,807 |
$11,979 |
12/31/22 |
$18,332 |
$21,399 |
$16,097 |
$12,566 |
03/31/23 |
$19,615 |
$23,004 |
$16,858 |
$12,866 |
06/30/23 |
$21,050 |
$25,015 |
$18,046 |
$13,166 |
09/30/23 |
$19,319 |
$24,196 |
$16,949 |
$12,203 |
12/31/23 |
$22,860 |
$27,025 |
$19,813 |
$14,107 |
03/31/24 |
$24,743 |
$29,878 |
$21,118 |
$14,019 |
06/30/24 |
$22,452 |
$31,157 |
$20,267 |
$13,989 |
09/30/24 |
$26,454 |
$32,992 |
$23,430 |
$16,198 |
12/31/24 |
$25,646 |
$33,786 |
$22,330 |
$15,163 |
03/31/25 |
$23,912 |
$32,343 |
$21,636 |
$15,278 |
06/30/25 |
$24,763 |
$35,882 |
$22,962 |
$15,055 |
09/30/25 |
$27,288 |
$38,797 |
$24,258 |
$15,731 |
12/31/25 |
$26,907 |
$39,827 |
$23,421 |
$15,418 |
|
| Average Annual Return [Table Text Block] |
Class/Index Name |
1 Year |
5 Years |
10 Years |
Retail |
4.92% |
5.38% |
10.40% |
MSCI USA IMI Extended Real Estate Index |
4.88% |
8.64% |
8.88% |
MSCI US REIT Index |
1.67% |
5.35% |
4.42% |
S&P 500 Index |
17.88% |
14.42% |
14.82% | |
| No Deduction of Taxes [Text Block] |
The performance data does not reflect the deduction of taxes that a shareholder would pay on Fund distributions or redemption of Fund shares
|
| AssetsNet |
$ 2,327,571,791
|
| Holdings Count | Holding |
41
|
| Advisory Fees Paid, Amount |
$ 22,155,893
|
| InvestmentCompanyPortfolioTurnover |
70.00%
|
| Additional Fund Statistics [Text Block] |
Total Net Assets |
$2,327,571,791 |
# of Issuers |
41 |
Portfolio Turnover Rate |
70% |
Total Advisory Fees Paid |
$22,155,893 | |
| Holdings [Text Block] |
Sector Breakdown(as a % of net assets)*
Value |
Value |
Real Estate |
40.7% |
Consumer Discretionary |
27.5% |
Financials |
12.8% |
Materials |
8.9% |
Industrials |
7.1% |
Information Technology |
1.5% |
Cash and Cash Equivalents |
1.6%Footnote Reference† |
| Footnote |
Description |
Footnote† |
Includes other assets and liabilities-net. | |
| Largest Holdings [Text Block] |
Holding |
% of Net Assets (12/31/25)* |
Jones Lang LaSalle, Inc. |
7.4% |
Welltower, Inc. |
5.8% |
Brookfield Corp. |
5.6% |
CBRE Group, Inc. |
5.5% |
Toll Brothers, Inc. |
4.7% |
Prologis, Inc. |
4.2% |
CRH PLC |
4.0% |
Wynn Resorts Ltd. |
3.4% |
Hyatt Hotels Corp. |
3.0% |
CoStar Group, Inc. |
2.9% |
Total |
46.5% | * Individual weights may not sum to 100% (or displayed total) due to rounding. |
| Material Fund Change [Text Block] |
|
| Updated Prospectus Phone Number |
1.800.99.BARON
|
| Updated Prospectus Web Address |
BaronCapitalGroup.com
|
| C000082257 |
|
| Shareholder Report [Line Items] |
|
| Fund Name |
Baron Real Estate Fund
|
| Class Name |
Institutional
|
| Trading Symbol |
BREIX
|
| Annual or Semi-Annual Statement [Text Block] |
This annual shareholder report contains important information about Baron Real Estate Fund (the Fund) for the period of January 1, 2025 to December 31, 2025.
|
| Additional Information [Text Block] |
You can find additional information about the Fund at BaronCapitalGroup.com. You can also request this information by contacting us at 1.800.99.BARON.
|
| Additional Information Phone Number |
1.800.99.BARON
|
| Additional Information Email |
<span style="box-sizing: border-box; color: rgb(0, 0, 0); display: inline; flex-wrap: nowrap; font-size: 10.6667px; font-weight: 400; grid-area: auto; line-height: 16px; margin: 0px; overflow: visible; text-align: left; text-align-last: auto; white-space-collapse: preserve-breaks;">info@BaronCapitalGroup.com</span>
|
| Additional Information Website |
BaronCapitalGroup.com
|
| Expenses [Text Block] |
What were the Fund costs for the the past 12 months?(based on a hypothetical $10,000 investment)
Class Name |
Cost of a $10,000 investment |
Costs paid as a percentage of a $10,000 investment |
Institutional |
$108 |
1.05% | |
| Expenses Paid, Amount |
$ 108
|
| Expense Ratio, Percent |
1.05%
|
| Factors Affecting Performance [Text Block] |
How did the Fund perform last year and what affected its performance?Real Estate trailed the broader U.S. equity market in 2025, as growth-oriented stocks, particularly those at the forefront of the AI boom, led the way. The Fund performed similarly to the Index during the year yet outperformed the MSCI US REIT Index, which was up 1.68%. The Fund failed to distance itself from the Index because solid stock selection in casinos & gaming (Wynn and Red Rock), homebuilders & land developers (Toll Brothers, Installed Building Products, and Champion Homes), and real estate services (Jones Lang LaSalle and CBRE) was mostly offset stock-specific weakness in REITs (Equinix, Vornado, Kilroy, Digital Realty, and Independence Realty Trust) and hotels & leisure (Expedia and Hyatt). |
| Performance Past Does Not Indicate Future [Text] |
Past performance is not predictive of future performance
|
| Line Graph [Table Text Block] |
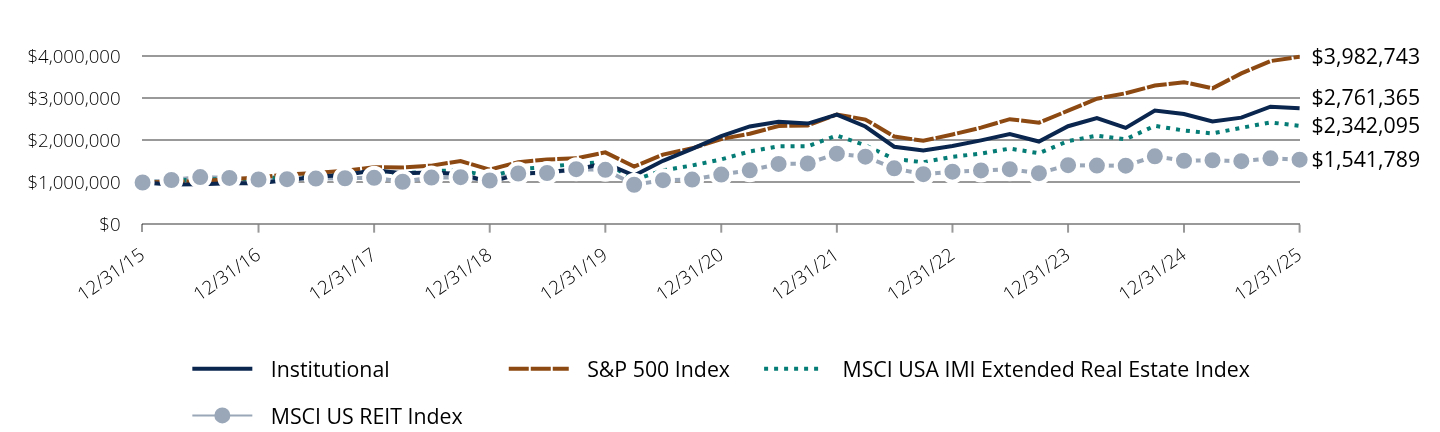
|
Institutional |
S&P 500 Index |
MSCI USA IMI Extended Real Estate Index |
MSCI US REIT Index |
12/31/15 |
$1,000,000 |
$1,000,000 |
$1,000,000 |
$999,999 |
03/31/16 |
$954,712 |
$1,013,479 |
$1,041,423 |
$1,058,712 |
06/30/16 |
$960,424 |
$1,038,364 |
$1,079,243 |
$1,127,604 |
09/30/16 |
$981,640 |
$1,078,360 |
$1,080,300 |
$1,107,711 |
12/31/16 |
$982,491 |
$1,119,599 |
$1,082,437 |
$1,071,352 |
03/31/17 |
$1,058,446 |
$1,187,516 |
$1,144,367 |
$1,078,683 |
06/30/17 |
$1,137,275 |
$1,224,189 |
$1,180,752 |
$1,093,187 |
09/30/17 |
$1,177,101 |
$1,279,038 |
$1,207,063 |
$1,100,052 |
12/31/17 |
$1,291,164 |
$1,364,026 |
$1,277,690 |
$1,111,459 |
03/31/18 |
$1,221,464 |
$1,353,671 |
$1,210,234 |
$1,018,244 |
06/30/18 |
$1,236,093 |
$1,400,154 |
$1,268,546 |
$1,117,431 |
09/30/18 |
$1,202,000 |
$1,508,117 |
$1,292,775 |
$1,126,134 |
12/31/18 |
$1,006,623 |
$1,304,223 |
$1,140,659 |
$1,046,689 |
03/31/19 |
$1,198,883 |
$1,482,222 |
$1,320,627 |
$1,213,356 |
06/30/19 |
$1,249,452 |
$1,546,015 |
$1,367,782 |
$1,225,393 |
09/30/19 |
$1,310,276 |
$1,572,271 |
$1,443,248 |
$1,315,798 |
12/31/19 |
$1,454,008 |
$1,714,876 |
$1,485,300 |
$1,301,366 |
03/31/20 |
$1,165,168 |
$1,378,794 |
$1,057,670 |
$946,918 |
06/30/20 |
$1,513,956 |
$1,662,045 |
$1,287,823 |
$1,054,761 |
09/30/20 |
$1,796,308 |
$1,810,454 |
$1,402,617 |
$1,068,885 |
12/31/20 |
$2,097,842 |
$2,030,393 |
$1,547,827 |
$1,188,135 |
03/31/21 |
$2,330,224 |
$2,155,767 |
$1,736,606 |
$1,289,080 |
06/30/21 |
$2,438,552 |
$2,340,062 |
$1,857,970 |
$1,440,476 |
09/30/21 |
$2,398,037 |
$2,353,682 |
$1,859,897 |
$1,451,252 |
12/31/21 |
$2,608,822 |
$2,613,225 |
$2,113,550 |
$1,683,714 |
03/31/22 |
$2,328,134 |
$2,493,055 |
$1,880,345 |
$1,611,652 |
06/30/22 |
$1,848,126 |
$2,091,645 |
$1,558,506 |
$1,335,041 |
09/30/22 |
$1,758,326 |
$1,989,517 |
$1,480,703 |
$1,197,861 |
12/31/22 |
$1,866,848 |
$2,139,947 |
$1,609,684 |
$1,256,554 |
03/31/23 |
$1,998,755 |
$2,300,379 |
$1,685,834 |
$1,286,580 |
06/30/23 |
$2,146,908 |
$2,501,484 |
$1,804,551 |
$1,316,625 |
09/30/23 |
$1,971,152 |
$2,419,599 |
$1,694,850 |
$1,220,260 |
12/31/23 |
$2,334,302 |
$2,702,488 |
$1,981,320 |
$1,410,680 |
03/31/24 |
$2,527,575 |
$2,987,762 |
$2,111,796 |
$1,401,918 |
06/30/24 |
$2,295,125 |
$3,115,750 |
$2,026,676 |
$1,398,879 |
09/30/24 |
$2,705,741 |
$3,299,160 |
$2,342,965 |
$1,619,790 |
12/31/24 |
$2,625,204 |
$3,378,642 |
$2,233,046 |
$1,516,285 |
03/31/25 |
$2,449,535 |
$3,234,302 |
$2,163,575 |
$1,527,783 |
06/30/25 |
$2,538,025 |
$3,588,212 |
$2,296,170 |
$1,505,522 |
09/30/25 |
$2,798,245 |
$3,879,736 |
$2,425,816 |
$1,573,121 |
12/31/25 |
$2,761,365 |
$3,982,743 |
$2,342,095 |
$1,541,789 |
|
| Average Annual Return [Table Text Block] |
Class/Index Name |
1 Year |
5 Years |
10 Years |
Institutional |
5.19% |
5.65% |
10.69% |
MSCI USA IMI Extended Real Estate Index |
4.88% |
8.64% |
8.88% |
MSCI US REIT Index |
1.67% |
5.35% |
4.42% |
S&P 500 Index |
17.88% |
14.42% |
14.82% | |
| No Deduction of Taxes [Text Block] |
The performance data does not reflect the deduction of taxes that a shareholder would pay on Fund distributions or redemption of Fund shares
|
| AssetsNet |
$ 2,327,571,791
|
| Holdings Count | Holding |
41
|
| Advisory Fees Paid, Amount |
$ 22,155,893
|
| InvestmentCompanyPortfolioTurnover |
70.00%
|
| Additional Fund Statistics [Text Block] |
Total Net Assets |
$2,327,571,791 |
# of Issuers |
41 |
Portfolio Turnover Rate |
70% |
Total Advisory Fees Paid |
$22,155,893 | |
| Holdings [Text Block] |
Sector Breakdown(as a % of net assets)*
Value |
Value |
Real Estate |
40.7% |
Consumer Discretionary |
27.5% |
Financials |
12.8% |
Materials |
8.9% |
Industrials |
7.1% |
Information Technology |
1.5% |
Cash and Cash Equivalents |
1.6%Footnote Reference† |
| Footnote |
Description |
Footnote† |
Includes other assets and liabilities-net. | |
| Largest Holdings [Text Block] |
Holding |
% of Net Assets (12/31/25)* |
Jones Lang LaSalle, Inc. |
7.4% |
Welltower, Inc. |
5.8% |
Brookfield Corp. |
5.6% |
CBRE Group, Inc. |
5.5% |
Toll Brothers, Inc. |
4.7% |
Prologis, Inc. |
4.2% |
CRH PLC |
4.0% |
Wynn Resorts Ltd. |
3.4% |
Hyatt Hotels Corp. |
3.0% |
CoStar Group, Inc. |
2.9% |
Total |
46.5% | * Individual weights may not sum to 100% (or displayed total) due to rounding. |
| Material Fund Change [Text Block] |
|
| Updated Prospectus Phone Number |
1.800.99.BARON
|
| Updated Prospectus Web Address |
BaronCapitalGroup.com
|
| C000165214 |
|
| Shareholder Report [Line Items] |
|
| Fund Name |
Baron Real Estate Fund
|
| Class Name |
R6
|
| Trading Symbol |
BREUX
|
| Annual or Semi-Annual Statement [Text Block] |
This annual shareholder report contains important information about Baron Real Estate Fund (the Fund) for the period of January 1, 2025 to December 31, 2025.
|
| Additional Information [Text Block] |
You can find additional information about the Fund at BaronCapitalGroup.com. You can also request this information by contacting us at 1.800.99.BARON.
|
| Additional Information Phone Number |
1.800.99.BARON
|
| Additional Information Email |
<span style="box-sizing: border-box; color: rgb(0, 0, 0); display: inline; flex-wrap: nowrap; font-size: 10.6667px; font-weight: 400; grid-area: auto; line-height: 16px; margin: 0px; overflow: visible; text-align: left; text-align-last: auto; white-space-collapse: preserve-breaks;">info@BaronCapitalGroup.com</span>
|
| Additional Information Website |
BaronCapitalGroup.com
|
| Expenses [Text Block] |
What were the Fund costs for the the past 12 months?(based on a hypothetical $10,000 investment)
Class Name |
Cost of a $10,000 investment |
Costs paid as a percentage of a $10,000 investment |
R6 |
$108 |
1.05% | |
| Expenses Paid, Amount |
$ 108
|
| Expense Ratio, Percent |
1.05%
|
| Factors Affecting Performance [Text Block] |
How did the Fund perform last year and what affected its performance?Real Estate trailed the broader U.S. equity market in 2025, as growth-oriented stocks, particularly those at the forefront of the AI boom, led the way. The Fund performed similarly to the Index during the year yet outperformed the MSCI US REIT Index, which was up 1.68%. The Fund failed to distance itself from the Index because solid stock selection in casinos & gaming (Wynn and Red Rock), homebuilders & land developers (Toll Brothers, Installed Building Products, and Champion Homes), and real estate services (Jones Lang LaSalle and CBRE) was mostly offset stock-specific weakness in REITs (Equinix, Vornado, Kilroy, Digital Realty, and Independence Realty Trust) and hotels & leisure (Expedia and Hyatt). |
| Performance Past Does Not Indicate Future [Text] |
Past performance is not predictive of future performance
|
| Line Graph [Table Text Block] |
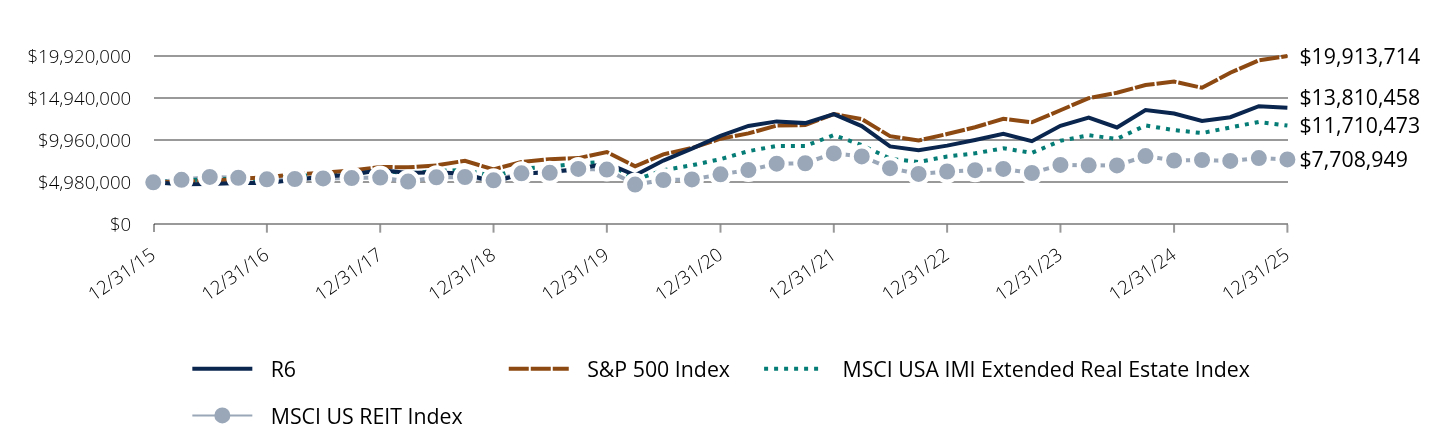
|
R6 |
S&P 500 Index |
MSCI USA IMI Extended Real Estate Index |
MSCI US REIT Index |
12/31/15 |
$5,000,000 |
$5,000,000 |
$5,000,000 |
$4,999,999 |
03/31/16 |
$4,773,562 |
$5,067,393 |
$5,207,117 |
$5,293,563 |
06/30/16 |
$4,802,122 |
$5,191,818 |
$5,396,216 |
$5,638,023 |
09/30/16 |
$4,910,241 |
$5,391,799 |
$5,401,501 |
$5,538,560 |
12/31/16 |
$4,912,953 |
$5,597,996 |
$5,412,185 |
$5,356,765 |
03/31/17 |
$5,292,767 |
$5,937,579 |
$5,721,836 |
$5,393,419 |
06/30/17 |
$5,686,953 |
$6,120,944 |
$5,903,758 |
$5,465,941 |
09/30/17 |
$5,886,099 |
$6,395,188 |
$6,035,314 |
$5,500,265 |
12/31/17 |
$6,456,474 |
$6,820,128 |
$6,388,452 |
$5,557,298 |
03/31/18 |
$6,107,940 |
$6,768,356 |
$6,051,169 |
$5,091,225 |
06/30/18 |
$6,183,241 |
$7,000,772 |
$6,342,732 |
$5,587,159 |
09/30/18 |
$6,011,039 |
$7,540,585 |
$6,463,877 |
$5,630,672 |
12/31/18 |
$5,033,982 |
$6,521,117 |
$5,703,293 |
$5,233,446 |
03/31/19 |
$5,995,449 |
$7,411,111 |
$6,603,133 |
$6,066,785 |
06/30/19 |
$6,248,341 |
$7,730,074 |
$6,838,908 |
$6,126,967 |
09/30/19 |
$6,552,971 |
$7,861,354 |
$7,216,239 |
$6,578,995 |
12/31/19 |
$7,274,527 |
$8,574,380 |
$7,426,500 |
$6,506,835 |
03/31/20 |
$5,827,253 |
$6,893,971 |
$5,288,352 |
$4,734,591 |
06/30/20 |
$7,571,613 |
$8,310,223 |
$6,439,115 |
$5,273,808 |
09/30/20 |
$8,983,946 |
$9,052,269 |
$7,013,085 |
$5,344,426 |
12/31/20 |
$10,492,020 |
$10,151,965 |
$7,739,135 |
$5,940,676 |
03/31/21 |
$11,654,240 |
$10,778,836 |
$8,683,032 |
$6,445,405 |
06/30/21 |
$12,196,026 |
$11,700,309 |
$9,289,851 |
$7,202,383 |
09/30/21 |
$11,993,393 |
$11,768,409 |
$9,299,487 |
$7,256,265 |
12/31/21 |
$13,047,778 |
$13,066,124 |
$10,567,751 |
$8,418,575 |
03/31/22 |
$11,643,943 |
$12,465,276 |
$9,401,724 |
$8,058,265 |
06/30/22 |
$9,243,228 |
$10,458,224 |
$7,792,532 |
$6,675,209 |
09/30/22 |
$8,794,103 |
$9,947,587 |
$7,403,515 |
$5,989,308 |
12/31/22 |
$9,336,865 |
$10,699,733 |
$8,048,422 |
$6,282,773 |
03/31/23 |
$9,996,588 |
$11,501,897 |
$8,429,170 |
$6,432,902 |
06/30/23 |
$10,737,558 |
$12,507,418 |
$9,022,753 |
$6,583,130 |
09/30/23 |
$9,858,704 |
$12,097,996 |
$8,474,252 |
$6,101,306 |
12/31/23 |
$11,674,780 |
$13,512,442 |
$9,906,601 |
$7,053,402 |
03/31/24 |
$12,641,419 |
$14,938,808 |
$10,558,980 |
$7,009,594 |
06/30/24 |
$11,478,840 |
$15,578,750 |
$10,133,378 |
$6,994,401 |
09/30/24 |
$13,532,500 |
$16,495,800 |
$11,714,824 |
$8,098,956 |
12/31/24 |
$13,129,540 |
$16,893,212 |
$11,165,229 |
$7,581,430 |
03/31/25 |
$12,247,681 |
$16,171,512 |
$10,817,877 |
$7,638,922 |
06/30/25 |
$12,693,528 |
$17,941,059 |
$11,480,849 |
$7,527,613 |
09/30/25 |
$13,995,041 |
$19,398,681 |
$12,129,082 |
$7,865,608 |
12/31/25 |
$13,810,458 |
$19,913,714 |
$11,710,473 |
$7,708,949 |
|
| Average Annual Return [Table Text Block] |
Class/Index Name |
1 Year |
5 Years |
10 Years |
R6 |
5.19% |
5.65% |
10.69% |
MSCI USA IMI Extended Real Estate Index |
4.88% |
8.64% |
8.88% |
MSCI US REIT Index |
1.67% |
5.35% |
4.42% |
S&P 500 Index |
17.88% |
14.42% |
14.82% | |
| No Deduction of Taxes [Text Block] |
The performance data does not reflect the deduction of taxes that a shareholder would pay on Fund distributions or redemption of Fund shares
|
| AssetsNet |
$ 2,327,571,791
|
| Holdings Count | Holding |
41
|
| Advisory Fees Paid, Amount |
$ 22,155,893
|
| InvestmentCompanyPortfolioTurnover |
70.00%
|
| Additional Fund Statistics [Text Block] |
Total Net Assets |
$2,327,571,791 |
# of Issuers |
41 |
Portfolio Turnover Rate |
70% |
Total Advisory Fees Paid |
$22,155,893 | |
| Holdings [Text Block] |
Sector Breakdown(as a % of net assets)*
Value |
Value |
Real Estate |
40.7% |
Consumer Discretionary |
27.5% |
Financials |
12.8% |
Materials |
8.9% |
Industrials |
7.1% |
Information Technology |
1.5% |
Cash and Cash Equivalents |
1.6%Footnote Reference† |
| Footnote |
Description |
Footnote† |
Includes other assets and liabilities-net. | |
| Largest Holdings [Text Block] |
Holding |
% of Net Assets (12/31/25)* |
Jones Lang LaSalle, Inc. |
7.4% |
Welltower, Inc. |
5.8% |
Brookfield Corp. |
5.6% |
CBRE Group, Inc. |
5.5% |
Toll Brothers, Inc. |
4.7% |
Prologis, Inc. |
4.2% |
CRH PLC |
4.0% |
Wynn Resorts Ltd. |
3.4% |
Hyatt Hotels Corp. |
3.0% |
CoStar Group, Inc. |
2.9% |
Total |
46.5% | * Individual weights may not sum to 100% (or displayed total) due to rounding. |
| Material Fund Change [Text Block] |
|
| Updated Prospectus Phone Number |
1.800.99.BARON
|
| Updated Prospectus Web Address |
BaronCapitalGroup.com
|
| C000095861 |
|
| Shareholder Report [Line Items] |
|
| Fund Name |
Baron Emerging Markets Fund
|
| Class Name |
Retail
|
| Trading Symbol |
BEXFX
|
| Annual or Semi-Annual Statement [Text Block] |
This annual shareholder report contains important information about Baron Emerging Markets Fund (the Fund) for the period of January 1, 2025 to December 31, 2025.
|
| Additional Information [Text Block] |
You can find additional information about the Fund at BaronCapitalGroup.com. You can also request this information by contacting us at 1.800.99.BARON.
|
| Additional Information Phone Number |
1.800.99.BARON
|
| Additional Information Email |
<span style="box-sizing: border-box; color: rgb(0, 0, 0); display: inline; flex-wrap: nowrap; font-size: 10.6667px; font-weight: 400; grid-area: auto; line-height: 16px; margin: 0px; overflow: visible; text-align: left; text-align-last: auto; white-space-collapse: preserve-breaks;">info@BaronCapitalGroup.com</span>
|
| Additional Information Website |
BaronCapitalGroup.com
|
| Expenses [Text Block] |
What were the Fund costs for the the past 12 months?(based on a hypothetical $10,000 investment)
Class Name |
Cost of a $10,000 investment |
Costs paid as a percentage of a $10,000 investment |
Retail |
$159 |
1.38% | |
| Expenses Paid, Amount |
$ 159
|
| Expense Ratio, Percent |
1.38%
|
| Factors Affecting Performance [Text Block] |
How did the Fund perform last year and what affected its performance?EM equities significantly outperformed their U.S. and global counterparts for first time in several years. Semiconductor-related strength in Taiwan and Korea contributed to EM’s excellent performance, overshadowing weakness in India, where equity markets were pressured by a temporary deceleration in economic growth and a related loss of earnings momentum. Poor stock selection in Poland, China, and India was largely responsible for the Fund’s relative shortfall. Meaningfully higher exposure to lagging Indian equities also proved costly. Somewhat offsetting the above was solid stock selection in Taiwan, higher exposure to strong performing Korean securities, and lack of exposure to lagging Saudi stocks. |
| Performance Past Does Not Indicate Future [Text] |
Past performance is not predictive of future performance
|
| Line Graph [Table Text Block] |
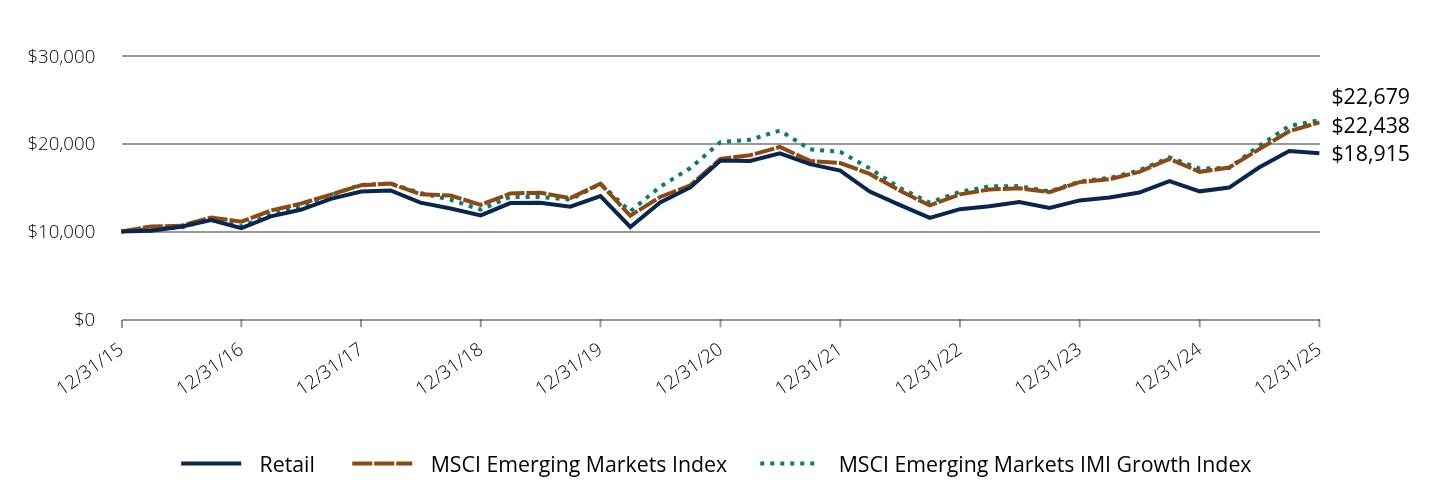
|
Retail |
MSCI Emerging Markets Index |
MSCI Emerging Markets IMI Growth Index |
12/31/15 |
$10,000 |
$10,000 |
$10,000 |
03/31/16 |
$10,076 |
$10,571 |
$10,297 |
06/30/16 |
$10,549 |
$10,641 |
$10,443 |
09/30/16 |
$11,315 |
$11,602 |
$11,420 |
12/31/16 |
$10,375 |
$11,119 |
$10,584 |
03/31/17 |
$11,721 |
$12,391 |
$11,913 |
06/30/17 |
$12,469 |
$13,168 |
$12,931 |
09/30/17 |
$13,724 |
$14,208 |
$14,158 |
12/31/17 |
$14,560 |
$15,264 |
$15,315 |
03/31/18 |
$14,674 |
$15,459 |
$15,467 |
06/30/18 |
$13,287 |
$14,248 |
$14,387 |
09/30/18 |
$12,623 |
$14,092 |
$13,614 |
12/31/18 |
$11,841 |
$13,040 |
$12,491 |
03/31/19 |
$13,239 |
$14,333 |
$13,928 |
06/30/19 |
$13,277 |
$14,420 |
$13,938 |
09/30/19 |
$12,823 |
$13,808 |
$13,633 |
12/31/19 |
$14,030 |
$15,443 |
$15,439 |
03/31/20 |
$10,513 |
$11,798 |
$12,298 |
06/30/20 |
$13,305 |
$13,932 |
$15,098 |
09/30/20 |
$15,021 |
$15,263 |
$17,227 |
12/31/20 |
$18,081 |
$18,270 |
$20,186 |
03/31/21 |
$18,042 |
$18,687 |
$20,448 |
06/30/21 |
$18,910 |
$19,630 |
$21,506 |
09/30/21 |
$17,680 |
$18,042 |
$19,363 |
12/31/21 |
$16,949 |
$17,805 |
$19,077 |
03/31/22 |
$14,549 |
$16,563 |
$17,196 |
06/30/22 |
$13,039 |
$14,667 |
$14,989 |
09/30/22 |
$11,558 |
$12,969 |
$13,288 |
12/31/22 |
$12,545 |
$14,228 |
$14,521 |
03/31/23 |
$12,865 |
$14,791 |
$15,140 |
06/30/23 |
$13,348 |
$14,923 |
$15,175 |
09/30/23 |
$12,681 |
$14,487 |
$14,570 |
12/31/23 |
$13,543 |
$15,626 |
$15,695 |
03/31/24 |
$13,863 |
$15,953 |
$16,104 |
06/30/24 |
$14,437 |
$16,796 |
$16,970 |
09/30/24 |
$15,737 |
$18,261 |
$18,438 |
12/31/24 |
$14,576 |
$16,799 |
$17,177 |
03/31/25 |
$15,006 |
$17,291 |
$17,241 |
06/30/25 |
$17,292 |
$19,363 |
$19,751 |
09/30/25 |
$19,170 |
$21,424 |
$22,019 |
12/31/25 |
$18,915 |
$22,438 |
$22,679 |
|
| Average Annual Return [Table Text Block] |
Class/Index Name |
1 Year |
5 Years |
10 Years |
Retail |
29.77% |
0.91% |
6.58% |
MSCI Emerging Markets Index |
33.57% |
4.20% |
8.42% |
MSCI Emerging Markets IMI Growth Index |
32.03% |
2.36% |
8.53% | |
| No Deduction of Taxes [Text Block] |
The performance data does not reflect the deduction of taxes that a shareholder would pay on Fund distributions or redemption of Fund shares
|
| AssetsNet |
$ 3,541,794,045
|
| Holdings Count | Holding |
88
|
| Advisory Fees Paid, Amount |
$ 36,571,671
|
| InvestmentCompanyPortfolioTurnover |
39.00%
|
| Additional Fund Statistics [Text Block] |
Total Net Assets |
$3,541,794,045 |
# of Issuers |
88 |
Portfolio Turnover Rate |
39% |
Total Advisory Fees Paid |
$36,571,671 | |
| Holdings [Text Block] |
Sector Breakdown(as a % of net assets)*
Value |
Value |
Information Technology |
26.4% |
Industrials |
19.4% |
Financials |
17.8% |
Consumer Discretionary |
15.1% |
Communication Services |
10.1% |
Health Care |
3.0% |
Materials |
3.0% |
Consumer Staples |
1.9% |
Energy |
1.4% |
Utilities |
0.8% |
Real Estate |
0.5% |
Cash and Cash Equivalents |
0.6%Footnote Reference† |
| Footnote |
Description |
Footnote† |
Includes other assets and liabilities-net. | Country Exposures(as a % of net assets)*
Value |
Value |
China |
27.2% |
India |
25.5% |
Taiwan |
15.4% |
Korea, Republic of |
15.3% |
Brazil |
4.9% |
South Africa |
2.2% |
Peru |
1.9% |
Mexico |
1.5% |
Poland |
1.2% |
Others |
5.1%Footnote Reference† |
| Footnote |
Description |
Footnote† |
Includes other assets and liabilities-net. | |
| Largest Holdings [Text Block] |
Holding |
% of Net Assets (12/31/25)* |
Taiwan Semiconductor Manufacturing Co., Ltd. |
11.7% |
Tencent Holdings Limited |
5.1% |
Alibaba Group Holding Limited |
3.9% |
Samsung Electronics Co., Ltd. |
3.4% |
Contemporary Amperex Technology Co. Ltd. |
2.4% |
HD Korea Shipbuilding & Offshore Engineering Co. Ltd. |
2.4% |
Bharti Airtel Ltd. |
2.4% |
Bajaj Finance Limited |
2.2% |
SK Hynix, Inc. |
2.0% |
Credicorp, Ltd. |
1.9% |
Total |
37.4% | * Individual weights may not sum to 100% (or displayed total) due to rounding. |
| Material Fund Change [Text Block] |
|
| Updated Prospectus Phone Number |
1.800.99.BARON
|
| Updated Prospectus Web Address |
BaronCapitalGroup.com
|
| C000095862 |
|
| Shareholder Report [Line Items] |
|
| Fund Name |
Baron Emerging Markets Fund
|
| Class Name |
Institutional
|
| Trading Symbol |
BEXIX
|
| Annual or Semi-Annual Statement [Text Block] |
This annual shareholder report contains important information about Baron Emerging Markets Fund (the Fund) for the period of January 1, 2025 to December 31, 2025.
|
| Additional Information [Text Block] |
You can find additional information about the Fund at BaronCapitalGroup.com. You can also request this information by contacting us at 1.800.99.BARON.
|
| Additional Information Phone Number |
1.800.99.BARON
|
| Additional Information Email |
<span style="box-sizing: border-box; color: rgb(0, 0, 0); display: inline; flex-wrap: nowrap; font-size: 10.6667px; font-weight: 400; grid-area: auto; line-height: 16px; margin: 0px; overflow: visible; text-align: left; text-align-last: auto; white-space-collapse: preserve-breaks;">info@BaronCapitalGroup.com</span>
|
| Additional Information Website |
BaronCapitalGroup.com
|
| Expenses [Text Block] |
What were the Fund costs for the the past 12 months?(based on a hypothetical $10,000 investment)
Class Name |
Cost of a $10,000 investment |
Costs paid as a percentage of a $10,000 investment |
Institutional |
$129 |
1.12% | |
| Expenses Paid, Amount |
$ 129
|
| Expense Ratio, Percent |
1.12%
|
| Factors Affecting Performance [Text Block] |
How did the Fund perform last year and what affected its performance?EM equities significantly outperformed their U.S. and global counterparts for first time in several years. Semiconductor-related strength in Taiwan and Korea contributed to EM’s excellent performance, overshadowing weakness in India, where equity markets were pressured by a temporary deceleration in economic growth and a related loss of earnings momentum. Poor stock selection in Poland, China, and India was largely responsible for the Fund’s relative shortfall. Meaningfully higher exposure to lagging Indian equities also proved costly. Somewhat offsetting the above was solid stock selection in Taiwan, higher exposure to strong performing Korean securities, and lack of exposure to lagging Saudi stocks. |
| Performance Past Does Not Indicate Future [Text] |
Past performance is not predictive of future performance
|
| Line Graph [Table Text Block] |
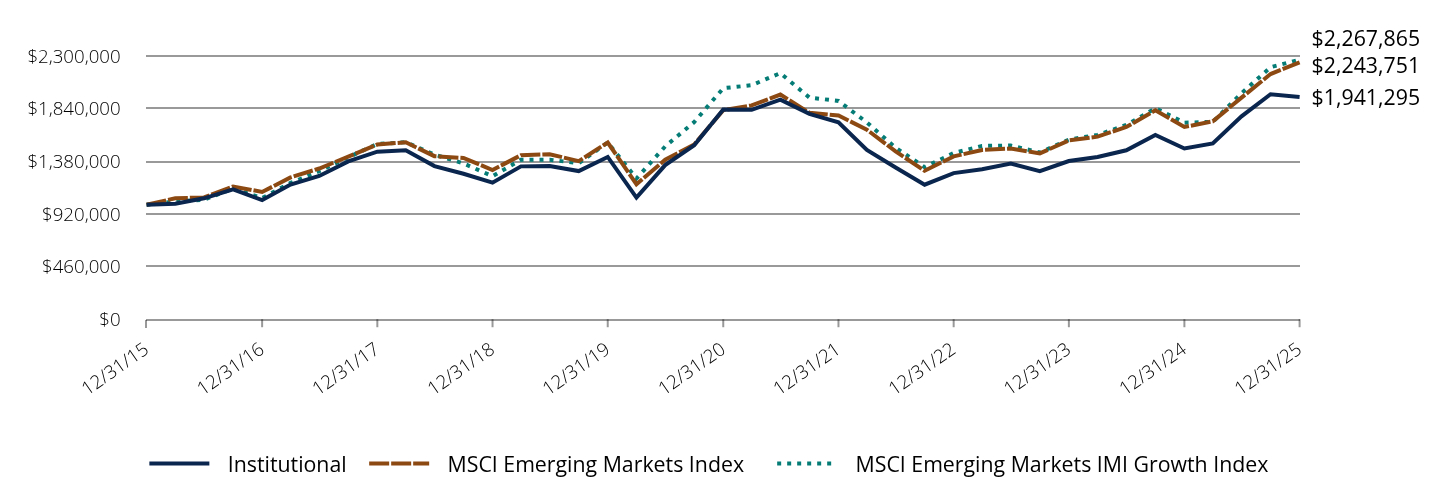
|
Institutional |
MSCI Emerging Markets Index |
MSCI Emerging Markets IMI Growth Index |
12/31/15 |
$1,000,000 |
$1,000,000 |
$1,000,000 |
03/31/16 |
$1,008,499 |
$1,057,136 |
$1,029,669 |
06/30/16 |
$1,056,657 |
$1,064,130 |
$1,044,273 |
09/30/16 |
$1,134,089 |
$1,160,184 |
$1,142,001 |
12/31/16 |
$1,040,762 |
$1,111,869 |
$1,058,357 |
03/31/17 |
$1,176,308 |
$1,239,122 |
$1,191,258 |
06/30/17 |
$1,252,137 |
$1,316,810 |
$1,293,050 |
09/30/17 |
$1,378,655 |
$1,420,755 |
$1,415,779 |
12/31/17 |
$1,463,597 |
$1,526,408 |
$1,531,461 |
03/31/18 |
$1,475,976 |
$1,545,914 |
$1,546,668 |
06/30/18 |
$1,337,901 |
$1,424,813 |
$1,438,656 |
09/30/18 |
$1,271,244 |
$1,409,221 |
$1,361,416 |
12/31/18 |
$1,193,046 |
$1,304,033 |
$1,249,145 |
03/31/19 |
$1,335,599 |
$1,433,329 |
$1,392,779 |
06/30/19 |
$1,339,426 |
$1,442,021 |
$1,393,821 |
09/30/19 |
$1,294,680 |
$1,380,805 |
$1,363,254 |
12/31/19 |
$1,418,087 |
$1,544,260 |
$1,543,921 |
03/31/20 |
$1,063,325 |
$1,179,831 |
$1,229,822 |
06/30/20 |
$1,346,942 |
$1,393,162 |
$1,509,769 |
09/30/20 |
$1,520,959 |
$1,526,325 |
$1,722,729 |
12/31/20 |
$1,832,457 |
$1,826,955 |
$2,018,639 |
03/31/21 |
$1,829,573 |
$1,868,712 |
$2,044,845 |
06/30/21 |
$1,918,023 |
$1,963,031 |
$2,150,631 |
09/30/21 |
$1,794,000 |
$1,804,180 |
$1,936,312 |
12/31/21 |
$1,721,195 |
$1,780,517 |
$1,907,655 |
03/31/22 |
$1,478,387 |
$1,656,327 |
$1,719,634 |
06/30/22 |
$1,325,653 |
$1,466,681 |
$1,498,923 |
09/30/22 |
$1,175,856 |
$1,296,950 |
$1,328,816 |
12/31/22 |
$1,276,700 |
$1,422,787 |
$1,452,106 |
03/31/23 |
$1,310,967 |
$1,479,071 |
$1,514,038 |
06/30/23 |
$1,360,899 |
$1,492,338 |
$1,517,510 |
09/30/23 |
$1,294,323 |
$1,448,684 |
$1,457,009 |
12/31/23 |
$1,382,497 |
$1,562,620 |
$1,569,514 |
03/31/24 |
$1,417,010 |
$1,595,277 |
$1,610,387 |
06/30/24 |
$1,476,176 |
$1,679,595 |
$1,697,023 |
09/30/24 |
$1,609,994 |
$1,826,097 |
$1,843,803 |
12/31/24 |
$1,491,714 |
$1,679,881 |
$1,717,673 |
03/31/25 |
$1,536,436 |
$1,729,061 |
$1,724,097 |
06/30/25 |
$1,772,964 |
$1,936,342 |
$1,975,131 |
09/30/25 |
$1,965,978 |
$2,142,426 |
$2,201,940 |
12/31/25 |
$1,941,295 |
$2,243,751 |
$2,267,865 |
|
| Average Annual Return [Table Text Block] |
Class/Index Name |
1 Year |
5 Years |
10 Years |
Institutional |
30.14% |
1.16% |
6.86% |
MSCI Emerging Markets Index |
33.57% |
4.20% |
8.42% |
MSCI Emerging Markets IMI Growth Index |
32.03% |
2.36% |
8.53% | |
| No Deduction of Taxes [Text Block] |
The performance data does not reflect the deduction of taxes that a shareholder would pay on Fund distributions or redemption of Fund shares
|
| AssetsNet |
$ 3,541,794,045
|
| Holdings Count | Holding |
88
|
| Advisory Fees Paid, Amount |
$ 36,571,671
|
| InvestmentCompanyPortfolioTurnover |
39.00%
|
| Additional Fund Statistics [Text Block] |
Total Net Assets |
$3,541,794,045 |
# of Issuers |
88 |
Portfolio Turnover Rate |
39% |
Total Advisory Fees Paid |
$36,571,671 | |
| Holdings [Text Block] |
Sector Breakdown(as a % of net assets)*
Value |
Value |
Information Technology |
26.4% |
Industrials |
19.4% |
Financials |
17.8% |
Consumer Discretionary |
15.1% |
Communication Services |
10.1% |
Health Care |
3.0% |
Materials |
3.0% |
Consumer Staples |
1.9% |
Energy |
1.4% |
Utilities |
0.8% |
Real Estate |
0.5% |
Cash and Cash Equivalents |
0.6%Footnote Reference† |
| Footnote |
Description |
Footnote† |
Includes other assets and liabilities-net. | Country Exposures(as a % of net assets)*
Value |
Value |
China |
27.2% |
India |
25.5% |
Taiwan |
15.4% |
Korea, Republic of |
15.3% |
Brazil |
4.9% |
South Africa |
2.2% |
Peru |
1.9% |
Mexico |
1.5% |
Poland |
1.2% |
Others |
5.1%Footnote Reference† |
| Footnote |
Description |
Footnote† |
Includes other assets and liabilities-net. | |
| Largest Holdings [Text Block] |
Holding |
% of Net Assets (12/31/25)* |
Taiwan Semiconductor Manufacturing Co., Ltd. |
11.7% |
Tencent Holdings Limited |
5.1% |
Alibaba Group Holding Limited |
3.9% |
Samsung Electronics Co., Ltd. |
3.4% |
Contemporary Amperex Technology Co. Ltd. |
2.4% |
HD Korea Shipbuilding & Offshore Engineering Co. Ltd. |
2.4% |
Bharti Airtel Ltd. |
2.4% |
Bajaj Finance Limited |
2.2% |
SK Hynix, Inc. |
2.0% |
Credicorp, Ltd. |
1.9% |
Total |
37.4% | * Individual weights may not sum to 100% (or displayed total) due to rounding. |
| Material Fund Change [Text Block] |
|
| Updated Prospectus Phone Number |
1.800.99.BARON
|
| Updated Prospectus Web Address |
BaronCapitalGroup.com
|
| C000165215 |
|
| Shareholder Report [Line Items] |
|
| Fund Name |
Baron Emerging Markets Fund
|
| Class Name |
R6
|
| Trading Symbol |
BEXUX
|
| Annual or Semi-Annual Statement [Text Block] |
This annual shareholder report contains important information about Baron Emerging Markets Fund (the Fund) for the period of January 1, 2025 to December 31, 2025.
|
| Additional Information [Text Block] |
You can find additional information about the Fund at BaronCapitalGroup.com. You can also request this information by contacting us at 1.800.99.BARON.
|
| Additional Information Phone Number |
1.800.99.BARON
|
| Additional Information Email |
<span style="box-sizing: border-box; color: rgb(0, 0, 0); display: inline; flex-wrap: nowrap; font-size: 10.6667px; font-weight: 400; grid-area: auto; line-height: 16px; margin: 0px; overflow: visible; text-align: left; text-align-last: auto; white-space-collapse: preserve-breaks;">info@BaronCapitalGroup.com</span>
|
| Additional Information Website |
BaronCapitalGroup.com
|
| Expenses [Text Block] |
What were the Fund costs for the the past 12 months?(based on a hypothetical $10,000 investment)
Class Name |
Cost of a $10,000 investment |
Costs paid as a percentage of a $10,000 investment |
R6 |
$129 |
1.12% | |
| Expenses Paid, Amount |
$ 129
|
| Expense Ratio, Percent |
1.12%
|
| Factors Affecting Performance [Text Block] |
How did the Fund perform last year and what affected its performance?EM equities significantly outperformed their U.S. and global counterparts for first time in several years. Semiconductor-related strength in Taiwan and Korea contributed to EM’s excellent performance, overshadowing weakness in India, where equity markets were pressured by a temporary deceleration in economic growth and a related loss of earnings momentum. Poor stock selection in Poland, China, and India was largely responsible for the Fund’s relative shortfall. Meaningfully higher exposure to lagging Indian equities also proved costly. Somewhat offsetting the above was solid stock selection in Taiwan, higher exposure to strong performing Korean securities, and lack of exposure to lagging Saudi stocks. |
| Performance Past Does Not Indicate Future [Text] |
Past performance is not predictive of future performance
|
| Line Graph [Table Text Block] |
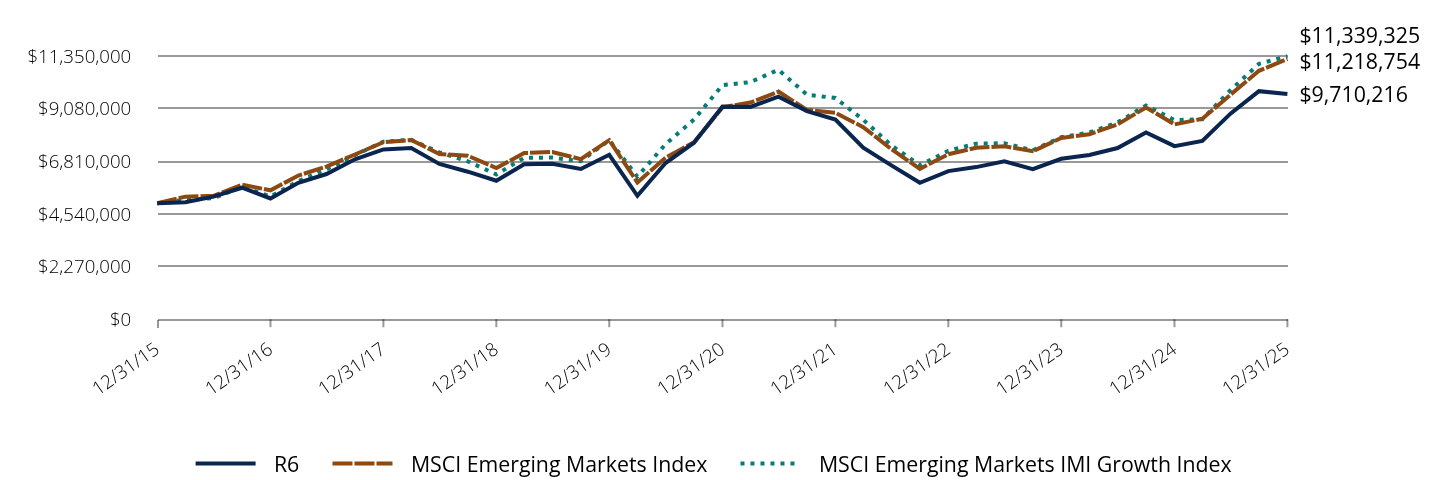
|
R6 |
MSCI Emerging Markets Index |
MSCI Emerging Markets IMI Growth Index |
12/31/15 |
$5,000,000 |
$5,000,000 |
$5,000,000 |
03/31/16 |
$5,047,214 |
$5,285,680 |
$5,148,343 |
06/30/16 |
$5,288,008 |
$5,320,649 |
$5,221,365 |
09/30/16 |
$5,670,444 |
$5,800,920 |
$5,710,004 |
12/31/16 |
$5,208,672 |
$5,559,343 |
$5,291,784 |
03/31/17 |
$5,881,676 |
$6,195,608 |
$5,956,289 |
06/30/17 |
$6,260,833 |
$6,584,049 |
$6,465,250 |
09/30/17 |
$6,898,174 |
$7,103,777 |
$7,078,895 |
12/31/17 |
$7,322,866 |
$7,632,039 |
$7,657,305 |
03/31/18 |
$7,384,763 |
$7,729,569 |
$7,733,340 |
06/30/18 |
$6,694,375 |
$7,124,064 |
$7,193,280 |
09/30/18 |
$6,361,085 |
$7,046,104 |
$6,807,078 |
12/31/18 |
$5,970,046 |
$6,520,165 |
$6,245,723 |
03/31/19 |
$6,678,032 |
$7,166,646 |
$6,963,897 |
06/30/19 |
$6,701,951 |
$7,210,103 |
$6,969,106 |
09/30/19 |
$6,478,219 |
$6,904,023 |
$6,816,269 |
12/31/19 |
$7,090,449 |
$7,721,301 |
$7,719,604 |
03/31/20 |
$5,321,442 |
$5,899,157 |
$6,149,109 |
06/30/20 |
$6,734,724 |
$6,965,812 |
$7,548,843 |
09/30/20 |
$7,609,614 |
$7,631,625 |
$8,613,644 |
12/31/20 |
$9,167,109 |
$9,134,773 |
$10,093,193 |
03/31/21 |
$9,152,688 |
$9,343,560 |
$10,224,225 |
06/30/21 |
$9,594,939 |
$9,815,156 |
$10,753,153 |
09/30/21 |
$8,974,825 |
$9,020,902 |
$9,681,561 |
12/31/21 |
$8,610,657 |
$8,902,583 |
$9,538,273 |
03/31/22 |
$7,396,648 |
$8,281,635 |
$8,598,172 |
06/30/22 |
$6,632,996 |
$7,333,406 |
$7,494,613 |
09/30/22 |
$5,884,031 |
$6,484,750 |
$6,644,079 |
12/31/22 |
$6,388,236 |
$7,113,934 |
$7,260,532 |
03/31/23 |
$6,559,568 |
$7,395,353 |
$7,570,188 |
06/30/23 |
$6,809,224 |
$7,461,692 |
$7,587,550 |
09/30/23 |
$6,471,455 |
$7,243,419 |
$7,285,043 |
12/31/23 |
$6,916,802 |
$7,813,101 |
$7,847,572 |
03/31/24 |
$7,084,423 |
$7,976,385 |
$8,051,933 |
06/30/24 |
$7,380,223 |
$8,397,976 |
$8,485,115 |
09/30/24 |
$8,054,187 |
$9,130,486 |
$9,219,016 |
12/31/24 |
$7,462,720 |
$8,399,404 |
$8,588,367 |
03/31/25 |
$7,686,303 |
$8,645,307 |
$8,620,487 |
06/30/25 |
$8,863,843 |
$9,681,708 |
$9,875,657 |
09/30/25 |
$9,833,779 |
$10,712,130 |
$11,009,702 |
12/31/25 |
$9,710,216 |
$11,218,754 |
$11,339,325 |
|
| Average Annual Return [Table Text Block] |
Class/Index Name |
1 Year |
5 Years |
10 Years |
R6 |
30.12% |
1.16% |
6.86% |
MSCI Emerging Markets Index |
33.57% |
4.20% |
8.42% |
MSCI Emerging Markets IMI Growth Index |
32.03% |
2.36% |
8.53% | |
| No Deduction of Taxes [Text Block] |
The performance data does not reflect the deduction of taxes that a shareholder would pay on Fund distributions or redemption of Fund shares
|
| AssetsNet |
$ 3,541,794,045
|
| Holdings Count | Holding |
88
|
| Advisory Fees Paid, Amount |
$ 36,571,671
|
| InvestmentCompanyPortfolioTurnover |
39.00%
|
| Additional Fund Statistics [Text Block] |
Total Net Assets |
$3,541,794,045 |
# of Issuers |
88 |
Portfolio Turnover Rate |
39% |
Total Advisory Fees Paid |
$36,571,671 | |
| Holdings [Text Block] |
Sector Breakdown(as a % of net assets)*
Value |
Value |
Information Technology |
26.4% |
Industrials |
19.4% |
Financials |
17.8% |
Consumer Discretionary |
15.1% |
Communication Services |
10.1% |
Health Care |
3.0% |
Materials |
3.0% |
Consumer Staples |
1.9% |
Energy |
1.4% |
Utilities |
0.8% |
Real Estate |
0.5% |
Cash and Cash Equivalents |
0.6%Footnote Reference† |
| Footnote |
Description |
Footnote† |
Includes other assets and liabilities-net. | Country Exposures(as a % of net assets)*
Value |
Value |
China |
27.2% |
India |
25.5% |
Taiwan |
15.4% |
Korea, Republic of |
15.3% |
Brazil |
4.9% |
South Africa |
2.2% |
Peru |
1.9% |
Mexico |
1.5% |
Poland |
1.2% |
Others |
5.1%Footnote Reference† |
| Footnote |
Description |
Footnote† |
Includes other assets and liabilities-net. | |
| Largest Holdings [Text Block] |
Holding |
% of Net Assets (12/31/25)* |
Taiwan Semiconductor Manufacturing Co., Ltd. |
11.7% |
Tencent Holdings Limited |
5.1% |
Alibaba Group Holding Limited |
3.9% |
Samsung Electronics Co., Ltd. |
3.4% |
Contemporary Amperex Technology Co. Ltd. |
2.4% |
HD Korea Shipbuilding & Offshore Engineering Co. Ltd. |
2.4% |
Bharti Airtel Ltd. |
2.4% |
Bajaj Finance Limited |
2.2% |
SK Hynix, Inc. |
2.0% |
Credicorp, Ltd. |
1.9% |
Total |
37.4% | * Individual weights may not sum to 100% (or displayed total) due to rounding. |
| Material Fund Change [Text Block] |
|
| Updated Prospectus Phone Number |
1.800.99.BARON
|
| Updated Prospectus Web Address |
BaronCapitalGroup.com
|
| C000112440 |
|
| Shareholder Report [Line Items] |
|
| Fund Name |
Baron Global Opportunity Fund
|
| Class Name |
Retail
|
| Trading Symbol |
BGAFX
|
| Annual or Semi-Annual Statement [Text Block] |
This annual shareholder report contains important information about Baron Global Opportunity Fund (the Fund) for the period of January 1, 2025 to December 31, 2025.
|
| Additional Information [Text Block] |
You can find additional information about the Fund at BaronCapitalGroup.com. You can also request this information by contacting us at 1.800.99.BARON.
|
| Additional Information Phone Number |
1.800.99.BARON
|
| Additional Information Email |
<span style="box-sizing: border-box; color: rgb(0, 0, 0); display: inline; flex-wrap: nowrap; font-size: 10.6667px; font-weight: 400; grid-area: auto; line-height: 16px; margin: 0px; overflow: visible; text-align: left; text-align-last: auto; white-space-collapse: preserve-breaks;">info@BaronCapitalGroup.com</span>
|
| Additional Information Website |
BaronCapitalGroup.com
|
| Expenses [Text Block] |
What were the Fund costs for the the past 12 months?(based on a hypothetical $10,000 investment)
Class Name |
Cost of a $10,000 investment |
Costs paid as a percentage of a $10,000 investment |
Retail |
$131 |
1.15% | |
| Expenses Paid, Amount |
$ 131
|
| Expense Ratio, Percent |
1.15%
|
| Factors Affecting Performance [Text Block] |
How did the Fund perform last year and what affected its performance?Global equities rose sharply for a third consecutive year, overcoming a swift selloff early in the period related to investor concerns about President Trump’s new tariff policies. Tariff-related fears diminished as the year wore on and the AI boom and U.S. Federal Reserve rate cuts helped push markets to fresh record highs. The Fund appreciated more than 25% and beat the Index in each of the last three years, bouncing back from a difficult stretch of absolute and relative performance in 2021 and 2022. The Fund’s U.S. holdings, specifically SpaceX and Cloudflare, were responsible for relative strength in 2025. |
| Performance Past Does Not Indicate Future [Text] |
Past performance is not predictive of future performance
|
| Line Graph [Table Text Block] |
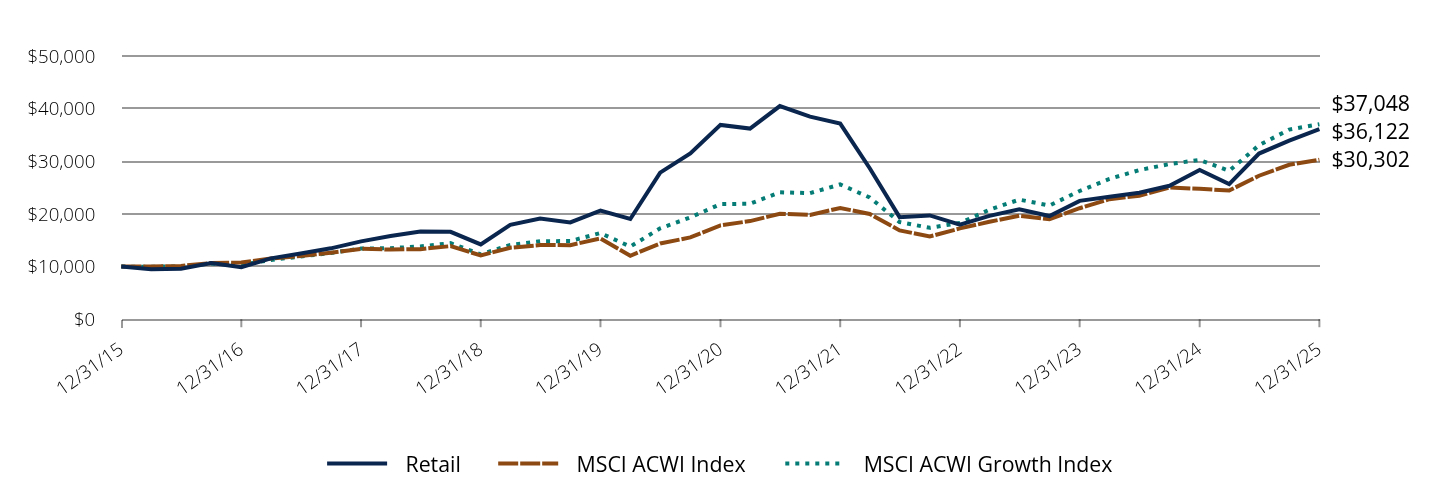
|
Retail |
MSCI ACWI Index |
MSCI ACWI Growth Index |
12/31/15 |
$10,000 |
$10,000 |
$10,000 |
03/31/16 |
$9,504 |
$10,024 |
$9,970 |
06/30/16 |
$9,597 |
$10,123 |
$10,044 |
09/30/16 |
$10,654 |
$10,660 |
$10,575 |
12/31/16 |
$9,885 |
$10,786 |
$10,327 |
03/31/17 |
$11,567 |
$11,532 |
$11,265 |
06/30/17 |
$12,480 |
$12,024 |
$11,909 |
09/30/17 |
$13,465 |
$12,647 |
$12,595 |
12/31/17 |
$14,788 |
$13,372 |
$13,425 |
03/31/18 |
$15,794 |
$13,234 |
$13,502 |
06/30/18 |
$16,671 |
$13,314 |
$13,821 |
09/30/18 |
$16,607 |
$13,884 |
$14,451 |
12/31/18 |
$14,213 |
$12,113 |
$12,333 |
03/31/19 |
$17,922 |
$13,588 |
$14,119 |
06/30/19 |
$19,137 |
$14,079 |
$14,811 |
09/30/19 |
$18,382 |
$14,075 |
$14,851 |
12/31/19 |
$20,618 |
$15,335 |
$16,369 |
03/31/20 |
$19,037 |
$12,059 |
$13,797 |
06/30/20 |
$27,850 |
$14,376 |
$17,266 |
09/30/20 |
$31,481 |
$15,545 |
$19,338 |
12/31/20 |
$36,909 |
$17,828 |
$21,869 |
03/31/21 |
$36,211 |
$18,643 |
$21,931 |
06/30/21 |
$40,496 |
$20,021 |
$24,120 |
09/30/21 |
$38,490 |
$19,810 |
$23,945 |
12/31/21 |
$37,153 |
$21,133 |
$25,609 |
03/31/22 |
$28,677 |
$20,000 |
$23,120 |
06/30/22 |
$19,389 |
$16,868 |
$18,460 |
09/30/22 |
$19,712 |
$15,717 |
$17,366 |
12/31/22 |
$17,947 |
$17,252 |
$18,283 |
03/31/23 |
$19,624 |
$18,512 |
$20,803 |
06/30/23 |
$20,869 |
$19,656 |
$22,716 |
09/30/23 |
$19,595 |
$18,987 |
$21,604 |
12/31/23 |
$22,480 |
$21,082 |
$24,356 |
03/31/24 |
$23,271 |
$22,798 |
$26,657 |
06/30/24 |
$24,040 |
$23,464 |
$28,326 |
09/30/24 |
$25,350 |
$25,016 |
$29,478 |
12/31/24 |
$28,345 |
$24,769 |
$30,257 |
03/31/25 |
$25,665 |
$24,441 |
$28,192 |
06/30/25 |
$31,472 |
$27,258 |
$33,058 |
09/30/25 |
$33,932 |
$29,336 |
$36,026 |
12/31/25 |
$36,122 |
$30,302 |
$37,048 |
|
| Average Annual Return [Table Text Block] |
Class/Index Name |
1 Year |
5 Years |
10 Years |
Retail |
27.43% |
(0.43)% |
13.70% |
MSCI ACWI Index |
22.34% |
11.19% |
11.72% |
MSCI ACWI Growth Index |
22.44% |
11.12% |
13.99% | |
| No Deduction of Taxes [Text Block] |
The performance data does not reflect the deduction of taxes that a shareholder would pay on Fund distributions or redemption of Fund shares
|
| AssetsNet |
$ 737,169,360
|
| Holdings Count | Holding |
42
|
| Advisory Fees Paid, Amount |
$ 4,979,140
|
| InvestmentCompanyPortfolioTurnover |
9.00%
|
| Additional Fund Statistics [Text Block] |
Total Net Assets |
$737,169,360 |
# of Issuers |
42 |
Portfolio Turnover Rate |
9% |
Total Advisory Fees Paid (Net of fees waived) |
$4,979,140 | |
| Holdings [Text Block] |
Sector Breakdown(as a % of net assets)*
Value |
Value |
Information Technology |
40.2% |
Industrials |
22.4% |
Consumer Discretionary |
21.7% |
Financials |
9.1% |
Health Care |
6.5% |
Unclassified |
0.1% |
Communication Services |
0.0%Footnote Reference‡ |
Cash and Cash Equivalents |
0.0%Footnote Reference†Footnote Reference‡ |
| Footnote |
Description |
Footnote‡ |
Rounds to less than 0.1%. |
Footnote† |
Includes other assets and liabilities-net. | Country Exposures(as a % of net assets)*
Value |
Value |
United States |
53.7% |
Netherlands |
8.2% |
India |
6.5% |
Argentina |
6.3% |
Canada |
5.6% |
Taiwan |
5.1% |
Brazil |
3.6% |
Korea, Republic of |
3.6% |
China |
2.9% |
Others |
4.5%Footnote Reference† |
| Footnote |
Description |
Footnote† |
Includes other assets and liabilities-net. | |
| Largest Holdings [Text Block] |
Holding |
% of Net Assets (12/31/25)* |
Space Exploration Technologies Corp. |
18.7% |
NVIDIA Corp. |
9.0% |
MercadoLibre, Inc. |
6.2% |
Shopify, Inc. |
5.6% |
Taiwan Semiconductor Manufacturing Co., Ltd. |
5.1% |
Amazon.com, Inc. |
4.0% |
argenx SE |
3.7% |
Coupang, Inc. |
3.6% |
Bajaj Finance Limited |
3.4% |
Eternal Ltd. |
3.1% |
Total |
62.5% | * Individual weights may not sum to 100% (or displayed total) due to rounding. |
| Material Fund Change [Text Block] |
|
| Updated Prospectus Phone Number |
1.800.99.BARON
|
| Updated Prospectus Web Address |
BaronCapitalGroup.com
|
| C000112441 |
|
| Shareholder Report [Line Items] |
|
| Fund Name |
Baron Global Opportunity Fund
|
| Class Name |
Institutional
|
| Trading Symbol |
BGAIX
|
| Annual or Semi-Annual Statement [Text Block] |
This annual shareholder report contains important information about Baron Global Opportunity Fund (the Fund) for the period of January 1, 2025 to December 31, 2025.
|
| Additional Information [Text Block] |
You can find additional information about the Fund at BaronCapitalGroup.com. You can also request this information by contacting us at 1.800.99.BARON.
|
| Additional Information Phone Number |
1.800.99.BARON
|
| Additional Information Email |
<span style="box-sizing: border-box; color: rgb(0, 0, 0); display: inline; flex-wrap: nowrap; font-size: 10.6667px; font-weight: 400; grid-area: auto; line-height: 16px; margin: 0px; overflow: visible; text-align: left; text-align-last: auto; white-space-collapse: preserve-breaks;">info@BaronCapitalGroup.com</span>
|
| Additional Information Website |
BaronCapitalGroup.com
|
| Expenses [Text Block] |
What were the Fund costs for the the past 12 months?(based on a hypothetical $10,000 investment)
Class Name |
Cost of a $10,000 investment |
Costs paid as a percentage of a $10,000 investment |
Institutional |
$102 |
0.90% | |
| Expenses Paid, Amount |
$ 102
|
| Expense Ratio, Percent |
0.90%
|
| Factors Affecting Performance [Text Block] |
How did the Fund perform last year and what affected its performance?Global equities rose sharply for a third consecutive year, overcoming a swift selloff early in the period related to investor concerns about President Trump’s new tariff policies. Tariff-related fears diminished as the year wore on and the AI boom and U.S. Federal Reserve rate cuts helped push markets to fresh record highs. The Fund appreciated more than 25% and beat the Index in each of the last three years, bouncing back from a difficult stretch of absolute and relative performance in 2021 and 2022. The Fund’s U.S. holdings, specifically SpaceX and Cloudflare, were responsible for relative strength in 2025. |
| Performance Past Does Not Indicate Future [Text] |
Past performance is not predictive of future performance
|
| Line Graph [Table Text Block] |
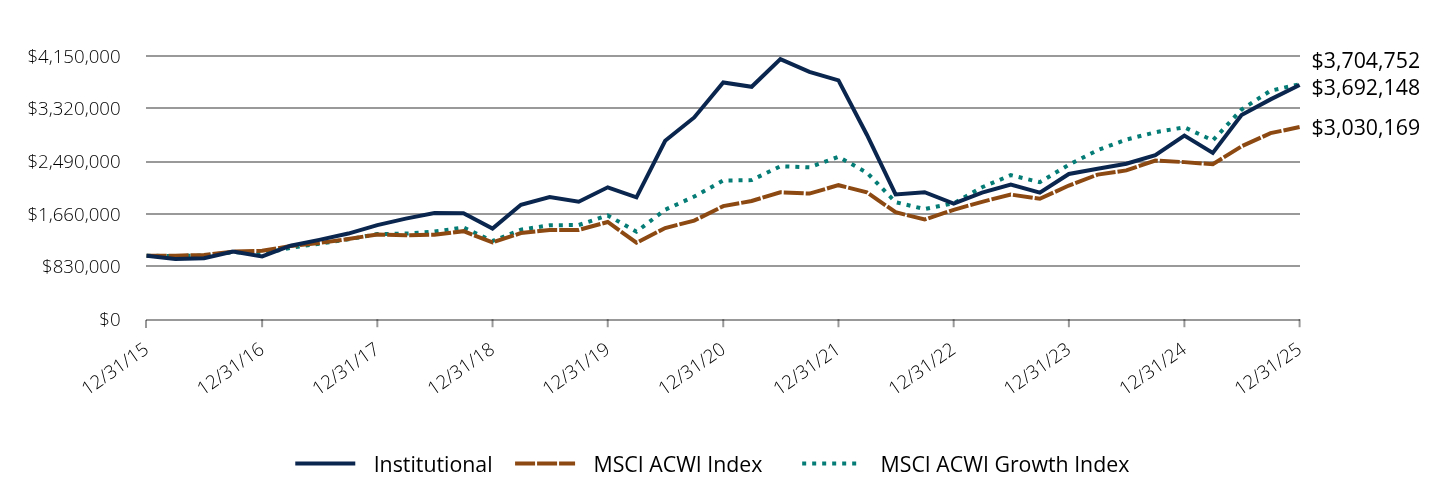
|
Institutional |
MSCI ACWI Index |
MSCI ACWI Growth Index |
12/31/15 |
$1,000,000 |
$1,000,000 |
$1,000,000 |
03/31/16 |
$950,714 |
$1,002,382 |
$996,980 |
06/30/16 |
$960,714 |
$1,012,294 |
$1,004,379 |
09/30/16 |
$1,067,143 |
$1,065,964 |
$1,057,453 |
12/31/16 |
$990,714 |
$1,078,643 |
$1,032,681 |
03/31/17 |
$1,159,286 |
$1,153,158 |
$1,126,486 |
06/30/17 |
$1,250,714 |
$1,202,435 |
$1,190,893 |
09/30/17 |
$1,350,714 |
$1,264,746 |
$1,259,497 |
12/31/17 |
$1,484,286 |
$1,337,217 |
$1,342,497 |
03/31/18 |
$1,586,429 |
$1,323,396 |
$1,350,161 |
06/30/18 |
$1,675,000 |
$1,331,425 |
$1,382,129 |
09/30/18 |
$1,670,000 |
$1,388,369 |
$1,445,145 |
12/31/18 |
$1,430,000 |
$1,211,326 |
$1,233,345 |
03/31/19 |
$1,804,286 |
$1,358,805 |
$1,411,908 |
06/30/19 |
$1,927,857 |
$1,407,884 |
$1,481,098 |
09/30/19 |
$1,852,857 |
$1,407,519 |
$1,485,064 |
12/31/19 |
$2,080,000 |
$1,533,507 |
$1,636,931 |
03/31/20 |
$1,921,429 |
$1,205,870 |
$1,379,698 |
06/30/20 |
$2,812,857 |
$1,437,625 |
$1,726,619 |
09/30/20 |
$3,181,429 |
$1,554,508 |
$1,933,778 |
12/31/20 |
$3,732,857 |
$1,782,776 |
$2,186,905 |
03/31/21 |
$3,664,286 |
$1,864,274 |
$2,193,088 |
06/30/21 |
$4,100,714 |
$2,002,105 |
$2,411,975 |
09/30/21 |
$3,899,286 |
$1,980,997 |
$2,394,502 |
12/31/21 |
$3,766,429 |
$2,113,256 |
$2,560,918 |
03/31/22 |
$2,908,571 |
$1,999,968 |
$2,311,983 |
06/30/22 |
$1,967,857 |
$1,686,763 |
$1,846,013 |
09/30/22 |
$2,002,122 |
$1,571,731 |
$1,736,554 |
12/31/22 |
$1,823,945 |
$1,725,177 |
$1,828,284 |
03/31/23 |
$1,995,576 |
$1,851,216 |
$2,080,265 |
06/30/23 |
$2,123,573 |
$1,965,570 |
$2,271,566 |
09/30/23 |
$1,994,849 |
$1,898,691 |
$2,160,374 |
12/31/23 |
$2,290,113 |
$2,108,199 |
$2,435,629 |
03/31/24 |
$2,372,292 |
$2,279,790 |
$2,665,721 |
06/30/24 |
$2,452,290 |
$2,346,442 |
$2,832,564 |
09/30/24 |
$2,588,286 |
$2,501,633 |
$2,947,838 |
12/31/24 |
$2,895,186 |
$2,476,895 |
$3,025,673 |
03/31/25 |
$2,623,194 |
$2,444,088 |
$2,819,181 |
06/30/25 |
$3,218,085 |
$2,725,809 |
$3,305,771 |
09/30/25 |
$3,466,078 |
$2,933,592 |
$3,602,605 |
12/31/25 |
$3,692,148 |
$3,030,169 |
$3,704,752 |
|
| Average Annual Return [Table Text Block] |
Class/Index Name |
1 Year |
5 Years |
10 Years |
Institutional |
27.53% |
(0.22)% |
13.95% |
MSCI ACWI Index |
22.34% |
11.19% |
11.72% |
MSCI ACWI Growth Index |
22.44% |
11.12% |
13.99% | |
| No Deduction of Taxes [Text Block] |
The performance data does not reflect the deduction of taxes that a shareholder would pay on Fund distributions or redemption of Fund shares
|
| AssetsNet |
$ 737,169,360
|
| Holdings Count | Holding |
42
|
| Advisory Fees Paid, Amount |
$ 4,979,140
|
| InvestmentCompanyPortfolioTurnover |
9.00%
|
| Additional Fund Statistics [Text Block] |
Total Net Assets |
$737,169,360 |
# of Issuers |
42 |
Portfolio Turnover Rate |
9% |
Total Advisory Fees Paid (Net of fees waived) |
$4,979,140 | |
| Holdings [Text Block] |
Sector Breakdown(as a % of net assets)*
Value |
Value |
Information Technology |
40.2% |
Industrials |
22.4% |
Consumer Discretionary |
21.7% |
Financials |
9.1% |
Health Care |
6.5% |
Unclassified |
0.1% |
Communication Services |
0.0%Footnote Reference‡ |
Cash and Cash Equivalents |
0.0%Footnote Reference†Footnote Reference‡ |
| Footnote |
Description |
Footnote‡ |
Rounds to less than 0.1%. |
Footnote† |
Includes other assets and liabilities-net. | Country Exposures(as a % of net assets)*
Value |
Value |
United States |
53.7% |
Netherlands |
8.2% |
India |
6.5% |
Argentina |
6.3% |
Canada |
5.6% |
Taiwan |
5.1% |
Brazil |
3.6% |
Korea, Republic of |
3.6% |
China |
2.9% |
Others |
4.5%Footnote Reference† |
| Footnote |
Description |
Footnote† |
Includes other assets and liabilities-net. | |
| Largest Holdings [Text Block] |
Holding |
% of Net Assets (12/31/25)* |
Space Exploration Technologies Corp. |
18.7% |
NVIDIA Corp. |
9.0% |
MercadoLibre, Inc. |
6.2% |
Shopify, Inc. |
5.6% |
Taiwan Semiconductor Manufacturing Co., Ltd. |
5.1% |
Amazon.com, Inc. |
4.0% |
argenx SE |
3.7% |
Coupang, Inc. |
3.6% |
Bajaj Finance Limited |
3.4% |
Eternal Ltd. |
3.1% |
Total |
62.5% | * Individual weights may not sum to 100% (or displayed total) due to rounding. |
| Material Fund Change [Text Block] |
|
| Updated Prospectus Phone Number |
1.800.99.BARON
|
| Updated Prospectus Web Address |
BaronCapitalGroup.com
|
| C000174764 |
|
| Shareholder Report [Line Items] |
|
| Fund Name |
Baron Global Opportunity Fund
|
| Class Name |
R6
|
| Trading Symbol |
BGLUX
|
| Annual or Semi-Annual Statement [Text Block] |
This annual shareholder report contains important information about Baron Global Opportunity Fund (the Fund) for the period of January 1, 2025 to December 31, 2025.
|
| Additional Information [Text Block] |
You can find additional information about the Fund at BaronCapitalGroup.com. You can also request this information by contacting us at 1.800.99.BARON.
|
| Additional Information Phone Number |
1.800.99.BARON
|
| Additional Information Email |
<span style="box-sizing: border-box; color: rgb(0, 0, 0); display: inline; flex-wrap: nowrap; font-size: 10.6667px; font-weight: 400; grid-area: auto; line-height: 16px; margin: 0px; overflow: visible; text-align: left; text-align-last: auto; white-space-collapse: preserve-breaks;">info@BaronCapitalGroup.com</span>
|
| Additional Information Website |
BaronCapitalGroup.com
|
| Expenses [Text Block] |
What were the Fund costs for the the past 12 months?(based on a hypothetical $10,000 investment)
Class Name |
Cost of a $10,000 investment |
Costs paid as a percentage of a $10,000 investment |
R6 |
$102 |
0.90% | |
| Expenses Paid, Amount |
$ 102
|
| Expense Ratio, Percent |
0.90%
|
| Factors Affecting Performance [Text Block] |
How did the Fund perform last year and what affected its performance?Global equities rose sharply for a third consecutive year, overcoming a swift selloff early in the period related to investor concerns about President Trump’s new tariff policies. Tariff-related fears diminished as the year wore on and the AI boom and U.S. Federal Reserve rate cuts helped push markets to fresh record highs. The Fund appreciated more than 25% and beat the Index in each of the last three years, bouncing back from a difficult stretch of absolute and relative performance in 2021 and 2022. The Fund’s U.S. holdings, specifically SpaceX and Cloudflare, were responsible for relative strength in 2025. |
| Performance Past Does Not Indicate Future [Text] |
Past performance is not predictive of future performance
|
| Line Graph [Table Text Block] |
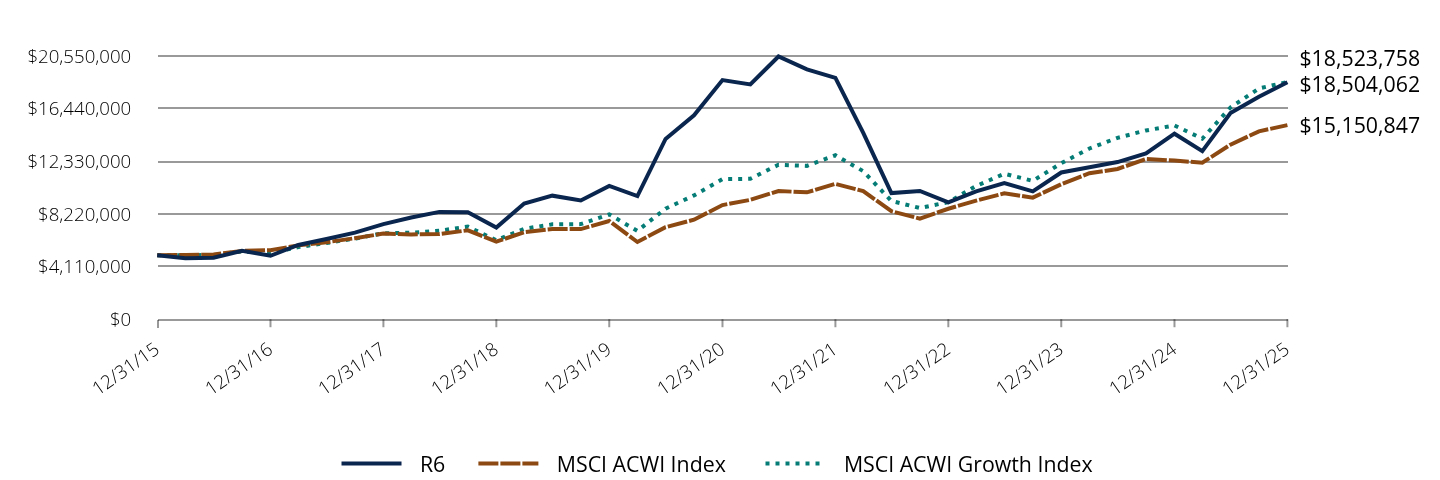
|
R6 |
MSCI ACWI Index |
MSCI ACWI Growth Index |
12/31/15 |
$5,000,000 |
$5,000,000 |
$5,000,000 |
03/31/16 |
$4,753,571 |
$5,011,909 |
$4,984,901 |
06/30/16 |
$4,803,571 |
$5,061,470 |
$5,021,896 |
09/30/16 |
$5,339,286 |
$5,329,820 |
$5,287,264 |
12/31/16 |
$4,953,571 |
$5,393,216 |
$5,163,407 |
03/31/17 |
$5,800,000 |
$5,765,791 |
$5,632,429 |
06/30/17 |
$6,257,143 |
$6,012,174 |
$5,954,466 |
09/30/17 |
$6,757,143 |
$6,323,729 |
$6,297,483 |
12/31/17 |
$7,425,000 |
$6,686,084 |
$6,712,484 |
03/31/18 |
$7,939,286 |
$6,616,979 |
$6,750,806 |
06/30/18 |
$8,378,571 |
$6,657,126 |
$6,910,643 |
09/30/18 |
$8,353,571 |
$6,941,843 |
$7,225,727 |
12/31/18 |
$7,153,571 |
$6,056,629 |
$6,166,723 |
03/31/19 |
$9,028,571 |
$6,794,027 |
$7,059,541 |
06/30/19 |
$9,646,429 |
$7,039,419 |
$7,405,492 |
09/30/19 |
$9,267,857 |
$7,037,596 |
$7,425,322 |
12/31/19 |
$10,403,571 |
$7,667,535 |
$8,184,655 |
03/31/20 |
$9,610,714 |
$6,029,350 |
$6,898,488 |
06/30/20 |
$14,071,429 |
$7,188,126 |
$8,633,096 |
09/30/20 |
$15,917,857 |
$7,772,539 |
$9,668,892 |
12/31/20 |
$18,671,429 |
$8,913,881 |
$10,934,526 |
03/31/21 |
$18,332,143 |
$9,321,370 |
$10,965,442 |
06/30/21 |
$20,514,286 |
$10,010,524 |
$12,059,874 |
09/30/21 |
$19,507,143 |
$9,904,985 |
$11,972,510 |
12/31/21 |
$18,842,857 |
$10,566,279 |
$12,804,588 |
03/31/22 |
$14,553,571 |
$9,999,842 |
$11,559,914 |
06/30/22 |
$9,846,429 |
$8,433,817 |
$9,230,064 |
09/30/22 |
$10,017,751 |
$7,858,654 |
$8,682,768 |
12/31/22 |
$9,126,880 |
$8,625,887 |
$9,141,418 |
03/31/23 |
$9,985,025 |
$9,256,078 |
$10,401,325 |
06/30/23 |
$10,624,997 |
$9,827,852 |
$11,357,828 |
09/30/23 |
$9,981,389 |
$9,493,453 |
$10,801,870 |
12/31/23 |
$11,457,689 |
$10,540,994 |
$12,178,146 |
03/31/24 |
$11,864,944 |
$11,398,948 |
$13,328,603 |
06/30/24 |
$12,268,563 |
$11,732,209 |
$14,162,818 |
09/30/24 |
$12,944,897 |
$12,508,163 |
$14,739,188 |
12/31/24 |
$14,483,013 |
$12,384,476 |
$15,128,365 |
03/31/25 |
$13,119,435 |
$12,220,440 |
$14,095,907 |
06/30/25 |
$16,097,489 |
$13,629,045 |
$16,528,853 |
09/30/25 |
$17,370,162 |
$14,667,960 |
$18,013,024 |
12/31/25 |
$18,504,062 |
$15,150,847 |
$18,523,758 |
|
| Average Annual Return [Table Text Block] |
Class/Index Name |
1 Year |
5 Years |
10 Years |
R6 |
27.76% |
(0.18)% |
13.98% |
MSCI ACWI Index |
22.34% |
11.19% |
11.72% |
MSCI ACWI Growth Index |
22.44% |
11.12% |
13.99% | |
| No Deduction of Taxes [Text Block] |
The performance data does not reflect the deduction of taxes that a shareholder would pay on Fund distributions or redemption of Fund shares
|
| AssetsNet |
$ 737,169,360
|
| Holdings Count | Holding |
42
|
| Advisory Fees Paid, Amount |
$ 4,979,140
|
| InvestmentCompanyPortfolioTurnover |
9.00%
|
| Additional Fund Statistics [Text Block] |
Total Net Assets |
$737,169,360 |
# of Issuers |
42 |
Portfolio Turnover Rate |
9% |
Total Advisory Fees Paid (Net of fees waived) |
$4,979,140 | |
| Holdings [Text Block] |
Sector Breakdown(as a % of net assets)*
Value |
Value |
Information Technology |
40.2% |
Industrials |
22.4% |
Consumer Discretionary |
21.7% |
Financials |
9.1% |
Health Care |
6.5% |
Unclassified |
0.1% |
Communication Services |
0.0%Footnote Reference‡ |
Cash and Cash Equivalents |
0.0%Footnote Reference†Footnote Reference‡ |
| Footnote |
Description |
Footnote‡ |
Rounds to less than 0.1%. |
Footnote† |
Includes other assets and liabilities-net. | Country Exposures(as a % of net assets)*
Value |
Value |
United States |
53.7% |
Netherlands |
8.2% |
India |
6.5% |
Argentina |
6.3% |
Canada |
5.6% |
Taiwan |
5.1% |
Brazil |
3.6% |
Korea, Republic of |
3.6% |
China |
2.9% |
Others |
4.5%Footnote Reference† |
| Footnote |
Description |
Footnote† |
Includes other assets and liabilities-net. | |
| Largest Holdings [Text Block] |
Holding |
% of Net Assets (12/31/25)* |
Space Exploration Technologies Corp. |
18.7% |
NVIDIA Corp. |
9.0% |
MercadoLibre, Inc. |
6.2% |
Shopify, Inc. |
5.6% |
Taiwan Semiconductor Manufacturing Co., Ltd. |
5.1% |
Amazon.com, Inc. |
4.0% |
argenx SE |
3.7% |
Coupang, Inc. |
3.6% |
Bajaj Finance Limited |
3.4% |
Eternal Ltd. |
3.1% |
Total |
62.5% | * Individual weights may not sum to 100% (or displayed total) due to rounding. |
| Material Fund Change [Text Block] |
|
| Updated Prospectus Phone Number |
1.800.99.BARON
|
| Updated Prospectus Web Address |
BaronCapitalGroup.com
|
| C000196927 |
|
| Shareholder Report [Line Items] |
|
| Fund Name |
Baron Real Estate Income Fund
|
| Class Name |
Retail
|
| Trading Symbol |
BRIFX
|
| Annual or Semi-Annual Statement [Text Block] |
This annual shareholder report contains important information about Baron Real Estate Income Fund (the Fund) for the period of January 1, 2025 to December 31, 2025.
|
| Additional Information [Text Block] |
You can find additional information about the Fund at BaronCapitalGroup.com. You can also request this information by contacting us at 1.800.99.BARON.
|
| Additional Information Phone Number |
1.800.99.BARON
|
| Additional Information Email |
<span style="box-sizing: border-box; color: rgb(0, 0, 0); display: inline; flex-wrap: nowrap; font-size: 10.6667px; font-weight: 400; grid-area: auto; line-height: 16px; margin: 0px; overflow: visible; text-align: left; text-align-last: auto; white-space-collapse: preserve-breaks;">info@BaronCapitalGroup.com</span>
|
| Additional Information Website |
BaronCapitalGroup.com
|
| Expenses [Text Block] |
What were the Fund costs for the the past 12 months?(based on a hypothetical $10,000 investment)
Class Name |
Cost of a $10,000 investment |
Costs paid as a percentage of a $10,000 investment |
Retail |
$107 |
1.05% | |
| Expenses Paid, Amount |
$ 107
|
| Expense Ratio, Percent |
1.05%
|
| Factors Affecting Performance [Text Block] |
How did the Fund perform last year and what affected its performance?REITs trailed the broader U.S. equity market in 2025, as growth-oriented stocks, particularly those at the forefront of the AI boom, led the way. The Fund outperformed because of its unique exposure to non-REIT real estate companies, which were up over 18%. GDS, Wynn, Jones Lang LaSalle, Brookfield, Las Vegas Sands, CRH, and Toll Brothers led the way in the group. Stock selection in health care (American Healthcare, Ventas, and Welltower) and self-storage (SmartStop Self Storage) REITs also added value but was undone by stock-specific weakness in all other REIT categories where the Fund had investments. |
| Performance Past Does Not Indicate Future [Text] |
Past performance is not predictive of future performance
|
| Line Graph [Table Text Block] |
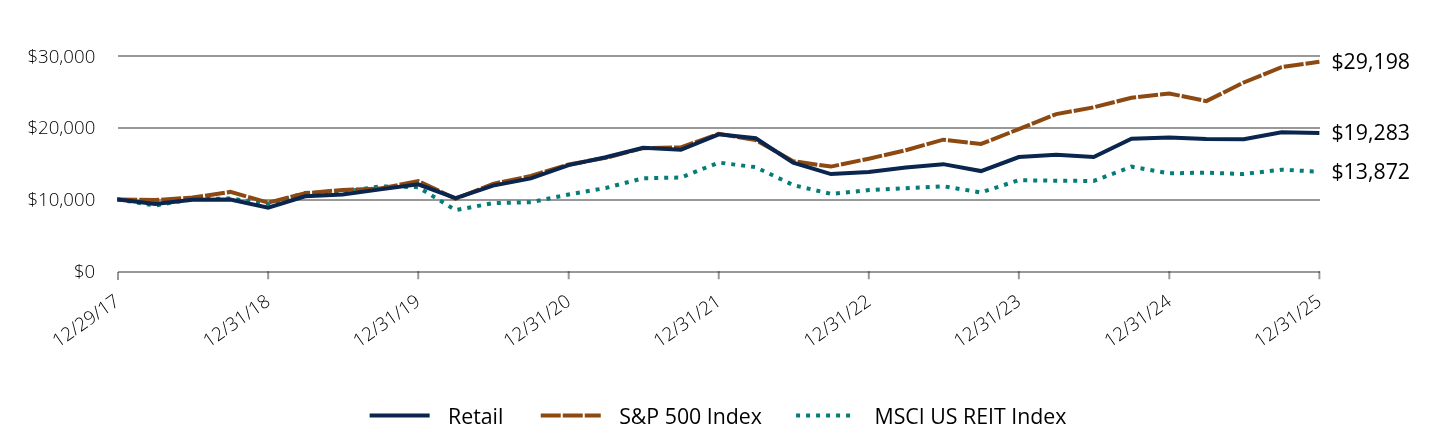
|
Retail |
S&P 500 Index |
MSCI US REIT Index |
12/29/17 |
$10,000 |
$10,000 |
$10,000 |
12/31/17 |
$10,000 |
$10,000 |
$10,000 |
3/31/18 |
$9,390 |
$9,924 |
$9,162 |
6/30/18 |
$9,975 |
$10,265 |
$10,054 |
9/30/18 |
$10,006 |
$11,056 |
$10,132 |
12/31/18 |
$8,867 |
$9,562 |
$9,417 |
3/31/19 |
$10,451 |
$10,867 |
$10,917 |
6/30/19 |
$10,694 |
$11,334 |
$11,025 |
9/30/19 |
$11,408 |
$11,527 |
$11,839 |
12/31/19 |
$12,118 |
$12,572 |
$11,709 |
3/31/20 |
$10,195 |
$10,108 |
$8,520 |
6/30/20 |
$11,937 |
$12,185 |
$9,490 |
9/30/20 |
$12,941 |
$13,273 |
$9,617 |
12/31/20 |
$14,787 |
$14,885 |
$10,690 |
3/31/21 |
$15,892 |
$15,804 |
$11,598 |
6/30/21 |
$17,217 |
$17,156 |
$12,961 |
9/30/21 |
$16,927 |
$17,255 |
$13,057 |
12/31/21 |
$19,087 |
$19,158 |
$15,149 |
3/31/22 |
$18,530 |
$18,277 |
$14,501 |
6/30/22 |
$15,115 |
$15,334 |
$12,012 |
9/30/22 |
$13,541 |
$14,586 |
$10,778 |
12/31/22 |
$13,818 |
$15,688 |
$11,306 |
3/31/23 |
$14,456 |
$16,865 |
$11,576 |
6/30/23 |
$14,925 |
$18,339 |
$11,846 |
9/30/23 |
$13,962 |
$17,739 |
$10,979 |
12/31/23 |
$15,917 |
$19,813 |
$12,692 |
3/31/24 |
$16,223 |
$21,904 |
$12,614 |
6/30/24 |
$15,909 |
$22,842 |
$12,586 |
9/30/24 |
$18,480 |
$24,187 |
$14,574 |
12/31/24 |
$18,648 |
$24,770 |
$13,643 |
3/31/25 |
$18,441 |
$23,711 |
$13,746 |
6/30/25 |
$18,398 |
$26,306 |
$13,546 |
9/30/25 |
$19,375 |
$28,443 |
$14,154 |
12/31/25 |
$19,283 |
$29,198 |
$13,872 |
|
| Average Annual Return [Table Text Block] |
Class/Index Name |
1 Year |
5 Years |
Since Inception 12/29/2017 |
Retail |
3.41% |
5.45% |
8.55% |
MSCI US REIT Index |
1.67% |
5.35% |
4.17% |
S&P 500 Index |
17.88% |
14.42% |
14.32% | |
| Performance Inception Date |
Dec. 29, 2017
|
| No Deduction of Taxes [Text Block] |
The performance data does not reflect the deduction of taxes that a shareholder would pay on Fund distributions or redemption of Fund shares
|
| AssetsNet |
$ 258,828,817
|
| Holdings Count | Holding |
35
|
| Advisory Fees Paid, Amount |
$ 1,589,738
|
| InvestmentCompanyPortfolioTurnover |
122.00%
|
| Additional Fund Statistics [Text Block] |
Total Net Assets |
$258,828,817 |
# of Issuers |
35 |
Portfolio Turnover Rate |
122% |
Total Advisory Fees Paid (Net of fees waived) |
$1,589,738 | |
| Holdings [Text Block] |
Sector Breakdown(as a % of net assets)*
Value |
Value |
Real Estate |
72.8% |
Financials |
9.2% |
Consumer Discretionary |
8.3% |
Materials |
2.9% |
Information Technology |
1.7% |
Industrials |
1.3% |
Cash and Cash Equivalents |
3.8%Footnote Reference† |
| Footnote |
Description |
Footnote† |
Includes other assets and liabilities-net. | |
| Largest Holdings [Text Block] |
Holding |
% of Net Assets (12/31/25)* |
Prologis, Inc. |
10.8% |
Welltower, Inc. |
10.2% |
Ventas, Inc. |
7.0% |
Simon Property Group, Inc. |
4.3% |
Brookfield Corp. |
4.0% |
Jones Lang LaSalle, Inc. |
4.0% |
EastGroup Properties, Inc. |
3.9% |
Macerich Co. |
3.7% |
Equinix, Inc. |
3.6% |
American Tower Corp. |
2.9% |
Total |
54.4% | * Individual weights may not sum to 100% (or displayed total) due to rounding. |
| Material Fund Change [Text Block] |
|
| Updated Prospectus Phone Number |
1.800.99.BARON
|
| Updated Prospectus Web Address |
BaronCapitalGroup.com
|
| C000196928 |
|
| Shareholder Report [Line Items] |
|
| Fund Name |
Baron Real Estate Income Fund
|
| Class Name |
Institutional
|
| Trading Symbol |
BRIIX
|
| Annual or Semi-Annual Statement [Text Block] |
This annual shareholder report contains important information about Baron Real Estate Income Fund (the Fund) for the period of January 1, 2025 to December 31, 2025.
|
| Additional Information [Text Block] |
You can find additional information about the Fund at BaronCapitalGroup.com. You can also request this information by contacting us at 1.800.99.BARON.
|
| Additional Information Phone Number |
1.800.99.BARON
|
| Additional Information Email |
<span style="box-sizing: border-box; color: rgb(0, 0, 0); display: inline; flex-wrap: nowrap; font-size: 10.6667px; font-weight: 400; grid-area: auto; line-height: 16px; margin: 0px; overflow: visible; text-align: left; text-align-last: auto; white-space-collapse: preserve-breaks;">info@BaronCapitalGroup.com</span>
|
| Additional Information Website |
BaronCapitalGroup.com
|
| Expenses [Text Block] |
What were the Fund costs for the the past 12 months?(based on a hypothetical $10,000 investment)
Class Name |
Cost of a $10,000 investment |
Costs paid as a percentage of a $10,000 investment |
Institutional |
$81 |
0.80% | |
| Expenses Paid, Amount |
$ 81
|
| Expense Ratio, Percent |
0.80%
|
| Factors Affecting Performance [Text Block] |
How did the Fund perform last year and what affected its performance?REITs trailed the broader U.S. equity market in 2025, as growth-oriented stocks, particularly those at the forefront of the AI boom, led the way. The Fund outperformed because of its unique exposure to non-REIT real estate companies, which were up over 18%. GDS, Wynn, Jones Lang LaSalle, Brookfield, Las Vegas Sands, CRH, and Toll Brothers led the way in the group. Stock selection in health care (American Healthcare, Ventas, and Welltower) and self-storage (SmartStop Self Storage) REITs also added value but was undone by stock-specific weakness in all other REIT categories where the Fund had investments. |
| Performance Past Does Not Indicate Future [Text] |
Past performance is not predictive of future performance
|
| Line Graph [Table Text Block] |
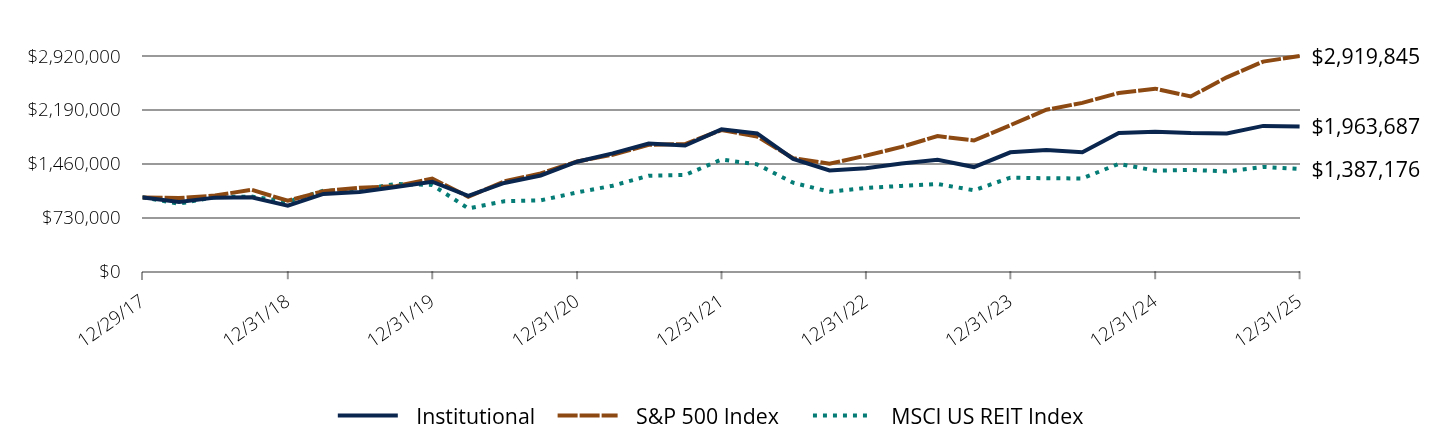
|
Institutional |
S&P 500 Index |
MSCI US REIT Index |
12/29/17 |
$1,000,000 |
$1,000,000 |
$1,000,000 |
12/31/17 |
$1,000,000 |
$1,000,000 |
$1,000,000 |
3/31/18 |
$940,000 |
$992,409 |
$916,133 |
6/30/18 |
$998,508 |
$1,026,487 |
$1,005,373 |
9/30/18 |
$1,002,593 |
$1,105,637 |
$1,013,203 |
12/31/18 |
$889,736 |
$956,158 |
$941,725 |
3/31/19 |
$1,049,110 |
$1,086,653 |
$1,091,679 |
6/30/19 |
$1,073,502 |
$1,133,421 |
$1,102,508 |
9/30/19 |
$1,142,797 |
$1,152,670 |
$1,183,848 |
12/31/19 |
$1,214,860 |
$1,257,217 |
$1,170,863 |
3/31/20 |
$1,023,575 |
$1,010,827 |
$851,959 |
6/30/20 |
$1,197,739 |
$1,218,485 |
$948,988 |
9/30/20 |
$1,299,230 |
$1,327,287 |
$961,695 |
12/31/20 |
$1,485,821 |
$1,488,530 |
$1,068,986 |
3/31/21 |
$1,598,482 |
$1,580,445 |
$1,159,809 |
6/30/21 |
$1,733,020 |
$1,715,556 |
$1,296,022 |
9/30/21 |
$1,705,139 |
$1,725,541 |
$1,305,718 |
12/31/21 |
$1,925,315 |
$1,915,818 |
$1,514,868 |
3/31/22 |
$1,869,667 |
$1,827,719 |
$1,450,033 |
6/30/22 |
$1,525,035 |
$1,533,435 |
$1,201,161 |
9/30/22 |
$1,367,663 |
$1,458,563 |
$1,077,737 |
12/31/22 |
$1,396,373 |
$1,568,846 |
$1,130,544 |
3/31/23 |
$1,462,378 |
$1,686,464 |
$1,157,559 |
6/30/23 |
$1,510,709 |
$1,833,898 |
$1,184,592 |
9/30/23 |
$1,413,162 |
$1,773,866 |
$1,097,891 |
12/31/23 |
$1,612,935 |
$1,981,259 |
$1,269,214 |
3/31/24 |
$1,644,526 |
$2,190,400 |
$1,261,331 |
6/30/24 |
$1,613,032 |
$2,284,231 |
$1,258,597 |
9/30/24 |
$1,875,084 |
$2,418,694 |
$1,457,355 |
12/31/24 |
$1,892,961 |
$2,476,964 |
$1,364,229 |
3/31/25 |
$1,874,471 |
$2,371,145 |
$1,374,575 |
6/30/25 |
$1,870,154 |
$2,630,605 |
$1,354,545 |
9/30/25 |
$1,971,653 |
$2,844,328 |
$1,415,365 |
12/31/25 |
$1,963,687 |
$2,919,845 |
$1,387,176 |
|
| Average Annual Return [Table Text Block] |
Class/Index Name |
1 Year |
5 Years |
Since Inception 12/29/2017 |
Institutional |
3.74% |
5.74% |
8.79% |
MSCI US REIT Index |
1.67% |
5.35% |
4.17% |
S&P 500 Index |
17.88% |
14.42% |
14.32% | |
| Performance Inception Date |
Dec. 29, 2017
|
| No Deduction of Taxes [Text Block] |
The performance data does not reflect the deduction of taxes that a shareholder would pay on Fund distributions or redemption of Fund shares
|
| AssetsNet |
$ 258,828,817
|
| Holdings Count | Holding |
35
|
| Advisory Fees Paid, Amount |
$ 1,589,738
|
| InvestmentCompanyPortfolioTurnover |
122.00%
|
| Additional Fund Statistics [Text Block] |
Total Net Assets |
$258,828,817 |
# of Issuers |
35 |
Portfolio Turnover Rate |
122% |
Total Advisory Fees Paid (Net of fees waived) |
$1,589,738 | |
| Holdings [Text Block] |
Sector Breakdown(as a % of net assets)*
Value |
Value |
Real Estate |
72.8% |
Financials |
9.2% |
Consumer Discretionary |
8.3% |
Materials |
2.9% |
Information Technology |
1.7% |
Industrials |
1.3% |
Cash and Cash Equivalents |
3.8%Footnote Reference† |
| Footnote |
Description |
Footnote† |
Includes other assets and liabilities-net. | |
| Largest Holdings [Text Block] |
Holding |
% of Net Assets (12/31/25)* |
Prologis, Inc. |
10.8% |
Welltower, Inc. |
10.2% |
Ventas, Inc. |
7.0% |
Simon Property Group, Inc. |
4.3% |
Brookfield Corp. |
4.0% |
Jones Lang LaSalle, Inc. |
4.0% |
EastGroup Properties, Inc. |
3.9% |
Macerich Co. |
3.7% |
Equinix, Inc. |
3.6% |
American Tower Corp. |
2.9% |
Total |
54.4% | * Individual weights may not sum to 100% (or displayed total) due to rounding. |
| Material Fund Change [Text Block] |
|
| Updated Prospectus Phone Number |
1.800.99.BARON
|
| Updated Prospectus Web Address |
BaronCapitalGroup.com
|
| C000196929 |
|
| Shareholder Report [Line Items] |
|
| Fund Name |
Baron Real Estate Income Fund
|
| Class Name |
R6
|
| Trading Symbol |
BRIUX
|
| Annual or Semi-Annual Statement [Text Block] |
This annual shareholder report contains important information about Baron Real Estate Income Fund (the Fund) for the period of January 1, 2025 to December 31, 2025.
|
| Additional Information [Text Block] |
You can find additional information about the Fund at BaronCapitalGroup.com. You can also request this information by contacting us at 1.800.99.BARON.
|
| Additional Information Phone Number |
1.800.99.BARON
|
| Additional Information Email |
<span style="box-sizing: border-box; color: rgb(0, 0, 0); display: inline; flex-wrap: nowrap; font-size: 10.6667px; font-weight: 400; grid-area: auto; line-height: 16px; margin: 0px; overflow: visible; text-align: left; text-align-last: auto; white-space-collapse: preserve-breaks;">info@BaronCapitalGroup.com</span>
|
| Additional Information Website |
BaronCapitalGroup.com
|
| Expenses [Text Block] |
What were the Fund costs for the the past 12 months?(based on a hypothetical $10,000 investment)
Class Name |
Cost of a $10,000 investment |
Costs paid as a percentage of a $10,000 investment |
R6 |
$81 |
0.80% | |
| Expenses Paid, Amount |
$ 81
|
| Expense Ratio, Percent |
0.80%
|
| Factors Affecting Performance [Text Block] |
How did the Fund perform last year and what affected its performance?REITs trailed the broader U.S. equity market in 2025, as growth-oriented stocks, particularly those at the forefront of the AI boom, led the way. The Fund outperformed because of its unique exposure to non-REIT real estate companies, which were up over 18%. GDS, Wynn, Jones Lang LaSalle, Brookfield, Las Vegas Sands, CRH, and Toll Brothers led the way in the group. Stock selection in health care (American Healthcare, Ventas, and Welltower) and self-storage (SmartStop Self Storage) REITs also added value but was undone by stock-specific weakness in all other REIT categories where the Fund had investments. |
| Performance Past Does Not Indicate Future [Text] |
Past performance is not predictive of future performance
|
| Line Graph [Table Text Block] |
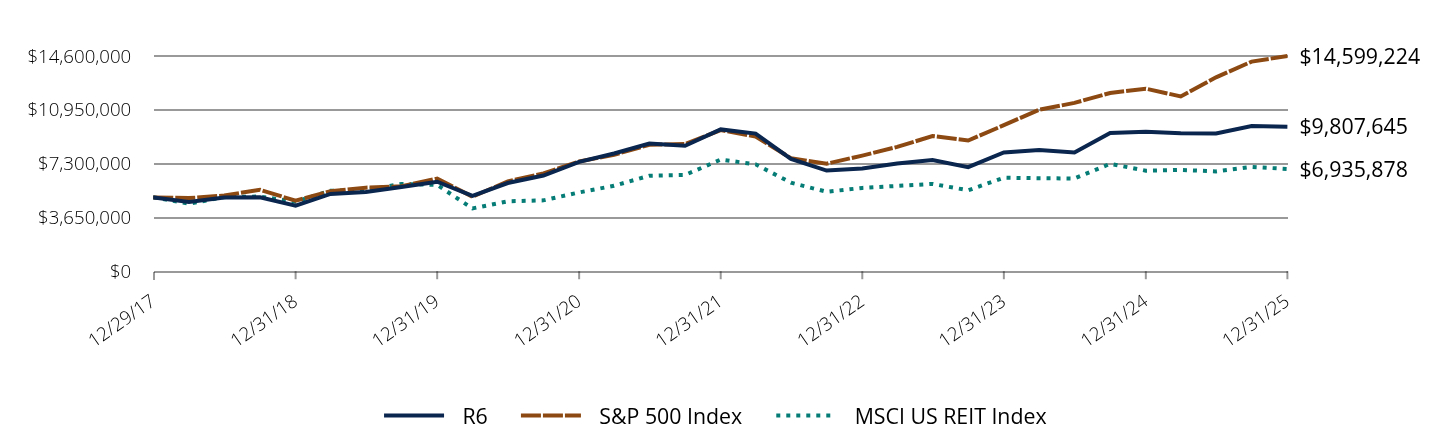
|
R6 |
S&P 500 Index |
MSCI US REIT Index |
12/29/17 |
$5,000,000 |
$5,000,000 |
$4,999,999 |
12/31/17 |
$5,000,000 |
$5,000,000 |
$4,999,999 |
3/31/18 |
$4,705,000 |
$4,962,045 |
$4,580,666 |
6/30/18 |
$4,997,538 |
$5,132,435 |
$5,026,866 |
9/30/18 |
$5,012,835 |
$5,528,185 |
$5,066,016 |
12/31/18 |
$4,448,569 |
$4,780,788 |
$4,708,624 |
3/31/19 |
$5,245,419 |
$5,433,264 |
$5,458,394 |
6/30/19 |
$5,372,526 |
$5,667,103 |
$5,512,541 |
9/30/19 |
$5,708,651 |
$5,763,348 |
$5,919,238 |
12/31/19 |
$6,068,938 |
$6,286,085 |
$5,854,314 |
3/31/20 |
$5,112,523 |
$5,054,136 |
$4,259,796 |
6/30/20 |
$5,983,322 |
$6,092,425 |
$4,744,939 |
9/30/20 |
$6,490,762 |
$6,636,436 |
$4,808,475 |
12/31/20 |
$7,423,695 |
$7,442,650 |
$5,344,932 |
3/31/21 |
$7,986,989 |
$7,902,225 |
$5,799,045 |
6/30/21 |
$8,659,665 |
$8,577,778 |
$6,480,111 |
9/30/21 |
$8,514,971 |
$8,627,704 |
$6,528,590 |
12/31/21 |
$9,621,126 |
$9,579,091 |
$7,574,341 |
3/31/22 |
$9,337,551 |
$9,138,595 |
$7,250,164 |
6/30/22 |
$7,619,763 |
$7,667,176 |
$6,005,804 |
9/30/22 |
$6,827,557 |
$7,292,816 |
$5,388,687 |
12/31/22 |
$6,976,529 |
$7,844,232 |
$5,652,722 |
3/31/23 |
$7,306,561 |
$8,432,318 |
$5,787,796 |
6/30/23 |
$7,548,221 |
$9,169,490 |
$5,922,958 |
9/30/23 |
$7,060,478 |
$8,869,332 |
$5,489,453 |
12/31/23 |
$8,053,838 |
$9,906,297 |
$6,346,071 |
3/31/24 |
$8,217,349 |
$10,952,000 |
$6,306,656 |
6/30/24 |
$8,059,895 |
$11,421,157 |
$6,292,986 |
9/30/24 |
$9,370,224 |
$12,093,469 |
$7,286,774 |
12/31/24 |
$9,453,994 |
$12,384,821 |
$6,821,147 |
3/31/25 |
$9,361,539 |
$11,855,725 |
$6,872,873 |
6/30/25 |
$9,339,954 |
$13,153,023 |
$6,772,727 |
9/30/25 |
$9,847,477 |
$14,221,641 |
$7,076,827 |
12/31/25 |
$9,807,645 |
$14,599,224 |
$6,935,878 |
|
| Average Annual Return [Table Text Block] |
Class/Index Name |
1 Year |
5 Years |
Since Inception 12/29/2017 |
R6 |
3.74% |
5.73% |
8.78% |
MSCI US REIT Index |
1.67% |
5.35% |
4.17% |
S&P 500 Index |
17.88% |
14.42% |
14.32% | |
| Performance Inception Date |
Dec. 29, 2017
|
| No Deduction of Taxes [Text Block] |
The performance data does not reflect the deduction of taxes that a shareholder would pay on Fund distributions or redemption of Fund shares
|
| AssetsNet |
$ 258,828,817
|
| Holdings Count | Holding |
35
|
| Advisory Fees Paid, Amount |
$ 1,589,738
|
| InvestmentCompanyPortfolioTurnover |
122.00%
|
| Additional Fund Statistics [Text Block] |
Total Net Assets |
$258,828,817 |
# of Issuers |
35 |
Portfolio Turnover Rate |
122% |
Total Advisory Fees Paid (Net of fees waived) |
$1,589,738 | |
| Holdings [Text Block] |
Sector Breakdown(as a % of net assets)*
Value |
Value |
Real Estate |
72.8% |
Financials |
9.2% |
Consumer Discretionary |
8.3% |
Materials |
2.9% |
Information Technology |
1.7% |
Industrials |
1.3% |
Cash and Cash Equivalents |
3.8%Footnote Reference† |
| Footnote |
Description |
Footnote† |
Includes other assets and liabilities-net. | |
| Largest Holdings [Text Block] |
Holding |
% of Net Assets (12/31/25)* |
Prologis, Inc. |
10.8% |
Welltower, Inc. |
10.2% |
Ventas, Inc. |
7.0% |
Simon Property Group, Inc. |
4.3% |
Brookfield Corp. |
4.0% |
Jones Lang LaSalle, Inc. |
4.0% |
EastGroup Properties, Inc. |
3.9% |
Macerich Co. |
3.7% |
Equinix, Inc. |
3.6% |
American Tower Corp. |
2.9% |
Total |
54.4% | * Individual weights may not sum to 100% (or displayed total) due to rounding. |
| Material Fund Change [Text Block] |
|
| Updated Prospectus Phone Number |
1.800.99.BARON
|
| Updated Prospectus Web Address |
BaronCapitalGroup.com
|
| C000200241 |
|
| Shareholder Report [Line Items] |
|
| Fund Name |
Baron Health Care Fund
|
| Class Name |
R6
|
| Trading Symbol |
BHCUX
|
| Annual or Semi-Annual Statement [Text Block] |
This annual shareholder report contains important information about Baron Health Care Fund (the Fund) for the period of January 1, 2025 to December 31, 2025.
|
| Additional Information [Text Block] |
You can find additional information about the Fund at BaronCapitalGroup.com. You can also request this information by contacting us at 1.800.99.BARON.
|
| Additional Information Phone Number |
1.800.99.BARON
|
| Additional Information Email |
<span style="box-sizing: border-box; color: rgb(0, 0, 0); display: inline; flex-wrap: nowrap; font-size: 10.6667px; font-weight: 400; grid-area: auto; line-height: 16px; margin: 0px; overflow: visible; text-align: left; text-align-last: auto; white-space-collapse: preserve-breaks;">info@BaronCapitalGroup.com</span>
|
| Additional Information Website |
BaronCapitalGroup.com
|
| Expenses [Text Block] |
What were the Fund costs for the the past 12 months?(based on a hypothetical $10,000 investment)
Class Name |
Cost of a $10,000 investment |
Costs paid as a percentage of a $10,000 investment |
R6 |
$89 |
0.85% | |
| Expenses Paid, Amount |
$ 89
|
| Expense Ratio, Percent |
0.85%
|
| Factors Affecting Performance [Text Block] |
How did the Fund perform last year and what affected its performance?Health Care struggled to keep pace with the broader U.S. equity market for a third straight year, with most of the weakness coming in May, June, and July when the sector trailed the Russell 3000 Index by approximately 20%. Health Care performance was hampered by multiple factors, including regulatory uncertainty, federal investigations involving sector heavyweight UnitedHealth, cancellations/delays of National Institutes of Health grants for academic research, concerns about tariffs on the pharmaceutical industry, and renewed investor interest in AI-driven technology companies. Against this challenging backdrop, the Fund trailed the Index due to a combination of disappointing stock selection and lower exposure to strong-performing mega cap pharmaceutical stocks. |
| Performance Past Does Not Indicate Future [Text] |
Past performance is not predictive of future performance
|
| Line Graph [Table Text Block] |
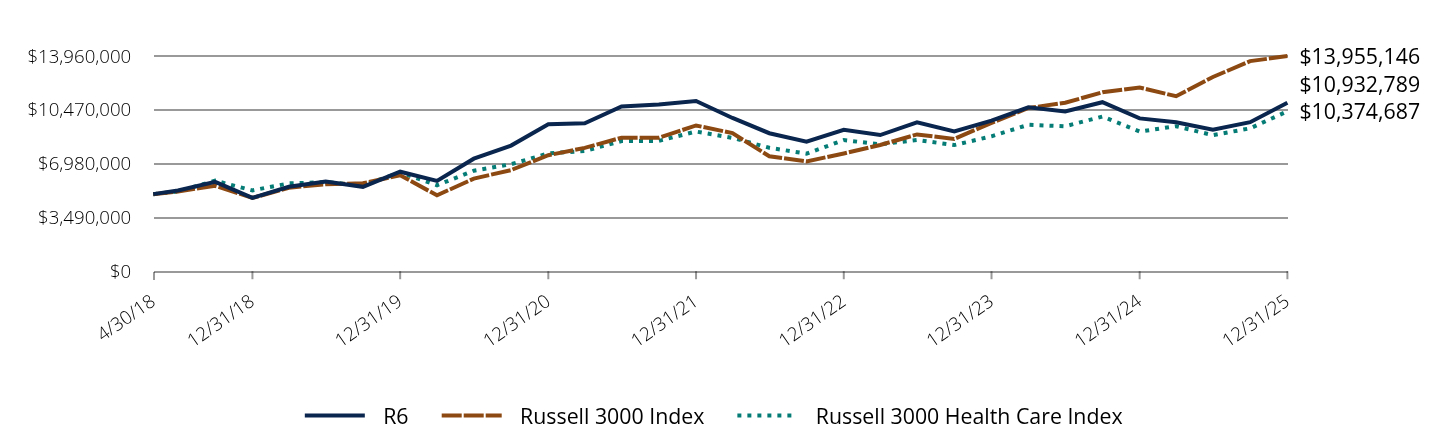
|
R6 |
Russell 3000 Index |
Russell 3000 Health Care Index |
4/30/18 |
$5,000,000 |
$5,000,000 |
$5,000,000 |
6/30/18 |
$5,240,000 |
$5,174,774 |
$5,169,101 |
9/30/18 |
$5,800,000 |
$5,543,421 |
$5,872,428 |
12/31/18 |
$4,760,000 |
$4,750,590 |
$5,242,465 |
3/31/19 |
$5,475,000 |
$5,417,737 |
$5,697,244 |
6/30/19 |
$5,825,000 |
$5,639,597 |
$5,778,840 |
9/30/19 |
$5,475,000 |
$5,705,159 |
$5,570,154 |
12/31/19 |
$6,455,000 |
$6,224,177 |
$6,401,579 |
3/31/20 |
$5,855,000 |
$4,923,343 |
$5,576,793 |
6/30/20 |
$7,300,000 |
$6,007,835 |
$6,517,950 |
9/30/20 |
$8,150,000 |
$6,561,008 |
$6,940,235 |
12/31/20 |
$9,537,612 |
$7,524,270 |
$7,639,687 |
3/31/21 |
$9,598,264 |
$8,001,829 |
$7,803,056 |
6/30/21 |
$10,690,010 |
$8,661,163 |
$8,439,848 |
9/30/21 |
$10,816,260 |
$8,652,354 |
$8,454,091 |
12/31/21 |
$11,043,325 |
$9,455,081 |
$9,060,627 |
3/31/22 |
$9,941,043 |
$8,955,999 |
$8,647,788 |
6/30/22 |
$8,951,553 |
$7,460,243 |
$8,005,630 |
9/30/22 |
$8,408,103 |
$7,127,173 |
$7,627,711 |
12/31/22 |
$9,177,137 |
$7,639,050 |
$8,508,021 |
3/31/23 |
$8,833,635 |
$8,187,557 |
$8,229,641 |
6/30/23 |
$9,653,938 |
$8,874,231 |
$8,512,817 |
9/30/23 |
$9,069,472 |
$8,585,479 |
$8,182,555 |
12/31/23 |
$9,766,729 |
$9,621,905 |
$8,751,949 |
3/31/24 |
$10,633,174 |
$10,585,958 |
$9,497,668 |
6/30/24 |
$10,361,449 |
$10,926,401 |
$9,400,994 |
9/30/24 |
$10,963,688 |
$11,607,022 |
$10,034,642 |
12/31/24 |
$9,913,151 |
$11,912,668 |
$9,056,080 |
3/31/25 |
$9,660,816 |
$11,350,158 |
$9,406,654 |
6/30/25 |
$9,171,596 |
$12,597,681 |
$8,824,260 |
9/30/25 |
$9,665,966 |
$13,627,690 |
$9,269,650 |
12/31/25 |
$10,932,789 |
$13,955,146 |
$10,374,687 |
|
| Average Annual Return [Table Text Block] |
Class/Index Name |
1 Year |
5 Years |
Since Inception 4/30/2018 |
R6 |
10.29% |
2.77% |
10.73% |
Russell 3000 Health Care Index |
14.56% |
6.31% |
9.98% |
Russell 3000 Index |
17.15% |
13.15% |
14.32% | |
| Performance Inception Date |
Apr. 30, 2018
|
| No Deduction of Taxes [Text Block] |
The performance data does not reflect the deduction of taxes that a shareholder would pay on Fund distributions or redemption of Fund shares
|
| AssetsNet |
$ 143,988,886
|
| Holdings Count | Holding |
43
|
| Advisory Fees Paid, Amount |
$ 994,776
|
| InvestmentCompanyPortfolioTurnover |
74.00%
|
| Additional Fund Statistics [Text Block] |
Total Net Assets |
$143,988,886 |
# of Issuers |
43 |
Portfolio Turnover Rate |
74% |
Total Advisory Fees Paid (Net of fees waived) |
$994,776 | |
| Holdings [Text Block] |
Sector Breakdown(as a % of net assets)*
Value |
Value |
Health Care |
94.7% |
Real Estate |
1.0% |
Cash and Cash Equivalents |
4.3%Footnote Reference† |
| Footnote |
Description |
Footnote† |
Includes other assets and liabilities-net. | |
| Largest Holdings [Text Block] |
Holding |
% of Net Assets (12/31/25)* |
Eli Lilly & Co. |
11.4% |
argenx SE |
6.8% |
Thermo Fisher Scientific, Inc. |
5.2% |
Insmed, Inc. |
4.6% |
AstraZeneca PLC |
4.0% |
AbbVie, Inc. |
3.9% |
Mettler-Toledo International, Inc. |
3.4% |
Intuitive Surgical, Inc. |
3.3% |
Boston Scientific Corp. |
3.1% |
Danaher Corp. |
3.1% |
Total |
48.8% | * Individual weights may not sum to 100% (or displayed total) due to rounding. |
| Material Fund Change [Text Block] |
|
| Updated Prospectus Phone Number |
1.800.99.BARON
|
| Updated Prospectus Web Address |
BaronCapitalGroup.com
|
| C000200239 |
|
| Shareholder Report [Line Items] |
|
| Fund Name |
Baron Health Care Fund
|
| Class Name |
Retail
|
| Trading Symbol |
BHCFX
|
| Annual or Semi-Annual Statement [Text Block] |
This annual shareholder report contains important information about Baron Health Care Fund (the Fund) for the period of January 1, 2025 to December 31, 2025.
|
| Additional Information [Text Block] |
You can find additional information about the Fund at BaronCapitalGroup.com. You can also request this information by contacting us at 1.800.99.BARON.
|
| Additional Information Phone Number |
1.800.99.BARON
|
| Additional Information Email |
<span style="box-sizing: border-box; color: rgb(0, 0, 0); display: inline; flex-wrap: nowrap; font-size: 10.6667px; font-weight: 400; grid-area: auto; line-height: 16px; margin: 0px; overflow: visible; text-align: left; text-align-last: auto; white-space-collapse: preserve-breaks;">info@BaronCapitalGroup.com</span>
|
| Additional Information Website |
BaronCapitalGroup.com
|
| Expenses [Text Block] |
What were the Fund costs for the the past 12 months?(based on a hypothetical $10,000 investment)
Class Name |
Cost of a $10,000 investment |
Costs paid as a percentage of a $10,000 investment |
Retail |
$116 |
1.10% | |
| Expenses Paid, Amount |
$ 116
|
| Expense Ratio, Percent |
1.10%
|
| Factors Affecting Performance [Text Block] |
How did the Fund perform last year and what affected its performance?Health Care struggled to keep pace with the broader U.S. equity market for a third straight year, with most of the weakness coming in May, June, and July when the sector trailed the Russell 3000 Index by approximately 20%. Health Care performance was hampered by multiple factors, including regulatory uncertainty, federal investigations involving sector heavyweight UnitedHealth, cancellations/delays of National Institutes of Health grants for academic research, concerns about tariffs on the pharmaceutical industry, and renewed investor interest in AI-driven technology companies. Against this challenging backdrop, the Fund trailed the Index due to a combination of disappointing stock selection and lower exposure to strong-performing mega cap pharmaceutical stocks. |
| Performance Past Does Not Indicate Future [Text] |
Past performance is not predictive of future performance
|
| Line Graph [Table Text Block] |
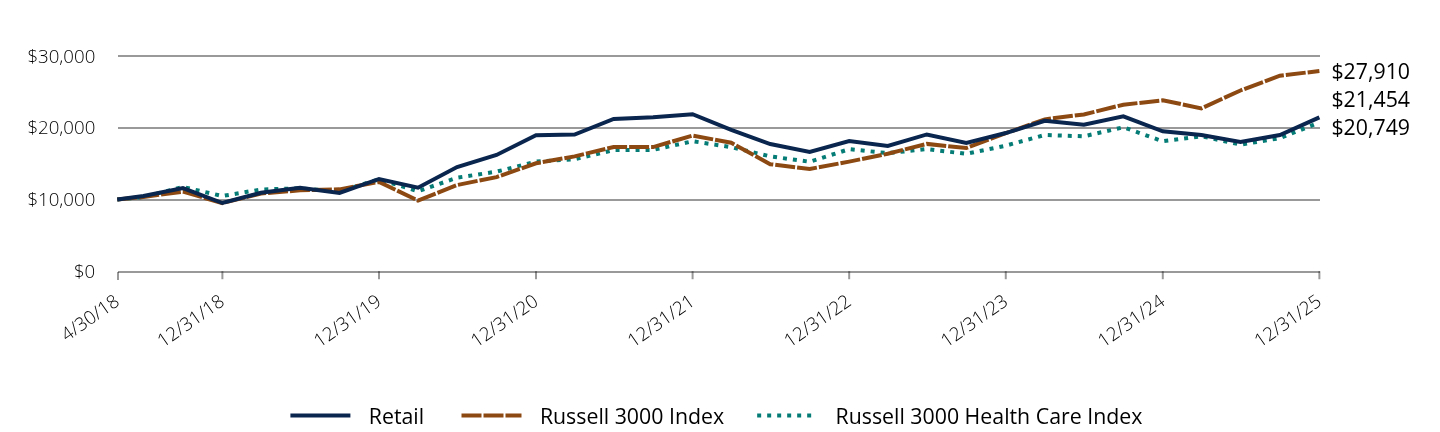
|
Retail |
Russell 3000 Index |
Russell 3000 Health Care Index |
4/30/18 |
$10,000 |
$10,000 |
$10,000 |
6/30/18 |
$10,480 |
$10,350 |
$10,338 |
9/30/18 |
$11,590 |
$11,087 |
$11,745 |
12/31/18 |
$9,510 |
$9,501 |
$10,485 |
3/31/19 |
$10,930 |
$10,835 |
$11,394 |
6/30/19 |
$11,620 |
$11,279 |
$11,558 |
9/30/19 |
$10,910 |
$11,410 |
$11,140 |
12/31/19 |
$12,860 |
$12,448 |
$12,803 |
3/31/20 |
$11,650 |
$9,847 |
$11,154 |
6/30/20 |
$14,520 |
$12,016 |
$13,036 |
9/30/20 |
$16,200 |
$13,122 |
$13,880 |
12/31/20 |
$18,955 |
$15,049 |
$15,279 |
3/31/21 |
$19,056 |
$16,004 |
$15,606 |
6/30/21 |
$21,220 |
$17,322 |
$16,880 |
9/30/21 |
$21,452 |
$17,305 |
$16,908 |
12/31/21 |
$21,886 |
$18,910 |
$18,121 |
3/31/22 |
$19,691 |
$17,912 |
$17,296 |
6/30/22 |
$17,722 |
$14,920 |
$16,011 |
9/30/22 |
$16,635 |
$14,254 |
$15,255 |
12/31/22 |
$18,142 |
$15,278 |
$17,016 |
3/31/23 |
$17,455 |
$16,375 |
$16,459 |
6/30/23 |
$19,065 |
$17,748 |
$17,026 |
9/30/23 |
$17,896 |
$17,171 |
$16,365 |
12/31/23 |
$19,260 |
$19,244 |
$17,504 |
3/31/24 |
$20,963 |
$21,172 |
$18,995 |
6/30/24 |
$20,419 |
$21,853 |
$18,802 |
9/30/24 |
$21,588 |
$23,214 |
$20,069 |
12/31/24 |
$19,502 |
$23,825 |
$18,112 |
3/31/25 |
$18,988 |
$22,700 |
$18,813 |
6/30/25 |
$18,022 |
$25,195 |
$17,649 |
9/30/25 |
$18,988 |
$27,255 |
$18,539 |
12/31/25 |
$21,454 |
$27,910 |
$20,749 |
|
| Average Annual Return [Table Text Block] |
Class/Index Name |
1 Year |
5 Years |
Since Inception 4/30/2018 |
Retail |
10.01% |
2.51% |
10.46% |
Russell 3000 Health Care Index |
14.56% |
6.31% |
9.98% |
Russell 3000 Index |
17.15% |
13.15% |
14.32% | |
| Performance Inception Date |
Apr. 30, 2018
|
| No Deduction of Taxes [Text Block] |
The performance data does not reflect the deduction of taxes that a shareholder would pay on Fund distributions or redemption of Fund shares
|
| AssetsNet |
$ 143,988,886
|
| Holdings Count | Holding |
43
|
| Advisory Fees Paid, Amount |
$ 994,776
|
| InvestmentCompanyPortfolioTurnover |
74.00%
|
| Additional Fund Statistics [Text Block] |
Total Net Assets |
$143,988,886 |
# of Issuers |
43 |
Portfolio Turnover Rate |
74% |
Total Advisory Fees Paid (Net of fees waived) |
$994,776 | |
| Holdings [Text Block] |
Sector Breakdown(as a % of net assets)*
Value |
Value |
Health Care |
94.7% |
Real Estate |
1.0% |
Cash and Cash Equivalents |
4.3%Footnote Reference† |
| Footnote |
Description |
Footnote† |
Includes other assets and liabilities-net. | |
| Largest Holdings [Text Block] |
Holding |
% of Net Assets (12/31/25)* |
Eli Lilly & Co. |
11.4% |
argenx SE |
6.8% |
Thermo Fisher Scientific, Inc. |
5.2% |
Insmed, Inc. |
4.6% |
AstraZeneca PLC |
4.0% |
AbbVie, Inc. |
3.9% |
Mettler-Toledo International, Inc. |
3.4% |
Intuitive Surgical, Inc. |
3.3% |
Boston Scientific Corp. |
3.1% |
Danaher Corp. |
3.1% |
Total |
48.8% | * Individual weights may not sum to 100% (or displayed total) due to rounding. |
| Material Fund Change [Text Block] |
|
| Updated Prospectus Phone Number |
1.800.99.BARON
|
| Updated Prospectus Web Address |
BaronCapitalGroup.com
|
| C000200240 |
|
| Shareholder Report [Line Items] |
|
| Fund Name |
Baron Health Care Fund
|
| Class Name |
Institutional
|
| Trading Symbol |
BHCHX
|
| Annual or Semi-Annual Statement [Text Block] |
This annual shareholder report contains important information about Baron Health Care Fund (the Fund) for the period of January 1, 2025 to December 31, 2025.
|
| Additional Information [Text Block] |
You can find additional information about the Fund at BaronCapitalGroup.com. You can also request this information by contacting us at 1.800.99.BARON.
|
| Additional Information Phone Number |
1.800.99.BARON
|
| Additional Information Email |
<span style="box-sizing: border-box; color: rgb(0, 0, 0); display: inline; flex-wrap: nowrap; font-size: 10.6667px; font-weight: 400; grid-area: auto; line-height: 16px; margin: 0px; overflow: visible; text-align: left; text-align-last: auto; white-space-collapse: preserve-breaks;">info@BaronCapitalGroup.com</span>
|
| Additional Information Website |
BaronCapitalGroup.com
|
| Expenses [Text Block] |
What were the Fund costs for the the past 12 months?(based on a hypothetical $10,000 investment)
Class Name |
Cost of a $10,000 investment |
Costs paid as a percentage of a $10,000 investment |
Institutional |
$89 |
0.85% | |
| Expenses Paid, Amount |
$ 89
|
| Expense Ratio, Percent |
0.85%
|
| Factors Affecting Performance [Text Block] |
How did the Fund perform last year and what affected its performance?Health Care struggled to keep pace with the broader U.S. equity market for a third straight year, with most of the weakness coming in May, June, and July when the sector trailed the Russell 3000 Index by approximately 20%. Health Care performance was hampered by multiple factors, including regulatory uncertainty, federal investigations involving sector heavyweight UnitedHealth, cancellations/delays of National Institutes of Health grants for academic research, concerns about tariffs on the pharmaceutical industry, and renewed investor interest in AI-driven technology companies. Against this challenging backdrop, the Fund trailed the Index due to a combination of disappointing stock selection and lower exposure to strong-performing mega cap pharmaceutical stocks. |
| Performance Past Does Not Indicate Future [Text] |
Past performance is not predictive of future performance
|
| Line Graph [Table Text Block] |
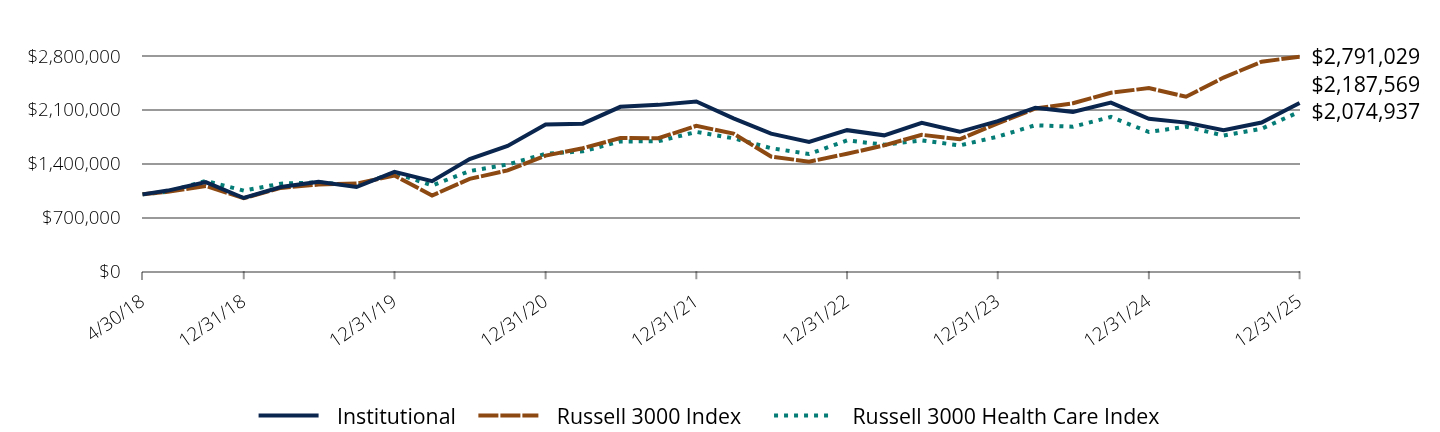
|
Institutional |
Russell 3000 Index |
Russell 3000 Health Care Index |
4/30/18 |
$1,000,000 |
$1,000,000 |
$1,000,000 |
6/30/18 |
$1,049,000 |
$1,034,955 |
$1,033,820 |
9/30/18 |
$1,160,000 |
$1,108,684 |
$1,174,486 |
12/31/18 |
$953,000 |
$950,118 |
$1,048,493 |
3/31/19 |
$1,096,000 |
$1,083,547 |
$1,139,449 |
6/30/19 |
$1,165,000 |
$1,127,919 |
$1,155,768 |
9/30/19 |
$1,095,000 |
$1,141,032 |
$1,114,031 |
12/31/19 |
$1,292,000 |
$1,244,835 |
$1,280,316 |
3/31/20 |
$1,171,000 |
$984,669 |
$1,115,359 |
6/30/20 |
$1,460,000 |
$1,201,567 |
$1,303,590 |
9/30/20 |
$1,630,000 |
$1,312,202 |
$1,388,047 |
12/31/20 |
$1,908,533 |
$1,504,854 |
$1,527,937 |
3/31/21 |
$1,919,653 |
$1,600,366 |
$1,560,611 |
6/30/21 |
$2,139,013 |
$1,732,233 |
$1,687,970 |
9/30/21 |
$2,164,263 |
$1,730,471 |
$1,690,818 |
12/31/21 |
$2,208,650 |
$1,891,016 |
$1,812,125 |
3/31/22 |
$1,989,221 |
$1,791,200 |
$1,729,558 |
6/30/22 |
$1,790,299 |
$1,492,049 |
$1,601,126 |
9/30/22 |
$1,682,635 |
$1,425,435 |
$1,525,542 |
12/31/22 |
$1,835,415 |
$1,527,810 |
$1,701,604 |
3/31/23 |
$1,767,741 |
$1,637,511 |
$1,645,928 |
6/30/23 |
$1,930,775 |
$1,774,846 |
$1,702,563 |
9/30/23 |
$1,813,882 |
$1,717,096 |
$1,636,511 |
12/31/23 |
$1,953,333 |
$1,924,381 |
$1,750,390 |
3/31/24 |
$2,127,646 |
$2,117,192 |
$1,899,534 |
6/30/24 |
$2,073,301 |
$2,185,280 |
$1,880,199 |
9/30/24 |
$2,193,748 |
$2,321,404 |
$2,006,928 |
12/31/24 |
$1,983,643 |
$2,382,534 |
$1,811,216 |
3/31/25 |
$1,933,176 |
$2,270,032 |
$1,881,331 |
6/30/25 |
$1,835,333 |
$2,519,536 |
$1,764,852 |
9/30/25 |
$1,934,206 |
$2,725,538 |
$1,853,930 |
12/31/25 |
$2,187,569 |
$2,791,029 |
$2,074,937 |
|
| Average Annual Return [Table Text Block] |
Class/Index Name |
1 Year |
5 Years |
Since Inception 4/30/2018 |
Institutional |
10.28% |
2.77% |
10.74% |
Russell 3000 Health Care Index |
14.56% |
6.31% |
9.98% |
Russell 3000 Index |
17.15% |
13.15% |
14.32% | |
| Performance Inception Date |
Apr. 30, 2018
|
| No Deduction of Taxes [Text Block] |
The performance data does not reflect the deduction of taxes that a shareholder would pay on Fund distributions or redemption of Fund shares
|
| AssetsNet |
$ 143,988,886
|
| Holdings Count | Holding |
43
|
| Advisory Fees Paid, Amount |
$ 994,776
|
| InvestmentCompanyPortfolioTurnover |
74.00%
|
| Additional Fund Statistics [Text Block] |
Total Net Assets |
$143,988,886 |
# of Issuers |
43 |
Portfolio Turnover Rate |
74% |
Total Advisory Fees Paid (Net of fees waived) |
$994,776 | |
| Holdings [Text Block] |
Sector Breakdown(as a % of net assets)*
Value |
Value |
Health Care |
94.7% |
Real Estate |
1.0% |
Cash and Cash Equivalents |
4.3%Footnote Reference† |
| Footnote |
Description |
Footnote† |
Includes other assets and liabilities-net. | |
| Largest Holdings [Text Block] |
Holding |
% of Net Assets (12/31/25)* |
Eli Lilly & Co. |
11.4% |
argenx SE |
6.8% |
Thermo Fisher Scientific, Inc. |
5.2% |
Insmed, Inc. |
4.6% |
AstraZeneca PLC |
4.0% |
AbbVie, Inc. |
3.9% |
Mettler-Toledo International, Inc. |
3.4% |
Intuitive Surgical, Inc. |
3.3% |
Boston Scientific Corp. |
3.1% |
Danaher Corp. |
3.1% |
Total |
48.8% | * Individual weights may not sum to 100% (or displayed total) due to rounding. |
| Material Fund Change [Text Block] |
|
| Updated Prospectus Phone Number |
1.800.99.BARON
|
| Updated Prospectus Web Address |
BaronCapitalGroup.com
|
| C000227029 |
|
| Shareholder Report [Line Items] |
|
| Fund Name |
Baron India Fund
|
| Class Name |
Retail
|
| Trading Symbol |
BINRX
|
| Annual or Semi-Annual Statement [Text Block] |
This annual shareholder report contains important information about Baron India Fund (the Fund) for the period of January 1, 2025 to December 31, 2025.
|
| Additional Information [Text Block] |
You can find additional information about the Fund at BaronCapitalGroup.com. You can also request this information by contacting us at 1.800.99.BARON.
|
| Additional Information Phone Number |
1.800.99.BARON
|
| Additional Information Email |
<span style="box-sizing: border-box; color: rgb(0, 0, 0); display: inline; flex-wrap: nowrap; font-size: 10.6667px; font-weight: 400; grid-area: auto; line-height: 16px; margin: 0px; overflow: visible; text-align: left; text-align-last: auto; white-space-collapse: preserve-breaks;">info@BaronCapitalGroup.com</span>
|
| Additional Information Website |
BaronCapitalGroup.com
|
| Expenses [Text Block] |
What were the Fund costs for the the past 12 months?(based on a hypothetical $10,000 investment)
Class Name |
Cost of a $10,000 investment |
Costs paid as a percentage of a $10,000 investment |
Retail |
$145 |
1.45% | |
| Expenses Paid, Amount |
$ 145
|
| Expense Ratio, Percent |
1.45%
|
| Factors Affecting Performance [Text Block] |
How did the Fund perform last year and what affected its performance?After delivering stellar performance over the 2020 to 2024 period, Indian equities experienced a phase of consolidation in 2025, driven by a temporary deceleration in economic growth and a related loss of earnings momentum. The Fund trailed the Index for the year with most of the underperformance coming in the fourth quarter when the breadth of equity returns narrowed in favor of large caps and value-oriented equities significantly outpaced growth peers. Consequently, the Fund’s sizable exposure to SMID-cap stocks and growth-oriented investment bias were key drags on relative performance. |
| Performance Past Does Not Indicate Future [Text] |
Past performance is not predictive of future performance
|
| Line Graph [Table Text Block] |
|
Retail |
MSCI Emerging Markets Index |
MSCI AC Asia ex Japan/India Linked Index |
MSCI India Index |
7/30/21 |
$10,000 |
$10,000 |
$10,000 |
$10,000 |
9/30/21 |
$10,370 |
$9,854 |
$9,802 |
$11,161 |
12/31/21 |
$10,170 |
$9,725 |
$9,681 |
$11,137 |
3/31/22 |
$8,610 |
$9,046 |
$8,907 |
$10,930 |
6/30/22 |
$7,920 |
$8,011 |
$8,105 |
$9,439 |
9/30/22 |
$6,950 |
$7,084 |
$6,984 |
$10,052 |
12/31/22 |
$7,400 |
$7,771 |
$7,776 |
$10,251 |
3/31/23 |
$7,610 |
$8,078 |
$8,114 |
$9,600 |
6/30/23 |
$7,770 |
$8,151 |
$8,012 |
$10,775 |
9/30/23 |
$7,370 |
$7,912 |
$7,744 |
$11,068 |
12/31/23 |
$7,810 |
$8,535 |
$8,242 |
$12,384 |
3/31/24 |
$8,310 |
$8,713 |
$8,437 |
$13,136 |
6/30/24 |
$9,200 |
$9,173 |
$9,045 |
$14,477 |
9/30/24 |
$9,772 |
$9,974 |
$9,403 |
$15,531 |
12/31/24 |
$9,181 |
$9,175 |
$8,339 |
$13,773 |
3/31/25 |
$8,901 |
$9,444 |
$8,092 |
$13,366 |
6/30/25 |
$9,712 |
$10,576 |
$8,839 |
$14,599 |
9/30/25 |
$9,091 |
$11,701 |
$8,167 |
$13,489 |
12/31/25 |
$9,123 |
$12,255 |
$8,557 |
$14,134 |
|
| Average Annual Return [Table Text Block] |
Class/Index Name |
1 Year |
Since Inception 7/30/2021 |
Retail |
(0.63)% |
(2.05)% |
MSCI AC Asia ex Japan/India Linked Index |
2.62% |
(3.46)% |
MSCI India Index |
2.62% |
8.13% |
MSCI Emerging Markets Index |
33.57% |
4.70% | |
| Performance Inception Date |
Jul. 30, 2021
|
| No Deduction of Taxes [Text Block] |
The performance data does not reflect the deduction of taxes that a shareholder would pay on Fund distributions or redemption of Fund shares
|
| AssetsNet |
$ 25,384,873
|
| Holdings Count | Holding |
38
|
| Advisory Fees Paid, Amount |
$ 0
|
| InvestmentCompanyPortfolioTurnover |
35.00%
|
| Additional Fund Statistics [Text Block] |
Total Net Assets |
$25,384,873 |
# of Issuers |
38 |
Portfolio Turnover Rate |
35% |
Total Advisory Fees Paid (Net of fees waived) |
$0 | |
| Holdings [Text Block] |
Sector Breakdown(as a % of net assets)*
Value |
Value |
Financials |
30.4% |
Industrials |
17.8% |
Consumer Discretionary |
10.5% |
Health Care |
8.9% |
Communication Services |
8.2% |
Information Technology |
7.5% |
Energy |
6.7% |
Utilities |
2.1% |
Consumer Staples |
2.0% |
Real Estate |
0.6% |
Materials |
0.4% |
Cash and Cash Equivalents |
4.9%Footnote Reference† |
| Footnote |
Description |
Footnote† |
Includes other assets and liabilities-net. | |
| Largest Holdings [Text Block] |
Holding |
% of Net Assets (12/31/25)* |
HDFC Bank Ltd. |
7.9% |
Bharti Airtel Ltd. PP |
7.4% |
Reliance Industries Limited |
6.7% |
Precision Wires India Ltd. |
4.8% |
ICICI Bank Ltd. |
4.4% |
Bajaj Finance Limited |
4.3% |
Max Healthcare Institute Ltd. |
4.3% |
Eternal Ltd. |
3.9% |
Aster DM Healthcare Ltd. |
3.0% |
Mahindra & Mahindra Ltd. |
3.0% |
Total |
49.8% | * Individual weights may not sum to 100% (or displayed total) due to rounding. |
| Material Fund Change [Text Block] |
|
| Updated Prospectus Phone Number |
1.800.99.BARON
|
| Updated Prospectus Web Address |
BaronCapitalGroup.com
|
| C000227030 |
|
| Shareholder Report [Line Items] |
|
| Fund Name |
Baron India Fund
|
| Class Name |
Institutional
|
| Trading Symbol |
BINDX
|
| Annual or Semi-Annual Statement [Text Block] |
This annual shareholder report contains important information about Baron India Fund (the Fund) for the period of January 1, 2025 to December 31, 2025.
|
| Additional Information [Text Block] |
You can find additional information about the Fund at BaronCapitalGroup.com. You can also request this information by contacting us at 1.800.99.BARON.
|
| Additional Information Phone Number |
1.800.99.BARON
|
| Additional Information Email |
<span style="box-sizing: border-box; color: rgb(0, 0, 0); display: inline; flex-wrap: nowrap; font-size: 10.6667px; font-weight: 400; grid-area: auto; line-height: 16px; margin: 0px; overflow: visible; text-align: left; text-align-last: auto; white-space-collapse: preserve-breaks;">info@BaronCapitalGroup.com</span>
|
| Additional Information Website |
BaronCapitalGroup.com
|
| Expenses [Text Block] |
What were the Fund costs for the the past 12 months?(based on a hypothetical $10,000 investment)
Class Name |
Cost of a $10,000 investment |
Costs paid as a percentage of a $10,000 investment |
Institutional |
$120 |
1.20% | |
| Expenses Paid, Amount |
$ 120
|
| Expense Ratio, Percent |
1.20%
|
| Factors Affecting Performance [Text Block] |
How did the Fund perform last year and what affected its performance?After delivering stellar performance over the 2020 to 2024 period, Indian equities experienced a phase of consolidation in 2025, driven by a temporary deceleration in economic growth and a related loss of earnings momentum. The Fund trailed the Index for the year with most of the underperformance coming in the fourth quarter when the breadth of equity returns narrowed in favor of large caps and value-oriented equities significantly outpaced growth peers. Consequently, the Fund’s sizable exposure to SMID-cap stocks and growth-oriented investment bias were key drags on relative performance. |
| Performance Past Does Not Indicate Future [Text] |
Past performance is not predictive of future performance
|
| Line Graph [Table Text Block] |
|
Institutional |
MSCI Emerging Markets Index |
MSCI AC Asia ex Japan/India Linked Index |
MSCI India Index |
7/30/21 |
$1,000,000 |
$1,000,000 |
$1,000,000 |
$1,000,000 |
9/30/21 |
$1,037,000 |
$985,394 |
$980,150 |
$1,116,115 |
12/31/21 |
$1,017,000 |
$972,470 |
$968,070 |
$1,113,710 |
3/31/22 |
$862,000 |
$904,641 |
$890,690 |
$1,093,020 |
6/30/22 |
$794,000 |
$801,061 |
$810,480 |
$943,873 |
9/30/22 |
$697,000 |
$708,359 |
$698,360 |
$1,005,184 |
12/31/22 |
$743,000 |
$777,088 |
$777,640 |
$1,025,124 |
3/31/23 |
$764,000 |
$807,828 |
$811,390 |
$960,030 |
6/30/23 |
$780,000 |
$815,075 |
$801,170 |
$1,077,480 |
9/30/23 |
$741,000 |
$791,232 |
$774,380 |
$1,106,751 |
12/31/23 |
$786,000 |
$853,461 |
$824,150 |
$1,238,417 |
3/31/24 |
$836,000 |
$871,297 |
$843,740 |
$1,313,580 |
6/30/24 |
$926,000 |
$917,349 |
$904,470 |
$1,447,661 |
9/30/24 |
$984,645 |
$997,365 |
$940,330 |
$1,553,144 |
12/31/24 |
$925,486 |
$917,505 |
$833,870 |
$1,377,295 |
3/31/25 |
$898,413 |
$944,366 |
$809,240 |
$1,336,631 |
6/30/25 |
$980,634 |
$1,057,577 |
$883,880 |
$1,459,915 |
9/30/25 |
$918,467 |
$1,170,135 |
$816,650 |
$1,348,862 |
12/31/25 |
$922,368 |
$1,225,476 |
$855,710 |
$1,413,372 |
|
| Average Annual Return [Table Text Block] |
Class/Index Name |
1 Year |
Since Inception 7/30/2021 |
Institutional |
(0.34)% |
(1.81)% |
MSCI AC Asia ex Japan/India Linked Index |
2.62% |
(3.46)% |
MSCI India Index |
2.62% |
8.13% |
MSCI Emerging Markets Index |
33.57% |
4.70% | |
| Performance Inception Date |
Jul. 30, 2021
|
| No Deduction of Taxes [Text Block] |
The performance data does not reflect the deduction of taxes that a shareholder would pay on Fund distributions or redemption of Fund shares
|
| AssetsNet |
$ 25,384,873
|
| Holdings Count | Holding |
38
|
| Advisory Fees Paid, Amount |
$ 0
|
| InvestmentCompanyPortfolioTurnover |
35.00%
|
| Additional Fund Statistics [Text Block] |
Total Net Assets |
$25,384,873 |
# of Issuers |
38 |
Portfolio Turnover Rate |
35% |
Total Advisory Fees Paid (Net of fees waived) |
$0 | |
| Holdings [Text Block] |
Sector Breakdown(as a % of net assets)*
Value |
Value |
Financials |
30.4% |
Industrials |
17.8% |
Consumer Discretionary |
10.5% |
Health Care |
8.9% |
Communication Services |
8.2% |
Information Technology |
7.5% |
Energy |
6.7% |
Utilities |
2.1% |
Consumer Staples |
2.0% |
Real Estate |
0.6% |
Materials |
0.4% |
Cash and Cash Equivalents |
4.9%Footnote Reference† |
| Footnote |
Description |
Footnote† |
Includes other assets and liabilities-net. | |
| Largest Holdings [Text Block] |
Holding |
% of Net Assets (12/31/25)* |
HDFC Bank Ltd. |
7.9% |
Bharti Airtel Ltd. PP |
7.4% |
Reliance Industries Limited |
6.7% |
Precision Wires India Ltd. |
4.8% |
ICICI Bank Ltd. |
4.4% |
Bajaj Finance Limited |
4.3% |
Max Healthcare Institute Ltd. |
4.3% |
Eternal Ltd. |
3.9% |
Aster DM Healthcare Ltd. |
3.0% |
Mahindra & Mahindra Ltd. |
3.0% |
Total |
49.8% | * Individual weights may not sum to 100% (or displayed total) due to rounding. |
| Material Fund Change [Text Block] |
|
| Updated Prospectus Phone Number |
1.800.99.BARON
|
| Updated Prospectus Web Address |
BaronCapitalGroup.com
|
| C000227028 |
|
| Shareholder Report [Line Items] |
|
| Fund Name |
Baron India Fund
|
| Class Name |
R6
|
| Trading Symbol |
BINUX
|
| Annual or Semi-Annual Statement [Text Block] |
This annual shareholder report contains important information about Baron India Fund (the Fund) for the period of January 1, 2025 to December 31, 2025.
|
| Additional Information [Text Block] |
You can find additional information about the Fund at BaronCapitalGroup.com. You can also request this information by contacting us at 1.800.99.BARON.
|
| Additional Information Phone Number |
1.800.99.BARON
|
| Additional Information Email |
<span style="box-sizing: border-box; color: rgb(0, 0, 0); display: inline; flex-wrap: nowrap; font-size: 10.6667px; font-weight: 400; grid-area: auto; line-height: 16px; margin: 0px; overflow: visible; text-align: left; text-align-last: auto; white-space-collapse: preserve-breaks;">info@BaronCapitalGroup.com</span>
|
| Additional Information Website |
BaronCapitalGroup.com
|
| Expenses [Text Block] |
What were the Fund costs for the the past 12 months?(based on a hypothetical $10,000 investment)
Class Name |
Cost of a $10,000 investment |
Costs paid as a percentage of a $10,000 investment |
R6 |
$120 |
1.20% | |
| Expenses Paid, Amount |
$ 120
|
| Expense Ratio, Percent |
1.20%
|
| Factors Affecting Performance [Text Block] |
How did the Fund perform last year and what affected its performance?After delivering stellar performance over the 2020 to 2024 period, Indian equities experienced a phase of consolidation in 2025, driven by a temporary deceleration in economic growth and a related loss of earnings momentum. The Fund trailed the Index for the year with most of the underperformance coming in the fourth quarter when the breadth of equity returns narrowed in favor of large caps and value-oriented equities significantly outpaced growth peers. Consequently, the Fund’s sizable exposure to SMID-cap stocks and growth-oriented investment bias were key drags on relative performance. |
| Performance Past Does Not Indicate Future [Text] |
Past performance is not predictive of future performance
|
| Line Graph [Table Text Block] |
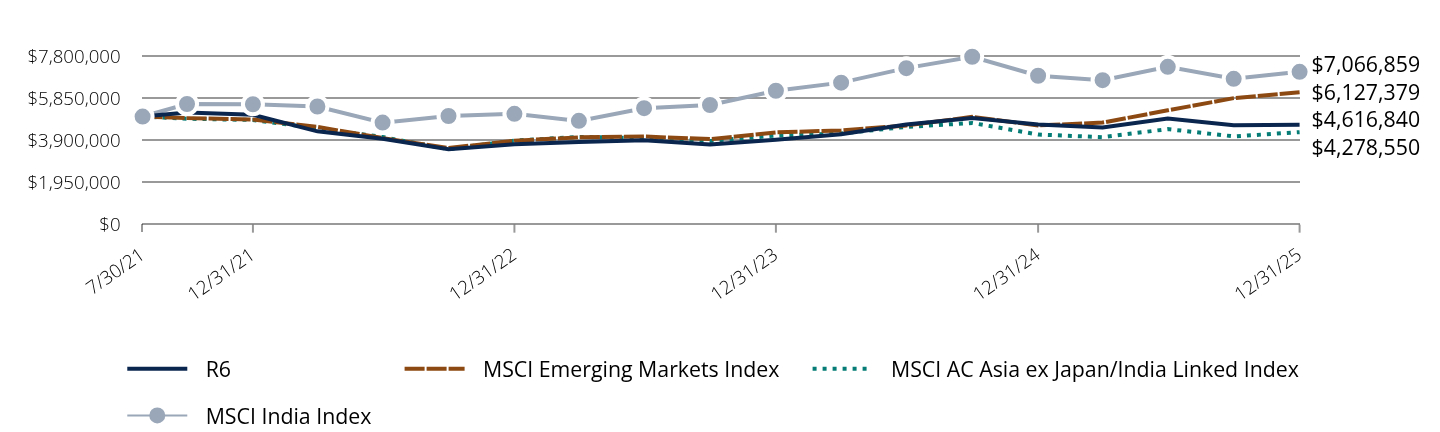
|
R6 |
MSCI Emerging Markets Index |
MSCI AC Asia ex Japan/India Linked Index |
MSCI India Index |
7/30/21 |
$5,000,000 |
$5,000,000 |
$5,000,000 |
$5,000,000 |
9/30/21 |
$5,185,000 |
$4,926,972 |
$4,900,750 |
$5,580,573 |
12/31/21 |
$5,085,000 |
$4,862,349 |
$4,840,350 |
$5,568,552 |
3/31/22 |
$4,315,000 |
$4,523,204 |
$4,453,450 |
$5,465,098 |
6/30/22 |
$3,975,000 |
$4,005,307 |
$4,052,400 |
$4,719,364 |
9/30/22 |
$3,490,000 |
$3,541,794 |
$3,491,800 |
$5,025,918 |
12/31/22 |
$3,715,000 |
$3,885,438 |
$3,888,200 |
$5,125,622 |
3/31/23 |
$3,825,000 |
$4,039,141 |
$4,056,950 |
$4,800,152 |
6/30/23 |
$3,905,000 |
$4,075,373 |
$4,005,850 |
$5,387,398 |
9/30/23 |
$3,710,000 |
$3,956,159 |
$3,871,900 |
$5,533,755 |
12/31/23 |
$3,930,000 |
$4,267,304 |
$4,120,750 |
$6,192,083 |
3/31/24 |
$4,185,000 |
$4,356,485 |
$4,218,700 |
$6,567,901 |
6/30/24 |
$4,635,000 |
$4,586,747 |
$4,522,350 |
$7,238,306 |
9/30/24 |
$4,928,225 |
$4,986,824 |
$4,701,650 |
$7,765,719 |
12/31/24 |
$4,632,431 |
$4,587,527 |
$4,169,350 |
$6,886,477 |
3/31/25 |
$4,497,068 |
$4,721,832 |
$4,046,200 |
$6,683,155 |
6/30/25 |
$4,908,171 |
$5,287,886 |
$4,419,400 |
$7,299,573 |
9/30/25 |
$4,592,324 |
$5,850,674 |
$4,083,250 |
$6,744,312 |
12/31/25 |
$4,616,840 |
$6,127,379 |
$4,278,550 |
$7,066,859 |
|
| Average Annual Return [Table Text Block] |
Class/Index Name |
1 Year |
Since Inception 7/30/2021 |
R6 |
(0.34)% |
(1.79)% |
MSCI AC Asia ex Japan/India Linked Index |
2.62% |
(3.46)% |
MSCI India Index |
2.62% |
8.13% |
MSCI Emerging Markets Index |
33.57% |
4.70% | |
| Performance Inception Date |
Jul. 30, 2021
|
| No Deduction of Taxes [Text Block] |
The performance data does not reflect the deduction of taxes that a shareholder would pay on Fund distributions or redemption of Fund shares
|
| AssetsNet |
$ 25,384,873
|
| Holdings Count | Holding |
38
|
| Advisory Fees Paid, Amount |
$ 0
|
| InvestmentCompanyPortfolioTurnover |
35.00%
|
| Additional Fund Statistics [Text Block] |
Total Net Assets |
$25,384,873 |
# of Issuers |
38 |
Portfolio Turnover Rate |
35% |
Total Advisory Fees Paid (Net of fees waived) |
$0 | |
| Holdings [Text Block] |
Sector Breakdown(as a % of net assets)*
Value |
Value |
Financials |
30.4% |
Industrials |
17.8% |
Consumer Discretionary |
10.5% |
Health Care |
8.9% |
Communication Services |
8.2% |
Information Technology |
7.5% |
Energy |
6.7% |
Utilities |
2.1% |
Consumer Staples |
2.0% |
Real Estate |
0.6% |
Materials |
0.4% |
Cash and Cash Equivalents |
4.9%Footnote Reference† |
| Footnote |
Description |
Footnote† |
Includes other assets and liabilities-net. | |
| Largest Holdings [Text Block] |
Holding |
% of Net Assets (12/31/25)* |
HDFC Bank Ltd. |
7.9% |
Bharti Airtel Ltd. PP |
7.4% |
Reliance Industries Limited |
6.7% |
Precision Wires India Ltd. |
4.8% |
ICICI Bank Ltd. |
4.4% |
Bajaj Finance Limited |
4.3% |
Max Healthcare Institute Ltd. |
4.3% |
Eternal Ltd. |
3.9% |
Aster DM Healthcare Ltd. |
3.0% |
Mahindra & Mahindra Ltd. |
3.0% |
Total |
49.8% | * Individual weights may not sum to 100% (or displayed total) due to rounding. |
| Material Fund Change [Text Block] |
|
| Updated Prospectus Phone Number |
1.800.99.BARON
|
| Updated Prospectus Web Address |
BaronCapitalGroup.com
|
| C000196932 |
|
| Shareholder Report [Line Items] |
|
| Fund Name |
Baron WealthBuilder Fund
|
| Class Name |
Retail
|
| Trading Symbol |
BWBFX
|
| Annual or Semi-Annual Statement [Text Block] |
This annual shareholder report contains important information about Baron WealthBuilder Fund (the Fund) for the period of January 1, 2025 to December 31, 2025.
|
| Additional Information [Text Block] |
You can find additional information about the Fund at BaronCapitalGroup.com. You can also request this information by contacting us at 1.800.99.BARON.
|
| Additional Information Phone Number |
1.800.99.BARON
|
| Additional Information Email |
<span style="box-sizing: border-box; color: rgb(0, 0, 0); display: inline; flex-wrap: nowrap; font-size: 10.6667px; font-weight: 400; grid-area: auto; line-height: 16px; margin: 0px; overflow: visible; text-align: left; text-align-last: auto; white-space-collapse: preserve-breaks;">info@BaronCapitalGroup.com</span>
|
| Additional Information Website |
BaronCapitalGroup.com
|
| Expenses [Text Block] |
What were the Fund costs for the the past 12 months?(based on a hypothetical $10,000 investment)
Class Name |
Cost of a $10,000 investment |
Costs paid as a percentage of a $10,000 investment |
Retail |
$31 |
0.30% | |
| Expenses Paid, Amount |
$ 31
|
| Expense Ratio, Percent |
0.30%
|
| Factors Affecting Performance [Text Block] |
How did the Fund perform last year and what affected its performance?Global equities rose sharply for a third consecutive year, overcoming a swift selloff early in the period related to investor concerns about President Trump’s new tariff policies. Tariff-related fears diminished as the year wore on and the AI boom and a series of U.S. Federal Reserve rate cuts helped push markets to new record highs. Smaller cap growth stocks trailed large caps for a fifth straight year. Given this backdrop, the Fund underperformed largely due to its elevated exposure to small- and mid-cap growth stocks via positions in Baron Growth, Small Cap, Discovery, and Asset, which together accounted for approximately 40% of average assets. Exposure to Baron Real Estate, Real Estate Income, and Health Care that are heavily invested in certain sectors that were out of favor during the year (Real Estate, REITs, and Health Care) and lower exposure to the prime beneficiaries of AI (semiconductors) also proved costly. |
| Performance Past Does Not Indicate Future [Text] |
Past performance is not predictive of future performance
|
| Line Graph [Table Text Block] |
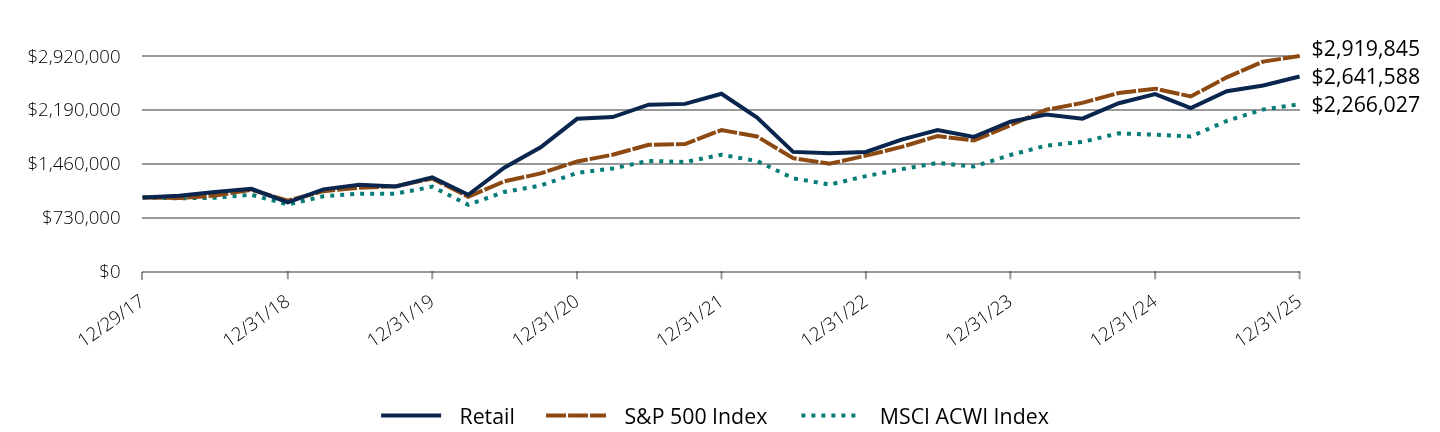
|
Retail |
S&P 500 Index |
MSCI ACWI Index |
12/29/17 |
$1,000,000 |
$1,000,000 |
$1,000,000 |
3/31/18 |
$1,024,000 |
$992,409 |
$989,664 |
6/30/18 |
$1,074,000 |
$1,026,487 |
$995,669 |
9/30/18 |
$1,118,000 |
$1,105,637 |
$1,038,252 |
12/31/18 |
$934,233 |
$956,158 |
$905,856 |
3/31/19 |
$1,110,466 |
$1,086,653 |
$1,016,144 |
6/30/19 |
$1,174,550 |
$1,133,421 |
$1,052,846 |
9/30/19 |
$1,148,952 |
$1,152,670 |
$1,052,574 |
12/31/19 |
$1,272,797 |
$1,257,217 |
$1,146,790 |
3/31/20 |
$1,037,595 |
$1,010,827 |
$901,776 |
6/30/20 |
$1,403,927 |
$1,218,485 |
$1,075,088 |
9/30/20 |
$1,681,127 |
$1,327,287 |
$1,162,495 |
12/31/20 |
$2,067,630 |
$1,488,530 |
$1,333,199 |
3/31/21 |
$2,091,931 |
$1,580,445 |
$1,394,145 |
6/30/21 |
$2,258,862 |
$1,715,556 |
$1,497,218 |
9/30/21 |
$2,270,484 |
$1,725,541 |
$1,481,433 |
12/31/21 |
$2,407,218 |
$1,915,818 |
$1,580,339 |
3/31/22 |
$2,083,427 |
$1,827,719 |
$1,495,620 |
6/30/22 |
$1,618,954 |
$1,533,435 |
$1,261,399 |
9/30/22 |
$1,601,533 |
$1,458,563 |
$1,175,375 |
12/31/22 |
$1,618,828 |
$1,568,846 |
$1,290,125 |
3/31/23 |
$1,786,015 |
$1,686,464 |
$1,384,380 |
6/30/23 |
$1,916,305 |
$1,833,898 |
$1,469,897 |
9/30/23 |
$1,821,758 |
$1,773,866 |
$1,419,882 |
12/31/23 |
$2,029,300 |
$1,981,259 |
$1,576,557 |
3/31/24 |
$2,127,306 |
$2,190,400 |
$1,704,877 |
6/30/24 |
$2,069,656 |
$2,284,231 |
$1,754,721 |
9/30/24 |
$2,279,504 |
$2,418,694 |
$1,870,776 |
12/31/24 |
$2,404,029 |
$2,476,964 |
$1,852,277 |
3/31/25 |
$2,213,782 |
$2,371,145 |
$1,827,743 |
6/30/25 |
$2,442,078 |
$2,630,605 |
$2,038,420 |
9/30/25 |
$2,519,519 |
$2,844,328 |
$2,193,804 |
12/31/25 |
$2,641,588 |
$2,919,845 |
$2,266,027 |
|
| Average Annual Return [Table Text Block] |
Class/Index Name |
1 Year |
5 Years |
Since Inception 12/29/2017 |
Retail |
9.88% |
5.02% |
12.91% |
S&P 500 Index |
17.88% |
14.42% |
14.33% |
MSCI ACWI Index |
22.34% |
11.19% |
10.77% | |
| Performance Inception Date |
Dec. 29, 2017
|
| No Deduction of Taxes [Text Block] |
The performance data does not reflect the deduction of taxes that a shareholder would pay on Fund distributions or redemption of Fund shares
|
| AssetsNet |
$ 559,087,397
|
| Holdings Count | Holding |
18
|
| Advisory Fees Paid, Amount |
$ 0
|
| InvestmentCompanyPortfolioTurnover |
11.00%
|
| Additional Fund Statistics [Text Block] |
Total Net Assets |
$559,087,397 |
# of Issuers |
18 |
Portfolio Turnover Rate |
11% |
Total Advisory Fees Paid |
$0 | |
| Holdings [Text Block] |
Sector Breakdown(as a % of net assets)*Footnote Reference*
|
|
Consumer Discretionary |
20.3% |
Financials |
20.1% |
Information Technology |
19.0% |
Industrials |
16.8% |
Health Care |
9.8% |
Real Estate |
7.0% |
Communication Services |
5.2% |
Materials |
1.1% |
Consumer Staples |
0.4% |
Energy |
0.1% |
Utilities |
0.0%Footnote Reference‡ |
Unclassified |
0.0%Footnote Reference‡ | * Individual weights may not sum to 100% (or displayed total) due to rounding.
| Footnote |
Description |
Footnote‡ |
Rounds to less than 0.1%. |
Footnote* |
Individual weights may not sum to 100% (or displayed total) due torounding. | Country Exposures(as a % of net assets)*
Value |
Value |
United States |
86.1% |
Canada |
1.7% |
Taiwan |
1.4% |
China |
1.4% |
India |
1.3% |
Netherlands |
1.1% |
Sweden |
0.9% |
Korea,Republic of |
0.8% |
Germany |
0.6% |
Other |
4.5% | |
| Material Fund Change [Text Block] |
|
| Updated Prospectus Phone Number |
1.800.99.BARON
|
| Updated Prospectus Web Address |
BaronCapitalGroup.com
|
| C000198571 |
|
| Shareholder Report [Line Items] |
|
| Fund Name |
Baron WealthBuilder Fund
|
| Class Name |
TA Shares
|
| Trading Symbol |
BWBTX
|
| Annual or Semi-Annual Statement [Text Block] |
This annual shareholder report contains important information about Baron WealthBuilder Fund (the Fund) for the period of January 1, 2025 to December 31, 2025.
|
| Additional Information [Text Block] |
You can find additional information about the Fund at BaronCapitalGroup.com. You can also request this information by contacting us at 1.800.99.BARON.
|
| Additional Information Phone Number |
1.800.99.BARON
|
| Additional Information Email |
<span style="box-sizing: border-box; color: rgb(0, 0, 0); display: inline; flex-wrap: nowrap; font-size: 10.6667px; font-weight: 400; grid-area: auto; line-height: 16px; margin: 0px; overflow: visible; text-align: left; text-align-last: auto; white-space-collapse: preserve-breaks;">info@BaronCapitalGroup.com</span>
|
| Additional Information Website |
BaronCapitalGroup.com
|
| Expenses [Text Block] |
What were the Fund costs for the the past 12 months?(based on a hypothetical $10,000 investment)
Class Name |
Cost of a $10,000 investment |
Costs paid as a percentage of a $10,000 investment |
TA Shares |
$5 |
0.05% | |
| Expenses Paid, Amount |
$ 5
|
| Expense Ratio, Percent |
0.05%
|
| Factors Affecting Performance [Text Block] |
How did the Fund perform last year and what affected its performance?Global equities rose sharply for a third consecutive year, overcoming a swift selloff early in the period related to investor concerns about President Trump’s new tariff policies. Tariff-related fears diminished as the year wore on and the AI boom and a series of U.S. Federal Reserve rate cuts helped push markets to new record highs. Smaller cap growth stocks trailed large caps for a fifth straight year. Given this backdrop, the Fund underperformed largely due to its elevated exposure to small- and mid-cap growth stocks via positions in Baron Growth, Small Cap, Discovery, and Asset, which together accounted for approximately 40% of average assets. Exposure to Baron Real Estate, Real Estate Income, and Health Care that are heavily invested in certain sectors that were out of favor during the year (Real Estate, REITs, and Health Care) and lower exposure to the prime beneficiaries of AI (semiconductors) also proved costly. |
| Performance Past Does Not Indicate Future [Text] |
Past performance is not predictive of future performance
|
| Line Graph [Table Text Block] |
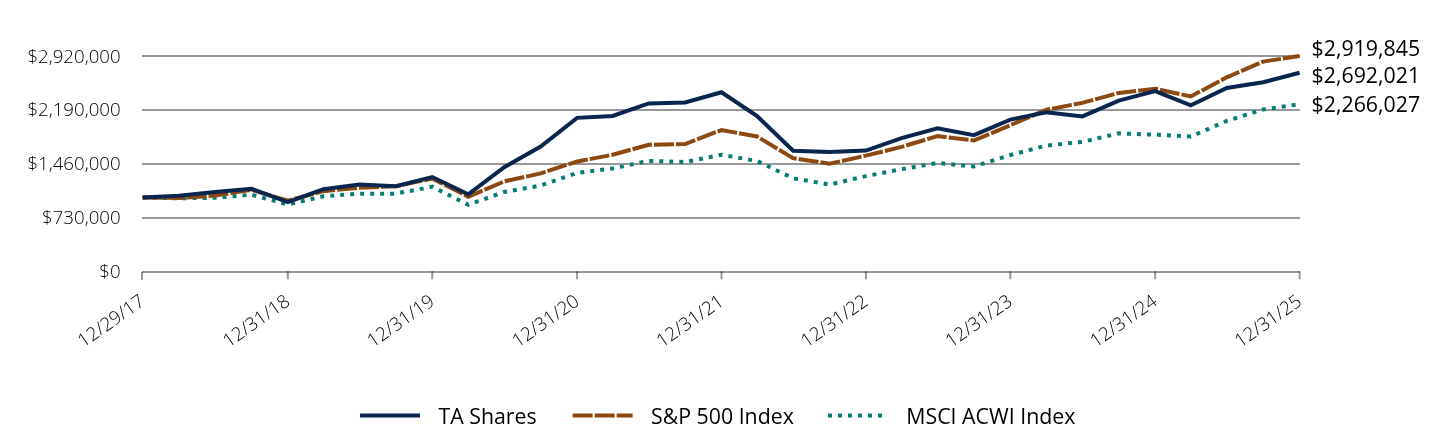
|
TA Shares |
S&P 500 Index |
MSCI ACWI Index |
12/29/17 |
$1,000,000 |
$1,000,000 |
$1,000,000 |
3/31/18 |
$1,024,000 |
$992,409 |
$989,664 |
6/30/18 |
$1,074,000 |
$1,026,487 |
$995,669 |
9/30/18 |
$1,120,000 |
$1,105,637 |
$1,038,252 |
12/31/18 |
$936,233 |
$956,158 |
$905,856 |
3/31/19 |
$1,113,467 |
$1,086,653 |
$1,016,144 |
6/30/19 |
$1,177,551 |
$1,133,421 |
$1,052,846 |
9/30/19 |
$1,152,953 |
$1,152,670 |
$1,052,574 |
12/31/19 |
$1,277,822 |
$1,257,217 |
$1,146,790 |
3/31/20 |
$1,042,652 |
$1,010,827 |
$901,776 |
6/30/20 |
$1,412,055 |
$1,218,485 |
$1,075,088 |
9/30/20 |
$1,691,304 |
$1,327,287 |
$1,162,495 |
12/31/20 |
$2,080,889 |
$1,488,530 |
$1,333,199 |
3/31/21 |
$2,106,240 |
$1,580,445 |
$1,394,145 |
6/30/21 |
$2,276,302 |
$1,715,556 |
$1,497,218 |
9/30/21 |
$2,288,978 |
$1,725,541 |
$1,481,433 |
12/31/21 |
$2,428,402 |
$1,915,818 |
$1,580,339 |
3/31/22 |
$2,103,648 |
$1,827,719 |
$1,495,620 |
6/30/22 |
$1,634,931 |
$1,533,435 |
$1,261,399 |
9/30/22 |
$1,618,636 |
$1,458,563 |
$1,175,375 |
12/31/22 |
$1,637,069 |
$1,568,846 |
$1,290,125 |
3/31/23 |
$1,806,420 |
$1,686,464 |
$1,384,380 |
6/30/23 |
$1,940,059 |
$1,833,898 |
$1,469,897 |
9/30/23 |
$1,846,205 |
$1,773,866 |
$1,419,882 |
12/31/23 |
$2,057,102 |
$1,981,259 |
$1,576,557 |
3/31/24 |
$2,157,364 |
$2,190,400 |
$1,704,877 |
6/30/24 |
$2,100,894 |
$2,284,231 |
$1,754,721 |
9/30/24 |
$2,314,676 |
$2,418,694 |
$1,870,776 |
12/31/24 |
$2,442,629 |
$2,476,964 |
$1,852,277 |
3/31/25 |
$2,251,276 |
$2,371,145 |
$1,827,743 |
6/30/25 |
$2,485,280 |
$2,630,605 |
$2,038,420 |
9/30/25 |
$2,564,926 |
$2,844,328 |
$2,193,804 |
12/31/25 |
$2,692,021 |
$2,919,845 |
$2,266,027 |
|
| Average Annual Return [Table Text Block] |
Class/Index Name |
1 Year |
5 Years |
Since Inception 12/29/2017 |
TA Shares |
10.21% |
5.28% |
13.18% |
S&P 500 Index |
17.88% |
14.42% |
14.33% |
MSCI ACWI Index |
22.34% |
11.19% |
10.77% | |
| Performance Inception Date |
Dec. 29, 2017
|
| No Deduction of Taxes [Text Block] |
The performance data does not reflect the deduction of taxes that a shareholder would pay on Fund distributions or redemption of Fund shares
|
| AssetsNet |
$ 559,087,397
|
| Holdings Count | Holding |
18
|
| Advisory Fees Paid, Amount |
$ 0
|
| InvestmentCompanyPortfolioTurnover |
11.00%
|
| Additional Fund Statistics [Text Block] |
Total Net Assets |
$559,087,397 |
# of Issuers |
18 |
Portfolio Turnover Rate |
11% |
Total Advisory Fees Paid |
$0 | |
| Holdings [Text Block] |
Sector Breakdown(as a % of net assets)*Footnote Reference*
|
|
Consumer Discretionary |
20.3% |
Financials |
20.1% |
Information Technology |
19.0% |
Industrials |
16.8% |
Health Care |
9.8% |
Real Estate |
7.0% |
Communication Services |
5.2% |
Materials |
1.1% |
Consumer Staples |
0.4% |
Energy |
0.1% |
Utilities |
0.0%Footnote Reference‡ |
Unclassified |
0.0%Footnote Reference‡ | * Individual weights may not sum to 100% (or displayed total) due to rounding.
| Footnote |
Description |
Footnote‡ |
Rounds to less than 0.1%. |
Footnote* |
Individual weights may not sum to 100% (or displayed total) due torounding. | Country Exposures(as a % of net assets)*
Value |
Value |
United States |
86.1% |
Canada |
1.7% |
Taiwan |
1.4% |
China |
1.4% |
India |
1.3% |
Netherlands |
1.1% |
Sweden |
0.9% |
Korea,Republic of |
0.8% |
Germany |
0.6% |
Other |
4.5% | |
| Material Fund Change [Text Block] |
|
| Updated Prospectus Phone Number |
1.800.99.BARON
|
| Updated Prospectus Web Address |
BaronCapitalGroup.com
|
| C000196933 |
|
| Shareholder Report [Line Items] |
|
| Fund Name |
Baron WealthBuilder Fund
|
| Class Name |
Institutional
|
| Trading Symbol |
BWBIX
|
| Annual or Semi-Annual Statement [Text Block] |
This annual shareholder report contains important information about Baron WealthBuilder Fund (the Fund) for the period of January 1, 2025 to December 31, 2025.
|
| Additional Information [Text Block] |
You can find additional information about the Fund at BaronCapitalGroup.com. You can also request this information by contacting us at 1.800.99.BARON.
|
| Additional Information Phone Number |
1.800.99.BARON
|
| Additional Information Email |
<span style="box-sizing: border-box; color: rgb(0, 0, 0); display: inline; flex-wrap: nowrap; font-size: 10.6667px; font-weight: 400; grid-area: auto; line-height: 16px; margin: 0px; overflow: visible; text-align: left; text-align-last: auto; white-space-collapse: preserve-breaks;">info@BaronCapitalGroup.com</span>
|
| Additional Information Website |
BaronCapitalGroup.com
|
| Expenses [Text Block] |
What were the Fund costs for the the past 12 months?(based on a hypothetical $10,000 investment)
Class Name |
Cost of a $10,000 investment |
Costs paid as a percentage of a $10,000 investment |
Institutional |
$5 |
0.05% | |
| Expenses Paid, Amount |
$ 5
|
| Expense Ratio, Percent |
0.05%
|
| Factors Affecting Performance [Text Block] |
How did the Fund perform last year and what affected its performance?Global equities rose sharply for a third consecutive year, overcoming a swift selloff early in the period related to investor concerns about President Trump’s new tariff policies. Tariff-related fears diminished as the year wore on and the AI boom and a series of U.S. Federal Reserve rate cuts helped push markets to new record highs. Smaller cap growth stocks trailed large caps for a fifth straight year. Given this backdrop, the Fund underperformed largely due to its elevated exposure to small- and mid-cap growth stocks via positions in Baron Growth, Small Cap, Discovery, and Asset, which together accounted for approximately 40% of average assets. Exposure to Baron Real Estate, Real Estate Income, and Health Care that are heavily invested in certain sectors that were out of favor during the year (Real Estate, REITs, and Health Care) and lower exposure to the prime beneficiaries of AI (semiconductors) also proved costly. |
| Performance Past Does Not Indicate Future [Text] |
Past performance is not predictive of future performance
|
| Line Graph [Table Text Block] |
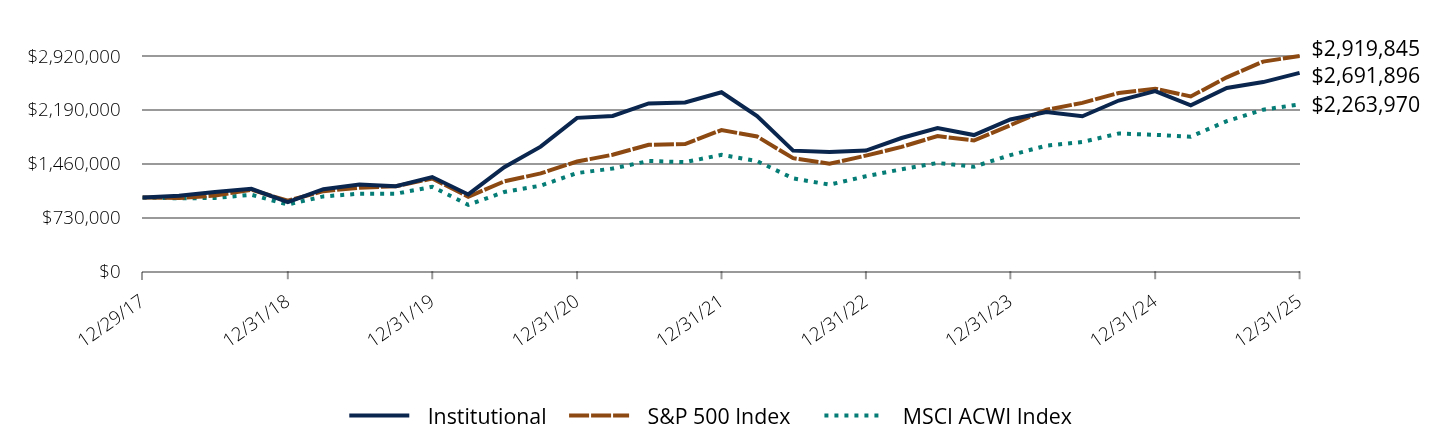
|
Institutional |
S&P 500 Index |
MSCI ACWI Index |
12/29/17 |
$1,000,000 |
$1,000,000 |
$1,000,000 |
12/31/17 |
$1,000,000 |
$1,000,000 |
$999,092 |
3/31/18 |
$1,024,000 |
$992,409 |
$988,766 |
6/30/18 |
$1,074,000 |
$1,026,487 |
$994,765 |
9/30/18 |
$1,119,000 |
$1,105,637 |
$1,037,310 |
12/31/18 |
$936,233 |
$956,158 |
$905,034 |
3/31/19 |
$1,112,465 |
$1,086,653 |
$1,015,222 |
6/30/19 |
$1,177,551 |
$1,133,421 |
$1,051,890 |
9/30/19 |
$1,152,993 |
$1,152,670 |
$1,051,618 |
12/31/19 |
$1,277,865 |
$1,257,217 |
$1,145,749 |
3/31/20 |
$1,041,648 |
$1,010,827 |
$900,957 |
6/30/20 |
$1,411,063 |
$1,218,485 |
$1,074,112 |
9/30/20 |
$1,690,310 |
$1,327,287 |
$1,161,440 |
12/31/20 |
$2,080,960 |
$1,488,530 |
$1,331,989 |
3/31/21 |
$2,107,368 |
$1,580,445 |
$1,392,879 |
6/30/21 |
$2,276,380 |
$1,715,556 |
$1,495,859 |
9/30/21 |
$2,289,056 |
$1,725,541 |
$1,480,088 |
12/31/21 |
$2,428,424 |
$1,915,818 |
$1,578,904 |
3/31/22 |
$2,103,667 |
$1,827,719 |
$1,494,262 |
6/30/22 |
$1,636,062 |
$1,533,435 |
$1,260,253 |
9/30/22 |
$1,618,614 |
$1,458,563 |
$1,174,308 |
12/31/22 |
$1,637,047 |
$1,568,846 |
$1,288,954 |
3/31/23 |
$1,807,549 |
$1,686,464 |
$1,383,123 |
6/30/23 |
$1,941,185 |
$1,833,898 |
$1,468,562 |
9/30/23 |
$1,847,333 |
$1,773,866 |
$1,418,593 |
12/31/23 |
$2,058,227 |
$1,981,259 |
$1,575,126 |
3/31/24 |
$2,158,488 |
$2,190,400 |
$1,703,329 |
6/30/24 |
$2,102,019 |
$2,284,231 |
$1,753,128 |
9/30/24 |
$2,315,798 |
$2,418,694 |
$1,869,077 |
12/31/24 |
$2,443,749 |
$2,476,964 |
$1,850,595 |
3/31/25 |
$2,251,246 |
$2,371,145 |
$1,826,083 |
6/30/25 |
$2,486,399 |
$2,630,605 |
$2,036,569 |
9/30/25 |
$2,566,044 |
$2,844,328 |
$2,191,813 |
12/31/25 |
$2,691,896 |
$2,919,845 |
$2,263,970 |
|
| Average Annual Return [Table Text Block] |
Class/Index Name |
1 Year |
5 Years |
Since Inception 12/29/2017 |
Institutional |
10.15% |
5.28% |
13.16% |
S&P 500 Index |
17.88% |
14.42% |
14.32% |
MSCI ACWI Index |
22.34% |
11.19% |
10.76% | |
| Performance Inception Date |
Dec. 29, 2017
|
| No Deduction of Taxes [Text Block] |
The performance data does not reflect the deduction of taxes that a shareholder would pay on Fund distributions or redemption of Fund shares
|
| AssetsNet |
$ 559,087,397
|
| Holdings Count | Holding |
18
|
| Advisory Fees Paid, Amount |
$ 0
|
| InvestmentCompanyPortfolioTurnover |
11.00%
|
| Additional Fund Statistics [Text Block] |
Total Net Assets |
$559,087,397 |
# of Issuers |
18 |
Portfolio Turnover Rate |
11% |
Total Advisory Fees Paid |
$0 | |
| Holdings [Text Block] |
Sector Breakdown(as a % of net assets)*Footnote Reference*
|
|
Consumer Discretionary |
20.3% |
Financials |
20.1% |
Information Technology |
19.0% |
Industrials |
16.8% |
Health Care |
9.8% |
Real Estate |
7.0% |
Communication Services |
5.2% |
Materials |
1.1% |
Consumer Staples |
0.4% |
Energy |
0.1% |
Utilities |
0.0%Footnote Reference‡ |
Unclassified |
0.0%Footnote Reference‡ | * Individual weights may not sum to 100% (or displayed total) due to rounding.
| Footnote |
Description |
Footnote‡ |
Rounds to less than 0.1%. |
Footnote* |
Individual weights may not sum to 100% (or displayed total) due torounding. | Country Exposures(as a % of net assets)*
Value |
Value |
United States |
86.1% |
Canada |
1.7% |
Taiwan |
1.4% |
China |
1.4% |
India |
1.3% |
Netherlands |
1.1% |
Sweden |
0.9% |
Korea,Republic of |
0.8% |
Germany |
0.6% |
Other |
4.5% | |
| Material Fund Change [Text Block] |
|
| Updated Prospectus Phone Number |
1.800.99.BARON
|
| Updated Prospectus Web Address |
BaronCapitalGroup.com
|