Shareholder Report
|
12 Months Ended |
|
Dec. 31, 2025
USD ($)
Holding
|
|---|
| Shareholder Report [Line Items] |
|
| Document Type |
N-CSR
|
| Amendment Flag |
false
|
| Registrant Name |
VALUE LINE ASSET ALLOCATION FUND INC
|
| Entity Central Index Key |
0000904170
|
| Entity Investment Company Type |
N-1A
|
| Document Period End Date |
Dec. 31, 2025
|
| Shareholder Report Annual or Semi-Annual |
Annual Shareholder Report
|
| C000162154 |
|
| Shareholder Report [Line Items] |
|
| Fund Name |
Value Line Asset Allocation Fund, Inc.
|
| Class Name |
Institutional
|
| Trading Symbol |
VLAIX
|
| Annual or Semi-Annual Statement [Text Block] |
This annual shareholder report contains important information about Value Line Asset Allocation Fund, Inc. (the "Fund") for the period of January 1, 2025 to December 31, 2025.
|
| Additional Information [Text Block] |
You can find additional information about the Fund at www.vlfunds.com. You can also request this information by contacting us at 1-800-243-2729 or investorservices@vlfunds.com.
|
| Additional Information Phone Number |
1-800-243-2729
|
| Additional Information Email |
<span style="box-sizing: border-box; color: rgb(0, 0, 0); display: inline; flex-wrap: nowrap; font-size: 12px; font-weight: 400; grid-area: auto; line-height: 14.4px; margin: 0px; overflow: visible; text-align: left; text-align-last: auto; white-space-collapse: preserve-breaks;">investorservices@vlfunds.com</span>
|
| Additional Information Website |
<span style="box-sizing: border-box; color: rgb(0, 0, 0); display: inline; flex-wrap: nowrap; font-size: 12px; font-weight: 400; grid-area: auto; line-height: 14.4px; margin: 0px; overflow: visible; text-align: left; text-align-last: auto; white-space-collapse: preserve-breaks;">www.vlfunds.com</span>
|
| Expenses [Text Block] |
What were the Fund costs for last year?(based on a hypothetical $10,000 investment)
Class Name |
Costs of a $10,000 investment |
Costs paid as a percentage of a $10,000 investment |
Institutional Class |
$82 |
0.83% | |
| Expenses Paid, Amount |
$ 82
|
| Expense Ratio, Percent |
0.83%
|
| Factors Affecting Performance [Text Block] |
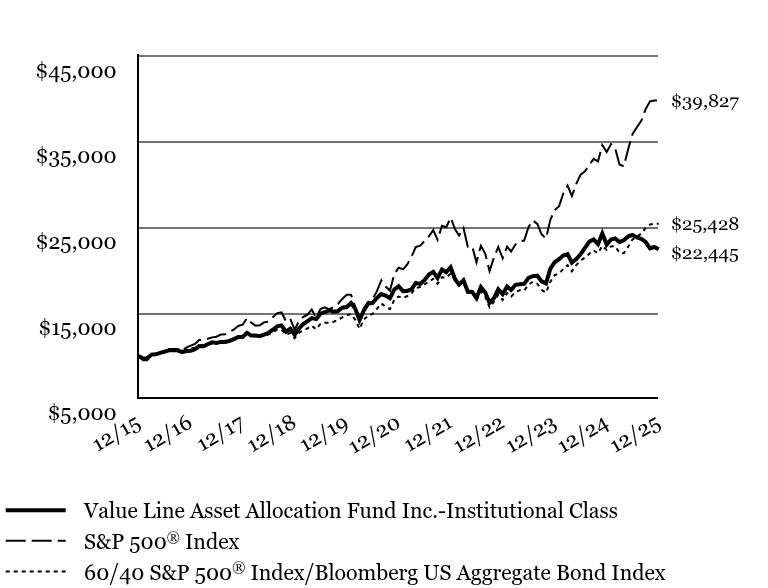
How did the Fund perform last year? The Fund's Institutional Class generated a total return of -2.38% during the 12 months ended December 31, 2025. • The Fund’s relative underperformance of its blended benchmark is attributable primarily to stock selection overall within its equity portfolio. The Fund’s fixed income portfolio modestly outperformed the Bloomberg Index. • The Fund’s asset allocation added value, as the Fund was overweight the equity market and underweight the bond market. The 17.88% return of the S&P 500® Index outpaced the 7.30% return of the Bloomberg Index. • The equity portion of the Fund was hurt most by stock selection in information technology. To a lesser degree, weak stock selection in the industrials and financials sectors and having no holdings in communication services, the strongest sector in the S&P 500® Index in 2025, also detracted. Contributing most positively was having no exposure to energy, real estate and materials—among the weakest sectors in the S&P 500® Index during the annual period. • Among individual stocks, positions in cloud software company ServiceNow, integrated software and technology services provider exclusively for the public sector Tyler Technologies and mission-critical communication and analytics solutions provider Motorola Solutions detracted most. Each experienced a double-digit share price decline during the annual period due to weaker than expected operating performance. • The equity portion of the Fund was helped most by not owning three mega-cap laggards-- information technology giant Apple, health insurance and health services provider UnitedHealth Group and e-commerce behemoth Amazon.com. • The fixed income portion of the Fund was helped most by sector allocation decisions. Overweights in corporate bonds, particularly BBB-rated bonds, and an underweight to U.S. Treasuries contributed most positively. Yield curve positioning also added value. An underweight to securitized debt and duration positioning modestly detracted. |
| Performance Past Does Not Indicate Future [Text] |
<p style="box-sizing: border-box; color: rgb(0, 0, 0); display: block; flex-wrap: nowrap; font-size: 9.33333px; font-weight: 400; grid-area: auto; line-height: 11.2px; margin: 0px; overflow: visible; text-align: justify; text-align-last: left; white-space-collapse: preserve-breaks;">The performance data quoted represent past performance and are no guarantee of future performance. The investment return and principal value of an investment will fluctuate so that an investment, when redeemed, may be worth more or less than its original cost. The performance data includes reinvestments of all dividends and distributions but does not reflect the deduction of taxes that a shareholder would pay on fund distributions or the redemption of fund shares.</p>
|
| Line Graph [Table Text Block] |
|
Value Line Asset Allocation Fund Inc.-Institutional Class |
S&P 500® Index |
60/40 S&P 500® Index/Bloomberg US Aggregate Bond Index |
12/15 |
$10,000 |
$10,000 |
$10,000 |
01/16 |
$9,701 |
$9,504 |
$9,757 |
02/16 |
$9,719 |
$9,491 |
$9,777 |
03/16 |
$10,155 |
$10,135 |
$10,211 |
04/16 |
$10,188 |
$10,174 |
$10,250 |
05/16 |
$10,350 |
$10,357 |
$10,362 |
06/16 |
$10,494 |
$10,384 |
$10,452 |
07/16 |
$10,649 |
$10,766 |
$10,710 |
08/16 |
$10,693 |
$10,782 |
$10,714 |
09/16 |
$10,653 |
$10,784 |
$10,713 |
10/16 |
$10,451 |
$10,587 |
$10,563 |
11/16 |
$10,581 |
$10,979 |
$10,698 |
12/16 |
$10,604 |
$11,196 |
$10,831 |
01/17 |
$10,785 |
$11,408 |
$10,962 |
02/17 |
$11,117 |
$11,861 |
$11,253 |
03/17 |
$11,117 |
$11,875 |
$11,258 |
04/17 |
$11,369 |
$11,997 |
$11,363 |
05/17 |
$11,587 |
$12,166 |
$11,494 |
06/17 |
$11,502 |
$12,242 |
$11,532 |
07/17 |
$11,635 |
$12,494 |
$11,694 |
08/17 |
$11,620 |
$12,532 |
$11,757 |
09/17 |
$11,756 |
$12,790 |
$11,881 |
10/17 |
$11,963 |
$13,089 |
$12,050 |
11/17 |
$12,204 |
$13,490 |
$12,265 |
12/17 |
$12,215 |
$13,640 |
$12,370 |
01/18 |
$12,694 |
$14,421 |
$12,738 |
02/18 |
$12,377 |
$13,890 |
$12,408 |
03/18 |
$12,377 |
$13,537 |
$12,250 |
04/18 |
$12,311 |
$13,589 |
$12,242 |
05/18 |
$12,497 |
$13,916 |
$12,454 |
06/18 |
$12,682 |
$14,002 |
$12,494 |
07/18 |
$13,057 |
$14,523 |
$12,774 |
08/18 |
$13,463 |
$14,996 |
$13,056 |
09/18 |
$13,567 |
$15,081 |
$13,067 |
10/18 |
$12,833 |
$14,050 |
$12,490 |
11/18 |
$13,173 |
$14,337 |
$12,673 |
12/18 |
$12,493 |
$13,042 |
$12,079 |
01/19 |
$13,204 |
$14,087 |
$12,711 |
02/19 |
$13,700 |
$14,540 |
$12,953 |
03/19 |
$14,047 |
$14,822 |
$13,204 |
04/19 |
$14,419 |
$15,422 |
$13,526 |
05/19 |
$14,311 |
$14,442 |
$13,106 |
06/19 |
$14,922 |
$15,460 |
$13,726 |
07/19 |
$15,118 |
$15,682 |
$13,857 |
08/19 |
$15,310 |
$15,434 |
$13,869 |
09/19 |
$15,154 |
$15,723 |
$13,995 |
10/19 |
$15,222 |
$16,063 |
$14,194 |
11/19 |
$15,625 |
$16,646 |
$14,500 |
12/19 |
$15,705 |
$17,149 |
$14,758 |
01/20 |
$16,174 |
$17,142 |
$14,869 |
02/20 |
$15,522 |
$15,731 |
$14,241 |
03/20 |
$14,186 |
$13,788 |
$13,152 |
04/20 |
$15,298 |
$15,555 |
$14,257 |
05/20 |
$16,121 |
$16,296 |
$14,691 |
06/20 |
$16,178 |
$16,620 |
$14,904 |
07/20 |
$16,773 |
$17,558 |
$15,497 |
08/20 |
$17,217 |
$18,820 |
$16,115 |
09/20 |
$17,054 |
$18,105 |
$15,744 |
10/20 |
$16,744 |
$17,623 |
$15,465 |
11/20 |
$17,738 |
$19,552 |
$16,541 |
12/20 |
$18,144 |
$20,304 |
$16,932 |
01/21 |
$17,564 |
$20,099 |
$16,781 |
02/21 |
$17,577 |
$20,653 |
$16,962 |
03/21 |
$17,766 |
$21,558 |
$17,323 |
04/21 |
$18,518 |
$22,708 |
$17,932 |
05/21 |
$18,386 |
$22,867 |
$18,031 |
06/21 |
$18,838 |
$23,401 |
$18,334 |
07/21 |
$19,508 |
$23,956 |
$18,677 |
08/21 |
$19,816 |
$24,685 |
$19,004 |
09/21 |
$19,109 |
$23,537 |
$18,408 |
10/21 |
$20,083 |
$25,186 |
$19,179 |
11/21 |
$19,775 |
$25,011 |
$19,122 |
12/21 |
$20,347 |
$26,132 |
$19,617 |
01/22 |
$18,951 |
$24,780 |
$18,839 |
02/22 |
$18,341 |
$24,038 |
$18,416 |
03/22 |
$18,828 |
$24,931 |
$18,622 |
04/22 |
$17,512 |
$22,757 |
$17,365 |
05/22 |
$17,468 |
$22,798 |
$17,429 |
06/22 |
$16,756 |
$20,916 |
$16,456 |
07/22 |
$18,030 |
$22,845 |
$17,528 |
08/22 |
$17,389 |
$21,913 |
$16,901 |
09/22 |
$16,181 |
$19,895 |
$15,675 |
10/22 |
$16,739 |
$21,506 |
$16,355 |
11/22 |
$17,771 |
$22,708 |
$17,144 |
12/22 |
$17,201 |
$21,399 |
$16,520 |
01/23 |
$18,099 |
$22,744 |
$17,346 |
02/23 |
$17,694 |
$22,189 |
$16,913 |
03/23 |
$18,304 |
$23,004 |
$17,457 |
04/23 |
$18,374 |
$23,363 |
$17,663 |
05/23 |
$18,412 |
$23,464 |
$17,632 |
06/23 |
$19,115 |
$25,015 |
$18,306 |
07/23 |
$19,315 |
$25,818 |
$18,654 |
08/23 |
$19,362 |
$25,407 |
$18,428 |
09/23 |
$18,691 |
$24,196 |
$17,714 |
10/23 |
$18,463 |
$23,687 |
$17,378 |
11/23 |
$20,154 |
$25,850 |
$18,645 |
12/23 |
$20,930 |
$27,025 |
$19,439 |
01/24 |
$21,294 |
$27,479 |
$19,614 |
02/24 |
$21,725 |
$28,946 |
$20,131 |
03/24 |
$21,869 |
$29,878 |
$20,594 |
04/24 |
$20,879 |
$28,657 |
$19,882 |
05/24 |
$21,310 |
$30,078 |
$20,608 |
06/24 |
$21,864 |
$31,157 |
$21,130 |
07/24 |
$22,613 |
$31,537 |
$21,481 |
08/24 |
$23,341 |
$32,302 |
$21,917 |
09/24 |
$23,582 |
$32,992 |
$22,316 |
10/24 |
$23,044 |
$32,692 |
$21,973 |
11/24 |
$24,285 |
$34,611 |
$22,840 |
12/24 |
$22,991 |
$33,786 |
$22,363 |
01/25 |
$23,580 |
$34,727 |
$22,785 |
02/25 |
$23,716 |
$34,274 |
$22,807 |
03/25 |
$23,286 |
$32,343 |
$22,039 |
04/25 |
$23,501 |
$32,124 |
$21,984 |
05/25 |
$23,948 |
$34,146 |
$22,751 |
06/25 |
$24,112 |
$35,882 |
$23,586 |
07/25 |
$23,829 |
$36,687 |
$23,878 |
08/25 |
$23,670 |
$37,431 |
$24,283 |
09/25 |
$23,308 |
$38,797 |
$24,921 |
10/25 |
$22,539 |
$39,706 |
$25,333 |
11/25 |
$22,708 |
$39,803 |
$25,433 |
12/25 |
$22,445 |
$39,827 |
$25,428 |
|
| Average Annual Return [Table Text Block] |
AATR |
1 Year |
5 Years |
10 Years |
Institutional Class |
(2.38%) |
4.35% |
8.42% |
S&P 500® Index |
17.88% |
14.42% |
14.82% |
60/40 S&P 500® Index/Bloomberg US Aggregate Bond Index |
13.70% |
8.47% |
9.78% | |
| AssetsNet |
$ 535,674,389
|
| Holdings Count | Holding |
124
|
| Advisory Fees Paid, Amount |
$ 5,180,207
|
| InvestmentCompanyPortfolioTurnover |
14.00%
|
| Additional Fund Statistics [Text Block] |
Total Net Assets |
$535,674,389 |
# of Portfolio Holdings |
124 |
Portfolio Turnover Rate |
14% |
Total Advisory Fees Paid |
$5,180,207 | |
| Holdings [Text Block] |
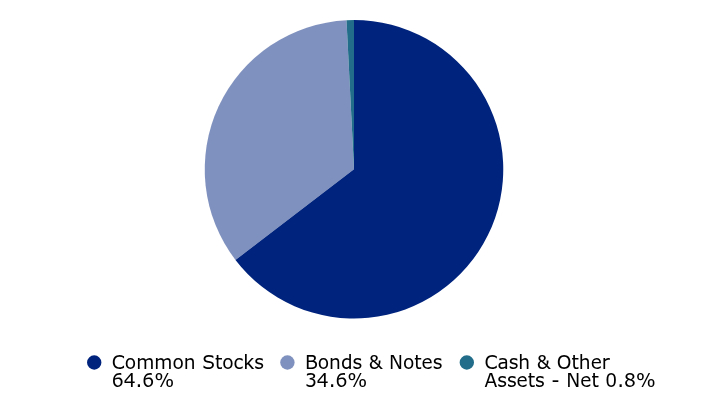
Asset Allocation (% of Net Assets)
Value |
Value |
Common Stocks |
64.6% |
Bonds & Notes |
34.6% |
Cash & Other Assets - Net |
0.8% | Common Stock Sectors (% of Common Stocks)*
Information Technology |
36.5% |
Financials |
22.3% |
Industrials |
19.5% |
Healthcare |
12.8% |
Consumer Staples |
7.5% |
Consumer Discretionary |
1.4% | * Excludes Short-term Investments, if any. Bonds & Notes Sectors (% of Bonds & Notes)*
Government |
38.2% |
Residential Mortgage-Backed Securities |
24.5% |
Financial |
11.8% |
Consumer, Non-cyclical |
5.7% |
Technology |
3.8% |
Energy |
3.4% |
Communications |
3.1% |
Consumer, Cyclical |
2.6% |
Industrial |
2.4% |
Utilities |
2.0% |
Basic Materials |
1.2% |
Collateralized Mortgage Obligations |
0.7% |
Commercial Mortgage-Backed Securities |
0.6% | * Excludes Short-term Investments, if any. |
| Largest Holdings [Text Block] |
Ten Largest Holdings (% of Net Assets)*
Costco Wholesale Corp. |
4.8% |
Tyler Technologies, Inc. |
4.5% |
Republic Services, Inc. |
4.4% |
Motorola Solutions, Inc. |
4.4% |
Cadence Design Systems, Inc. |
4.2% |
ServiceNow, Inc. |
4.2% |
Stryker Corp. |
3.5% |
IDEXX Laboratories, Inc. |
3.4% |
TransDigm Group, Inc. |
3.3% |
W.R. Berkley Corp. |
3.0% | |
| Material Fund Change [Text Block] |
|
| Updated Prospectus Phone Number |
800-243-2729
|
| Updated Prospectus Email Address |
<span style="box-sizing: border-box; color: rgb(0, 0, 0); display: inline; flex-wrap: nowrap; font-size: 12px; font-weight: 400; grid-area: auto; line-height: 14.4px; margin: 0px; overflow: visible; text-align: left; text-align-last: auto; white-space-collapse: preserve-breaks;">investorservices@vlfunds.com</span>
|
| C000020616 |
|
| Shareholder Report [Line Items] |
|
| Fund Name |
Value Line Asset Allocation Fund, Inc.
|
| Class Name |
Investor
|
| Trading Symbol |
VLAAX
|
| Annual or Semi-Annual Statement [Text Block] |
This annual shareholder report contains important information about Value Line Asset Allocation Fund, Inc. (the "Fund") for the period of January 1, 2025 to December 31, 2025.
|
| Additional Information [Text Block] |
You can find additional information about the Fund at www.vlfunds.com. You can also request this information by contacting us at 1-800-243-2729 or investorservices@vlfunds.com.
|
| Additional Information Phone Number |
1-800-243-2729
|
| Additional Information Email |
<span style="box-sizing: border-box; color: rgb(0, 0, 0); display: inline; flex-wrap: nowrap; font-size: 12px; font-weight: 400; grid-area: auto; line-height: 14.4px; margin: 0px; overflow: visible; text-align: left; text-align-last: auto; white-space-collapse: preserve-breaks;">investorservices@vlfunds.com</span>
|
| Additional Information Website |
<span style="box-sizing: border-box; color: rgb(0, 0, 0); display: inline; flex-wrap: nowrap; font-size: 12px; font-weight: 400; grid-area: auto; line-height: 14.4px; margin: 0px; overflow: visible; text-align: left; text-align-last: auto; white-space-collapse: preserve-breaks;">www.vlfunds.com</span>
|
| Expenses [Text Block] |
What were the Fund costs for last year?(based on a hypothetical $10,000 investment)
Class Name |
Costs of a $10,000 investment |
Costs paid as a percentage of a $10,000 investment |
Investor Class |
$109 |
1.10% | |
| Expenses Paid, Amount |
$ 109
|
| Expense Ratio, Percent |
1.10%
|
| Factors Affecting Performance [Text Block] |
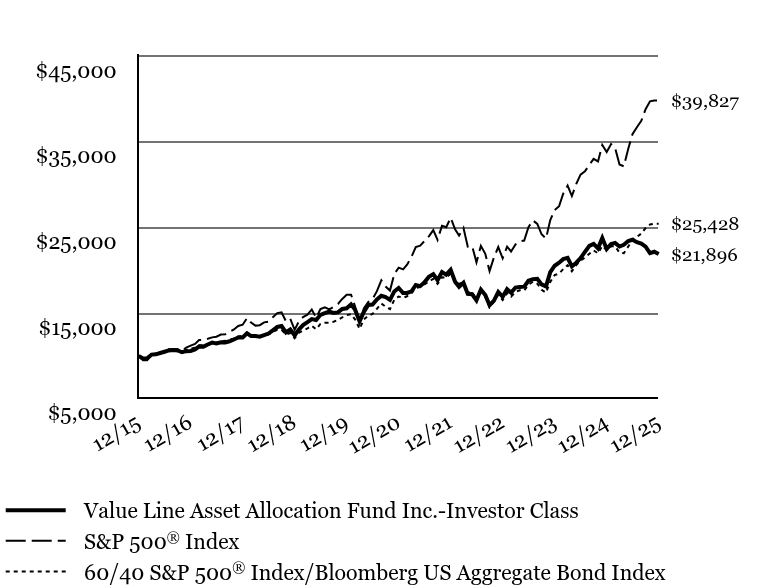
How did the Fund perform last year? The Fund's Investor Class generated a total return of -2.63% during the 12 months ended December 31, 2025. • The Fund’s relative underperformance of its blended benchmark is attributable primarily to stock selection overall within its equity portfolio. The Fund’s fixed income portfolio modestly outperformed the Bloomberg Index. • The Fund’s asset allocation added value, as the Fund was overweight the equity market and underweight the bond market. The 17.88% return of the S&P 500® Index outpaced the 7.30% return of the Bloomberg Index. • The equity portion of the Fund was hurt most by stock selection in information technology. To a lesser degree, weak stock selection in the industrials and financials sectors and having no holdings in communication services, the strongest sector in the S&P 500® Index in 2025, also detracted. Contributing most positively was having no exposure to energy, real estate and materials—among the weakest sectors in the S&P 500® Index during the annual period. • Among individual stocks, positions in cloud software company ServiceNow, integrated software and technology services provider exclusively for the public sector Tyler Technologies and mission-critical communication and analytics solutions provider Motorola Solutions detracted most. Each experienced a double-digit share price decline during the annual period due to weaker than expected operating performance. • The equity portion of the Fund was helped most by not owning three mega-cap laggards-- information technology giant Apple, health insurance and health services provider UnitedHealth Group and e-commerce behemoth Amazon.com. • The fixed income portion of the Fund was helped most by sector allocation decisions. Overweights in corporate bonds, particularly BBB-rated bonds, and an underweight to U.S. Treasuries contributed most positively. Yield curve positioning also added value. An underweight to securitized debt and duration positioning modestly detracted. |
| Performance Past Does Not Indicate Future [Text] |
<p style="box-sizing: border-box; color: rgb(0, 0, 0); display: block; flex-wrap: nowrap; font-size: 9.33333px; font-weight: 400; grid-area: auto; line-height: 11.2px; margin: 0px; overflow: visible; text-align: justify; text-align-last: left; white-space-collapse: preserve-breaks;">The performance data quoted represent past performance and are no guarantee of future performance. The investment return and principal value of an investment will fluctuate so that an investment, when redeemed, may be worth more or less than its original cost. The performance data includes reinvestments of all dividends and distributions but does not reflect the deduction of taxes that a shareholder would pay on fund distributions or the redemption of fund shares.</p>
|
| Line Graph [Table Text Block] |
|
Value Line Asset Allocation Fund Inc.-Investor Class |
S&P 500® Index |
60/40 S&P 500® Index/Bloomberg US Aggregate Bond Index |
12/15 |
$10,000 |
$10,000 |
$10,000 |
01/16 |
$9,708 |
$9,504 |
$9,757 |
02/16 |
$9,719 |
$9,491 |
$9,777 |
03/16 |
$10,152 |
$10,135 |
$10,211 |
04/16 |
$10,184 |
$10,174 |
$10,250 |
05/16 |
$10,343 |
$10,357 |
$10,362 |
06/16 |
$10,484 |
$10,384 |
$10,452 |
07/16 |
$10,639 |
$10,766 |
$10,710 |
08/16 |
$10,678 |
$10,782 |
$10,714 |
09/16 |
$10,635 |
$10,784 |
$10,713 |
10/16 |
$10,429 |
$10,587 |
$10,563 |
11/16 |
$10,559 |
$10,979 |
$10,698 |
12/16 |
$10,577 |
$11,196 |
$10,831 |
01/17 |
$10,758 |
$11,408 |
$10,962 |
02/17 |
$11,087 |
$11,861 |
$11,253 |
03/17 |
$11,083 |
$11,875 |
$11,258 |
04/17 |
$11,334 |
$11,997 |
$11,363 |
05/17 |
$11,549 |
$12,166 |
$11,494 |
06/17 |
$11,464 |
$12,242 |
$11,532 |
07/17 |
$11,593 |
$12,494 |
$11,694 |
08/17 |
$11,575 |
$12,532 |
$11,757 |
09/17 |
$11,711 |
$12,790 |
$11,881 |
10/17 |
$11,914 |
$13,089 |
$12,050 |
11/17 |
$12,147 |
$13,490 |
$12,265 |
12/17 |
$12,157 |
$13,640 |
$12,370 |
01/18 |
$12,635 |
$14,421 |
$12,738 |
02/18 |
$12,315 |
$13,890 |
$12,408 |
03/18 |
$12,315 |
$13,537 |
$12,250 |
04/18 |
$12,245 |
$13,589 |
$12,242 |
05/18 |
$12,426 |
$13,916 |
$12,454 |
06/18 |
$12,608 |
$14,002 |
$12,494 |
07/18 |
$12,981 |
$14,523 |
$12,774 |
08/18 |
$13,378 |
$14,996 |
$13,056 |
09/18 |
$13,483 |
$15,081 |
$13,067 |
10/18 |
$12,746 |
$14,050 |
$12,490 |
11/18 |
$13,082 |
$14,337 |
$12,673 |
12/18 |
$12,403 |
$13,042 |
$12,079 |
01/19 |
$13,106 |
$14,087 |
$12,711 |
02/19 |
$13,595 |
$14,540 |
$12,953 |
03/19 |
$13,937 |
$14,822 |
$13,204 |
04/19 |
$14,303 |
$15,422 |
$13,526 |
05/19 |
$14,195 |
$14,442 |
$13,106 |
06/19 |
$14,795 |
$15,460 |
$13,726 |
07/19 |
$14,986 |
$15,682 |
$13,857 |
08/19 |
$15,173 |
$15,434 |
$13,869 |
09/19 |
$15,018 |
$15,723 |
$13,995 |
10/19 |
$15,081 |
$16,063 |
$14,194 |
11/19 |
$15,479 |
$16,646 |
$14,500 |
12/19 |
$15,554 |
$17,149 |
$14,758 |
01/20 |
$16,015 |
$17,142 |
$14,869 |
02/20 |
$15,368 |
$15,731 |
$14,241 |
03/20 |
$14,041 |
$13,788 |
$13,152 |
04/20 |
$15,137 |
$15,555 |
$14,257 |
05/20 |
$15,950 |
$16,296 |
$14,691 |
06/20 |
$16,003 |
$16,620 |
$14,904 |
07/20 |
$16,589 |
$17,558 |
$15,497 |
08/20 |
$17,022 |
$18,820 |
$16,115 |
09/20 |
$16,860 |
$18,105 |
$15,744 |
10/20 |
$16,545 |
$17,623 |
$15,465 |
11/20 |
$17,523 |
$19,552 |
$16,541 |
12/20 |
$17,924 |
$20,304 |
$16,932 |
01/21 |
$17,346 |
$20,099 |
$16,781 |
02/21 |
$17,354 |
$20,653 |
$16,962 |
03/21 |
$17,541 |
$21,558 |
$17,323 |
04/21 |
$18,277 |
$22,708 |
$17,932 |
05/21 |
$18,143 |
$22,867 |
$18,031 |
06/21 |
$18,586 |
$23,401 |
$18,334 |
07/21 |
$19,241 |
$23,956 |
$18,677 |
08/21 |
$19,542 |
$24,685 |
$19,004 |
09/21 |
$18,843 |
$23,537 |
$18,408 |
10/21 |
$19,798 |
$25,186 |
$19,179 |
11/21 |
$19,489 |
$25,011 |
$19,122 |
12/21 |
$20,050 |
$26,132 |
$19,617 |
01/22 |
$18,668 |
$24,780 |
$18,839 |
02/22 |
$18,065 |
$24,038 |
$18,416 |
03/22 |
$18,542 |
$24,931 |
$18,622 |
04/22 |
$17,242 |
$22,757 |
$17,365 |
05/22 |
$17,194 |
$22,798 |
$17,429 |
06/22 |
$16,492 |
$20,916 |
$16,456 |
07/22 |
$17,740 |
$22,845 |
$17,528 |
08/22 |
$17,103 |
$21,913 |
$16,901 |
09/22 |
$15,916 |
$19,895 |
$15,675 |
10/22 |
$16,462 |
$21,506 |
$16,355 |
11/22 |
$17,472 |
$22,708 |
$17,144 |
12/22 |
$16,908 |
$21,399 |
$16,520 |
01/23 |
$17,788 |
$22,744 |
$17,346 |
02/23 |
$17,385 |
$22,189 |
$16,913 |
03/23 |
$17,981 |
$23,004 |
$17,457 |
04/23 |
$18,050 |
$23,363 |
$17,663 |
05/23 |
$18,082 |
$23,464 |
$17,632 |
06/23 |
$18,770 |
$25,015 |
$18,306 |
07/23 |
$18,958 |
$25,818 |
$18,654 |
08/23 |
$18,999 |
$25,407 |
$18,428 |
09/23 |
$18,343 |
$24,196 |
$17,714 |
10/23 |
$18,109 |
$23,687 |
$17,378 |
11/23 |
$19,770 |
$25,850 |
$18,645 |
12/23 |
$20,525 |
$27,025 |
$19,439 |
01/24 |
$20,877 |
$27,479 |
$19,614 |
02/24 |
$21,296 |
$28,946 |
$20,131 |
03/24 |
$21,437 |
$29,878 |
$20,594 |
04/24 |
$20,454 |
$28,657 |
$19,882 |
05/24 |
$20,877 |
$30,078 |
$20,608 |
06/24 |
$21,417 |
$31,157 |
$21,130 |
07/24 |
$22,148 |
$31,537 |
$21,481 |
08/24 |
$22,848 |
$32,302 |
$21,917 |
09/24 |
$23,080 |
$32,992 |
$22,316 |
10/24 |
$22,551 |
$32,692 |
$21,973 |
11/24 |
$23,766 |
$34,611 |
$22,840 |
12/24 |
$22,488 |
$33,786 |
$22,363 |
01/25 |
$23,065 |
$34,727 |
$22,785 |
02/25 |
$23,193 |
$34,274 |
$22,807 |
03/25 |
$22,766 |
$32,343 |
$22,039 |
04/25 |
$22,971 |
$32,124 |
$21,984 |
05/25 |
$23,404 |
$34,146 |
$22,751 |
06/25 |
$23,559 |
$35,882 |
$23,586 |
07/25 |
$23,276 |
$36,687 |
$23,878 |
08/25 |
$23,115 |
$37,431 |
$24,283 |
09/25 |
$22,760 |
$38,797 |
$24,921 |
10/25 |
$22,000 |
$39,706 |
$25,333 |
11/25 |
$22,155 |
$39,803 |
$25,433 |
12/25 |
$21,896 |
$39,827 |
$25,428 |
|
| Average Annual Return [Table Text Block] |
AATR |
1 Year |
5 Years |
10 Years |
Investor Class |
(2.63%) |
4.09% |
8.15% |
S&P 500® Index |
17.88% |
14.42% |
14.82% |
60/40 S&P 500® Index/Bloomberg US Aggregate Bond Index |
13.70% |
8.47% |
9.78% | |
| AssetsNet |
$ 535,674,389
|
| Holdings Count | Holding |
124
|
| Advisory Fees Paid, Amount |
$ 5,180,207
|
| InvestmentCompanyPortfolioTurnover |
14.00%
|
| Additional Fund Statistics [Text Block] |
Total Net Assets |
$535,674,389 |
# of Portfolio Holdings |
124 |
Portfolio Turnover Rate |
14% |
Total Advisory Fees Paid |
$5,180,207 | |
| Holdings [Text Block] |
Asset Allocation (% of Net Assets)
Value |
Value |
Common Stocks |
64.6% |
Bonds & Notes |
34.6% |
Cash & Other Assets - Net |
0.8% | Common Stock Sectors (% of Common Stocks)*
Information Technology |
36.5% |
Financials |
22.3% |
Industrials |
19.5% |
Healthcare |
12.8% |
Consumer Staples |
7.5% |
Consumer Discretionary |
1.4% | * Excludes Short-term Investments, if any. Bonds & Notes Sectors (% of Bonds & Notes)*
Government |
38.2% |
Residential Mortgage-Backed Securities |
24.5% |
Financial |
11.8% |
Consumer, Non-cyclical |
5.7% |
Technology |
3.8% |
Energy |
3.4% |
Communications |
3.1% |
Consumer, Cyclical |
2.6% |
Industrial |
2.4% |
Utilities |
2.0% |
Basic Materials |
1.2% |
Collateralized Mortgage Obligations |
0.7% |
Commercial Mortgage-Backed Securities |
0.6% | * Excludes Short-term Investments, if any. |
| Largest Holdings [Text Block] |
Ten Largest Holdings (% of Net Assets)*
Costco Wholesale Corp. |
4.8% |
Tyler Technologies, Inc. |
4.5% |
Republic Services, Inc. |
4.4% |
Motorola Solutions, Inc. |
4.4% |
Cadence Design Systems, Inc. |
4.2% |
ServiceNow, Inc. |
4.2% |
Stryker Corp. |
3.5% |
IDEXX Laboratories, Inc. |
3.4% |
TransDigm Group, Inc. |
3.3% |
W.R. Berkley Corp. |
3.0% | |
| Material Fund Change [Text Block] |
|
| Updated Prospectus Phone Number |
800-243-2729
|
| Updated Prospectus Email Address |
<span style="box-sizing: border-box; color: rgb(0, 0, 0); display: inline; flex-wrap: nowrap; font-size: 12px; font-weight: 400; grid-area: auto; line-height: 14.4px; margin: 0px; overflow: visible; text-align: left; text-align-last: auto; white-space-collapse: preserve-breaks;">investorservices@vlfunds.com</span>
|