Shareholder Report
Dec. 31, 2025
USD ($)
Holding
This annual shareholder report contains important information about the fund for the period of January 1, 2025, to December 31,
2025.
You can find additional information about the fund at
www.schwabassetmanagement.com/prospectus
.
You can also request
this information by calling
1-866-414-6349
or by sending an email request to
orders@mysummaryprospectus.com
.
FUND COSTS FOR THE LAST year ENDED December 31, 2025
(BASED ON A HYPOTHETICAL $10,000 INVESTMENT)
COSTS OF A $10,000 INVESTMENT |
COSTS PAID AS A PERCENTAGE OF A $10,000 INVESTMENT | |
Schwab Government Money Market Portfolio |
$28 |
0.27% |
Statistics
Net Assets (millions) |
$261 |
Number of Holdings |
278 |
Advisory Fees Paid by the Fund |
$510,547 |
Weighted Average Maturity |
39 Days |
Seven-Day Yield (with waivers) |
3.54% |
Seven-Day Yield (without waivers) |
3.54% |
Seven-Day Effective Yield (with waivers) |
3.60% |
Business Interest Deduction (163j) |
99.98% |
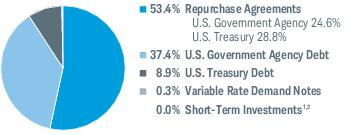
Portfolio Composition by Security Type % of Investments
Portfolio Composition By Effective Maturity % of Investments
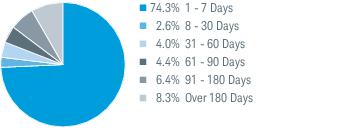
Portfolio holdings may have changed since the report date.
1
Less than 0.05%
2
Includes the fund’s position in money market mutual funds registered under the Investment Company Act of 1940, as amended.
This annual shareholder report contains important information about the fund for the period of January 1, 2025, to December 31,
2025.
You can find additional information about the fund at
www.schwabassetmanagement.com/prospectus
.
You can also request
this information by calling
1-866-414-6349
or by sending an email request to
orders@mysummaryprospectus.com
.
FUND COSTS FOR THE LAST year ENDED December 31, 2025
(BASED ON A HYPOTHETICAL $10,000 INVESTMENT)
COSTS OF A $10,000 INVESTMENT |
COSTS PAID AS A PERCENTAGE OF A $10,000 INVESTMENT | |
Schwab S&P 500 Index Portfolio |
$3 |
0.03% |
MANAGEMENT’S DISCUSSION OF FUND PERFORMANCE
For the 12-month reporting period ended December 31, 2025, the fund returned 17.83%. The S&P 500
®
Index returned 17.88%.
Differences between the return of the fund and the return of the S&P 500
®
Index may be attributable to, among other things, the
operational and transactional costs incurred by the fund and not the index.
■
Over the reporting period, no sectors detracted from the return of the fund. However, the smallest contributors to total return
were:
●
Real estate sector securities, including Equinix, Inc. (which detracted from the total return of the fund)
●
Energy sector securities
■
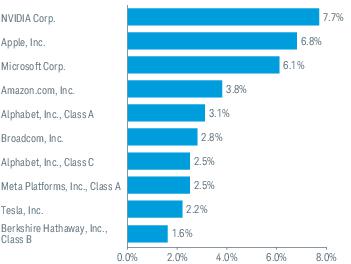
Top contributors to total return:
●
Information technology sector securities, including NVIDIA Corp.
●
Communication services sector securities
Portfolio holdings may have changed since the report date.
Performance of Hypothetical $10,000 Investment (December 31, 2015 - December 31, 2025)
1
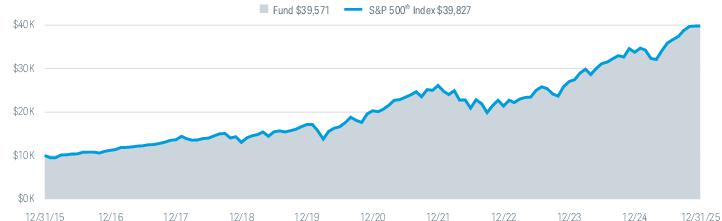
All total return figures on this page assume dividends and distributions were reinvested. Index figures do not include trading and management costs, which would lower
performance. Indices are unmanaged and cannot be invested in directly. Performance results less than one year are not annualized.
For index definitions, please see www.schwabassetmanagement.com/glossary.
Index ownership — “Standard & Poor’s
®
,” “S&P
®
,” and “S&P 500
®
” are registered trademarks of Standard & Poor’s Financial Services LLC (S&P), and “Dow Jones
®
” is a
registered trademark of Dow Jones Trademark Holdings LLC (Dow Jones) and have been licensed for use by S&P Dow Jones Indices LLC and its affiliates and sublicensed for
certain purposes by Charles Schwab Investment Management, Inc. The “S&P 500
®
Index” is a product of S&P Dow Jones Indices LLC or its affiliates, and has been licensed for
use by Charles Schwab Investment Management, Inc. The Schwab S&P 500 Index Portfolio is not sponsored, endorsed, sold or promoted by S&P Dow Jones Indices LLC, Dow
Jones, S&P, or their respective affiliates, and neither S&P Dow Jones Indices LLC, Dow Jones, S&P, nor their respective affiliates make any representation regarding the
advisability of investing in the fund.
1
Fund performance does not reflect the additional fees and expenses imposed by the insurance company under the variable insurance product contract. If those contract
fees and expenses were included, the performance would be less than that shown. Please refer to the variable insurance product prospectus for a complete listing of these
expenses.
Average Annual Total Returns
Fund and Inception Date |
1 Year |
5 Years |
10 Years |
Fund: Schwab S&P 500 Index Portfolio (11/01/1996) 1 |
17.83% |
14.38% |
14.75% |
S&P 500 ® Index |
17.88% |
14.42% |
14.82% |
All total return figures on this page assume dividends and distributions were reinvested. Index figures do not include trading and management costs, which would lower
performance. Indices are unmanaged and cannot be invested in directly. Performance results less than one year are not annualized.
For index definitions, please see www.schwabassetmanagement.com/glossary.
Index ownership — “Standard & Poor’s
®
,” “S&P
®
,” and “S&P 500
®
” are registered trademarks of Standard & Poor’s Financial Services LLC (S&P), and “Dow Jones
®
” is a
registered trademark of Dow Jones Trademark Holdings LLC (Dow Jones) and have been licensed for use by S&P Dow Jones Indices LLC and its affiliates and sublicensed for
certain purposes by Charles Schwab Investment Management, Inc. The “S&P 500
®
Index” is a product of S&P Dow Jones Indices LLC or its affiliates, and has been licensed for
use by Charles Schwab Investment Management, Inc. The Schwab S&P 500 Index Portfolio is not sponsored, endorsed, sold or promoted by S&P Dow Jones Indices LLC, Dow
Jones, S&P, or their respective affiliates, and neither S&P Dow Jones Indices LLC, Dow Jones, S&P, nor their respective affiliates make any representation regarding the
advisability of investing in the fund.
1
Fund performance does not reflect the additional fees and expenses imposed by the insurance company under the variable insurance product contract. If those contract
fees and expenses were included, the performance would be less than that shown. Please refer to the variable insurance product prospectus for a complete listing of these
expenses.
To obtain performance information current to the most recent month end, please
visit
www.schwabassetmanagement.com/prospectus
.
Statistics
Net Assets (millions) |
$3,170 |
Number of Holdings (excludes derivatives) |
502 |
Portfolio Turnover Rate |
6% |
Advisory Fees Paid by the Fund |
$821,609 |
Weighted Average Market Cap ($ x 1,000,000) |
$1,430,230 |
Price/Earnings Ratio (P/E) |
28.3 |
Price/Book Ratio (P/B) |
5.2 |
Dividends Received Deduction |
93.05% |
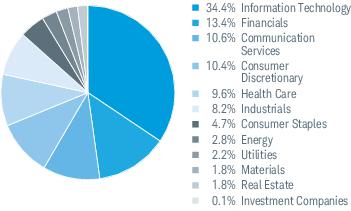
Sector Weightings % of Investments
1
Top Equity Holdings % of Net Assets
Portfolio holdings may
have
changed since the report date.The Sector/Industry classifications in this report use the Global Industry Classification Standard (GICS) which was developed by and is the exclusive property of MSCI Inc.
(MSCI) and Standard & Poor’s (S&P). GICS is a service mark of MSCI and S&P and has been licensed for use by Charles Schwab & Co., Inc.
1
Excludes derivatives.
Top Equity Holdings % of Net Assets
Portfolio holdings may
have
changed since the report date.This annual shareholder report contains important information about the fund for the period of January 1, 2025, to December 31,
2025.
You can find additional information about the fund at
www.schwabassetmanagement.com/prospectus
.
You can also request
this information by calling
1-866-414-6349
or by sending an email request to
orders@mysummaryprospectus.com
.
FUND COSTS FOR THE LAST year ENDED December 31, 2025
(BASED ON A HYPOTHETICAL $10,000 INVESTMENT)
COSTS OF A $10,000 INVESTMENT |
COSTS PAID AS A PERCENTAGE OF A $10,000 INVESTMENT | |
Schwab VIT Balanced Portfolio |
$54 |
0.51% |
MANAGEMENT’S DISCUSSION OF FUND PERFORMANCE
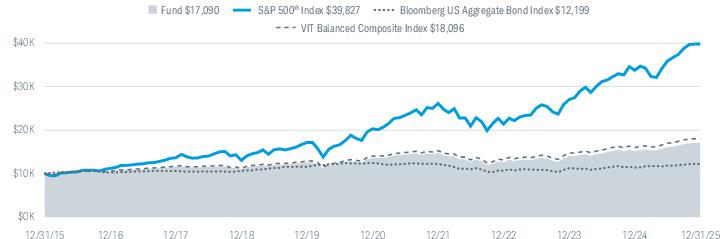
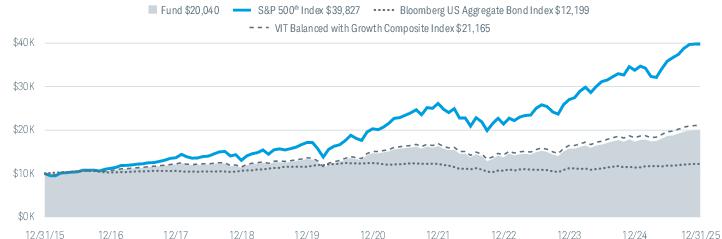
For the 12-month reporting period ended December 31, 2025, the fund returned 12.93%. The S&P 500
®
Index, which provides a
broad measure of equity market performance, and the Bloomberg US Aggregate Bond Index, which provides a broad measure of
bond market performance, returned 17.88% and 7.30%, respectively. The fund’s internally calculated comparative index, the VIT
Balanced Composite Index (the composite index), returned 13.32%.
■
Asset allocations were broadly in line with those of the composite index
■
Top contributors to total return:
●
Schwab U.S. Large-Cap ETF
●
Schwab International Equity ETF
■
Over the reporting period, there were no detractors from the return of the fund. However, the smallest contributors to total return
were:
●
Schwab U.S. REIT ETF
●
Schwab U.S. TIPS ETF
Portfolio holdings may have changed since the report date.
Performance of Hypothetical $10,000 Investment (December 31, 2015 - December 31, 2025)
1
All total return figures on this page assume dividends and distributions were reinvested. Index figures do not include trading and management costs, which would lower
performance. Indices are unmanaged and cannot be invested in directly. Performance results less than one year are not annualized.
For index definitions, please see www.schwabassetmanagement.com/glossary.
1
Fund expenses may have been partially absorbed by the investment adviser and its affiliates. Without these reductions, the fund’s returns would have been lower. Fund
performance does not reflect the additional fees and expenses imposed by the insurance company under the variable insurance product contract. If those contract fees and
expenses were included, the performance would be less than that shown. Please refer to the variable insurance product prospectus for a complete listing of these
expenses.
Average Annual Total Returns
Fund and Inception Date |
1 Year |
5 Years |
10 Years |
Fund: Schwab VIT Balanced Portfolio (07/25/2012) 1 |
12.93% |
4.69% |
5.51% |
S&P 500 ® Index |
17.88% |
14.42% |
14.82% |
Bloomberg US Aggregate Bond Index |
7.30% |
-0.36% |
2.01% |
VIT Balanced Composite Index |
13.32% |
5.24% |
6.11% |
All total return figures on this page assume dividends and distributions were reinvested. Index figures do not include trading and management costs, which would lower
performance. Indices are unmanaged and cannot be invested in directly. Performance results less than one year are not annualized.
For index definitions, please see www.schwabassetmanagement.com/glossary.
1
Fund expenses may have been partially absorbed by the investment adviser and its affiliates. Without these reductions, the fund’s returns would have been lower. Fund
performance does not reflect the additional fees and expenses imposed by the insurance company under the variable insurance product contract. If those contract fees and
expenses were included, the performance would be less than that shown. Please refer to the variable insurance product prospectus for a complete listing of these
expenses.
To obtain performance information current to the most recent month end, please
visit
www.schwabassetmanagement.com/prospectus
.
Statistics
Net Assets (millions) |
$80 |
Number of Holdings |
10 |
Portfolio Turnover Rate |
29% |
Advisory Fees Paid by the Fund |
$377,912 |
Foreign Tax Paid and Passed Through |
$31,143 |
Gross Income From Foreign Sources |
$382,540 |
Dividends Received Deduction |
10.63% |
Long Term Capital Gain Distribution |
$1,099,081 |
Business Interest Deduction (163j) |
73.69% |
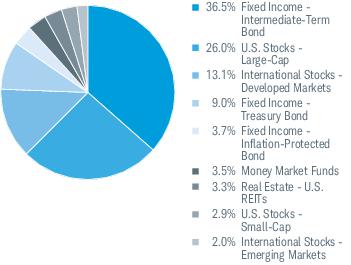
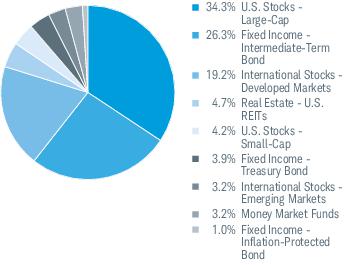
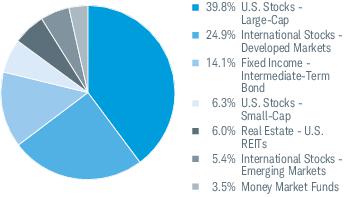
Asset Class Weightings % of Investments
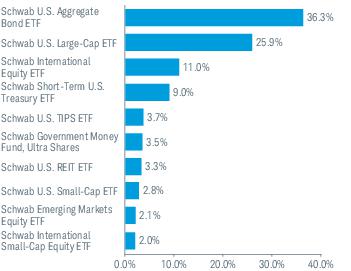
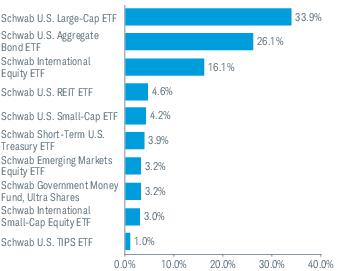
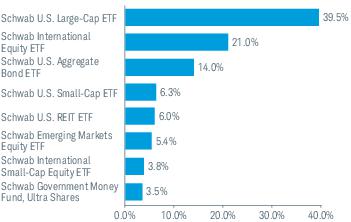
Top Holdings % of Net Assets
Portfolio holdings may have changed since the report date.
Top Holdings % of Net Assets
Portfolio holdings may have changed since the report date.
This annual shareholder report contains important information about the fund for the period of January 1, 2025, to December 31,
2025.
You can find additional information about the fund at
www.schwabassetmanagement.com/prospectus
.
You can also request
this information by calling
1-866-414-6349
or by sending an email request to
orders@mysummaryprospectus.com
.
FUND COSTS FOR THE LAST year ENDED December 31, 2025
(BASED ON A HYPOTHETICAL $10,000 INVESTMENT)
COSTS OF A $10,000 INVESTMENT |
COSTS PAID AS A PERCENTAGE OF A $10,000 INVESTMENT | |
Schwab VIT Balanced with Growth Portfolio |
$52 |
0.48% |
MANAGEMENT’S DISCUSSION OF FUND PERFORMANCE
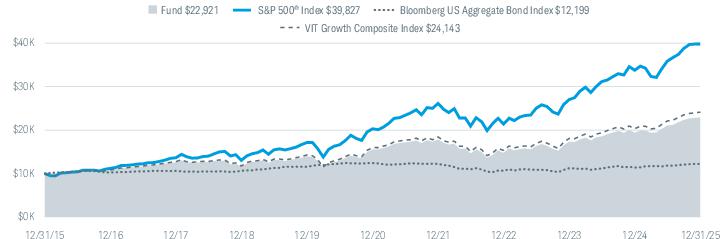
For the 12-month reporting period ended December 31, 2025, the fund returned 15.60%. The S&P 500
®
Index, which provides a
broad measure of equity market performance, and the Bloomberg US Aggregate Bond Index, which provides a broad measure of
bond market performance, returned 17.88% and 7.30%, respectively. The fund’s internally calculated comparative index, the VIT
Balanced with Growth Composite Index (the composite index), returned 16.09%.
■
Asset allocations were broadly in line with those of the composite index
■
Top contributors to total return:
●
Schwab U.S. Large-Cap ETF
●
Schwab International Equity ETF
■
Over the reporting period, there were no detractors from the return of the fund. However, the smallest contributors to total return
were:
●
Schwab U.S. TIPS ETF
●
Schwab U.S. REIT ETF
Portfolio holdings may have changed since the report date.
Performance of Hypothetical $10,000 Investment (December 31, 2015 - December 31, 2025)
1
All total return figures on this page assume dividends and distributions were reinvested. Index figures do not include trading and management costs, which would lower
performance. Indices are unmanaged and cannot be invested in directly. Performance results less than one year are not annualized.
For index definitions, please see www.schwabassetmanagement.com/glossary.
1
Fund expenses may have been partially absorbed by the investment adviser and its affiliates. Without these reductions, the fund’s returns would have been lower. Fund
performance does not reflect the additional fees and expenses imposed by the insurance company under the variable insurance product contract. If those contract fees and
expenses were included, the performance would be less than that shown. Please refer to the variable insurance product prospectus for a complete listing of these
expenses.
Average Annual Total Returns
Fund and Inception Date |
1 Year |
5 Years |
10 Years |
Fund: Schwab VIT Balanced with Growth Portfolio (07/25/2012) 1 |
15.60% |
6.45% |
7.20% |
S&P 500 ® Index |
17.88% |
14.42% |
14.82% |
Bloomberg US Aggregate Bond Index |
7.30% |
-0.36% |
2.01% |
VIT Balanced with Growth Composite Index |
16.09% |
7.01% |
7.79% |
All total return figures on this page assume dividends and distributions were reinvested. Index figures do not include trading and management costs, which would lower
performance. Indices are unmanaged and cannot be invested in directly. Performance results less than one year are not annualized.
For index definitions, please see www.schwabassetmanagement.com/glossary.
1
Fund expenses may have been partially absorbed by the investment adviser and its affiliates. Without these reductions, the fund’s returns would have been lower. Fund
performance does not reflect the additional fees and expenses imposed by the insurance company under the variable insurance product contract. If those contract fees and
expenses were included, the performance would be less than that shown. Please refer to the variable insurance product prospectus for a complete listing of these
expenses.
To obtain performance information current to the most recent month end, please
visit
www.schwabassetmanagement.com/prospectus
.
Statistics
Net Assets (millions) |
$180 |
Number of Holdings |
10 |
Portfolio Turnover Rate |
12% |
Advisory Fees Paid by the Fund |
$769,329 |
Foreign Tax Paid and Passed Through |
$90,171 |
Gross Income From Foreign Sources |
$1,101,023 |
Dividends Received Deduction |
14.22% |
Long Term Capital Gain Distribution |
$3,461,292 |
Business Interest Deduction (163j) |
48.92% |
Asset Class Weightings % of Investments
Top Holdings % of Net Assets
Portfolio holdings may have changed since the report date.
Top Holdings % of Net Assets
Portfolio holdings may have changed since the report date.
This annual shareholder report contains important information about the fund for the period of January 1, 2025, to December 31,
2025.
You can find additional information about the fund at
www.schwabassetmanagement.com/prospectus
.
You can also request
this information by calling
1-866-414-6349
or by sending an email request to
orders@mysummaryprospectus.com
.
FUND COSTS FOR THE LAST year ENDED December 31, 2025
(BASED ON A HYPOTHETICAL $10,000 INVESTMENT)
COSTS OF A $10,000 INVESTMENT |
COSTS PAID AS A PERCENTAGE OF A $10,000 INVESTMENT | |
Schwab VIT Growth Portfolio |
$52 |
0.48% |
MANAGEMENT’S DISCUSSION OF FUND PERFORMANCE
For the 12-month reporting period ended December 31, 2025, the fund returned 18.24%. The S&P 500
®
Index, which provides a
broad measure of equity market performance, and the Bloomberg US Aggregate Bond Index, which provides a broad measure of
bond market performance, returned 17.88% and 7.30%, respectively. The fund’s internally calculated comparative index, the VIT
Growth Composite Index (the composite index), returned 18.73%.
■
Asset allocations were broadly in line with those of the composite index
■
Top contributors to total return:
●
Schwab U.S. Large-Cap ETF
●
Schwab International Equity ETF
■
Over the reporting period, there were no detractors from the return of the fund. However, the smallest contributors to total return
were:
●
Schwab U.S. REIT ETF
●
Schwab U.S. Small-Cap ETF
Portfolio holdings may have changed since the report date.
Performance of Hypothetical $10,000 Investment (December 31, 2015 - December 31, 2025)
1
All total return figures on this page assume dividends and distributions were reinvested. Index figures do not include trading and management costs, which would lower
performance. Indices are unmanaged and cannot be invested in directly. Performance results less than one year are not annualized.
For index definitions, please see www.schwabassetmanagement.com/glossary.
1
Fund expenses may have been partially absorbed by the investment adviser and its affiliates. Without these reductions, the fund’s returns would have been lower. Fund
performance does not reflect the additional fees and expenses imposed by the insurance company under the variable insurance product contract. If those contract fees and
expenses were included, the performance would be less than that shown. Please refer to the variable insurance product prospectus for a complete listing of these
expenses.
Average Annual Total Returns
Fund and Inception Date |
1 Year |
5 Years |
10 Years |
Fund: Schwab VIT Growth Portfolio (07/25/2012) 1 |
18.24% |
8.07% |
8.65% |
S&P 500 ® Index |
17.88% |
14.42% |
14.82% |
Bloomberg US Aggregate Bond Index |
7.30% |
-0.36% |
2.01% |
VIT Growth Composite Index |
18.73% |
8.60% |
9.21% |
All total return figures on this page assume dividends and distributions were reinvested. Index figures do not include trading and management costs, which would lower
performance. Indices are unmanaged and cannot be invested in directly. Performance results less than one year are not annualized.
For index definitions, please see www.schwabassetmanagement.com/glossary.
1
Fund expenses may have been partially absorbed by the investment adviser and its affiliates. Without these reductions, the fund’s returns would have been lower. Fund
performance does not reflect the additional fees and expenses imposed by the insurance company under the variable insurance product contract. If those contract fees and
expenses were included, the performance would be less than that shown. Please refer to the variable insurance product prospectus for a complete listing of these
expenses.
To obtain performance information current to the most recent month end, please
visit
www.schwabassetmanagement.com/prospectus
.
Statistics
Net Assets (millions) |
$178 |
Number of Holdings |
8 |
Portfolio Turnover Rate |
12% |
Advisory Fees Paid by the Fund |
$761,934 |
Foreign Tax Paid and Passed Through |
$123,582 |
Gross Income From Foreign Sources |
$1,479,135 |
Dividends Received Deduction |
21.41% |
Long Term Capital Gain Distribution |
$8,962,012 |
Business Interest Deduction (163j) |
31.46% |
Asset Class Weightings % of Investments
Top Holdings % of Net Assets
Portfolio holdings may have changed since the report date.
Top Holdings % of Net Assets
Portfolio holdings may have changed since the report date.