Pay vs Performance Disclosure - USD ($)
Nov. 02, 2025
Nov. 03, 2024
Oct. 29, 2023
Oct. 30, 2022
Oct. 31, 2021
PAY VERSUS PERFORMANCE
The following tables and related disclosure have been prepared in accordance with the SEC’s pay versus performance rules and do not ” above.
reflect
compensation actually earned, realized or received by the NEOs. The Compensation Committee did not consider this pay versus performance disclosure in making its pay decisions for any of the years shown. For a discussion of how the Compensation Committee seeks to align pay with performance when setting NEO compensation, see “Compensation Discussion and Analysis
Year |
Summary Compensation Table (“SCT”) Total for Principal Executive Officer (“PEO”) (1) ($) |
Compensation Actually Paid (“CAP”) to PEO (2) ($ Millions) |
Average SCT Total for Non-PEO NEOs (3) ($) |
Average CAP to Non-PEO NEOs (2) ($) |
Value of Initial Fixed $100 Investment based on: (4) |
Net Income ($ Millions) |
Net Revenue ($ Millions) (5) | |||||||||||||||||||||||||||||||||
TSR ($) |
Peer Group TSR ($) | |||||||||||||||||||||||||||||||||||||||
2025 |
205,278,006 |
2,268 |
19,632,894 |
332,352,803 |
1,182.35 |
243.37 |
23,126 |
63,887 |
||||||||||||||||||||||||||||||||
2024 |
2,634,542 |
1,150 |
10,633,084 |
190,786,530 |
535.10 |
187.18 |
5,895 |
51,574 |
||||||||||||||||||||||||||||||||
2023 |
161,826,161 |
768 |
26,807,158 |
119,860,261 |
261.58 |
131.38 |
14,082 |
35,819 |
||||||||||||||||||||||||||||||||
2022 |
60,606,971 |
50 |
4,444,960 |
(11,048,223 |
) |
143.70 |
106.05 |
11,495 |
33,203 |
|||||||||||||||||||||||||||||||
2021 |
60,703,627 |
84 |
14,983,358 |
42,183,932 |
156.83 |
144.43 |
6,736 |
27,450 |
||||||||||||||||||||||||||||||||
(1) |
The amounts in this column are the amounts reported for Hock E. Tan, our PEO, for each corresponding fiscal year in the “Total” column of the SCT. |
(2) |
The following table shows the fiscal 2025 amounts deducted from and added to the SCT total compensation to calculate the CAP to our NEOs in accordance with SEC rules. |
2025 | |||||||||||||||
PEO ($) |
Average for Non-PEOs ($) | ||||||||||||||
SCT Total |
205,278,006 |
19,632,894 |
|||||||||||||
Value of Stock Awards in SCT |
(202,351,080 |
) |
(18,124,037 |
) | |||||||||||
Year End Fair Value of Unvested Awards Granted in Current Year |
219,080,056 |
37,449,179 |
|||||||||||||
Year Over Year Change in Fair Value of Unvested Awards from Prior Years |
2,045,498,218 |
271,277,883 |
|||||||||||||
Vesting Date Fair Value for Awards Granted and Vested in the Current Year |
— |
910,225 |
|||||||||||||
Change in Fair Value of Awards from Prior Years that Vested in Current Year |
— |
21,206,659 |
|||||||||||||
CAP |
2,267,505,200 |
332,352,803 |
|||||||||||||
(3) |
The amounts in this column are the average amounts reported for our Non-PEO NEOs for each corresponding year in the “Total” column of the SCT for the relevant year. For each of fiscal 2025, 2024 and 2023, our Non-PEO NEOs were Kirsten M. Spears, Mark D. Brazeal and Charlie B. Kawwas, Ph.D. For each of fiscal 2022 and 2021, our Non-PEO NEOs were Kirsten M. Spears, Mark D. Brazeal, Charlie B. Kawwas, Ph.D. and Thomas H. Krause, Jr. |
(4) |
The NASDAQ 100 Index is the industry peer group we used for the purposes of the stock performance graph required by Item 201(e) of Regulation S-K included in our 2025 Annual Report. This table assumes $100 was invested in Broadcom and in the NASDAQ 100 Index, respectively, for the period starting October 30, 2020 through the end of the listed fiscal year. Historical stock performance is not necessarily indicative of future stock performance. |
(5) |
As discussed under “ Compensation Discussion and Analysis — Elements of Fiscal 2025 Executive Compensation Program — Annual Cash Incentive Bonus Plan Non-PEO NEOs for fiscal 2025. |
(3) |
The amounts in this column are the average amounts reported for our Non-PEO NEOs for each corresponding year in the “Total” column of the SCT for the relevant year. For each of fiscal 2025, 2024 and 2023, our Non-PEO NEOs were Kirsten M. Spears, Mark D. Brazeal and Charlie B. Kawwas, Ph.D. For each of fiscal 2022 and 2021, our Non-PEO NEOs were Kirsten M. Spears, Mark D. Brazeal, Charlie B. Kawwas, Ph.D. and Thomas H. Krause, Jr. |
(4) |
The NASDAQ 100 Index is the industry peer group we used for the purposes of the stock performance graph required by Item 201(e) of Regulation S-K included in our 2025 Annual Report. This table assumes $100 was invested in Broadcom and in the NASDAQ 100 Index, respectively, for the period starting October 30, 2020 through the end of the listed fiscal year. Historical stock performance is not necessarily indicative of future stock performance. |
(2) |
The following table shows the fiscal 2025 amounts deducted from and added to the SCT total compensation to calculate the CAP to our NEOs in accordance with SEC rules. |
2025 | |||||||||||||||
PEO ($) |
Average for Non-PEOs ($) | ||||||||||||||
SCT Total |
205,278,006 |
19,632,894 |
|||||||||||||
Value of Stock Awards in SCT |
(202,351,080 |
) |
(18,124,037 |
) | |||||||||||
Year End Fair Value of Unvested Awards Granted in Current Year |
219,080,056 |
37,449,179 |
|||||||||||||
Year Over Year Change in Fair Value of Unvested Awards from Prior Years |
2,045,498,218 |
271,277,883 |
|||||||||||||
Vesting Date Fair Value for Awards Granted and Vested in the Current Year |
— |
910,225 |
|||||||||||||
Change in Fair Value of Awards from Prior Years that Vested in Current Year |
— |
21,206,659 |
|||||||||||||
CAP |
2,267,505,200 |
332,352,803 |
|||||||||||||
RELATIONSHIP BETWEEN CAP AND FINANCIAL PERFORMANCE
The following charts illustrate the relationship between CAP to our PEO and the average of CAP to our
Non-PEO
NEOs, and our cumulative TSR, the Nasdaq 100 TSR, our net income and our net revenue, respectively, over the five most recently completed fiscal years. 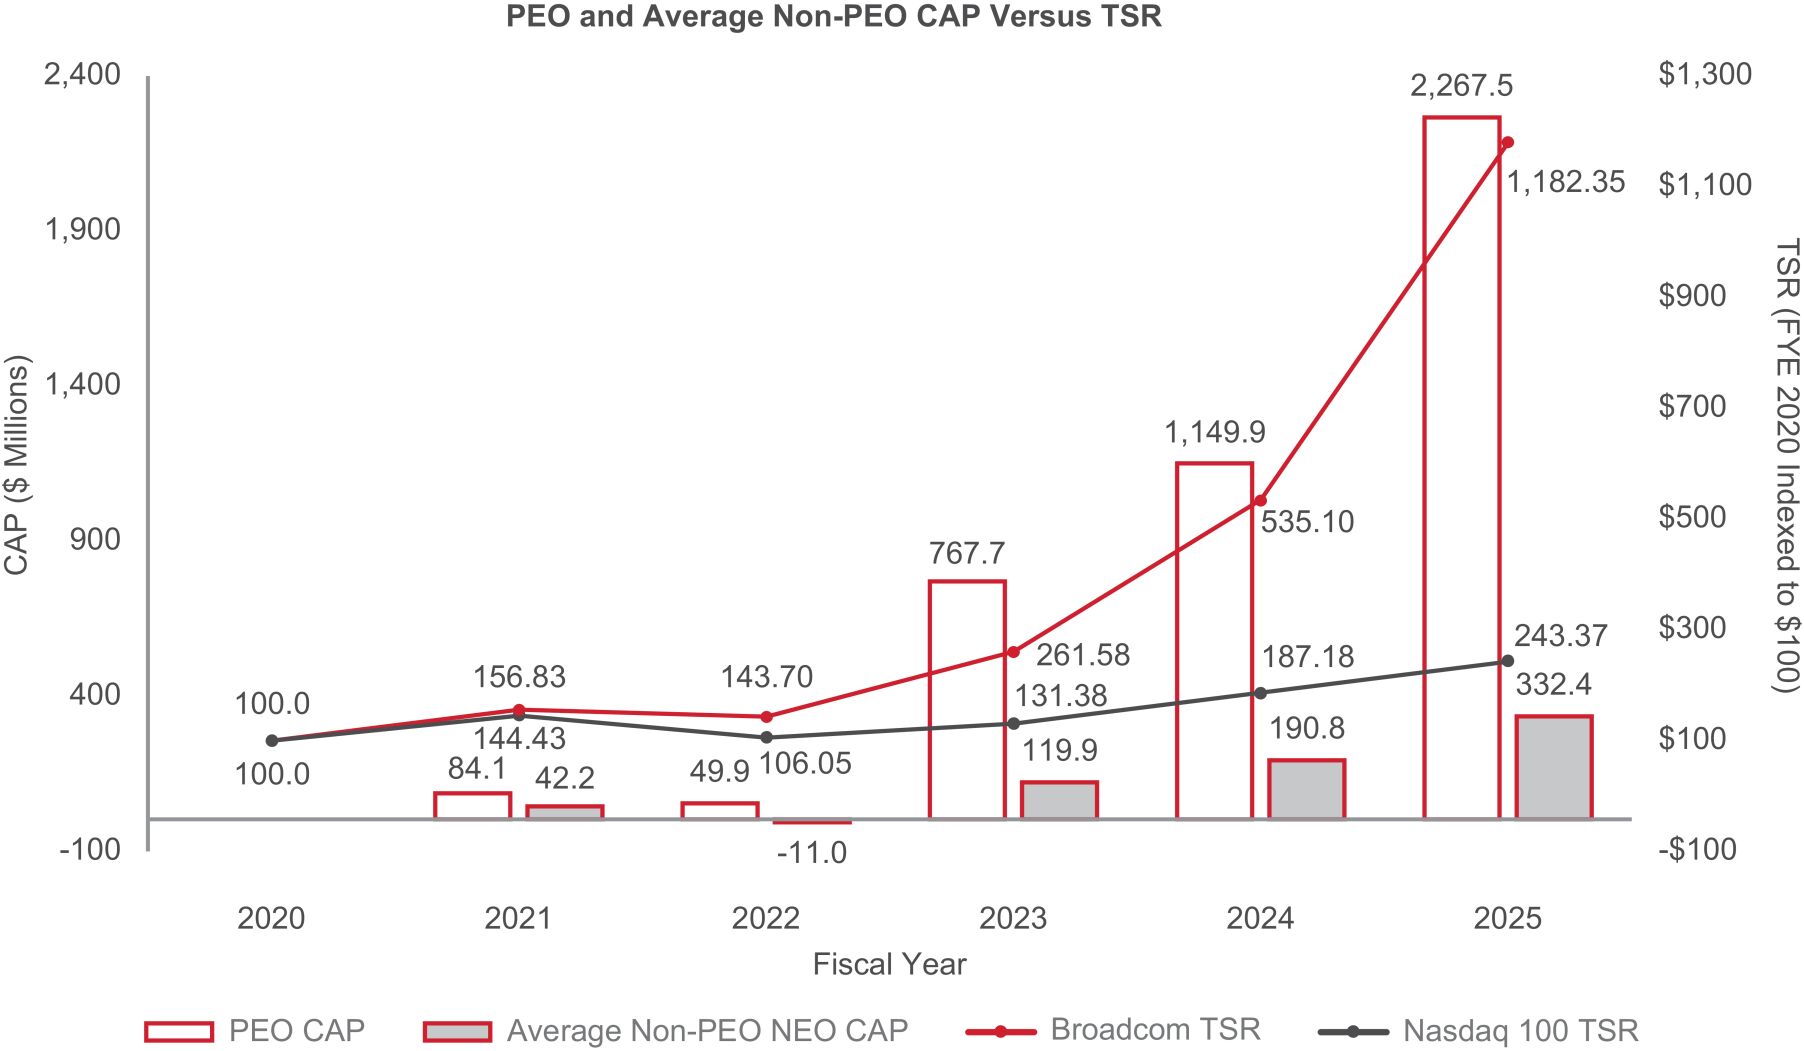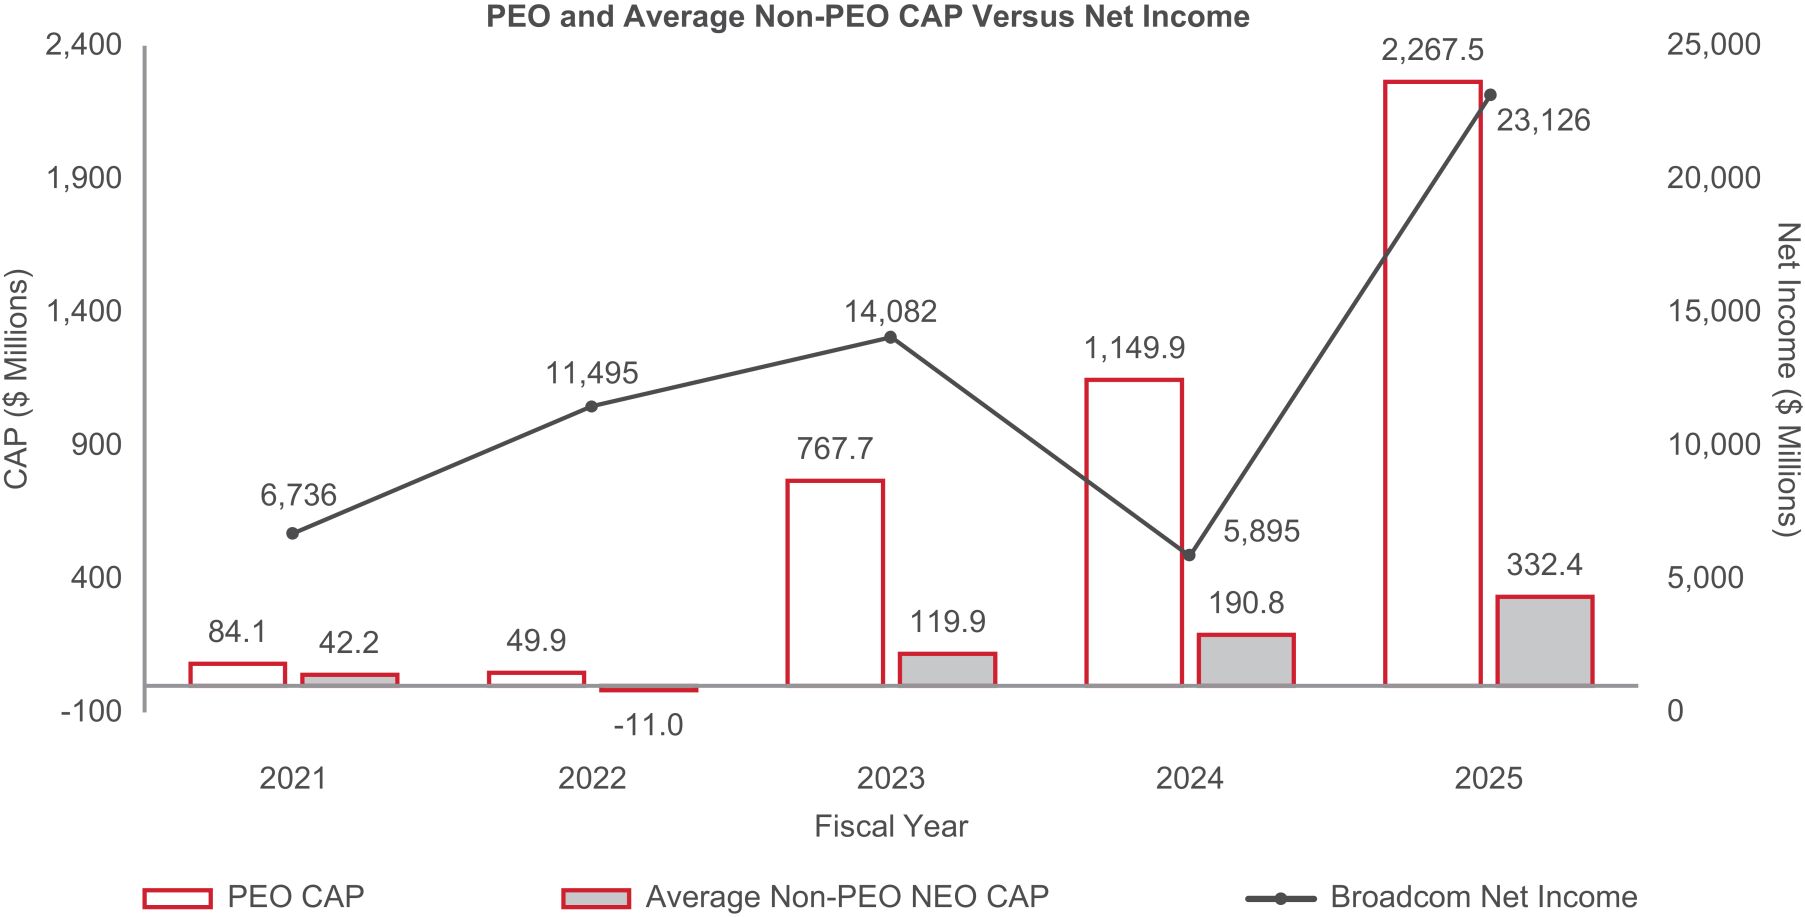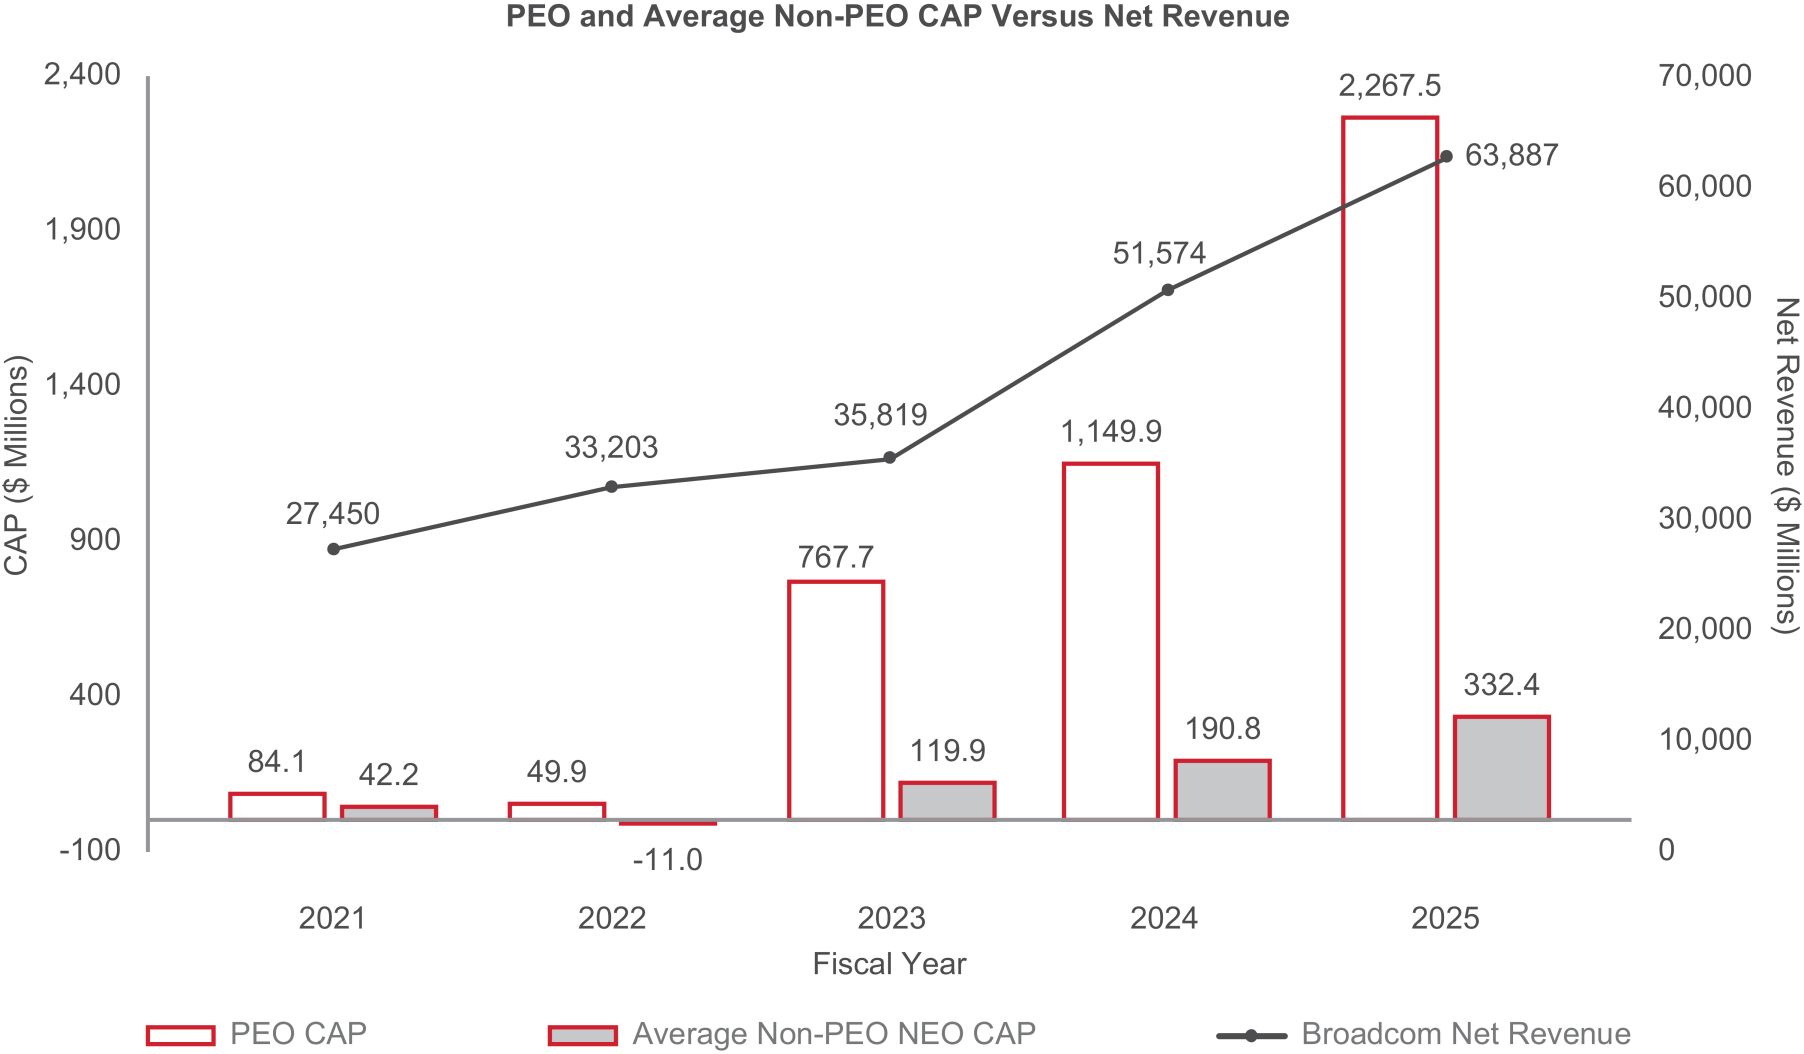
TABULAR LIST OF MOST IMPORTANT FINANCIAL PERFORMANCE MEASURES
The following table presents the financial performance and
non-financial
performance measures that Broadcom considers to have been the most important in linking CAP to our PEO and other NEOs to Broadcom’s performance for fiscal 2025. The measures in this table are further described in “Compensation Discussion and Analysis”
and are not ranked. All financial performance measures we used to link CAP of our PEO’s and other NEO’s to Broadcom’s performance for fiscal 2025 are included on this list. Net Revenue Adjusted Non-GAAP Operating Margin Division Financial and Strategic Goals Individual Performance Modifier TSR performance relative to the S&P 500 |