PAY VERSUS PERFORMANCE
The following table shows the past three fiscal years’ total compensation for our named executive officers as set forth in the Summary Compensation Table, the “compensation actually paid” to our named executive officers (as determined under SEC rules), our total shareholder return (TSR), and our net income.
SEC rules require certain adjustments be made to the Summary Compensation Table totals to determine Compensation Actually Paid as reported in the Pay Versus Performance Table. Compensation Actually Paid does not necessarily represent cash and/or equity value transferred to the applicable named executive officer without restriction, but rather is a valuation calculated under applicable SEC rules. In general, Compensation Actually Paid is calculated as summary compensation table total compensation adjusted to (a) include the value of any pension benefit (or loss) attributed to the past fiscal year, including on account of any amendments adopted during such year; and (b) include the fair market value of equity awards as of November 29, 2025 or, if earlier, the vesting date (rather than the grant date) and factor in dividends and interest accrued with respect to such awards. For purposes of the disclosure below, no pension valuation adjustments were required.
|
Year |
Summary Table Principal Officer |
Compensation |
Average |
Average |
Value of Initial Shareholder (“TSR”) (4) |
Net |
||||||||||||||||||
|
2025 |
$ | 826,500 | $ | 827,800 | $ | 520,450 | $ | 521,490 | $ | 107 | $ | 6,100 | ||||||||||||
|
2024 |
$ | 491,900 | $ | 485,570 | $ | 344,213 | $ | 339,149 | $ | 112 | $ | (9,695 | ) | |||||||||||
|
2023 |
$ | 533,750 | $ | 526,540 | $ | 361,134 | $ | 355,366 | $ | 116 | $ | (3,171 | ) | |||||||||||
(1) The amounts in this column reflect the summary compensation table totals for Mr. Spilman for fiscal years 2023, 2024 and 2025.
(2) The amounts in this column reflect the average summary compensation table totals of our non-CEO NEOs, which includes for 2024 and 2025 Messrs. Cohenour, Daniel and Bassett and for and 2023 Messrs. Cohenour, Daniel, Bassett and David C. Baker.
(3) SEC rules require certain adjustments be made for Summary Compensation Table totals to determine compensation “actually paid” as reported in the Pay versus Performance table. The following tables detail these adjustments.
(4) Total shareholder return (TSR) is determined based on the value of an initial fixed investment of $100.
|
Year |
Executives |
Summary Compensation Table Total |
Deduct Reported Value of Equity Awards(a) |
Add Equity Award Adjustments(b) |
Compensation Actually Paid |
|||||||||||||
|
($) |
($) |
($) |
($) |
|||||||||||||||
|
2025 |
CEO |
826,500 | 0 | 1,300 | 827,800 | |||||||||||||
|
Other NEOs |
520,450 | 0 | 1,040 | 521,490 | ||||||||||||||
|
2024 |
CEO |
491,900 | 0 | (6,330 | ) | 485,570 | ||||||||||||
|
Other NEOs |
344,213 | 0 | (5,064 | ) | 339,149 | |||||||||||||
|
2023 |
CEO |
533,750 | 52,650 | 45,440 | 526,540 | |||||||||||||
|
Other NEOs |
361,134 | 42,120 | 36,352 | 355,366 | ||||||||||||||
|
(a) |
The amounts in this column represent the grant date fair value of equity awards as reported in the “Stock Awards” column of the Summary Compensation Table for each applicable year. |
|
(b) |
The equity award adjustments for each applicable year include the addition (or subtraction, as applicable) of the following: |
|
i. |
the year-end fair value of any equity awards granted in the applicable year that are outstanding and unvested as of the end of the year; |
|
ii. |
the amount of change in fair value as of the end of the applicable year (from the end of the prior fiscal year) of any awards granted in prior years that are outstanding and unvested as of the end of the applicable year; |
|
iii. |
for awards that are granted and vest in the same applicable year, the fair value as of the vesting date; |
|
iv. |
for awards granted in prior years that vest in the applicable year, the amount equal to the change in fair value as of the vesting date (from the end of the prior fiscal year); |
|
v. |
for awards granted in prior years that are determined to fail to meet the applicable vesting conditions during the applicable year, a deduction for the amount equal to the fair value at the end of the prior fiscal year; and |
|
vi. |
the dollar value of any dividends or other earnings paid on equity awards In the applicable year prior to the vesting date that are not otherwise reflected in the fair value of such award or included in any other component of total compensation for the applicable year. |
|
Year |
Executives |
Summary Compensation Table Total |
Deduct Reported Value of Equity Awards(a) |
Add Equity Award Adjustments(b) |
Compensation Actually Paid |
|||||||||||||
|
($) |
($) |
($) |
($) |
|||||||||||||||
|
2025 |
CEO |
826,500 | 0 | 1,300 | 827,800 | |||||||||||||
|
Other NEOs |
520,450 | 0 | 1,040 | 521,490 | ||||||||||||||
|
2024 |
CEO |
491,900 | 0 | (6,330 | ) | 485,570 | ||||||||||||
|
Other NEOs |
344,213 | 0 | (5,064 | ) | 339,149 | |||||||||||||
|
2023 |
CEO |
533,750 | 52,650 | 45,440 | 526,540 | |||||||||||||
|
Other NEOs |
361,134 | 42,120 | 36,352 | 355,366 | ||||||||||||||
|
(a) |
The amounts in this column represent the grant date fair value of equity awards as reported in the “Stock Awards” column of the Summary Compensation Table for each applicable year. |
|
(b) |
The equity award adjustments for each applicable year include the addition (or subtraction, as applicable) of the following: |
|
i. |
the year-end fair value of any equity awards granted in the applicable year that are outstanding and unvested as of the end of the year; |
|
ii. |
the amount of change in fair value as of the end of the applicable year (from the end of the prior fiscal year) of any awards granted in prior years that are outstanding and unvested as of the end of the applicable year; |
|
iii. |
for awards that are granted and vest in the same applicable year, the fair value as of the vesting date; |
|
iv. |
for awards granted in prior years that vest in the applicable year, the amount equal to the change in fair value as of the vesting date (from the end of the prior fiscal year); |
|
v. |
for awards granted in prior years that are determined to fail to meet the applicable vesting conditions during the applicable year, a deduction for the amount equal to the fair value at the end of the prior fiscal year; and |
|
vi. |
the dollar value of any dividends or other earnings paid on equity awards In the applicable year prior to the vesting date that are not otherwise reflected in the fair value of such award or included in any other component of total compensation for the applicable year. |
Relationship of Pay and Performance Measures*
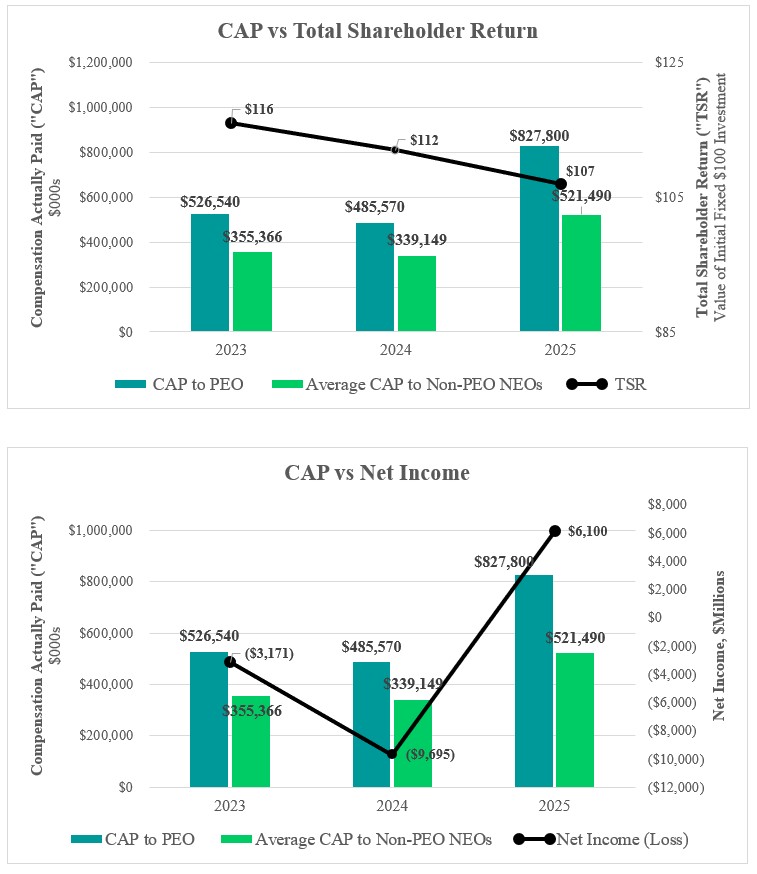
*Compensation Actually Paid (“CAP”)
Relationship of Pay and Performance Measures*
*Compensation Actually Paid (“CAP”)
The amounts deducted or added in calculating the equity award adjustments are as follows:
|
Unvested Awards |
Vested Awards |
|||||||||||||||||||||||||||||
|
Year |
Executive |
Year end fair value of equity awards granted during the year and outstanding and unvested at year end |
Year over year change in fair value of outstanding and unvested equity awards at year end |
Fair value as of vesting date of equity awards granted and vested in the year |
Change as of vesting date from prior year end of prior awards that vested during year |
Deduct forfeited awards (fair value at end of prior year) |
Value of dividends or other earnings paid |
Total equity award adjustments |
||||||||||||||||||||||
|
($) |
($) |
($) |
($) |
($) |
($) |
($) |
||||||||||||||||||||||||
|
2025 |
CEO |
0 | 300 | 0 | 1,000 | 0 | 0 | 1,300 | ||||||||||||||||||||||
|
Other NEOs |
0 | 240 | 0 | 800 | 0 | 0 | 1,040 | |||||||||||||||||||||||
|
2024 |
CEO |
0 | (4,200 | ) | 0 | (2,130 | ) | 0 | 0 | (6,330 | ) | |||||||||||||||||||
|
Other NEOs |
0 | (3,360 | ) | 0 | (1,704 | ) | 0 | 0 | (5,064 | ) | ||||||||||||||||||||
|
2023 |
CEO |
49,890 | (3,980 | ) | 0 | (470 | ) | 0 | 0 | 45,440 | ||||||||||||||||||||
|
Other NEOs |
39,912 | (3,184 | ) | 0 | (376 | ) | 0 | 0 | 36,352 | |||||||||||||||||||||