
Manulife Financial Corporation
Management’s Discussion and Analysis
For the year ended December 31, 2025
1 | 2025 Annual Report | Management’s Discussion and Analysis |
Caution regarding forward-looking statements
From time to time, Manulife Financial Corporation (“MFC”) makes written and/or oral forward-looking statements, including in this
document. In addition, our representatives may make forward-looking statements orally to analysts, investors, the media and
others. All such statements are made pursuant to the “safe harbour” provisions of Canadian provincial securities laws and the
U.S. Private Securities Litigation Reform Act of 1995.
The forward-looking statements in this document include, but are not limited to, statements with respect to possible share
buybacks, the Company’s strategic priorities and targets, its medium-term financial and operating targets, the probability and
impact of the Life Insurance Capital Adequacy Test (“LICAT”) scenario switches, the anticipated benefits of the acquisitions of
Comvest Credit Partners (“Comvest”) and PT Schroder Investment Management Indonesia (“Schroders Indonesia”), our entry
into the Indian insurance market and its anticipated benefits, the anticipated benefits and value derived from the use of AI, future
premium increases, and exposure limit estimates for our property and casualty reinsurance business, and also relate to, among
other things, our objectives, goals, strategies, intentions, plans, beliefs, expectations and estimates, and can generally be
identified by the use of words such as “may”, “will”, “could”, “should”, “would”, “likely”, “suspect”, “outlook”, “expect”, “intend”,
“estimate”, “anticipate”, “believe”, “plan”, “forecast”, “objective”, “seek”, “aim”, “continue”, “goal”, “restore”, “embark” and
“endeavour” (or the negative of any thereof) and words and expressions of similar import, and include statements concerning
possible or assumed future results. Although we believe that the expectations reflected in such forward-looking statements are
reasonable, such statements involve risks and uncertainties, and undue reliance should not be placed on such statements and
they should not be interpreted as confirming market or analysts’ expectations in any way.
Certain material factors or assumptions are applied in making forward-looking statements and actual results may differ materially
from those expressed or implied in such statements. Important factors that could cause actual results to differ materially from
expectations include, but are not limited to: general business and economic conditions (including but not limited to the
performance, volatility and correlation of equity markets, interest rates, credit and swap spreads, inflation rates, currency rates,
investment losses and defaults, market liquidity and creditworthiness of guarantors, reinsurers and counterparties); changes in
laws and regulations; changes in accounting standards applicable in any of the territories in which we operate; changes in
regulatory capital requirements; our ability to obtain premium rate increases on in-force policies; our ability to execute strategic
plans and changes to strategic plans; downgrades in our financial strength or credit ratings; our ability to maintain our reputation;
impairments of goodwill or intangible assets or the establishment of provisions against future tax assets; the accuracy of
estimates relating to morbidity, mortality and policyholder behaviour; the accuracy of other estimates used in applying accounting
policies, actuarial methods and embedded value methods; our ability to implement effective hedging strategies and unforeseen
consequences arising from such strategies; our ability to source appropriate assets to back our long-dated liabilities; level of
competition and consolidation; our ability to market and distribute products through current and future distribution channels;
unforeseen liabilities or asset impairments arising from acquisitions and dispositions of businesses; the realization of losses
arising from the sale of investments classified as fair value through other comprehensive income; our liquidity, including the
availability of financing to satisfy existing financial liabilities on expected maturity dates when required; obligations to pledge
additional collateral; the availability of letters of credit to provide capital management flexibility; accuracy of information received
from counterparties and the ability of counterparties to meet their obligations; the availability, affordability and adequacy of
reinsurance; legal and regulatory proceedings, including tax audits, tax litigation or similar proceedings; our ability to adapt
products and services to the changing market; our ability to attract and retain key executives, employees and agents; the
appropriate use and interpretation of complex models or deficiencies in models used; political, legal, operational and other risks
associated with our operations; geopolitical uncertainty, including international conflicts and trade disputes; acquisitions and our
ability to complete acquisitions including the availability of equity and debt financing for this purpose; the disruption of or changes
to key elements of the Company’s or public infrastructure systems; environmental concerns including climate change; our ability
to protect our intellectual property and exposure to claims of infringement; our inability to withdraw cash from subsidiaries; the
anticipated benefits of the Comvest Credit and Schroders Indonesia acquisitions; the receipt of regulatory approvals and
satisfaction of closing conditions for the Schroders Indonesia acquisition; the receipt of regulatory approvals for entering into the
Indian insurance market and the anticipated benefits of such entry; our ability to execute our digital plans and to deploy future
digital use cases and derive value from AI; receipt of regulatory approval from the Toronto Stock Exchange for our new normal
course issuer bid, and the fact that the amount and timing of any future common share repurchases will depend on the earnings,
cash requirements and financial condition of Manulife, market conditions, capital requirements (including under LICAT capital
standards), common share issuance requirements, applicable law and regulations (including Canadian and U.S. securities laws
and Canadian insurance company regulations), and other factors deemed relevant by Manulife, and may be subject to regulatory
approval or conditions.
Additional information about material risk factors that could cause actual results to differ materially from expectations and about
material factors or assumptions applied in making forward-looking statements may be found in this document under “Risk
Management and Risk Factors”, “Critical Actuarial and Accounting Policies” and in the “Risk Management” note to the Annual
Consolidated Financial Statements as well as elsewhere in our filings with Canadian and U.S. securities regulators.
The forward-looking statements in this document are, unless otherwise indicated, stated as of February 11, 2026 and are
presented for the purpose of assisting investors and others in understanding our financial position and results of operations, our
future operations, as well as our objectives and strategic priorities, and may not be appropriate for other purposes. We do not
undertake to update any forward-looking statements, except as required by law.
| 2 | |
Contents
Management's Discussion and Analysis | |
1. Manulife Financial Corporation . . . . . . . . . . . . . . . . . . . . . . . . . . . . . . . . . . . . . . . . . . . . . . . . . . . . . . . . . . . . . . . . . | |
2. Asia . . . . . . . . . . . . . . . . . . . . . . . . . . . . . . . . . . . . . . . . . . . . . . . . . . . . . . . . . . . . . . . . . . . . . . . . . . . . . . . . . . . . . . . . | |
3. Canada . . . . . . . . . . . . . . . . . . . . . . . . . . . . . . . . . . . . . . . . . . . . . . . . . . . . . . . . . . . . . . . . . . . . . . . . . . . . . . . . . . . . . | |
4. U.S. . . . . . . . . . . . . . . . . . . . . . . . . . . . . . . . . . . . . . . . . . . . . . . . . . . . . . . . . . . . . . . . . . . . . . . . . . . . . . . . . . . . . . . . . | |
5. Global Wealth and Asset Management . . . . . . . . . . . . . . . . . . . . . . . . . . . . . . . . . . . . . . . . . . . . . . . . . . . . . . . . . . | |
6. Corporate and Other . . . . . . . . . . . . . . . . . . . . . . . . . . . . . . . . . . . . . . . . . . . . . . . . . . . . . . . . . . . . . . . . . . . . . . . . . . | |
7. Investments . . . . . . . . . . . . . . . . . . . . . . . . . . . . . . . . . . . . . . . . . . . . . . . . . . . . . . . . . . . . . . . . . . . . . . . . . . . . . . . . . | |
8. Fourth Quarter Financial Highlights . . . . . . . . . . . . . . . . . . . . . . . . . . . . . . . . . . . . . . . . . . . . . . . . . . . . . . . . . . . . . | |
9. Risk Management and Risk Factors . . . . . . . . . . . . . . . . . . . . . . . . . . . . . . . . . . . . . . . . . . . . . . . . . . . . . . . . . . . . | |
10. Capital Management Framework . . . . . . . . . . . . . . . . . . . . . . . . . . . . . . . . . . . . . . . . . . . . . . . . . . . . . . . . . . . . . . . | |
11. Critical Actuarial and Accounting Policies . . . . . . . . . . . . . . . . . . . . . . . . . . . . . . . . . . . . . . . . . . . . . . . . . . . . . . . . | |
12. Controls and Procedures . . . . . . . . . . . . . . . . . . . . . . . . . . . . . . . . . . . . . . . . . . . . . . . . . . . . . . . . . . . . . . . . . . . . . . | |
13. Non-GAAP and Other Financial Measures . . . . . . . . . . . . . . . . . . . . . . . . . . . . . . . . . . . . . . . . . . . . . . . . . . . . . . . | |
14. Additional Disclosures . . . . . . . . . . . . . . . . . . . . . . . . . . . . . . . . . . . . . . . . . . . . . . . . . . . . . . . . . . . . . . . . . . . . . . . . |
1 This item is a non-GAAP financial measure. See “Non-GAAP and Other Financial Measures” below for more information.
3 | 2025 Annual Report | Management’s Discussion and Analysis |
Management’s Discussion and Analysis
This Management’s Discussion and Analysis (“MD&A”) is current as of February 11, 2026.
1. Manulife Financial Corporation
Manulife Financial Corporation is a leading international financial services provider, headquartered in Toronto, Canada.
Anchored in our ambition to be the number one choice for customers, we operate as Manulife across Canada and Asia,
and primarily as John Hancock in the United States, providing financial advice and insurance for individuals, groups
and businesses. Through Manulife Wealth & Asset Management, the global brand for our Global Wealth and Asset
Management segment, we serve individuals, institutions and retirement plan members worldwide. At the end of 2025,
we had more than 37,000 employees, over 106,000 agents, and thousands of distribution partners, serving over 37
million customers with operations across 25 markets globally. At the end of 2025, we had $1.7 trillion (US$1.2 trillion) in
assets under management and administration1, including total invested assets of $0.5 trillion (US$0.3 trillion), and
segregated funds net assets of $0.5 trillion (US$0.3 trillion). We trade as ‘MFC’ on the Toronto, New York, and Philippine
stock exchanges, and under ‘945’ on the Hong Kong stock exchange.
Our reporting segments are:
•Asia – providing insurance products and insurance-based wealth accumulation products in Asia.
•Canada – providing insurance products, insurance-based wealth accumulation products, and banking services in Canada.
•U.S. – providing life insurance products and insurance-based wealth accumulation products as well as having an in-force
long-term care insurance business and an in-force annuity business.
•Global Wealth and Asset Management (“Global WAM”) – providing innovative investment solutions to our retail, retirement,
and institutional clients around the world under the Manulife Wealth & Asset Management brand.
•Corporate and Other – comprised of investment performance on assets backing capital, net of amounts allocated to
operating segments; financing costs; costs incurred by the corporate office related to shareholder activities (not allocated to
operating segments); our Property and Casualty (“P&C”) Reinsurance business; and run-off reinsurance operation.
In this document, the terms “Company”, “Manulife”, “we” and “our” mean Manulife Financial Corporation (“MFC”) and its
subsidiaries. The term “MLI” means The Manufacturers Life Insurance Company and its subsidiaries.
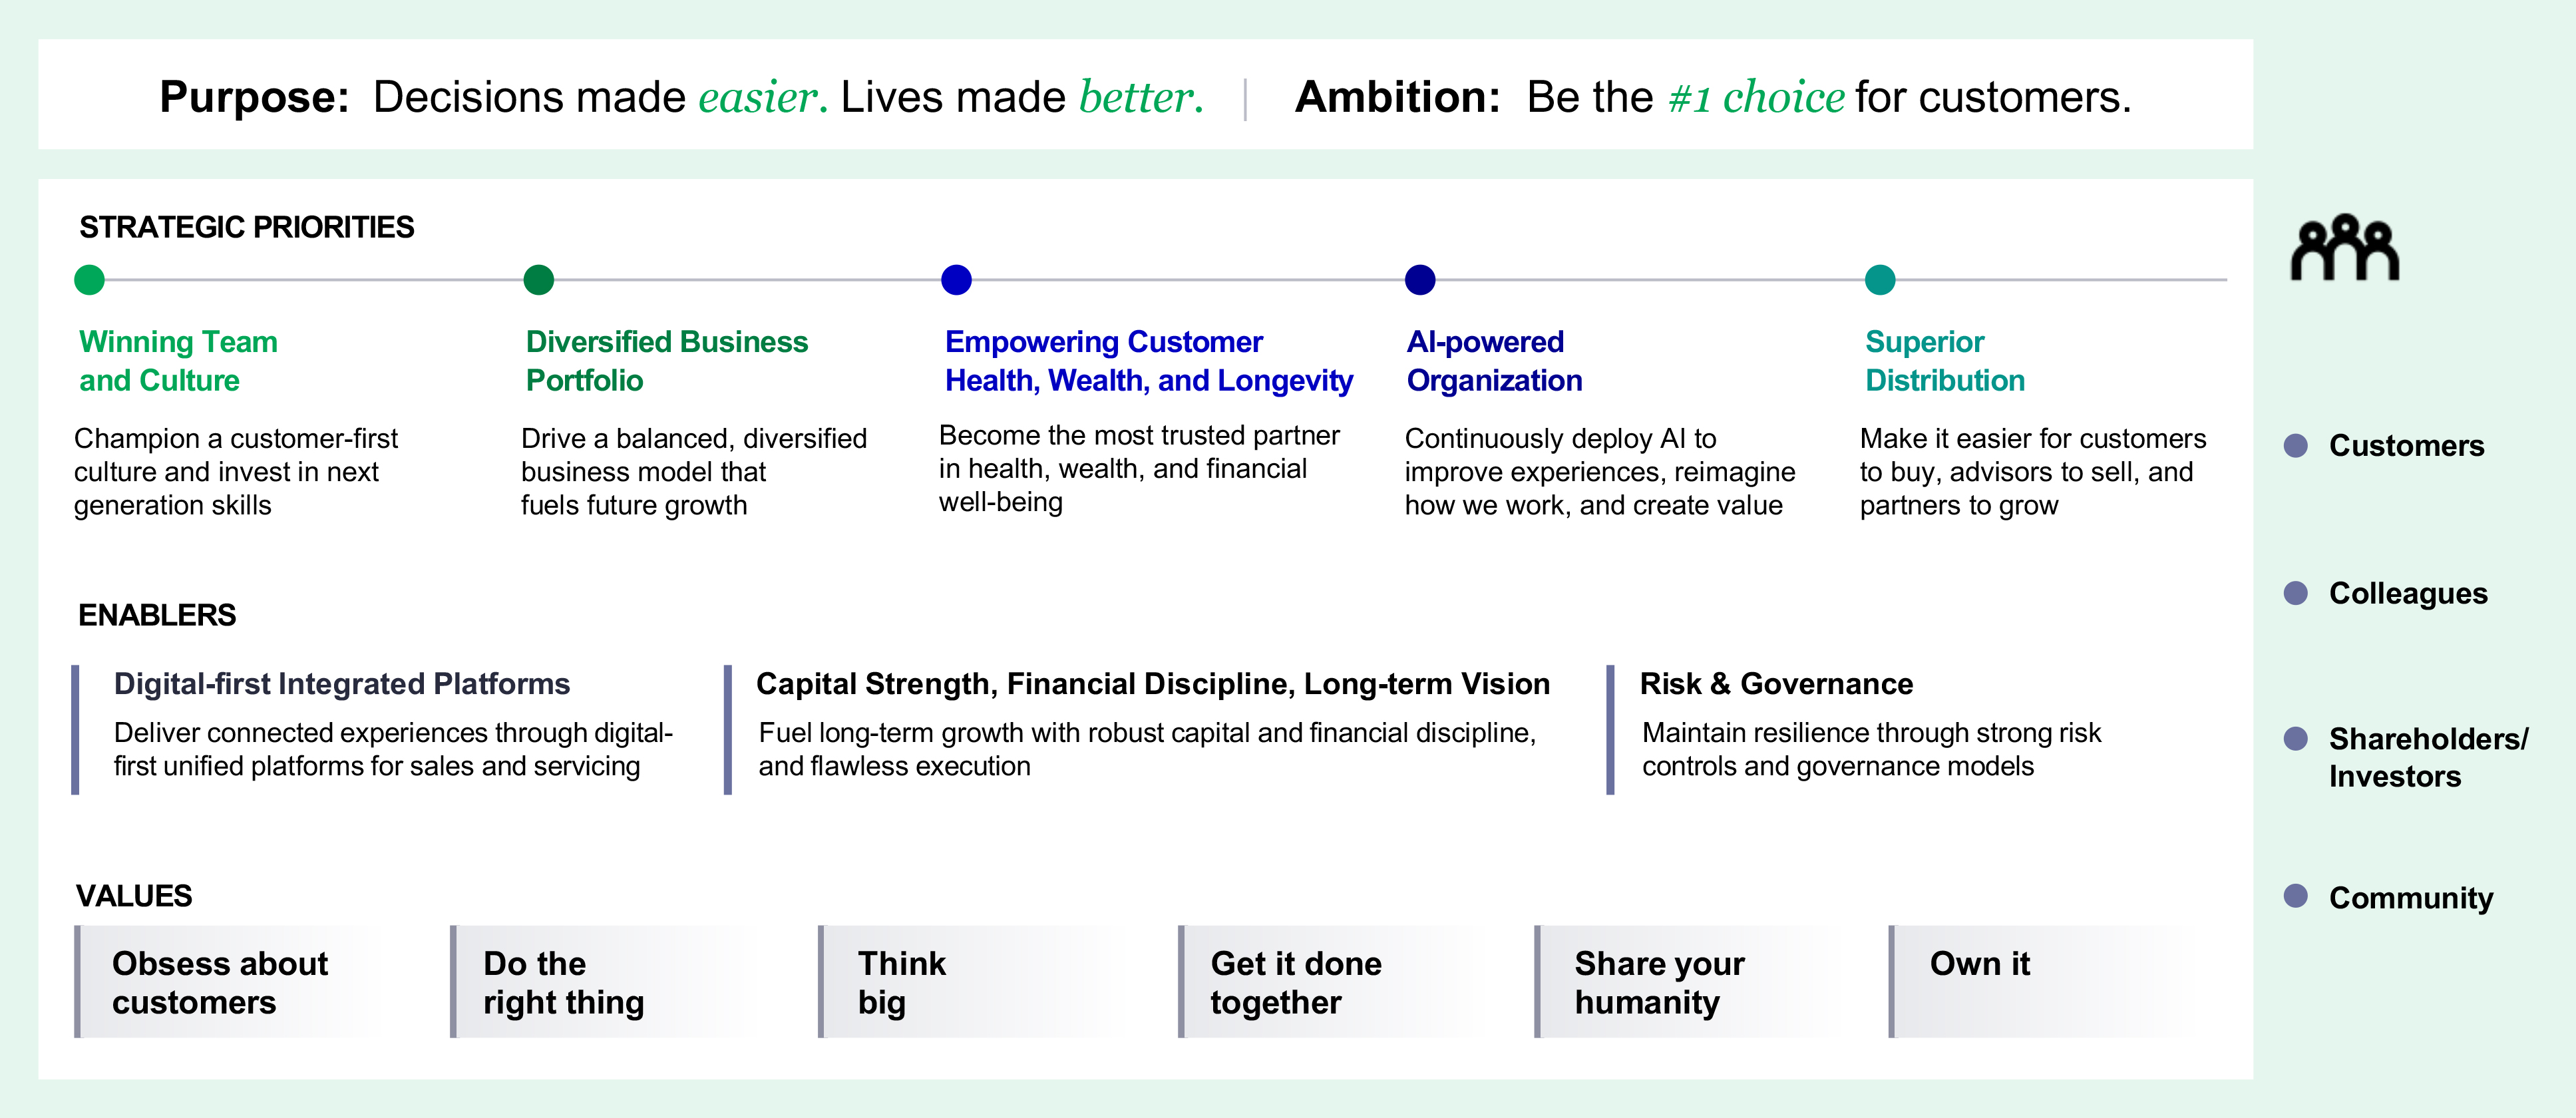
Enterprise Strategy
In November 2025, we announced our refreshed enterprise strategy as summarized below:
1 Based on the annual global employee engagement survey conducted by Gallup. Ranking is measured by the engagement grand mean as compared to Gallup’s
Finance and Insurance Company level database.
| 4 | |
Strategic Priorities and Progress Update
We are well-positioned to make significant progress on our refreshed strategy to achieve sustainable long-term growth.
Throughout 2025, we undertook various initiatives that equipped us to deliver on our new and elevated strategic priorities as
outlined below.
Winning Team and Culture | ||||
Champion a customer-first culture and invest in next generation skills. Focus areas: •Build a sustainable growth culture that drives customer focus, innovation and speed •Elevate colleague experience where all colleagues can grow, lead and thrive •Drive inclusion across our workplace •Continue to strengthen our value proposition and position Manulife as a magnet for top talent | ||||
Winning Team and Culture builds on the strong foundation of colleague engagement, performance, and inclusion, and supports
our priority to champion a customer-first culture and invest in next generation skills.
For the sixth year in a row, we have achieved a top quartile employee engagement rank.1
2025 Highlights
•Included for the first time in the TIME World’s Best Companies (2025) list, which encompassed 1,000 global organizations.
The assessment focused on three key dimensions: employee satisfaction, revenue growth, and sustainability transparency.
•Awarded the 2025 Gallup Exceptional Workplace Award for the third year in a row, which specifically recognized us for our
progressive policies, competitive compensation and benefits, training and career development opportunities, and a flexible
working approach that demonstrates our commitment to wellness.
•Recognized by Forbes as one of the World’s Best Employers for the sixth consecutive year, as one of the World’s Top
Companies for Women, and included on their list of the World’s Best Life Insurance Companies for the first time.
•Recognized globally across various markets by a number of leading organizations:
◦Winner of the “Best Companies to Work for in Asia Award” by HR Asia in seven of our Asia markets;
◦Recognized by MediaCorp as one of Canada’s Top 100 Employers, Greater Toronto’s Top Employers, and Canada’s
Top Employers for Young People for the fifth year in a row;
◦Named one of Canada’s Most Admired Corporate Cultures by Waterstone for the fifth time;
◦John Hancock was included on Fortune’s 2025 Change the World list for our industry-leading Vitality Program, marking
us as the only life insurer acknowledged; and
◦Won Gold in all three categories of the inaugural Racial D&I Employers Award Scheme from Hong Kong’s Equal
Opportunities Commission: Racial Equity in Hiring Award, Inclusive Workplace Award, and Community Engagement
Award.
Diversified Business Portfolio | ||||
Drive a balanced, diversified business model that builds on our strong foundation to fuel high-quality, sustainable growth across all our segments, through organic and inorganic opportunities. Focus areas: •In Asia, deliver distribution excellence and holistic customer solutions •In Global WAM, deliver superior outcomes for customers •In Canada, build on our momentum and deepen customer relationships across life, health, and wealth solutions •In the U.S., strategically target high growth areas via our differentiated solutions | ||||
We continue to drive a diversified business model that strives to deliver high quality sustainable growth across all segments. Asia
and Global WAM segments remain as high-growth businesses, but we also plan to invest in our Canada and U.S. segments,
having demonstrated our ability to deliver attractive new business performance in recent years. While the North American
markets are more mature, opportunities for profitable growth remain, which supports our goal of sustaining and growing scale in
these markets as a globally diversified organization.
1 Subject to the receipt of regulatory approvals. See “Caution regarding forward-looking statements” above.
2 Assets under management (“AUM”) is a non-GAAP financial measure. See “Non-GAAP and Other Financial Measures” below for more information.
3 See “Caution regarding forward looking statements” above.
4 Subject to the receipt of regulatory approvals and satisfaction of customary closing conditions. See “Caution regarding forward looking statements” above.
5 | 2025 Annual Report | Management’s Discussion and Analysis |
2025 Highlights
•In Asia, we continued to expand our geographical presence and strengthen our market reach:
◦Agreed to establish a 50:50 life insurance joint venture with Mahindra & Mahindra Ltd. (“Mahindra”), an existing partner
through our asset management joint venture, to enter the India insurance market.1 This partnership will expand our
global footprint and position us to grow across one of the world’s largest economies, delivering long-term value; and
◦Became the first international life insurer to establish an office in the Dubai International Financial Centre dedicated to
advising on and arranging life insurance contracts to high-net-worth (“HNW”) customers. This strategic move deepens
our presence in the Middle East and enhances our ability to address the growing wealth and protection needs of HNW
and ultra-HNW individuals in the region.
•In Global WAM, we executed several initiatives to drive sustainable growth opportunities and deliver comprehensive
investment solutions:
◦Acquired 75% of Comvest Credit Partners (“Comvest”), a U.S. private credit manager with $17.5 billion of AUM as at the
acquisition date.2 The acquisition will enhance our private credit capabilities and create a comprehensive platform by
aligning Comvest and Manulife’s existing senior credit team.3 By leveraging Comvest’s investment philosophy and
expertise, we can offer clients expanded access to differentiated private credit strategies;
◦Entered into an agreement to acquire PT Schroder Investment Management Indonesia (“Schroders Indonesia”),
strengthening our position as the largest asset manager in Indonesia. It will enable us to deliver enhanced value to our
clients and stakeholders by leveraging the firm’s local expertise and client relationships4; and
◦Successfully closed the Manulife Infrastructure Fund III, L.P., raising over US$5.5 billion from existing and new
investors. This milestone reflects the continued strength of our North American mid-market infrastructure strategy and
our commitment to meeting investor needs for alternative solutions through strategic expansion of our product offerings.
•In Canada, we expanded solutions for Canadians and their families to meet their wealth and protection needs:
◦Launched a simplified specialized lending suite of products in Manulife Bank to streamline the lending experience for
advisors serving HNW clients and business owners. This emphasizes our focus on removing friction, enhancing clarity,
and delivering smarter, faster, and more personalized solutions for advisors and customers; and
◦Introduced an enhanced online life and health insurance application form that reduces complexity, accelerates medical
data collection, and shortens processing times through adaptive questioning and streamlined workflows, transforming
the digital experience for advisors. These efficiencies strengthen our competitiveness in the mass market segment and
support our ambition of delivering scalable digital offerings.
•In the U.S., we delivered strong new business growth by strengthening our distribution model and diversifying our portfolio
with new offerings and enhancements, including:
◦An accumulation survivorship indexed universal life product, John Hancock’s first offering in this product category;
◦A new hybrid indexed universal life insurance solution offering more flexible living benefits and a streamlined digital
application process; and
◦A new variable universal life insurance solution with improved fund selection and index loans.
Empowering Customer Health, Wealth, and Longevity | ||||
Become the most trusted partner in health, wealth, and financial well-being. Focus areas: •Through product innovation, digital solutions and partnerships, further enhance our differentiated value propositions and generate sustained value for our customers, colleagues, and the communities where we live and work •Continue to support global research, thought leadership, advocacy, and community investment, contributing to longer, healthier, and more financially secure lives for our stakeholders | ||||
With global megatrends, such as the widening retirement and health protection gaps as global populations live longer, there is
significant opportunity to create shared value solutions and drive positive outcomes across customer lifespans. Leveraging our
market-leading behavioural insurance capabilities in the U.S., we will expand our expertise globally to enhance customer
outcomes, as well as provide advice, guidance, and investment solutions to our wealth and asset management customers. In
Asia, we aim to provide innovative health solutions across the region, while in Canada, we intend to scale a digital health
ecosystem across our businesses, creating a unified platform for access to care. In the U.S., we seek to continue to leverage our
expertise in the wellness and longevity economy.
We launched the Manulife Longevity Institute, a global platform for research, thought leadership, innovation, advocacy and
community partnerships. Through this unified platform, we are investing $350 million through 2030 to help people live longer,
healthier, and more financially secure lives.
1 Maven Clinic, Meet Maven, 2024.
| 6 | |
2025 Highlights
•We further leveraged our strategic partnership with GRAIL and launched various initiatives across our segments, including
expanded access to the Galleri® multi-cancer early detection test to eligible Manulife Vitality program members in Canada
and to eligible plan participants in U.S. Retirement.
•In Asia, we continued to enhance our health, wealth, and longevity propositions to meet the evolving needs of customers
seeking better health and wellness outcomes:
◦Agreed to establish a strategic collaboration with Bupa International Limited, a global healthcare company, to create a
more robust and integrated healthcare network for our customers. By combining the strengths of both organizations,
this collaboration in Hong Kong aims to expand customer access to high-quality care while enhancing convenience,
value, and affordability through integrated healthcare solutions and personalized support throughout their healthcare
journey;
◦Launched the enhanced ManulifeMOVE, our flagship lifestyle program, with initial rollout in Singapore and the
Philippines. ManulifeMOVE empowers customers to take charge of their health and well-being, with key enhancements
including differentiated and expanded benefits across preventive health services, medical and assistive care, cancer
care support, health and well-being coaching, fitness and wellness experiences, and community engagement;
◦Hosted Asia’s inaugural Manulife Longevity Symposium in Singapore and the Philippines, reinforcing our commitment to
advancing Asia’s longevity movement. The symposiums brought together over 1,400 healthcare experts, industry
leaders, academics, customers and partners to address the challenge of living not just longer, but better, covering topics
such as health and longevity innovations, and financial well-being; and
◦Delivered enhanced health service coverage and expanded access to cross-border healthcare in Hong Kong. We
launched a cross-border Cancer Drug Support Service through our partnership with one of the leading healthcare
service providers in the China Greater Bay Area. In addition, we broadened select Manulife Hong Kong and Macau
health insurance product coverage to over 38,000 hospitals in mainland China and introduced hospitalization credit
services at more than 800 hospitals in mainland China, enabling patients to receive treatment without upfront payments.
•In Global WAM, we released our second annual global Financial Resilience and Longevity study. With insights drawn from
retirement plan members across all regions, our report outlined tailored steps for each generation and highlighted how
retirement plan providers, sponsors, and advisors can support better financial outcomes across people’s lifespans.
•In Canada, we:
◦Enhanced the Manulife Vitality program and introduced additional resources and incentives for managing and
preventing diabetes, the extension of travel rewards to all members, the addition of ŌURA as a key rewards partner,
and new collaborations offering tools that span nutrition, fitness, mental health, and personalized medicine; and
◦Partnered with Maven Clinic, the world’s largest virtual clinic for women’s and family health1, to offer eligible Group
Benefits members 24/7 virtual access to personalized support during some of their most important stages of life,
including fertility, maternity, parenting, and menopause. This initiative addresses critical care gaps that impact women’s
health and workforce participation.
•In the U.S., we advanced our mission to help our customers live longer, healthier, and better lives:
◦Empowered eligible John Hancock Vitality members with early detection technology and resources to proactively
manage their health, including access to Function Health’s technology and health screening tools, and access to
continuous glucose monitoring technology and dietitian support; and
◦Released the first-of-its-kind Longevity Preparedness Index – developed in collaboration with the MIT AgeLab, to deliver
actionable insights on what it means to prepare well for living longer, and build on our brand awareness in the longevity
space.
AI-powered Organization | ||||
Continuously deploy AI to improve experiences, reimagine how we work, and create value. Focus areas: Key to our strategy is the disciplined deployment of AI underpinned by our responsible AI principles. We will continue to drive growth through three horizons: •Operational efficiency: We are optimizing many of our manual processes to improve efficiency and enhance customer experience •Improved outcomes: We are delivering transformative new capabilities to drive further productivity, grow our top-line, and accelerate decision making through new data sources and real time insights •Enabling growth: We are exploring opportunities to innovate with AI-based products and business models, and new sources of data | ||||
Our AI transformation continued to deliver meaningful impact, as we embed AI across our businesses. As of December 31, 2025,
we had 91 use cases in production and another 121 in development. Notably, Manulife was ranked first among life insurers and
1 The Evident AI Index for Insurance assesses AI maturity across 30 of the most prominent insurance companies in North America and Europe, measuring progress
across four key categories: Talent, Innovation, Leadership, and Transparency.
2 Figure excludes mainland China. A refactored version of ChatMFC has been deployed and is available to all employees in our mainland China life insurance joint
venture.
7 | 2025 Annual Report | Management’s Discussion and Analysis |
top five overall in the inaugural Evident AI Insurance Index1, underscoring our leadership in AI maturity and responsible
innovation.
Building on this momentum, we are progressing toward a proprietary Agentic AI Platform – a foundational element of our
enterprise AI strategy. This approach seeks to make it easier to manage and coordinate AI tools across different systems by
enabling our teams to share ideas, work and code across markets, so we can roll out AI faster and more consistently.
Additionally, it includes automated checks to make sure all AI models meet strict safety and risk standards, streamlining parts of
our AI governance process and making it more effective.
2025 Highlights
•Enterprise-wide:
◦We deployed GenAI sales enablement solutions across nine markets and multiple business lines in all four operating
segments, delivering measurable results, accelerating information access and elevating client interactions. These
GenAI-powered solutions empowered agents, advisors and distribution partners with personalized engagement
insights, automated email drafting, and real-time coaching to drive sales performance; and
◦ChatMFC is a core productivity platform for Manulife, delivering enterprise-wide value since we achieved 100% global
workforce coverage2 including contingent workers. Throughout 2025, ChatMFC has seen major feature rollouts such as
integration with key knowledge bases, as well as implementation of document upload and end-to-end translation
capabilities. With strong adoption and continuous innovation, ChatMFC is driving cultural and operational transformation
across the organization, becoming a tool our colleagues lean on to make their work easier, better, and faster.
•In Asia, we:
◦Launched advanced AI-enabled agency tools across the region to enhance sales support and improve customer
experience. In Indonesia, Singapore and Japan, we rolled out AI assistants to provide faster access to product and
policy information and streamline administrative tasks. In Hong Kong, we launched AI Sales Pro – a GenAI-powered
tool that helps agents identify top sales opportunities, craft personalized customer solutions, and access critical know-
how to drive business performance; and
◦Rolled out VOICE in Singapore and Japan, a multi-signal dashboard that includes call trend analysis, net sentiment
scores, topic trends and deep dive insights from call center transcripts. VOICE utilizes GenAI to categorize data, find
correlations, and customize insights by analyzing near real-time trends from customer interactions. These insights help
us to better understand customer sentiment and key interests, enhance services, improve training, and identify
opportunities to better deliver value to our customers.
•In Global WAM, we:
◦Incorporated a suite of AI-powered research tools to enhance investment analysis for our public markets investment
research teams. By integrating internal and external data into actionable insights, we streamline our research process,
accelerate decision-making, and empower our investment professionals to focus on driving value for our clients;
◦Launched an AI-powered sales enablement solution in U.S. Retirement, delivering real-time insights and personalized
content to enhance our sales operations and productivity, improve our sales close ratio, and drive revenue growth. This
reduced the time spent on information searches and tripled the number of sales opportunities compared with 2024; and
◦Expanded our retirement plan offerings with the launch of FutureStepTM and FutureChoiceTM in the U.S., two fully digital
retirement plan solutions that enhance our capabilities and market presence. These new offerings improve user
experience by integrating AI and streamlining both client onboarding and participant access.
•In Canada, we:
◦Introduced an innovative GenAI tool in our Individual Insurance business that automatically generates personalized
communications to advisors by analyzing historical data and identifying available opportunities. This tool enables our
internal sales team to deliver timely, relevant, and actionable messages to drive meaningful interactions and enhance
collaboration with advisors; and
◦Launched a GenAI-powered coaching tool for Licensed Insurance Advisor (“LIA”) supervisors in our Affinity business
that evaluates customer service calls, generating insights that allow supervisors to provide LIAs with more effective,
timely, and targeted feedback to enhance customer service and sales outcomes.
•In the U.S., we:
◦Partnered with Munich Re Life US to enhance underwriting efficiency through alitheia, its AI-driven risk assessment
platform, raising instant underwriting decision eligibility from US$3 million to US$5 million, enabling more customers to
experience a streamlined life insurance application process; and
◦Deployed GenAI capabilities to improve outcomes in our in-force Long Term Care (“LTC”) insurance business, including
further enhancements to automated claims processing and predictive analytics to detect and reduce fraud, waste and
abuse.
1 MDRT membership awarded based on prior year production.
2 This refers to Asia agency annualized premium equivalent (“APE”) sales per active agents.
| 8 | |
Superior Distribution | ||||
Make it easier for customers to buy, advisors to sell, and partners to grow. Focus areas: •Expand our presence across distribution channels and invest in AI tools to help us reach more customers and deliver frictionless experiences for our customers •Further expand professional and digitally enabled agency force in applicable markets •Enhance distribution partnerships with new and differentiated solutions | ||||
In order to sustain a balanced portfolio and fuel sustainable growth, we will continue to invest in making it easier for customers to
buy and advisors to sell our products, and also expand our partnerships with new and differentiated solutions.
In Asia, we expect to further grow and enhance our agency and bank distribution channels, expand health offerings, and
accelerate our HNW leadership on the basis of continued structural trends that support long-term growth, driven by an aging
population, gaps in health, protection and retirement savings, and the rise of middle-income households.
In Global WAM, we have great momentum with a diversified investor base, a robust distribution network and strong capabilities,
and we are investing to continue delivering strong returns and positive experiences for our customers.
In Canada, we are accelerating our digital transformation that deepens our penetration in the mass market and further
strengthens our Group Benefits business.
In the U.S. we continue to leverage our strong brand and trusted relationships with distributors, to deliver sustained scale by
broadening our offerings and expanding our customer base, including within the U.S. HNW and mass affluent customer
segments.
In 2025, we continued to expand our reach through our diversified distribution platforms and advanced strategic partnerships,
such as the renewal of our bancassurance partnership with China Banking Corporation (“Chinabank”) in the Philippines and the
new partnership with Bank of China (Hong Kong) (“BOCHK”) with a flagship fund launch. In addition, we continued to integrate AI
and digital capabilities into our business solutions to more effectively reach our customers and improve their experience.
2025 Highlights
•In Asia, we continued to broaden our reach and leverage strategic partnerships through our diversified distribution platforms
to accelerate growth:
◦Renewed our bancassurance partnership in the Philippines with Chinabank, extending our exclusive partnership until
2039. This strategic partnership, which started in 2007, solidifies the two organizations’ shared commitment to providing
holistic life, wealth, and health solutions for the long-term financial security of Filipino families; and
◦Continued to build on our high-quality agency force at scale by improving agent capabilities and capacities across the
agency value chain. Our strategy is focused on quality recruitment, digital and AI tools, and robust learning and
development initiatives. This includes the launch of Manulife Business Academy, which collaborates with globally
accredited training partners to enhance skills in financial planning, recruitment, and leadership. These efforts have
contributed to a 23% year-over-year increase in our annual Million Dollar Round Table ("MDRT") membership1,
positioning us as having the third largest MDRT members globally, while agency productivity2 for 2025 rose by 17%
compared with 2024.
•In Global WAM, we:
◦Enhanced the Manulife iFUNDS platform, making it the first integrated digital wealth solution in Singapore that offers
advisors a unified view of clients’ Unit Trust and Investment-Linked Plan (“ILP”) holdings. By integrating these into a
single platform and incorporating AI-powered ILP analytics capabilities, the enhancements streamline portfolio
oversight, accelerate transaction execution, and empower advisors to deliver more personalized and insightful financial
guidance; and
◦Entered a strategic partnership with BOCHK to launch our flagship Global Multi-Asset Diversified Income Fund to
customers in Hong Kong and Malaysia. The collaboration leverages the firm’s distribution capabilities and our asset
management expertise to provide customers with comprehensive wealth management solutions.
•In Canada, we:
◦Partnered with M3 Financial Group (“M3”) to offer our Affinity Mortgage Protection Plan through M3’s Canada-wide
broker network, beginning with advisors in British Columbia. Our licensed advisors work directly with M3’s mortgage
clients to guide them through the process of purchasing the mortgage protection coverage they need, enabling M3’s
brokers to focus on servicing their core business. This initiative strengthens our position in mortgage protection by
offering more accessible, trusted protection in Canada’s housing market; and
◦Launched an end-to-end digital travel insurance platform that modernizes the distributor experience and simplifies the
purchasing process for Canadians and their families.
9 | 2025 Annual Report | Management’s Discussion and Analysis |
•In the U.S., we enhanced our distribution footprint by expanding our wholesaling team, pursuing more targeted growth
strategies and accelerating our penetration within the U.S. HNW and mass affluent markets, contributing to the strong new
business growth in 2025.
Financial and Strategic Targets
Below is a summary of our 2025 results against our 2025, 2027 and medium-term targets:
Targets(1) | |||||
2025 | 2024 | 2027 | Medium-term | ||
Core return on common shareholders’ equity (“core ROE”)(2),(3) | 16.5% | 16.2% | 18%+ | ||
Remittances ($ billions)(4) | $6.4 | $7.0 | $22+ cumulative | ||
Diluted core earnings per common share (“core EPS”) growth(2),(3) | 8% | 10% | 10% to 12% | ||
Expense efficiency ratio(2) | 44.8% | 44.8% | <45% | ||
New business contractual service margin (“new business CSM”) growth(2) | 28% | 32% | 15% | ||
Contractual service margin (“CSM”) balance growth(2) | 16% | 3% | 8% to 10% | ||
Financial leverage ratio(2),(3) | 23.9% | 24.0% | 25% | ||
Common share core dividend payout ratio(2),(3) | 42% | 42% | 35% to 45% | ||
Targets(1) | ||||||
2025 | 2024 | 2025 | 2027 | Medium-term | ||
Core earnings contribution from highest potential businesses(2),(3),(5) | 75% | 68% | 75% | |||
Core earnings contribution from LTC insurance and variable annuities (“VA”) businesses(2),(3) | 9% | 10% | <15% | |||
Straight-through-processing (“STP”)(6) | 90% | 89% | 88% | |||
Net promoter score (“NPS”) | 27 | 27 | 37 | |||
Core earnings contribution from Asia region(2),(3) | 47% | 41% | 50% | |||
Employee engagement (quartile)(7) | 1st | 1st | 1st | |||
5-year Total Shareholder Return (quartile)(8) | 2nd | 1st | 1st | |||
Corporate Sustainability Assessment (quartile)(9) | 1st | 1st | 1st | |||
(1)See “Caution regarding forward-looking statements” above.
(2)Core ROE, core EPS, expense efficiency ratio, financial leverage ratio, common share core dividend payout ratio, core earnings contribution from highest potential
businesses, core earnings contribution from LTC insurance and VA businesses, and core earnings contribution from Asia region are non-GAAP ratios. CSM and
new business CSM are net of non-controlling interest (“NCI”). Percentage growth / declines in CSM net of NCI, new business CSM, and core EPS are stated on a
constant exchange rate basis and are non-GAAP ratios. See “Non-GAAP and Other Financial Measures” below for more information.
(3)2024 metrics were updated to align with the presentation of Global Minimum Taxes in 2025. See the "Global Minimum Taxes" section below for more information.
(4)2024 to 2025 cumulative remittances were $13.4 billion, compared with our target of $22 billion+ for 2024 to 2027. For more information on this metric, see “Non-
GAAP and Other Financial Measures” below.
(5)Highest potential businesses include Asia segment, Global WAM segment, Canada Group Benefits and North American behavioural insurance products.
(6)Straight-through-processing represents customer interactions that are completely digital, and includes money movement.
(7)As compared to global financial services companies and insurance peers.
(8)As compared to our performance peer group. Refer to Manulife’s most recent Management Information Circular for information on our performance peer group.
Rankings as at December 31 of each respective year.
(9)Based on Standard & Poor’s Corporate Sustainability Assessment rating.
We have achieved our 2025 target on core earnings contribution from highest potential businesses, and exceeded the 2025
targets on core earnings contribution from LTC insurance and VA businesses, and STP.
In addition, we continued to make solid progress on our 2027 targets:
•We generated 47% in core earnings contribution from Asia region (a combination of our Asia segment and Asia wealth and
asset management) in 2025, and remain committed to meeting our 2027 target of delivering 50% in core earnings
contribution from the Asia region.
•We achieved an NPS score of 27, in line with 2024.
Details of our performance on the financial targets are provided below.
1 2024 items excluded from core earnings has been updated to align with the presentation of GMT in 2025. See the “Global Minimum Taxes” section below for more
information.
2 The reinsurance transaction with the Reinsurance Group of America, Incorporated (“RGA U.S. Reinsurance Transaction”) closed January 1, 2025. The reinsurance
transaction with Global Atlantic (“GA Reinsurance Transaction”) closed February 22, 2024, with an effective date of January 1, 2024. The reinsurance transaction
with the RGA Life Reinsurance Company of Canada (“RGA Canadian Reinsurance Transaction”) closed April 1, 2024.
3 Includes impacts from reinsurance transactions reported in core earnings and items excluded from core earnings.
4 There is an offsetting change in other comprehensive income (“OCI”) attributed to shareholders resulting in a neutral impact to book value.
5 Percentage growth/declines in core earnings, pre-tax core earnings, core earnings excluding the change in ECL, core expenses, general expenses, assets under
management and administration (“AUMA”), AUM, core earnings before interest, taxes, depreciation and amortization (“core EBITDA”), and Manulife Bank average
net lending assets are stated on a constant exchange rate basis, a non-GAAP ratio. See “Non-GAAP and Other Financial Measures” below for more information.
6 The increase in Global WAM net fee income is due to higher average assets under management and administration (“average AUMA”) reflecting the favourable
impact of markets and the acquisition of Comvest. For more information on average AUMA, see “Non-GAAP and Other Financial Measures” below.
| 10 | |
Profitability
Profitability
As at and for the years ended December 31, | 2025 | 2024 |
($ millions, unless otherwise stated) | ||
Net income (loss) attributed to shareholders | $5,572 | $5,385 |
Core earnings(1),(2) | $7,521 | $7,182 |
Diluted earnings (loss) per common share ($) | $3.07 | $2.84 |
Core EPS ($)(2) | $4.21 | $3.85 |
Return on common shareholders’ equity (“ROE”) | 12.0% | 12.0% |
Core ROE | 16.5% | 16.2% |
Expense efficiency ratio | 44.8% | 44.8% |
General expenses | $4,901 | $4,859 |
Core expenses(1) | $7,096 | $6,899 |
(1)This item is a non-GAAP financial measure. See “Non-GAAP and Other Financial Measures” below for more information.
(2)2024 core earnings and core EPS have been updated to align with the presentation of Global Minimum Taxes (“GMT”) in 2025. See the “Global Minimum Taxes”
section below for more information.
Our net income attributed to shareholders was $5.6 billion in 2025 compared with $5.4 billion in 2024. Net income
attributed to shareholders is comprised of core earnings (consisting of items we believe reflect the underlying earnings capacity
of the business), which amounted to $7.5 billion in 2025 compared with $7.2 billion in 2024, and items excluded from core
earnings of $1.9 billion of net charges in 2025 compared with net charges of $1.8 billion1 in 2024. The effective tax rate on net
income (loss) attributed to shareholders was 14% in 2025 compared with 17% in 2024 primarily due to jurisdictional mix of
earnings coupled with one-time tax benefits and tax true-ups in both years.
Net income attributed to shareholders increased $0.2 billion in 2025 compared with 2024, primarily due to growth in core
earnings and the impact of reinsurance transactions in 2025 compared with 2024, partially offset by a higher charge from market
experience. The RGA U.S. Reinsurance Transaction2 resulted in a net loss attributed to shareholders of $0.7 billion3 in 2025
compared with a combined net loss attributed to shareholders of $0.9 billion3 in 2024 from the Global Atlantic Reinsurance
Transaction2 and the RGA Canadian Reinsurance Transaction2. The net loss on all three transactions was primarily related to
market experience from the sale of fair value through other comprehensive income (“FVOCI”) debt instruments.4 In addition, the
higher charge in market experience is due to a net charge from derivatives and hedge accounting ineffectiveness in 2025
compared with a net gain in 2024. Total market experience was a net charge of $1.7 billion in 2025, primarily related to lower-
than-expected returns on alternative long-duration assets (“ALDA”), largely related to real estate, private equity and timber
investments, net realized losses due to the sale of debt instruments primarily related to the RGA U.S. Reinsurance Transaction,
and a net charge related to derivatives and hedge accounting ineffectiveness, partially offset by higher-than-expected returns on
public equities.
Core earnings increased $0.3 billion, or 3%5, on a constant exchange rate basis compared with 2024. The increase was driven
by higher core earnings in Global WAM, largely reflecting an increase in net fee income6, higher performance fees in Institutional
Asset Management, and disciplined expense management, partially offset by lower favourable tax true-ups and tax benefits, the
impact of the eMPF transition in Hong Kong and lower fee spreads. In addition, growth in our insurance business, the net impact
of 2025 updates to actuarial methods and assumptions, an adjustment to the accrual for withholding taxes following the
announcement of the Comvest acquisition, and favourable insurance experience in Asia also contributed to higher core earnings.
These increases were partially offset by unfavourable insurance experience in our U.S. life insurance business, lower expected
investment earnings, a lower gain from updates to provisions for estimated losses in our P&C Reinsurance business, a larger
increase in the expected credit loss (“ECL”) provision in 2025 and less favourable insurance experience in Canada. The impact
of 2024 updates to actuarial methods and assumptions was net neutral. In addition, the RGA U.S. Reinsurance Transaction, the
RGA Canadian Reinsurance Transaction, and the GA Reinsurance Transaction reduced core earnings by $33 million, $19 million
and $11 million, respectively, in 2025 compared with 2024.
11 | 2025 Annual Report | Management’s Discussion and Analysis |
Additional information on the change in ECL is presented in the following table:
For the years ended December 31, | ||
($ millions) | 2025 | 2024 |
Change in ECL | ||
Net new originations or purchases | $(16) | $(24) |
Changes to risk, parameters and models | ||
Credit migration | (111) | (111) |
Parameter and model updates, and other | 35 | 105 |
Total (increase) recovery in ECL, pre-tax | $(92) | $(30) |
Total (increase) recovery in ECL, post-tax | $(75) | $(23) |
The increase in the ECL provision of $75 million post-tax in 2025 was primarily related to credit migration, partially offset by net
positive impact from parameter and model updates reflecting a favourable macro environment. The increase in the ECL provision
of $23 million post-tax in 2024 reflected credit migration, partially offset by positive parameter and model updates from a positive
macro environment, in particular, improved equity markets.
Core earnings by segment are presented in the following table. See Asia, Canada, U.S., Global WAM, and Corporate and Other
sections below.
For the years ended December 31, | 2025 | 2024 | % change(1) 2025 vs 2024 |
($ millions) | |||
Core earnings by segment(2) | |||
Asia | $2,969 | $2,466 | 18% |
Canada | 1,634 | 1,568 | 4% |
U.S. | 1,206 | 1,690 | (30)% |
Global Wealth and Asset Management | 1,932 | 1,673 | 14% |
Corporate and Other | (220) | (215) | (2)% |
Total core earnings | $7,521 | $7,182 | 3% |
(1)Percentage change is on a constant exchange rate basis, a non-GAAP ratio. See “Non-GAAP and Other Financial Measures” below for more information.
(2)2024 core earnings by segment have been updated to align with the presentation of GMT in 2025. See the “Global Minimum Taxes” section below for more
information.
| 12 | |
The following table presents 2025 and 2024 net income attributed to shareholders consisting of core earnings and items
excluded from core earnings.
For the years ended December 31, | 2025 | 2024 |
($ millions) | ||
Core earnings | $7,521 | $7,182 |
Items excluded from core earnings: | ||
Market experience gains (losses)(1) | $(1,662) | $(1,450) |
Realized gains (losses) on debt instruments | (753) | (962) |
Derivatives and hedge accounting ineffectiveness | (173) | 132 |
Actual less expected long-term returns on public equity | 237 | 312 |
Actual less expected long-term returns on ALDA | (968) | (969) |
Other investment results | (5) | 37 |
Updates to actuarial methods and assumptions that flow directly through income(2) | (216) | (199) |
Restructuring charge(3) | (12) | (72) |
Amortization of acquisition-related intangible assets(4) | (18) | - |
Reinsurance transactions, tax-related items and other(5) | (41) | (76) |
Total items excluded from core earnings | (1,949) | (1,797) |
Net income (loss) attributed to shareholders | $5,572 | $5,385 |
(1)Market experience was a net charge of $1,662 million in 2025 primarily due to lower-than-expected returns on ALDA, largely related to real estate, private equity
and timber investments, net realized losses from the sale of debt instruments, of which $732 million was related to the transfer of assets with respect to the RGA
U.S. Reinsurance Transaction, which are classified as FVOCI, and a net charge from derivatives and hedge accounting ineffectiveness. These were partially offset
by higher-than-expected returns on public equity. Market experience was a net charge of $1,450 million in 2024 primarily due to lower-than-expected returns on
ALDA, driven by real estate and private equity investments, and net realized losses from the sale of debt instruments, of which $841 million was related to the
transfer of assets with respect to the GA Reinsurance Transaction and the RGA Canadian Reinsurance Transaction, which are classified as FVOCI. These were
partially offset by gains from higher-than-expected returns from public equity, a net gain from derivatives and hedge accounting ineffectiveness, and a gain from
other investment results.
(2)See “Critical Actuarial and Accounting Policies – Review of Actuarial Methods and Assumptions” section below for more information on the 2025 and 2024 net
charges.
(3)In 2025, we reported a restructuring charge of $12 million post-tax ($16 million pre-tax) in Global WAM and Canada. In 2024, we reported a restructuring charge of
$72 million post-tax ($92 million pre-tax) in Global WAM and Canada.
(4)This item is excluded from core earnings commencing in the third quarter of 2025 (“3Q25”). See “Non-GAAP and Other Financial Measures” below for more
information.
(5)In 2025, the net charge of $41 million included a charge of $45 million related to an accounting true-up in Asia, a $24 million charge for Comvest acquisition-
related costs, and a $10 million charge for an investment impairment in Global WAM, partially offset by a net gain of $36 million related to tax-related benefits and
true-ups. In 2024, the net charge of $76 million included a charge of $70 million from the GA Reinsurance Transaction in the U.S. and Japan, a charge of $60
million related to U.S. withholding taxes on remittances associated with the GA Reinsurance Transaction, a net charge of $43 million related to the acquisition of
CQS Investment Management (“CQS”), a charge of $25 million related to a reinsurance recapture in Asia, a charge of $23 million related to GMT (an additional
$208 million charge was recorded in core earnings, see the “Global Minimum Taxes” section below for more information) and an investment impairment charge of
$22 million in Global WAM. This was partially offset by tax-related benefits and true-ups of $125 million and a gain of $34 million related to the RGA Canadian
Reinsurance Transaction in Canada.
Net income attributed to shareholders by segment is presented in the following table. See Asia, Canada, U.S., Global WAM, and
Corporate and Other sections below.
For the years ended December 31, | 2025 | 2024 | % change(1) 2025 vs 2024 |
($ millions) | |||
Net income (loss) attributed to shareholders by segment | |||
Asia | $2,972 | $2,355 | 26% |
Canada | 1,313 | 1,221 | 8% |
U.S. | (527) | 135 | – |
Global Wealth and Asset Management | 1,900 | 1,597 | 19% |
Corporate and Other | (86) | 77 | – |
Total net income (loss) attributed to shareholders | $5,572 | $5,385 | 3% |
(1)Percentage change is on an actual exchange rate basis.
Diluted earnings (loss) per common share (“EPS”) was $3.07 in 2025, compared with $2.84 in 2024 primarily related to the
impact of common share buybacks and the increase in net income attributed to common shareholders. Diluted core earnings per
common share was $4.21 in 2025, compared with $3.85 in 2024 primarily related to the increase in core earnings and the impact
of common share buybacks. The diluted weighted average common shares outstanding was 1,708 million in 2025 and 1,785
million in 2024.
ROE for 2025 of 12.0% was in line with 2024, reflecting higher net income attributed to common shareholders, offset by higher
average common shareholders’ equity. Core ROE was 16.5% in 2025 compared with 16.2% in 2024. The increase in 2025 core
ROE was primarily driven by an increase in core earnings.
1 This is a non-GAAP financial measure. See “Non-GAAP and Other Financial Measures" below for more information.
13 | 2025 Annual Report | Management’s Discussion and Analysis |
Expense efficiency ratio
Expense efficiency is embedded in our culture and its focus has enabled us to drive the benefits of scale across our businesses.
We believe there are further opportunities to leverage our global scale and operating environment, streamline processes and
further digitize our business.
We use the expense efficiency ratio to measure our progress on our expense management initiatives. It reflects expenses that
flow directly through core earnings (“core expenses”), which include core general expenses, directly attributable maintenance
expenses and directly attributable acquisition expenses for products measured using the premium allocation approach (“PAA”)
and for other products without a CSM. Core expenses exclude certain expenses directly attributable to acquiring new business
that are capitalized into the CSM, instead of flowing directly through core earnings.
The expense efficiency ratio was 44.8% in 2025, in line with 2024, reflecting a 2% increase in both pre-tax core earnings1 and
core expenses. The increase in core expenses was driven by higher workforce-related costs, continued strategic investments in
digital transformation and AI, the inclusion of operating expenses related to our acquisitions of CQS and Comvest, and the eMPF
transition in Hong Kong. These were partially offset by disciplined expense management primarily in Global WAM.
Core general expenses are a component of core expenses. Total 2025 general expenses increased 1% on an actual exchange
rate basis and remained unchanged on a constant exchange rate basis compared with 2024. The increase was driven by the
items noted above related to the increase in core expenses, as well as a reallocation of expenses from directly attributable
maintenance to general expenses, partially offset by a reduction in expenses excluded from core earnings. Total general
expenses excluded from core earnings in 2025 consisted primarily of costs related to the acquisition of Comvest, the
amortization of acquisition-related intangible assets, and restructuring charges in Global WAM and Canada. In 2024, these
expenses primarily related to the restructuring charges in Global WAM and Canada and the acquisition of CQS.
1 Percentage growth/declines in APE sales and NBV are stated on a constant exchange rate basis.
2 For more information on this metric, see “Non-GAAP and Other Financial Measures” below. In addition, 2024 NBV margin was updated to include the impact of
GMT, consistent with 2025. See the “Global Minimum Taxes” section below for more information.
| 14 | |
Business Performance
Business performance
As at and for the years ended December 31, | 2025 | 2024 |
($ millions, unless otherwise stated) | ||
Asia APE sales | $7,340 | $6,073 |
Canada APE sales | 1,593 | 1,689 |
U.S. APE sales | 784 | 623 |
Total APE sales(1) | 9,717 | 8,385 |
Asia new business CSM(2) | 2,787 | 2,148 |
Canada new business CSM | 435 | 357 |
U.S. new business CSM | 553 | 382 |
Total new business CSM(2) | 3,775 | 2,887 |
Asia new business value(3) | 2,560 | 2,078 |
Canada new business value | 674 | 627 |
U.S. new business value | 299 | 241 |
Total new business value(1),(3) | 3,533 | 2,946 |
Asia CSM net of NCI | 17,750 | 15,540 |
Canada CSM | 4,459 | 4,109 |
U.S. CSM | 2,760 | 2,468 |
Corporate and Other CSM | - | 10 |
Total CSM net of NCI | 24,969 | 22,127 |
Post-tax CSM net of NCI(3),(4) | 20,733 | 18,353 |
Global WAM gross flows ($ billions)(1) | 191.4 | 171.7 |
Global WAM net flows ($ billions)(1) | (14.3) | 13.3 |
Global WAM assets under management and administration ($ billions)(4),(5) | 1,106.6 | 1,031.1 |
Global WAM total invested assets ($ billions) | 9.8 | 9.7 |
Global WAM segregated funds net assets ($ billions)(5) | 313.6 | 291.9 |
Total assets under management and administration ($ billions) | 1,704.4 | 1,608.0 |
Total invested assets ($ billions) | 459.9 | 442.5 |
Total net segregated funds net assets ($ billions) | 461.3 | 436.0 |
(1)For more information on this metric, see “Non-GAAP and Other Financial Measures” below.
(2)New business CSM is net of NCI.
(3)2024 new business value and post-tax CSM net of NCI have been updated to include the impact of GMT, consistent with 2025. See the “Global Minimum Taxes”
section below for more information.
(4)This item is a non-GAAP financial measure. See “Non-GAAP and Other Financial Measures” below for more information.
(5)The Global WAM portion of AUMA as at December 31, 2025 was $1,106.6 billion, an increase of 11% compared with December 31, 2024, driven by the favourable
impact of equity markets and interest rates, and the assets from the acquisition of Comvest in the fourth quarter of 2025 (“4Q25”), partially offset by net outflows.
The Global WAM segregated funds net assets were $313.6 billion as at December 31, 2025, an increase of 7% compared with December 31, 2024 on an actual
exchange rate basis driven by the favourable impact of equity markets partially offset by unfavorable foreign currency exchange rates.
Annualized premium equivalent (“APE”) sales were $9,717 million in 2025, an increase of 14%1 compared with 2024, new
business CSM was $3,775 million in 2025, an increase of 28% compared with 2024, and new business value (“NBV”) was
$3,533 million in 2025, an increase of 18%1 compared with 2024. New business results by segment were as follows:
•In Asia, APE sales, new business CSM, and NBV increased 18%, 27% and 20%, respectively, in 2025 compared with 2024,
reflecting strong 2025 performance across the region, led by Hong Kong, mainland China, Singapore and Japan. New
business value margin (“NBV margin”)2 improved to 39.5%.
•In Canada, APE sales decreased 6% in 2025 compared with 2024, as strong growth in Individual Insurance sales
throughout 2025 was more than offset by the non-recurrence of a significant Group Insurance large-case sale in the prior
year. New business CSM increased 22% in 2025 compared with 2024, driven by higher sales volumes in Individual
Insurance, and higher margins and sales volumes in Annuities, partially offset by net lower margins in Individual Insurance.
NBV increased 7% in 2025 compared with 2024, reflecting higher sales volumes in Individual Insurance and favourable
product mix in Group Insurance, partially offset by lower sales volumes in Group Insurance.
•In the U.S., APE sales increased 24% in 2025 compared with 2024, reflecting broad-based demand for our suite of products.
New business CSM increased 42% primarily driven by higher sales volumes and product mix. NBV increased 22% in 2025
compared with 2024, primarily driven by higher sales volumes.
1 Percentage growth/declines in organic CSM is stated on a constant exchange rate basis.
15 | 2025 Annual Report | Management’s Discussion and Analysis |
CSM net of NCI was $24,969 million as at December 31, 2025, an increase of $2,842 million or 16% compared with December
31, 2024. Organic CSM movement was an increase of $2,257 million in 2025, representing a 10% growth1, driven by the impact
of new business, interest accretion and net favourable insurance experience, partially offset by amortization recognized in core
earnings. Inorganic CSM movement was an increase of $585 million in 2025, primarily driven by the net impact of 2025 updates
to actuarial methods and assumptions and equity market performance, partially offset by the impacts of changes in foreign
currency exchange rates and reinsurance transactions.
Global WAM net outflows were $14.3 billion in 2025, compared with net inflows of $13.3 billion in 2024.
•Net outflows in Retirement were $9.4 billion in 2025, compared with net inflows of $0.7 billion in 2024, primarily driven by
higher retirement plan redemptions, and higher net member withdrawals reflecting higher account balances from market
growth. This was partially offset by higher new plan sales in Canada.
•Net outflows in Retail were $12.3 billion in 2025, compared with net inflows of $6.8 billion in 2024, driven by lower net sales
through third-party intermediaries in North America and our Canada retail wealth platform.
•Net inflows in Institutional Asset Management were $7.4 billion in 2025, compared with net inflows of $5.7 billion in 2024,
driven by higher net flows from fixed income mandates including strong contributions from our Manulife | CQS products, and
the impact of the acquisition of Comvest. This was partially offset by higher redemptions in equity mandates and lower
deployments in private markets.
Assets under Management and Administration
AUMA as at December 31, 2025 was $1.7 trillion, an increase of 9% compared with December 31, 2024, primarily due to the
favourable impact of equity markets and interest rates, partially offset by net outflows. Total invested assets increased 4% on an
actual exchange rate basis, primarily due to the impact of interest rates on debt instruments and the impact of equity markets,
partially offset by the transfer of invested assets related to the RGA U.S. Reinsurance Transaction. Segregated funds net assets
increased 6% on an actual exchange rate basis, primarily due to the impact of equity markets.
Assets under Management and Administration
As at December 31, | 2025 | 2024 |
($ millions) | ||
Total invested assets | $459,928 | $442,497 |
Segregated funds net assets(1) | 461,254 | 435,988 |
Mutual funds, institutional asset management and other(1),(2) | 537,216 | 506,868 |
Total assets under management | 1,458,398 | 1,385,353 |
Other assets under administration | 246,021 | 222,614 |
Total assets under management and administration | $1,704,419 | $1,607,967 |
(1)These assets are not available to satisfy the liabilities of the Company’s general fund.
(2)Other funds represent pension funds, pooled funds, endowment funds and other institutional funds managed by the Company on behalf of others.
1 This item is a non-GAAP financial measure. See “Non-GAAP and Other Financial Measures” below for more information. Post-tax CSM and adjusted book value
have been updated to include the impact of GMT, consistent with 2025. See the “Global Minimum Taxes” section below for more information.
2 The net issuance of securities consists of the issuance of US$1.0 billion of senior debt in 4Q25 and the issuance of $0.5 billion of subordinated debt in the second
quarter of 2025 (“2Q25”), partially offset by the redemption of $1.0 billion of subordinated debt in 2Q25.
3 The net redemption of capital instruments consists of the redemption $1.0 billion of subordinated debt, partially offset by the issuance of $0.5 billion of subordinated
debt in 2Q25.
4 Includes cash and cash equivalents, comprised of cash on deposit, Canadian and U.S. Treasury Bills and high quality short-term investments, and marketable
assets, comprised of investment grade government and agency bonds, investment grade corporate bonds, investment grade securitized instruments, publicly
traded common stocks and preferred shares.
| 16 | |
Financial Strength
Financial strength metrics
2025 | 2024 | |
As at December 31, | ||
MLI’s LICAT ratio(1) | 136% | 137% |
Financial leverage ratio(2) | 23.9% | 24.0% |
Consolidated capital ($ billions)(2),(3) | $81.6 | $79.9 |
Book value per common share ($) | $25.91 | $25.63 |
Adjusted book value per common share ($)(2),(4) | $38.27 | $36.25 |
(1)This item is disclosed under the Office of the Superintendent of Financial Institutions (“OSFI”) Life Insurance Capital Adequacy Test Public Disclosure
Requirements guideline.
(2)2024 consolidated capital and adjusted book value per common share have been updated to include the impact of GMT, consistent with 2025. See the “Global
Minimum Taxes” section below for more information.
(3)This item is a capital management measure. For more information on this metric, see “Non-GAAP and Other Financial Measures” below.
(4)This item is a non-GAAP ratio. See “Non-GAAP and Other Financial Measures” below for more information.
The Life Insurance Capital Adequacy Test (“LICAT”) ratio for MLI was 136% as at December 31, 2025, compared with 137%
as at December 31, 2024. The decrease in the ratio was driven by dividends and common share buybacks, the acquisition of
Comvest, the impact of the new segregated fund capital requirements effective January 1, 2025, as well as the net redemption of
subordinated debt. This was partially offset by the positive impact of earnings and the CSM, the RGA U.S. Reinsurance
Transaction and the net impact of updates to actuarial methods and assumptions.
MFC’s financial leverage ratio as at December 31, 2025 was 23.9%, a decrease of 0.1 percentage points from 24.0% as at
December 31, 2024. The decrease in the ratio was driven by a higher post-tax CSM1 and the impact of a stronger Canadian
dollar on foreign currency denominated debt, partially offset by the net issuance of securities2 and a decrease in total equity. The
decrease in total equity was driven by dividends and common share buybacks, partially offset by total comprehensive income,
which was unfavourably impacted by a stronger Canadian dollar relative to the U.S. dollar.
MFC’s consolidated capital was $81.6 billion as at December 31, 2025, an increase of $1.7 billion compared with $79.9 billion
as at December 31, 2024. The increase was primarily driven by a higher post-tax CSM, partially offset by the net redemption of
capital instruments3 and a decrease in total equity. The decrease in total equity was driven by dividends and common share
buybacks, partially offset by total comprehensive income, which was unfavourably impacted by a stronger Canadian dollar
relative to the U.S. dollar.
Remittances were $6.4 billion in 2025 of which Asia and U.S. operations delivered $2.1 billion and $1.7 billion, respectively.
Remittances in 2025 decreased by $0.6 billion compared with 2024 due to the favourable impact of market movements in 2024.
Refer to “Remittance of Capital” below for more information.
Cash and cash equivalents and marketable securities4 were $276.0 billion as at December 31, 2025 compared with $263.3
billion as at December 31, 2024. The increase of $12.7 billion was primarily driven by the growth in equity markets, and the
impact of lower interest rates, partially offset by the impact of changes in foreign currency exchange rates. Refer to “Liquidity
Risk Management Strategy” below for more information.
Book value per common share as at December 31, 2025 was $25.91, a 1% increase compared with $25.63 as at December
31, 2024. The number of common shares outstanding was 1,677 million as at December 31, 2025, a net decrease of 52 million
common shares from 1,729 million as at December 31, 2024, primarily due to common share buybacks.
Adjusted book value per common share as at December 31, 2025 was $38.27, a 6% increase compared with $36.25 as at
December 31, 2024, driven by an increase in the adjusted book value1 and a lower number of common shares outstanding.
Adjusted book value increased $1.5 billion due to an increase in post-tax CSM, net of NCI, partially offset by a decrease in total
common shareholders’ equity. The decrease in common shareholders’ equity reflects dividends and common share buybacks,
partially offset by total comprehensive income attributed to common shareholders, which was unfavourably impacted by a
stronger Canadian dollar relative to the U.S. dollar.
1 Includes MLI, John Hancock Life Insurance Company (U.S.A.), John Hancock Life & Health Insurance Company, and John Hancock Life Insurance Company of
New York.
17 | 2025 Annual Report | Management’s Discussion and Analysis |
Credit ratings - On September 19, 2025, Moody’s upgraded the financial strength rating to Aa3 from A1 for Manulife’s primary
insurance operating companies1. As indicated in Moody’s press release, the upgrade reflects improved profitability, strong
capital, and reduced exposure to lower ROE and legacy businesses.
Impact of Foreign Currency Exchange Rates
We have worldwide operations, including in Canada, the United States and various markets in Asia, and generate revenues and
incur expenses in local currencies in these jurisdictions, all of which are translated into Canadian dollars. The bulk of our
exposure to foreign currency exchange rates is to movements in the U.S. dollar.
Items impacting our Consolidated Statements of Income are translated to Canadian dollars using average exchange rates for the
respective quarterly period. For items impacting our Consolidated Statements of Financial Position, period end rates are used for
currency translation purposes. The following table provides the most relevant foreign currency exchange rates for 2025 and
2024.
Quarterly | Full Year | |||||||
Exchange rate | 4Q25 | 3Q25 | 2Q25 | 1Q25 | 4Q24 | 2025 | 2024 | |
Average(1) | ||||||||
U.S. dollar | 1.3939 | 1.3773 | 1.3837 | 1.4349 | 1.3987 | 1.3974 | 1.3698 | |
Japanese yen | 0.0090 | 0.0093 | 0.0096 | 0.0094 | 0.0092 | 0.0093 | 0.0090 | |
Hong Kong dollar | 0.1792 | 0.1761 | 0.1773 | 0.1844 | 0.1799 | 0.1793 | 0.1755 | |
Period end | ||||||||
U.S. dollar | 1.3707 | 1.3914 | 1.3645 | 1.4393 | 1.4382 | 1.3707 | 1.4382 | |
Japanese yen | 0.0087 | 0.0094 | 0.0094 | 0.0096 | 0.0092 | 0.0087 | 0.0092 | |
Hong Kong dollar | 0.1761 | 0.1788 | 0.1738 | 0.1850 | 0.1851 | 0.1761 | 0.1851 | |
(1)Average rates for the quarter are from Bank of Canada which are applied against Consolidated Statements of Income items for each period. Average rate for the
full year is a 4-point average of the quarterly average rates.
Net income attributed to shareholders and core earnings from the Company’s foreign operations are translated to Canadian
dollars, and in general, our net income attributed to shareholders and core earnings benefit from a weakening Canadian dollar
and are adversely affected by a strengthening Canadian dollar. However, in a period of net losses in foreign operations, the
weakening of the Canadian dollar has the effect of increasing the losses. The relative impact of foreign currency exchange in any
given period is driven by the movement of currency rates as well as the proportion of earnings generated in our foreign
operations.
Changes in foreign currency exchange rates increased core earnings by $114 million in 2025 compared with the same period of
2024, primarily due to a weaker Canadian dollar compared with the U.S. dollar. The impact of foreign currency exchange rates
on items excluded from core earnings does not provide relevant information given the nature of these items.
Global Minimum Taxes
On June 20, 2024, the Canadian government passed the Global Minimum Tax Act into law. Canada’s GMT is applied
retroactively to fiscal periods commencing on or after December 31, 2023.
Impact of GMT on net income attributed to shareholders and core earnings
As additional local jurisdictions have enacted the GMT in 2025, GMT has been recognized in net income in the reporting
segments whose earnings are subject to this tax. GMT is reported in both core earnings and items excluded from core earnings
in line with our definition of core earnings in section 13 “Non-GAAP and Other Financial Measures” below. As items excluded
from core earnings are presented on a post-tax basis, each line includes the appropriate impact of GMT.
In 2024, the impact of GMT was recognized in the Corporate and Other segment. To improve the comparability of core earnings
between 2025 and 2024, we have updated 2024 core earnings to reallocate GMT from the Corporate and Other segment to the
segment whose core earnings are subject to this tax. This update includes a reallocation of the first quarter of 2024 (“1Q24”)
GMT, previously reported in the second quarter of 2024 (“2Q24”) items excluded from core earnings, to 1Q24 core earnings.
There is no impact to our 2024 quarterly net income attributed to shareholders by segment or reporting period. The impact of the
reallocation of GMT between segments and by quarter was offset by an equal amount in items excluded from core earnings in
the segments. This offset is reported in the reinsurance transaction, tax-related items and other line. In total, with these updates,
we continue to record total GMT expense of $231 million in 2024, however $208 million is now reported in core earnings and $23
million is now reported in items excluded from core earnings.
| 18 | |
As a result of the update to core earnings, we have also updated the following 2024 non-GAAP measures:
•Core ROE
•Core EPS
•Core earnings available to common shareholders
•Common share dividend core payout ratio
•Highest potential businesses core earnings contribution
•Asia region core earnings contribution
•LTC and VA core earnings contribution
•Operating segment core earnings contribution
Impact of GMT on other financial measures
GMT also impacts additional metrics reported on a post-tax basis. In 2025, we have included the impact of GMT in these
measures and we have updated 2024 comparatives to include the impact of GMT.
The following non-GAAP financial measures and non-GAAP ratios have been updated:
•Post-tax CSM and post-tax CSM net of NCI
•Adjusted book value and Adjusted book value per common share
•Financial leverage ratio
The following other financial measures have been updated:
•Consolidated capital
•NBV and NBV margin
1 Based on APE sales.
2 Includes insurance customers, retail investment customers acquired through the agency channel, and retirement customers.
3 This represents our International High Net Worth business.
4 This item is a non-GAAP ratio. See “Non-GAAP and Other Financial Measures” below for more information.
19 | 2025 Annual Report | Management’s Discussion and Analysis |
2. Asia
Our Asia segment offers insurance and insurance-based wealth accumulation products, driven by a customer-centric
strategy, and leverages the asset management expertise of, and products managed by, our Global Wealth and Asset
Management segment. We are a top three pan-Asian life insurer1, with a history of over 125 years and more than 13
million customers2, focused on addressing the significant health and mortality protection gaps and low insurance
penetration rates across Asia.
With a broad geographic presence across 12 markets – Hong Kong, Macau, Japan, Bermuda3, mainland China,
Singapore, Vietnam, Indonesia, the Philippines, Malaysia, Cambodia, and Myanmar – and a robust diversified
distribution platform, we are well-positioned to create value for our customers, employees, and shareholders. We have
over 100,000 contracted agents and over 100 bank partnerships, of which our exclusive bancassurance partnerships
provide us access to over 35 million bank customers. This includes our regional exclusive bancassurance partnership
with DBS Bank across Singapore, Hong Kong, mainland China, and Indonesia. We also work with many independent
agents, financial advisors, and brokers.
Asia continues to be a core driver of growth for Manulife, as we execute our strategy to deliver high-quality sustainable
growth across a diversified business portfolio. This is supported by our robust, diversified distribution platform,
holistic solutions across health, wealth and longevity, and leading digital and AI capabilities that enhance customer and
distributor experience. Our growth is underpinned by Asia megatrends including fast growing economies, rising middle
class populations, and growing unmet health and protection needs driving continued demand for financial solutions.
In 2025, our Asia segment contributed 38%4 of the Company’s core earnings from operating segments and, as at December 31,
2025, accounted for 13%4 of the Company’s assets under management and administration. See section 1 “Strategic Priorities
and Progress Update” above, for information on the core earnings contributions from Asia segment and Asia operations in Global
WAM segment combined.
Profitability
Asia reported net income attributed to shareholders of $2,972 million in 2025 compared with $2,355 million in 2024. Net income
attributed to shareholders is comprised of core earnings, which were $2,969 million in 2025 compared with $2,466 million in
2024, and items excluded from core earnings, which amounted to a net gain of $3 million for 2025 compared with a net charge of
$111 million in 2024. See section 13 “Non-GAAP and Other Financial Measures” below, for a reconciliation of core earnings to
net income (loss) attributed to shareholders. The changes in net income attributed to shareholders and core earnings expressed
in Canadian dollars were due to the factors described below and, in addition, the change in core earnings reflected a net $61
million favourable impact due to changes in various foreign currency exchange rates versus the Canadian dollar.
Expressed in U.S. dollars, the presentation currency of the segment, net income attributed to shareholders was US$2,131 million
in 2025 compared with US$1,717 million in 2024. Core earnings were US$2,126 million in 2025 compared with US$1,799 million
in 2024 and items excluded from core earnings amounted to a net gain of US$5 million in 2025 compared with a net charge of
US$82 million in 2024. Items excluded from core earnings are outlined in the table below.
Core earnings in 2025 increased 18% compared with 2024, after adjusting for the impact of changes in foreign currency
exchange rates. The changes in core earnings by geography are primarily due to the items noted below and also include the
impact of higher investment income on allocated capital. Investment income on allocated capital increased core earnings by
US$60 million on a pre-tax basis in 2025 compared with 2024.
•Hong Kong increased 26% driven by an increase in expected earnings on insurance contracts and higher expected
investment earnings, both reflecting business growth. The increase in expected earnings on insurance contracts also
reflected the net impact of 2025 updates to actuarial methods and assumptions. In addition, Hong Kong had a lower
effective tax rate;
•Japan increased 8% reflecting higher expected investment earnings and an increase in expected earnings on insurance
contracts, both reflecting business growth, and improved insurance experience, partially offset by a higher effective tax rate.
In addition, the GA Reinsurance Transaction decreased core earnings by US$12 million in 2025 compared with 2024;
•International High Net Worth business increased 13% due to an increase in expected earnings on insurance contracts due
to business growth, partially offset by lower expected investment earnings;
•Mainland China increased 48% reflecting an improved impact of new business;
•Singapore increased 7% driven by an increase in expected earnings on insurance contracts due to business growth and
favourable insurance experience;
•Vietnam was in line with 2024, reflecting favourable insurance experience offset by lower expected earnings on insurance
contracts; and
| 20 | |
•Other Emerging Markets increased 14% reflecting improved insurance experience.
The following table presents net income attributed to shareholders for Asia for 2025 and 2024 consisting of core earnings and
items excluded from core earnings.
For the years ended December 31, | Canadian $ | US $ | |||
($ millions) | 2025 | 2024 | 2025 | 2024 | |
Core earnings | $2,969 | $2,466 | $2,126 | $1,799 | |
Items excluded from core earnings:(1) | |||||
Market experience gains (losses) | 136 | (178) | 101 | (131) | |
Realized gains (losses) on debt instruments | (40) | (374) | (28) | (276) | |
Derivatives and hedge accounting ineffectiveness | (40) | (92) | (30) | (67) | |
Actual less expected long-term returns on public equity | 150 | 204 | 113 | 151 | |
Actual less expected long-term returns on ALDA | 47 | 21 | 33 | 15 | |
Other investment results | 19 | 63 | 13 | 46 | |
Updates to actuarial methods and assumptions that flow directly through income | (39) | (5) | (28) | (4) | |
Reinsurance transactions, tax-related items and other | (94) | 72 | (68) | 53 | |
Total items excluded from core earnings | 3 | (111) | 5 | (82) | |
Net income (loss) attributed to shareholders | $2,972 | $2,355 | $2,131 | $1,717 | |
(1)For explanations of items excluded from core earnings, see “Items excluded from core earnings” table in the total Company “Profitability” section above.
Business Performance
(All percentages quoted are on a constant exchange rate basis)
APE sales were US$5,250 million in 2025, representing an increase of 18% compared with 2024, driven by broad-based growth
across most markets in Asia, partially offset by a decrease in Vietnam and the International High Net Worth business. New
business CSM of US$1,994 million and NBV of US$1,832 million in 2025 increased 27% and 20% compared with 2024,
respectively, driven by higher sales volumes and a more favourable business mix. NBV margin was 39.5% in 2025, an increase
of 1.2 percentage points compared with 2024.
•In Hong Kong, APE sales were US$1,965 million in 2025, a 21% increase compared with 2024, reflecting higher sales
across all channels, driven by strong growth in sales of savings, health and protection products. The increase reflected our
sales growth in both mainland Chinese visitor and domestic customers. New business CSM of US$811 million in 2025
increased 21% compared with 2024 driven by higher sales volumes. NBV of US$966 million in 2025 increased 31%
compared with 2024 due to higher sales volumes and product mix. NBV margin of 49.2% in 2025 increased 3.9 percentage
points compared with 2024.
•In Japan, APE sales were US$460 million in 2025, an increase of 17% compared with 2024, reflecting higher sales in the
broker channel, driven by strong growth in sales of wealth accumulation products. New business CSM of US$279 million in
2025 increased 30% compared with 2024, primarily driven by higher sales volume. NBV of US$165 million in 2025 was in
line with 2024, driven by higher sales volumes offset by product mix. NBV margin of 36.0% in 2025 decreased 6.0
percentage points compared with 2024.
•International High Net Worth business APE sales were US$155 million in 2025, a decrease of 9% compared with 2024,
reflecting lower sales in savings products. New business CSM of US$136 million and NBV of US$121 million in 2025 were
both in line with 2024, due to lower sales volumes, partially offset by product mix. NBV margin was 78.4%, an increase of
6.5 percentage points compared with 2024.
•In mainland China, APE sales were US$1,180 million in 2025, a 32% increase compared with 2024, reflecting higher sales
in the bancassurance and agency channels, driven by strong growth in participating savings products. New business CSM
of US$254 million in 2025 increased 28% compared with 2024, primarily driven by higher sales volumes. NBV of US$185
million in 2025 increased 11% compared with 2024 due to higher sales volumes partially offset by product mix. NBV margin
of 30.7% in 2025 decreased 5.7 percentage points compared with 2024.
•In Singapore, APE sales were US$1,118 million in 2025, a 14% increase compared with 2024, reflecting higher sales across
all channels driven by strong growth in sales of investment-linked products. New business CSM of US$443 million in 2025
increased 52% compared with 2024 due to higher sales volumes and product mix. NBV of US$342 million in 2025 increased
25% compared with 2024 due to higher sales volumes and product mix. NBV margin of 30.6% in 2025 increased 2.6
percentage points compared with 2024.
•In Vietnam, APE sales were US$69 million in 2025, a 24% decrease compared with 2024, reflecting lower sales in the
bancassurance channel following the cessation of the partnership agreement with Vietnam Technological and Commercial
Joint-Stock Bank in October 2024, partially offset by higher sales in the agency channel. New business CSM of US$16
million in 2025 increased 40% compared with 2024 due to product mix, partially offset by lower sales volumes. NBV of
negative US$3 million in 2025 improved by US$2 million compared with 2024 due to product mix partially offset by lower
sales volumes. NBV margin of negative 4.1% in 2025 improved 1.2 percentage points compared with 2024.
1 This item is a non-GAAP financial measure. See “Non-GAAP and Other Financial Measures” below for more information.
2 MDRT membership awarded based on prior year production.
3 Asia agency APE sales per active agents.
21 | 2025 Annual Report | Management’s Discussion and Analysis |
•In Other Emerging Markets, APE sales were US$303 million in 2025, a 3% increase compared with 2024, reflecting higher
sales in the bancassurance and agency channels. New business CSM was US$55 million, a 5% increase compared with
2024 primarily due to higher sales volumes. NBV was US$56 million, an 11% decrease compared with 2024 due to the
impact of a local regulatory update in Indonesia, partially offset by higher sales volumes. NBV margin was 20.6%, a
decrease of 3.1 percentage points compared with 2024.
CSM net of NCI was US$12,951 million as at December 31, 2025, an increase of US$2,144 million compared with December
31, 2024. Organic CSM movement was an increase of US$1,173 million in 2025 driven by the impact of new business, interest
accretion, and a net increase in insurance experience, partially offset by amortization recognized in core earnings. Inorganic
CSM movement was an increase of US$971 million in 2025 largely due to the net impact of 2025 updates to actuarial methods
and assumptions that adjust the CSM, the impact of equity market performance and interest rate movement, and the weakening
of the U.S. dollar against most Asian currencies.
Business Performance
As at and for the years ended December 31, | Canadian $ | US $ | |||
($ millions) | 2025 | 2024 | 2025 | 2024 | |
APE sales | $7,340 | $6,073 | $5,250 | $4,429 | |
New business value | $2,560 | $2,078 | $1,832 | $1,516 | |
New business CSM(1) | $2,787 | $2,148 | $1,994 | $1,567 | |
CSM net of NCI | $17,750 | $15,540 | $12,951 | $10,807 | |
(1) New business CSM is net of NCI.
Assets under Management1 (“AUM”)
Asia’s assets under management were US$159.1 billion as at December 31, 2025, an increase of US$23.4 billion or 15%
compared with December 31, 2024. The increase was driven by business growth and the impact of favourable equity market
performance on invested assets and segregated funds net assets.
Assets under Management
As at December 31, | Canadian $ | US $ | |||
($ millions) | 2025 | 2024 | 2025 | 2024 | |
Total invested assets | $185,848 | $166,590 | $135,597 | $115,843 | |
Segregated funds net assets | 32,245 | 28,622 | 23,527 | 19,904 | |
Total assets under management | $218,093 | $195,212 | $159,124 | $135,747 | |
Strategic Highlights
Asia continues to be a core driver of growth for Manulife, as we execute our strategy to deliver high-quality sustainable growth
across a diversified business portfolio. This is supported by our robust, diversified distribution platform, holistic solutions across
health, wealth and longevity, and leading digital and AI capabilities that enhance customer and distributor experience.
We continued to broaden our reach and leverage strategic partnerships through our diversified distribution platforms to
accelerate growth. In 2025, we:
•Renewed our bancassurance partnership in the Philippines with Chinabank, extending our exclusive partnership until 2039.
This strategic partnership, which started in 2007, solidifies the two organizations’ shared commitment to providing holistic
life, wealth, and health solutions for the long-term financial security of Filipino families; and
•Continued to build on our high-quality agency force at scale by improving agent capabilities and capacities across the
agency value chain. Our strategy is focused on quality recruitment, digital and AI tools, and robust learning and development
initiatives. This includes the launch of Manulife Business Academy, which collaborates with globally accredited training
partners to enhance skills in financial planning, recruitment, and leadership. These efforts have contributed to a 23% year-
over-year increase in our annual Million Dollar Round Table ("MDRT") membership2, positioning us as having the third
largest MDRT members globally, while agency productivity3 for 2025 rose by 17% compared with 2024.
We continued to enhance our health, wealth, and longevity propositions to meet the evolving needs of customers seeking better
health and wellness outcomes. In 2025, we:
•Agreed to establish a strategic collaboration with Bupa International Limited, a global healthcare company, to create a more
robust and integrated healthcare network for our customers. By combining the strengths of both organizations, this
1 Subject to the receipt of regulatory approvals. See “Caution regarding forward-looking statements” above.
| 22 | |
collaboration in Hong Kong aims to expand customer access to high-quality care while enhancing convenience, value, and
affordability through integrated healthcare solutions and personalized support throughout their healthcare journey;
•Launched the enhanced ManulifeMOVE, our flagship lifestyle program, with initial rollout in Singapore and the Philippines.
ManulifeMOVE empowers customers to take charge of their health and well-being, with key enhancements including
differentiated and expanded benefits across preventive health services, medical and assistive care, cancer care support,
health and well-being coaching, fitness and wellness experiences, and community engagement;
•Hosted Asia’s inaugural Manulife Longevity Symposium in Singapore and the Philippines, reinforcing our commitment to
advancing Asia’s longevity movement. The symposiums brought together over 1,400 healthcare experts, industry leaders,
academics, customers and partners to address the challenge of living not just longer, but better, covering topics such as
health and longevity innovations, and financial well-being; and
•Delivered enhanced health service coverage and expanded access to cross-border healthcare in Hong Kong. We launched
a cross-border Cancer Drug Support Service through our partnership with one of the leading healthcare service providers in
the China Greater Bay Area. In addition, we broadened select Manulife Hong Kong and Macau health insurance product
coverage to over 38,000 hospitals in mainland China and introduced hospitalization credit services at more than 800
hospitals in mainland China, enabling patients to receive treatment without upfront payments.
We continued to expand our geographical presence and strengthen our market reach. In 2025, we:
•Agreed to establish a 50:50 life insurance joint venture with Mahindra, an existing partner through our asset management
joint venture, to enter the India insurance market.1 This partnership will expand our global footprint and position us to grow
across one of the world’s largest economies, delivering long-term value; and
•Became the first international life insurer to establish an office in the Dubai International Financial Centre dedicated to
advising on and arranging life insurance contracts to high-net-worth (“HNW”) customers. This strategic move deepens our
presence in the Middle East and enhances our ability to address the growing wealth and protection needs of HNW and ultra-
HNW individuals in the region.
We also continued to invest in our AI and digital capabilities to enhance the customer and distributor experience. In 2025, we:
•Launched advanced AI-enabled agency tools across Asia to enhance sales support and improve customer experience. In
Indonesia, Singapore and Japan, we rolled out AI assistants to provide faster access to product and policy information and
streamline administrative tasks. In Hong Kong, we launched AI Sales Pro – a GenAI-powered tool that helps agents identify
top sales opportunities, craft personalized customer solutions, and access critical know-how to drive business performance;
and
•Rolled out VOICE in Singapore and Japan, a multi-signal dashboard that includes call trend analysis, net sentiment scores,
topic trends and deep dive insights from call center transcripts. VOICE utilizes GenAI to categorize data, find correlations,
and customize insights by analyzing near real-time trends from customer interactions. These insights help us to better
understand customer sentiment and key interests, enhance services, improve training, and identify opportunities to better
deliver value to our customers.
We continued to maintain a diverse and engaged culture and make Manulife a great place to work. Manulife has been
recognized by HR Asia as one of the “Best Companies to Work for in Asia 2025” in seven of our markets.
1 Includes insurance customers and Global WAM customers.
23 | 2025 Annual Report | Management’s Discussion and Analysis |
3. Canada
Our Canada segment has been committed to customers in our home market for over 135 years. We serve the needs of
over 7 million customers1 across the country, including members of approximately 27,000 businesses and
organizations in our group benefits business, through a diverse and competitive suite of financial and health-protection
offerings tailored to individuals, families, and business owners. We leverage the asset management expertise of, and
products managed by, our Global Wealth and Asset Management segment.
Our Canadian business lines are: group life, health, and disability insurance solutions for employers; individual
insurance and guaranteed investment products including life, critical illness, segregated funds, and annuities sold via
retail advisors; and Affinity insurance offerings including life, health, travel, disability, and creditor insurance solutions
sold through the Manulife CoverMe® brand, mortgage brokers, travel advisors, and sponsor groups and associations.
Through Manulife Bank, we offer flexible banking products and solutions to both individual customers and businesses.
We aim to be the leading life and health insurer in Canada, by focusing on four key areas: continuing to strengthen our
core operations; accelerating digital transformation; differentiating through health; and expanding distribution.
In 2025, our Canada segment contributed 21% of the Company’s core earnings from operating segments and, as at December
31, 2025, accounted for 9% of the Company’s assets under management and administration.
Profitability
Canada’s reported net income attributed to shareholders was $1,313 million in 2025 compared with $1,221 million in 2024. Net
income attributed to shareholders is comprised of core earnings, which were $1,634 million in 2025 compared with $1,568 million
in 2024, and items excluded from core earnings, which amounted to a net charge of $321 million in 2025 compared with a net
charge of $347 million in 2024. Items excluded from core earnings are outlined in the table below. See section 13 “Non-GAAP
and Other Financial Measures” below, for a reconciliation of core earnings to net income attributed to shareholders.
The $66 million, or 4%, increase in core earnings was driven by higher expected investment earnings, business growth in Group
Insurance, improved insurance experience in Individual Insurance, and an increase in CSM amortization, partially offset by less
favourable insurance experience in Group Insurance, and lower Manulife Bank earnings. Core earnings also included the net
favourable impact of 2025 updates to actuarial methods and assumptions. Investment income on allocated capital also reduced
core earnings by $29 million on a pre-tax basis compared with 2024. In addition, the RGA Canadian Reinsurance Transaction
reduced core earnings by $19 million in 2025 compared with 2024.
The following table presents net income attributed to shareholders for Canada for 2025 and 2024 consisting of core earnings and
items excluded from core earnings.
For the years ended December 31, | 2025 | 2024 |
($ millions) | ||
Core earnings | $1,634 | $1,568 |
Items excluded from core earnings:(1) | ||
Market experience gains (losses) | (374) | (384) |
Realized gains (losses) on debt instruments | 3 | (328) |
Derivatives and hedge accounting ineffectiveness | (74) | 109 |
Actual less expected long-term returns on public equity | 13 | 65 |
Actual less expected long-term returns on ALDA | (265) | (235) |
Other investment results | (51) | 5 |
Updates to actuarial methods and assumptions that flow directly through income | 58 | 2 |
Restructuring charge | (3) | (6) |
Reinsurance transactions, tax-related items and other | (2) | 41 |
Total items excluded from core earnings | (321) | (347) |
Net income (loss) attributed to shareholders | $1,313 | $1,221 |
(1)For explanations of items excluded from core earnings, see “Items excluded from core earnings” table in the total Company “Profitability” section above.
Business Performance
APE sales were $1,593 million in 2025, a decrease of 6% compared with 2024.
•Individual Insurance APE sales of $630 million in 2025 increased 20% compared with 2024, primarily due to higher
participating life insurance sales.
1 This item is a non-GAAP financial measure. See “Non-GAAP and Other Financial Measures” below for more information.
2 Maven Clinic, Meet Maven, 2024.
| 24 | |
•Group Insurance APE sales of $702 million in 2025 decreased 24% compared with 2024, driven by the non-recurrence of a
significant large-case sale in 2Q24.
•Annuities APE sales of $261 million in 2025 increased 7% compared with 2024, primarily due to higher sales of segregated
fund products.
CSM was $4,459 million as at December 31, 2025, an increase of $350 million compared with December 31, 2024. Organic
CSM movement was an increase of $128 million in 2025, driven by the impact of new business and interest accretion, partially
offset by amortization recognized in core earnings. Inorganic CSM movement was an increase of $222 million in 2025, reflecting
the net impact of 2025 updates to actuarial methods and assumptions that adjust the CSM, favourable equity market experience,
and the impact of amendments to reinsurance treaties in 2Q25, partially offset by unfavourable impacts of interest rates.
Manulife Bank average net lending assets1 were $28.3 billion in 2025, an increase of $2.3 billion, or 9%, compared with 2024,
primarily due to growth in residential lending.
Business Performance
As at and for the years ended December 31, | 2025 | 2024 |
($ millions) | ||
APE sales | $1,593 | $1,689 |
Contractual service margin | $4,459 | $4,109 |
Manulife Bank average net lending assets | $28,307 | $26,020 |
Assets under Management
Canada’s assets under management of $152.7 billion as at December 31, 2025 increased $7.5 billion, or 5%, from $145.2 billion
as at December 31, 2024, driven by higher total invested assets from business growth and the net favourable impact from equity
markets and interest rates.
Assets under Management
As at December 31, | 2025 | 2024 |
($ millions) | ||
Total invested assets | $114,483 | $107,141 |
Segregated funds net assets | 38,218 | 38,099 |
Total assets under management | $152,701 | $145,240 |
Strategic Highlights
We continued to drive strong business growth by delivering tailored solutions that create value for customers and distributors,
supported by updates to the Manulife Vitality program and key partnerships, and advancing our digital capabilities through
GenAI-driven innovations, so that our customers can focus on improving their health, wealth and longevity. During 2025, we:
•Enhanced the Manulife Vitality program with offerings to assist members in meeting their health and wellness goals:
◦Became the first insurer in Canada to offer access to GRAIL’s Galleri® multi-cancer early detection test to eligible
Manulife Vitality program members at a discount in partnership with Medcan, a global leader in proactive health and
wellness services. This milestone reinforces Manulife’s commitment to proactive health solutions and complements
existing public screening programs, supporting earlier detection and improved outcomes for customers; and
◦Introduced additional resources and incentives for managing and preventing diabetes, the extension of travel rewards to
all members, the addition of ŌURA as a key rewards partner, and new collaborations offering tools that span nutrition,
fitness, mental health, and personalized medicine.
•Established strategic partnerships to support our customers’ health and well-being and grow our distribution network through
personalized and value-added solutions:
◦Partnered with Maven Clinic, the world’s largest virtual clinic for women’s and family health2, to offer eligible Group
Benefits members 24/7 virtual access to personalized support during some of their most important stages of life,
including fertility, maternity, parenting, and menopause. This initiative addresses critical care gaps that impact women’s
health and workforce participation; and
◦Partnered with M3 Financial Group (“M3”) to offer our Affinity Mortgage Protection Plan through M3’s Canada-wide
broker network, beginning with advisors in British Columbia. Our licensed advisors work directly with M3’s mortgage
clients to guide them through the process of purchasing the mortgage protection coverage they need, enabling M3’s
brokers to focus on servicing their core business. This initiative strengthens our position in mortgage protection by
offering more accessible, trusted protection in Canada’s housing market.
25 | 2025 Annual Report | Management’s Discussion and Analysis |
•Advanced our digital capabilities through GenAI-driven innovations and modernized platforms to improve advisor and
customer experience:
◦Introduced an enhanced online life and health insurance application form that reduces complexity, accelerates medical
data collection, and shortens processing times through adaptive questioning and streamlined workflows, transforming
the digital experience for advisors. These efficiencies strengthen our competitiveness in the mass market segment and
support our ambition of delivering scalable digital offerings;
◦Introduced an innovative GenAI tool in our Individual Insurance business that automatically generates personalized
communications to advisors by analyzing historical data and identifying available opportunities. This tool enables our
internal sales team to deliver timely, relevant, and actionable messages to drive meaningful interactions and enhance
collaboration with advisors;
◦Launched a GenAI-powered coaching tool for Licensed Insurance Advisor (“LIA”) supervisors in our Affinity business
that evaluates customer service calls, generating insights that allow supervisors to provide LIAs with more effective,
timely, and targeted feedback to enhance customer service and sales outcomes; and
◦Launched an end-to-end digital travel insurance platform that modernizes the distributor experience and simplifies the
purchasing process for Canadians and their families.
•Expanded solutions for Canadians and their families to meet their wealth and protection needs:
◦Launched a simplified specialized lending suite of products in Manulife Bank to streamline the lending experience for
advisors serving HNW clients and business owners. This emphasizes our focus on removing friction, enhancing clarity,
and delivering smarter, faster, and more personalized solutions for advisors and customers.
| 26 | |
4. U.S.
Our U.S. segment is committed to a future of dynamic growth by helping our customers live longer, healthier, better
lives through an array of life insurance and insurance-based wealth-accumulation solutions that meet a variety of
planning needs and offer a behavioural insurance component through the John Hancock Vitality Program.
We operate under the brand of John Hancock with more than 160 years of history in the U.S., where we have built
lifelong customer relationships and created a vast distribution network of licensed financial advisors who help us bring
the benefits of life insurance, wellness, and wealth planning to more individuals and their families. Our life insurance
solutions are designed to meet customers’ estate, business, income-protection, and wealth accumulation needs, while
also helping them prepare to spend more years in good health. We also leverage the expertise and solutions of our
Global Wealth and Asset Management segment.
We have integrated behavioural insurance across our suite of solutions, offering customers tools, resources,
education, and rewards through John Hancock Vitality to help them make more informed decisions about their overall
health. The program continuously evolves to include the latest advances in science and technology and is built on a
network of collaborators including GRAIL, Apple, Prenuvo, and the Massachusetts Institute of Technology (“MIT”)
AgeLab.
Additionally, we have in-force LTC and annuity businesses. Our proven record of organically managing our LTC blocks,
as well as our LTC, variable and fixed annuity reinsurance transactions over the last few years have been significant
contributors to the Company’s efforts to transform the business portfolio into one of higher returns and lower risk.
In 2025, our U.S. segment contributed 16% of the Company’s core earnings from operating segments and, as at December 31,
2025, accounted for 12% of the Company’s assets under management and administration.
Profitability
U.S. reported net loss attributed to shareholders of $527 million in 2025 compared with net income attributed to shareholders of
$135 million in 2024. Net income (loss) attributed to shareholders is comprised of core earnings, which was $1,206 million in
2025 compared with $1,690 million in 2024, and items excluded from core earnings, which amounted to a net charge of $1,733
million in 2025 compared with a net charge of $1,555 million in 2024. See section 13 “Non-GAAP and Other Financial Measures”
below, for a reconciliation of core earnings to net income (loss) attributed to shareholders. The changes in core earnings
expressed in Canadian dollars were due to the factors described below and additionally, reflected a $26 million favourable impact
from the strengthening of the U.S. dollar compared with the Canadian dollar.
Expressed in U.S. dollars, the functional currency of the segment, the net loss attributed to shareholders was US$367 million in
2025 compared with net income attributed to shareholders of US$96 million in 2024. Core earnings were US$862 million in 2025
compared with US$1,234 million in 2024 and items excluded from core earnings amounted to a net charge of US$1,229 million
in 2025 compared with a net charge of US$1,138 million in 2024. Items excluded from core earnings are outlined in the table
below.
The US$372 million, or 30%, decrease in core earnings was mainly due to a combination of factors, including unfavourable life
insurance claims experience in 2025 compared with favourable experience in 2024, lower expected investment earnings and the
net impact of the 2024 updates to actuarial methods and assumptions, which impacted expected investment earnings and
insurance service result. This was partially offset by favourable lapse experience in 2025 compared with unfavourable
experience in 2024. The net impact of the 2025 updates to actuarial methods and assumptions was slightly positive. Investment
income on allocated capital also reduced core earnings by US$54 million on a pre-tax basis in 2025 compared with 2024. The
RGA U.S. Reinsurance Transaction reduced core earnings by US$20 million in 2025 compared with 2024, attributable to the
impact on expected earnings on insurance contracts, the expected investment earnings and the change in ECL.
27 | 2025 Annual Report | Management’s Discussion and Analysis |
The following table presents net income attributed to shareholders for the U.S. for 2025 and 2024 consisting of core earnings
and items excluded from core earnings.
For the years ended December 31, | Canadian $ | US $ | |||
($ millions) | 2025 | 2024 | 2025 | 2024 | |
Core earnings | $1,206 | $1,690 | $862 | $1,234 | |
Items excluded from core earnings:(1) | |||||
Market experience gains (losses) | (1,498) | (1,327) | (1,058) | (971) | |
Realized gains (losses) on debt instruments | (697) | (525) | (487) | (385) | |
Derivatives and hedge accounting ineffectiveness | 2 | (33) | 3 | (23) | |
Actual less expected long-term returns on public equity | (118) | (47) | (84) | (34) | |
Actual less expected long-term returns on ALDA | (719) | (751) | (514) | (550) | |
Other investment results | 34 | 29 | 24 | 21 | |
Updates to actuarial methods and assumptions that flow directly through income | (235) | (202) | (171) | (148) | |
Reinsurance transactions, tax-related items and other | - | (26) | - | (19) | |
Total items excluded from core earnings | (1,733) | (1,555) | (1,229) | (1,138) | |
Net income (loss) attributed to shareholders | $(527) | $135 | $(367) | $96 | |
(1)For explanations of items excluded from core earnings, see “Items excluded from core earnings” table in the total Company “Profitability” section above.
Business Performance
U.S. APE sales of US$561 million in 2025 increased 24% compared with 2024, reflecting broad-based demand for our suite of
products.
CSM was US$2,013 million as at December 31, 2025, an increase of US$298 million compared with December 31, 2024.
Organic CSM movement was an increase of US$345 million in 2025 driven by the impact of new business, interest accretion and
net favourable insurance experience, partially offset by amortization recognized in core earnings. The net favourable insurance
experience was mainly due to long-term care lapse and claims experience. Inorganic CSM movement was a decrease of US$47
million in 2025 due to the RGA U.S. Reinsurance Transaction in the first quarter of 2025, partially offset by favourable market
impacts from equity market experience and the net impact of 2025 updates to actuarial methods and assumptions that adjust the
CSM.
Business Performance
As at and for the years ended December 31, | Canadian $ | US $ | |||
($ millions) | 2025 | 2024 | 2025 | 2024 | |
APE sales | $784 | $623 | $561 | $454 | |
Contractual service margin | $2,760 | $2,468 | $2,013 | $1,715 | |
Assets under Management
U.S. assets under management of US$145.8 billion as at December 31, 2025 decreased 2% compared with December 31, 2024.
The decrease was largely due to the transfer of invested assets related to the RGA U.S. Reinsurance Transaction, partially offset
by the net impact from interest rates and equity markets on both segregated funds net assets and total invested assets.
Assets under Management
As at December 31, | Canadian $ | US $ | |||
($ millions) | 2025 | 2024 | 2025 | 2024 | |
Total invested assets | $122,591 | $136,833 | $89,434 | $95,142 | |
Segregated funds net assets | 77,272 | 77,440 | 56,372 | 53,845 | |
Total assets under management | $199,863 | $214,273 | $145,806 | $148,987 | |
Strategic Highlights
At John Hancock, we are focused on profitably growing our life insurance business to sustain a scaled presence in the U.S. by
diversifying and enhancing our product portfolio and deploying AI-driven solutions to transform the end-to-end purchase
experience for our customers. We are also focused on differentiating through behavioural insurance solutions to help our
customers live longer, healthier, better lives. In 2025, we:
Delivered strong new business growth by strengthening our distribution model and diversifying our portfolio with new offerings
and enhancements to our current solutions:
| 28 | |
•Enhanced our distribution footprint by expanding our wholesaling team, pursuing more targeted growth strategies and
accelerating our penetration within the U.S. HNW and mass affluent markets;
•Expanded our suite of insurance solutions by introducing an accumulation survivorship indexed universal life product, John
Hancock’s first offering in this product category;
•Introduced a new hybrid indexed universal life insurance solution offering more flexible living benefits and a streamlined
digital application process; and
•Offered improved fund selection and index loans on our new variable universal life insurance solution.
Positioned ourselves as an AI-powered organization, leveraging GenAI capabilities to accelerate underwriting, improve the
customer experience, and detect and reduce fraud, waste, and abuse:
•Partnered with Munich Re Life US to enhance underwriting efficiency through alitheia, its AI-driven risk assessment platform,
raising instant underwriting decision eligibility from US$3 million to US$5 million, enabling more customers to experience a
streamlined life insurance application process; and
•Deployed GenAI capabilities to improve outcomes in our in-force Long Term Care (“LTC”) insurance business, including
further enhancements to automated claims processing and predictive analytics to detect and reduce fraud, waste and
abuse.
Advanced our mission to help our customers live longer, healthier, and better lives:
•Empowered eligible John Hancock Vitality members with early detection technology and resources to proactively manage
their health, including annual and recurring access to GRAIL’s Galleri® multi-cancer early detection test, access to Function
Health’s technology and health screening tools, and access to continuous glucose monitoring technology and dietitian
support; and
•Released the first-of-its-kind Longevity Preparedness Index – developed in collaboration with the MIT AgeLab, to deliver
actionable insights on what it means to prepare well for living longer, and build on our brand awareness in the longevity
space.
1 United States, Canada, Japan, Hong Kong, Singapore, Taiwan, Indonesia, Vietnam, Malaysia, India, the Philippines, Brazil, England, Ireland, Switzerland,
Germany, and mainland China. In addition, we have timberland/farmland operations in Australia, New Zealand, and Chile.
29 | 2025 Annual Report | Management’s Discussion and Analysis |
5. Global Wealth and Asset Management
Our Global Wealth and Asset Management segment, branded Manulife Wealth & Asset Management, is defined by our
purpose: to be the number one choice for customers to make decisions easier and lives better by empowering
investors for a better tomorrow. We operate across 20 geographies, including 10 in Asia1, distributing innovative
investment solutions to both individual and institutional investors through three integrated and complementary
business lines.
Through our extensive team of investment professionals across public and private markets, including Manulife | CQS
Investment Management and Manulife | Comvest, we offer investment capabilities across a wide spectrum of asset
classes. Our philosophy across our entire platform is anchored on good stewardship, engaging with companies and
investors with a view to addressing material risks, which in turn allows us to deliver resilient, alpha-generating
investment solutions to our customers.
We distribute our investment capabilities and solutions through three global businesses:
Our Retirement business serves more than 9 million investors in North America and Asia through retirement plan
solutions, with investments managed by our internal teams and third-party managers. We offer financial guidance and
advice to investors to help them improve their financial preparedness, and also provide solutions to investors when
they retire or leave their employer plan.
Our Retail business serves individual investors through third-party intermediaries in North America and Asia, and
through an affiliated wealth management network in North America. Our product platform predominantly consists of
internally managed solutions. We also supplement our solutions by partnering with third-party managers through sub-
advisory agreements.
Our Institutional Asset Management business serves a broad range of clients around the world, including pension
plans, foundations, endowments, financial institutions, and other institutional investors as well as our own insurance
business.
We believe that the combination of our global footprint, broad investment expertise, and diversified distribution
channels position us strongly to capitalize on high-growth opportunities in the most attractive markets globally.
In 2025, our Global WAM segment contributed 25% of the Company’s core earnings from operating segments and, as at
December 31, 2025, represented 65% of the Company’s total assets under management and administration.
Profitability
Global WAM’s net income attributed to shareholders was $1,900 million in 2025 compared with $1,597 million in 2024. Net
income (loss) attributed to shareholders is comprised of core earnings, which was $1,932 million in 2025 compared with $1,673
million in 2024, and items excluded from core earnings, which amounted to a net charge of $32 million in 2025 compared with a
net charge of $76 million in 2024. See section 13 “Non-GAAP and Other Financial Measures” below, for a reconciliation of core
earnings to net income (loss) attributed to shareholders.
Core earnings increased $259 million, or 14%, compared with 2024 on a constant exchange rate basis, primarily driven by an
increase in net fee income from higher average AUMA, reflecting the favourable impact of markets and the acquisition of
Comvest, higher performance fees in Institutional Asset Management, as well as disciplined expense management. This
increase was partially offset by lower favourable tax true-ups and tax benefits, the impact of the eMPF transition in Hong Kong
and lower fee spreads.
1 This item is a non-GAAP financial measure. See “Non-GAAP and Other Financial Measures” below.
2 This item is a non-GAAP ratio. See “Non-GAAP and Other Financial Measures” below for more information.
| 30 | |
The following table presents net income attributed to shareholders for the Global WAM segment for 2025 and 2024 consisting of
core earnings and items excluded from core earnings.
For the years ended December 31, | 2025 | 2024 |
($ millions) | ||
Core earnings | ||
Retirement | $1,101 | $950 |
Retail | 595 | 581 |
Institutional | 236 | 142 |
Core earnings | 1,932 | 1,673 |
Items excluded from core earnings:(1) | ||
Market experience gains (losses) | 22 | 4 |
Realized gains (losses) on debt instruments | 3 | - |
Derivatives and hedge accounting ineffectiveness | - | - |
Actual less expected long-term returns on public equity | 25 | 4 |
Actual less expected long-term returns on ALDA | (6) | - |
Other investment results | - | - |
Restructuring charge | (9) | (66) |
Amortization of acquisition-related intangible assets(2) | (18) | - |
Reinsurance transactions, tax-related items and other | (27) | (14) |
Total items excluded from core earnings | (32) | (76) |
Net income (loss) attributed to shareholders | $1,900 | $1,597 |
(1)For explanations of items excluded from core earnings, see “Items excluded from core earnings” table in the total Company “Profitability” section above.
(2)This item is excluded from core earnings commencing in 3Q25. See “Non-GAAP and Other Financial Measures” below for more information.
In 2025, core EBITDA1 was $2,571 million, $639 million higher than core earnings. In 2024, core EBITDA was $2,173 million,
$500 million higher than core earnings. Core EBITDA increased $398 million, or 17%, compared with 2024, driven by similar
factors impacting core earnings as mentioned above.
Core EBITDA margin2 was 29.7% in 2025 compared with 27.1% in 2024. The 260 basis point increase was primarily driven by
similar factors impacting core earnings as mentioned above.
Core EBITDA
For the years ended December 31, | 2025 | 2024 |
($ millions) | ||
Core earnings | $1,932 | $1,673 |
Amortization of deferred acquisition costs and other depreciation | 202 | 188 |
Amortization of deferred sales commissions | 87 | 78 |
Core income tax expenses (recoveries) | 350 | 234 |
Core EBITDA | $2,571 | $2,173 |
Core EBITDA margin (%) | 29.7% | 27.1% |
Business Performance
Net outflows were $14.3 billion in 2025 compared with net inflows of $13.3 billion in 2024.
•Retirement net outflows were $9.4 billion in 2025 compared with net inflows of $0.7 billion in 2024, primarily driven by higher
retirement plan redemptions, and higher net member withdrawals reflecting higher account balances from market growth.
This was partially offset by higher new plan sales in Canada.
•Retail net outflows were $12.3 billion in 2025 compared with net inflows of $6.8 billion in 2024, driven by lower net sales
through third-party intermediaries in North America and our Canada retail wealth platform.
•Institutional Asset Management net inflows were $7.4 billion in 2025 compared with net inflows of $5.7 billion in 2024, driven
by higher net flows from fixed income mandates including strong contributions from our Manulife | CQS products, and the
impact of the acquisition of Comvest. This was partially offset by higher redemptions in equity mandates and lower
deployments in private markets.
1 This item is a non-GAAP financial measure. See “Non-GAAP and Other Financial Measures” below.
31 | 2025 Annual Report | Management’s Discussion and Analysis |
Net Flows
For the years ended December 31, | 2025 | 2024 |
($ millions) | ||
Net flows | $(14,264) | $13,270 |
Assets under Management and Administration
As at December 31, 2025, AUMA for our wealth and asset management businesses were $1,106.6 billion, an increase of 11%
compared with December 31, 2024, driven by the favourable impact of equity markets and interest rates, and the assets from the
acquisition of Comvest in 4Q25, partially offset by net outflows. As of December 31, 2025, Global WAM also managed 234.4
billion in assets for the Company’s other reporting segments. Including those assets, AUMA managed by Global WAM1 were
$1,341.0 billion compared with $1,257.8 billion as at December 31, 2024.
Segregated funds net assets were $313.6 billion as at December 31, 2025, an increase of 7% compared with December 31,
2024 on an actual exchange rate basis, driven by the favourable impact of equity markets partially offset by unfavorable foreign
currency exchange rates.
Changes in Assets under Management and Administration
As at and for the years ended December 31, | 2025 | 2024 |
($ millions) | ||
Balance January 1, | $1,031,085 | $849,163 |
Acquisitions / Dispositions(1) | 17,551 | 18,670 |
Net flows | (14,264) | 13,270 |
Investment income (loss) and other | 72,218 | 149,982 |
Balance December 31, | $1,106,590 | $1,031,085 |
Average assets under management and administration | $1,070,839 | $946,087 |
(1)Includes $17.5 billion of AUM from the acquisition of Comvest in 2025 and $19.0 billion of AUM from the acquisition of CQS in 2024.
Assets under Management and Administration
As at December 31, | 2025 | 2024 |
($ millions) | ||
Total invested assets | $9,787 | $9,743 |
Segregated funds net assets(1) | 313,566 | 291,860 |
Mutual funds, institutional asset management and other(2) | 537,216 | 506,868 |
Total assets under management | 860,569 | 808,471 |
Other assets under administration | 246,021 | 222,614 |
Total assets under management and administration | $1,106,590 | $1,031,085 |
(1)Segregated funds net assets are primarily comprised of AUM in our Retirement business, which mainly consists of fee-based products with little or no guarantees.
(2)Other funds represent pension funds, pooled funds, endowment funds and other institutional funds managed by the Company on behalf of others.
Managed Assets under Management and Administration
As at December 31, | 2025 | 2024 |
($ millions) | ||
Assets under management and administration | $1,106,590 | $1,031,085 |
AUM managed by Global WAM on behalf of Manulife’s other segments | 234,370 | 226,752 |
Total managed assets under management and administration | $1,340,960 | $1,257,837 |
Strategic Highlights
As one of Manulife’s highest potential businesses, we are focused on accelerating growth, achieving operational excellence, and
driving value for shareholders. Our strategy is anchored in delivering consistently strong risk-adjusted returns for investors;
offering differentiated products, solutions and experiences to drive better customer outcomes; expanding global distribution
capabilities; amplifying our partnerships with insurance affiliates; and maximizing the value of our vertically integrated model. Our
strategy is further powered by our winning talent and culture, our strong reputation and global brand, our technology and AI-
forward mindset, and our focus on financial and operational discipline.
1 See “Caution regarding forward looking statements” above.
2 Subject to the receipt of regulatory approvals and satisfaction of customary closing conditions. See “Caution regarding forward looking statements” above.
| 32 | |
We continued to embrace a digital-first mindset and integrated AI-powered solutions to enhance the experiences for our
customers. In 2025, we:
•Incorporated a suite of AI-powered research tools to enhance investment analysis for our public markets investment
research teams. By integrating internal and external data into actionable insights, we streamline our research process,
accelerate decision-making, and empower our investment professionals to focus on driving value for our clients;
•Expanded our retirement plan offerings with the launch of FutureStepTM and FutureChoiceTM in the U.S., two fully digital
retirement plan solutions that enhance our capabilities and market presence. These new offerings improve user experience
by integrating AI and streamlining both client onboarding and participant access;
•Launched an AI-powered sales enablement solution in U.S. Retirement, delivering real-time insights and personalized
content to enhance our sales operations and productivity, improve our sales close ratio, and drive revenue growth. This
reduced the time spent on information searches and tripled the number of sales opportunities compared with 2024; and
•Enhanced the Manulife iFUNDS platform, making it the first integrated digital wealth solution in Singapore that offers
advisors a unified view of clients’ Unit Trust and Investment-Linked Plan (“ILP”) holdings. By integrating these into a single
platform and incorporating AI-powered ILP analytics capabilities, the enhancements streamline portfolio oversight,
accelerate transaction execution, and empower advisors to deliver more personalized and insightful financial guidance.
We executed several initiatives to drive sustainable growth opportunities and deliver comprehensive investment solutions. In
2025, we:
•Acquired 75% of Comvest Credit Partners (“Comvest”), a U.S. private credit manager with $17.5 billion of AUM as at the
acquisition date. The acquisition will enhance our private credit capabilities and create a comprehensive platform by aligning
Comvest and Manulife’s existing senior credit team.1 By leveraging Comvest’s investment philosophy and expertise, we can
offer clients expanded access to differentiated private credit strategies;
•Entered into an agreement to acquire PT Schroder Investment Management Indonesia (“Schroders Indonesia”),
strengthening our position as the largest asset manager in Indonesia. It will enable us to deliver enhanced value to our
clients and stakeholders by leveraging the firm’s local expertise and client relationships2;
•Successfully closed the Manulife Infrastructure Fund III, L.P., raising over US$5.5 billion from existing and new investors.
This milestone reflects the continued strength of our North American mid-market infrastructure strategy and our commitment
to meeting investor needs for alternative solutions through strategic expansion of our product offerings; and
•Entered a strategic partnership with BOCHK to launch our flagship Global Multi-Asset Diversified Income Fund to customers
in Hong Kong and Malaysia. The collaboration leverages the firm’s distribution capabilities and our asset management
expertise to provide customers with comprehensive wealth management solutions.
We continued to focus on educating and supporting our customers and advisors around the importance of health, wealth and
longevity. In 2025, we:
•Partnered with the U.S. segment to introduce exclusive health and wellness offers to more than 3 million plan participants in
U.S. Retirement, including access to GRAIL’s Galleri® multi-cancer early detection test to eligible participants. These
initiatives reinforce our commitment to longevity and helped participants address the financial preparedness gap; and
•Released our second annual global Financial Resilience and Longevity study. With insights drawn from retirement plan
members across all regions, our report outlined tailored steps for each generation and highlighted how retirement plan
providers, sponsors, and advisors can support better financial outcomes across people’s lifespans.
1 See “Caution regarding forward-looking statements” above.
33 | 2025 Annual Report | Management’s Discussion and Analysis |
6. Corporate and Other
Corporate and Other is comprised of investment performance on assets backing capital, net of amounts allocated to
the operating segments; financing costs; costs incurred by the corporate office related to shareholder activities (not
allocated to the operating segments); our P&C Reinsurance business; as well as our run-off reinsurance operation
including variable annuities and accident and health. In addition, for segment reporting purposes, consolidations and
eliminations of transactions between operating segments are also included in Corporate and Other earnings.
Profitability
Corporate and Other reported a net loss attributed to shareholders of $86 million in 2025 compared with net income attributed to
shareholders of $77 million in 2024. Net income (loss) attributed to shareholders is comprised of core earnings (loss) and items
excluded from core earnings (loss). Core loss was $220 million in 2025 compared with core loss of $215 million in 2024. Items
excluded from core earnings (loss) amounted to a net gain of $134 million in 2025 compared with a net gain of $292 million in
2024. Items excluded from core earnings (loss) are outlined in the table below. See section 13 “Non-GAAP and Other Financial
Measures” below, for a reconciliation of core earnings to net income (loss) attributed to shareholders.
The unfavourable variance in core loss of $5 million was primarily attributable to higher interest on capital allocated to operating
segments and lower gains from updates to provisions for estimated losses in our P&C Reinsurance business compared to prior
year, partially offset by an adjustment to the accrual for withholding taxes following the announcement of the Comvest acquisition
and higher investment income.
The following table presents net income attributed to shareholders for 2025 and 2024 consisting of core earnings (loss) and
items excluded from core earnings (loss).
For the years ended December 31, | 2025 | 2024 |
($ millions) | ||
Core earnings (loss) | $(220) | $(215) |
Items excluded from core earnings (loss):(1) | ||
Market experience gains (losses) | 52 | 435 |
Realized gains (losses) on debt instruments | (22) | 265 |
Derivatives and hedge accounting ineffectiveness | (61) | 148 |
Actual less expected long-term returns on public equity | 167 | 86 |
Actual less expected long-term returns on ALDA | (25) | (4) |
Other investment results | (7) | (60) |
Updates to actuarial methods and assumptions that flow directly through income | - | 6 |
Reinsurance transactions, tax-related items and other | 82 | (149) |
Total items excluded from core earnings (loss) | 134 | 292 |
Net income (loss) attributed to shareholders | $(86) | $77 |
(1)For explanations of items excluded from core earnings, see “Items excluded from core earnings” table in the total Company “Profitability” section above.
Strategic Highlights
Our P&C Reinsurance business provides substantial retrocessional capacity for a select clientele in the property and casualty
reinsurance market. The business is largely non-correlated to Manulife’s other businesses and helps diversify our overall
business mix. We manage the risk exposure of this business in relation to the total Company balance sheet risk and volatility as
well as the prevailing market pricing conditions. The business is renewable annually, and we currently estimate our exposure limit
in 2025 for a single event to be approximately US$250 million (net of reinstatement premiums) and for multiple events to be
approximately US$550 million (net of all premiums).1
| 34 | |
7. Investments
Our investment philosophy for the general fund is to invest in an asset mix that optimizes our risk adjusted returns and matches
the characteristics of our underlying liabilities. We follow a bottom-up approach which combines our strong asset management
skills with an in-depth understanding of the characteristics of each investment. We invest in a diversified mix of assets and our
diversification strategy has historically produced superior risk adjusted returns while reducing overall risk. We use a disciplined
approach across all asset classes. Our risk management strategy is outlined in the “Risk Management and Risk Factors” section
below.
General Fund Assets
As at December 31, 2025, our general fund invested assets totaled $459.9 billion compared with $442.5 billion at the end of
2024. The following table shows the asset class composition as at December 31, 2025 and December 31, 2024.
2025 | 2024 | ||||||
As at December 31, ($ billions) | Carrying value | % of total | Fair value | Carrying value | % of total | Fair value | |
Cash and short-term securities | $26.7 | 6 | $26.7 | $25.8 | 6 | $25.8 | |
Debt securities and private placement debt | |||||||
Government bonds | 83.4 | 18 | 83.1 | 83.9 | 19 | 83.6 | |
Corporate bonds | 128.4 | 28 | 128.2 | 125.0 | 28 | 124.8 | |
Mortgage / asset-backed securities | 2.3 | 1 | 2.3 | 1.8 | - | 1.8 | |
Private placement debt | 51.8 | 11 | 51.8 | 49.7 | 11 | 49.7 | |
Mortgages | 57.1 | 12 | 57.6 | 54.4 | 12 | 54.8 | |
Loans to Bank clients | 2.7 | 1 | 2.7 | 2.3 | 1 | 2.3 | |
Public equities | 41.0 | 9 | 41.0 | 33.7 | 8 | 33.7 | |
Alternative long-duration assets | |||||||
Real estate | 12.7 | 3 | 12.8 | 13.3 | 3 | 13.4 | |
Infrastructure | 18.6 | 4 | 19.2 | 17.8 | 4 | 18.3 | |
Timber and agriculture | 6.0 | 1 | 6.5 | 5.9 | 1 | 6.5 | |
Private equity | 18.4 | 4 | 18.5 | 18.3 | 4 | 18.3 | |
Energy | 1.7 | - | 1.7 | 1.9 | 1 | 1.9 | |
Various other ALDA | 4.3 | 1 | 4.3 | 3.9 | 1 | 3.8 | |
Leveraged leases and other | 4.8 | 1 | 4.8 | 4.8 | 1 | 4.8 | |
Total general fund invested assets | $459.9 | 100 | $461.2 | $442.5 | 100 | $443.5 | |
The carrying values for invested assets are generally equal to their fair values, however, residential mortgages and some
commercial mortgages are carried at amortized cost; company own use properties are mainly held at fair value; loans to Bank
clients are carried at amortized cost; and private equity investments, including infrastructure, energy, and timber, are accounted
for as associates using the equity method, or at fair value. Certain public bonds are classified as held to maturity and held at
amortized cost, with the remaining public and private bonds being classified as either “fair value through other comprehensive
income” or as “fair value through profit or loss”.
Shareholders’ accumulated other comprehensive pre-tax income (loss) as at December 31, 2025 consisted of a $15.8 billion loss
for bonds (2024 – loss of $17.5 billion), a $2.7 billion loss for private placements (2024 – loss of $3.2 billion), and a $0.9 billion
loss for mortgages (2024 – loss of $1.7 billion). Included in the losses for bonds, private placements and mortgages were gains
related to the fair value hedge basis adjustments attributable to the hedged risk of certain FVOCI bonds, FVOCI private
placements and FVOCI mortgages of $322 million, $112 million and $12 million, respectively (2024 – loss of $414 million, $235
million, and $124 million, respectively).
Debt Securities and Private Placement Debt
We manage our high-quality fixed income portfolio to optimize yield and quality while ensuring that asset portfolios remain
diversified by sector, industry, issuer, and geography. As at December 31, 2025, our fixed income portfolio of $265.9 billion (2024
– $260.3 billion) was 96% investment grade (rated BBB or better) and 70% was rated A or higher (2024 – 96% and 70%,
respectively). Our private placement debt holdings provide diversification benefits (issuer, industry, and geography) and, because
they often have stronger protective covenants and collateral than debt securities, they typically provide better credit protection
and potentially higher recoveries in the event of default. Geographically, our fixed income portfolio is well-diversified. 20% is
invested in Canada (2024 – 20%), 47% is invested in the U.S. (2024 – 48%), 7% is invested in Europe (2024 – 6%) and the
remaining 26% is invested in Asia and other geographic areas (2024 – 26%).
35 | 2025 Annual Report | Management’s Discussion and Analysis |
Debt Securities and Private Placement Debt – by Credit Quality(1)
2025 | 2024 | ||||||||
As at December 31, ($ billions) | Debt securities | Private placement debt | Total | % of Total | Debt securities | Private placement debt | Total | % of Total | |
AAA | $18.9 | $0.3 | $19.2 | 7 | $39.3 | $0.6 | $39.9 | 15 | |
AA | 55.1 | 7.9 | 63.0 | 24 | 36.2 | 7.5 | 43.7 | 17 | |
A | 83.8 | 18.6 | 102.4 | 39 | 80.9 | 17.5 | 98.4 | 38 | |
BBB | 51.8 | 18.2 | 70.0 | 26 | 48.6 | 17.8 | 66.4 | 26 | |
BB | 4.4 | 1.0 | 5.4 | 2 | 4.7 | 0.9 | 5.6 | 2 | |
B & lower, and unrated | 0.1 | 5.8 | 5.9 | 2 | 0.9 | 5.4 | 6.3 | 2 | |
Total carrying value | $214.1 | $51.8 | $265.9 | 100 | $210.6 | $49.7 | $260.3 | 100 | |
(1)Reflects credit quality ratings as assigned by Nationally Recognized Statistical Rating Organizations (“NRSRO”) using the following priority sequence order: S&P
Global Ratings (“S&P”), Moody’s Investors Services (“Moody’s”), DBRS Limited and its affiliated entities (“Morningstar DBRS”), Fitch Ratings Inc. (“Fitch”), Rating
and Investment information, Japan Credit Rating, and Kroll Bond Rating Agency. For those assets where ratings by NRSRO are not available, disclosures are
based upon internal ratings as described in the “Risk Management and Risk Factors” section below.
Debt Securities and Private Placement Debt – by Sector
2025 | 2024 | ||||||
As at December 31, (Per cent of carrying value, unless otherwise stated) | Debt securities | Private placement debt | Total | Debt securities | Private placement debt | Total | |
Government and agency | 39 | 8 | 33 | 40 | 9 | 34 | |
Utilities | 14 | 32 | 17 | 14 | 34 | 18 | |
Financial | 15 | 13 | 15 | 15 | 12 | 15 | |
Industrial | 8 | 15 | 9 | 8 | 15 | 9 | |
Consumer (non-cyclical) | 8 | 16 | 9 | 7 | 14 | 9 | |
Energy | 6 | 5 | 7 | 6 | 5 | 6 | |
Consumer (cyclical) | 3 | 6 | 4 | 3 | 5 | 3 | |
Securitized (MBS/ABS) | 1 | - | 1 | 1 | 1 | 1 | |
Telecommunications | 2 | 1 | 1 | 2 | 1 | 1 | |
Basic materials | 2 | 3 | 2 | 2 | 3 | 2 | |
Technology | 1 | 1 | 1 | 1 | - | 1 | |
Media and internet and other | 1 | - | 1 | 1 | 1 | 1 | |
Total per cent | 100 | 100 | 100 | 100 | 100 | 100 | |
Total carrying value ($ billions) | $214.1 | $51.8 | $265.9 | $210.6 | $49.7 | $260.3 | |
As at December 31, 2025, gross unrealized losses on our fixed income holdings were $23.4 billion, or 8%, of the amortized cost
of these holdings (2024 – gross unrealized loss of $26.9 billion or 10%). Of this amount, $13.0 billion (2024 – $12.2 billion)
related to debt instruments trading below 80% of amortized cost for more than 6 months. Securitized assets represented $75.0
million of the gross unrealized losses and $0.2 million of the amounts traded below amortized cost for more than 6 months (2024
– gross unrealized loss of $111.0 million and $0.2 million, respectively). After adjusting for debt securities supporting participating
policyholder and pass-through products and the provisions for credit included in the insurance and investment contract liabilities,
the potential impact to shareholders’ pre-tax earnings for debt securities trading below 80% of amortized cost for greater than 6
months was approximately $10.6 billion as at December 31, 2025 (2024 – $10.2 billion).
Mortgages
As at December 31, 2025, our mortgage portfolio of $57.1 billion represented 12% of invested assets (2024 – $54.4 billion and
12%, respectively). Geographically, 70% of the portfolio is invested in Canada (2024 – 68%) and 30% is invested in the U.S.
(2024 – 32%). The overall portfolio is also diversified by geographic region, property type, and borrower. Of the total mortgage
portfolio, 15% is insured (2024 – 14%), primarily by the Canada Mortgage and Housing Corporation (“CMHC”) — Canada’s AAA
rated government-backed national housing agency, with 31% of residential mortgages insured (2024 – 31%) and 2% of
commercial mortgages insured (2024 – 1%).
| 36 | |
As at December 31, | 2025 | 2024 | |||
($ billions) | Carrying value | % of total | Carrying value | % of total | |
Commercial | |||||
Retail | $7.9 | 14 | $8.0 | 15 | |
Office | 7.1 | 12 | 7.5 | 14 | |
Multi-family residential | 6.6 | 12 | 6.7 | 12 | |
Industrial | 6.1 | 11 | 5.5 | 10 | |
Other commercial | 2.3 | 4 | 2.4 | 4 | |
30.0 | 53 | 30.1 | 55 | ||
Other mortgages | |||||
Manulife Bank single-family residential | 26.8 | 46 | 24.0 | 44 | |
Agricultural | 0.3 | 1 | 0.3 | 1 | |
Total mortgages | $57.1 | 100 | $54.4 | 100 | |
Our commercial mortgage loans are originated with a hold-for-investment philosophy. They have low loan-to-value ratios, high
debt-service coverage ratios, and as at December 31, 2025, there were 3 loans in arrears. Geographically, of the total
commercial mortgage loans, 44% are in Canada and 56% are in the U.S. (2024 – 43% and 57%, respectively). We are
diversified by property type and largely avoid market segments such as hotels, construction loans, and second liens.
Non-CMHC Insured Commercial Mortgages(1)
As at December 31, | 2025 | 2024 | |||
Canada | U.S. | Canada | U.S. | ||
Loan-to-Value ratio(2) | 59% | 57% | 61% | 59% | |
Debt-Service Coverage ratio(2) | 1.74x | 1.98x | 1.67x | 1.94x | |
Average duration (years) | 3.91 | 5.33 | 4.15 | 5.47 | |
Average loan size ($ millions) | $22.0 | $21.6 | $21.7 | $21.9 | |
Loans in arrears(3) | 0.03% | 0.36% | 0.00% | 0.00% | |
(1)Excludes Manulife Bank commercial mortgage loans of $376 million (2024 – $350 million).
(2)Loan-to-Value and Debt-Service Coverage ratios are based on re-underwritten cash flows.
(3)Arrears defined as three or more missed monthly payments or in the process of foreclosure in Canada and two or more missed monthly payments or in the
process of foreclosure in the U.S.
Public Equities
As at December 31, 2025, public equity holdings of $41.0 billion represented 9% (2024 – $33.7 billion and 8%) of invested
assets and, when excluding assets supporting participating policyholder and pass-through products, represented 1% (2024 –
1%) of invested assets. The portfolio is diversified by industry sector and issuer. Geographically, 20% (2024 – 20%) is held in
Canada; 9% (2024 – 12%) is held in the U.S.; and the remaining 71% (2024 – 68%) is held in Asia, Europe, and other
geographic areas.
Public Equities – classified by type of product-line supported
As at December 31, | 2025 | 2024 | |||
($ billions) | Carrying value | % of total | Carrying value | % of total | |
Participating policyholders | $27.3 | 67 | $20.8 | 62 | |
Non-participating products and pass-through products | 10.4 | 25 | 9.3 | 28 | |
Global Wealth and Asset Management(1) | 1.6 | 4 | 1.5 | 4 | |
Corporate and Other segment | 1.7 | 4 | 2.1 | 6 | |
Total public equities | $41.0 | 100 | $33.7 | 100 | |
(1)Includes $1.2 billion of seed money investments in new segregated and mutual funds.
Alternative Long-Duration Assets
Our ALDA portfolio is comprised of a diverse range of asset classes with varying degrees of correlations. The portfolio typically
consists of private assets representing investments in varied sectors of the economy which act as a natural hedge against future
inflation and serve as an alternative source of asset supply to long-term corporate bonds. In addition to being a suitable match
for our long-duration liabilities, these assets provide enhanced long-term yields and diversification relative to traditional fixed
income markets. The majority of our ALDA are managed in-house.
1 Based on the global timber investment management organization ranking in the RISI International Timberland Ownership and Investment Database.
37 | 2025 Annual Report | Management’s Discussion and Analysis |
As at December 31, 2025, carrying value of ALDA of $61.7 billion represented 13% (2024 – $61.1 billion and 14%) of invested
assets. The fair value of total ALDA was $62.9 billion as at December 31, 2025 (2024 – $62.3 billion). The carrying value and
corresponding fair value by sector and/or asset type are outlined above (see table in the section “General Fund Assets”).
Real Estate
Our real estate portfolio is diversified by geographic region; of the total fair value of this portfolio, 43% is located in the U.S., 38%
in Canada, and 19% in Asia and Other as at December 31, 2025 (2024 – 45%, 37%, and 18%, respectively). This high-quality
portfolio has very low leverage and is well-diversified by property type, including industrial, multi-family, urban office, suburban
office, and company own use buildings. The portfolio is well-positioned with an average occupancy rate of 82% (2024 – 84%)
and an average lease term of 5.5 years (2024 – 5.4 years). During 2025, one acquisition was executed representing $0.05 billion
market value of commercial real estate asset (2024 – no acquisitions). As part of ongoing portfolio management initiatives, 6
commercial real estate assets totaling $0.36 billion were sold during 2025 (2024 - 3 sales and $0.07 billion, respectively).
The composition of our real estate portfolio based on fair value is as follows:
As at December 31, | 2025 | 2024 | |||
($ billions) | Fair value | % of total | Fair value | % of total | |
Company Own Use | $2.8 | 22 | $2.8 | 21 | |
Office – Downtown | 3.5 | 27 | 3.8 | 28 | |
Office – Suburban | 0.7 | 5 | 0.8 | 6 | |
Industrial | 2.5 | 20 | 2.6 | 19 | |
Residential | 2.5 | 20 | 2.5 | 19 | |
Retail | 0.3 | 2 | 0.3 | 2 | |
Other | 0.5 | 4 | 0.6 | 5 | |
Total real estate(1) | $12.8 | 100 | $13.4 | 100 | |
(1)These figures represent the fair value of the real estate portfolio excluding real estate interests. The carrying value of the portfolio was $12.7 billion and
$13.3 billion as at December 31, 2025 and December 31, 2024, respectively.
Infrastructure
We invest both directly and through funds in a variety of industry specific asset classes, listed below. The portfolio is well-
diversified with over 700 portfolio companies. The portfolio is predominantly invested in the U.S. and Canada, but also in Europe,
Australia, Asia, and Latin America. Our power and infrastructure holdings are as follows:
2025 | 2024 | |||||
As at December 31, ($ billions) | Carrying value | % of total | Carrying value | % of total | ||
Renewable power generation | $3.8 | 21 | $3.8 | 21 | ||
Thermal power generation | 1.2 | 7 | 1.7 | 9 | ||
Transportation (including roads, ports) | 4.8 | 26 | 4.5 | 25 | ||
Electric and gas regulated utilities | 0.7 | 3 | 0.7 | 4 | ||
Electricity transmission | - | - | 0.1 | 1 | ||
Water distribution | 0.3 | 1 | 0.3 | 2 | ||
Midstream gas infrastructure | 0.7 | 4 | 0.7 | 4 | ||
Maintenance service, efficiency and social infrastructure | 1.7 | 9 | 1.3 | 7 | ||
Digital infrastructure | 5.1 | 27 | 4.4 | 25 | ||
Other infrastructure | 0.3 | 2 | 0.3 | 2 | ||
Total infrastructure | $18.6 | 100 | $17.8 | 100 | ||
Timber and Agriculture
Our timber and agriculture assets of $6.0 billion as at December 31, 2025 (2024 – $5.9 billion) are managed by a proprietary
entity, Manulife Investment Management Timberland and Agriculture (“MIM Timberland and Agriculture”). In addition to being the
world’s largest timberland investment manager for institutional investors1, with timberland properties in the U.S., New Zealand,
Australia, Chile, Brazil, and Canada, MIM Timberland and Agriculture also manages farmland properties in the U.S., Australia,
Chile, and Canada. The general fund’s timber holdings comprised 21% of MIM’s total timberland AUM (2024 – 21%). The
farmland portfolio includes annual (row) crops, fruit crops, wine grapes, and nut crops. The general fund’s farmland holdings
comprised 41% of MIM’s total farmland AUM (2024 – 41%).
| 38 | |
Private Equities
Our private equity portfolio of $18.5 billion (2024 – $18.3 billion) includes both directly held private equity and private equity
funds. Both are diversified across vintage years and industry sectors. The portfolio is largely invested in private market
companies across various sectors of the economy including: consumer, business, financial, healthcare and IT services, and
software.
Energy
This category is comprised of $1.7 billion (2024 – $1.9 billion), which includes legacy oil and gas equity interests related to
upstream and midstream assets that are in runoff, and energy transition private equity interests in areas supportive of the
transition to lower carbon forms of energy, such as wind, solar, and carbon sequestration.
Investment Income
For the years ended December 31, | 2025 | 2024 |
($ millions) | ||
Interest income | $14,210 | $13,761 |
Dividend, rental income and other income(1) | 4,870 | 3,719 |
Impairments, provisions and recoveries, net | (106) | 109 |
Other | 40 | 660 |
19,014 | 18,249 | |
Realized and unrealized gains (losses) on assets supporting insurance and | ||
investment contract liabilities | ||
Debt securities | 226 | (1,857) |
Public equities | 5,231 | 4,178 |
Mortgages | 61 | (151) |
Private placements | 161 | 235 |
Real estate | (29) | (592) |
Other invested assets | 255 | 1,256 |
Derivatives | 370 | (859) |
6,275 | 2,210 | |
Investment expenses | (1,342) | (1,348) |
Total investment income (loss) | $23,947 | $19,111 |
(1)Rental income from investment properties is net of direct operating expenses.
In 2025, the $23.9 billion of investment income (2024 – income of $19.1 billion) consisted of:
•$19.0 billion of investment income before net realized and unrealized gains on assets supporting insurance and investment
contract liabilities (2024 – income of $18.2 billion);
•$6.3 billion of net realized and unrealized gains on assets supporting insurance and investment contract liabilities (2024 –
gains of $2.2 billion); and
•$1.3 billion of investment expenses (2024 – $1.3 billion).
The $0.8 billion increase in net investment income before unrealized and realized gains was primarily driven by higher interest
income on private equity assets.
In 2025, net realized and unrealized gains on assets supporting insurance and investment contract liabilities were $6.3 billion
compared with gains of $2.2 billion in 2024. The 2025 gains were primarily driven by gains on equities resulting from higher
equity markets in the U.S., Canada, and Asia. The 2024 gains were primarily driven by gains on equities resulting from higher
equity markets in the U.S., Canada and Asia, partially offset by losses on fixed income assets resulting from higher interest rates
in the U.S. and Canada.
1 The increase in Global WAM net fee income was due to higher average AUMA resulting from the favourable impact of markets over the past 12 months and the
acquisition of Comvest.
39 | 2025 Annual Report | Management’s Discussion and Analysis |
8. Fourth Quarter Financial Highlights
Profitability
Quarterly Results | ||
($ millions, unless otherwise stated) | 4Q25 | 4Q24 |
Net income (loss) attributed to shareholders | $1,499 | $1,638 |
Core earnings(1) | $1,993 | $1,907 |
Diluted earnings (loss) per common share ($) | $0.83 | $0.88 |
Core EPS ($) | $1.12 | $1.03 |
ROE | 12.7% | 14.0% |
Core ROE | 17.1% | 16.5% |
Expense efficiency ratio | 44.7% | 44.4% |
General expenses | $1,327 | $1,328 |
Core expenses | $1,873 | $1,797 |
(1)Impact of currency movement on the fourth quarter of 2025 (“4Q25”) core earnings compared with the fourth quarter of 2024 (“4Q24”) was a $7 million
unfavourable variance.
Manulife’s 4Q25 net income attributed to shareholders was $1,499 million compared with $1,638 million in 4Q24. Net
income attributed to shareholders is comprised of core earnings (consisting of items we believe reflect the underlying earnings
capacity of the business), which amounted to $1,993 million in 4Q25 compared with $1,907 million in 4Q24, and items excluded
from core earnings, which amounted to a net charge of $494 million in 4Q25 compared with a net charge of $269 million in 4Q24.
The effective tax rate on net income (loss) attributed to shareholders was 16% in 4Q25 compared with 19% in 4Q24, primarily
due to differences in the jurisdictional mix of earnings and the impact of tax true-ups.
Net income attributed to shareholders in 4Q25 decreased $139 million compared with 4Q24, primarily reflecting a higher charge
from market experience, partially offset by growth in core earnings. The net charge from market experience of $441 million in
4Q25 was primarily from lower-than-expected returns on ALDA, mainly related to infrastructure, private equity, and real estate
investments, as well as a net charge from derivatives and hedge accounting ineffectiveness.
The 5% increase in core earnings on a constant exchange rate basis compared with 4Q24 was driven by growth in our insurance
business, the net impact of 2025 updates to actuarial methods and assumptions and a net release in the provision for ECL in
4Q25. In addition, core earnings increased in Global WAM, reflecting higher net fee income1, as well as disciplined expense
management, partially offset by the impact of the eMPF transition in Hong Kong and lower performance fees in Institutional Asset
Management. These increases were partially offset by unfavourable insurance experience in our U.S. life insurance business,
lower expected investment earnings and less favourable insurance experience in Canada. In addition, the RGA U.S.
Reinsurance Transaction reduced core earnings by $6 million in 4Q25 compared with 4Q24.
Additional information on the change in ECL is presented in the following table:
($ millions) | 4Q25 | 4Q24 |
Change in ECL | ||
Net new originations or purchases | $1 | $(6) |
Changes to risk, parameters and models | ||
Credit migration | (36) | (9) |
Parameter and model updates, and other | 47 | 10 |
Total (increase) recovery in ECL, pre-tax | $12 | $(5) |
Total (increase) recovery in ECL, post-tax | $11 | $(3) |
The reduction in the ECL provision of $11 million post-tax in 4Q25 was primarily related to a positive market environment and
parameter updates, partially offset by credit migration. The post-tax ECL provision was neutral in 4Q24, reflecting the positive
macro environment, offset by credit migration.
| 40 | |
Core earnings by segment are presented in the following table for the periods presented.
4Q25 | 4Q24 | |
($ millions) | ||
Core earnings by segment | ||
Asia | $785 | $640 |
Canada | 413 | 390 |
U.S. | 319 | 412 |
Global Wealth and Asset Management | 490 | 459 |
Corporate and Other | (14) | 6 |
Total core earnings | $1,993 | $1,907 |
In Asia, core earnings were $785 million in 4Q25 compared with $640 million in 4Q24. The 24% increase on a constant
exchange rate basis was driven by an increase in expected earnings on insurance contracts and higher expected investment
earnings, both reflecting business growth. The increase in expected earnings on insurance contracts also reflected the net
impact of 2025 updates to actuarial methods and assumptions. Investment income on allocated capital also increased core
earnings by $21 million on a pre-tax basis in 4Q25 compared with 4Q24.
In Canada, core earnings were $413 million in 4Q25 compared with $390 million in 4Q24. The 6% increase primarily reflected
favourable insurance experience in Individual Insurance, higher expected investment earnings, business growth in Group
Insurance, and an increase in CSM amortization, partially offset by less favourable insurance experience in Group Insurance.
Core earnings also included the net favourable impact of 2025 updates to actuarial methods and assumptions. Investment
income on allocated capital reduced core earnings by $7 million on a pre-tax basis compared with 4Q24.
In the U.S., core earnings were $319 million in 4Q25 compared with $412 million in 4Q24. The 22% decrease on a constant
exchange rate basis reflected lower expected investment earnings and unfavourable life insurance claims experience in 4Q25
compared with favourable experience in 4Q24, partially offset by higher expected earnings on insurance contracts. Investment
income on allocated capital also reduced core earnings by $19 million on a pre-tax basis in 4Q25 compared with 4Q24. The RGA
U.S. Reinsurance Transaction reduced core earnings by $5 million in 4Q25 compared with 4Q24, attributable to the impact on
the expected earnings on insurance contracts and expected investment earnings.
Global WAM core earnings were $490 million in 4Q25 compared with $459 million in 4Q24. The 7% increase was driven by an
increase in net fee income from higher average AUMA resulting from the favourable impact of markets over the past 12 months
and the acquisition of Comvest, as well as disciplined expense management. This increase was partially offset by the impact of
the eMPF transition in Hong Kong and lower performance fees in Institutional Asset Management.
Corporate and Other core loss was $14 million in 4Q25 compared with core earnings of $6 million in 4Q24. The $20 million
decrease in core earnings was primarily related to higher interest on capital allocated to operating segments.
The following table presents net income attributed to shareholders consisting of core earnings and the items excluded from core
earnings.
($ millions) | 4Q25 | 4Q24 |
Core earnings | $1,993 | $1,907 |
Items excluded from core earnings: | ||
Market experience gains (losses)(1) | (441) | (192) |
Realized gains (losses) on debt instruments | 27 | (43) |
Derivatives and hedge accounting ineffectiveness | (162) | 40 |
Actual less expected long-term returns on public equity | (63) | (113) |
Actual less expected long-term returns on ALDA | (232) | (97) |
Other investment results | (11) | 21 |
Updates to actuarial methods and assumptions that flow directly through income | - | - |
Restructuring charge(2) | (12) | (52) |
Amortization of acquisition-related intangible assets | (12) | - |
Reinsurance transactions, tax-related items and other(3) | (29) | (25) |
Total items excluded from core earnings | (494) | (269) |
Net income (loss) attributed to shareholders | $1,499 | $1,638 |
(1)Market experience was a net charge of $441 million in 4Q25 primarily reflecting lower-than-expected returns on ALDA mainly related to infrastructure, private
equity, and real estate investments, a net charge from derivatives and hedge accounting ineffectiveness and lower-than-expected returns on public equity, partially
offset by realized gains from the sale of debt instruments which are classified as FVOCI. Market experience was a net charge of $192 million in 4Q24 primarily
reflecting lower-than-expected returns from public equity, lower-than-expected returns on ALDA driven by real estate investments, and net realized losses from the
sale of debt instruments which are classified as FVOCI. These were partially offset by a gain from derivatives and hedge accounting ineffectiveness and other
investment results.
(2)In 4Q25, we reported a restructuring charge of $12 million post-tax ($16 million pre-tax) in Global WAM and Canada. In 4Q24, we reported a restructuring charge
of $52 million post-tax ($67 million pre-tax) in Global WAM and Canada.
(3)The 4Q25 net charge of $29 million mainly included a charge for tax-related adjustments of $14 million, a $10 million charge for an investment impairment in
Global WAM and $7 million charge for Comvest acquisition related costs. The 4Q24 net charge of $25 million mainly included a $22 million charge for an
investment impairment in Global WAM.
41 | 2025 Annual Report | Management’s Discussion and Analysis |
Net income attributed to shareholders by segment is presented in the following tables.
Quarterly Results | ||
($ millions) | 4Q25 | 4Q24 |
Asia | $623 | $583 |
Canada | 252 | 439 |
U.S. | 81 | 103 |
Global Wealth and Asset Management | 452 | 384 |
Corporate and Other | 91 | 129 |
Total net income (loss) attributed to shareholders | $1,499 | $1,638 |
Expense efficiency ratio
The expense efficiency ratio was 44.7% in 4Q25, compared with 44.4% in 4Q24. The 0.3 percentage point increase in the ratio
compared with 4Q24 reflected a 4% increase in core expenses, partially offset by a 3% increase in pre-tax core earnings. The
increase in core expenses was driven by higher strategic investments in digital transformation and AI, higher workforce-related
costs, the acquisition of Comvest, and the impact of the eMPF transition in Hong Kong. These were partially offset by disciplined
expense management primarily in Global WAM.
Core general expenses are a component of core expenses. Total general expenses in 4Q25 were consistent with 4Q24 on both
an actual and constant exchange rate basis, driven by items noted above for the increase in core expenses, offset by a reduction
in general expenses excluded from core earnings. General expenses excluded from core earnings in 4Q25 consisted primarily of
restructuring charges in Global WAM and Canada, the amortization of acquisition related intangible assets, and the acquisition of
Comvest. In 4Q24, these expenses were primarily related to restructuring charges in Global WAM and Canada and the
acquisition of CQS.
Business Performance
As at and for the quarters ended December 31, | 2025 | 2024 |
($ millions, unless otherwise stated) | ||
Asia APE sales | $1,608 | $1,661 |
Canada APE sales | 383 | 376 |
U.S. APE sales | 231 | 211 |
Total APE sales | 2,222 | 2,248 |
Asia new business CSM | 697 | 586 |
Canada new business CSM | 135 | 116 |
U.S. new business CSM | 188 | 140 |
Total new business CSM | 1,020 | 842 |
Asia new business value | 606 | 551 |
Canada new business value | 174 | 168 |
U.S. new business value | 94 | 89 |
Total new business value | 874 | 808 |
Asia CSM net of NCI | 17,750 | 15,540 |
Canada CSM | 4,459 | 4,109 |
U.S. CSM | 2,760 | 2,468 |
Corporate and Other CSM | - | 10 |
Total CSM net of NCI | 24,969 | 22,127 |
Post-tax CSM net of NCI | 20,733 | 18,353 |
Global WAM gross flows ($ billions) | 49.9 | 43.5 |
Global WAM net flows ($ billions) | (9.5) | 1.2 |
Global WAM assets under management and administration ($ billions) | 1,106.6 | 1,031.1 |
Global WAM total invested assets ($ billions) | 9.8 | 9.7 |
Global WAM segregated funds net assets ($ billions) | 313.6 | 291.9 |
Total assets under management and administration ($ billions) | 1,704.4 | 1,608.0 |
Total invested assets ($ billions) | 459.9 | 442.5 |
Total net segregated funds net assets ($ billions) | 461.3 | 436.0 |
1 Asia Other excludes Hong Kong and Japan.
| 42 | |
APE sales were $2,222 million in 4Q25, in line with 4Q24, New business CSM was $1,020 million in 4Q25, an increase of 21%
compared with 4Q24, and NBV was $874 million in 4Q25, an increase of 8% compared with 4Q24.
•In Asia, APE sales decreased 3% in 4Q25 compared with 4Q24, as growth in Japan and Asia Other1 was more than offset
by lower sales in Hong Kong. New business CSM and NBV increased 19% and 10% respectively in 4Q25 compared with
4Q24, due to business mix partially offset by lower sales volumes. NBV margin improved to 41.2%.
•In Canada, APE sales increased 2% in 4Q25 compared with 4Q24, reflecting higher sales in Individual Insurance and
Annuities, partially offset by lower sales in Group Insurance. New business CSM increased 16% in 4Q25 compared with
4Q24, driven by higher sales volumes and margins in Individual Insurance, and higher sales volumes in Annuities. NBV
increased 4% in 4Q25 compared with 4Q24, driven by higher sales volumes and margins in Individual Insurance and
Annuities, partially offset by lower sales volumes in Group Insurance.
•U.S. APE sales increased 9% in 4Q25 compared with 4Q24, reflecting broad-based demand for our suite of products. New
business CSM increased 34% compared with 4Q24 primarily driven by higher sales volumes and product mix. NBV
increased 8% compared with 4Q24, primarily driven by higher sales volumes.
Global WAM net outflows were $9.5 billion in 4Q25 compared with net inflows of $1.2 billion in 4Q24.
•Net outflows in Retirement were $7.2 billion in 4Q25 compared with net outflows of $1.9 billion in 4Q24, primarily driven by
higher retirement plan redemptions, and higher net member withdrawals reflecting higher account balances from market
growth. This was partially offset by higher new plan sales across all geographies.
•Net outflows in Retail were $5.6 billion in 4Q25 compared with net inflows of $1.3 billion in 4Q24, due to lower net sales
through third-party intermediaries in North America and our Canada retail wealth platform.
•Net inflows in Institutional Asset Management were $3.4 billion in 4Q25 compared with net inflows of $1.8 billion in 4Q24,
due to higher net flows from fixed income mandates, primarily driven by our Manulife | CQS products, and money market
mandates, as well as the impact of the acquisition of Comvest. This was partially offset by higher redemptions in equity
mandates and lower deployments in private markets.
43 | 2025 Annual Report | Management’s Discussion and Analysis |
9. Risk Management and Risk Factors
This section provides an overview of our overall risk management approach along with detailed description of specific risks.
Enterprise Risk Management Framework
Our approach to risk management is governed by our Enterprise Risk Management (“ERM”) Framework. The ERM Framework is
a foundational, holistic, integrated, and adaptive approach to understanding and managing risk while balancing the need to
remain competitive. This structure is designed to provide guardrails on our risk profile while optimizing risk-adjusted returns
without compromising our ability to meet our commitments to customers and all stakeholders.
The ERM Framework is comprised of five interrelated components: Risk Taxonomy, Risk Appetite, Risk Governance, Risk
Process, and Risk Culture.
Risk Taxonomy
Our businesses and operations expose Manulife to a broad range of potentially material risks. The Risk Taxonomy categorizes
and defines these risks. It creates a common risk language and provides reasonable assurance that risks are consistently
understood and managed.
In this document, the risks are categorized in six overarching categories (known collectively as “Principal Risks”): Strategic Risk,
Market & Liquidity Risk, Credit & Investment Risk, Insurance Risk, Operational Risk and Technology & Cyber Risk. The Principal
Risks are further subdivided into subcategories, with increasing levels of granularity as appropriate.
The Risk Taxonomy is a core element of the ERM Framework, supporting all other components. It provides the basis for policy
and committee coverage (Risk Governance), enables risk identification (Risk Process), reasonably assures that Risk Appetite
Statements and Limits are established for material risks (Risk Appetite), and clarifies who is accountable for managing each risk
(Risk Culture).
The following sections of the MD&A describe the risk management strategies and risk factors for each Principal Risk category.
Additional risks not presently known to us or that are currently immaterial could impair our businesses, operations and financial
condition in the future. If any such risks should occur, the trading price of our securities, including common shares, preferred
shares and debt securities, could decline, and investors may lose all or part of their investment.
Risk Appetite
The Risk Appetite Framework (“RAF”) guides the level of risk, for each risk category that we are prepared to accept in pursuit of
our strategic priorities, as well as how much additional risk we can tolerate.
The RAF creates a balanced view of risk and return that promotes sustainable growth and resilience, supports informed
decision-making, and fosters prudent Risk Culture. The RAF is integral to the Board and management discussions and decision-
making. They receive regular reports on the RAF’s effectiveness and compliance, including comparisons of actual results versus
stated RAF measures, and notification of any limit breaches and corresponding action plans. Risk Appetite Statements are
designed to provide guardrails on our appetite for identified risks. Qualitative Risk Appetite Statements regarding our Principal
Risks are summarized as follows:
•Strategic – Manulife accepts a total level of risk that provides a very high level of confidence to meeting customer
obligations while targeting an appropriate overall return to shareholders over time.
•Market & Liquidity – Market risks are acceptable when they are managed within specific risk limits and tolerances.
•Credit & Investment – Manulife believes a diversified investment portfolio reduces overall risk and enhances returns;
therefore, it accepts credit and ALDA-related risks as part of its investment strategy.
•Insurance – Manulife pursues insurance risks that add customer and shareholder value where we have competence to
assess and monitor them, and for which we receive appropriate compensation.
•Operational – Manulife accepts that operational risks, as well as Technology & Cyber risks below, are an inherent part of
the business and are managed by implementing appropriate controls that provide reasonable assurance that we are within
our risk thresholds and tolerances. Management will protect its business and customers’ assets through cost-effective
operational risk mitigation.
•Technology & Cyber – Manulife manages technology risk by prioritizing activities that support a stable, scalable and
resilient technology environment guided by formal technology governance processes. Manulife manages cybersecurity risk
by maintaining the confidentiality, integrity and availability of our technology assets supported by layered and intelligence
driven defenses.
Quantitative Risk Appetite Statements (“RAS Metric”), Risk Tolerance and Board-approved Limits establish the aggregate level of
each type of risk the Company may take. Depending on the risk being quantified, different measures are used; these include
1 The Chief Actuary and the Actuarial function are considered to have accountability for both the First Line and Second Line duties.
| 44 | |
Earnings at Risk (“EaR”), Economic Capital (“EC”), LICAT, measures of liquidity risk, and measures pertaining to derivative
usage.
Risk Governance
Risk Governance is intended to provide an organized approach to risk management oversight. It is articulated in policies and
executed through a Three Lines Operating Model that is supported by a risk committee structure. Requirements, limits, and
decisions are cascaded top-down; issues, escalations, and reporting are raised bottom-up.
Risk Committee Structure
The Board governs oversight of risk management and is supported by a dedicated Board Risk Committee (“BRC”).
Management has established an Executive Risk Committee (“ERC”), which strategically manages our global risk profile, and
shapes our Risk Management Principles, Risk Appetite, and Risk Culture.
The ERC is supported by Risk Oversight Committees including Global Asset Liability Committee, Credit Committee, Product
Oversight Committee, Operational Risk and Resilience Oversight Committee, Technology and Cyber Risk Committee,
Reinsurance Risk Oversight Committee, and Capital Outlook Committee.
Segment Risk Committees have also been established, each with mandates similar to the ERC with a focus on the applicable
segment (Asia, Canada, U.S., and Global WAM). All functional and segment risk oversight committees oversee our risks with
independent chairs. These committees may further delegate oversight activities to various subcommittees.
Three Lines Operating Model
Management has established an operating model that separates duties between risk taking, risk oversight, and independent
assurance as follows:
The First Line consists of the CEO, General Managers for the Segments and Business Units (“Business Management”), Group
Function Heads (“Group Functions”), and their respective teams. Business Management and Group Functions are accountable
for maintaining an effective control environment, managing risks arising from everyday operations, and overseeing the execution
of the business strategy. They have a responsibility to identify, assess, manage, monitor, and report on their risk exposures, and
to sufficiently document these activities.
The Second Line consists of oversight functions, which provide objective assessments to the Board, BRC and Audit Committee.
These include the Chief Risk Officer (“CRO”) who leads the Global Risk Management (“GRM”) function, the Global Compliance
Chief who leads the Global Compliance function, and the Chief Actuary who leads the Actuarial function1. Collectively, these
oversight functions design and implement policies and procedures to independently identify, assess, monitor, and report on risks.
They have a responsibility to oversee and objectively challenge the effectiveness of First Line risk management and internal
controls; to determine whether operations, results and risk exposures are consistent with Risk Appetite; and to sufficiently
document their activities.
The Third Line consists of the Chief Auditor and the Audit & Advisory Services team, which provides independent assurance to
the Board and management on the effectiveness of internal controls, risk management, and governance processes.
Risk Process
The Risk Process involves the First Line managing risk in alignment with the RAF and within Risk Limits, and the Second Line
overseeing risk management and providing objective challenges. It entails the First Line and the Second Line independently
identifying, assessing, monitoring, and reporting on our current risk profile and our risk profile under stressed conditions, with
appropriate controls and documentation.
Risk Identification
Risk identification is the first step in the Risk Process. Given the constantly evolving operating environment, risk identification is
an ongoing process conducted using a risk based approach that considers risk exposure size, likelihood of the risk occurring,
and its impact.
Risks within the Company’s strategic and business plans are identified and assessed for alignment with Risk Appetite at least
annually.
Risk identification distinguishes between the identification of risk events, their drivers, and their impacts. Multiple different drivers
can contribute to or result in the same risk event. One risk event can result in multiple different impacts.
45 | 2025 Annual Report | Management’s Discussion and Analysis |
Risk Assessment
Risk assessment involves granular understanding of the probability of a risk event occurring as well as the potential impacts it
may have. Risk assessment must be current, timely, and of sufficient granularity and quality to support decision-making. It can
leverage both quantitative approaches and qualitative perspectives. On a Company-wide basis, multiple approaches are used to
assess risk individually and in aggregate.
Risk Management
Risks are effectively managed to an acceptable level. The First Line establishes processes and controls for managing risks
arising from their activities within stated Risk Appetite, which can include risk avoidance, risk acceptance, risk mitigation, and risk
transfer techniques. The Second Line provides an independent oversight and objective challenge.
Risk Monitoring
Risk exposures fluctuate over time. We monitor risk exposures on an ongoing basis and take appropriate action to keep
exposures within the Risk Appetite. At times, risk exposures may move beyond Risk Appetite into the tolerance range; in those
circumstances, we act to further mitigate or transfer the risk to avoid a breach of our Risk Limits.
Risk Reporting
The Company produces Risk Reporting that is accurate, timely, comprehensive and of sufficient quality, clarity, and granularity so
that it can be relied upon for decision-making.
Risk Profile and Stress Testing
Regular and timely stress testing, including sensitivity testing and scenario testing, is designed to facilitate risk identification and
assessment, which contributes to the establishment of risk mitigation plans and control. Stress testing supports strategic
decision-making and assesses the impact of severe but plausible events on our risk profile. Subject to the specific stress test, it
can inform:
•Evaluation of implications on earnings and capital;
•Evaluation of the Company’s liquidity profile;
•Identification of potential portfolio vulnerabilities, sensitivities, and concentrations;
•The establishment of the Company’s internal capital target ratios; and
•Validation of contingency plans.
A range of stress tests are regularly considered. On a regular basis, the Second Line establishes the parameters of stress testing
with the involvement of the First Line to determine appropriate scenario definitions and assumptions. Ad hoc stress testing is
often developed in response to changes in the environment or to aid management, BRC and the Board in decision-making. For
key exposures, stress testing is performed at least annually.
Risk Culture
The Company is committed to a set of shared values, which reflect our culture, inform our behaviours, actions, and decisions,
and help define how we work together. Refer to “Enterprise Strategy” above for more information on our values.
Risk Culture is a subset of the Company’s culture; it reflects norms of behaviours, actions, and decisions in relation to risk
awareness, risk taking, and risk oversight. A sound Risk Culture balances risk-return to remain within Risk Appetite and in
alignment with the ERM Framework. It emphasizes the importance of maintaining an effective control environment. It promptly
detects and remediates policy/limit breaches and operational incidents, and then follows up to understand root causes, enhances
preventative and detective controls, and takes appropriate disciplinary action if warranted.
We foster a sound Risk Culture that promotes integrity and risk awareness. We balance the level of risk with obligations to our
stakeholders. We incentivize behaviours, actions and decisions that achieve consistent and sustainable performance over the
long-term. Our values support our Risk Culture by creating an environment where we communicate openly, raise issues
proactively, take accountability, and make decisions that align to the ERM Framework.
Culture Risk is the risk that arises when there is misalignment between an organization’s desired culture and its actual culture
and the behaviours, decisions, and practices that are demonstrated and reinforced across the Company. Such misalignment can
undermine strategic objectives, regulatory compliance, ethical conduct, and effective risk management. Common drivers include
inconsistent leadership tone, unclear accountability, ineffective communication, or incentives that conflict with risk principles.
To manage Culture Risk effectively, the Company embeds cultural expectations into core business and talent practices, among
others, through:
•Enterprise-wide communication of our values;
•Performance assessment ratings that assess behaviours (‘how’) alongside outcomes (‘what’);
•Appropriate incentive compensation structures that do not encourage unnecessary risk-taking; and
| 46 | |
•Confidential reporting channels such as an ethics hotline to support a speak-up culture.
Culture alignment is reinforced through recruitment, onboarding, training, and leadership development, while governance
structures and escalation processes further strengthen accountability and cultural integrity.
Strategic Risk
Strategic risk is the risk of loss resulting from the inability to adequately plan or implement an appropriate business strategy that
allows us to effectively compete in the markets in which we operate, or to adapt to change in the external business, economic,
geopolitical, or regulatory environment.
Customer acquisition, loyalty and retention, and access to distributors are important to the Company’s success and are
influenced by many factors, including product features, prices, our distribution practices and regulations, service levels including
digital capabilities, investment performance, and our financial strength ratings and reputation. Our ability to effectively compete is
highly dependent upon being quick to react and adapt to changes from the external environment while continuing to proactively
drive innovation.
Strategic Risk Management Strategy
While the Board approves the overall strategy of the Company, the CEO and Executive Leadership Team establish and oversee
execution of business strategies and have accountability to understand and manage the risks embedded in these strategies.
They are supported by several processes:
•Strategic business, financial, and capital planning that is prepared by Executive Leadership Team and reviewed with the
Board;
•Performance and risk reviews of all key businesses with the CEO and annual reviews with the Board;
•Risk based capital allocation designed to encourage a consistent decision-making framework across the organization; and
•Review and approval of significant acquisitions and divestitures by the CEO and Deal Committee and, where appropriate,
the Board.
Reputation Risk
Our reputation is among our most valuable assets. Our Risk Management Principles compel us to protect our reputation and
brand.
Reputation risk is the risk that the Company’s corporate reputation may be eroded by adverse publicity, real or perceived, as a
result of business practices of the Company or its representatives, potentially resulting in damage to the Company’s franchise
value.
Reputation risk may arise from both internal and external drivers. This transverse nature of reputation risk, which can be a causal
risk driver, a risk event, or an impact arising from other risks, means that understanding and managing it cannot be done in
isolation. Reputation risk identification, assessment and monitoring processes and practices are embedded in:
•Business operations and management decisions;
•Governance and mitigation/control processes, including within the Crisis Management Standard, and risk monitoring
processes;
•Impact analysis of changes in society, social media, and political and regulatory factors;
•Regular amendments to the Code of Business Conduct and Ethics for review and sign off, as well as disclosure of conflicts
of interest by employees and directors; and
•Explicit discussion of corporate reputation as a valued asset within training materials.
Environmental, Social and Governance Framework
Sustainability issues may impact Manulife’s investments, underwriting, and operations. These impacts could lead to adverse
financial, operational, legal, reputational, or brand value risks for Manulife, due to Manulife’s actual or perceived actions or
inaction in relation to sustainability issues.
The Board’s Corporate Governance and Nominating Committee (“CGNC”) oversees Manulife’s environmental, social, and
governance (“ESG”) framework, including matters related to climate change strategy and disclosures. On a regular basis, the
CGNC is updated on relevant sustainability matters, including Manulife’s progress against the commitments set out in Manulife’s
Climate Action Plan. In addition to regular internal sessions, members of the CGNC participate in at least one externally
facilitated sustainability-related education session every two years.
The CGNC’s oversight complements the work of Manulife’s Executive Sustainability Council (“ESC”), which is composed of
senior executives, including the CEO, the Chief Sustainability Officer (“CSO”), and other functional and business leaders. The
ESC may rotate its Chair at the election of its members and is currently chaired by the General Counsel. The ESC generally
convenes on a monthly basis and is responsible for establishing the enterprise’s sustainability ambition, guiding the development
and execution of our sustainability strategy, and providing recommendations and direction on sustainability matters. The CSO
47 | 2025 Annual Report | Management’s Discussion and Analysis |
chairs Manulife’s Sustainability Centre of Expertise (“CoE”), which consists of corporate function and business unit leads tasked
with leading the development and implementation of Manulife’s sustainability strategy and the integration of sustainability into
business unit strategies, policies, and procedures. The CoE is supported by a network of committees and working groups that
convene regularly to provide decision-making oversight and enable coordinated action across a range of sustainability topics.
Additionally, our Global Inclusion Strategy is led by our Global Chief Inclusion Officer, alongside the Global Inclusion Team and
Global Inclusion Council. The Council, chaired by our CEO and Chief People Officer, includes executive leaders who champion
inclusion within their business functions and turn strategy into action. Council members meet quarterly to champion initiatives
tailored to their respective functions, influencing inclusion around people, customer experience, and product design.
Climate Risk Management Strategy
Consistent with the International Sustainability Standards Board’s (“ISSB”) IFRS S2 “Climate-related Disclosures” standard,
which leverages the Taskforce on Climate-Related Financial Disclosures framework, Manulife defines climate-related risks as the
potential negative impacts from climate change on Manulife’s business model, strategy, and financial and operational resilience.
These may be experienced directly (e.g., through financial loss) and/or indirectly (e.g., through reputational harm), resulting from
the physical impacts of climate change or the transition to a low-carbon economy.
Climate-related risks are viewed as transverse risks that manifest across a diverse set of pathways, with the potential to affect
any of Manulife’s principal risks, including Strategic Risk (including Reputational), Market & Liquidity Risk, Credit & Investment
Risk, Insurance Risk, Operational Risk (including Legal) , and Technology & Cyber Risk. Failure to adequately prepare for the
potential impacts of climate change could result in material adverse impacts on Manulife’s balance sheet and/or Manulife’s ability
to operate effectively.
In response, we have enhanced the integration of climate-related risk into Manulife’s ERM Framework, with an aim of ensuring
that they are managed in alignment with Manulife’s overall risk management approach. Manulife’s Environmental Risk Policy,
and other relevant policies and standards, guide business operations in identifying and assessing climate-related risks. GRM
continues to enhance risk management practices to account for potential climate impacts across key areas, including in
Manulife’s investment decision-making processes, life insurance underwriting due diligence, and assessment of operational risks
and controls.
For details on our strategy to address climate change, please see Manulife’s “Climate Action Implementation Plan Report”. For
details on the management of material sustainability matters and performance data, please see Manulife’s annual “Sustainability
Report”, published in the second quarter of each year.
Strategic Risk Factors
We may not be successful in executing our business strategies or these strategies may not achieve our objectives.
•The global environment has a significant impact on our financial plans and ability to implement our business strategy.
•Our business strategy and associated financial plans are developed by considering forecasts of economic growth. Actual
economic growth can be significantly impacted by the macroeconomic environment and can deviate significantly from
forecasts, thus impacting our financial results and the ability to implement our business strategy.
•Operations in new markets may achieve low margins or may be unprofitable, and expansion in existing markets may be
affected by local economic and market conditions.
•Changes in the global environment can also have a significant impact on financial markets, including movements in interest
rates, spreads on fixed income assets, and returns on public equity and ALDA investments. Our financial plan, including
income, balance sheet, and capital projections are based on certain assumptions with respect to future interest rates and
spreads on fixed income assets, and future returns from our public equity and ALDA investments. Actual experience is highly
variable and can deviate significantly from our assumptions, thus impacting our financial results. For example, for changes
to interest rates, please refer to the risk factor “Prolonged changes in market interest rates may impact our net income
attributed to shareholders and capital ratios”.
•The spending and savings patterns of our customers can evolve, impacting the products and services we offer to our
customers.
•Customer behaviour and emergence of claims on our liabilities can change. For example, a prolonged period of economic
weakness in certain markets may adversely impact policyholders’ behaviour (such as higher withdrawals, lapses, lower
premium deposits, and lower policy persistency than anticipated), increase expenses and cost of funding, along with other
adverse impacts from continued uncertainty in our operating environment as noted in the Market & Liquidity Risk Factors
section below.
•A rise in geopolitical tensions and political risk either within or outside of jurisdictions in which we operate can trigger
changes in the global environment, overall regulatory landscape, and consumer behaviour, which can have various impacts
across our business. For example, economic sanctions imposed on a country could adversely impact our ability to achieve
specific business objectives. Military conflicts could drive financial and economic dislocations across global capital markets,
supply chains, or commodity markets. See also “Operational Risk Factors – Our operations face political, legal, operational,
and other risks that could negatively affect those operations or our results of operations and financial condition.”
| 48 | |
Adverse publicity, litigation or regulatory action resulting from our business practices or actions by our employees,
representatives and/or business partners could erode our corporate image and damage our franchise value and/or
create losses.
•Harm to a company’s reputation is often a consequence of risk control failure. Manulife’s reputation could also be harmed by
the actions of third parties with whom we do business. Our representatives include affiliated broker-dealers, agents,
wholesalers, and independent distributors, such as broker-dealers and banks, on whose services and representations our
customers rely. Business partners include, among others, joint venture partners and third parties to whom we outsource
certain functions and that we rely on to fulfill various obligations.
•If any of these representatives or business partners fail to adequately perform their responsibilities or monitor their own
risks, these failures could affect our business reputation and operations. While we seek to maintain adequate internal risk
management policies and procedures and protect against performance failures, events may occur involving our
representatives or our business partners. Such events could cause us to lose customers or cause us or our representatives
or business partners to become subject to legal, regulatory, economic or trade sanctions, which could have a material
adverse effect on our reputation, our business and our results of operations. For further discussion of government regulation
and legal proceedings, refer to “Government Regulation” in MFC’s Annual Information Form dated February 11, 2026, and
note 18 of the 2025 Annual Consolidated Financial Statements.
Our businesses are heavily regulated, and changes in regulation or laws – or in the interpretation or enforcement
thereof – may reduce our profitability and limit our growth.
•Our operations are subject to a wide variety of insurance and other laws and regulations including with respect to financial
crimes (which include, but are not limited to, money laundering, bribery and economic or trade sanctions), privacy, market
conduct, consumer protection, business conduct, prudential and other generally applicable non-financial requirements.
Legislators, regulators and self-regulatory or government authorities in Canada, the United States, Asia and other
jurisdictions regularly re-examine existing laws, regulations, rules and standards applicable to insurance companies,
investment advisors, broker-dealers and their products. Compliance with applicable laws and regulations is time consuming
and personnel-intensive, and changes in these laws and regulations, or in the interpretation or enforcement thereof, may
materially increase our direct and indirect compliance costs and other expenses of doing business, thus having a material
adverse effect on our results of operations and financial condition.
•Future regulatory capital, actuarial and accounting changes, including changes with a retroactive impact, could have a
material adverse effect on the Company’s consolidated financial condition, results of operations and regulatory capital both
on transition and going forward. In addition, such changes could have a material adverse effect on the Company’s position
relative to that of other Canadian and international financial institutions with which Manulife competes for business and
capital.
•In Canada, MFC and its principal operating subsidiary, MLI, are governed by the Insurance Companies Act (Canada)
(“ICA”). The ICA is administered, and the activities of the Company are supervised, by the Office of the Superintendent of
Financial Institutions (“OSFI”). MLI is also subject to regulation and supervision under the insurance laws of each of the
provinces and territories of Canada. Regulatory oversight is vested in various governmental agencies having broad
administrative power with respect to, among other things, dividend payments, capital adequacy and risk-based capital
requirements, asset and reserve valuation requirements, permitted investments and the sale and marketing of insurance
contracts. OSFI has an expanded mandate to supervise institutions to determine whether they have adequate policies and
procedures to protect against threats to integrity and security, including foreign interference. In general, OSFI has increased
their supervisory focus on other non-financial risks, which has led to new or enhanced regulations, including conduct risk,
third-party risk, cybersecurity, and operational resilience. These regulations focus on protecting policyholders, beneficiaries,
and the stability of the Canadian financial system, rather than investors, and may adversely impact shareholder value.
•Some recent examples of regulatory and professional standard developments, which could impact our net income attributed
to shareholders and/or capital position, are provided below.
◦A new Segregated Fund Guarantees LICAT capital framework became effective on January 1, 2025. The new
framework includes adjustments to the available capital calculation, adjustments to the Base Solvency Buffer and the
inclusion of transition measures. We continue to meet OSFI’s requirements and maintain capital in excess of regulatory
expectations.
◦The International Association of Insurance Supervisors (“IAIS”) announced the adoption of a new global Insurance
Capital Standard (“ICS”) at their annual conference in December 2024. LICAT continues to provide an appropriate risk-
based measure of group capital in Canada and we do not expect any impact from the adoption of ICS by IAIS.
◦The National Association of Insurance Commissioners (“NAIC”) continues to review and revise reserving and capital
methodologies as well as the overall risk management framework as required to keep pace with an evolving landscape.
These reviews will affect U.S. life insurers, including John Hancock, and could lead to increased reserving and/or capital
requirements for our business in the U.S. Additionally, in December 2020 the NAIC adopted a group capital calculation
(“GCC”) which included exemptions for certain insurance holding groups, including John Hancock and Manulife, from
the requirements of the GCC. Michigan, the lead state for NAIC regulation of John Hancock, amended its regulations in
March 2023 to adopt the NAIC GCC model language and the Michigan Department of Insurance and Financial Services
(“DIFS”) has promulgated implementing rules. As the Canadian group-wide supervisor, OSFI was determined to be a
“Recognize and Accept Jurisdiction” by the NAIC on December 18, 2024, providing mutual recognition and treatment of
49 | 2025 Annual Report | Management’s Discussion and Analysis |
the Canadian group supervision and regulatory framework. Mutual recognition avoids redundant group oversight at the
John Hancock level by U.S. regulators, and Manulife and John Hancock have taken a leadership role to ensure the
NAIC developed a process that accommodates what OSFI would undertake. NAIC’s recognition of OSFI also eliminated
the need for John Hancock to file annual GCC filing waiver requests with the Michigan DIFS.
◦The use of asset-intensive reinsurance, where investment risk is transferred to the reinsurer along with insurance risk,
has been the subject of increased focus by insurance authorities in several jurisdictions. NAIC has adopted additional
guidelines regarding the use of asset-intensive reinsurance, however, we do not expect these changes will impact our
existing treaties; NAIC or other insurance regulatory authorities, may in the future impose additional rules or standards.
New guidelines or regulatory requirements may impact the reinsurance market and limit the availability of asset-
intensive reinsurance, increase its cost, or reduce the capital or risk management benefits of such reinsurance in a
manner that could have a material impact on Manulife.
◦Regulators in various jurisdictions in which we operate continue to reform their respective capital regulations. We
continue to closely monitor developments.
•Increasingly, global financial regulators are promulgating guidance and rules related to climate change and its potential
impacts on financial services firms. OSFI and several regulators across Asia have been engaging with industry to assess the
impacts of climate change and to set expectations on establishing climate transition plans, including ensuring effective risk
management and governance structures to manage climate change-related risks, and have begun releasing guidance and
disclosure requirements. There are also increasing expectations from investors, regulators, and other stakeholders to
provide comparable, decision-useful data and reporting on climate change-related risks and opportunities, including
performance metrics such as an organization’s Scope 1, 2 and 3 greenhouse gas emissions, alongside other indicators of
climate resilience and transition progress. Regulatory disclosure requirements are guided by private-sector bodies, where
there is a convergence in the industry around sustainability reporting frameworks. The IFRS Foundation’s ISSB is one such
body and has published standards for a comprehensive global baseline of sustainability disclosures for capital markets.
•In the United States, state insurance laws regulate most aspects of our business, and our U.S. insurance subsidiaries are
regulated by the insurance departments of the states in which they are domiciled and the states in which they are licensed.
State laws grant insurance regulatory authorities broad administrative powers with respect to, among other things: licensing
companies and agents to transact business; calculating the value of assets to determine compliance with statutory
requirements; mandating certain insurance benefits; regulating certain premium rates; reviewing and approving policy forms;
regulating unfair trade and claims practices, including through the imposition of restrictions on marketing and sales
practices, distribution arrangements, and payment of inducements; regulating advertising; protecting privacy; establishing
statutory capital and reserve requirements and solvency standards; fixing maximum interest rates on insurance policy loans
and minimum rates for guaranteed crediting rates on life insurance policies and annuity contracts; approving changes in
control of insurance companies; restricting the payment of dividends and other transactions between affiliates; and
regulating the types, amounts and valuation of investments. Changes in any such laws and regulations, or in the
interpretation or enforcement thereof by regulators, could significantly affect our business, results of operations and financial
condition.
•Currently, the U.S. federal government does not directly regulate the business of insurance. However, federal legislation and
administrative policies in several areas can significantly and adversely affect state-regulated insurance companies. These
areas include financial services regulation, securities regulation, pension regulation, privacy, tort reform legislation, and
taxation. In addition, under the Dodd-Frank Wall Street Reform and Consumer Protection Act (“Dodd-Frank”), the U.S. Board
of Governors of the Federal Reserve has supervisory powers over non-bank financial companies that are determined to be
systemically important.
•Insurance guaranty associations in Canada and the United States have the right to assess insurance companies doing
business in their jurisdiction for funds to help pay the obligations of insolvent insurance companies to policyholders and
claimants. Typically, an insurer is assessed an amount related to its proportionate share of the line of business written by all
insurers in the relevant jurisdiction. Because the amount and timing of an assessment is beyond our control, the liabilities
that we have currently established for these potential liabilities may not be adequate, particularly if there is an increase in the
number of insolvent insurers, or if the insolvent insurers operated in the same lines of business and in the same jurisdictions
in which we operate.
•Manulife operates in numerous jurisdictions in Asia. These operations are subject to the regulations and laws in each local
jurisdiction, with the structure or model for oversight of insurance differing by jurisdiction. We are encouraged to see further
regional economic and trade integration in Asia, with most jurisdictions supportive of foreign investment, and the increasing
willingness of many regulators to benchmark domestic law and regulation against international standards and best practices.
However, the increasing geopolitical complexity, rising political and regulatory uncertainty, and regulatory tightening in some
jurisdictions have created heightened complexity and risk for Manulife to mitigate and navigate, which may adversely impact
shareholder value.
•While many of the laws and regulations to which we are subject are intended to protect policyholders, beneficiaries,
depositors and investors in our products and services, others also set standards and requirements for the governance of our
operations. Failure to comply with applicable laws or regulations could result in financial penalties or sanctions, which could
damage our reputation.
•All aspects of Manulife’s Global WAM businesses are subject to various laws and regulations around the world. These laws
and regulations are primarily intended to protect investment advisory clients, investors in registered and unregistered funds,
1 See “Caution regarding forward-looking statements” above.
| 50 | |
and clients of Manulife’s global retirement businesses. Agencies that regulate investment advisors, investment funds, and
retirement plan products and services have broad administrative powers, including the power to limit, restrict, or prohibit the
regulated entity or person from carrying on business if it fails to comply with such laws and regulations. Possible sanctions
for significant compliance failures include the suspension of individual employees, limitations on engaging in certain lines of
business for specified periods of time, revocation of investment advisor, and other registrations and censures and fines both
for individuals and Manulife, along with the resulting damage to our reputation.
•From time to time, regulators raise issues during examinations or audits of Manulife that could have a material adverse
impact on us. We cannot predict whether or when regulatory actions may be taken that could adversely affect our
operations. Our failure to comply with existing and evolving regulatory requirements could also result in regulatory sanctions
and could affect our relationships with regulatory authorities and our ability to execute our business strategies and plans. For
further discussion of government regulation and legal proceedings, refer to “Government Regulation” in MFC’s Annual
Information Form dated February 11, 2026, and note 18 of the 2025 Annual Consolidated Financial Statements. See also
“Operational Risk Factors – Our operations face political, legal, operational and other risks that could negatively affect those
operations or our results of operations and financial condition” for further discussion on the impact to our operations.
Changes in tax laws, tax regulations, or interpretations of such laws or regulations could make some of our products
less attractive to consumers, could increase our corporate taxes or cause us to change the value of our deferred tax
assets and liabilities as well as our tax assumptions included in the valuation of our insurance and investment contract
liabilities. This could have a material adverse effect on our business, results of operations and financial condition1.
•Many of the products that the Company sells benefit from one or more forms of preferred tax treatment under current
income tax regimes. For example, the Company sells life insurance policies that benefit from the deferral or elimination of
taxation on earnings accrued under the policy, as well as permanent exclusion of certain death benefits that may be paid to
policyholders’ beneficiaries. We also sell annuity contracts that allow the policyholders to defer the recognition of taxable
income earned within the contract. Other products that the Company sells, such as certain employer-paid health and dental
plans, also enjoy similar, as well as other, types of tax advantages. The Company also benefits from certain tax benefits,
including tax-exempt interest, dividends-received deductions, tax credits (such as foreign tax credits), and favourable tax
rates and/or income measurement rules for tax purposes.
•There is risk that tax legislation could be enacted that would lessen or eliminate some or all of the tax advantages currently
benefiting the Company, its policyholders, or its other clients. This could occur in the context of deficit reduction or other tax
reforms. The effects of any such changes could result in materially lower product sales, lapses of policies currently held,
and/or our incurrence of materially higher corporate taxes, any of which could have a material adverse effect on our
business, results of operations and financial condition.
•Additionally, the Company may be required to change its provision for income taxes or carrying amount of deferred tax
assets or liabilities if the characterization of certain items is successfully challenged by taxing authorities or if future
transactions or events, which could include changes in tax laws, tax regulations or interpretations of such laws or
regulations, occur. Any such changes could significantly affect the amounts reported in the consolidated financial statements
in the year these changes occur.
•In July 2025, the United States enacted significant tax legislation commonly referred to as the One Big Beautiful Bill Act
("OBBBA"). The OBBBA makes permanent many provisions of the Tax Cuts and Jobs Act of 2017 and introduces additional
changes affecting individuals and businesses. The key business related provisions include the permanent restoration of
100% bonus depreciation, full deductibility of domestic research & development expenses, modification of the deduction for
interest expense, restructuring the tax on global intangible low-taxed income (GILTI) and the deduction for foreign-derived
intangible income (FDII). The federal income tax rate of 21% was left unchanged. We have reviewed the OBBBA and
continue to monitor and model its potential impact on our operations and effective tax rate. Most provisions that represent
substantive changes to existing law took effect in 2025 or are scheduled to take effect in 2026. Based on our current
analysis of the provisions applicable to the Company, we do not expect any material impact.
•In November 2025, Canada introduced a federal budget that included several income tax items, including proposed
amendments to the foreign affiliate rules that are intended to specifically target certain foreign investments of Canadian
insurance companies, starting in 2026. Based on the stated scope of these proposed amendments, they are not expected to
have a material impact. We will continue to monitor the progress of these proposals for any further refinements before
enactment or additional interpretive guidance from the Department of Finance that may affect our analysis.
Access to capital may be negatively impacted by market conditions.
•Disruptions, uncertainty, or volatility in the financial markets may limit or delay our access to the capital markets to raise
capital required to operate our business, satisfy regulatory capital requirements, or meet our refinancing needs. Under
extreme conditions, we may be forced, among other things, to delay raising capital, issue different types of capital than we
would otherwise under normal conditions, issue shorter-term securities than we prefer, or issue securities that bear an
unattractive cost of capital which could decrease our financial flexibility, profitability, and/or dilute our existing shareholders.
51 | 2025 Annual Report | Management’s Discussion and Analysis |
As a holding company, MFC depends on the ability of its subsidiaries to transfer funds to MFC to meet its obligations
and pay dividends. Subsidiaries’ remittance of capital depends on subsidiaries’ earnings, regulatory requirements and
restrictions, and macroeconomic and market conditions.
•MFC is a holding company and relies on dividends and interest payments from our insurance and other subsidiaries as the
principal source of cash flow to meet MFC’s obligations and pay dividends. As a result, MFC’s cash flows and ability to
service its obligations are dependent upon the earnings of its subsidiaries and the distribution of those earnings and other
funds by its subsidiaries to MFC. Substantially all of MFC’s business is currently conducted through its subsidiaries.
•The ability of MFC’s insurance subsidiaries to pay dividends to MFC in the future will depend on their earnings,
macroeconomic and market conditions, and their respective local regulatory requirements and restrictions, including capital
adequacy and requirements, exchange controls and economic or trade sanctions.
•MFC’s insurance subsidiaries are subject to a variety of insurance and other laws and regulations that vary by jurisdiction
and are intended to protect policyholders and beneficiaries in that jurisdiction first and foremost, rather than investors. These
subsidiaries are generally required to maintain solvency and capital standards as set by their local regulators and may also
be subject to other regulatory restrictions, all of which may limit the ability of subsidiary companies to pay dividends or make
distributions to MFC.
•Potential changes to regulatory capital and actuarial and accounting standards could also limit the ability of the insurance
subsidiaries to pay dividends or make distributions and could have a material adverse effect on internal capital mobility. We
may be required to raise additional capital, which could be dilutive to existing shareholders, or to limit the new business we
write, or to pursue actions that would support capital needs but adversely impact our subsequent earnings potential. In
addition, the timing and outcome of these initiatives could have a significantly adverse impact on our competitive position
relative to that of other Canadian and international financial institutions with which we compete for business and capital.
•The Company seeks to maintain capital in its regulated subsidiaries in excess of the minimum required in all jurisdictions in
which the Company does business. The minimum requirements in each jurisdiction may increase due to regulatory changes
and we may decide to maintain additional capital in our operating subsidiaries for competitive reasons, to fund expected
growth of the business or to deal with changes in the risk profile of such subsidiaries. Any such increases in the level of
capital may reduce the ability of the operating companies to pay dividends.
•The payment of dividends to MFC by MLI is subject to restrictions set out in the ICA. The ICA prohibits the declaration or
payment of any dividend on shares of an insurance company if there are reasonable grounds for believing: (i) the company
does not have adequate capital and adequate and appropriate forms of liquidity; or (ii) the declaration or the payment of the
dividend would cause the company to be in contravention of any regulation made under the ICA respecting the maintenance
of adequate capital and adequate and appropriate forms of liquidity, or of any order made to the company by the
Superintendent. All of our U.S. and Asian operating life insurance companies are subsidiaries of MLI. Accordingly, a
restriction on dividends from MLI would restrict MFC’s ability to obtain dividends from its U.S. and Asian businesses.
•Certain of MFC’s U.S. insurance subsidiaries also are subject to insurance laws in Michigan, New York and Massachusetts,
the jurisdictions in which these subsidiaries are domiciled, which impose general limitations on the payment of dividends and
other upstream distributions by these subsidiaries to MLI.
•Our Asian insurance subsidiaries are also subject to restrictions in the jurisdictions in which these subsidiaries are domiciled
which could affect their ability to pay dividends to MLI in certain circumstances.
The declaration and payment of dividends and the amount thereof is subject to change.
•The holders of common shares are entitled to receive dividends as and when declared by the Board, subject to the
preference of the holders of Class A Shares, Class B Shares, Class 1 Shares (collectively, the “Preferred Shares”) and any
other shares ranking senior to the common shares with respect to priority in payment of dividends. The declaration and
payment of dividends and the amount thereof is subject to the discretion of the Board of MFC and is dependent upon the
results of operations, financial condition, cash requirements and future prospects of, and regulatory and contractual
restrictions on the payment of dividends by MFC and other factors deemed relevant by the Board of MFC. Although MFC has
historically declared quarterly cash dividends on the common shares, MFC is not required to do so and the Board of MFC
may reduce, defer, or eliminate MFC’s common share dividend in the future.
•The foregoing risk disclosure in respect of the declaration and payment of dividends on the common shares applies equally in
respect of the declaration and payment of dividends on the Preferred Shares.
•See “Government Regulation” and “Dividends” in MFC’s Annual Information Form dated February 11, 2026 for a summary of
additional statutory and contractual restrictions concerning the declaration of dividends by MFC.
We may experience downgrades in our financial strength or credit ratings, which may materially adversely impact our
financial condition and results of operations.
•Credit rating agencies publish financial strength ratings on life insurance companies that are indicators of an insurance
company’s ability to meet contract holder and policyholder obligations. Credit rating agencies also assign credit ratings,
which are indicators of an issuer’s ability to meet the terms of its obligations in a timely manner and are important factors in
a company’s overall funding profile and ability to access external capital. Ratings reflect the views held by each credit
agency, which are subject to change based on various factors that may be within or beyond a company’s control.
•Ratings are important factors in establishing the competitive position of insurance companies, maintaining public confidence
in products being offered, and determining the cost of capital. A ratings downgrade, or the potential for such a downgrade,
| 52 | |
could adversely affect our operations and financial condition. A downgrade could, among other things, increase our cost of
capital and limit our access to the capital and loan markets; cause some of our existing liabilities to be subject to
acceleration, additional collateral support, changes in terms, or additional financial obligations; result in the termination of
our relationships with broker-dealers, banks, agents, wholesalers and other distributors of our products and services;
increase our cost of hedging; unfavourably impact our ability to execute on our hedging strategies; materially increase the
number of surrenders, for all or a portion of the net cash values, by the owners of policies and contracts we have issued;
impact our ability to obtain reinsurance at reasonable prices or at all; and materially increase the number of withdrawals by
policyholders of cash values from their policies and reduce new sales.
Competitive factors may adversely affect our market share and profitability.
•The insurance, wealth and asset management, and banking industries are highly competitive. Our competitors include other
insurers, securities firms, investment advisors, asset managers, banks and other financial institutions. The rapid
advancement of new technologies, such as blockchain, AI (e.g., generative AI) and advanced analytics, may enable other
non-traditional firms (e.g., big technology competitors providing financial products and services) to compete directly in the
industry space, or offer services to our traditional competitors to enhance their value propositions. The rapid growth and
availability of AI and generative AI technologies presents significant opportunities to enhance customer experience, improve
business decisions, manage risk and drive operational efficiencies, however, there can be no assurances that the use of AI
and generative AI technologies will have their intended effects, appropriately or sufficiently replicate certain outcomes, or
accurately predict future events or exposures. The use of AI and generative AI technologies presents complex challenges,
including balancing and mitigating potential risks posed by the development or deployment of AI technologies, such as the
risk of biased results or unreliable outputs from AI resulting from incomplete or biased data sets. Additionally, future legislation
may restrict certain usage of AI models or technologies or data that feed into AI models or technologies, which could impact
our ability to effectively use such models or technology.
•The impact from technological disruption may result in our competitors improving their customer experience, product offerings
and business costs. Our competitors compete with us for customers, access to distribution channels such as brokers and
independent agents, and for employees. In some cases, competitors may be subject to less onerous regulatory requirements,
have lower operating costs or have the ability to absorb greater risk while maintaining their financial strength ratings, thereby
allowing them to price their products more competitively or offer features that make their products more attractive. These
competitive pressures could result in lower new business volumes and increased pricing pressures on a number of our
products and services that may harm our ability to maintain or increase our profitability. Due to the highly competitive nature
of the financial services industry, there can be no assurance that we will continue to effectively compete with our traditional
and non-traditional industry rivals, and competitive pressure may have a material adverse effect on our business, results of
operations and financial condition.
We are exposed to investors trying to profit from short positions in our stock.
•Short sellers may seek to profit from a decline in the price of our common shares. Their actions and public statements,
including encouraging others to take short positions in our shares, could contribute to downward pressure on our share price
from which they seek to profit. The existence of such short positions and the related publicity could lead to increased
volatility in our common share price.
Industry trends could adversely affect the profitability of our businesses.
•Our business segments continue to be influenced by a variety of trends that affect our business and the financial services
industry in general. The impact of the volatility and instability of the financial markets on our business is difficult to predict and
the results of operations and our financial condition may be significantly impacted by general business and economic trends
in the geographies in which we operate. These conditions include, but are not limited to, market factors, such as public equity,
foreign currency, interest rate and other market risks, demographic shifts, consumer behaviours, and governmental policies
(e.g., fiscal, monetary, and global trade). In addition, the future of global trade remains uncertain, as companies and countries
look to decrease reliance on global supply chains, and countries implement increased protectionist measures, including
through protectionist trade policies and tariffs. Such policies and measures, and increasing economic nationalism could
reshape global alliances and impact the economies in which we operate. The Company’s business plans, results of
operations, and financial condition have been negatively impacted in the past and may be negatively affected in the future.
We may face unforeseen liabilities or asset impairments arising from possible mergers with, or acquisitions and
dispositions of, or strategic investments in, businesses or difficulties integrating acquired businesses.
•We have engaged in mergers with, acquisitions and dispositions of, or strategic investments in, businesses in the past and
expect to continue to do so in the future as we may deem appropriate. There could be unforeseen liabilities or asset
impairments, including goodwill impairments that arise in connection with the businesses that we may sell, have acquired, or
may acquire in the future. In addition, there may be liabilities or asset impairments that we fail, or are unable, to discover in
the course of performing due diligence investigations on acquisition targets. Furthermore, the use of our own funds as
consideration in any acquisition would consume capital resources that would no longer be available for other corporate
purposes.
•Our ability to achieve some or all of the benefits we anticipate from any mergers with, acquisitions and dispositions of, or
strategic investments in, businesses will depend in large part upon our ability to successfully integrate the businesses in an
53 | 2025 Annual Report | Management’s Discussion and Analysis |
efficient and effective manner. We may not be able to integrate the businesses smoothly or successfully, and the process
may take longer than expected. The integration of operations may require the dedication of significant management
resources, which may distract management’s attention from our day-to-day business. Mergers with, acquisitions and
dispositions of, or strategic investments in, operations outside of North America, especially any acquisition in a jurisdiction in
which we do not currently operate, may be particularly challenging or costly to integrate. If we are unable to successfully
integrate the operations of any acquired businesses, we may be unable to realize the benefits we expect to achieve as a
result of the acquisitions, and the results of operations may be less than expected.
If our businesses do not perform well, or if the outlook for our businesses is significantly lower than historical trends,
we may be required to recognize an impairment of goodwill or intangible assets or to establish a valuation allowance
against our deferred tax assets, which could have a material adverse effect on our results of operations and financial
condition.
•Goodwill represents the excess of the amounts we paid to acquire subsidiaries and other businesses over the fair value of
their net identifiable assets at the date of acquisition. Intangible assets represent assets that are separately identifiable at
the time of an acquisition and provide future benefits such as the John Hancock brand.
•As outlined below under “Critical Actuarial and Accounting Policies – Goodwill and Intangible Assets”, goodwill and intangible
assets with indefinite lives are tested at least annually for impairment at the cash generating unit (“CGU”) or group of CGUs
level, representing the smallest group of assets that is capable of generating largely independent cash flows. As a result of
the impact of economic conditions and changes in product mix and the granular level of goodwill testing under IFRS,
additional impairment charges could occur in the future. Any impairment in goodwill would not affect LICAT capital.
•If market conditions deteriorate in the future and, in particular, if MFC’s common share price is low relative to book value per
share, if the Company’s actions to limit risk associated with its products or investments cause a significant change in any
one CGU’s recoverable amount, or if the outlook for a CGU’s results deteriorate, the Company may need to reassess the
value of goodwill and/or intangible assets which could have a material adverse effect on our results of operations and
financial condition.
•Deferred income tax balances represent the expected future tax effects of the differences between the book and tax basis of
assets and liabilities, loss carry forwards and tax credits. Deferred tax assets are recorded when the Company expects to
claim deductions on tax returns in the future for expenses that have already been recorded in the financial statements.
•The availability of those deductions is dependent on future taxable income against which the deductions can be made.
Deferred tax assets are assessed periodically by management to determine if they are realizable.
•Factors in management’s determination include the performance of the business including the ability to generate gains from
a variety of sources and tax planning strategies. If, based on information available at the time of the assessment, it is
determined that the deferred tax asset will not be realized, then the deferred tax asset is reduced to the extent that it is no
longer probable that the tax benefit will be realized.
We may not be able to protect our intellectual property and may be subject to infringement claims.
•We rely on a combination of registrations, contractual rights and copyright, trademark, patent, and trade secret laws to
establish and protect our intellectual property. In particular, we have invested considerable resources in promoting and
protecting the brand names “Manulife” and “John Hancock” and expect to continue to do so. Although we use a broad range
of measures to protect our intellectual property rights, third parties may infringe or misappropriate our intellectual property.
As the occurrence of potential infringements or misappropriations against our intellectual property increases, we may have
to litigate more often to enforce and protect our copyrights, trademarks, patents, trade secrets and know-how or to
determine their scope, validity, or enforceability, which represents a diversion of resources that may be significant in amount
and may not prove successful. The loss of intellectual property protection or the inability to secure or enforce the protection
of our intellectual property assets could have a material adverse effect on our business and our ability to compete.
•We also may be subject to costly litigation in the event that another party alleges our operations or activities infringe upon its
intellectual property rights. Third parties may have, or may eventually be issued, patents that could be infringed by our
products, methods, processes, or services. Any party that holds such a patent could make a claim of infringement against
us. We may also be subject to claims by third parties for breach of copyright, trademark, trade secret or license usage rights.
Any such claims and any resulting litigation could result in significant liability for damages. If we were found to have infringed
a third-party patent or other intellectual property rights, we could incur substantial liability, and in some circumstances could
be enjoined from providing certain products or services to our customers, or utilizing and benefiting from certain methods,
processes, copyrights, trademarks, trade secrets, or licenses, or alternatively could be required to enter into costly licensing
arrangements with third parties, all of which could have a material adverse effect on our business, results of operations and
financial condition.
Applicable laws may discourage takeovers and business combinations that common shareholders of MFC might
consider in their best interests.
•The ICA contains restrictions on the purchase or other acquisition, issue, transfer and voting of the shares of an insurance
company. In addition, under applicable U.S. insurance laws and regulations in states where certain of our insurance
company subsidiaries are domiciled, no person may acquire control of MFC without obtaining prior approval of those states’
insurance regulatory authorities. These restrictions may delay, defer, prevent, or render more difficult a takeover attempt that
| 54 | |
common shareholders of MFC might consider in their best interests. For instance, they may prevent shareholders of MFC
from receiving the benefit from any premium to the market price of MFC’s common shares offered by a bidder in a takeover
context. Even in the absence of a takeover attempt, the existence of these provisions may adversely affect the prevailing
market price of MFC’s common shares if they are viewed as discouraging takeover attempts in the future.
Entities within the MFC group are interconnected which may make separation difficult.
•MFC operates in local markets through subsidiaries and branches of subsidiaries. These local operations are financially and
operationally interconnected to lessen expenses, share and reduce risk, and efficiently utilize financial resources. In general,
external capital required for companies in the Manulife group has been raised at the MFC level in recent years and then
transferred to other entities primarily as equity or debt capital as appropriate. Other linkages include policyholder and other
creditor guarantees and other forms of internal support between various entities, loans, capital maintenance agreements,
derivatives, shared services and affiliate reinsurance treaties. Accordingly, the risks undertaken by a subsidiary may be
transferred to or shared by affiliates through financial and operational linkages. Some of the consequences of this are:
◦Financial difficulties at a subsidiary may not be isolated and could cause material adverse effects on affiliates and the
group as a whole.
◦Linkages may make it difficult to dispose of or separate a subsidiary or business within the group by way of a spin-off or
similar transaction, and the disposition or separation of a subsidiary or business may not fully eliminate the liability of
the Company and its remaining subsidiaries for shared risks. Issues raised by such a transaction could include: (i) the
Company cannot terminate, without policyholder consent, and in certain jurisdictions regulator consent, parental
guarantees on in-force policies and therefore would continue to have residual risk under any such non-terminated
guarantees; (ii) internal capital mobility and efficiency could be limited; (iii) significant potential tax consequences; (iv)
uncertainty about the accounting and regulatory outcomes of such a transaction; (v) obtaining any other required
approvals; (vi) there may be a requirement for significant capital injections; and (vii) the transaction may result in
increased sensitivity of net income attributed to shareholders and capital of MFC and its remaining subsidiaries to
market declines.
We may not be able to meet the evolving expectations of clients, shareholders, or regulators as they pertain to our
sustainability commitments, and/or stewardship practices, and may not be able to achieve certain stated sustainability
commitments.
•Manulife continues to advance its sustainability commitments, including climate-related commitments, in alignment with our
business priorities, stakeholder expectations, and evolving regulatory requirements. These commitments are supported by
policies and processes designed to manage associated risks and opportunities across operations, investments, and
products. Failure to achieve stated commitments may result in reputational, operational, and/or legal consequences.
•Internal or external factors, including, but not limited to, aspects such as shifts to regulatory priorities, changes in market
conditions and conflicting stakeholder sentiment, may affect Manulife’s ability to meet some or all of its sustainability
commitments. In particular, assumptions underlying forward-looking sustainability commitments, including commitments in
line with net-zero scenarios, are subject to change and sensitive to market and regulatory conditions outside of Manulife’s
control and influence. Manulife monitors regulatory and market developments and engages stakeholders to seek to ensure
its sustainability strategy remains aligned with evolving expectations. However, different stakeholder groups may have
divergent views on sustainability matters. This divergence increases the risk that action, or inaction, on sustainability matters
will be perceived negatively by at least some stakeholders thereby potentially adversely impacting our business or
reputation. Additionally, because Manulife operates in multiple jurisdictions, it may be subject to differing or competing
regulatory requirements and expectations, which may create operational and compliance challenges.
•Manulife annually discloses its sustainability priorities and performance informed by widely accepted frameworks (e.g., the
IFRS Foundation’s ISSB standards). Stakeholders relying, in full or in part, on sustainability performance data in their
evaluation of Manulife for investment, employment and/or product selection purposes may rely on criteria that deviate from
Manulife’s understanding and prioritization of material sustainability issues.
•Manulife seeks to incorporate sustainability factors, where appropriate, into investment practices of its General Account, in
line with efforts to achieve positive risk-adjusted returns. We seek to address material financial risks and opportunities that
we believe may arise from systemic global challenges such as climate change and have therefore made commitments to
address transition risks associated with global efforts to limit greenhouse gas emissions. The integration of sustainability
risks, in appropriate balance with reasonable economic and market scenarios, can influence asset pricing, portfolio
alignment and performance, and erode our ability to achieve climate commitments, if transition risks fail to materialize in line
with expectations.
•In our third-party asset management business, success is judged by how well we meet clients’ needs and objectives. We
integrate sustainability factors into investment practices where appropriate and in alignment with our fiduciary
responsibilities. Active management and ongoing investment stewardship practices, such as direct company engagement,
do not guarantee specific outcomes with respect to environmental or social practices of investees. If stewardship efforts do
not evolve in line with client expectations or market developments, Manulife may be exposed to additional reputational,
operational, and/or legal risk and financial loss.
•As regulatory scrutiny increases globally, including around sustainability-related disclosures and investment practices, the
risk of enforcement actions or litigation is growing, particularly in relation to perceived misstatements and “greenwashing”.
55 | 2025 Annual Report | Management’s Discussion and Analysis |
The availability and reliability of third-party sustainability data, along with the ongoing evolution of commonly accepted
accounting standards (e.g., Corporate Greenhouse Gas Protocol, Partnership for Carbon Accounting in Finance), and
target-setting frameworks, may impact the consistency and reliability of Manulife’s performance against key sustainability
metrics and targets, which remain subject to change. Incomplete, inconsistent, or unavailable data may lead to restatements
or revisions in reported performance and could create the perception of misstatements and “greenwashing”, potentially
resulting in litigation. Manulife continues to monitor and adapt to these developments to mitigate potential compliance and
reputational risks and has established controls to strengthen the reliability and quality of statements related to environmental
and social outcomes.
Market & Liquidity Risk
Market risk is the risk of loss resulting from market price volatility, interest rate change, credit and swap spread changes, and
adverse foreign currency exchange rate movements. Market price volatility primarily relates to changes in prices of publicly
traded equities and alternative long-duration assets. The profitability of our insurance and annuity products, as well as the fees
we earn in our investment management business, are subject to market risk.
Liquidity risk is the risk of loss resulting from the inability to access sufficient funds or liquid assets to meet expected and
unexpected cash and collateral demands.
IFRS 7 Disclosures
Text and tables in this and the following section (“Market Risk Sensitivities and Market Risk Exposure Measures”) include
disclosures on market and liquidity risk in accordance with IFRS 7 “Financial Instruments – Disclosures”, and discussions on how
we measure risk and our objectives, policies and methodologies for managing them. Disclosures in accordance with IFRS 7 are
identified by a vertical line in the left margin of each page. The identified text and tables represent an integral part of our audited
2025 Annual Consolidated Financial Statements. The fact that certain text and tables are considered an integral part of the 2025
Annual Consolidated Financial Statements does not imply that the disclosures are of any greater importance than the sections
not part of the disclosures. Accordingly, the “Risk Management and Risk Factors” should be read in its entirety.
Market & Liquidity Risk Management Strategy
Market & liquidity risk management strategy is governed by the Global Asset Liability Committee which oversees the market and
liquidity risk program. Our overall strategy to manage our market & liquidity risks incorporates several component strategies,
each targeted to manage one or more of the market & liquidity risks arising from our businesses. At an enterprise level, these
strategies are designed to manage our aggregate exposures to market & liquidity risks against limits associated with earnings
and capital volatility.
The following table outlines our key market & liquidity risks and identifies the risk management strategies which contribute to
managing these risks.
Risk Management Strategy | Key Market & Liquidity Risk | ||||
Public Equity Risk | Interest Rate and Spread Risk | ALDA Risk | Foreign Currency Exchange Risk | Liquidity Risk | |
Product design and pricing | ü | ü | ü | ü | ü |
Dynamic hedging | ü | ü | ü | ü | |
Macro equity risk hedging | ü | ü | ü | ||
Asset liability management | ü | ü | ü | ü | ü |
Foreign currency exchange management | ü | ü | |||
Liquidity risk management | ü | ||||
Public Equity Risk – To manage public equity risk from our insurance and annuity businesses, we primarily use a dynamic
hedging strategy which is complemented by a general macro equity risk hedging strategy, in addition to asset liability
management strategies. Our strategies employed for dynamic hedging and macro equity risk hedging expose the Company to
additional risks. See “Market & Liquidity Risk Factors” below for more information.
Interest Rate and Spread Risk – To manage interest rate and spread risk, we primarily employ asset liability management
strategies to manage the duration of our fixed income investments and execute interest rate hedges.
ALDA Risk – We seek to limit concentration risk associated with ALDA performance by investing in a diversified basket of assets
including commercial real estate, timber, farmland, private equities, infrastructure, and energy assets. We further diversify risk by
managing investments against established investment and risk limits.
Foreign Currency Exchange Risk – Our policy is to generally match the currency of our assets with the currency of the
liabilities they support. Where assets and liabilities are not currency matched, we seek to hedge this exposure where appropriate
to stabilize our consolidated capital positions and remain within our enterprise foreign exchange risk limits.
| 56 | |
Liquidity Risk – In the operating companies, cash and collateral demands arise day-to-day to fund policyholder benefits,
customer withdrawals, reinsurance settlements, derivative instrument settlements/collateral pledging, expenses, and investment
activities. Under stressed conditions, additional cash and collateral demands could arise from changes to policyholder
termination or policy renewal rates, withdrawals of customer deposit balances, loan extensions, derivative settlements or
collateral demands, and reinsurance settlements.
Our liquidity risk management framework is designed to provide adequate liquidity to cover cash and collateral obligations as
they come due, and to sustain and grow operations in both normal and stressed conditions. See “Liquidity Risk Management
Strategy” below for more information.
Product Design and Pricing Strategy
Our policies, standards, and guidelines, with respect to product design and pricing, are designed with the objective of aligning
our product offerings with our risk taking philosophy and risk appetite, and in particular, ensuring that incremental risk generated
from new sales aligns with our strategic risk objectives and risk limits. The specific design features of our product offerings,
including level of benefit guarantees, policyholder options, fund offerings and availability restrictions as well as our associated
investment strategies, help to mitigate the level of underlying risk. We regularly review and modify key features within our product
offerings, including premiums and fee charges with a goal of meeting profit targets and staying within risk limits. Certain of our
general fund adjustable benefit products have minimum rate guarantees. The rate guarantees for any particular policy are set at
the time the policy is issued and governed by insurance regulation in each jurisdiction where the products are sold. The
contractual provisions allow crediting rates to be reset at pre-established intervals subject to the established minimum crediting
rate guarantees. The Company may partially mitigate the interest rate exposure by setting new rates on new business and by
adjusting rates on in-force business where permitted. In addition, the Company partially mitigates this interest rate risk through its
asset liability management process, product design elements, and crediting rate strategies.
Hedging Strategies for Public Equity Risks
The Company’s exposure to movement in public equity market values primarily arises from insurance contract liabilities related to
variable annuity guarantees and general fund public equity investments.
We seek to manage public equity risk arising from exposures in our insurance contract liabilities through our dynamic and macro
equity risk hedging strategy.
Variable Annuity Dynamic Hedging Strategy
The variable annuity dynamic hedging strategy is designed to hedge the sensitivity of variable annuity guarantee insurance
contract liabilities to fund performance (both public equity and bond funds) and interest rate movements. The objective of the
variable annuity dynamic hedging strategy is to offset, as closely as possible, the change in the economic value of guarantees
with the profit and loss from our hedge asset portfolio.
Our variable annuity dynamic hedging program uses a variety of exchange-traded and over-the-counter (“OTC”) derivative
contracts to offset the change in value of variable annuity guarantees. The main derivative instruments used are equity index
futures, government bond futures, currency futures, interest rate swaps, total return swaps, equity options, and interest rate
swaptions. The hedge instruments’ positions against insurance contract liabilities are continuously monitored as market
conditions change. As necessary, the hedge asset positions will be dynamically rebalanced to stay within established limits. We
may also utilize other derivatives with the objective to improve hedge effectiveness opportunistically.
Our variable annuity guarantee dynamic hedging strategy is not designed to completely offset the sensitivity of insurance
contract liabilities to all risks associated with the guarantees embedded in these products. The profit (loss) on the hedge
instruments will not completely offset the underlying losses (gains) related to the guarantee liabilities hedged because:
•Policyholder behaviour and mortality experience are not hedged;
•Risk adjustment related to cost of guarantees in the insurance contract liabilities is largely hedged;
•A portion of interest rate risk is not hedged;
•Credit spreads may widen and actions might not be taken to adjust accordingly;
•Fund performance on a small portion of the underlying funds is not hedged due to lack of availability of effective exchange-
traded hedge instruments;
•Performance of the underlying funds hedged may differ from the performance of the corresponding hedge instruments;
•Correlations between interest rates and equity markets could lead to unfavourable material impacts;
•Unfavourable hedge rebalancing costs can be incurred during periods of high volatility from equity markets, bond markets,
and / or interest rates, which is magnified when these impacts occur concurrently; and
•Not all other risks are hedged.
Differences in the profit (loss) on the hedge instruments versus the underlying losses (gains) related to the guarantee liabilities
hedged are reported in CSM.
We seek to manage interest rate risk arising from our variable annuity business that is not dynamically hedged through our asset
liability management strategy.
57 | 2025 Annual Report | Management’s Discussion and Analysis |
Macro Equity Risk Hedging Strategy
The objective of the macro equity risk hedging program is to maintain our overall earnings sensitivity to public equity market
movements within our Board approved risk appetite limits. The macro equity risk hedging program is designed to hedge earnings
sensitivity due to movements in public equity markets arising from all sources (outside of dynamically hedged exposures).
Sources of equity market sensitivity addressed by the macro equity risk hedging program include general fund equity holdings
backing guaranteed, and adjustable liabilities.
Asset Liability Management Strategy
Our asset liability management strategy is designed to help ensure that the market risks embedded in our assets and liabilities
held in the Company’s general fund are effectively managed and that risk exposures arising from these assets and liabilities are
maintained within risk limits. The embedded market risks include risks related to the level and movement of interest rates and
credit and swap spreads, public equity market performance, ALDA performance, and foreign currency exchange rate
movements.
General fund product liabilities are categorized into groups with similar characteristics in order to support them with a specific
asset strategy. We seek to align the asset strategy for each group to the premium and benefit patterns, policyholder options and
guarantees, and crediting rate strategies of the products they support. The strategies are set using portfolio analysis techniques
intended to optimize returns, subject to considerations related to regulatory and economic capital requirements, and risk
tolerances. They are designed to achieve broad diversification across asset classes and individual investment risks while being
suitably aligned with the liabilities they support. The strategies encompass asset mix, quality rating, term profile, liquidity,
currency, and industry concentration targets.
Products which feature guaranteed liability cash flows (i.e., where the projected net flows remain largely unaffected by economic
scenarios) are managed according to a target return investment strategy. The products backed by this asset group include:
•Accumulation annuities (other than annuities with pass-through features), which are primarily short-to-medium-term
obligations and offer interest rate guarantees for specified terms on single premiums. Withdrawals may or may not have
market value adjustments;
•Payout annuities, which have no surrender options and include predictable and very long-dated obligations; and
•Insurance products, with recurring premiums extending many years in the future, and which also include a significant
component of very long-dated obligations.
We seek to manage the assets backing these long-dated benefits to achieve a target return sufficient to support the obligations
over their lifetime, subject to established risk tolerances and the impact of regulatory and economic capital requirements. Fixed
income assets are managed to a benchmark developed to minimize interest rate risk against the liability cash flows. Utilizing
ALDA and public equity investments provide a suitable match for long-duration liabilities that also enhances long-term investment
returns and reduces aggregate risk through diversification.
For insurance and annuity products where significant pass-through features exist, a total return strategy approach is used,
generally combining fixed income with ALDA and public equity investments. ALDA and public equity may be included to enhance
long-term investment returns and reduce aggregate risk through diversification. Target investment strategies are established
using portfolio analysis techniques that seek to optimize long-term investment returns while considering the risks related to
embedded product guarantees and policyholder withdrawal options, the impact of regulatory and economic capital requirements
and considering management tolerances with respect to short-term income volatility and long-term tail risk exposure. For these
pass-through products such as participating insurance and universal life insurance, the investment performance of assets
supporting the liabilities will be largely passed through to policyholders as changes in the amounts of dividends declared or rates
of interest credited, subject to embedded minimum guarantees. Shorter duration liabilities such as fixed deferred annuities do not
incorporate ALDA and public equity investments into their target asset mixes. Authority to manage our investment portfolios is
delegated to investment professionals who manage to benchmarks derived from the target investment strategies established for
each group, including interest rate risk tolerances.
Our asset liability management strategy incorporates a wide variety of risk measurement, risk mitigation and risk management,
and hedging processes. The liabilities and risks to which the Company is exposed, however, cannot be completely matched or
hedged due to both limitations on instruments available in investment markets and uncertainty of impact on liability cash flows
from policyholder experience/behaviour.
Foreign Currency Exchange Risk Management Strategy
Our policy is to generally match the currency of our assets with the currency of the liabilities they support. Where assets and
liabilities are not currency matched, we seek to hedge this exposure where appropriate to stabilize our earnings and consolidated
capital positions and remain within our enterprise foreign exchange risk limits.
Risk from small balance sheet mismatches is accepted if managed within set risk limits. Risk exposures are measured in terms
of potential changes in earnings and capital ratios, due to foreign currency exchange rate movements, determined to represent a
specified likelihood of occurrence based on internal models.
| 58 | |
Liquidity Risk Management Strategy
Global liquidity management policies and procedures are designed to provide adequate liquidity to cover cash and collateral
obligations as they come due, and to sustain and grow operations in both normal and stressed conditions. They consider legal,
regulatory, tax, operational or economic impediments to inter-entity funding. The asset mix of our balance sheet takes into
account the need to hold adequate unencumbered and appropriate liquid assets to satisfy the requirements arising under
stressed scenarios and to allow our liquidity ratios to remain strong. We manage liquidity centrally and closely monitor the
liquidity positions of our principal subsidiaries.
We seek to mitigate liquidity risk by diversifying our business across different products, markets, geographical regions, and
policyholders. We design insurance products to encourage policyholders to maintain their policies in-force, to help generate a
diversified and stable flow of recurring premiums. We design the policyholder termination features with the goal of mitigating the
financial exposure and liquidity risk related to unexpected policyholder terminations. We establish and implement investment
strategies intended to match the term profile of the assets to the liabilities they support, taking into account the potential for
unexpected policyholder terminations and resulting liquidity needs. Liquid assets represent a large portion of our total assets. We
aim to reduce liquidity risk in our businesses by diversifying our funding sources and appropriately managing the term structure
of our funding. We forecast and monitor daily operating liquidity and cash movements in various individual entities and
operations as well as centrally, aiming to ensure liquidity is available and cash is employed optimally.
We also maintain centralized cash pools and access to other sources of liquidity and contingent liquidity such as repurchase
funding agreements. Our centralized cash pools consist of cash or near-cash, high quality short-term investments that are
continually monitored for their credit quality and market liquidity.
As at December 31, 2025, the Company held $276.0 billion in cash and cash equivalents, comprised of cash on deposit,
Canadian and U.S. Treasury Bills and high quality short-term investments, and marketable securities comprised of investment
grade government and agency bonds, investment grade corporate bonds, investment grade securitized instruments, publicly
traded common stocks and preferred shares, compared with $263.3 billion as at December 31, 2024 as noted in the table below.
As at December 31, | 2025 | 2024 |
($ millions, unless otherwise stated) | ||
Cash and cash equivalents | $26,703 | $25,789 |
Marketable securities | ||
Government bonds (investment grade) | 80,736 | 80,891 |
Corporate bonds (investment grade) | 126,705 | 122,324 |
Securitized – ABS, CMBS, RMBS (investment grade) | 2,134 | 1,758 |
Public equities | 39,732 | 32,576 |
Total marketable assets | 249,307 | 237,549 |
Total cash and cash equivalents and marketable securities(1) | $276,010 | $263,338 |
(1)Including $17.3 billion encumbered cash and cash equivalents and marketable securities as at December 31, 2025 (2024 – $15.6 billion).
We have established a variety of contingent liquidity sources. These include, among others, a $500 million committed unsecured
revolving credit facility with certain Canadian chartered banks available for MFC, and a US$500 million committed unsecured
revolving credit facility with certain U.S. banks available for MFC and certain of its U.S. subsidiaries. There were no outstanding
borrowings under these facilities as at December 31, 2025 (2024 – $nil). In addition, John Hancock Life Insurance Company
(U.S.A.) (“JHUSA”) is a member of the Federal Home Loan Bank of Indianapolis (“FHLBI”), which enables the Company to
obtain loans from FHLBI as an alternative source of liquidity that is collateralizable by qualifying mortgage loans, mortgage-
backed securities, municipal bonds, and U.S. Treasury and Agency securities. As at December 31, 2025, JHUSA had an
estimated maximum borrowing capacity of US$3.8 billion (2024 – US$3.8 billion) based on regulatory limitations with an
outstanding balance of US$500 million (2024 – US$500 million) under the FHLBI facility.
The following table outlines the maturity of the Company’s significant financial liabilities.
Maturity of financial liabilities
As at December 31, 2025 | Less than 1 year | 1 to 3 years | 3 to 5 years | Over 5 years | Total |
($ millions) | |||||
Long-term debt(1) | $1,741 | $958 | $- | $4,986 | $7,685 |
Capital instruments(1) | - | - | - | 6,990 | 6,990 |
Derivatives | 2,270 | 1,746 | 875 | 9,456 | 14,347 |
Deposits from Bank clients(2) | 17,462 | 4,441 | 2,804 | - | 24,707 |
Lease liabilities | 101 | 138 | 49 | 46 | 334 |
(1)The amounts shown above are net of the related unamortized deferred issue costs.
(2)Carrying value and fair value of deposits from Bank clients as at December 31, 2025 were $24,707 million and $24,945 million, respectively (2024 – $22,063
million and $22,270 million, respectively). Fair value is determined by discounting contractual cash flows, using market interest rates currently offered for deposits
with similar terms and conditions. All deposits from Bank clients were categorized in Level 2 of the fair value hierarchy (2024 – Level 2).
59 | 2025 Annual Report | Management’s Discussion and Analysis |
Through the normal course of business, pledging of assets is required to comply with jurisdictional regulatory and other
requirements including collateral pledged to partially mitigate derivative counterparty credit risk, assets pledged to exchanges as
initial margin, and assets held as collateral for repurchase funding agreements. Total unencumbered assets were $537.4 billion
as at December 31, 2025 (2024 – $516.6 billion).
Market Risk Sensitivities and Market Risk Exposure Measures
Variable Annuity and Segregated Fund Guarantees Sensitivities and Risk Exposure Measures
Guarantees on variable annuity products and segregated funds may include one or more of death, maturity, income and
withdrawal guarantees. Variable annuity and segregated fund guarantees are contingent and only payable upon the occurrence
of the relevant event, if fund values at that time are below guarantee values. Depending on future equity market levels, liabilities
on current in-force business are to expected to be recognized primarily within the next 20 years.
We seek to mitigate a portion of the risks embedded in our retained (i.e., net of reinsurance) variable annuity and segregated
fund guarantee business through the combination of our dynamic and macro hedging strategies (see “Publicly Traded Equity
Performance Risk” below).
The table below shows selected information regarding the Company’s variable annuity and segregated fund investment-related
guarantees, gross and net of reinsurance.
Variable annuity and segregated fund guarantees, net of reinsurance
2025 | 2024 | ||||||
As at December 31, ($ millions) | Guarantee value(1) | Fund value | Net amount at risk(1),(2),(3) | Guarantee value(1) | Fund value | Net amount at risk(1),(2),(3) | |
Guaranteed minimum income benefit | $3,142 | $2,534 | $708 | $3,628 | $2,780 | $918 | |
Guaranteed minimum withdrawal benefit | 29,664 | 31,071 | 2,643 | 33,473 | 33,539 | 3,339 | |
Guaranteed minimum accumulation benefit | 18,908 | 19,208 | 55 | 18,987 | 19,097 | 70 | |
Gross living benefits(4) | 51,714 | 52,813 | 3,406 | 56,088 | 55,416 | 4,327 | |
Gross death benefits(5) | 7,892 | 19,924 | 486 | 8,612 | 19,851 | 644 | |
Total gross of reinsurance | 59,606 | 72,737 | 3,892 | 64,700 | 75,267 | 4,971 | |
Living benefits reinsured | 20,518 | 21,932 | 2,351 | 23,768 | 23,965 | 3,016 | |
Death benefits reinsured | 3,058 | 2,620 | 195 | 3,430 | 2,776 | 289 | |
Total reinsured | 23,576 | 24,552 | 2,546 | 27,198 | 26,741 | 3,305 | |
Total, net of reinsurance | $36,030 | $48,185 | $1,346 | $37,502 | $48,526 | $1,666 | |
(1)Guarantee Value and Net Amount at Risk in respect of guaranteed minimum withdrawal business in Canada and the U.S. reflect the time value of money of these
claims.
(2)Amount at risk (in-the-money amount) is the excess of guarantee values over fund values on all policies where the guarantee value exceeds the fund value. For
guaranteed minimum death benefit, the amount at risk is defined as the current guaranteed minimum death benefit in excess of the current account balance and
assumes that all claims are immediately payable. In practice, guaranteed death benefits are contingent and only payable upon the eventual death of policyholders
if fund values remain below guarantee values. For guaranteed minimum withdrawal benefit, the amount at risk assumes that the benefit is paid as a lifetime
annuity commencing at the earliest contractual income start age. These benefits are also contingent and only payable at scheduled maturity/income start dates in
the future, if the policyholders are still living and have not terminated their policies and fund values remain below guarantee values. For all guarantees, the amount
at risk is floored at zero at the single contract level.
(3)The amount at risk net of reinsurance at December 31, 2025 was $1,346 million (December 31, 2024 – $1,666 million) of which: US$244 million (December 31,
2024 – US$293 million) was on our U.S. business, $835 million (December 31, 2024 – $1,021 million) was on our Canadian business, US$80 million (December
31, 2024 – US$100 million) was on our Japan business, and US$49 million (December 31, 2024 – US$56 million) was related to Asia (other than Japan) and our
run-off reinsurance business.
(4)Where a policy includes both living and death benefits, the guarantee in excess of the living benefit is included in the death benefit category as outlined in footnote
5.
(5)Death benefits include stand-alone guarantees and guarantees in excess of living benefit guarantees where both death and living benefits are provided on a
policy.
Investment categories for variable contracts with guarantees
Variable contracts with guarantees, including variable annuities and variable life, are invested at the policyholder’s discretion
subject to contract limitations, in various fund types within the segregated fund accounts and other investments. The account
balances by investment category are set out below.
| 60 | |
As at December 31, | ||
($ millions) | 2025 | 2024 |
Investment category | ||
Equity funds | $51,919 | $51,457 |
Balanced funds | 36,889 | 37,381 |
Bond funds | 8,528 | 9,017 |
Money market funds | 1,794 | 1,712 |
Other debt investments | 2,074 | 2,082 |
Total | $101,204 | $101,649 |
Caution Related to Sensitivities
In the sections that follow, we provide sensitivities and risk exposure measures for certain risks. These include sensitivities due
to specific changes in market prices and interest rate levels projected using internal models as at a specific date, and are
measured relative to a starting level reflecting the Company’s assets and liabilities at that date. The risk exposures measure the
impact of changing one factor at a time and assume that all other factors remain unchanged. Actual results can differ materially
from these estimates for a variety of reasons including the interaction among these factors when more than one changes;
changes in liabilities from updates to non-economic assumptions, changes in business mix, effective tax rates and other market
factors; and the general limitations of our internal models. For these reasons, the sensitivities should only be viewed as
directional estimates of the underlying sensitivities for the respective factors based on the assumptions outlined below. Given the
nature of these calculations, we cannot provide assurance that the actual impact on contractual service margin, net income
attributed to shareholders, other comprehensive income attributed to shareholders, and total comprehensive income attributed to
shareholders or on MLI’s LICAT ratio will be as indicated.
Market movements affect LICAT capital sensitivities through the available capital, surplus allowance and required capital
components of the regulatory capital framework. The LICAT available capital component is primarily affected by total
comprehensive income and the CSM.
Publicly Traded Equity Performance Risk Sensitivities and Exposure Measures
As outlined above, we have net exposure to equity risk through asset and liability mismatches; our guarantee dynamic hedging
strategy is not designed to completely offset the sensitivity of insurance contract liabilities to all risks associated with the
guarantees embedded in these products. The macro hedging strategy is designed to mitigate public equity risk arising from
guarantees not dynamically hedged, and from other unhedged exposures in our insurance contracts.
Changes in public equity prices may impact other items including, but not limited to, asset-based fees earned on assets under
management and administration or policyholder account value, and estimated profits and amortization of deferred policy
acquisition and other costs. These items are not hedged.
The tables below include the potential impacts from an immediate 10%, 20% and 30% change in market values of publicly traded
equities on net income attributed to shareholders, CSM, other comprehensive income attributed to shareholders, and total
comprehensive income attributed to shareholders. The potential impact is shown after taking into account the impact of the
change in markets on the hedge assets. While we cannot reliably estimate the amount of the change in dynamically hedged
guarantee liabilities that will not be offset by the change in the dynamic hedge assets, we make certain assumptions for the
purposes of estimating the impact on net income attributed to shareholders.
This estimate assumes that the performance of the dynamic hedging program would not completely offset the gain/loss from the
dynamically hedged variable annuity and segregated fund guarantee liabilities. It assumes that the hedge assets are based on
the actual position at the period end, and that equity hedges in the dynamic program offset 95% of the hedged variable annuity
liability movement that occurs as a result of market changes.
It is also important to note that these estimates are illustrative, and that the dynamic and macro hedging programs may
underperform these estimates, particularly during periods of high realized volatility and/or periods where both interest rates and
equity market movements are unfavourable. The method used for deriving sensitivity information and significant assumptions did
not change from the previous period.
Changes in equity markets impact our available and required components of the LICAT ratio. The second set of tables shows the
potential impact to MLI’s LICAT ratio resulting from changes in public equity market values.
61 | 2025 Annual Report | Management’s Discussion and Analysis |
Potential immediate impact on net income attributed to shareholders arising from changes to public equity returns(1)
As at December 31, 2025 | Net income attributed to shareholders | |||||
($ millions) | -30% | -20% | -10% | +10% | +20% | +30% |
Underlying sensitivity | ||||||
Variable annuity and segregated fund guarantees(2) | $(1,790) | $(1,070) | $(490) | $400 | $750 | $1,050 |
General fund equity investments(3) | (1,320) | (880) | (440) | 440 | 870 | 1,310 |
Total underlying sensitivity before hedging | (3,110) | (1,950) | (930) | 840 | 1,620 | 2,360 |
Impact of macro and dynamic hedge assets(4) | 650 | 390 | 170 | (130) | (240) | (330) |
Net potential impact on net income attributed to shareholders after impact of hedging and before impact of reinsurance | (2,460) | (1,560) | (760) | 710 | 1,380 | 2,030 |
Impact of reinsurance | 1,110 | 670 | 310 | (270) | (490) | (700) |
Net potential impact on net income attributed to shareholders after impact of hedging and reinsurance | $(1,350) | $(890) | $(450) | $440 | $890 | $1,330 |
As at December 31, 2024 | Net income attributed to shareholders | |||||
($ millions) | -30% | -20% | -10% | +10% | +20% | +30% |
Underlying sensitivity | ||||||
Variable annuity and segregated fund guarantees(2) | $(2,050) | $(1,240) | $(560) | $470 | $860 | $1,190 |
General fund equity investments(3) | (1,240) | (820) | (400) | 390 | 780 | 1,180 |
Total underlying sensitivity before hedging | (3,290) | (2,060) | (960) | 860 | 1,640 | 2,370 |
Impact of macro and dynamic hedge assets(4) | 720 | 430 | 190 | (150) | (260) | (360) |
Net potential impact on net income attributed to shareholders after impact of hedging and before impact of reinsurance | (2,570) | (1,630) | (770) | 710 | 1,380 | 2,010 |
Impact of reinsurance | 1,320 | 810 | 370 | (320) | (590) | (830) |
Net potential impact on net income attributed to shareholders after impact of hedging and reinsurance | $(1,250) | $(820) | $(400) | $390 | $790 | $1,180 |
(1)See “Caution related to sensitivities” above.
(2)For variable annuity contracts measured under the variable fee approach (“VFA”), the impact of financial risk and changes in interest rates adjusts CSM, unless
the risk mitigation option applies. The Company has elected to apply risk mitigation and therefore, a portion of the impact is reported in net income attributed to
shareholders instead of adjusting the CSM. If the CSM for a group of variable annuity contracts is exhausted, the full impact is reported in net income attributed to
shareholders.
(3)This impact for general fund equity investments includes general fund investments supporting our insurance contract liabilities, investment in seed money
investments (in segregated and mutual funds made by Global WAM segment), and the impact on insurance contract liabilities related to the projected future fee
income on variable universal life and other unit-linked products. The impact does not include any potential impact on public equity weightings. The participating
policy funds are largely self-supporting and generate no material impact on net income attributed to shareholders as a result of changes in equity markets.
(4)Includes the impact of assumed rebalancing of equity hedges in the macro and dynamic hedging program. The impact of dynamic hedging represents the impact
of equity hedges offsetting 95% of the dynamically hedged variable annuity liability movement that occurs as a result of market changes, but does not include any
impact in respect of other sources of hedge accounting ineffectiveness (e.g., fund tracking, realized volatility and equity, and interest rate correlations different from
expected among other factors).
| 62 | |
Potential immediate impact on contractual service margin, other comprehensive income to shareholders, total
comprehensive income to shareholders and MLI’s LICAT ratio from changes to public equity market values(1),(2)
As at December 31, 2025 | ||||||
($ millions) | -30% | -20% | -10% | +10% | +20% | +30% |
Variable annuity and segregated fund guarantees reported in CSM | $(2,970) | $(1,820) | $(840) | $730 | $1,390 | $1,980 |
Impact of risk mitigation – hedging(3) | 870 | 510 | 220 | (180) | (320) | (430) |
Impact of risk mitigation – reinsurance(3) | 1,400 | 850 | 390 | (330) | (630) | (890) |
VA net of risk mitigation | (700) | (460) | (230) | 220 | 440 | 660 |
General fund equity | (1,410) | (910) | (440) | 440 | 880 | 1,300 |
Contractual service margin ($ millions, pre-tax) | $(2,110) | $(1,370) | $(670) | $660 | $1,320 | $1,960 |
Other comprehensive income attributed to shareholders ($ millions, post-tax)(4) | $(920) | $(620) | $(300) | $300 | $580 | $860 |
Total comprehensive income attributed to shareholders ($ millions, post-tax) | $(2,270) | $(1,510) | $(750) | $740 | $1,470 | $2,190 |
MLI’s LICAT ratio (change in percentage points) | (2) | (1) | (1) | 1 | 1 | 2 |
As at December 31, 2024 | ||||||
($ millions) | -30% | -20% | -10% | +10% | +20% | +30% |
Variable annuity and segregated fund guarantees reported in CSM | $(3,420) | $(2,110) | $(970) | $840 | $1,580 | $2,250 |
Impact of risk mitigation – hedging(3) | 940 | 560 | 250 | (190) | (350) | (470) |
Impact of risk mitigation – reinsurance(3) | 1,670 | 1,020 | 470 | (400) | (740) | (1,050) |
VA net of risk mitigation | (810) | (530) | (250) | 250 | 490 | 730 |
General fund equity | (1,140) | (740) | (370) | 370 | 750 | 1,110 |
Contractual service margin ($ millions, pre-tax) | $(1,950) | $(1,270) | $(620) | $620 | $1,240 | $1,840 |
Other comprehensive income attributed to shareholders ($ millions, post-tax)(4) | $(840) | $(560) | $(280) | $270 | $530 | $790 |
Total comprehensive income attributed to shareholders ($ millions, post-tax) | $(2,090) | $(1,380) | $(680) | $660 | $1,320 | $1,970 |
MLI’s LICAT ratio (change in percentage points) | (1) | (1) | - | 1 | 1 | 1 |
(1)See “Caution related to sensitivities” above.
(2)This estimate assumes that the performance of the dynamic hedging program would not completely offset the gain/loss from the dynamically hedged variable
annuity and segregated fund guarantee liabilities. It assumes that the hedge assets are based on the actual position at the period end, and that equity hedges in
the dynamic program offset 95% of the hedged variable annuity liability movement that occurs as a result of market changes.
(3)For variable annuity contracts measured under VFA, the impact of financial risk and changes in interest rates adjusts CSM, unless the risk mitigation option
applies. The Company has elected to apply risk mitigation and therefore a portion of the impact is reported in net income attributed to shareholders instead of
adjusting the CSM. If the CSM for a group of variable annuity contracts is exhausted, the full impact is reported in net income attributed to shareholders.
(4)The impact of financial risk and changes to interest rates for variable annuity contracts is not expected to generate sensitivity in Other Comprehensive Income.
Interest Rate and Spread Risk Sensitivities and Exposure Measures
As at December 31, 2025, we estimated the sensitivity of our net income attributed to shareholders to a 50 basis point parallel
decline in interest rates to be a benefit of $100 million, and to a 50 basis point parallel increase in interest rates to be a charge of
$100 million.
The table below shows the potential impacts from a 50 basis point parallel move in interest rates on CSM, net income attributed
to shareholders, other comprehensive income attributed to shareholders, and total comprehensive income attributed to
shareholders. This includes a change in current government, swap and corporate rates for all maturities across all markets with
no change in credit spreads between government, swap and corporate rates. Also shown separately are the potential impacts
from a 50 basis point parallel move in corporate spreads and a 20 basis point parallel move in swap spreads. The impacts reflect
the net impact of movements in asset values in liability and surplus segments and movements in the present value of cash flows
for insurance contracts including those with cash flows that vary with the returns of underlying items where the present value is
measured by stochastic modelling. The method used for deriving sensitivity information and significant assumptions did not
change from the previous period.
The disclosed interest rate sensitivities reflect the accounting designations of our financial assets and corresponding insurance
contract liabilities. In most cases these assets and liabilities are designated as fair value through other comprehensive income
and as a result, impacts from changes to interest rates are largely in other comprehensive income. There are also changes in
interest rates that impact the CSM for VFA contracts that relate to amounts that are not passed through to policyholders. In
addition, changes in interest rates impact net income as it relates to derivatives not in hedge accounting relationships and on
VFA contracts where the CSM has been exhausted.
63 | 2025 Annual Report | Management’s Discussion and Analysis |
The disclosed interest rate sensitivities assume no hedge accounting ineffectiveness, as our hedge accounting programs are
optimized for parallel movements in interest rates, leading to immaterial net income impacts under these shocks. However, the
actual hedge accounting ineffectiveness is sensitive to non-parallel interest rate movements and will depend on the shape and
magnitude of the interest rate movements which could materially impact net income attributed to shareholders.
Our sensitivities vary across all regions in which we operate, and the impacts of yield curve changes will vary depending upon
the geography where the change occurs. Furthermore, the impacts from non-parallel movements may be materially different
from the estimated impacts of parallel movements.
The interest rate and spread risk sensitivities are determined in isolation of each other and therefore do not reflect the combined
impact of changes in government rates and credit spreads between government, swap and corporate rates occurring
simultaneously. As a result, the impact of the summation of each individual sensitivity may be materially different from the impact
of sensitivities to simultaneous changes in interest rate and spread risk.
The potential impacts also do not take into account other potential effects of changes in interest rate levels, for example, CSM at
recognition on the sale of new business or lower interest earned on future fixed income asset purchases.
The impacts do not reflect any potential effect of changing interest rates on the value of our ALDA. Rising interest rates could
negatively impact the value of our ALDA (see “Critical Actuarial and Accounting Policies – Fair Value of Invested Assets”, below).
More information on ALDA can be found below in the “Alternative Long-Duration Asset Performance Risk Sensitivities and
Exposure Measures” section.
The impact to the LICAT ratio from a change in interest rates reflects the impacts on total comprehensive income, the LICAT
adjustments to earnings for the CSM, the surplus allowance and required capital components of the regulatory capital
framework.
Potential impacts on contractual service margin, net income attributed to shareholders, other comprehensive income
attributed to shareholders, and total comprehensive income attributed to shareholders of an immediate parallel change
in interest rates, corporate spreads or swap spreads relative to current rates(1),(2),(3)
As at December 31, 2025 | Interest rates | Corporate spreads | Swap spreads | |||
($ millions, post-tax except CSM) | -50bp | +50bp | -50bp | +50bp | -20bp | +20bp |
CSM | $200 | $(300) | $(200) | $100 | $- | $- |
Net income attributed to shareholders | 100 | (100) | - | - | 100 | (100) |
Other comprehensive income attributed to shareholders | (100) | 100 | 100 | - | (300) | 300 |
Total comprehensive income attributed to shareholders | - | - | 100 | - | (200) | 200 |
As at December 31, 2024 | Interest rates | Corporate spreads | Swap spreads | |||
($ millions, post-tax except CSM) | -50bp | +50bp | -50bp | +50bp | -20bp | +20bp |
CSM | $100 | $(200) | $- | $(100) | $- | $- |
Net income attributed to shareholders | 100 | (100) | 100 | (100) | 100 | (100) |
Other comprehensive income attributed to shareholders | (100) | 200 | (200) | 300 | (100) | 100 |
Total comprehensive income attributed to shareholders | - | 100 | (100) | 200 | - | - |
(1)See “Caution related to sensitivities” above.
(2)Estimates include changes to the net actuarial gains/losses with respect to the Company’s pension obligations as a result of changes in interest rates.
(3)Includes guaranteed insurance and annuity products, including variable annuity contracts as well as adjustable benefit products where benefits are generally
adjusted as interest rates and investment returns change, a portion of which have minimum credited rate guarantees. For adjustable benefit products subject to
minimum rate guarantees, the sensitivities are based on the assumption that credited rates will be floored at the minimum.
Potential impact on MLI’s LICAT ratio of an immediate parallel change in interest rates, corporate spreads or swap
spreads relative to current rates(1),(2),(3),(4),(5)
As at December 31, 2025 | Interest rates | Corporate spreads | Swap spreads | |||
(change in percentage points) | -50bp | +50bp | -50bp | +50bp | -20bp | +20bp |
MLI’s LICAT ratio | (1) | - | (3) | 3 | - | - |
As at December 31, 2024 | Interest rates | Corporate spreads | Swap spreads | |||
(change in percentage points) | -50bp | +50bp | -50bp | +50bp | -20bp | +20bp |
MLI’s LICAT ratio | - | - | (3) | 3 | - | - |
(1)See “Caution related to sensitivities” above.
(2)Estimates include changes to the net actuarial gains/losses with respect to the Company’s pension obligations as a result of changes in interest rates.
(3)Includes guaranteed insurance and annuity products, including variable annuity contracts as well as adjustable benefit products where benefits are generally
adjusted as interest rates and investment returns change, a portion of which have minimum credited rate guarantees. For adjustable benefit products subject to
minimum rate guarantees, the sensitivities are based on the assumption that credited rates will be floored at the minimum.
(4)LICAT impacts reflect the impact of anticipated scenario switches.
(5)Under LICAT, spread movements are determined from a selection of investment grade bond indices with BBB and better bonds for each jurisdiction. For LICAT, we
use the following indices: FTSE TMX Canada All Corporate Bond Index, Barclays USD Liquid Investment Grade Corporate Index, and Nomura-BPI (Japan). LICAT
impacts presented for corporate spreads reflect the impact of anticipated scenario switches.
1 LICAT geographic locations to determine the most adverse scenario include North America, the United Kingdom, Europe, Japan and Other Region.
2 See “Caution regarding forward-looking statements” above.
3 Energy includes legacy oil and gas equity interests related to upstream and midstream assets that are in runoff, and energy transition private equity interests in
areas supportive of the transition to lower carbon forms of energy, such as wind, solar, and carbon sequestration.
| 64 | |
LICAT Scenario Switch
When interest rates change past a certain threshold, reflecting the combined movement in risk-free rates and corporate spreads,
a different prescribed interest rate stress scenario needs to be taken into account in the LICAT ratio calculation in accordance
with OSFI’s LICAT guideline.
The LICAT guideline specifies four stress scenarios for interest rates and prescribes the methodology to determine the most
adverse scenario to apply for each LICAT geographic region1 based on current market inputs and the Company’s Consolidated
Statements of Financial Position.
With the current level of interest rates in 2025, the probability of a scenario switch that could materially impact our LICAT ratio is
low2. Should the future interest rate movements differ from those presented above, a scenario switch, if applicable, may cause
the impact to the LICAT ratio to be different from the disclosed values. Should a scenario switch be triggered in a LICAT
geographic region, the full impact would be reflected immediately for non-participating products while the impact for participating
products would be reflected over six quarters using a rolling average of interest rate risk capital, in line with the smoothing
approach prescribed in the LICAT guideline. The LICAT interest rate, corporate spread and swap spread sensitivities presented
above reflect the impact of scenario switches, if any, for each disclosed sensitivity.
The level of interest rates and corporate spreads that would trigger a switch in the scenarios is dependent on market conditions
and movements in the Company’s asset and liability position. The scenario switch, if triggered, could reverse in response to
subsequent changes in interest rates and/or corporate spreads.
Alternative Long-Duration Asset Performance Risk Sensitivities and Exposure Measures
The following table shows the potential impact on CSM, net income attributed to shareholders, other comprehensive income
attributed to shareholders, and total comprehensive income attributed to shareholders resulting from an immediate 10% change
in market values of ALDA. The method used for deriving sensitivity information and significant assumptions made did not change
from the previous period.
ALDA used in this sensitivity analysis includes commercial real estate, private equity, infrastructure, timber and agriculture,
energy3 and other investments.
The impacts do not reflect any future potential changes to non-fixed income return volatility. Refer to “Publicly traded equity
performance risk sensitivities and exposure measures” above for more details.
Potential immediate impacts on contractual service margin, net income attributed to shareholders, other
comprehensive income attributed to shareholders, and total comprehensive income attributed to shareholders from
changes in ALDA market values(1)
As at | December 31, 2025 | December 31, 2024 | |||
($ millions, post-tax except CSM) | -10% | +10% | -10% | +10% | |
CSM excluding NCI | $(200) | $200 | $(200) | $200 | |
Net income attributed to shareholders(2) | (2,200) | 2,200 | (2,500) | 2,500 | |
Other comprehensive income attributed to shareholders | (200) | 200 | (200) | 200 | |
Total comprehensive income attributed to shareholders | (2,400) | 2,400 | (2,700) | 2,700 | |
(1)See “Caution related to sensitivities” above.
(2)Net income attributed to shareholders includes core earnings and the items excluded from core earnings.
Potential immediate impact on MLI LICAT ratio arising from changes in ALDA market values(1)
As at | December 31, 2025 | December 31, 2024 | |||
(change in percentage points) | -10% | +10% | -10% | +10% | |
MLI’s LICAT ratio | (1) | - | (1) | 1 | |
(1)See “Caution Related to Sensitivities” above.
Foreign Exchange Risk Sensitivities and Exposure Measures
We generally match the currency of our assets with the currency of the insurance and investment contract liabilities they support.
As at December 31, 2025, we did not have a material unmatched currency exposure.
The following table shows the potential impact on core earnings of a 10% change in the value of the Canadian dollar relative to
our other key operating currencies. Note that the impact of foreign currency exchange rates on items excluded from core
earnings does not provide relevant information given the nature of these items.
65 | 2025 Annual Report | Management’s Discussion and Analysis |
Potential impact on core earnings of changes in foreign exchange rates(1)
December 31, 2025 | December 31, 2024 | ||||
As at ($ millions) | +10% strengthening | -10% weakening | +10% strengthening | -10% weakening | |
10% change in the Canadian dollar relative to the U.S. dollar and the Hong Kong dollar | $(430) | $430 | $(450) | $450 | |
10% change in the Canadian dollar relative to the Japanese yen | (60) | 60 | (50) | 50 | |
(1)See “Caution Related to Sensitivities” above.
LICAT regulatory ratios are also sensitive to the fluctuations in the Canadian dollar relative to our other key operating currencies.
The direction and materiality of this sensitivity varies across various capital metrics.
Liquidity Risk Exposure Strategy
We manage liquidity levels of the consolidated group and key subsidiaries against established thresholds, which are based on
extreme but plausible liquidity stress scenarios over varying time horizons.
Our use of derivatives for hedging purposes is a significant source of liquidity risk through collateral and cash settlement
requirements for OTC bilateral and centrally cleared derivatives under adverse market conditions. To assess these potential
liquidity needs, we regularly stress test the market value of our derivative portfolio under various stress scenarios and measure
and monitor the contingent requirements against our liquid asset holdings. Additionally, we maintain a liquidity contingency plan
with diverse sources of contingent liquidity that can be utilized under severe stress conditions.
Manulife Bank (the “Bank”) has a stand-alone liquidity risk management framework. The framework includes daily monitoring of
liquidity levels, liquidity forecasting and stress testing, and a liquidity contingency plan. The Bank maintains an unencumbered,
high-quality liquidity buffer and has established a diversified funding program to meet its funding and liquidity requirements. The
Bank’s funding program includes retail demand deposits and GICs, wholesale term funding, and a well-established program to
securitize residential mortgage assets. The Bank models extreme but plausible stress scenarios that demonstrate the Bank has
sufficient liquid marketable securities and sufficient contingent liquidity to manage its requirements during periods of elevated
market stress.
Similarly, Global WAM has a stand-alone liquidity risk management framework for the businesses managing assets or
manufacturing investment products for third-party clients. We maintain fiduciary standards designed to ensure that client and
regulatory expectations are met in relation to the liquidity risks taken within each investment. Additionally, we regularly monitor
and review the liquidity of our investment products as part of our ongoing risk management practices.
Market & Liquidity Risk Factors
Our most significant source of publicly traded equity risk arises from equity-linked products with guarantees, where the
guarantees are linked to the performance of the underlying funds.
•The reported public equity risk sensitivity primarily arises from insurance exposures, including guarantees associated with
equity-linked investments such as variable annuity and segregated fund products, general fund investments in publicly
traded equities and mutual funds backing general fund product liabilities.
•Market conditions resulting in reductions in the asset value we manage have an adverse effect on the revenues and
profitability of our investment management business, which depends on fees related primarily to the values of assets under
management and administration.
•Guaranteed benefits of variable annuity and segregated funds are contingent and payable upon death, maturity, permitted
withdrawal or annuitization. If equity markets decline or even if they increase by an amount lower than the risk-free rate plus
an adjustment for product illiquidity assumed in our actuarial valuation, additional liabilities may need to be established to
cover the contingent liabilities, resulting in reductions that could impact net income attributed to shareholders, the
contractual service margin, and regulatory capital ratios. Further, if equity markets do not recover to the amount of the
guarantees, by the dates the liabilities are due, the accrued liabilities will need to be paid out in cash. In addition, sustained
flat or declining public equity markets would likely reduce asset-based fee revenues related to variable annuities and
segregated funds with guarantees, unit-linked products, and other wealth and insurance products.
•Where publicly traded equity investments are used to support general fund product liabilities, adverse public equity returns
and associated impacts to insurance contract liabilities from certain product features such as universal life minimum
crediting rate guarantees, or participating product zero dividend floor implicit guarantees, could result in a reduction to the
contractual services margin or total comprehensive income.
We experience interest rate and spread risk within the general fund primarily due to differences in how our assets and
liabilities respond to changes in these variables.
•Interest rate and spread risk arises from differences in the movements of our assets and liabilities due to changes in these
variables. For our assets, changes in value from movements in interest rates and spreads would vary by asset and would be
impacted by factors such as duration and credit rating. For insurance contract liabilities, which are discounted using risk-free
yields adjusted by an illiquidity premium, changes in the value would be impacted by factors such as the duration of the
| 66 | |
liability, and the spread exposure through the illiquidity premium. To the extent that there are mismatches between the
assets and liabilities such as through differences in duration, or differences in spread exposure, interest rate or spread
movements could result in a reduction in the contractual service margin or total comprehensive income.
•The Company’s disclosed estimated impact from interest rate movements reflects a parallel increase and decrease in
interest rates of specific amounts. The impact from non-parallel movements may be different from the estimated impact of
parallel movements. For further information on interest rate scenarios refer to “Interest Rate and Spread Risk Sensitivities
and Exposure Measures”.
We experience foreign exchange risk as a substantial portion of our business is transacted in currencies other than
Canadian dollars.
•Our financial results are reported in Canadian dollars. A substantial portion of our business is transacted in currencies other
than Canadian dollars, mainly U.S. dollars, Hong Kong dollars and Japanese yen. If the Canadian dollar strengthens relative
to these currencies, net income attributed to shareholders would decline and our reported shareholders’ equity would
decline. A weakening of the Canadian dollar against the foreign currencies in which we do business would have the opposite
effect and would increase net income attributed to shareholders and shareholders’ equity.
The Company’s hedging strategies will not fully reduce the market risks related to the product guarantees and fees
being hedged, hedging costs may increase and the hedging strategies expose the Company to additional risks.
•Our hedging strategies rely on the execution of derivative transactions in a timely manner. Market conditions can limit
availability of hedging instruments, requiring us to post additional collateral, and can further increase the costs of executing
derivative transactions. Therefore, hedging costs and the effectiveness of the strategy may be negatively impacted if
markets for these instruments become illiquid. The Company is subject to the risk of increased funding and collateral
demands which may become significant as equity markets and interest rates increase.
•The Company is also subject to counterparty risks arising from the derivative instruments and to the risk of increased
funding and collateral demands which may become significant as equity markets and interest rates increase. The strategies
are highly dependent on complex systems and mathematical models that are subject to error and rely on forward-looking
long-term assumptions that may prove inaccurate, and which rely on sophisticated infrastructure and personnel which may
fail or be unavailable at critical times. Due to the complexity of the strategies, there may be additional unidentified risks that
may negatively impact our business and future financial results. For further information pertaining to counterparty risks, refer
to the risk factor “If a counterparty fails to fulfill its obligations, we may be exposed to risks we had sought to mitigate”.
•Under certain market conditions, which include a sustained increase in realized equity and interest rate volatilities, a decline
in interest rates, or an increase in the correlation between equity returns and interest rates, our dynamic hedging strategy
will not fully offset the changes in liabilities.
•The level of guarantee claims returns or other benefits ultimately paid will be impacted by policyholder longevity and
policyholder behaviour including the timing and amount of withdrawals, lapses, fund transfers, and contributions. The
sensitivity of liability values to equity market and interest rate movements that we hedge are based on long-term
expectations for longevity and policyholder behaviour since the impact of actual policyholder longevity and policyholder
behaviour variances cannot be hedged using capital markets instruments. The efficiency of our market risk hedging is
directly affected by accuracy of the assumptions related to policyholder longevity and policyholder behaviour.
•Policy liability guarantees for certain products use long-term forward-looking estimates of volatilities. These long-term
forward-looking volatilities assumed for policy liabilities meet the Canadian Institute of Actuaries calibration standards. To the
extent that realized equity or interest rate volatilities in any quarter exceed the assumed long-term volatilities, or correlations
between interest rate changes and equity returns are higher, there is a risk that rebalancing will be greater and more
frequent, resulting in higher hedging costs.
Prolonged changes in market interest rates may impact our net income attributed to shareholders and capital ratios.
•A prolonged low or negative (nominal or real) interest rate environment may result in lower net investment results and a
decrease in new business CSM until products are repositioned for the lower rate environment. Other potential
consequences of low interest rates include:
◦Negative impact on sales and reduced new business profitability;
◦Increased cost of hedging and as a result, the offering of guarantees could become uneconomic;
◦Reinvestment of cash flows into low yielding bonds could result in lower future earnings due to lower returns on surplus
and general fund assets supporting in-force liabilities, and due to guarantees embedded in products including minimum
guaranteed rates in participating and adjustable products;
◦Negative impacts to other macroeconomic factors including unfavourable economic growth and lower returns on other
asset classes;
◦Potential impairments of goodwill;
◦Lower expected earnings on in-force policies;
◦Potential risk of lowering the ultimate spot rate within our discount rates that would increase our liabilities;
◦A switch in the prescribed interest stress scenario that impacts LICAT capital. See “LICAT Scenario Switch” above; and
◦Reduced ability of MFC’s insurance subsidiaries to pay dividends to MFC.
67 | 2025 Annual Report | Management’s Discussion and Analysis |
•While higher interest rates are generally good for our business, there are some associated risks. A rapid rise in interest rate
or a prolonged high-rate environment may result in material changes in policyholder behaviour such as higher surrenders,
withdrawals, changes in fund contributions or fund transfers. Other potential consequences of a rapid rise in or prolonged
high interest rates include:
◦Decrease in value of existing fixed income assets supporting general account surplus and liabilities, including the
employee benefit plans;
◦Losses attributable to early liquidation of fixed income instruments supporting contractual surrender benefits;
◦Decline in value of some of our ALDA investments, particularly those with fixed contractual cash flows such as long-
leased real estate and certain infrastructure investments;
◦Increase in collateral demands, especially for our interest rate hedging book which incurs market-to-market losses in a
rising rate environment;
◦Adverse effect on the local solvency ratio for some countries in which we operate;
◦A switch in the prescribed interest stress scenario that impacts LICAT capital. See “LICAT Scenario Switch” above;
◦Shift in new sales mix from competitive pressure on wealth products that are less attractive on a yield basis;
◦Increase in funding costs on repurchase agreements (i.e., repo transactions); and
◦Increase in borrowing costs as we refinance our debt.
Liquidity risk is impacted by various factors, including but not limited to, capital and credit market conditions, repricing
risk on letters of credit, collateral pledging obligations, and reliance on deposits sensitive to confidence or broad
macroeconomic factors.
•Adverse market conditions may significantly affect our liquidity risk.
◦Reduced asset liquidity may restrict our ability to sell certain types of assets for cash without taking significant losses. If
providers of credit preserve their capital, our access to borrowing from banks and others or access to other types of
credit, such as letters of credit, may be reduced. If investors have a negative perception of our creditworthiness, this
may reduce access to the debt capital markets or increase borrowing costs.
◦Liquid assets are required to pledge as collateral and to cover cash settlements for variation margin to support activities
such as the use of derivatives for hedging purposes.
◦The principal sources of our liquidity are cash, insurance and annuity premiums, fee income earned on AUM, cash flow
from our investment portfolios, and our assets that are readily convertible into cash, including money market securities.
The issuance of long-term debt, common and preferred shares, and other capital securities may also increase our
available liquid assets or be required to replace certain maturing or callable liabilities. In the event we seek additional
financing, the availability and terms of such financing will depend on a variety of factors including market conditions, the
availability of credit to the financial services industry, our credit ratings and credit capacity, as well as the possibility that
customers, lenders, or investors could develop a negative perception of our long-term or short-term financial prospects
if we incur large financial losses or if the level of our business activity decreases due to a significant market downturn.
•Increased cleared derivative transactions, combined with margin rules on non-cleared derivatives, could adversely impact
our liquidity risk.
◦Over time our existing over-the-counter derivatives will migrate to clearing houses, or the Company and its
counterparties may have the right to cancel derivative contracts after specific dates or in certain situations such as a
ratings downgrade, which could accelerate the transition to clearing houses. Cleared derivatives are subject to both
initial and variation margin requirements, and a more restrictive set of eligible collateral than non-cleared derivatives.
◦In addition, initial margin rules for new non-cleared derivatives further increase our liquidity needs.
•We are exposed to repricing risk on letters of credit.
◦In the normal course of business, third-party banks issue letters of credit on our behalf. In lieu of posting collateral, our
businesses utilize letters of credit for which third parties are the beneficiaries, as well as for affiliate reinsurance
transactions between subsidiaries of MFC. Letters of credit and letters of credit facilities must be renewed periodically.
At time of renewal, the Company is exposed to repricing risk and under adverse conditions, increases in costs may be
realized. In the most extreme scenarios, letters of credit capacity could become constrained due to non-renewals which
would restrict our flexibility to manage capital. This could negatively impact our ability to meet local capital requirements
or our sales of products in jurisdictions in which our operating companies have been affected. As at December 31,
2025, letters of credit for which third parties are beneficiaries, in the amount of $251 million, were outstanding (2024 –
$271 million). There were no assets pledged against these outstanding letters of credit as at December 31, 2025.
•Our obligations to pledge collateral or make payments related to declines in value of specified assets may adversely affect
our liquidity.
◦In the normal course of business, we are obligated to pledge assets to comply with jurisdictional regulatory and other
requirements including collateral pledged in relation to derivative contracts and assets held as collateral for repurchase
funding agreements. The amount of collateral we may be required to post under these agreements, and the payments
we are required to make to our counterparties, may increase under certain circumstances, including a sustained or
| 68 | |
continued decline in the value of our derivative contracts. Such additional collateral requirements and payments could
have an adverse effect on our liquidity. As at December 31, 2025, total pledged assets were $26,745 million, compared
with $26,272 million as at December 31, 2024.
•Our bank subsidiary relies on deposits sensitive to confidence as well as macroeconomic conditions.
◦The Bank is a wholly owned subsidiary of our Canadian life insurance operating company, MLI. Retail deposits are a
significant part of the funding base of the Bank. A real or perceived problem with the Bank or its parent company could
result in a loss of confidence in the Bank’s ability to meet its obligations, which in turn may trigger a significant
withdrawal of deposit funds. Depositors are protected through the Bank’s membership in the Canada Deposit Insurance
Corporation (“CDIC”) which insures demand deposits up to $100,000 per eligible depositor. Insured demand deposits
are less susceptible to runoff and a significant proportion of the Bank’s deposits are CDIC insured. The Bank also
protects depositors through mitigation strategies outlined in the Bank’s liquidity contingency plan and the Bank may
elect to sell or securitize assets with third parties to increase liquidity. The Bank may consider the use of Bank of
Canada facilities to generate short term liquidity to pay depositors; however, access to these facilities is at the sole
discretion of the Bank of Canada.
•Our investments in predominately-investment-grade private placements and below-investment-grade private credit do not
have readily observable market prices and may be less liquid than other investments.
◦We mitigate these risks by rigorous approval and oversight processes for all private assets, by employing third-party
valuation services to value most private credit assets, and through our liquidity risk framework, which assumes private
fixed income assets have limited liquidity in a stress scenario.
Credit & Investment Risk
Credit risk is the risk of loss due to the inability or unwillingness of a borrower or counterparty to fulfill its payment obligations.
Investment risk, such as those pertaining to market fluctuations (e.g., interest rates, foreign exchange) or operating performance,
that can affect both fixed income and ALDA valuations, are covered under the Market & Liquidity section above.
Credit Risk Management Strategy
Credit risk is governed by the Credit Committee which oversees the overall credit risk management program. The Company has
established objectives for overall quality and diversification of our general fund investment portfolio and criteria for the selection
of counterparties, including derivative counterparties, reinsurers, and insurance providers. Our policies establish exposure limits
by borrower, corporate connection, quality rating, industry, and geographic region, and govern the usage of credit derivatives.
Corporate connection limits vary according to risk rating. Our general fund fixed income investments are primarily public and
private investment grade bonds and commercial mortgages. We have a program for selling Credit Default Swaps (“CDS”) that
employs a highly selective, diversified, and conservative approach. CDS decisions follow the same underwriting standards as our
cash bond portfolio. Our credit granting units follow a defined evaluation process that provides an objective assessment of credit
proposals. We assign a risk rating, based on a standardized 22-point scale consistent with those of external rating agencies,
following a detailed examination of the borrower that includes a review of business strategy, market competitiveness, industry
trends, financial strength, access to funds, and other risks facing the counterparty. We assess and update risk ratings regularly.
For additional input to the process, we also assess credit risks using a variety of industry standard market-based tools and
metrics. We map our risk ratings to pre-established probabilities of default and loss given defaults, based on historical industry
and Company experience, and to resulting default costs.
We establish delegated credit approval authorities and make credit decisions on a case-by-case basis at a management level
appropriate to the size and risk level of the transaction, based on the delegated authorities that vary according to risk rating.
Major credit decisions are approved by the Credit Committee and the largest decisions are approved by the CEO and, in certain
cases, by the Board.
We limit the types of authorized derivatives and applications and require pre-approval of all derivative application strategies and
regular monitoring of the effectiveness of derivative strategies. Derivative counterparty exposure limits are established based on
a minimum acceptable counterparty credit rating (generally A- from internationally recognized rating agencies). We measure both
bilateral and exchange-traded derivative counterparty exposure as net potential credit exposure. The measurement takes into
consideration the replacement cost, which reflects mark-to-market values of the exposure adjusted for the effects of net
collateral, and the potential future exposure, which reflects the potential increase in exposure until the closure or replacement of
the transactions. Credit risk arising from reinsurance counterparties is included in the valuation models for reinsurance contract
assets. Reinsurance counterparty exposure is measured reflecting the level of ceded liabilities on a best estimate basis net of
collateral held. The creditworthiness of all reinsurance counterparties is reviewed internally on a regular basis.
Regular reviews of credits within the various portfolios are undertaken with the goal of prompt identification of changes to credit
quality and, where appropriate, taking corrective action.
Our credit policies, procedures and investment strategies are established under a strong governance framework and are
designed to ensure that risks are identified, measured, and monitored consistent with our risk appetite. We seek to actively
69 | 2025 Annual Report | Management’s Discussion and Analysis |
manage credit exposure in our investment portfolio to reduce risk and minimize losses, and derivative counterparty exposure is
managed proactively. However, we could experience volatility on a quarterly basis and losses could potentially arise as a result.
Credit Risk Exposure Measures
We use the Expected Credit Loss (“ECL”) impairment allowance model in accordance with IFRS to establish and maintain
allowances on our invested assets which are debt instruments measured at FVOCI or amortized cost. ECL allowances are
measured on a probability-weighted basis, based on four macroeconomic scenarios, and incorporate consideration of past
events, current market conditions, and reasonable supportable information about future economic conditions.
We measure ECL allowances using a three-stage approach. We recognize ECL on performing financial instruments that have
not experienced significant increases in credit risk (“SICR”) since acquisition to the extent of losses expected to result from
defaults occurring within 12 months of the reporting date (Stage 1). Full lifetime ECLs are recognized for financial instruments
experiencing SICR since acquisition or having become 30 days in arrears in principal or interest payments (Stage 2). Full lifetime
ECLs are also recognized for financial instruments which have become credit-impaired (Stage 3), with a probability of default set
at 100%. Interest income on Stage 3 financial instruments is determined based on the carrying amount of the asset, net of any
credit loss allowance.
We establish ECL allowances for investments in debt instruments which are measured at FVOCI or amortized cost. On an
ongoing basis, these ECL allowances are monitored and adjusted for changes in credit quality and conditions. Credit risk arising
from reinsurance counterparties is included in the valuation models for reinsurance contract assets. There is no assurance that
the ECL allowances or valuation results will be adequate to cover future potential losses.
For more information on our ECL allowances, refer to notes 1 and 8 of the 2025 Annual Consolidated Financial Statements.
Credit & Investment Risk Factors
Borrower or counterparty defaults or downgrades could adversely impact our earnings.
•Worsening regional and global economic conditions could result in borrower or counterparty defaults or downgrades and
could lead to increased allowances or impairments related to our general fund invested assets and derivative financial
instruments, and an increase in the credit risk factored into modeling of our reinsurance contract assets and insurance
contract liabilities.
•Our invested assets subject to credit risk primarily include investment grade bonds, private placements, commercial and
residential mortgages, asset-backed securities, and consumer loans. These assets are generally carried at FVOCI, and as a
result, changes in the required ECL allowance would be recorded in the provision for credit losses in the Consolidated
Statements of Income. The return cash inflow assumptions incorporated in actuarial liabilities include an expected level of
future asset impairments. There is a risk that actual impairments will exceed the assumed level of impairments in the future
and earnings could be adversely impacted.
•Volatility may arise from defaults and downgrade charges on our invested assets, and as a result, losses could potentially
rise above long-term expected levels. The ECL impairment allowance was $809 million, representing 0.18% of total general
fund invested assets as at December 31, 2025, compared with $828 million, representing 0.19% of total general fund
invested assets as at December 31, 2024.
If a counterparty fails to fulfill its obligations, we may be exposed to risks we had sought to mitigate.
•The Company uses derivative financial instruments to mitigate exposures to public equity, foreign currency, interest rate and
other market risks arising from on-balance sheet financial instruments, guarantees related to variable annuity products,
selected anticipated transactions and certain other guarantees. The Company may be exposed to counterparty risk if a
counterparty fails to pay amounts owed to us or otherwise perform its obligations to us. Counterparty risk increases during
economic downturns because the probability of default increases for most counterparties. If any of these counterparties
default, we may not be able to recover the amounts due from that counterparty. As at December 31, 2025, the largest single
counterparty exposure, without taking into account the impact of master netting agreements or the benefit of collateral held,
was $1,386 million (2024 – $1,319 million). The net exposure to this counterparty, after taking into account master netting
agreements and the fair value of collateral held, was $nil (2024 – $nil). As at December 31, 2025, the total maximum credit
exposure related to derivatives across all counterparties, without taking into account the impact of master netting
agreements and the benefit of collateral held, was $9,955 million (2024 – $9,048 million) compared with $561 million after
taking into account master netting agreements and the benefit of fair value of collateral held (2024 – $429 million). The
exposure to any counterparty would grow if, upon the counterparty’s default, markets moved such that our derivatives with
that counterparty gain in value. Until we are able to replace those derivatives with another counterparty, the gain on the
derivatives subsequent to the counterparty’s default would not be backed by collateral.
•The Company reinsures a portion of the insurance policies it sells, which also includes the use of reinsurance to effectively
sell blocks of business to third parties. Unless the policies are novated to the reinsurer, the Company remains directly liable
to policyholders to fulfill obligations under these policies. The Company is reimbursed by the reinsurer for payments made to
policyholders on the reinsured policies. To mitigate credit risk to the reinsurer, the Company may require reinsurers to
provide collateral for their reinsurance obligations. In the event that a reinsurer fails to fulfill its contractual obligations to the
Company under the reinsurance contract, a proportional decrease to the value of the reinsurance asset would be
| 70 | |
acknowledged with a consequent negative impact to any net income attributed to shareholders and capital position. Such
negative impact would be offset to the extent the amount of collateral provided by the reinsurer is sufficient to cover the
reinsurer’s obligations.
•We participate in a securities lending program whereby blocks of securities are loaned to third parties, primarily major
brokerage firms and commercial banks. Collateral, which exceeds the market value of the loaned securities, is retained by
the Company until the underlying security has been returned. If any of our securities lending counterparties default and the
value of the collateral is insufficient, we would incur losses. As at December 31, 2025, the Company had loaned securities
(which are included in invested assets) valued at approximately $1,800 million, compared with $1,021 million as at
December 31, 2024.
The determination of loss allowances and impairments on our investments is subjective and changes could materially
impact our results of operations or financial position.
•The determination of impairment losses on debt investments measured at FVOCI or amortized cost is based upon the ECL
model which is applied quarterly. ECL allowances are estimated as the differences between all contractual cash flows due in
accordance with the contract and all the cash flows that we expect to receive, discounted at the original effective interest
rates of the contracts. This process includes consideration of past events, current market conditions, and reasonable and
supportable information about future economic conditions. Forward-looking macroeconomic variables used within the
estimation models represent variables that are the most closely related with credit loss expectations for the relevant
issuance.
•The estimation and measurement of ECL impairment losses requires significant judgment. These estimates are driven by
many elements, changes in which can result in different levels of allowances. Elements include the estimation of the amount
and timing of future cash flows, our criteria for assessing if there has been a significant increase in credit risk (“SICR”), the
selection of forward-looking macroeconomic scenarios and their probability weights, the application of expert credit judgment
in the development of the models, inputs and, when applicable, overlay adjustments. It is our process to regularly review our
models in the context of actual loss experience and adjust when necessary. We have implemented formal policies,
procedures, and controls over all significant impairment processes.
•Such evaluations and assessments are revised as conditions change and new information becomes available. We update
our evaluations regularly and reflect changes in allowances and impairments as such evaluations warrant. The evaluations
are inherently subjective and incorporate only those risk factors known to us at the time the evaluation is made. There can
be no assurance that management has accurately assessed the level of impairments that have occurred. Additional
impairments will likely need to be taken or allowances provided for in the future as conditions evolve. Historical trends may
not be indicative of future impairments or allowances.
We experience ALDA performance risk from the risk of low returns, including lower valuations.
•ALDA performance risk arises from general fund investments in directly-owned real estate, timber properties, farmland
properties, infrastructure, private equities, and energy assets.
•Difficult economic conditions could result in higher vacancy, lower rental rates, and lower demand for real estate
investments, all of which would adversely impact the value of our diversified real estate investments. Continual advances in
the digitization of work and the transformation of physical retail may have further negative impact to our commercial real
estate investments. Difficult economic conditions could also prevent companies in which we have made private equity
investments from achieving their business plans and could cause the value of these investments to fall, or even cause the
companies to fail. Sustained declines in valuation multiples in the public equity market would also likely cause values to
decline in our private equity portfolio. The timing and amount of investment income from private equity investments is difficult
to predict, and investment income from these investments can vary from quarter to quarter.
•Our timberland and farmland holdings are exposed to natural risks, such as prolonged drought, wildfires, insects,
windstorms, flooding, and climate change. We are generally not insured for these types of risks but seek to proactively
mitigate their impact through portfolio diversification and prudent operating practices.
•The value of energy assets, including oil and gas, could be adversely affected by declines in energy prices as well as by a
number of other factors including production declines, difficult economic conditions, changes in consumer preferences to
transition to a low-carbon economy, and geopolitical events. Changes in government regulation, including environmental
regulation could also adversely affect the value of our investments in both renewable and non-renewable energy assets.
•Higher interest rates, in combination with uncertain economic environments, could precipitate higher ALDA discount rates as
buyers demand higher current returns to invest in ALDA. Since ALDA cash flows may, to some degree, be fixed in the near
to medium-term, some ALDA values may initially decline in order for the asset returns to meet the desired higher discount
rates in future periods, resulting in lowered current portfolio returns.
•The negative impact of changes in market or economic factors can take time to be fully reflected in the valuations of private
investments, including ALDA, especially if the change is large and rapid, as market participants endeavor to adjust their
forecasts and better understand the potential medium to long-term impact of such changes. As a result, valuation changes in
any given period may reflect the delayed impact of events that occurred in prior periods. Our real estate valuations are
based on external appraisals and these appraisals may lag behind current market transactions.
•We rely on a diversified portfolio of ALDA to generate relatively stable investment returns. Diversification benefits may be
reduced at times, especially during a period of economic stress, which would adversely affect portfolio returns.
1 Global WAM product-related risks (e.g. strategic, operational, etc.) are managed by First Line Local / Regional Product Committees and working groups and the
Global Investment Product Committee. Notable products which could introduce new and material risks are reviewed and approved by the Global WAM Risk
Committee prior to launch.
71 | 2025 Annual Report | Management’s Discussion and Analysis |
Insurance Risk
Insurance risk is the risk of loss due to actual insurance experience emerging differently than assumed when a product was
designed and priced. Assumptions for future claims are generally based on both Company and industry experience, and
assumptions for future policyholder behaviour and expenses are generally based on Company experience.
Insurance Risk Management Strategy
The Product Oversight Committee1 oversees the overall insurance risk management program. The Product Oversight Committee
has established a broad framework for managing insurance risk under a set of policies, standards, and guidelines, designed to
ensure that our product offerings align with our risk taking philosophy and risk limits, and achieve acceptable profit margins.
These cover:
•product design features •use of reinsurance •pricing models and software •internal risk based capital allocations •target profit objectives | •pricing methods and assumption setting •stochastic and stress scenario testing •required documentation •review and approval processes •experience monitoring programs |
In each business unit that sells insurance, we designate individual pricing officers who are accountable for pricing activities, chief
underwriters who are accountable for underwriting activities, and chief claims risk managers who are accountable for claims
activities. Both the pricing officer and the general manager of each business unit approve the design and pricing of each product,
including key claims, policyholder behaviour, investment return and expense assumptions, in accordance with global policies and
standards. Risk management functions provide additional oversight, review and approval of material product and pricing
initiatives, as well as material underwriting initiatives. Actuarial functions provide oversight review and approval of insurance and
investment contract liability valuation methods and assumptions. In addition, both risk and actuarial functions review and approve
new reinsurance arrangements. We perform annual risk and compliance self-assessments of the product development, pricing,
underwriting and claims activities of all insurance businesses. To leverage best practices, we facilitate knowledge transfer
between staff working with similar businesses in different geographies.
We utilize an internally developed global underwriting manual, supplemented with reinsurers’ manuals in certain jurisdictions and
for certain coverages. This is intended to ensure insurance underwriting practices for direct written life business are consistent
across the organization while reflecting local conditions. Each business unit establishes underwriting policies and procedures,
including criteria for approval of risks and claims adjudication policies and procedures.
We apply retention limits per insured life that are intended to reduce our exposure to individual large claims which are monitored
in each business unit. These retention limits vary by market and jurisdiction. We reinsure exposure in excess of these limits with
other companies (see “Risk Management and Risk Factors – Insurance Risk Factors – External market conditions determine the
availability, terms and cost of reinsurance protection” below). Enterprise-wide, we aim to reduce the likelihood of high aggregate
claims by operating globally, insuring a wide range of unrelated risk events, and reinsuring some risks. We seek to actively
manage the Company’s aggregate exposure to each of policyholder behaviour risk and claims risk against enterprise-wide
economic capital limits. Policyholder behaviour risk limits cover the combined risk arising from policy lapses and surrenders,
withdrawals, and other policyholder driven activity. The claims risk limits cover the risks arising from mortality, longevity, and
morbidity.
Internal experience studies, as well as trends in our experience and that of the industry, are monitored to update current and
projected claims and policyholder behaviour assumptions, resulting in updates to insurance contract liabilities as appropriate.
Insurance Risk Factors
Losses may result should actual experience be materially different than that assumed in the valuation of insurance
contract liabilities.
•Such losses could have a significant adverse effect on our results of operations and financial condition. In addition, we
periodically review the assumptions we make in determining our insurance contract liabilities and the review may result in an
increase in insurance contract liabilities and a decrease in net income attributed to shareholders. Such assumptions require
significant professional judgment, and actual experience may be materially different than the assumptions we make. See
“Critical Actuarial and Accounting Policies” below.
•Policyholder behaviour including premium payment patterns, policy renewals, lapse rates and withdrawal, and surrender
activity are influenced by many factors including market and general economic conditions, and the availability and relative
attractiveness of other products in the marketplace. For example, a weak or declining economic environment could increase
the value of guarantees associated with variable annuities or other embedded guarantees and contribute to adverse
| 72 | |
policyholder behaviour experience, or a rapid rise in interest rates could increase the attractiveness of alternatives for
customers holding products that offer contractual surrender benefits that are not market value adjusted, which could also
contribute to adverse policyholder behaviour experience. If premium persistency or lapse rates are significantly different
from our expectations, it could have a material adverse effect on our business, financial condition, results of operations, and
cash flows.
We may be unable to implement necessary price increases on our in-force businesses or may face delays in
implementation.
•We continue to seek state regulatory approvals for price increases on existing long-term care business in the United States.
We cannot be certain whether or when each approval will be granted. For some in-force business, regulatory approval for
price increases may not be required. However, regulators or policyholders may nonetheless seek to challenge our authority
to implement such increases. Our insurance contract liabilities reflect our estimates of the impact of these price increases,
but should we be less successful than anticipated in obtaining them, then insurance contract liabilities could increase
accordingly and reduce net income attributed to shareholders.
Evolving legislation related to genetic testing could adversely impact our underwriting abilities.
•Current or future legislation in jurisdictions where Manulife operates may restrict its right to underwrite based on access to
genetic test results. Without the obligation of disclosure, the asymmetry of information shared between applicant and insurer
could increase anti-selection in both new business and in-force policyholder behaviour. The impact of restricting insurers’
access to this information and the associated problems of anti-selection becomes more acute where genetic technology
leads to advancements in diagnosis of life-threatening conditions that are not matched by improvements in treatment. We
cannot predict the potential financial impact that this would have on the Company or the industry as a whole. In addition,
there may be further unforeseen implications as genetic testing continues to evolve and becomes more established in
mainstream medical practice.
Evolving AI models could adversely impact our underwriting and claims abilities.
•The rapid growth and availability of AI and generative AI technologies presents significant opportunities to enhance
underwriting and claims activities, together with certain risks and challenges. AI models have been implemented in some
geographies to enhance underwriting and claims processes. These new technologies carry risks that may not be fully
understood. The Company puts in place guardrails that seek to limit the scope of exposure and monitors closely the
experience to mitigate any emerging risks, but the Company can make no assurances that these efforts will be successful.
•Future legislation may restrict certain usage of AI models or data that feed into the AI models, which could adversely impact
our underwriting and claims abilities.
Life and health insurance claims may be impacted unexpectedly by changes in the prevalence of diseases or illnesses,
medical and technology advances, widespread lifestyle changes, natural disasters, large-scale human-made disasters
and acts of terrorism.
•Claims resulting from catastrophic events could cause substantial volatility in our financial results in any period and could
materially reduce our profitability or harm our financial condition. Large-scale catastrophic events may also reduce the
overall level of economic activity, which could hurt our business and our ability to write new business. It is possible that
geographic concentration of insured individuals could increase the severity of claims we receive from future catastrophic
events. The effectiveness of external parties, including governmental and non-governmental organizations, in combating the
severity of such an event is outside of our control and could have a material impact on the losses we experience.
Additionally, catastrophic events could harm our reinsurers’ financial condition, resulting in reinsurance defaults.
•The cost of health insurance benefits may be impacted by unforeseen trends in the incidence, termination and severity rates
of claims. The ultimate level of lifetime benefits paid to policyholders may be increased by an unexpected increase in life
expectancy. For example, advances in technology could lead to longer lives through better medical treatment or better
disease prevention. As well, adverse claims experience could result from systematic anti-selection, which could arise from
anti-selective lapse behaviour, underwriting process failures, anti-selective policyholder behaviour due to greater consumer
accessibility to home-based medical screening, or other factors.
External market conditions determine the availability, terms and cost of reinsurance protection which could impact our
financial position and our ability to write new policies.
•As part of our overall risk and capital management strategy, we purchase reinsurance protection on certain risks
underwritten or assumed by our various insurance businesses. As the global reinsurance industry continues to review their
business models, certain of our reinsurers have attempted to increase rates on our existing reinsurance contracts. The
ability of our reinsurers to increase rates depends upon the terms of each reinsurance contract. Typically, a reinsurer’s ability
to raise rates is restricted by terms in our reinsurance contracts, which we seek to enforce. Over the past several years, we
have received rate increase requests from some of our reinsurers. Thus far, dealing with those requests has not had a
material adverse effect on our results of operation or financial condition. Consistent with past practice, we dispute requested
increases and, if necessary, we can pursue legal action in order to protect our contractual rights. While possible outcomes
remain unknown and there can be no assurance that the outcome of any one or more of these disputes would not have a
73 | 2025 Annual Report | Management’s Discussion and Analysis |
material adverse effect on our results of operation or financial condition for a particular reporting period, we believe that our
reserves, inclusive of reinsurance provisions, are appropriate overall.
•In addition, an increase in the cost of reinsurance could also adversely affect our ability to write future new business or result
in the assumption of more risk with respect to policies we issue. Premium rates charged on new policies we write are based,
in part, on the assumption that reinsurance will be available at a certain cost. Certain reinsurers may attempt to increase
rates they charge us for new policies we write, and for competitive reasons, we may not be able to raise the premium rates
we charge for newly written policies to offset the increase in reinsurance rates. If the cost of reinsurance were to increase, or
if reinsurance were to become unavailable and if alternatives to reinsurance were not available, our ability to write new
policies at competitive premium rates could be adversely affected.
Operational Risk
Operational risk is naturally present in all of our business activities and encompasses a broad range of risks, including business
disruptions, damage to physical assets, human resource management failures, processing errors, modelling errors, business
integration, theft and fraud, as well as regulatory compliance failures or legal disputes.
Operational risk is also embedded in all the practices we use to manage other risks; therefore, if not managed effectively,
operational risk can impact our ability to manage other key risks such as credit & investment risk, market & liquidity risk,
insurance risk, and technology and cyber risk.
Operational risk is inherently on the rise as we expand our ecosystem to include more third parties and adopt newer technologies
to drive better customer outcomes and efficiencies. In such cases, an operational risk can arise from outside of Manulife’s
immediate span of direct control and have material consequences for Manulife, our customers, and other key stakeholders. If left
unmitigated, these risks can be amplified across multiple business units and processes resulting in significant exposures.
Exposures can take the form of financial losses, regulatory sanctions, loss of competitive positioning, or damage to our brand
and reputation. As such, there are higher expectations from Manulife’s management, our customers and other key stakeholders,
including regulators, on our ability to ensure continued operations of our most critical operations and services in a face of
disruption.
Furthermore, Manulife has strengthened its operational risk management program by identifying its critical operations, defining
impact tolerances and establishing effective mitigations against severe but plausible disruptions, and has been embedded into
our Operational Risk Frameworks and risk management practices.
Operational Risk and Resilience Management Strategy
Our corporate governance practices, corporate values, and integrated enterprise-wide approach to managing risk set the
foundation for mitigating operational risks. This base is further strengthened by internal controls and systems, compensation
programs, and talent management throughout the organization. We align compensation programs with business strategy, long-
term shareholder value and good governance practices, and we benchmark these compensation practices against peer
companies.
We have our enterprise operational risk management framework that sets out the processes we use to identify, assess, manage,
mitigate, and report on significant operational risk exposures. Complementary to this, we have our operational resilience
framework which outlines Manulife’s approach to resilience including our ability to adapt to, recover from and withstand
disruption of our most critical operations. Operational resilience entails a sound understanding of critical operations and services
end to end and their delivery through severe but plausible circumstances within tolerance for disruption. Overall, the execution of
our operational risk management strategy supports the drive towards a focus on the effective management of our key global
operational risks and operational resilience. Our Operational Risk and Segment Risk Committees oversee all operational risk and
resilience matters, including operational risk strategy, management, and governance. We have enterprise-wide risk management
programs for specific operational risks that could materially impact our ability to do business or impact our reputation.
Business Continuity Risk Management Strategy
Effective business continuity management is an important capability to help ensure the resilience of a firm’s most critical
operations and services. However it has traditionally focused on the ‘recovery after’ rather than the ‘continued operation through’
disruption. At Manulife, we connect our business continuity with other key disciplines such as third-party risk management,
technology risk and disaster recovery, and change risk and data risk management through the lens of critical operations and
seek to ensure that resilience is embedded into the design of processes and technologies to reduce the likelihood of failure in the
first instance.
We manage business continuity risk through its lifecycle in accordance with regulatory requirements, our business continuity risk
management standard, and industry best practices. Management develops and owns the business continuity plans (BCPs) and
processes that seek to minimize the impact of, and continue to operate through disruptions resulting from internal or external
factors. BCPs are developed with a level of detail and comprehensiveness commensurate with the criticality of the business
process and address business strategy and requirements, incorporate inputs from key stakeholders, and details upstream and
downstream dependencies. The BCPs are updated through regular monitoring and testing, recalibrating them to meet the
| 74 | |
evolving environment conditions and business requirements. Oversight and challenge are provided by the risk teams at all
stages of the business continuity management lifecycle, helping to ensure the requirements set out in the standard are being met
and that our plans are up to date and actionable.
Third-Party Risk Management Strategy
Our operations and strategic initiatives depend on a diverse set of third-party relationships—including distributors, independent
contractors, outsourcing providers, and suppliers—that deliver essential services and capabilities. While these relationships are
critical to our business model, they also introduce risks that may affect profitability, regulatory compliance, and reputation if third
parties fail to meet performance expectations, contractual obligations, or legal requirements.
We manage third-party risk through a comprehensive framework that governs the full lifecycle of these relationships. This
includes due diligence during onboarding, clear contractual arrangements, ongoing performance monitoring, and structured
processes for renewal or termination. The framework is designed to be adaptable across various third-party types and is aligned
with applicable regulatory expectations.
Additional oversight is applied to third parties deemed critical to our operations, with enhanced requirements focused on service
continuity, exit planning, and disruption response. Third-party risk is assessed in coordination with broader enterprise risk
domains—including operational, cyber, compliance, and reputational risk—to ensure a holistic view of exposures. These
practices help ensure accountability, resilience, and responsiveness to evolving regulatory expectations.
Change Risk Management Strategy
We seek to ensure that significant changes are practical and meet company objectives, and are successfully implemented and
monitored by management. Our practices are enforced through our framework, policies and standards which are benchmarked
against leading practices and regulatory requirements.
Legal and Regulatory Compliance Program Risk Management Strategy
Compliance oversees our Regulatory Compliance Management program and function. For our centralized programs, support is
provided by our designated Segment Chief Compliance Officers and Compliance Functional leads as instructed by the Global
Chief Compliance Officer. Programs supported include Regulatory Governance, Financial Crimes Compliance, Privacy
Compliance, the Global Ethics Office, and Distribution Compliance.
The program is designed to promote compliance with regulatory obligations worldwide and to assist in making the Company’s
employees aware of the laws and regulations that affect it, along with the risks associated with failing to comply. Compliance
monitors emerging legal and regulatory developments and prepares the Company to address any changes related to new or
existing requirements or obligations.
Compliance seeks to ensure significant issues are escalated and proactively mitigated. Compliance also independently assesses
and monitors the effectiveness of a broad range of regulatory compliance processes and business practices against potential
legal, regulatory, fraud, and reputation risks. These processes and business practices include Privacy, Sales and Marketing
practices, Sales conduct (including compensation practices, product design, suitability and fiduciary responsibilities), Asset
Management practices, the Ethics Hotline, and Regulatory filings. In addition, the Company has standards, policies, processes
and controls in place to help protect the Company, our customers and relevant third parties from acts of fraud, and from risks
associated with money laundering and terrorist financing. Audit Services and Compliance personnel independently assess the
effectiveness of the system of internal controls supporting Compliance. For further discussion of government regulation and legal
proceedings, refer to “Government Regulation” in MFC’s Annual Information Form dated February 11, 2026 and note 18 of the
2025 Annual Consolidated Financial Statements.
Global Privacy Risk Management Framework
In addition to the Regulatory Compliance program above, we also have a global framework for managing the Company’s privacy
risk which is overseen by our Global Chief Privacy Officer and includes policies and standards and ongoing monitoring of
emerging privacy legislation. Processes have been established to provide guidance on handling personal information and for
reporting privacy incidents and issues to appropriate management for response and resolution. Additional controls from both
business and technology functions are in place to support compliance with legal and regulatory expectations. Furthermore, a
network of privacy, compliance and risk officers support implementation across the enterprise, seeking to ensure compliance with
a wide range of global privacy laws and regulations. As privacy legislation continues to evolve, particularly with more stringent
requirements around incident reporting and data subject rights, we remain focused on maintaining compliance and minimizing
associated risks.
Human Resource Risk Management Strategy
We have multiple human resource policies, practices and programs in place that seek to manage the risks associated with
attracting and retaining top talent. These include recruiting programs at every level of the organization, training and development
programs for our individual contributors and people leaders, initiatives to foster inclusion, employee engagement surveys, and
75 | 2025 Annual Report | Management’s Discussion and Analysis |
competitive compensation programs that are designed to attract, motivate, and retain high performing and high potential
employees.
Communications Risk Management Strategy
Our Communications team is responsible for both protecting and managing our reputation and the risk associated with
distributing communications – internally and externally. Our Media and Social Media policies help ensure that proper reviews of
content are taking place ahead of distribution. We also use tools to listen for what others are saying about Manulife as a way to
proactively understand and respond to inherent risk. We have teams that are able to distribute communications in response to a
crisis should we need to.
Marketing Risk Management Strategy
We have policies, processes and controls in place across media channels and forums globally which seek to ensure Manulife's
brands, trademarks, advertising, other marketing-related materials and all communications are presented accurately.
Model Risk Management Strategy
We have designated Model Risk Management teams working closely with model owners and users that seek to manage model
risk. Our model risk oversight program includes processes intended to ensure that our critical business models are conceptually
sound, implemented and performed as expected, and used as intended.
For AI models our Model Risk Management teams will also work closely with other critical control functions in Manulife, including
but not limited to compliance and legal, data governance and privacy offices, IT and Cybersecurity, and other risk management
functions, aiming to ensure responsible development and adoption of AI. Generative AI models, such as Large Language Models
(LLMs), introduce unique challenges in ensuring they operate with acceptable outcomes, particularly concerning risks like model
drift and hallucinations. To mitigate these risks, we employ techniques such as continuous monitoring, fine-tuning, and retraining,
along with human-in-the-loop systems for oversight. Despite these measures, AI models may not perform within an acceptable
range of outcomes.
AI Operational Risk
We currently use, and expect to continue using AI in support of our products, services, and critical business functions, either
through technology we develop or technology developed and maintained by third parties.
The use of AI can accelerate Operational Risks as AI performs tasks previously performed by humans. AI may be susceptible to
manipulation, increasing the potential for fraud, privacy issues, litigation, and other issues. AI itself is prone to errors such as
hallucinations which can lead to incorrect outcomes in, and disruption to, our business processes, including where AI is used to
support the execution of our critical operations and services. The Company strives to put in place appropriate guardrails to
mitigate such risks.
Operational Risk Factors
Competition for the best people is intense and an inability to recruit qualified individuals may negatively impact our
ability to execute on business strategies, conduct our operations or to meet the rapid changes in external environments
such as demographics and regulatory landscape.
•Market fluctuations aside, the competition for top talent and key capabilities continues to be fierce. Our ability to attract
external talent while developing our own internal capabilities is core to our high performing team ambitions. Our industry
continues to require specific core capabilities and in meeting those talent needs we compete against other insurance
companies, financial institutions, and wealth management organizations to attract talent. We compete against organizations
across many industries for digital talent, functional experts, leaders, and sales talent. We also monitor and react to rapid
changes in regulations across the globe. These regulations are often complex and may have a significant impact to our
operations. To find the talent we need to deliver on our strategic objectives and maintain our competitive advantage, our
core approach is focused on building enhanced talent networks to entice top candidates in the market. The risk of other
organizations both inside and outside of our geographic footprint targeting our employees is heightened as companies
maintain flexible remote working arrangements. Additionally, we are in an environment where pay levels have been
increasing more quickly than in recent years due to the competitive talent market, inflation, and other factors. We help
ensure that our value proposition remains competitive and current through offerings such as flexible work arrangements,
learning investments, wellbeing, recognition & incentive programs, and a culture that strives to be recognized as a top
employer within the markets we operate.
If we are not able to attract, motivate and retain agency leaders and individual agents, our competitive position, growth
and profitability will suffer.
•The attraction and motivation of productive and engaged sales representatives (agents) is critical to achieving our financial
targets and a positive customer experience and brand. We compete with other financial services companies for sales
representatives primarily based on the opportunity available, our brand and culture, support services, compensation and
product features. Negative changes to any of these factors, or falling below market competitive levels, could impact our
| 76 | |
ability to attract, retain and engage sufficient sales representatives which could pose a risk to our business objectives and
ambitions and could have a material adverse effect on our business, results of operations and financial condition.
If we are unable to manage the risk of significant changes to our business in accordance with our standards, our
business strategies and plans, and operations may be impaired.
•We must successfully deliver several significant changes to our business to implement our business strategies and
successfully achieve our plans. If we are unable to manage risk imposed by significant changes in accordance with our risk
appetite and in order to capture the projected benefits and outcomes of such changes, there could be a material adverse
effect on our business and financial condition.
Key business processes may fail, causing material loss events and impacting our customers and reputation.
•Our institution processes a substantial volume of complex transactions both internally and through third-party relationships.
This complexity introduces a risk that errors could have material impact on our customers or result in financial loss for the
organization. To mitigate these risks, we have instituted controls that seek to ensure timely and accurate processing for our
most significant business processes. Furthermore, we have established necessary monitoring, escalation and reporting
processes to promptly address errors that may arise.
The interconnectedness of our operations and risk management strategies could expose us to risk if all factors are not
appropriately considered and communicated.
•Our business operations, including strategies and operations related to risk management, asset liability management and
liquidity management, are interconnected and complex. Changes in one area may have a secondary impact in another area
of our operations. For example, risk management actions, such as the increased use of interest rate swaps, could have
implications for liquidity risk management, as this strategy could result in the need to post additional amounts of collateral.
Failure to appropriately consider these inter-relationships, or effectively communicate changes in strategies or activities
across our operations, could have a negative impact on the strategic objectives or operations of another group.
Our risk management policies, procedures and strategies may leave us exposed to unidentified or unanticipated risks,
which could negatively affect our business, results of operations and financial condition.
•We devote significant resources to develop our risk management policies, procedures, and strategies. Nonetheless, there is
a risk that our policies, procedures, and strategies may not be comprehensive. Many of our methods for measuring and
managing risk exposures are based upon the use of observed historical market behaviour or statistics based on historical
models. Future behaviour may differ from past behaviour. Furthermore, data or models we use may not always be accurate,
complete, up-to-date, or properly evaluated or reported.
We are subject to tax audits, tax litigation or similar proceedings, and as a result we may owe additional taxes, interest
and penalties in amounts that may be material.
•We are subject to income and other taxes in the jurisdictions in which we do business. In determining our provisions for
income taxes and our accounting for tax-related matters in general, we are required to exercise judgment. We regularly
make estimates where the ultimate tax determination is uncertain. There can be no assurance that the final determination of
any tax audit, appeal of the decision of a taxing authority, tax litigation or similar proceedings will not be materially different
from that reflected in our historical financial statements. The assessment of additional taxes, interest and penalties could be
materially adverse to our current and future results of operations and financial condition.
Our operations face political, legal, operational and other risks that could negatively affect those operations or our
results of operations and financial condition.
•Our operations face the risk of discriminatory regulation, political and economic instability, the imposition of economic or
trade sanctions, isolationist foreign policies, armed conflicts, civil unrest or disobedience, government policies or regulations
adopted in response to political or social pressures and rising populism and/or nationalism, limited protection for, or
increased costs to protect intellectual property rights, inability to protect and/or enforce contractual or legal rights,
nationalization or expropriation of assets, price controls and exchange controls or other restrictions that prevent us from
transferring funds out of the countries in which we operate and disruptions in global supply chains. In addition, as political
tensions and populism and/or nationalism rise in a number of locations, compliance with laws and regulations by global
financial institutions may become challenging as complying with the requirements in one jurisdiction may be contrary to the
requirements of another.
•A substantial portion of our revenue and net income attributed to shareholders is derived from our operations outside of
North America, primarily in Asian markets. Some of these markets are developing and are rapidly growing countries where
these risks may be heightened.
•There is tension between mainland China and Canada, the U.S. and their allies over a number of issues, including trade,
technology and human rights resulting in the imposition of sanctions and trade restrictions on companies and individuals.
Mainland China and the Hong Kong SAR are important markets for Manulife and tensions may create a more challenging
operating environment for Manulife. In addition, the military conflicts in the Middle East and in Ukraine may negatively impact
regional and global financial markets and economies.
77 | 2025 Annual Report | Management’s Discussion and Analysis |
•These risks could result in disruptions to our operations, unanticipated costs, increased market volatility and inflation, a
contraction of business activity and recession, diminished investor and consumer confidence, lower investment growth,
insurance sales and fees earned on managed assets, the loss of assets or a reduction in their value and reduced
remittances. Failure to manage these risks could have a significant negative impact on our operations and profitability
globally.
We are regularly involved in litigation.
•We are regularly involved in litigation, either as a plaintiff or defendant. These cases could result in an unfavourable
resolution and could have a material adverse effect on our results of operations and financial condition. For further
discussion of legal proceedings refer to note 18 of the 2025 Annual Consolidated Financial Statements.
We may experience difficulty in marketing and distributing products through our current and future distribution
channels.
•We distribute our insurance and wealth management products through a variety of distribution channels, including brokers,
independent agents, broker-dealers, banks, wholesalers, affinity partners, other third-party organizations and our own sales
force in Asia. We generate a significant portion of our business through individual third-party arrangements. We periodically
negotiate provisions and renewals of these relationships, and there can be no assurance that such terms will remain
acceptable to us or relevant third parties. An interruption in our continuing relationship with certain of these third parties could
significantly affect our ability to market our products and could have a material adverse effect on our business, results of
operations and financial condition.
Model risk may arise from the inappropriate use or interpretation of models or their output, or the use of deficient
models, data or assumptions.
•We rely on highly complex models to support the various operations such as underwriting, pricing, valuation, risk
measurement, and for input on decision-making. Consequently, the risk of inappropriate use or interpretation of our models
or their output, or the use of deficient or outdated models, could have a material adverse effect on our business.
Fraud risks may arise from incidents caused by many internal and external threats.
•As a major financial institution, Manulife is subject to fraud risk stemming from internal and external threats. It is impossible
to eliminate all fraud risk; however, having an effective company-wide Anti-Fraud Program to guide the organization on
minimum required controls, as outlined by the Global Anti-Fraud Standard, will maximize the likelihood that fraud will be
prevented or detected in a timely manner and will create a strong deterrent to fraudulent activities such as account takeover,
bank, claims, distribution, underwriting, and others. The Anti-Fraud Office within Compliance is responsible for Second Line
governance and oversight of global fraud risks. Despite these efforts, Manulife may not be successful in preventing or timely
detecting fraud, which could result in business disruption or financial losses, either due to the fraud itself, or from measures
Manulife adopts to mitigate fraudulent activity. In addition to the risk of loss, Manulife could face legal actions and the loss of
customer and market confidence from fraud events.
Contracted third parties may fail to deliver against contracted activities.
•We rely on third parties to perform a variety of activities on our behalf, and failure of our most significant third parties to meet
their contracted obligations may impact our ability to meet our strategic objectives or may directly impact our customers.
Third-party governance processes are in place that seek to ensure that appropriate due diligence is conducted at time of
contracting, and ongoing third-party monitoring activities are in place that seek to ensure that the contracted services are
being fulfilled to satisfaction but we may nevertheless be unable to mitigate all possible failures.
Damage to the natural environment may arise related to our business operations, owned property or commercial
mortgage loan portfolio.
•Environmental risk may originate from investment properties that are subject to natural or human-made environmental risk.
Real estate assets may be owned, leased and/or managed, as well as mortgaged by Manulife and we might enter into the
chain of liability due to foreclosure ownership when in default.
•Liability under environmental protection laws resulting from our commercial mortgage loan portfolio and owned property
(including commercial real estate, timberland and farmland properties) may adversely impact our reputation, results of
operations and financial condition. Under applicable laws, contamination of a property with hazardous materials or
substances may give rise to a lien on the property to secure recovery of the costs of cleanup. In some instances, this lien
has priority over the lien of an existing mortgage encumbering the property. The environmental risk may result from on-site
or off-site (adjacent) due to migration of regulated pollutants or contaminants with financial or reputational environmental risk
and liability consequences by virtue of strict liability. Environmental risk could also arise from natural disasters (e.g., climate
change, weather, fire, earthquake, floods, and pests) or human activities (use of chemicals or pesticides) conducted within
the site or when impacted from adjacent sites.
•Additionally, as lender, we may incur environmental liability (including without limitation liability for cleanup, remediation and
damages incurred by third parties) similar to that of an owner or operator of the property, if we or our agents exercise
| 78 | |
sufficient control over the operations at the property. We may also have liability as the owner and/or operator of real estate
for environmental conditions or contamination that exist or occur on the property or affecting other property.
•Across our portfolio of investment properties, we seek to ensure appropriate levels of insurance are maintained in line with
industry standards. These policies often include protections against physical and/or operational damage related to various
environmental risks. Should the availability of such insurance policies become more limited or not reasonably commercially
available, there may be an increased risk of loss for environmental related damages on our portfolio.
Pandemics, epidemics or infectious disease outbreaks, and the economic, legal, regulatory, tax and other responses to
such pandemics, epidemics, or infectious disease outbreaks, could have a material adverse effect on our business,
results of operations and financial condition.
•We purchase reinsurance protection on certain risks underwritten or assumed by our various insurance businesses. As
either a direct or indirect result of a pandemic, epidemic or infectious disease outbreaks, we may find reinsurance more
difficult or costly to obtain.
•In pricing or repricing of new business, the impact of any pandemic, epidemic or infectious disease outbreaks related
changes may be compounded with or offset by other pricing inputs. These inputs include assumption changes (e.g.,
reinsurance, interest rates, morbidity, mortality, expense, lapse, and surrender changes), business considerations related to
retaining specific market share or client business and regulatory restrictions impacting the approval process for price
changes.
•Market volatility and stressed conditions resulting from pandemic, epidemic or infectious disease outbreaks could result in
additional cash and collateral demands primarily from changes to policyholder termination or renewal rates, withdrawals of
customer deposit balances, borrowers renewing or extending their loans when they mature, derivative settlements or
collateral demands, reinsurance settlements or collateral demands, and our willingness to support the local solvency
position of our subsidiaries. Such an environment could also limit our access to capital markets. Sustained global economic
uncertainty could also result in adverse credit rating changes which in turn could result in more costly or limited access to
funding sources. While we currently have a variety of sources of liquidity including cash balances, short-term investments,
government and highly rated corporate bonds, and access to contingent liquidity facilities, there can be no assurance that
these sources will provide us with sufficient liquidity on commercially reasonable terms in the future.
•Pandemics, epidemics, or infectious disease outbreaks may result in further increases in the risks outlined in the “Risk
Management and Risk Factors” section of this document, including strategic, market, liquidity, insurance, model, business
continuity, legal, regulatory, reputational, operational, and technology and cyber risks.
Technology & Cyber Risk
Technology & cyber risk refers to the potential for loss or disruption arising from failures in technology systems or from
unauthorized access, misuse, or attacks on information assets. These risks encompass system outages, data breaches, and
operational disruptions caused by factors such as hardware or software failures, human error, cyber-attacks, or vulnerabilities in
third-party services. As we rely on secure and resilient technology to support our insurance and investment operations, protect
customer and policyholder information, and deliver consistent service, any significant disruption or compromise could affect our
ability to operate effectively, safeguard sensitive information, and maintain customer trust. The evolving nature of cyber threats,
including the use of advanced techniques and emerging technologies, adds complexity to managing these risks and requires
ongoing investment in security controls, monitoring, and resilience measures.
Technology and Cyber Risk Management Strategy
Our global framework for managing technology and cyber risks is supported by enterprise-wide programs that establish
governance, policies, standards, and controls to protect our information assets and systems. These programs are guided by
dedicated leadership, including the Chief Information Security Officer, Chief Technology Officer, Chief Information Risk Officer,
and Chief Privacy Officer, who provide strategic direction and oversight.
Risk is managed collaboratively across business, technology, and oversight teams. This includes identifying, monitoring, and
reporting critical exposures; maintaining risk profiles and dashboards; advising on emerging threats and regulatory
developments; and embedding sound practices into sourcing, outsourcing, and vendor management.
Technology risk management focuses on ensuring the availability, performance, recovery, capacity, and integrity of new and
existing systems that support our core business operations. This includes proactive monitoring, incident response planning, and
infrastructure safeguards to minimize disruption and maintain operational resilience.
Cybersecurity activities focus on managing confidentiality, integrity, and availability risks through access control, system security,
vulnerability management, and operational safeguards. These efforts are supported by ongoing security awareness training for
all employees. As emerging technologies such as artificial intelligence and automation advance, we continue to strengthen our
resilience and adapt our risk management practices to proactively address new and emerging threats.
The Board’s Risk Committee regularly reviews the effectiveness of these programs and engages in discussions to ensure the
Company is well-positioned to identify and respond to technology and cybersecurity risks.
79 | 2025 Annual Report | Management’s Discussion and Analysis |
Technology and Cyber Risk Factors
A cybersecurity breach involving our systems or those of a third party could result in unauthorized access to sensitive
information, disruption of operations, financial loss, regulatory exposure, and reputational harm.
•We and our vendors, like other commercial entities, have been, and will likely continue to be, subject to a variety of forms of
cyberattacks with the objective of gaining unauthorized access to our systems and data, or disrupting our operations.
•The Company may not always be able to anticipate or implement effective measures to prevent all disruptions from privacy
and security breaches. Threat actors continue to evolve in both sophistication and scale, employing techniques such as
malware, phishing, denial-of-service, and social engineering. These attacks may originate from criminal organizations,
activist groups, or state-sponsored entities, and the increasing use of AI technologies will add velocity and complexity to the
threat landscape. Such incidents can target our systems directly or exploit vulnerabilities in third-party services to gain
access or cause disruption.
•We manage these risks through layered security controls, threat intelligence, proactive monitoring, incident response
planning, and infrastructure safeguards. Our enterprise-wide Information Risk Management Program provides governance
and oversight, supported by dedicated leadership. While we believe our defenses are strong, there can be no assurance
that these countermeasures will be successful in every instance. We also maintain cyber risk insurance; however, coverage
may not extend to all costs associated with the financial, operational, and reputational consequences of personal,
confidential, or proprietary information being compromised.
Technology system failures, outages, or disruptions to facilities may impact business operations and continuity.
•Technology is embedded in nearly every aspect of our business and is central to our strategy for serving customers.
Disruptions caused by system failures, human error, or external events such as natural disasters, pandemics, or
infrastructure outages (including electric grids, undersea cables, and satellite communications), may impair our ability to
operate effectively and maintain business continuity. Although our facilities and operations are distributed globally, such
events can restrict access to key locations and disrupt the ability of employees, partners, and vendors to support critical
functions.
•We support operational resilience through redundancy in critical systems, proactive monitoring, incident response planning,
infrastructure safeguards, and regular testing of recovery capabilities. These measures enable us to operate through, and
recover from, unpredictable events. An interruption to our operations may subject us to regulatory sanctions and legal
claims, lead to a loss of customers, assets and revenues, or otherwise adversely affect us from a financial, operational and
reputational perspective.
Changes in cybersecurity or privacy regulations may increase our compliance costs, limit our liability to gain insight
from data and lead to increased scrutiny.
•We collect, process, store, share, disclose and use personal information from and about our customers, employees and plan
participants as well as our website, mobile and application users. Any actual or perceived failure by us or our service
providers to comply with our privacy policies, privacy-related obligations to customers, employees or third parties, data
disclosure consent obligations and data protection obligations may result in governmental enforcement actions, litigation or
public statements critical of us. Such actual or perceived failures could also cause our customers, suppliers and employees
to lose trust in us, which may have an adverse effect on our business.
•Restrictions on data collection and use may limit opportunities to gain business insights useful to running our business and
offering innovative products and services. We are subject to numerous regulations regarding the privacy and security of
personal information. These laws vary widely by jurisdiction. Ongoing global developments in AI regulation will continue to
increase and require attention and investments. These regulations, which are designed to protect privacy and prevent
misuse of personal information, are complex and change frequently. The public, consumer and privacy advocates,
legislatures and regulators are increasingly concerned about the collection, use, sharing and cross-border transfer of
personal data, especially personal information that may be deemed sensitive, such as financial information, behavioral data,
biometric data and health data. Additional legislative or regulatory action could further regulate our collection, use, sharing
and other processing of personal data. Changes in existing cybersecurity and privacy regulations or the enactment of new
regulations may increase our compliance costs and failure to comply with these regulations may lead to reputational
damage, fines or civil damages and increased regulatory scrutiny and oversight.
Our use of artificial intelligence is subject to the same risks inherent in other technology systems.
•We intend to avail ourselves of the benefits, insights and efficiencies that are available through the use of AI. To this end, we
may pay and bear expenses and fees associated with developing, using and maintaining such technology.
•Our use of AI may yield inaccurate, incomplete, or ineffective results, which could lead to operational and reputational harm
to the extent that we rely on such results. We test for hallucinations and monitor outcomes but given the highly flexible
nature of AI it is impossible to prevent all unexpected outcomes. In the event of unexpected outcomes with AI we have
processes to respond to those failures and incidents.
•AI is a new and rapidly evolving technology so we may implement it incorrectly or embed it into business processes that are
not well suited for digitization resulting in processing errors or other failures. Our investments in AI may not produce the
value expected and we may experience delays in implementing AI technology due to insufficient talent, non-performant
| 80 | |
technology or other factors; our vendors may not be able to provide us with the solutions required to achieve our AI
objectives. We have established a governance framework, AI councils and related processes to govern our use of AI, and
manage risks related thereto.
Evolving Risks
The identification and assessment of our external environment for evolving risks is an important aspect of our ERM Framework,
as these risks could have the potential to have a material adverse impact on our operations and/or business strategies.
Our evolving risk framework facilitates the ongoing identification, assessment and monitoring of evolving risks, and includes:
maintaining a process for the ongoing discussion and evaluation of such risks with management; reviewing and validating
evolving risks with the ERC; developing and executing on responses to each evolving risk based on materiality and prioritization;
and monitoring and reporting on evolving risks on a regular basis to the Board’s Risk Committee.
Additional Risk Factors That May Affect Future Results
Other factors that may affect future results include changes in government trade policy; monetary policy or fiscal policy, including
interest rates policy from central banks; geopolitical conditions and developments in or affecting the countries in which we
operate; technological changes; public infrastructure disruptions; changes in consumer spending and saving habits; the possible
impact on local, national or global economies from public health or natural disaster emergencies; and international conflicts and
other developments including those relating to terrorist activities. Although we take steps to anticipate and minimize risks in
general, unforeseen future events may have a negative impact on our business, financial condition and results of operations.
We caution that the preceding discussion of risks that may affect future results is not exhaustive. When relying on our forward-
looking statements to make decisions with respect to our Company, investors and others should carefully consider the foregoing
risks, as well as other uncertainties and potential events, and other external and company-specific risks that may adversely affect
the future business, financial condition or results of operations of our Company.
81 | 2025 Annual Report | Management’s Discussion and Analysis |
10. Capital Management Framework
Manulife seeks to manage its capital with the objectives of:
•Operating with sufficient capital to be able to honour all commitments to its policyholders and creditors with a high degree of
confidence;
•Retaining the ongoing confidence of regulators, policyholders, rating agencies, investors and other creditors in order to
ensure access to capital markets; and
•Optimizing return on capital to meet shareholders’ expectations subject to constraints and considerations of adequate levels
of capital established to meet the first two objectives.
Capital is managed and monitored in accordance with the Capital Management Policy. The Policy is reviewed and approved by
the Board annually and is integrated with the Company’s risk and financial management frameworks. It establishes guidelines
regarding the quantity and quality of capital, internal capital mobility, and proactive management of ongoing and future capital
requirements.
Our capital management framework takes into account the requirements of the Company as a whole, as well as the needs of
each of our subsidiaries. Internal capital targets are set above regulatory requirements, and consider a number of factors,
including results of sensitivity and stress testing and our own risk assessments, as well as business needs. We monitor against
these internal targets and initiate actions appropriate to achieving our business objectives.
We periodically assess the strength of our capital position under various stress scenarios. The annual Financial Condition Testing
(“FCT”) typically quantifies the financial impact of economic events arising from shocks in public equity and other markets,
interest rates and credit, amongst others. Our 2025 FCT results demonstrate that we would have sufficient assets, under the
various adverse scenarios tested, to discharge our insurance and investment contract liabilities. This conclusion was also
supported by a variety of other stress tests conducted by the Company.
We use an Economic Capital (“EC”) framework to inform our internal view of the level of required capital and available capital.
The EC framework is a key component of the Own Risk and Solvency Assessment process, which is an internal assessment of
an insurer’s risks, capital needs and solvency position, and is used for setting Internal Capital Targets.
Capital management is also integrated into our product planning and performance management practices.
The composition of capital between equity and other capital instruments impacts the financial leverage ratio which is an
important consideration in determining the Company’s financial strength and credit ratings. The Company monitors and
rebalances its capital mix through capital issuances and redemptions.
Financing Activities
Securities Transactions
During 2025, we raised a total of $1.9 billion of debt securities in Canada and the U.S., and $1.0 billion of subordinated debt was
redeemed at par.
($ millions) | Par value | Issued(1) | Redeemed/ Matured(1) |
3.983% MFC Subordinated debenture, issued on May 23, 2025 | $500 | $497 | $- |
4.986% MFC Senior notes, issued on Dec 11, 2025 | US$1,000 | 1,362 | |
2.237% MFC Subordinated debenture, redeemed on May 12, 2025 | $1,000 | - | 1,000 |
Total | $1,859 | $1,000 |
(1)Represents carrying value, net of issuance costs.
Normal Course Issuer Bid
On February 19, 2025, we received approval from the Toronto Stock Exchange (“TSX”) to launch a normal course issuer bid (the
“2025 NCIB”), permitting the purchase for cancellation of up to 51.5 million common shares, representing approximately 3.0% of
common shares outstanding as at February 12, 2025. Purchases under the 2025 NCIB commenced on February 24, 2025, and
may continue until February 23, 2026, when the 2025 NCIB expires, or such earlier date as we complete our purchases.
The 2024 NCIB was announced on February 20, 2024 and subsequently amended on May 7, 2024. We received approval from
the TSX to purchase for cancellation up to 90 million of common shares, representing approximately 5.0% of common shares
outstanding as at February 12, 2024. The 2024 NCIB expired on February 22, 2025.
During the year ended December 31, 2025, we purchased for cancellation 54.4 million common shares for a total cost of $2.4
billion pre-tax, including 48.7 million common shares for a total cost of $2.1 billion pre-tax under the 2025 NCIB, and 5.7 million
common shares for a total cost of $0.2 billion pre-tax under the 2024 NCIB.
1 See “Caution regarding forward looking statements” above.
2 The net redemption of capital instruments consists of the redemption $1.0 billion of subordinated debt, partially offset by the issuance of $0.5 billion of subordinated
debt in 2Q25.
3 The net issuance of securities consists of the issuance of US$1.0 billion senior debt in 4Q25 and the issuance of $0.5 billion subordinated debt in 2Q25, partially
offset by the redemption of $1.0 billion subordinated debt in 2Q25.
| 82 | |
On February 11, 2026, we announced that we are launching a normal course issuer bid (the “2026 NCIB”) permitting the
purchase for cancellation of up to 42 million common shares, representing approximately 2.5% of common shares outstanding
as at January 31, 2026. We have received approval from OSFI for the 2026 NCIB on January 19, 2026. Purchases under the
2026 NCIB are expected to commence in late February, subject to approval from the TSX.1
Consolidated Capital
As at December 31, | 2025 | 2024 |
($ millions) | ||
Non-controlling interests | $1,531 | $1,421 |
Participating policyholders’ equity | 836 | 567 |
Preferred shares and other equity | 6,660 | 6,660 |
Common shareholders’ equity(1) | 43,461 | 44,312 |
Total equity | 52,488 | 52,960 |
Exclude the accumulated other comprehensive gain/(loss) on cash flow hedges | 87 | 119 |
Total equity excluding accumulated other comprehensive gain/(loss) on cash flow hedges | 52,401 | 52,841 |
Post-tax CSM | 22,165 | 19,497 |
Qualifying capital instruments | 6,990 | 7,532 |
Consolidated capital(2) | $81,556 | $79,870 |
(1)Common shareholders’ equity is equal to total shareholders’ equity less preferred shares and other equity.
(2)Consolidated capital does not include $7.7 billion (2024 – $6.6 billion) of MFC senior debt as this form of financing does not meet OSFI’s definition of regulatory
capital at the MFC level. The Company has down-streamed the proceeds from this financing into operating entities in a form that qualifies as regulatory capital at
the subsidiary level.
MFC’s consolidated capital was $81.6 billion as at December 31, 2025, an increase of $1.7 billion compared with $79.9 billion as
at December 31, 2024. The increase was primarily driven by a higher post-tax CSM, partially offset by the net redemption of
capital instruments2 and a decrease in total equity. The decrease in total equity was driven by dividends and common share
buybacks, partially offset by total comprehensive income, which was unfavourably impacted by a stronger Canadian dollar
relative to the U.S. dollar.
Remittance of Capital
As part of its capital management, Manulife promotes internal capital mobility so that MFC has access to funds to meet its
obligations and to optimize capital deployment. Remittances is defined as the cash remitted or made available for distribution to
MFC from its subsidiaries, prior to payment of financing costs, dividends, and other capital deployments. It is a key metric used
by management to evaluate our financial flexibility. In 2025, MFC subsidiaries delivered $6.4 billion in remittances of which Asia
and U.S. operations delivered $2.1 billion and $1.7 billion, respectively. Remittances were $0.6 billion lower than 2024 due to the
favourable impact of market movements in 2024.
Financial Leverage Ratio
MFC’s financial leverage ratio as at December 31, 2025 was 23.9%, a decrease of 0.1 percentage points from 24.0% as at
December 31, 2024. The decrease in the ratio was driven by a higher post-tax CSM and the impact of a stronger Canadian dollar
on foreign currency denominated debt, partially offset by the net issuance of securities3 and a decrease in total equity.
Common Shareholder Dividends
The declaration and payment of shareholder dividends and the amount thereof are at the discretion of the Board and depend
upon various factors, including the results of operations, financial conditions, future prospects of the Company, dividend payout
ratio, and taking into account regulatory restrictions on the payment of shareholder dividends.
Common Shareholder Dividends Paid
For the years ended December 31, | 2025 | 2024 |
$ per share | ||
Dividends paid | $1.76 | $1.60 |
1 Includes MLI, John Hancock Life Insurance Company (U.S.A.), John Hancock Life & Health Insurance Company, and John Hancock Life Insurance Company of
New York.
83 | 2025 Annual Report | Management’s Discussion and Analysis |
The Company offers a Dividend Reinvestment Program (“DRIP”) whereby shareholders may elect to automatically reinvest
dividends in the form of MFC common shares instead of receiving cash. The offering of the program and its terms of execution
are subject to the Board’s discretion.
During 2025, the required common shares in connection with the DRIP were purchased on the open market with no applicable
discount.
Regulatory Capital Position
MFC and MLI are regulated by OSFI and are subject to consolidated risk based capital requirements. Manulife monitors and
manages its consolidated capital in compliance with the OSFI LICAT guideline. Under this regime, our available capital and other
eligible capital resources are measured against a required amount of risk capital determined in accordance with the guideline.
For regulatory reporting purposes under the LICAT framework, consolidated capital is adjusted for various additions or
deductions to capital as mandated by the guidelines defined by OSFI.
Manulife’s operating activities are conducted within MLI and its subsidiaries. MLI’s LICAT ratio was 136% as at December 31,
2025, compared with 137% as at December 31, 2024. The decrease in the ratio was driven by dividends and common share
buybacks, the acquisition of Comvest, the impact of the new segregated fund capital requirements effective January 1, 2025, as
well as the net redemption of subordinated debt, partially offset by the positive impact of earnings and the CSM, the RGA U.S.
Reinsurance Transaction and the net impact of updates to actuarial methods and assumptions.
MFC’s LICAT ratio was 125% as at December 31, 2025, compared with 124% as at December 31, 2024, with the change driven
by similar factors that impacted the movement in MLI’s LICAT ratio. The difference between the MLI and MFC ratios is largely
due to $6.3 billion (2024 – $6.6 billion) of MFC senior debt outstanding that does not qualify as available capital at the MFC level,
but based on the form it was down-streamed to MLI, it qualifies as regulatory capital at the MLI level.
The LICAT ratios as at December 31, 2025, resulted in excess capital of $24.1 billion over OSFI’s supervisory target ratio of
100% for MLI, and $23.7 billion over OSFI’s regulatory minimum target ratio of 90% for MFC (no supervisory target is applicable
to MFC). In addition, all MLI’s subsidiaries maintain capital levels in excess of local requirements.
Credit Ratings
Manulife’s operating companies have strong financial strength ratings from credit rating agencies. These ratings are important
factors in establishing the competitive position of insurance companies and maintaining public confidence in products being
offered. Maintaining strong ratings on debt and capital instruments issued by MFC and its subsidiaries allows us to access
capital markets at competitive pricing levels. Should these credit ratings decrease materially, our cost of financing may increase
and our access to funding and capital through capital markets could be reduced.
During 2025, S&P, Morningstar DBRS, Fitch, and AM Best Company (“AM Best”) maintained their assigned ratings of MFC and
its primary insurance operating companies. On September 19, 2025, Moody’s upgraded the financial strength ratings for
Manulife’s primary insurance operating companies1 to Aa3 from A1. As indicated in Moody’s press release, the upgrade reflects
improved profitability, strong capital, and reduced exposure to lower ROE and legacy businesses.
The following table summarizes the financial strength ratings of MLI and certain of its subsidiaries as at January 31, 2026.
Financial Strength Ratings
Subsidiary | Jurisdiction | S&P | Moody’s | Morningstar DBRS | Fitch | AM Best |
The Manufacturers Life Insurance Company | Canada | AA- | Aa3 | AA | AA | A+ (Superior) |
John Hancock Life Insurance Company (U.S.A.) | United States | AA- | Aa3 | Not Rated | AA | A+ (Superior) |
Manulife (International) Limited | Hong Kong | AA- | Not Rated | Not Rated | Not Rated | Not Rated |
Manulife Life Insurance Company | Japan | A+ | Not Rated | Not Rated | Not Rated | Not Rated |
Manulife (Singapore) Pte. Ltd. | Singapore | AA- | Not Rated | Not Rated | Not Rated | Not Rated |
As at January 31, 2026, S&P, Moody’s, Morningstar DBRS, Fitch, and AM Best had a stable outlook on these ratings. The S&P
rating and outlook for Manulife Life Insurance Company are constrained by the sovereign rating on Japan (A+/Stable).
| 84 | |
11. Critical Actuarial and Accounting Policies
The preparation of Consolidated Financial Statements in conformity with IFRS requires management to make judgments,
estimates and assumptions that affect the application of accounting policies and the reported amounts of assets and liabilities,
and the disclosure of contingent assets and liabilities as at the date of the Consolidated Financial Statements, and the reported
amounts of insurance service, investment result, and other revenues and expenses during the reporting periods. Actual results
may differ from these estimates. The most significant estimation processes relate to evaluating assumptions used in measuring
insurance and investment contract liabilities and reinsurance contract held liabilities, assessing assets for impairment,
determining of pension and other post-employment benefit obligation and expense assumptions, determining income taxes and
uncertain tax positions, and estimating fair values of certain invested assets. Estimates and underlying assumptions are
reviewed on an ongoing basis. Revisions to accounting estimates are recognized in the year in which the estimates are revised
and in any future years affected. Although some variability is inherent in these estimates, management believes that the amounts
recorded are appropriate. The material accounting policies used and the most significant judgments made by management in
applying these accounting policies in the preparation of the 2025 Annual Consolidated Financial Statements are described in
note 1 to the Consolidated Financial Statements.
Critical Actuarial Policies – Insurance and Investment Contract Liabilities
Insurance contract liabilities are determined under IFRS 17 “Insurance Contracts”, which establishes principles for the
recognition, measurement, presentation and disclosure of insurance contracts within the scope of the Standard. The objective of
IFRS 17 is to ensure that an entity provides relevant information that faithfully represents those contracts. This information
provides a basis for users of financial statements to assess the effect that insurance contracts have on the entity’s financial
position, financial performance, and cash flows.
Insurance contract liabilities include the fulfilment cash flows and the contractual service margin. The fulfilment cash flows
comprise:
•An estimate of future cash flows
•An adjustment to reflect the time value of money and the financial risk related to the future cash flows if not included in the
estimate of future cash flows
•A risk adjustment for non-financial risk
Estimates of future cash flows including any adjustments to reflect the time value of money and financial risk represent the
estimated value of future policyholder benefits and settlement obligations to be paid over the term remaining on in-force policies,
including costs of servicing the policies, reduced by any future amounts paid by policyholders to the Company for their policies.
The determination of estimates of future cash flows involves the use of estimates and assumptions. To determine the best
estimate amount, assumptions must be made for several key factors, including future mortality and morbidity rates, rates of
policy termination and premium persistency, operating expenses, and certain taxes (other than income taxes). Further
information on best estimate assumptions is provided in the “Best Estimate Assumptions” section below.
To reflect the time value of money and financial risk, estimates of future cash flows are generally discounted using risk-free yield
curves adjusted by an illiquidity premium to reflect the liquidity characteristics of the liabilities. The Company primarily uses a
deterministic projection using best estimate assumptions to determine the present value of future cash flows. However, where
there are financial guarantees such as universal life minimum crediting rates guarantees, participating life zero dividend floor
implicit guarantees and variable annuities guarantees, a stochastic approach to capture the asymmetry of the risk is used. For
the stochastic approach the cash flows are both projected and discounted at scenario specific rates calibrated on average to be
the risk-free yield curves adjusted for illiquidity. The Company disaggregates insurance finance income or expenses on insurance
contracts issued for most of its group of insurance contracts between profit or loss and other comprehensive income (“OCI”). The
impact of changes in market interest rates on the value of the life insurance and related reinsurance assets and liabilities is
reflected in OCI to minimize accounting mismatches between the accounting for insurance assets and liabilities and supporting
financial assets.
Risk adjustments for non-financial risk represent the compensation an entity requires for bearing the uncertainty about the
amount and timing of the cash flows that arises from non-financial risk as the entity fulfills insurance contracts. The risk
adjustment considers insurance, lapse and expense risks, includes both favourable and unfavourable outcomes, and reflects
diversification benefits from the insurance contracts issued. The Company has estimated the risk adjustment using a margin
approach. This approach applies a margin for adverse deviation, typically in terms of a percentage of best estimate assumptions,
where future cash flows are uncertain. The resulting cash flows are discounted at rates consistent with the best estimate cash
flows to arrive at the total risk adjustment. The ranges of these margins are set by the Company and reviewed periodically. The
risk adjustment for non-financial risk for insurance contracts corresponds to a 90% – 95% confidence level for all segments. The
risk adjustment for non-financial risk leads to higher insurance contract liabilities, but increases the income recognized in later
periods as the risk adjustment releases as the non-financial risk on policies decreases.
The contractual service margin represents the present value of unearned profits the entity will recognize as services are provided
in the future.
85 | 2025 Annual Report | Management’s Discussion and Analysis |
Total net insurance contract liabilities were $540.3 billion as at December 31, 2025 (December 31, 2024 – $522.8 billion),
reflecting business growth and foreign exchange impacts.
Best Estimate Assumptions
We follow established processes to determine the assumptions used in the determination of insurance contract liabilities. The
nature of each risk factor and the process for setting the assumptions used in the determination are discussed below.
Mortality
Mortality relates to the occurrence of death. Mortality assumptions are based on our internal as well as industry past and
emerging experience and are differentiated by sex, underwriting class, policy type and geographic market. We make
assumptions about future mortality improvements using historical experience derived from population data. Reinsurance is used
to offset some of our direct mortality exposure on in-force life insurance policies with the impact of the reinsurance separately
accounted for in our reinsurance contract assets or liabilities. Actual mortality experience is monitored against these assumptions
separately for each business. The results are favourable where mortality rates are lower than assumed for life insurance and
where mortality rates are higher than assumed for payout annuities and long-term care. Overall 2025 experience was
unfavourable (2024 – favourable) when compared with our assumptions.
Morbidity
Morbidity relates to the occurrence of accidents and sickness for the insured risks. Morbidity assumptions are based on our
internal as well as industry past and emerging experience and are established for each type of morbidity risk and geographic
market. For our John Hancock Long Term Care business we make assumptions about future morbidity changes. Actual morbidity
experience is monitored against these assumptions separately for each business. Our morbidity risk exposure relates to future
expected claims costs for long-term care insurance, as well as for group benefits and certain individual health insurance products
we offer. Overall 2025 experience was favourable (2024 – favourable) when compared with our assumptions.
Policy Termination and Premium Persistency
Policy termination includes lapses and surrenders, where lapses represent the termination of policies due to non-payment of
premiums and surrenders represent the voluntary termination of policies by policyholders. Premium persistency represents the
level of ongoing deposits on contracts where there is policyholder discretion as to the amount and timing of deposits. Policy
termination and premium persistency assumptions are primarily based on our recent experience adjusted for expected future
conditions. Assumptions reflect differences by type of contract within each geographic market and actual experience is monitored
against these assumptions separately for each business. Overall 2025 experience was unfavourable (2024 – unfavourable)
when compared with our assumptions.
Directly Attributable Expenses and Taxes
Directly attributable operating expense assumptions reflect the projected costs of maintaining and servicing in-force policies,
including associated directly attributable overhead expenses. The expenses are derived from internal cost studies and are
projected into the future with an allowance for inflation. For some developing businesses, there is an expectation that unit costs
will decline as these businesses mature. Actual expenses are monitored against assumptions separately for each business.
Overall maintenance expenses for 2025 were unfavourable (2024 – unfavourable) when compared with our assumptions. Taxes
reflect assumptions for future premium taxes and other non-income related taxes.
Experience Adjusted Products
Where policies have features that allow the impact of changes in experience to be passed on to policyholders through policy
dividends, experience rating refunds, credited rates or other adjustable features, the projected policyholder benefits are adjusted
to reflect the projected experience. Minimum contractual guarantees and other market considerations are considered in
determining the policy adjustments.
Sensitivity of Earnings to Changes in Assumptions
The following tables present information on how reasonably possible changes in assumptions made by the Company on
insurance contracts’ non-economic risk variables and certain economic risk variables impact contractual service margin, net
income attributed to shareholders, other comprehensive income attributed to shareholders, and total comprehensive income
attributed to shareholders. For non-economic risk variables, the impacts are shown separately gross and net of the impacts of
reinsurance contracts held. The method used for deriving sensitivity information and significant assumptions made did not
change from the previous period.
The analysis is based on a simultaneous change in assumptions across all businesses and holds all other assumptions constant.
In practice, experience for each assumption will frequently vary by geographic market and business, and assumption updates
are specifically made on a business and geographic basis. Actual results can differ materially from these estimates for a variety
| 86 | |
of reasons including the interaction among these factors when more than one changes, actual experience differing from the
assumptions, changes in business mix, effective tax rates, and the general limitations of our internal models.
Potential impact on contractual service margin, net income attributed to shareholders, other comprehensive income
attributed to shareholders, and total comprehensive income attributed to shareholders arising from changes to non-
economic assumptions(1)
As at December 31, 2025 | CSM net of NCI | Net income attributed to shareholders | Other comprehensive income attributed to shareholders | Total comprehensive income attributed to shareholders | ||||
($ millions, post-tax except CSM) | Gross | Net | Gross | Net | Gross | Net | Gross | Net |
Policy related assumptions | ||||||||
2% adverse change in future mortality rates(2),(3),(5) | ||||||||
Portfolios where an increase in rates increases insurance contract liabilities | $(700) | $(200) | $(700) | $(200) | $100 | $- | $(600) | $(200) |
Portfolios where a decrease in rates increases insurance contract liabilities | (300) | (400) | 200 | (100) | 100 | 100 | 300 | - |
5% adverse change in future morbidity rates(4),(5),(6) (incidence and termination) | (2,200) | (1,800) | (3,000) | (2,500) | 600 | 500 | (2,400) | (2,000) |
10% change in future policy termination rates(3),(5) | ||||||||
Portfolios where an increase in rates increases insurance contract liabilities | (900) | (800) | (100) | (100) | (200) | (200) | (300) | (300) |
Portfolios where a decrease in rates increases insurance contract liabilities | (800) | (600) | (700) | (400) | 500 | 300 | (200) | (100) |
5% increase in future expense levels | (600) | (600) | (100) | (100) | 100 | 100 | - | - |
As at December 31, 2024 | CSM net of NCI | Net income attributed to shareholders | Other comprehensive income attributed to shareholders | Total comprehensive income attributed to shareholders | ||||
($ millions, post-tax except CSM) | Gross | Net | Gross | Net | Gross | Net | Gross | Net |
Policy related assumptions | ||||||||
2% adverse change in future mortality rates(2),(3),(5) | ||||||||
Portfolios where an increase in rates increases insurance contract liabilities | $(700) | $(200) | $(700) | $(300) | $200 | $100 | $(500) | $(200) |
Portfolios where a decrease in rates increases insurance contract liabilities | (100) | (600) | - | - | 100 | 200 | 100 | 200 |
5% adverse change in future morbidity rates(4),(5),(6) (incidence and termination) | (2,200) | (1,800) | (3,000) | (2,700) | 700 | 600 | (2,300) | (2,100) |
10% change in future policy termination rates(3),(5) | ||||||||
Portfolios where an increase in rates increases insurance contract liabilities | (700) | (600) | (100) | (100) | (200) | (200) | (300) | (300) |
Portfolios where a decrease in rates increases insurance contract liabilities | (900) | (700) | (700) | (400) | 400 | 300 | (300) | (100) |
5% increase in future expense levels | (600) | (600) | (100) | (100) | 100 | 100 | - | - |
(1)The participating policy funds are largely self-supporting and experience gains or losses would generally result in changes to future dividends reducing the direct
impact on the CSM and shareholder income.
(2)An increase in mortality rates will generally increase insurance contract liabilities for life insurance contracts, whereas a decrease in mortality rates will generally
increase insurance contract liabilities for policies with longevity risk such as payout annuities.
(3)The sensitivity is measured for each direct insurance portfolio net of the impacts of any reinsurance held on the policies within that portfolio to determine if the
overall insurance contract liabilities increased.
(4)No amounts related to morbidity risk are included for policies where the insurance contract liability provides only for claims costs expected over a short period,
generally less than one year, such as Group Life and Health.
(5)The impacts of the sensitivities on LTC for morbidity, mortality and lapse do not assume any offsets from the Company’s ability to contractually raise premium rates
in such events, subject to state regulatory approval. In practice, we would plan to file for rate increases equal to the amount of deterioration resulting from the
sensitivity.
(6)This includes a 5% deterioration in incidence rates and a 5% deterioration in claim termination rates.
87 | 2025 Annual Report | Management’s Discussion and Analysis |
Potential impact on contractual service margin, net income attributed to shareholders, other comprehensive income
attributed to shareholders, and total comprehensive income attributed to shareholders arising from changes to non-
economic assumptions on Long Term Care(1)
As at December 31, 2025 | CSM net of NCI | Net income attributed to shareholders | Other comprehensive income attributed to shareholders | Total comprehensive income attributed to shareholders | ||||
($ millions, post-tax except CSM) | Gross | Net | Gross | Net | Gross | Net | Gross | Net |
Policy related assumptions | ||||||||
2% adverse change in future mortality rates(2),(3) | $(300) | $(300) | $- | $- | $- | $- | $- | $- |
5% adverse change in future morbidity incidence rates(2),(3) | (1,500) | (1,300) | (400) | (300) | 200 | 200 | (200) | (100) |
5% adverse change in future morbidity claims termination rates(2),(3) | (1,500) | (1,300) | (1,200) | (1,000) | 400 | 400 | (800) | (600) |
10% adverse change in future policy termination rates(2),(3) | (400) | (300) | - | - | - | - | - | - |
5% increase in future expense levels(3) | (100) | (100) | - | - | - | - | - | - |
As at December 31, 2024 | CSM net of NCI | Net income attributed to shareholders | Other comprehensive income attributed to shareholders | Total comprehensive income attributed to shareholders | ||||
($ millions, post-tax except CSM) | Gross | Net | Gross | Net | Gross | Net | Gross | Net |
Policy related assumptions | ||||||||
2% adverse change in future mortality rates(2),(3) | $(300) | $(300) | $- | $- | $- | $- | $- | $- |
5% adverse change in future morbidity incidence rates(2),(3) | (1,400) | (1,300) | (500) | (400) | 200 | 200 | (300) | (200) |
5% adverse change in future morbidity claims termination rates(2),(3) | (1,400) | (1,300) | (1,300) | (1,100) | 500 | 400 | (800) | (700) |
10% adverse change in future policy termination rates(2),(3) | (400) | (400) | - | - | 100 | 100 | 100 | 100 |
5% increase in future expense levels(3) | (100) | (100) | - | - | - | - | - | - |
(1)The potential impacts on CSM were translated from US$ at 1.3707 (2024 – 1.4382) and the potential impacts on net income attributed to shareholders, OCI
attributed to shareholders and total comprehensive income attributed to shareholders were translated from US$ at 1.3939 (2024 – 1.3987).
(2)The impacts of the sensitivities on LTC for morbidity, mortality and lapse do not assume any offsets from the Company’s ability to contractually raise premium rates
in such events, subject to state regulatory approval. In practice, we would plan to file for rate increases equal to the amount of deterioration resulting from the
sensitivities.
(3)The impact of favourable changes to all the sensitivities is relatively symmetrical.
Potential impact on contractual service margin, net income attributed to shareholders, other comprehensive income
attributed to shareholders, and total comprehensive income attributed to shareholders arising from changes to certain
economic financial assumptions used in the determination of insurance contract liabilities(1)
As at December 31, 2025 ($ millions, post-tax except CSM) | CSM net of NCI | Net income attributed to shareholders | Other comprehensive income attributed to shareholders | Total comprehensive income attributed to shareholders | ||||
Financial assumptions | ||||||||
10 basis point reduction in ultimate spot rate | $(300) | $- | $(200) | $(200) | ||||
50 basis point increase in interest rate volatility(2) | (100) | - | - | - | ||||
50 basis point increase in non-fixed income return volatility(2) | (100) | - | - | - | ||||
As at December 31, 2024 ($ millions, post-tax except CSM) | CSM net of NCI | Net income attributed to shareholders | Other comprehensive income attributed to shareholders | Total comprehensive income attributed to shareholders | ||||
Financial assumptions | ||||||||
10 basis point reduction in ultimate spot rate | $(300) | $- | $(200) | $(200) | ||||
50 basis point increase in interest rate volatility(2) | (100) | - | - | - | ||||
50 basis point increase in non-fixed income return volatility(2) | (100) | - | - | - | ||||
(1)Note that the impact of these assumptions is not linear.
(2)Used in the determination of insurance contract liabilities with financial guarantees. This includes universal life minimum crediting rate guarantees, participating life
zero dividend floor implicit guarantees, and variable annuities guarantees, where a stochastic approach is used to capture the asymmetry of the risk.
Review of Actuarial Methods and Assumptions
The Company performs a comprehensive review of actuarial methods and assumptions annually. The review is designed to
reduce the Company’s exposure to uncertainty by ensuring assumptions for liability risks remain appropriate. This is
accomplished by monitoring experience and updating assumptions that represent a best estimate of expected future experience,
1 Fulfilment cash inflows include an estimate of future cash flows; an adjustment to reflect the time value of money and the financial risk related to future cash flows if
not included in the estimate of future cash flows; and a risk adjustment for non-financial risk. Additional information on fulfilment cash flows can be found in note 6
of our 2025 Annual Consolidated Financial Statements.
| 88 | |
and maintaining a risk adjustment that is appropriate for the risks assumed. While the assumptions selected represent the
Company’s best estimates and assessment of risk, the ongoing monitoring of experience and changes in the economic
environment are likely to result in future changes to the actuarial assumptions, which could materially impact the insurance
contract liabilities. The changes implemented from the review are generally implemented in the third quarter of each year, though
updates may be made outside the third quarter in certain circumstances.
2025 Review of Actuarial Methods and Assumptions
The completion of the 2025 annual review of actuarial methods and assumptions resulted in a decrease in pre-tax fulfilment cash
flows1 of $605 million, excluding the portion related to non-controlling interests. These updates resulted in a decrease in pre-tax
net income attributed to shareholders of $244 million ($216 million post-tax), a decrease in pre-tax net income attributed to
participating policyholders of $88 million ($67 million post-tax), an increase in CSM of $1,080 million, a decrease in pre-tax other
comprehensive income attributed to shareholders of $52 million ($73 million post-tax), and a decrease in pre-tax other
comprehensive income attributed to participating policyholders of $91 million ($70 million post-tax).
Impact of updates to actuarial methods and assumptions on pre-tax fulfilment cash flows(1)
For the year ended December 31, 2025 | |
($ millions) | Total |
Hong Kong health insurance product reserving approach | $(463) |
Methodology and other updates | (207) |
Lapse and policyholder behaviour updates | 181 |
Long-term care triennial review | (77) |
Mortality and morbidity updates | (39) |
Impact of updates to actuarial methods and assumptions, on pre-tax fulfilment cash flows | $(605) |
(1)Excludes the portion related to non-controlling interests of $116 million. The impact of updates to actuarial methods and assumptions on pre-tax fulfilment cash
flows, including the portion related to non-controlling interests, would be $(489) million.
Impact of updates to actuarial methods and assumptions on pre-tax net income attributed to shareholders, pre-tax net
income attributed to participating policyholders, OCI and CSM(1)
For the year ended December 31, 2025 | |
($ millions) | Total |
Portion recognized in pre-tax net income (loss) attributed to: | |
Participating policyholders | $(88) |
Shareholders | (244) |
(332) | |
Portion increasing (decreasing) CSM | 1,080 |
Portion recognized in pre-tax OCI attributed to: | |
Participating policyholders | (91) |
Shareholders | (52) |
(143) | |
Impact of updates to actuarial methods and assumptions, pre-tax | $605 |
(1)Excludes the portion related to non-controlling interests of $(116) million. The impact of updates to actuarial methods and assumptions on pre-tax fulfilment cash
flows, including the portion related to non-controlling interests, would be $489 million.
Hong Kong health insurance product reserving approach
An update to the pricing philosophy on certain health insurance products in Hong Kong led to a change in the IFRS 17
measurement model from the Premium Allocation Approach to the General Measurement Model, which requires all future cash
flows to be included in the fulfilment cash flows, amounting to a decrease in pre-tax fulfilment cash flows of $463 million.
Methodology and other updates
Methodology and other updates resulted in a decrease in pre-tax fulfilment cash flows of $207 million.
The decrease was mainly driven by annual yield and parameter updates to our valuation models for participating products in Asia
and Canada. This was partially offset by various other valuation models updates in the U.S. to non-participating products that
netted to a residual increase in fulfilment cash flows.
1 The mortality rate of LTC policyholders who are currently not on claim.
2 Our actual experience obtaining premium increases could be materially different than what we have assumed, resulting in further increases or decreases in pre-tax
fulfilment cash flows, which could be material. See “Caution regarding forward-looking statements” above.
3 Our review of actuarial methods and assumptions also impacts net income attributed to participating policyholders. The total company impact can be found in the
above table.
89 | 2025 Annual Report | Management’s Discussion and Analysis |
Lapse and policyholder behaviour updates
Updates to lapses and policyholder behaviour assumptions resulted in an increase in pre-tax fulfilment cash flows of
$181 million.
The increase was mainly driven by the review of lapse assumptions in Singapore as well as other smaller updates. The
Singapore update reflected higher lapse experience on our index-linked and universal life products. This was partially offset by
the impact of the lapse review on term insurance products in Canada.
Long-term care triennial review
U.S. Insurance completed a comprehensive long-term care (“LTC”) experience study. The review included all aspects of claim
assumptions, as well as the progress on future premium increases and approved premium increases in excess of prior
assumptions. The impact of the LTC review was a decrease in pre-tax fulfilment cash flows of $77 million.
The overall experience study led to a $1.9 billion (US$1.4 billion) increase in pre-tax fulfilment cash flows for claim costs
following a review of morbidity, mortality and lapse assumptions. This was mainly driven by higher utilization of benefits due to
the impact of higher inflation in the cost-of-care, and also reflects the benefit of in-force management initiatives related to fraud,
waste and abuse programs. The impact from utilization was partially offset by updates to reflect higher terminations. The impacts
of updating incidence, active life mortality1, lapse and other refinements were all relatively small.
The review of assumed future premium increases resulted in a $1.5 billion (US$1.1 billion) decrease in pre-tax fulfilment cash
flows. This reflects expected future net premium increases that are due to the outstanding amounts from prior state filings as well
as to our 2025 review of morbidity, mortality, and lapse assumptions. Since the last triennial review in 2022, we have received
actual premium increase approvals of $3.2 billion pre-tax (US$2.3 billion pre-tax) on a present value basis. This exceeds the
amount of premium increases we assumed in our pre-tax fulfilment cash flows by $0.5 billion (US$0.3 billion) at that time, and
demonstrates our continued strong track record of securing premium rate increases.2
Mortality and morbidity updates
Mortality and morbidity updates resulted in a decrease in pre-tax fulfilment cash flows of $39 million.
The decrease was mainly driven by a morbidity study of group long-term disability benefits in Canada related to claim
termination, partially offset by other items that netted to a modest residual increase in fulfilment cash flows.
Impact of updates to actuarial methods and assumptions on pre-tax fulfilment cash flows, net income attributed to
shareholders, CSM and OCI by segment3
The impact of updates to actuarial methods and assumptions in Canada resulted in a decrease in pre-tax fulfilment cash flows of
$382 million. The decrease was primarily driven by the impact of annual updates to our valuation models for participating
products, the lapse review on term insurance products as well as the review of morbidity assumptions for group long-term
disability benefits. These updates resulted in an increase in pre-tax net income attributed to shareholders of $80 million
($58 million post-tax), an increase in CSM of $348 million, and an increase in pre-tax other comprehensive income attributed to
shareholders of $98 million ($71 million post-tax).
The impact of updates to actuarial methods and assumptions in the U.S. resulted in an increase in pre-tax fulfilment cash flows
of $179 million. The increase was primarily driven by a number of valuation model updates, partially offset by the impact of the
LTC triennial review. These updates resulted in a decrease in pre-tax net income attributed to shareholders of $298 million
($235 million post-tax), an increase in CSM of $43 million, and an increase in pre-tax other comprehensive income attributed to
shareholders of $75 million ($60 million post-tax).
The impact of updates to actuarial methods and assumptions in Asia resulted in a decrease in pre-tax fulfilment cash flows of
$418 million. The decrease was primarily driven by the impact of the change in the IFRS 17 measurement model on certain
health insurance products in Hong Kong and the impact of annual updates to our valuation models for participating products,
partly offset by a review of lapse assumptions for certain products in Singapore. These updates resulted in a decrease in pre-tax
net income attributed to shareholders of $26 million ($39 million post-tax), an increase in CSM of $704 million, and a decrease in
pre-tax other comprehensive income attributed to shareholders of $224 million ($203 million post-tax).
The impact of updates to actuarial methods and assumptions in Corporate and Other (which includes our property and casualty
reinsurance businesses, run-off insurance operations including variable annuities and health, and consolidation adjustments
including intercompany eliminations) resulted in an increase in pre-tax fulfilment cash flows of $16 million. These updates
resulted in no impact to pre-tax or post-tax net income attributed to shareholders, a decrease in CSM of $15 million and a
decrease in pre-tax other comprehensive income attributed to shareholders of $1 million ($1 million post-tax).
1 Fulfilment cash flows include an estimate of future cash flows; an adjustment to reflect the time value of money and the financial risk related to future cash flows if
not included in the estimate of future cash flows; and a risk adjustment for non-financial risk. Additional information on fulfilment cash flows can be found in note 6
of our 2025 Annual Consolidated Financial Statements.
| 90 | |
2024 Review of Actuarial Methods and Assumptions
The completion of the 2024 annual review of actuarial methods and assumptions resulted in a decrease in pre-tax fulfilment cash
flows1 of $174 million, excluding the portion related to non-controlling interests. These updates resulted in a decrease in pre-tax
net income attributed to shareholders of $250 million ($199 million post-tax), an increase in pre-tax net income attributed to
participating policyholders of $29 million ($21 million post-tax), a decrease in CSM of $421 million, an increase in pre-tax other
comprehensive income attributed to shareholders of $771 million ($632 million post-tax), and an increase in pre-tax other
comprehensive income attributed to participating policyholders of $45 million ($32 million post-tax).
Impact of updates to actuarial methods and assumptions on pre-tax fulfilment cash flows(1)
For the year ended December 31, 2024 | Total |
($ millions) | |
Lapse and policyholder behaviour updates | $620 |
Reinsurance contract and other risk adjustment review | 427 |
Expense updates | (406) |
Financial related updates | (386) |
Mortality and morbidity updates | (273) |
Methodology and other updates | (156) |
Impact of updates to actuarial methods and assumptions on pre-tax fulfilment cash flows | $(174) |
(1)Excludes the portion related to non-controlling interests of $(215) million. The impact of updates to actuarial methods and assumptions on pre-tax fulfilment cash
flows, including the portion related to non-controlling interests, would be $(389) million.
Impact of updates to actuarial methods and assumptions on pre-tax net income attributed to shareholders, pre-tax net
income attributed to participating policyholders, OCI and CSM(1)
For the year ended December 31, 2024 | Total |
($ millions) | |
Portion recognized in net income (loss) attributed to: | |
Participating policyholders | $29 |
Shareholders | (250) |
(221) | |
Portion increasing (decreasing) CSM | (421) |
Portion recognized in OCI attributed to: | |
Participating policyholders | 45 |
Shareholders | 771 |
816 | |
Impact of updates to actuarial methods and assumptions, pre-tax | $174 |
(1)Excludes the portion related to non-controlling interests of $215 million. The impact of updates to actuarial methods and assumptions on pre-tax fulfilment cash
flows, including the portion related to non-controlling interests, would be $389 million.
Lapse and policyholder behaviour updates
Updates to lapses and policyholder behaviour assumptions resulted in an increase in pre-tax fulfilment cash flows of
$620 million.
The increase was primarily driven by a detailed review of the lapse assumptions for our non-participating products in our U.S. life
insurance business and our International High Net Worth business in Asia segment. For U.S. protection products, lapse rates
declined during the COVID-19 pandemic and continue to remain low, while for U.S. indexed universal life, U.S. bank-owned life
insurance, and Asia’s International High Net Worth business, lapse rates increased due to the impact of higher short-term
interest rates. We updated our lapse assumptions to reflect these experience trends. The ultimate lapse rates for products with
no-lapse guarantees were not changed.
Reinsurance contract and other risk adjustment review
The review of our reinsurance contracts and risk adjustment, excluding changes that were a direct result of other assumption
updates, resulted in an increase in pre-tax fulfilment cash flows of $427 million.
1 Our annual update of actuarial methods and assumptions also impacts net income and other comprehensive income attributed to participating policyholders. The
total company impact of these metrics can be found in the above table.
91 | 2025 Annual Report | Management’s Discussion and Analysis |
The increase was driven by updates to our reinsurance contract fulfilment cash flows to reflect current reinsurance market
conditions and the resulting expected cost on older U.S. mortality reinsurance, partially offset by updates to our risk adjustment
methodology in North America related to non-financial risk.
Our overall risk adjustment continues to be within the 90 – 95% confidence level.
Expense updates
Expense updates resulted in a decrease in pre-tax fulfilment cash flows of $406 million.
The decrease was driven by a detailed review of our global expenses, including investment expenses. We aligned them with our
current cost structure and included the impact of changes in classification of certain expenses from directly attributable to non-
directly attributable.
Financial related updates
Financial related updates resulted in a decrease in pre-tax fulfilment cash flows of $386 million.
The decrease was driven by a review of the discount rates used in the valuation of our non-participating business, which
included increases to ultimate risk-free rates in the U.S. to align with historical averages, as well as updates to parameters used
to determine illiquidity premiums. This was partially offset by refinements to crediting rate projections on certain U.S. universal life
products.
Mortality and morbidity updates
Mortality and morbidity updates resulted in a decrease in pre-tax fulfilment cash flows of $273 million.
The decrease was driven by morbidity updates to health insurance products in Hong Kong to reflect lower hospital claims on
certain business that we account for under the general measurement model, partially offset by updates to mortality and morbidity
assumptions on critical illness products in Hong Kong to reflect emerging experience.
Methodology and other updates
Methodology and other updates resulted in a decrease in pre-tax fulfilment cash flows of $156 million.
The decrease was driven by the impact of annual updates to our valuation models for participating products in Asia and Canada
reflecting higher interest rates during the year, partially offset by various other smaller items that netted to an increase in
fulfilment cash flows.
Impact of updates to actuarial methods and assumptions on pre-tax fulfilment cash flows, net income attributed to
shareholders, CSM and OCI by segment1
The impact of updates to actuarial methods and assumptions in Canada resulted in a decrease in pre-tax fulfilment cash flows of
$266 million. The decrease was primarily driven by updates to the risk adjustment methodology related to non-financial risks and
the review of the discount rates used in the valuation of non-participating business. These updates resulted in an increase in pre-
tax net income attributed to shareholders of $3 million ($2 million post-tax), an increase in CSM of $222 million, and a decrease
in pre-tax other comprehensive income attributed to shareholders of $15 million ($10 million post-tax).
The impact of updates to actuarial methods and assumptions in the U.S. resulted in an increase in pre-tax fulfilment cash flows
of $895 million. The increase was primarily driven by the net impact of updates to our reinsurance contract fulfilment cash flows
and risk adjustment methodology related to non-financial risks, a detailed review of the lapse assumptions in our life insurance
business, and refinements to our crediting rate projections on certain universal life products, partially offset by a review of the
discount rates used in the valuation of non-participating business. These updates resulted in a decrease in pre-tax net income
attributed to shareholders of $256 million ($202 million post-tax), a decrease in CSM of $1,228 million, and an increase in pre-tax
other comprehensive income attributed to shareholders of $589 million ($466 million post-tax).
The impact of updates to actuarial methods and assumptions in Asia resulted in a decrease in pre-tax fulfilment cash flows of
$818 million. The decrease was primarily driven by the impact of morbidity updates to certain health insurance products in Hong
Kong to reflect emerging experience, updates from our detailed review of global expenses, including investment expenses, as
well as the impact of annual updates to our valuation models for participating products, partially offset by a review of lapse
assumptions for the International High Net Worth business. These updates resulted in a decrease in pre-tax net income
attributed to shareholders of $4 million ($5 million post-tax), an increase in CSM of $591 million, and an increase in pre-tax other
comprehensive income attributed to shareholders of $213 million ($190 million post-tax).
The impact of updates to actuarial methods and assumptions in Corporate and Other (which includes our property and casualty
reinsurance businesses, run-off insurance operations including variable annuities and health, and consolidation adjustments
including intercompany eliminations) resulted in an increase in pre-tax fulfilment cash flows of $15 million. These updates
| 92 | |
resulted in an increase in pre-tax net income attributed to shareholders of $7 million ($6 million post-tax), a decrease in CSM of
$6 million, and a decrease in pre-tax other comprehensive income attributed to shareholders of $16 million ($14 million post-tax).
Critical Accounting Policies
Consolidation
The Company is required to consolidate the financial position and results of the entities it controls. Control exists when the
Company:
•Has the power to govern the financial and operating policies of the entity;
•Is exposed to a significant portion of the entity’s variable returns; and
•Is able to use its power to influence variable returns from the entity.
The Company uses the same principles to assess control over any entity it is involved with. In evaluating control, potential factors
assessed include the effects of:
•Substantive voting rights that are potentially or currently exercisable;
•Contractual management relationships with the entity;
•Rights and obligations resulting from policyholders to manage investments on their behalf;
•The extent of other parties’ involvement in the entity, if any, the possibility for de facto control being present; and
•The effect of any legal or contractual restraints on the Company from using its power to affect its variable returns from the
entity.
An assessment of control is based on arrangements in place and the assessed risk exposures at inception of the relationship.
Initial evaluations are reconsidered at a later date if:
•The contractual arrangements of the entity are amended such that the Company’s involvement with the entity changes;
•The Company acquires or loses power over the financial and operating policies of the entity;
•The Company acquires additional interests in the entity or its interests in an entity are diluted; or
•The Company’s ability to use its power to affect its variable returns from the entity changes.
Subsidiaries are consolidated from the date on which control is obtained by the Company and cease to be consolidated from the
date that control ceases. A change in control may lead to gains or losses on derecognition of a subsidiary when losing control, or
on derecognition of previous interests in a subsidiary when gaining control.
Fair Value of Invested Assets
A large portion of the Company’s invested assets are recorded at fair value. Refer to note 1 of the 2025 Annual Consolidated
Financial Statements for a description of the methods used in determining fair values. When quoted prices in active markets are
not available for a particular investment, significant judgment is required to determine an estimated fair value based on market
standard valuation methodologies including discounted cash flow methodologies, matrix pricing, consensus pricing services, or
other similar techniques. The inputs to these standard valuation methodologies include: current interest rates or yields for similar
instruments, credit rating of the issuer or counterparty, industry sector of the issuer, coupon rate, call provisions, sinking fund
requirements, tenor (or expected tenor) of the instrument, management’s assumptions regarding liquidity, volatilities and
estimated future cash flows. Accordingly, the estimated fair values are based on available market information and management’s
judgments about the key market factors impacting these financial instruments. Financial markets are susceptible to severe
events evidenced by rapid depreciation in asset values accompanied by a reduction in asset liquidity. The Company’s ability to
sell assets, or the price ultimately realized for these assets, depends upon the demand and liquidity in the market which affect
the use of judgment in determining the estimated fair value of certain assets.
Evaluation of Invested Asset Impairment
FVOCI debt investments are carried at fair market value, with changes in fair value recorded in OCI with the exception of
unrealized gains and losses on foreign currency translation of foreign currency denominated FVOCI debt investments which are
included in net income.
Debt investments classified as FVOCI or amortized cost are reviewed on a regular basis for expected credit loss (“ECL”)
impairment allowances. ECL impairment allowances are measured as the difference between amounts due according to the
contractual terms of the debt security and the discounted value of cash flows that the Company expects to receive. Changes in
ECL impairment allowances are recorded in the provision for credit losses included in net income.
Significant judgment is required in assessing ECL impairment allowances and fair values and recoverable values. Key matters
considered include macroeconomic factors, industry specific developments, and specific issues with respect to single issuers
and borrowers.
Changes in circumstances may cause future assessments of invested asset ECL impairment allowances to be materially
different from current assessments, which could require additional provisions for impairment. Additional information on the
93 | 2025 Annual Report | Management’s Discussion and Analysis |
process and methodology for determining the allowance for expected credit losses is included in the discussion of credit risk in
notes 1 & 8 to the 2025 Annual Consolidated Financial Statements.
Derivative Financial Instruments
The Company uses derivative financial instruments (“derivatives”) including swaps, forwards and futures agreements, and
options to help manage current and anticipated exposures to changes in interest rates, foreign exchange rates, commodity
prices and equity market prices, and to replicate different types of investments. Refer to note 4 to the 2025 Annual Consolidated
Financial Statements for a description of the methods used to determine the fair value of derivatives.
The accounting for derivatives is complex and interpretations of the primary accounting guidance continue to evolve in practice.
Judgment is applied in determining the availability and application of hedge accounting designations and the appropriate
accounting treatment under such accounting guidance. Differences in judgment as to the availability and application of hedge
accounting designations and the appropriate accounting treatment may result in a differing impact on the Consolidated Financial
Statements of the Company from previous periods. Assessments of hedge effectiveness and measurements of ineffectiveness of
hedging relationships are also subject to interpretations and estimations.
Hedge Accounting
The Company applies hedge accounting principles under IFRS 9 to certain economic hedge transactions that qualify for hedge
accounting. The Company evaluates the economic relationship between the hedged item and the hedging instrument, assesses
the effect of credit risk on the economic relationship, and determines the hedge ratio between the hedged item and hedging
instrument to identify qualifying hedge accounting relationships.
The Company designates fair value hedges to hedge interest rate exposure on fixed rate assets and liabilities. In certain
instances, the Company hedges fair value exposure due to both foreign exchange and interest rate risk using cross currency
swaps.
The Company designates interest rate derivatives under cash flow hedges to hedge interest rate exposure in variable rate
financial instruments. In addition, the Company may use non-functional currency denominated long-term debt, forward currency
contracts, and cross currency swaps to mitigate the foreign exchange translation risk of net investments in foreign operations.
The Company applies the cost of hedging option for certain hedge accounting relationships, as such changes in forward points
and foreign currency basis spreads are excluded from the hedge accounting relationships and are accounted for as a separate
component in equity.
Employee Future Benefits
The Company maintains defined contribution and defined benefit pension plans, and other post-employment plans for employees
and agents, including registered (tax qualified) pension plans that are typically funded, as well as supplemental non-registered
(non-qualified) pension plans for executives, retiree welfare plans and disability welfare plans that are typically not funded. The
largest defined benefit pension and retiree welfare plans in the U.S. and Canada are the material plans that are discussed herein
and in note 15 to the 2025 Annual Consolidated Financial Statements.
Due to the long-term nature of defined benefit pension and retiree welfare plans, the calculation of the defined benefit obligation
and net benefit cost depends on various assumptions such as discount rates, salary increase rates, cash balance interest
crediting rates, health care cost trend rates and rates of mortality. These assumptions are determined by management and are
reviewed annually. The key assumptions, as well as the sensitivity of the defined benefit obligation to changes in these
assumptions, are presented in note 15 to the 2025 Annual Consolidated Financial Statements.
Changes in assumptions and differences between actual and expected experience give rise to actuarial gains and losses that
affect the amount of the defined benefit obligation and OCI. For 2025, the amount recorded in OCI was a gain of $49 million
(2024 – gain of $67 million) for the defined benefit pension plans and a gain of $32 million (2024 – gain of $16 million) for the
retiree welfare plans.
Contributions to the registered (tax qualified) defined benefit pension plans are made in accordance with the applicable U.S. and
Canadian regulations. During 2025, the Company contributed $2 million (2024 – $2 million) to these plans. As at December 31,
2025, the difference between the fair value of assets and the defined benefit obligation for these plans was a surplus of
$488 million (2024 – surplus of $483 million). For 2026, the contributions to the plans are expected to be approximately $2
million.
The Company’s supplemental pension plans for executives are not funded; benefits under these plans are paid as they become
due. During 2025, the Company paid benefits of $53 million (2024 – $55 million) under these plans. As at December 31, 2025,
the defined benefit obligation for these plans, which is reflected as a liability in the balance sheet, amounted to $493 million
(2024 – $533 million).
The Company’s retiree welfare plans are partially funded, although there are no regulations or laws governing or requiring the
funding of these plans. As at December 31, 2025, the difference between the fair value of plan assets and the defined benefit
obligation for these plans was a surplus of $166 million (2024 – surplus of $125 million).
| 94 | |
Income Taxes
The Company is subject to income tax laws in various jurisdictions. Tax laws are complex and potentially subject to different
interpretations by the taxpayer and the relevant tax authority. The provision for income taxes represents management’s
interpretation of the relevant tax laws and its estimate of current and future income tax implications of the transactions and
events during the period. A deferred tax asset or liability results from temporary differences between carrying values of assets
and liabilities and their respective tax basis. Deferred tax assets and liabilities are recorded based on expected future tax rates
and management’s assumptions regarding the expected timing of the reversal of such temporary differences. The realization of
deferred tax assets depends upon the existence of sufficient taxable income within the carryback or carryforward periods under
the tax law in the applicable tax jurisdiction. A deferred tax asset is recognized to the extent that future realization of the tax
benefit is probable. Deferred tax assets are reviewed at each reporting date and are reduced to the extent that it is no longer
probable that the tax benefit will be realized. At December 31, 2025, we had $5,741 million of deferred tax assets (December 31,
2024 – $5,884 million). Factors in management’s determination include, among others, the following:
•Future taxable income exclusive of reversing temporary differences and carryforwards;
•Future reversals of existing taxable temporary differences;
•Taxable income in prior carryback years; and
•Tax planning strategies.
The Company may be required to change its provision for income taxes if the ultimate deductibility of certain items is
successfully challenged by taxing authorities, or if estimates used in determining the amount of deferred tax assets to recognize
change significantly, or when receipt of new information indicates the need for adjustment in the recognition of deferred tax
assets. Additionally, future events, such as changes in tax laws, tax regulations, or interpretations of such laws or regulations,
could have an impact on the provision for income tax, deferred tax balances, actuarial liabilities (see Critical Actuarial and
Accounting Policies – Directly Attributable Expenses and Taxes above) and the effective tax rate. Any such changes could
significantly affect the amounts reported in the Consolidated Financial Statements in the year these changes occur.
Goodwill and Intangible Assets
At December 31, 2025, under IFRS we had $6,877 million of goodwill (December 31, 2024 – $6,275 million) and $5,447 million
of intangible assets ($2,243 million of which are intangible assets with indefinite lives) (December 31, 2024 – $4,777 million and
$2,124 million, respectively). Goodwill and intangible assets with indefinite lives are tested for impairment at the cash generating
unit level (“CGU”) or group of CGUs level. A CGU comprises the smallest group of assets that are capable of generating largely
independent cash flows and is either a business segment or a level below. The tests performed in 2025 demonstrated that there
was $nil impairment of goodwill or intangible assets with indefinite lives (2024 – $nil). Changes in discount rates and cash flow
projections used in the determination of recoverable values or reductions in market-based earnings multiples may result in
impairment charges in the future, which could be material.
Impairment charges could occur in the future as a result of changes in economic conditions. The goodwill testing for 2026 will be
updated based on the conditions that exist in 2026 and may result in impairment charges, which could be material.
95 | 2025 Annual Report | Management’s Discussion and Analysis |
12. Controls and Procedures
Disclosure Controls and Procedures
Our disclosure controls and procedures are designed to provide reasonable assurance that information required to be disclosed
by us is recorded, processed, summarized, and reported accurately and completely and within the time periods specified under
Canadian and U.S. securities laws. Our process includes controls and procedures that are designed to ensure that information is
accumulated and communicated to management, including the CEO and CFO, to allow timely decisions regarding required
disclosure.
As of December 31, 2025, management evaluated the effectiveness of its disclosure controls and procedures as defined under
the rules adopted by the U.S. Securities and Exchange Commission and the Canadian securities regulatory authorities. This
evaluation was performed under the supervision of the Audit Committee, the CEO and CFO. Based on that evaluation, the CEO
and CFO concluded that our disclosure controls and procedures were effective as of December 31, 2025.
MFC’s Audit Committee has reviewed this MD&A and the 2025 Consolidated Financial Statements and MFC’s Board approved
these reports prior to their release.
Management’s Report on Internal Control over Financial Reporting
Management is responsible for establishing and maintaining adequate internal control over financial reporting. The Company’s
internal control system was designed to provide reasonable assurance to management and the Board regarding the preparation
and fair presentation of published financial statements in accordance with generally accepted accounting principles. All internal
control systems, no matter how well designed, have inherent limitations. Therefore, even those systems determined to be
effective can provide only reasonable assurance with respect to financial statement preparation and presentation.
Management maintains a comprehensive system of controls intended to ensure that transactions are executed in accordance
with management’s authorization, assets are safeguarded, and financial records are reliable. Management also takes steps to
ensure that information and communication flows are effective and to monitor performance, including performance of internal
control procedures.
Management assessed the effectiveness of the Company’s internal control over financial reporting as of December 31, 2025
based on the criteria set forth by the Committee of Sponsoring Organizations of the Treadway Commission 2013 framework in
Internal Control – Integrated Framework. Based on this assessment, management believes that, as of December 31, 2025, the
Company’s internal control over financial reporting is effective.
The effectiveness of the Company’s internal control over financial reporting as of December 31, 2025 has been audited by Ernst
& Young LLP, the Company’s independent registered public accounting firm that also audited the Consolidated Financial
Statements of the Company for the year ended December 31, 2025. Their report expressed an unqualified opinion on the
effectiveness of the Company’s internal control over financial reporting as of December 31, 2025.
Changes in Internal Control over Financial Reporting
No changes were made in our internal control over financial reporting during the year ended December 31, 2025 that have
materially affected, or are reasonably likely to materially affect, our internal control over financial reporting.
| 96 | |
13. Non-GAAP and Other Financial Measures
The Company prepares its Consolidated Financial Statements in accordance with International Financial Reporting Standards
(“IFRS”) as issued by the International Accounting Standards Board. We use a number of non-GAAP and other financial
measures to evaluate overall performance and to assess each of our businesses. This section includes information required by
National Instrument 52-112 – Non-GAAP and Other Financial Measures Disclosure in respect of “specified financial
measures” (as defined therein).
Non-GAAP financial measures include core earnings (loss); pre-tax core earnings; core earnings available to common
shareholders; core earnings before interest, taxes, depreciation, and amortization (“core EBITDA”); total expenses; core
expenses; core Drivers of Earnings (“DOE”) line items for core net insurance service result, core net investment result, other core
earnings, and core income tax (expenses) recoveries; post-tax contractual service margin (“post-tax CSM”); post-tax contractual
service margin net of NCI (“post-tax CSM net of NCI”); Manulife Bank net lending assets; Manulife Bank average net lending
assets; assets under management (“AUM”); assets under management and administration (“AUMA”); Global WAM managed
AUMA; core revenue; adjusted book value; and net annualized fee income. In addition, non-GAAP financial measures include
the following stated on a constant exchange rate (“CER”) basis: any of the foregoing non-GAAP financial measures; net income
attributed to shareholders; common shareholders’ net income; and new business CSM.
Non-GAAP ratios include core return on common shareholders’ equity (“core ROE”); diluted core earnings per common share
(“core EPS”); core earnings contributions from highest potential businesses; core earnings contribution from Asia region; core
earnings contribution from LTC and VA businesses; financial leverage ratio; adjusted book value per common share; common
share core dividend payout ratio (“dividend payout ratio”); expense efficiency ratio; core EBITDA margin; effective tax rate on
core earnings; operating segment core earnings contribution; segment share of the total Company AUMA; and net annualized
fee income yield on average AUMA. In addition, non-GAAP ratios include the percentage growth/decline on a CER basis in any
of the above non-GAAP financial measures and non-GAAP ratios; net income attributed to shareholders; common shareholders’
net income; pre-tax net income attributed to shareholders; general expenses; CSM; CSM net of NCI; impact of new insurance
business net of NCI; new business CSM; basic earnings per common share (“basic EPS”); and diluted earnings per common
share (“diluted EPS”).
Other specified financial measures include assets under administration (“AUA”); consolidated capital; new business value
(“NBV”); new business value margin (“NBV margin”); sales; annualized premium equivalent (“APE”) sales; gross flows; net flows;
average assets under management and administration (“average AUMA”); Global WAM average managed AUMA; average
assets under administration; remittances; any of the foregoing specified financial measures stated on a CER basis; and
percentage growth/decline in any of the foregoing specified financial measures on a CER basis. In addition, we provide an
explanation below of the components of core DOE line items other than the change in expected credit loss, the items that
comprise certain items excluded from core earnings (on a pre-tax and post-tax basis), and the components of CSM movement
other than the new business CSM.
Our reporting currency for the Company is Canadian dollars and U.S. dollars is the functional currency for Asia and U.S.
segment results. Financial measures presented in U.S. dollars are calculated in the same manner as the Canadian dollar
measures. These amounts are translated to U.S. dollars using the period end rate of exchange for financial measures such as
AUMA and the CSM balance and the average rates of exchange for the respective quarter for periodic financial measures such
as our Consolidated Statements of Income, core earnings and items excluded from core earnings, and line items in our CSM
movement schedule and DOE. Year-to-date or full year periodic financial measures presented in U.S. dollars are calculated as
the sum of the quarterly results translated to U.S. dollars. See section 1 “Impact of Foreign Currency Exchange Rates” of the
MD&A above for the Canadian to U.S. dollar quarterly and full year rates of exchange.
Non-GAAP financial measures and non-GAAP ratios are not standardized financial measures under GAAP and, therefore, might
not be comparable to similar financial measures disclosed by other issuers. Therefore, they should not be considered in isolation
or as a substitute for any other financial information prepared in accordance with GAAP.
Core earnings (loss) is a financial measure which we believe aids investors in better understanding the long-term earnings
capacity and valuation of the business. Core earnings allows investors to focus on the Company’s operating performance by
excluding the impact of market related gains or losses, and certain items such as the net impact of updates to actuarial methods
and assumptions that flow directly through income as well as other items, outlined below, that we believe are material, but do not
reflect the underlying earnings capacity of the business. For example, due to the long-term nature of our business, the mark-to-
market movements in equity markets, interest rates including impacts on hedge accounting ineffectiveness, foreign currency
exchange rates and commodity prices as well as the change in the fair value of ALDA from period-to-period can, and frequently
do, have a substantial impact on the reported amounts of our assets, insurance contract liabilities and net income attributed to
shareholders. These reported amounts may not be realized if markets move in the opposite direction in a subsequent period.
This makes it very difficult for investors to evaluate how our businesses are performing from period-to-period and to compare our
performance with other issuers.
We believe that core earnings better reflect the underlying earnings capacity and valuation of our business. We use core
earnings and core EPS as key metrics in our short-term incentive plans at the total Company and operating segment level. We
also base our mid- and long-term strategic priorities on core earnings.
97 | 2025 Annual Report | Management’s Discussion and Analysis |
Core earnings include the expected return on our invested assets and any other gains (charges) from market experience are
included in net income but excluded from core earnings. The expected return for fixed income assets is based on the related
book yields. For ALDA and public equities, the expected return reflects our long-term view of asset class performance. These
returns for ALDA and public equities vary by asset class and range from 3.25% to 11.5%, leading to an average return of
between 9.0% to 9.5% on these assets as of December 31, 2025.
While core earnings are relevant to how we manage our business and offer a consistent methodology, it is not insulated from
macroeconomic factors which can have a significant impact. See below for a reconciliation of core earnings to net income
attributed to shareholders and income before income taxes. Net income attributed to shareholders excludes net income
attributed to participating policyholders and non-controlling interests.
Any future changes to the core earnings definition referred to below, will be disclosed.
Items included in core earnings:
1.Expected insurance service result on in-force policies, including expected release of the risk adjustment, CSM recognized
for service provided, and expected earnings from short-term products measured under the premium allocation approach
(“PAA”).
2.Impacts from the initial recognition of new contracts (onerous contracts, including the impact of the associated reinsurance
contracts).
3.Insurance experience gains or losses that flow directly through net income.
4.Operating and investment expenses compared with expense assumptions used in the measurement of insurance and
investment contract liabilities.
5.Expected investment earnings, which is the difference between expected return on our invested assets and the associated
finance income or expense from the insurance contract liabilities.
6.Net provision for ECL on FVOCI and amortized cost debt instruments.
7.Expected asset returns on surplus investments.
8.All earnings for the Global WAM segment, except for applicable net income items excluded from core earnings as noted
below.
9.All earnings for the Manulife Bank business, except for applicable net income items excluded from core earnings as noted
below.
10.Routine legal settlements.
11.All other items not specifically excluded.
12.Tax on the above items.
13.All tax-related items except the impact of enacted or substantively enacted income tax rate changes and taxes on items
excluded from core earnings.
Net income items excluded from core earnings:
1.Market experience gains (losses) including the items listed below:
•Gains (charges) on general fund public equity and ALDA investments from returns being different than expected.
•Gains (charges) on derivatives not in hedging relationships, or gains (charges) resulting from hedge accounting
ineffectiveness.
•Realized gains (charges) from the sale of FVOCI debt instruments.
•Market related gains (charges) on onerous contracts measured using the variable fee approach (e.g., variable annuities,
unit-linked, participating insurance) net of the performance on any related hedging instruments.
•Gains (charges) related to certain changes in foreign exchange rates.
2.Updates to actuarial methods and assumptions used in the measurement of insurance contract liabilities that flow directly
through income. The Company reviews actuarial methods and assumptions annually, and this process is designed to reduce
the Company’s exposure to uncertainty by ensuring assumptions remain appropriate. This is accomplished by monitoring
experience and selecting assumptions which represent a current view of expected future experience and ensuring that the
risk adjustment is appropriate for the risks assumed.
3.Amortization and impairment of intangible assets acquired in a business combination, except for amortization of software
and distribution agreements. Commencing 3Q25, this item is now excluded from core earnings to better represent the
underlying earnings capacity of acquired businesses, consistent with our definition of core earnings, and to better align with
industry practice. Prior periods have not been restated as these amounts are not considered material, and use the definition
of core earnings in effect for those periods.
4.The impact on the measurement of insurance and investment contract assets and liabilities and reinsurance contract held
assets and liabilities from changes in product features and new or changes to in-force reinsurance contracts.
5.The fair value changes in long-term investment plan obligations for Global WAM investment management.
6.Goodwill impairment charges.
7.Gains or losses on acquisition and disposition of a business.
8.One-time only adjustments, including highly unusual/extraordinary legal settlements and restructuring charges, or other
items that are exceptional in nature.
| 98 | |
9.Tax on the above items.
10.Net income (loss) attributed to participating shareholders and non-controlling interests.
11.Impact of enacted or substantively enacted income tax rate changes.
Reconciliation of core earnings to net income attributed to shareholders – 2025
($ millions, post-tax and based on actual foreign exchange rates in effect in the applicable reporting period, unless otherwise stated)
2025 | ||||||
Asia | Canada | U.S. | Global WAM | Corporate and Other | Total | |
Income (loss) before income taxes | $4,129 | $1,736 | $(708) | $2,251 | $(314) | $7,094 |
Income tax (expenses) recoveries | ||||||
Core earnings | (389) | (429) | (275) | (350) | 204 | (1,239) |
Items excluded from core earnings | (327) | 45 | 456 | 9 | 22 | 205 |
Income tax (expenses) recoveries | (716) | (384) | 181 | (341) | 226 | (1,034) |
Net income (post-tax) | 3,413 | 1,352 | (527) | 1,910 | (88) | 6,060 |
Less: Net income (post-tax) attributed to | ||||||
Non-controlling interests | 270 | - | - | 10 | (2) | 278 |
Participating policyholders | 171 | 39 | - | - | - | 210 |
Net income (loss) attributed to shareholders (post-tax) | 2,972 | 1,313 | (527) | 1,900 | (86) | 5,572 |
Less: Items excluded from core earnings (post-tax) | ||||||
Market experience gains (losses) | 136 | (374) | (1,498) | 22 | 52 | (1,662) |
Updates to actuarial methods and assumptions that flow directly through income | (39) | 58 | (235) | - | - | (216) |
Restructuring charge | - | (3) | - | (9) | - | (12) |
Amortization of acquisition-related intangible assets | - | - | - | (18) | - | (18) |
Reinsurance transactions, tax-related items and other | (94) | (2) | - | (27) | 82 | (41) |
Core earnings (post-tax) | $2,969 | $1,634 | $1,206 | $1,932 | $(220) | $7,521 |
Income tax on core earnings (see above) | 389 | 429 | 275 | 350 | (204) | 1,239 |
Core earnings (pre-tax) | $3,358 | $2,063 | $1,481 | $2,282 | $(424) | $8,760 |
Core earnings, CER basis and U.S. dollars – 2025
($ millions, post-tax and based on actual foreign exchange rates in effect in the applicable reporting period, unless otherwise stated)
2025 | ||||||
Asia | Canada | U.S. | Global WAM | Corporate and Other | Total | |
Core earnings (post-tax) | $2,969 | $1,634 | $1,206 | $1,932 | $(220) | $7,521 |
CER adjustment(1) | (20) | - | (5) | (4) | 1 | (28) |
Core earnings, CER basis (post-tax) | $2,949 | $1,634 | $1,201 | $1,928 | $(219) | $7,493 |
Income tax on core earnings, CER basis(2) | 386 | 429 | 274 | 349 | (203) | 1,235 |
Core earnings, CER basis (pre-tax) | $3,335 | $2,063 | $1,475 | $2,277 | $(422) | $8,728 |
Core earnings (U.S. dollars) – Asia and U.S. segments | ||||||
Core earnings (post-tax)(3), US $ | $2,126 | $862 | ||||
CER adjustment US $(1) | (11) | - | ||||
Core earnings, CER basis (post-tax), US $ | $2,115 | $862 | ||||
(1)The impact of updating foreign exchange rates to that which was used in 4Q25.
(2)Income tax on core earnings adjusted to reflect the foreign exchange rates for the Statement of Income in effect for 4Q25.
(3)Core earnings (post-tax) in Canadian $ are translated to US $ using the US $ Statement of Income exchange rate for the four respective quarters that make up
2025 core earnings.
99 | 2025 Annual Report | Management’s Discussion and Analysis |
Reconciliation of core earnings to net income attributed to shareholders – 2024(1)
($ millions, post-tax and based on actual foreign exchange rates in effect in the applicable reporting period, unless otherwise stated)
2024 | ||||||
Asia | Canada | U.S. | Global WAM | Corporate and Other | Total | |
Income (loss) before income taxes | $3,197 | $1,679 | $132 | $1,747 | $335 | $7,090 |
Income tax (expenses) recoveries | ||||||
Core earnings | (390) | (399) | (408) | (234) | 121 | (1,310) |
Items excluded from core earnings | (70) | 46 | 411 | 86 | (375) | 98 |
Income tax (expenses) recoveries | (460) | (353) | 3 | (148) | (254) | (1,212) |
Net income (post-tax) | 2,737 | 1,326 | 135 | 1,599 | 81 | 5,878 |
Less: Net income (post-tax) attributed to | ||||||
Non-controlling interests | 241 | - | - | 2 | 4 | 247 |
Participating policyholders | 141 | 105 | - | - | - | 246 |
Net income (loss) attributed to shareholders (post-tax) | 2,355 | 1,221 | 135 | 1,597 | 77 | 5,385 |
Less: Items excluded from core earnings (post-tax) | ||||||
Market experience gains (losses) | (178) | (384) | (1,327) | 4 | 435 | (1,450) |
Updates to actuarial methods and assumptions that flow directly through income | (5) | 2 | (202) | - | 6 | (199) |
Restructuring charge | - | (6) | - | (66) | - | (72) |
Amortization of acquisition-related intangible assets | - | - | - | - | - | - |
Reinsurance transactions, tax-related items and other | 72 | 41 | (26) | (14) | (149) | (76) |
Core earnings (post-tax) | $2,466 | $1,568 | $1,690 | $1,673 | $(215) | $7,182 |
Income tax on core earnings (see above) | 390 | 399 | 408 | 234 | (121) | 1,310 |
Core earnings (pre-tax) | $2,856 | $1,967 | $2,098 | $1,907 | $(336) | $8,492 |
(1)This reconciliation and related core earnings reconciliation below have been updated to align with the presentation of GMT in 2025. See the “Global Minimum
Taxes” section above for more information.
Core earnings, CER basis and U.S. dollars – 2024
($ millions, post-tax and based on actual foreign exchange rates in effect in the applicable reporting period, unless otherwise stated)
2024 | ||||||
Asia | Canada | U.S. | Global WAM | Corporate and Other | Total | |
Core earnings (post-tax) | $2,466 | $1,568 | $1,690 | $1,673 | $(215) | $7,182 |
CER adjustment(1) | 32 | - | 31 | 20 | 3 | 86 |
Core earnings, CER basis (post-tax) | $2,498 | $1,568 | $1,721 | $1,693 | $(212) | $7,268 |
Income tax on core earnings, CER basis(2) | 397 | 399 | 415 | 235 | (121) | 1,325 |
Core earnings, CER basis (pre-tax) | $2,895 | $1,967 | $2,136 | $1,928 | $(333) | $8,593 |
Core earnings (U.S. dollars) – Asia and U.S. segments | ||||||
Core earnings (post-tax)(3), US $ | $1,799 | $1,234 | ||||
CER adjustment US $(1) | (7) | - | ||||
Core earnings, CER basis (post-tax), US $ | $1,792 | $1,234 | ||||
(1)The impact of updating foreign exchange rates to that which was used in 4Q25.
(2)Income tax on core earnings adjusted to reflect the foreign exchange rates for the Statement of Income in effect for 4Q25.
(3)Core earnings (post-tax) in Canadian $ are translated to US $ using the US $ Statement of Income exchange rate for the four respective quarters that make up
2024 core earnings.
| 100 | |
Reconciliation of core earnings to net income attributed to shareholders – 4Q25
($ millions, post-tax and based on actual foreign exchange rates in effect in the applicable reporting period, unless otherwise stated)
4Q25 | ||||||
Asia | Canada | U.S. | Global WAM | Corporate and Other | Total | |
Income (loss) before income taxes | $899 | $354 | $101 | $542 | $9 | $1,905 |
Income tax (expenses) recoveries | ||||||
Core earnings | (101) | (111) | (75) | (93) | 52 | (328) |
Items excluded from core earnings | (102) | 25 | 55 | 10 | 30 | 18 |
Income tax (expenses) recoveries | (203) | (86) | (20) | (83) | 82 | (310) |
Net income (post-tax) | 696 | 268 | 81 | 459 | 91 | 1,595 |
Less: Net income (post-tax) attributed to | ||||||
Non-controlling interests | 26 | - | - | 7 | - | 33 |
Participating policyholders | 47 | 16 | - | - | - | 63 |
Net income (loss) attributed to shareholders (post-tax) | 623 | 252 | 81 | 452 | 91 | 1,499 |
Less: Items excluded from core earnings (post-tax) | ||||||
Market experience gains (losses) | (121) | (158) | (238) | (1) | 77 | (441) |
Updates to actuarial methods and assumptions that flow directly through income | - | - | - | - | - | - |
Restructuring charge | - | (3) | - | (9) | - | (12) |
Amortization of acquisition-related intangible assets | - | - | - | (12) | - | (12) |
Reinsurance transactions, tax-related items and other | (41) | - | - | (16) | 28 | (29) |
Core earnings (post-tax) | $785 | $413 | $319 | $490 | $(14) | $1,993 |
Income tax on core earnings (see above) | 101 | 111 | 75 | 93 | (52) | 328 |
Core earnings (pre-tax) | $886 | $524 | $394 | $583 | $(66) | $2,321 |
Core earnings, CER basis and U.S. dollars – 4Q25
($ millions, post-tax and based on actual foreign exchange rates in effect in the applicable reporting period, unless otherwise stated)
4Q25 | ||||||
Asia | Canada | U.S. | Global WAM | Corporate and Other | Total | |
Core earnings (post-tax) | $785 | $413 | $319 | $490 | $(14) | $1,993 |
CER adjustment(1) | - | - | - | - | - | - |
Core earnings, CER basis (post-tax) | $785 | $413 | $319 | $490 | $(14) | $1,993 |
Income tax on core earnings, CER basis(2) | 101 | 111 | 75 | 93 | (52) | 328 |
Core earnings, CER basis (pre-tax) | $886 | $524 | $394 | $583 | $(66) | $2,321 |
Core earnings (U.S. dollars) – Asia and U.S. segments | ||||||
Core earnings (post-tax)(3), US $ | $564 | $229 | ||||
CER adjustment US $(1) | - | - | ||||
Core earnings, CER basis (post-tax), US $ | $564 | $229 | ||||
(1)The impact of updating foreign exchange rates to that which was used in 4Q25.
(2)Income tax on core earnings adjusted to reflect the foreign exchange rates for the Statement of Income in effect for 4Q25.
(3)Core earnings (post-tax) in Canadian $ are translated to US $ using the US $ Statement of Income exchange rate for 4Q25.
101 | 2025 Annual Report | Management’s Discussion and Analysis |
Reconciliation of core earnings to net income attributed to shareholders – 3Q25
($ millions, post-tax and based on actual foreign exchange rates in effect in the applicable reporting period, unless otherwise stated)
3Q25 | ||||||
Asia | Canada | U.S. | Global WAM | Corporate and Other | Total | |
Income (loss) before income taxes | $1,268 | $551 | $(109) | $606 | $(87) | $2,229 |
Income tax (expenses) recoveries | ||||||
Core earnings | (93) | (119) | (79) | (82) | 91 | (282) |
Items excluded from core earnings | (140) | (5) | 113 | 1 | 3 | (28) |
Income tax (expenses) recoveries | (233) | (124) | 34 | (81) | 94 | (310) |
Net income (post-tax) | 1,035 | 427 | (75) | 525 | 7 | 1,919 |
Less: Net income (post-tax) attributed to | ||||||
Non-controlling interests | 128 | - | - | 2 | - | 130 |
Participating policyholders | 12 | (22) | - | - | - | (10) |
Net income (loss) attributed to shareholders (post-tax) | 895 | 449 | (75) | 523 | 7 | 1,799 |
Less: Items excluded from core earnings (post-tax) | ||||||
Market experience gains (losses) | 173 | (37) | (172) | 18 | 16 | (2) |
Updates to actuarial methods and assumptions that flow directly through income | (39) | 58 | (235) | - | - | (216) |
Restructuring charge | - | - | - | - | - | - |
Amortization of acquisition-related intangible assets | - | - | - | (6) | - | (6) |
Reinsurance transactions, tax-related items and other | 2 | - | - | (14) | - | (12) |
Core earnings (post-tax) | $759 | $428 | $332 | $525 | $(9) | $2,035 |
Income tax on core earnings (see above) | 93 | 119 | 79 | 82 | (91) | 282 |
Core earnings (pre-tax) | $852 | $547 | $411 | $607 | $(100) | $2,317 |
Core earnings, CER basis and U.S. dollars – 3Q25
($ millions, post-tax and based on actual foreign exchange rates in effect in the applicable reporting period, unless otherwise stated)
3Q25 | ||||||
Asia | Canada | U.S. | Global WAM | Corporate and Other | Total | |
Core earnings (post-tax) | $759 | $428 | $332 | $525 | $(9) | $2,035 |
CER adjustment(1) | 2 | - | 4 | 3 | 1 | 10 |
Core earnings, CER basis (post-tax) | $761 | $428 | $336 | $528 | $(8) | $2,045 |
Income tax on core earnings, CER basis(2) | 94 | 119 | 79 | 82 | (90) | 284 |
Core earnings, CER basis (pre-tax) | $855 | $547 | $415 | $610 | $(98) | $2,329 |
Core earnings (U.S. dollars) – Asia and U.S. segments | ||||||
Core earnings (post-tax)(3), US $ | $550 | $241 | ||||
CER adjustment US $(1) | (5) | - | ||||
Core earnings, CER basis (post-tax), US $ | $545 | $241 | ||||
(1)The impact of updating foreign exchange rates to that which was used in 4Q25.
(2)Income tax on core earnings adjusted to reflect the foreign exchange rates for the Statement of Income in effect for 4Q25.
(3)Core earnings (post-tax) in Canadian $ are translated to US $ using the US $ Statement of Income exchange rate for 3Q25.
| 102 | |
Reconciliation of core earnings to net income attributed to shareholders – 2Q25
($ millions, post-tax and based on actual foreign exchange rates in effect in the applicable reporting period, unless otherwise stated)
2Q25 | ||||||
Asia | Canada | U.S. | Global WAM | Corporate and Other | Total | |
Income (loss) before income taxes | $1,092 | $526 | $31 | $575 | $37 | $2,261 |
Income tax (expenses) recoveries | ||||||
Core earnings | (94) | (110) | (37) | (89) | 32 | (298) |
Items excluded from core earnings | (55) | (5) | 42 | (4) | (18) | (40) |
Income tax (expenses) recoveries | (149) | (115) | 5 | (93) | 14 | (338) |
Net income (post-tax) | 943 | 411 | 36 | 482 | 51 | 1,923 |
Less: Net income (post-tax) attributed to | ||||||
Non-controlling interests | 49 | - | - | - | - | 49 |
Participating policyholders | 64 | 21 | - | - | - | 85 |
Net income (loss) attributed to shareholders (post-tax) | 830 | 390 | 36 | 482 | 51 | 1,789 |
Less: Items excluded from core earnings (post-tax) | ||||||
Market experience gains (losses) | 161 | (27) | (158) | 16 | 121 | 113 |
Updates to actuarial methods and assumptions that flow directly through income | - | - | - | - | - | - |
Restructuring charge | - | - | - | - | - | - |
Amortization of acquisition-related intangible assets | - | - | - | - | - | - |
Reinsurance transactions, tax-related items and other | (51) | (2) | - | 3 | - | (50) |
Core earnings (post-tax) | $720 | $419 | $194 | $463 | $(70) | $1,726 |
Income tax on core earnings (see above) | 94 | 110 | 37 | 89 | (32) | 298 |
Core earnings (pre-tax) | $814 | $529 | $231 | $552 | $(102) | $2,024 |
Core earnings, CER basis and U.S. dollars – 2Q25
($ millions, post-tax and based on actual foreign exchange rates in effect in the applicable reporting period, unless otherwise stated)
2Q25 | ||||||
Asia | Canada | U.S. | Global WAM | Corporate and Other | Total | |
Core earnings (post-tax) | $720 | $419 | $194 | $463 | $(70) | $1,726 |
CER adjustment(1) | (3) | - | 1 | 3 | - | 1 |
Core earnings, CER basis (post-tax) | $717 | $419 | $195 | $466 | $(70) | $1,727 |
Income tax on core earnings, CER basis(2) | 94 | 110 | 39 | 89 | (33) | 299 |
Core earnings, CER basis (pre-tax) | $811 | $529 | $234 | $555 | $(103) | $2,026 |
Core earnings (U.S. dollars) – Asia and U.S. segments | ||||||
Core earnings (post-tax)(3), US $ | $520 | $141 | ||||
CER adjustment US $(1) | (6) | - | ||||
Core earnings, CER basis (post-tax), US $ | $514 | $141 | ||||
(1)The impact of updating foreign exchange rates to that which was used in 4Q25.
(2)Income tax on core earnings adjusted to reflect the foreign exchange rates for the Statement of Income in effect for 4Q25.
(3)Core earnings (post-tax) in Canadian $ are translated to US $ using the US $ Statement of Income exchange rate for 2Q25.
103 | 2025 Annual Report | Management’s Discussion and Analysis |
Reconciliation of core earnings to net income attributed to shareholders – 1Q25
($ millions, post-tax and based on actual foreign exchange rates in effect in the applicable reporting period, unless otherwise stated)
1Q25 | ||||||
Asia | Canada | U.S. | Global WAM | Corporate and Other | Total | |
Income (loss) before income taxes | $870 | $305 | $(731) | $528 | $(273) | $699 |
Income tax (expenses) recoveries | ||||||
Core earnings | (101) | (89) | (84) | (86) | 29 | (331) |
Items excluded from core earnings | (30) | 30 | 246 | 2 | 7 | 255 |
Income tax (expenses) recoveries | (131) | (59) | 162 | (84) | 36 | (76) |
Net income (post-tax) | 739 | 246 | (569) | 444 | (237) | 623 |
Less: Net income (post-tax) attributed to | ||||||
Non-controlling interests | 67 | - | - | 1 | (2) | 66 |
Participating policyholders | 48 | 24 | - | - | - | 72 |
Net income (loss) attributed to shareholders (post-tax) | 624 | 222 | (569) | 443 | (235) | 485 |
Less: Items excluded from core earnings (post-tax) | ||||||
Market experience gains (losses) | (77) | (152) | (930) | (11) | (162) | (1,332) |
Updates to actuarial methods and assumptions that flow directly through income | - | - | - | - | - | - |
Restructuring charge | - | - | - | - | - | - |
Amortization of acquisition-related intangible assets | - | - | - | - | - | - |
Reinsurance transactions, tax-related items and other | (4) | - | - | - | 54 | 50 |
Core earnings (post-tax) | $705 | $374 | $361 | $454 | $(127) | $1,767 |
Income tax on core earnings (see above) | 101 | 89 | 84 | 86 | (29) | 331 |
Core earnings (pre-tax) | $806 | $463 | $445 | $540 | $(156) | $2,098 |
Core earnings, CER basis and U.S. dollars – 1Q25
($ millions, post-tax and based on actual foreign exchange rates in effect in the applicable reporting period, unless otherwise stated)
1Q25 | ||||||
Asia | Canada | U.S. | Global WAM | Corporate and Other | Total | |
Core earnings (post-tax) | $705 | $374 | $361 | $454 | $(127) | $1,767 |
CER adjustment(1) | (19) | - | (10) | (10) | - | (39) |
Core earnings, CER basis (post-tax) | $686 | $374 | $351 | $444 | $(127) | $1,728 |
Income tax on core earnings, CER basis(2) | 97 | 89 | 81 | 85 | (28) | 324 |
Core earnings, CER basis (pre-tax) | $783 | $463 | $432 | $529 | $(155) | $2,052 |
Core earnings (U.S. dollars) – Asia and U.S. segments | ||||||
Core earnings (post-tax)(3), US $ | $492 | $251 | ||||
CER adjustment US $(1) | - | - | ||||
Core earnings, CER basis (post-tax), US $ | $492 | $251 | ||||
(1)The impact of updating foreign exchange rates to that which was used in 4Q25.
(2)Income tax on core earnings adjusted to reflect the foreign exchange rates for the Statement of Income in effect for 4Q25.
(3)Core earnings (post-tax) in Canadian $ are translated to US $ using the US $ Statement of Income exchange rate for 1Q25.
| 104 | |
Reconciliation of core earnings to net income attributed to shareholders – 4Q24(1)
($ millions, post-tax and based on actual foreign exchange rates in effect in the applicable reporting period, unless otherwise stated)
4Q24 | ||||||
Asia | Canada | U.S. | Global WAM | Corporate and Other | Total | |
Income (loss) before income taxes | $781 | $579 | $112 | $419 | $222 | $2,113 |
Income tax (expenses) recoveries | ||||||
Core earnings | (97) | (97) | (98) | (83) | 30 | (345) |
Items excluded from core earnings | (59) | (20) | 89 | 48 | (119) | (61) |
Income tax (expenses) recoveries | (156) | (117) | (9) | (35) | (89) | (406) |
Net income (post-tax) | 625 | 462 | 103 | 384 | 133 | 1,707 |
Less: Net income (post-tax) attributed to | ||||||
Non-controlling interests | 18 | - | - | - | 4 | 22 |
Participating policyholders | 24 | 23 | - | - | - | 47 |
Net income (loss) attributed to shareholders (post-tax) | 583 | 439 | 103 | 384 | 129 | 1,638 |
Less: Items excluded from core earnings (post-tax) | ||||||
Market experience gains (losses) | (83) | 55 | (309) | (23) | 168 | (192) |
Updates to actuarial methods and assumptions that flow directly through income | - | - | - | - | - | - |
Restructuring charge | - | (6) | - | (46) | - | (52) |
Amortization of acquisition-related intangible assets | - | - | - | - | - | - |
Reinsurance transactions, tax-related items and other | 26 | - | - | (6) | (45) | (25) |
Core earnings (post-tax) | $640 | $390 | $412 | $459 | $6 | $1,907 |
Income tax on core earnings (see above) | 97 | 97 | 98 | 83 | (30) | 345 |
Core earnings (pre-tax) | $737 | $487 | $510 | $542 | $(24) | $2,252 |
(1)This reconciliation and related core earnings reconciliation below have been updated to align with the presentation of GMT in 2025. See the “Global Minimum
Taxes” section above for more information.
Core earnings, CER basis and U.S. dollars – 4Q24
($ millions, post-tax and based on actual foreign exchange rates in effect in the applicable reporting period, unless otherwise stated)
4Q24 | ||||||
Asia | Canada | U.S. | Global WAM | Corporate and Other | Total | |
Core earnings (post-tax) | $640 | $390 | $412 | $459 | $6 | $1,907 |
CER adjustment(1) | (4) | - | (2) | (1) | - | (7) |
Core earnings, CER basis (post-tax) | $636 | $390 | $410 | $458 | $6 | $1,900 |
Income tax on core earnings, CER basis(2) | 98 | 97 | 97 | 83 | (31) | 344 |
Core earnings, CER basis (pre-tax) | $734 | $487 | $507 | $541 | $(25) | $2,244 |
Core earnings (U.S. dollars) – Asia and U.S. segments | ||||||
Core earnings (post-tax)(3), US $ | $457 | $294 | ||||
CER adjustment US $(1) | (1) | - | ||||
Core earnings, CER basis (post-tax), US $ | $456 | $294 | ||||
(1)The impact of updating foreign exchange rates to that which was used in 4Q25.
(2)Income tax on core earnings adjusted to reflect the foreign exchange rates for the Statement of Income in effect for 4Q25.
(3)Core earnings (post-tax) in Canadian $ are translated to US $ using the US $ Statement of Income exchange rate for 4Q24.
1 2024 core earnings in this section has been updated to align with the presentation of the GMT in 2025. See the “Global Minimum Taxes” section above for more
information.
105 | 2025 Annual Report | Management’s Discussion and Analysis |
Segment core earnings by business line or geographic source1
($ millions, post-tax and based on actual foreign exchange rates in effect in the applicable reporting period, unless otherwise stated)
Asia
Quarterly Results | Full Year Results | ||||||
(US $ millions) | 4Q25 | 3Q25 | 2Q25 | 1Q25 | 4Q24 | 2025 | 2024 |
Hong Kong | $318 | $298 | $259 | $256 | $230 | $1,131 | $901 |
Japan | 108 | 103 | 97 | 87 | 87 | 395 | 362 |
Asia Other(1) | 164 | 157 | 159 | 149 | 151 | 629 | 570 |
International High Net Worth | 129 | 114 | |||||
Mainland China | 61 | 41 | |||||
Singapore | 238 | 216 | |||||
Vietnam | 121 | 126 | |||||
Other Emerging Markets(2) | 80 | 73 | |||||
Regional Office | (26) | (8) | 5 | - | (11) | (29) | (34) |
Total Asia core earnings | $564 | $550 | $520 | $492 | $457 | $2,126 | $1,799 |
(1)Core earnings for Asia Other is reported by country annually, on a full year basis.
(2)Other Emerging Markets includes Indonesia, the Philippines, Malaysia, Thailand, Cambodia and Myanmar.
Quarterly Results | Full Year Results | ||||||
(US $ millions), CER basis(1) | 4Q25 | 3Q25 | 2Q25 | 1Q25 | 4Q24 | 2025 | 2024 |
Hong Kong | $318 | $298 | $259 | $256 | $231 | $1,131 | $901 |
Japan | 108 | 99 | 91 | 86 | 86 | 384 | 357 |
Asia Other(2) | 164 | 156 | 159 | 150 | 150 | 629 | 568 |
International High Net Worth | 129 | 114 | |||||
Mainland China | 62 | 42 | |||||
Singapore | 239 | 223 | |||||
Vietnam | 120 | 120 | |||||
Other Emerging Markets(3) | 79 | 69 | |||||
Regional Office | (26) | (8) | 5 | - | (11) | (29) | (34) |
Total Asia core earnings, CER basis | $564 | $545 | $514 | $492 | $456 | $2,115 | $1,792 |
(1)Core earnings adjusted to reflect the foreign exchange rates for the Statement of Income in effect for 4Q25.
(2)Core earnings for Asia Other are reported by country annually, on a full year basis.
(3)Other Emerging Markets includes Indonesia, the Philippines, Malaysia, Thailand, Cambodia and Myanmar.
Canada
Quarterly Results | Full Year Results | ||||||
(Canadian $ in millions) | 4Q25 | 3Q25 | 2Q25 | 1Q25 | 4Q24 | 2025 | 2024 |
Insurance | $320 | $326 | $326 | $280 | $295 | $1,252 | $1,188 |
Annuities | 57 | 62 | 56 | 58 | 51 | 233 | 210 |
Manulife Bank | 36 | 40 | 37 | 36 | 44 | 149 | 170 |
Total Canada core earnings | $413 | $428 | $419 | $374 | $390 | $1,634 | $1,568 |
U.S.
Quarterly Results | Full Year Results | ||||||
(US $ in millions) | 4Q25 | 3Q25 | 2Q25 | 1Q25 | 4Q24 | 2025 | 2024 |
U.S. Insurance | $200 | $218 | $114 | $229 | $256 | $761 | $1,064 |
U.S. Annuities | 29 | 23 | 27 | 22 | 38 | 101 | 170 |
Total U.S. core earnings | $229 | $241 | $141 | $251 | $294 | $862 | $1,234 |
| 106 | |
Global WAM by business line
Quarterly Results | Full Year Results | ||||||
(Canadian $ in millions) | 4Q25 | 3Q25 | 2Q25 | 1Q25 | 4Q24 | 2025 | 2024 |
Retirement | $268 | $305 | $265 | $263 | $259 | $1,101 | $950 |
Retail | 155 | 154 | 145 | 141 | 161 | 595 | 581 |
Institutional asset management | 67 | 66 | 53 | 50 | 39 | 236 | 142 |
Total Global WAM core earnings | $490 | $525 | $463 | $454 | $459 | $1,932 | $1,673 |
Quarterly Results | Full Year Results | ||||||
(Canadian $ in millions), CER basis(1) | 4Q25 | 3Q25 | 2Q25 | 1Q25 | 4Q24 | 2025 | 2024 |
Retirement | $268 | $307 | $267 | $257 | $259 | $1,099 | $963 |
Retail | 155 | 154 | 146 | 139 | 160 | 594 | 586 |
Institutional asset management | 67 | 67 | 53 | 48 | 39 | 235 | 144 |
Total Global WAM core earnings, CER basis | $490 | $528 | $466 | $444 | $458 | $1,928 | $1,693 |
(1)Core earnings adjusted to reflect the foreign exchange rates for the Statement of Income in effect for 4Q25.
Global WAM by geographic source
Quarterly Results | Full Year Results | ||||||
(Canadian $ in millions) | 4Q25 | 3Q25 | 2Q25 | 1Q25 | 4Q24 | 2025 | 2024 |
Asia | $116 | $149 | $126 | $138 | $135 | $529 | $497 |
Canada | 117 | 124 | 109 | 110 | 108 | 460 | 390 |
U.S. | 257 | 252 | 228 | 206 | 216 | 943 | 786 |
Total Global WAM core earnings | $490 | $525 | $463 | $454 | $459 | $1,932 | $1,673 |
Quarterly Results | Full Year Results | ||||||
(Canadian $ in millions), CER basis(1) | 4Q25 | 3Q25 | 2Q25 | 1Q25 | 4Q24 | 2025 | 2024 |
Asia | $116 | $149 | $127 | $134 | $134 | $526 | $504 |
Canada | 117 | 124 | 109 | 110 | 108 | 460 | 390 |
U.S. | 257 | 255 | 230 | 200 | 216 | 942 | 799 |
Total Global WAM core earnings, CER basis | $490 | $528 | $466 | $444 | $458 | $1,928 | $1,693 |
(1)Core earnings adjusted to reflect the foreign exchange rates for the Statement of Income in effect for 4Q25.
Core earnings available to common shareholders is a financial measure that is used in the calculation of core ROE and core
EPS. It is calculated as core earnings (post-tax) less preferred share dividends and other equity distributions.
Quarterly Results | Full Year Results | ||||||
($ millions, post-tax and based on actual foreign exchange rates in effect in the applicable reporting period, unless otherwise stated) | 4Q25 | 3Q25 | 2Q25 | 1Q25 | 4Q24 | 2025 | 2024 |
Core earnings(1) | $1,993 | $2,035 | $1,726 | $1,767 | $1,907 | $7,521 | $7,182 |
Less: Preferred share dividends and other equity distributions(2) | 103 | 58 | 103 | 57 | 101 | 321 | 311 |
Core earnings available to common shareholders | 1,890 | 1,977 | 1,623 | 1,710 | 1,806 | 7,200 | 6,871 |
CER adjustment(3) | - | 10 | 1 | (39) | (7) | (28) | 86 |
Core earnings available to common shareholders, CER basis | $1,890 | $1,987 | $1,624 | $1,671 | $1,799 | $7,172 | $6,957 |
(1)2024 core earnings and core earnings available to common shareholders have been updated to align with the presentation of GMT in 2025. See the “Global
Minimum Taxes” section above for more information.
(2)Preferred share dividends and other equity distributions are recorded in the Corporate and Other segment. As a result, core earnings and core earnings available
to common shareholders are the same figure for Asia, Canada, U.S. and Global WAM segments. Core earnings for Corporate and Other segment is reduced by
preferred shares and other equity distributions to arrive at core earnings available to common shareholders. See above for the reconciliation of core earnings to
net income attributed to shareholders for each segment.
(3)The impact of updating foreign exchange rates to that which was used in 4Q25.
107 | 2025 Annual Report | Management’s Discussion and Analysis |
Core ROE measures profitability using core earnings available to common shareholders as a percentage of the capital deployed
to earn the core earnings. The Company calculates core ROE using average common shareholders’ equity quarterly, as the
average of common shareholders’ equity at the start and end of the quarter, and annually, as the average of the quarterly
average common shareholders’ equity for the year.
Quarterly Results | Full Year Results | ||||||
($ millions, unless otherwise stated) | 4Q25 | 3Q25 | 2Q25 | 1Q25 | 4Q24 | 2025 | 2024 |
Core earnings available to common shareholders(1) | $1,890 | $1,977 | $1,623 | $1,710 | $1,806 | $7,200 | $6,871 |
Annualized core earnings available to common shareholders (post-tax) | $7,498 | $7,844 | $6,510 | $6,935 | $7,185 | $7,200 | $6,871 |
Average common shareholders’ equity (see below) | $43,759 | $43,238 | $43,448 | $44,394 | $43,613 | $43,709 | $42,288 |
Core ROE (annualized) (%)(1) | 17.1% | 18.1% | 15.0% | 15.6% | 16.5% | 16.5% | 16.2% |
Average common shareholders’ equity | |||||||
Total shareholders’ and other equity | $50,121 | $50,716 | $49,080 | $51,135 | $50,972 | $50,121 | $50,972 |
Less: Preferred shares and other equity | 6,660 | 6,660 | 6,660 | 6,660 | 6,660 | 6,660 | 6,660 |
Common shareholders’ equity | $43,461 | $44,056 | $42,420 | $44,475 | $44,312 | $43,461 | $44,312 |
Average common shareholders’ equity | $43,759 | $43,238 | $43,448 | $44,394 | $43,613 | $43,709 | $42,288 |
(1)2024 core earnings available to common shareholders and core ROE have been updated to align with the presentation of GMT in 2025. See the “Global Minimum
Taxes” section above for more information.
Core EPS is equal to core earnings available to common shareholders divided by diluted weighted average common shares
outstanding.
Core earnings related to Financial and Strategic Targets
The Company measures its progress on certain 2025 and 2027 financial and strategic targets using core earnings, including core
earnings from highest potential businesses, core earnings from Asia region and core earnings from LTC and VA businesses. The
core earnings for these businesses is calculated consistent with our definition of core earnings and expressed as a percentage of
total core earnings.
Highest potential businesses
For the years ended December 31, | ||
($ millions and post-tax, unless otherwise stated)(1) | 2025 | 2024 |
Core earnings highest potential businesses(2) | $5,649 | $4,898 |
Core earnings - all other businesses | 1,872 | 2,284 |
Core earnings | 7,521 | 7,182 |
Items excluded from core earnings | (1,949) | (1,797) |
Net income (loss) attributed to shareholders | $5,572 | $5,385 |
Highest potential businesses core earnings contribution | 75% | 68% |
(1)2024 core earnings, items excluded from core earnings and core earnings contribution have been updated to align with the presentation of GMT in 2025. See the
“Global Minimum Taxes” section above for more information.
(2)Includes core earnings from Asia and Global WAM segments, Canada Group Benefits, and North American behavioural insurance products.
Asia region
For the years ended December 31, | ||
($ millions and post-tax, unless otherwise stated)(1) | 2025 | 2024 |
Core earnings of Asia region(2) | $3,498 | $2,963 |
Core earnings - all other businesses | 4,023 | 4,219 |
Core earnings | 7,521 | 7,182 |
Items excluded from core earnings | (1,949) | (1,797) |
Net income (loss) attributed to shareholders | $5,572 | $5,385 |
Asia region core earnings contribution(2) | 47% | 41% |
(1)2024 core earnings, items excluded from core earnings and core earnings contribution have been updated to align with the presentation of GMT in 2025. See the
“Global Minimum Taxes” section above for more information.
(2)Includes core earnings from Asia segment and Global WAM’s business in Asia.
| 108 | |
LTC and VA businesses
For the years ended December 31, | ||
($ millions and post-tax, unless otherwise stated)(1) | 2025 | 2024 |
Core earnings of LTC and VA businesses(2) | $702 | $744 |
Core earnings - all other businesses | 6,819 | 6,438 |
Core earnings | 7,521 | 7,182 |
Items excluded from core earnings | (1,949) | (1,797) |
Net income (loss) attributed to shareholders | $5,572 | $5,385 |
LTC and VA businesses core earnings contribution | 9% | 10% |
(1)2024 core earnings, items excluded from core earnings and core earnings contribution have been updated to align with the presentation of GMT in 2025. See the
“Global Minimum Taxes” section above for more information.
(2)Includes core earnings from U.S. long-term care and Asia, Canada and U.S. variable annuities businesses.
The effective tax rate on core earnings is equal to income tax on core earnings divided by pre-tax core earnings.
The operating segment core earnings contribution measures the core earnings contribution from each operating segment,
expressed as a percentage. The operating segments are Asia, Canada, U.S. and Global WAM. For each operating segment, the
percentage is calculated as the core earnings from that segment divided by the sum of core earnings from all four of the
operating segments. As of December 31, 2025, Asia, Canada, U.S. and Global WAM operating core earnings contributions were
38%, 21%, 16% and 25%, respectively (December 31, 2024 – 33%, 21%, 23% and 23%, respectively, after updating our 2024
core earnings by segment to align with the presentation of GMT in 2025. See “Global Minimum Taxes” above for more
information).
109 | 2025 Annual Report | Management’s Discussion and Analysis |
Drivers of Earnings (“DOE”) is used to identify the primary sources of gains or losses in each reporting period. It is one of the
key tools we use to understand and manage our business. The DOE line items are comprised of amounts that have been
included in our financial statements. The core DOE shows the sources of core earnings and the items excluded from core
earnings, reconciled to net income attributed to shareholders. The elements of the core earnings DOE are described below:
Net Insurance Service Result represents the core earnings associated with providing insurance service to policyholders within
the period including:
•Expected earnings on insurance contracts which includes the release of risk adjustment for expired non-financial risk, the
CSM recognized for service provided, and expected earnings on short-term PAA insurance business.
•Impact of new insurance business relates to income at initial recognition from new insurance contracts. Losses would
occur if the group of new insurance contracts was onerous at initial recognition. If reinsurance contracts provide coverage for
the direct insurance contracts, then the loss is offset by a corresponding gain on reinsurance contracts held.
•Insurance experience gains (losses) arise from items such as claims, persistency, and expenses, where the actual
experience in the current period differs from the expected results assumed in the insurance and investment contract
liabilities. Generally, this line would be driven by claims and expenses, as persistency experience relates to future service
and would be offset by changes to the carrying amount of the contractual service margin unless the group is onerous, in
which case the impact of persistency experience would be included in core earnings.
•Other represents pre-tax net income on residual items in the insurance result section.
Net Investment Result represents the core earnings associated with investment results within the period. Note that results
associated with Global WAM and Manulife Bank are shown on separate DOE lines. However within the Consolidated Statements
of Income, the results associated with these businesses would impact the total investment result. This section includes:
•Expected investment earnings, which is the difference between expected asset returns and the associated finance income
or expense from insurance and investment contract liabilities, net of investment expenses.
•Change in expected credit loss, which is the gain or charge to net income attributed to shareholders for credit losses to
bring the allowance for credit losses to a level management considers adequate for expected credit-related losses on its
portfolio.
•Expected earnings on surplus reflects the expected investment return on surplus assets.
•Other represents pre-tax net income on residual items in the investment result section.
Global WAM is the pre-tax net income from the Global Wealth and Asset Management segment, adjusted for applicable items
excluded from core earnings as noted in the core earnings (loss) section above.
Manulife Bank is the pre-tax net income from Manulife Bank, adjusted for applicable items excluded from core earnings as
noted in the core earnings (loss) section above.
Other represents net income associated with items outside of the net insurance service result, net investment result, Global
WAM and Manulife Bank. Other includes lines attributed to core earnings such as:
•Non-directly attributable expenses are expenses incurred by the Company which are not directly attributable to fulfilling
insurance contracts. Non-directly attributable expenses exclude non-directly attributable investment expenses as they are
included in the net investment result.
•Other represents pre-tax net income on residual items in the Other section. Most notably this would include the cost of
financing debt issued by Manulife.
Net income attributed to shareholders includes the following items excluded from core earnings:
•Market experience gains (losses) related to items excluded from core earnings that relate to changes in market variables.
•Updates to actuarial methods and assumptions that flow directly through income related to updates in the methods
and assumptions used to value insurance contract liabilities.
•Restructuring charges includes a charge taken to reorganize operations.
•Amortization and impairment of intangible assets acquired in a business combination, except for amortization of
software and distribution agreements. As noted above, this item is now excluded from core earnings commencing in 3Q25 to
better represent the underlying earnings capacity of acquired businesses, consistent with our definition of core earnings, and
to better align with industry practice. Prior periods have not been restated as these amounts are not considered material,
and use the definition of core earnings in effect for those periods.
•Reinsurance transactions, tax-related items and other include the impacts of new or changes to in-force reinsurance
contracts, the impact of enacted or substantively enacted income tax rate changes and other amounts defined as items
excluded from core earnings not specifically captured in the lines above.
All of the above items are discussed in more detail in our definition of items excluded from core earnings.
| 110 | |
DOE Reconciliation – 2025
($ millions, pre-tax and based on actual foreign exchange rates in effect in the applicable reporting period, unless otherwise stated)
2025 | ||||||
Asia | Canada | U.S. | Global WAM | Corporate and Other | Total | |
Net insurance service result reconciliation | ||||||
Total insurance service result - financial statements | $2,518 | $1,514 | $394 | $- | $100 | $4,526 |
Less: Insurance service result attributed to: | ||||||
Items excluded from core earnings | (79) | 81 | 88 | - | (1) | 89 |
NCI | 85 | - | - | - | - | 85 |
Participating policyholders | 257 | 90 | - | - | - | 347 |
Core net insurance service result | 2,255 | 1,343 | 306 | - | 101 | 4,005 |
Core net insurance service result, CER adjustment(1) | (13) | - | (3) | - | 2 | (14) |
Core net insurance service result, CER basis | $2,242 | $1,343 | $303 | $- | $103 | $3,991 |
Total investment result reconciliation | ||||||
Total investment result per financial statements | $2,004 | $1,449 | $(1,083) | $(977) | $1,016 | $2,409 |
Less: Reclassify Manulife Bank(2) and Global WAM to their own DOE lines | - | 1,338 | - | (977) | - | 361 |
Add: Consolidation and other adjustments from Other DOE line | - | 3 | 80 | - | (682) | (599) |
Less: Net investment result attributed to: | ||||||
Items excluded from core earnings | 364 | (429) | (2,275) | (1) | (21) | (2,362) |
NCI | 253 | - | - | 1 | (2) | 252 |
Participating policyholders | 22 | (62) | - | - | - | (40) |
Core net investment result | 1,365 | 605 | 1,272 | - | 357 | 3,599 |
Core net investment result, CER adjustment(1) | (13) | - | (3) | - | - | (16) |
Core net investment result, CER basis | $1,352 | $605 | $1,269 | $- | $357 | $3,583 |
Manulife Bank and Global WAM by DOE line reconciliation | ||||||
Manulife Bank and Global WAM net income attributed to shareholders | $- | $211 | $- | $2,245 | $- | $2,456 |
Less: Manulife Bank and Global WAM attributed to: | ||||||
Items excluded from core earnings | - | 3 | - | (37) | - | (34) |
Core earnings in Manulife Bank and Global WAM | - | 208 | - | 2,282 | - | 2,490 |
Core earnings in Manulife Bank and Global WAM, CER adjustment(1) | - | - | - | (5) | - | (5) |
Core earnings in Manulife Bank and Global WAM, CER basis | $- | $208 | $- | $2,277 | $- | $2,485 |
Other reconciliation | ||||||
Other revenue per financial statements | $13 | $301 | $160 | $8,020 | $(365) | $8,129 |
General expenses per financial statements | (366) | (617) | (181) | (3,260) | (477) | (4,901) |
Commissions related to non-insurance contracts | 3 | (69) | 16 | (1,528) | 39 | (1,539) |
Interest expenses per financial statements | (43) | (842) | (14) | (3) | (628) | (1,530) |
Total financial statements values included in Other | (393) | (1,227) | (19) | 3,229 | (1,431) | 159 |
Less: Reclassifications: | ||||||
Manulife Bank and Global WAM to their own DOE lines | - | (1,127) | - | 3,222 | - | 2,095 |
Consolidation and other adjustments to net investment result DOE line | - | 3 | 80 | - | (683) | (600) |
Less: Other attributed to: | ||||||
Items excluded from core earnings | (84) | 3 | (2) | (2) | 135 | 50 |
NCI | 13 | 1 | - | 9 | (1) | 22 |
Participating policyholders | (12) | - | - | - | - | (12) |
Add: Participating policyholders’ earnings transfer to shareholders | 48 | 14 | - | - | - | 62 |
Other core earnings | (262) | (93) | (97) | - | (882) | (1,334) |
Other core earnings, CER adjustment(1) | 3 | - | - | - | - | 3 |
Other core earnings, CER basis | $(259) | $(93) | $(97) | $- | $(882) | $(1,331) |
Income tax (expenses) recoveries reconciliation | ||||||
Income tax (expenses) recoveries per financial statements | $(716) | $(384) | $181 | $(341) | $226 | $(1,034) |
Less: Income tax (expenses) recoveries attributed to: | ||||||
Items excluded from core earnings | (198) | 21 | 456 | 9 | 21 | 309 |
NCI | (81) | (1) | - | - | 1 | (81) |
Participating policyholders | (48) | 25 | - | - | - | (23) |
Core income tax (expenses) recoveries | (389) | (429) | (275) | (350) | 204 | (1,239) |
Core income tax (expenses) recoveries, CER adjustment(1) | 3 | - | 1 | 1 | (1) | 4 |
Core income tax (expenses) recoveries, CER basis | $(386) | $(429) | $(274) | $(349) | $203 | $(1,235) |
(1)The impact of updating foreign exchange rates to that which was used in 4Q25.
(2)Manulife Bank is part of Canada segment.
111 | 2025 Annual Report | Management’s Discussion and Analysis |
DOE Reconciliation – 2024(1)
($ millions, pre-tax and based on actual foreign exchange rates in effect in the applicable reporting period, unless otherwise stated)
2024 | ||||||
Asia | Canada | U.S. | Global WAM | Corporate and Other | Total | |
Net insurance service result reconciliation | ||||||
Total insurance service result - financial statements | $2,160 | $1,320 | $357 | $- | $164 | $4,001 |
Less: Insurance service result attributed to: | ||||||
Items excluded from core earnings | (11) | (5) | (205) | - | 1 | (220) |
NCI | 101 | - | - | - | - | 101 |
Participating policyholders | 201 | 71 | - | - | - | 272 |
Core net insurance service result | 1,869 | 1,254 | 562 | - | 163 | 3,848 |
Core net insurance service result, CER adjustment(2) | 27 | - | 9 | - | 3 | 39 |
Core net insurance service result, CER basis | $1,896 | $1,254 | $571 | $- | $166 | $3,887 |
Total investment result reconciliation | ||||||
Total investment result per financial statements | $1,248 | $1,789 | $(218) | $(982) | $1,684 | $3,521 |
Less: Reclassify Manulife Bank(3) and Global WAM to their own DOE lines | - | 1,547 | - | (982) | - | 565 |
Add: Consolidation and other adjustments from Other DOE line | - | - | - | - | (656) | (656) |
Less: Net investment result attributed to: | ||||||
Items excluded from core earnings | (212) | (397) | (1,809) | - | 612 | (1,806) |
NCI | 202 | - | - | - | 4 | 206 |
Participating policyholders | 24 | 57 | - | - | - | 81 |
Core net investment result | 1,234 | 582 | 1,591 | - | 412 | 3,819 |
Core net investment result, CER adjustment(2) | 15 | - | 29 | - | - | 44 |
Core net investment result, CER basis | $1,249 | $582 | $1,620 | $- | $412 | $3,863 |
Manulife Bank and Global WAM by DOE line reconciliation | ||||||
Manulife Bank and Global WAM net income attributed to shareholders | $- | $235 | $- | $1,747 | $- | $1,982 |
Less: Manulife Bank and Global WAM attributed to: | ||||||
Items excluded from core earnings | - | - | - | (160) | - | (160) |
Core earnings in Manulife Bank and Global WAM | - | 235 | - | 1,907 | - | 2,142 |
Core earnings in Manulife Bank and Global WAM, CER adjustment(2) | - | - | - | 21 | - | 21 |
Core earnings in Manulife Bank and Global WAM, CER basis | $- | $235 | $- | $1,928 | $- | $2,163 |
Other reconciliation | ||||||
Other revenue per financial statements | $155 | $294 | $137 | $7,439 | $(437) | $7,588 |
General expenses per financial statements | (330) | (613) | (139) | (3,249) | (528) | (4,859) |
Commissions related to non-insurance contracts | (8) | (64) | 8 | (1,454) | 38 | (1,480) |
Interest expenses per financial statements | (28) | (1,047) | (13) | (7) | (586) | (1,681) |
Total financial statements values included in Other | (211) | (1,430) | (7) | 2,729 | (1,513) | (432) |
Less: Reclassifications: | ||||||
Manulife Bank and Global WAM to their own DOE lines | - | (1,311) | - | 2,729 | - | 1,418 |
Consolidation and other adjustments to net investment result DOE line | - | (1) | - | - | (656) | (657) |
Less: Other attributed to: | ||||||
Items excluded from core earnings | 80 | 2 | 48 | (2) | 54 | 182 |
NCI | (1) | - | - | 2 | - | 1 |
Participating policyholders | (7) | (5) | - | - | - | (12) |
Add: Participating policyholders’ earnings transfer to shareholders | 36 | 11 | - | - | - | 47 |
Other core earnings | (247) | (104) | (55) | - | (911) | (1,317) |
Other core earnings, CER adjustment(2) | (3) | - | - | - | - | (3) |
Other core earnings, CER basis | $(250) | $(104) | $(55) | $- | $(911) | $(1,320) |
Income tax (expenses) recoveries reconciliation | ||||||
Income tax (expenses) recoveries per financial statements | $(460) | $(353) | $3 | $(148) | $(254) | $(1,212) |
Less: Income tax (expenses) recoveries attributed to: | ||||||
Items excluded from core earnings | 32 | 53 | 411 | 86 | (375) | 207 |
NCI | (61) | - | - | - | - | (61) |
Participating policyholders | (41) | (7) | - | - | - | (48) |
Core income tax (expenses) recoveries | (390) | (399) | (408) | (234) | 121 | (1,310) |
Core income tax (expenses) recoveries, CER adjustment(2) | (7) | - | (7) | (1) | - | (15) |
Core income tax (expenses) recoveries, CER basis | $(397) | $(399) | $(415) | $(235) | $121 | $(1,325) |
(1)This reconciliation has been updated to align with the presentation of GMT in 2025. See the “Global Minimum Taxes” section for more information.
(2)The impact of updating foreign exchange rates to that which was used in 4Q25.
(3)Manulife Bank is part of Canada segment.
| 112 | |
DOE Reconciliation – 4Q25
($ millions, pre-tax and based on actual foreign exchange rates in effect in the applicable reporting period, unless otherwise stated)
4Q25 | ||||||
Asia | Canada | U.S. | Global WAM | Corporate and Other | Total | |
Net insurance service result reconciliation | ||||||
Total insurance service result - financial statements | $692 | $362 | $136 | $- | $66 | $1,256 |
Less: Insurance service result attributed to: | ||||||
Items excluded from core earnings | (4) | (2) | 23 | - | (2) | 15 |
NCI | 20 | - | - | - | - | 20 |
Participating policyholders | 70 | 25 | - | - | - | 95 |
Core net insurance service result | 606 | 339 | 113 | - | 68 | 1,126 |
Core net insurance service result, CER adjustment(1) | - | - | - | - | - | - |
Core net insurance service result, CER basis | $606 | $339 | $113 | $- | $68 | $1,126 |
Total investment result reconciliation | ||||||
Total investment result per financial statements | $322 | $316 | $(38) | $(287) | $325 | $638 |
Less: Reclassify Manulife Bank(2) and Global WAM to their own DOE lines | - | 341 | - | (287) | - | 54 |
Add: Consolidation and other adjustments from Other DOE line | 1 | (1) | 27 | - | (181) | (154) |
Less: Net investment result attributed to: | ||||||
Items excluded from core earnings | (63) | (175) | (309) | - | 53 | (494) |
NCI | 8 | - | - | - | - | 8 |
Participating policyholders | 6 | (7) | - | - | - | (1) |
Core net investment result | 372 | 156 | 298 | - | 91 | 917 |
Core net investment result, CER adjustment(1) | - | - | - | - | - | - |
Core net investment result, CER basis | $372 | $156 | $298 | $- | $91 | $917 |
Manulife Bank and Global WAM by DOE line reconciliation | ||||||
Manulife Bank and Global WAM net income attributed to shareholders | $- | $50 | $- | $536 | $- | $586 |
Less: Manulife Bank and Global WAM attributed to: | ||||||
Items excluded from core earnings | - | (1) | - | (47) | - | (48) |
Core earnings in Manulife Bank and Global WAM | - | 51 | - | 583 | - | 634 |
Core earnings in Manulife Bank and Global WAM, CER adjustment(1) | - | - | - | - | - | - |
Core earnings in Manulife Bank and Global WAM, CER basis | $- | $51 | $- | $583 | $- | $634 |
Other reconciliation | ||||||
Other revenue per financial statements | $31 | $70 | $39 | $2,119 | $(112) | $2,147 |
General expenses per financial statements | (119) | (159) | (39) | (889) | (121) | (1,327) |
Commissions related to non-insurance contracts | (1) | (18) | 6 | (399) | 8 | (404) |
Interest expenses per financial statements | (26) | (217) | (3) | (1) | (158) | (405) |
Total financial statements values included in Other | (115) | (324) | 3 | 830 | (383) | 11 |
Less: Reclassifications: | ||||||
Manulife Bank and Global WAM to their own DOE lines | - | (291) | - | 823 | - | 532 |
Consolidation and other adjustments to net investment result DOE line | 1 | (1) | 27 | - | (182) | (155) |
Less: Other attributed to: | ||||||
Items excluded from core earnings | (11) | (8) | (7) | - | 24 | (2) |
NCI | 4 | - | - | 7 | - | 11 |
Participating policyholders | (2) | 3 | - | - | - | 1 |
Add: Participating policyholders’ earnings transfer to shareholders | 15 | 5 | - | - | - | 20 |
Other core earnings | (92) | (22) | (17) | - | (225) | (356) |
Other core earnings, CER adjustment(1) | - | - | - | - | - | - |
Other core earnings, CER basis | $(92) | $(22) | $(17) | $- | $(225) | $(356) |
Income tax (expenses) recoveries reconciliation | ||||||
Income tax (expenses) recoveries per financial statements | $(203) | $(86) | $(20) | $(83) | $82 | $(310) |
Less: Income tax (expenses) recoveries attributed to: | ||||||
Items excluded from core earnings | (84) | 25 | 55 | 10 | 30 | 36 |
NCI | (6) | - | - | - | - | (6) |
Participating policyholders | (12) | - | - | - | - | (12) |
Core income tax (expenses) recoveries | (101) | (111) | (75) | (93) | 52 | (328) |
Core income tax (expenses) recoveries, CER adjustment(1) | - | - | - | - | - | - |
Core income tax (expenses) recoveries, CER basis | $(101) | $(111) | $(75) | $(93) | $52 | $(328) |
(1)The impact of updating foreign exchange rates to that which was used in 4Q25.
(2)Manulife Bank is part of Canada segment.
113 | 2025 Annual Report | Management’s Discussion and Analysis |
DOE Reconciliation – 3Q25
($ millions, pre-tax and based on actual foreign exchange rates in effect in the applicable reporting period, unless otherwise stated)
3Q25 | ||||||
Asia | Canada | U.S. | Global WAM | Corporate and Other | Total | |
Net insurance service result reconciliation | ||||||
Total insurance service result - financial statements | $641 | $465 | $72 | $- | $43 | $1,221 |
Less: Insurance service result attributed to: | ||||||
Items excluded from core earnings | (19) | 88 | 4 | - | 1 | 74 |
NCI | 22 | - | - | - | - | 22 |
Participating policyholders | 60 | 26 | - | - | - | 86 |
Core net insurance service result | 578 | 351 | 68 | - | 42 | 1,039 |
Core net insurance service result, CER adjustment(1) | 3 | - | - | - | 1 | 4 |
Core net insurance service result, CER basis | $581 | $351 | $68 | $- | $43 | $1,043 |
Total investment result reconciliation | ||||||
Total investment result per financial statements | $653 | $402 | $(205) | $(210) | $229 | $869 |
Less: Reclassify Manulife Bank(2) and Global WAM to their own DOE lines | - | 353 | - | (210) | - | 143 |
Add: Consolidation and other adjustments from Other DOE line | (2) | 1 | 25 | - | (173) | (149) |
Less: Net investment result attributed to: | ||||||
Items excluded from core earnings | 202 | (48) | (548) | (1) | (30) | (425) |
NCI | 134 | - | - | 1 | - | 135 |
Participating policyholders | (16) | (67) | - | - | - | (83) |
Core net investment result | 331 | 165 | 368 | - | 86 | 950 |
Core net investment result, CER adjustment(1) | 1 | - | 4 | - | - | 5 |
Core net investment result, CER basis | $332 | $165 | $372 | $- | $86 | $955 |
Manulife Bank and Global WAM by DOE line reconciliation | ||||||
Manulife Bank and Global WAM net income attributed to shareholders | $- | $58 | $- | $607 | $- | $665 |
Less: Manulife Bank and Global WAM attributed to: | ||||||
Items excluded from core earnings | - | 4 | - | - | - | 4 |
Core earnings in Manulife Bank and Global WAM | - | 54 | - | 607 | - | 661 |
Core earnings in Manulife Bank and Global WAM, CER adjustment(1) | - | - | - | 3 | - | 3 |
Core earnings in Manulife Bank and Global WAM, CER basis | $- | $54 | $- | $610 | $- | $664 |
Other reconciliation | ||||||
Other revenue per financial statements | $73 | $72 | $63 | $2,024 | $(87) | $2,145 |
General expenses per financial statements | (94) | (152) | (43) | (818) | (125) | (1,232) |
Commissions related to non-insurance contracts | (1) | (15) | 7 | (390) | 13 | (386) |
Interest expenses per financial statements | (4) | (221) | (3) | - | (160) | (388) |
Total financial statements values included in Other | (26) | (316) | 24 | 816 | (359) | 139 |
Less: Reclassifications: | ||||||
Manulife Bank and Global WAM to their own DOE lines | - | (295) | - | 816 | - | 521 |
Consolidation and other adjustments to net investment result DOE line | (2) | 1 | 25 | 1 | (173) | (148) |
Less: Other attributed to: | ||||||
Items excluded from core earnings | 41 | 6 | 24 | (2) | 43 | 112 |
NCI | 7 | 1 | - | 1 | (1) | 8 |
Participating policyholders | (2) | (3) | - | - | - | (5) |
Add: Participating policyholders’ earnings transfer to shareholders | 13 | 3 | - | - | - | 16 |
Other core earnings | (57) | (23) | (25) | - | (228) | (333) |
Other core earnings, CER adjustment(1) | (1) | - | - | - | 1 | - |
Other core earnings, CER basis | $(58) | $(23) | $(25) | $- | $(227) | $(333) |
Income tax (expenses) recoveries reconciliation | ||||||
Income tax (expenses) recoveries per financial statements | $(233) | $(124) | $34 | $(81) | $94 | $(310) |
Less: Income tax (expenses) recoveries attributed to: | ||||||
Items excluded from core earnings | (88) | (29) | 113 | 1 | 2 | (1) |
NCI | (35) | (1) | - | - | 1 | (35) |
Participating policyholders | (17) | 25 | - | - | - | 8 |
Core income tax (expenses) recoveries | (93) | (119) | (79) | (82) | 91 | (282) |
Core income tax (expenses) recoveries, CER adjustment(1) | (1) | - | - | - | (1) | (2) |
Core income tax (expenses) recoveries, CER basis | $(94) | $(119) | $(79) | $(82) | $90 | $(284) |
(1)The impact of updating foreign exchange rates to that which was used in 4Q25.
(2)Manulife Bank is part of Canada segment.
| 114 | |
DOE Reconciliation – 2Q25
($ millions, pre-tax and based on actual foreign exchange rates in effect in the applicable reporting period, unless otherwise stated)
2Q25 | ||||||
Asia | Canada | U.S. | Global WAM | Corporate and Other | Total | |
Net insurance service result reconciliation | ||||||
Total insurance service result - financial statements | $571 | $370 | $39 | $- | $26 | $1,006 |
Less: Insurance service result attributed to: | ||||||
Items excluded from core earnings | (43) | - | 28 | - | - | (15) |
NCI | 16 | - | - | - | - | 16 |
Participating policyholders | 65 | 25 | - | - | - | 90 |
Core net insurance service result | 533 | 345 | 11 | - | 26 | 915 |
Core net insurance service result, CER adjustment(1) | (1) | - | - | - | - | (1) |
Core net insurance service result, CER basis | $532 | $345 | $11 | $- | $26 | $914 |
Total investment result reconciliation | ||||||
Total investment result per financial statements | $685 | $433 | $10 | $(208) | $346 | $1,266 |
Less: Reclassify Manulife Bank(2) and Global WAM to their own DOE lines | - | 312 | - | (208) | - | 104 |
Add: Consolidation and other adjustments from Other DOE line | 1 | 3 | 28 | - | (157) | (125) |
Less: Net investment result attributed to: | ||||||
Items excluded from core earnings | 275 | (27) | (208) | - | 105 | 145 |
NCI | 51 | - | - | - | - | 51 |
Participating policyholders | 24 | (2) | - | - | - | 22 |
Core net investment result | 336 | 153 | 246 | - | 84 | 819 |
Core net investment result, CER adjustment(1) | (4) | - | 3 | - | - | (1) |
Core net investment result, CER basis | $332 | $153 | $249 | $- | $84 | $818 |
Manulife Bank and Global WAM by DOE line reconciliation | ||||||
Manulife Bank and Global WAM net income attributed to shareholders | $- | $53 | $- | $575 | $- | $628 |
Less: Manulife Bank and Global WAM attributed to: | ||||||
Items excluded from core earnings | - | - | - | 23 | - | 23 |
Core earnings in Manulife Bank and Global WAM | - | 53 | - | 552 | - | 605 |
Core earnings in Manulife Bank and Global WAM, CER adjustment(1) | - | - | - | 3 | - | 3 |
Core earnings in Manulife Bank and Global WAM, CER basis | $- | $53 | $- | $555 | $- | $608 |
Other reconciliation | ||||||
Other revenue per financial statements | $(92) | $85 | $33 | $1,902 | $(77) | $1,851 |
General expenses per financial statements | (73) | (154) | (47) | (756) | (110) | (1,140) |
Commissions related to non-insurance contracts | 7 | (18) | 1 | (362) | 8 | (364) |
Interest expenses per financial statements | (6) | (190) | (5) | (1) | (156) | (358) |
Total financial statements values included in Other | (164) | (277) | (18) | 783 | (335) | (11) |
Less: Reclassifications: | ||||||
Manulife Bank and Global WAM to their own DOE lines | - | (259) | - | 783 | - | 524 |
Consolidation and other adjustments to net investment result DOE line | 1 | 3 | 28 | - | (157) | (125) |
Less: Other attributed to: | ||||||
Items excluded from core earnings | (97) | 3 | (20) | - | 34 | (80) |
NCI | 1 | - | - | - | - | 1 |
Participating policyholders | (5) | 1 | - | - | - | (4) |
Add: Participating policyholders’ earnings transfer to shareholders | 9 | 3 | - | - | - | 12 |
Other core earnings | (55) | (22) | (26) | - | (212) | (315) |
Other core earnings, CER adjustment(1) | 2 | - | - | - | (1) | 1 |
Other core earnings, CER basis | $(53) | $(22) | $(26) | $- | $(213) | $(314) |
Income tax (expenses) recoveries reconciliation | ||||||
Income tax (expenses) recoveries per financial statements | $(149) | $(115) | $5 | $(94) | $15 | $(338) |
Less: Income tax (expenses) recoveries attributed to: | ||||||
Items excluded from core earnings | (25) | (5) | 42 | (5) | (17) | (10) |
NCI | (19) | - | - | - | - | (19) |
Participating policyholders | (11) | - | - | - | - | (11) |
Core income tax (expenses) recoveries | (94) | (110) | (37) | (89) | 32 | (298) |
Core income tax (expenses) recoveries, CER adjustment(1) | - | - | (2) | - | 1 | (1) |
Core income tax (expenses) recoveries, CER basis | $(94) | $(110) | $(39) | $(89) | $33 | $(299) |
(1)The impact of updating foreign exchange rates to that which was used in 4Q25.
(2)Manulife Bank is part of Canada segment.
115 | 2025 Annual Report | Management’s Discussion and Analysis |
DOE Reconciliation – 1Q25
($ millions, pre-tax and based on actual foreign exchange rates in effect in the applicable reporting period, unless otherwise stated)
1Q25 | ||||||
Asia | Canada | U.S. | Global WAM | Corporate and Other | Total | |
Net insurance service result reconciliation | ||||||
Total insurance service result - financial statements | $614 | $317 | $147 | $- | $(35) | $1,043 |
Less: Insurance service result attributed to: | ||||||
Items excluded from core earnings | (13) | (5) | 33 | - | - | 15 |
NCI | 27 | - | - | - | - | 27 |
Participating policyholders | 62 | 14 | - | - | - | 76 |
Core net insurance service result | 538 | 308 | 114 | - | (35) | 925 |
Core net insurance service result, CER adjustment(1) | (15) | - | (3) | - | 1 | (17) |
Core net insurance service result, CER basis | $523 | $308 | $111 | $- | $(34) | $908 |
Total investment result reconciliation | ||||||
Total investment result per financial statements | $344 | $298 | $(850) | $(272) | $116 | $(364) |
Less: Reclassify Manulife Bank(2) and Global WAM to their own DOE lines | - | 332 | - | (272) | - | 60 |
Add: Consolidation and other adjustments from Other DOE line | - | - | - | - | (171) | (171) |
Less: Net investment result attributed to: | ||||||
Items excluded from core earnings | (50) | (179) | (1,210) | - | (149) | (1,588) |
NCI | 60 | - | - | - | (2) | 58 |
Participating policyholders | 8 | 14 | - | - | - | 22 |
Core net investment result | 326 | 131 | 360 | - | 96 | 913 |
Core net investment result, CER adjustment(1) | (10) | - | (10) | - | - | (20) |
Core net investment result, CER basis | $316 | $131 | $350 | $- | $96 | $893 |
Manulife Bank and Global WAM by DOE line reconciliation | ||||||
Manulife Bank and Global WAM net income attributed to shareholders | $- | $50 | $- | $527 | $- | $577 |
Less: Manulife Bank and Global WAM attributed to: | ||||||
Items excluded from core earnings | - | - | - | (13) | - | (13) |
Core earnings in Manulife Bank and Global WAM | - | 50 | - | 540 | - | 590 |
Core earnings in Manulife Bank and Global WAM, CER adjustment(1) | - | - | - | (11) | - | (11) |
Core earnings in Manulife Bank and Global WAM, CER basis | $- | $50 | $- | $529 | $- | $579 |
Other reconciliation | ||||||
Other revenue per financial statements | $1 | $74 | $25 | $1,975 | $(89) | $1,986 |
General expenses per financial statements | (80) | (152) | (52) | (797) | (121) | (1,202) |
Commissions related to non-insurance contracts | (2) | (18) | 2 | (377) | 10 | (385) |
Interest expenses per financial statements | (7) | (214) | (3) | (1) | (154) | (379) |
Total financial statements values included in Other | (88) | (310) | (28) | 800 | (354) | 20 |
Less: Reclassifications: | ||||||
Manulife Bank and Global WAM to their own DOE lines | - | (282) | - | 800 | - | 518 |
Consolidation and other adjustments to net investment result DOE line | - | - | - | (1) | (171) | (172) |
Less: Other attributed to: | ||||||
Items excluded from core earnings | (17) | 2 | 1 | - | 34 | 20 |
NCI | 1 | - | - | 1 | - | 2 |
Participating policyholders | (3) | (1) | - | - | - | (4) |
Add: Participating policyholders’ earnings transfer to shareholders | 11 | 3 | - | - | - | 14 |
Other core earnings | (58) | (26) | (29) | - | (217) | (330) |
Other core earnings, CER adjustment(1) | 2 | - | - | - | - | 2 |
Other core earnings, CER basis | $(56) | $(26) | $(29) | $- | $(217) | $(328) |
Income tax (expenses) recoveries reconciliation | ||||||
Income tax (expenses) recoveries per financial statements | $(131) | $(59) | $162 | $(83) | $35 | $(76) |
Less: Income tax (expenses) recoveries attributed to: | ||||||
Items excluded from core earnings | (1) | 30 | 246 | 3 | 6 | 284 |
NCI | (21) | - | - | - | - | (21) |
Participating policyholders | (8) | - | - | - | - | (8) |
Core income tax (expenses) recoveries | (101) | (89) | (84) | (86) | 29 | (331) |
Core income tax (expenses) recoveries, CER adjustment(1) | 4 | - | 3 | 1 | (1) | 7 |
Core income tax (expenses) recoveries, CER basis | $(97) | $(89) | $(81) | $(85) | $28 | $(324) |
(1)The impact of updating foreign exchange rates to that which was used in 4Q25.
(2)Manulife Bank is part of Canada segment.
| 116 | |
DOE Reconciliation – 4Q24(1)
($ millions, pre-tax and based on actual foreign exchange rates in effect in the applicable reporting period, unless otherwise stated)
4Q24 | ||||||
Asia | Canada | U.S. | Global WAM | Corporate and Other | Total | |
Net insurance service result reconciliation | ||||||
Total insurance service result - financial statements | $545 | $330 | $(257) | $- | $71 | $689 |
Less: Insurance service result attributed to: | ||||||
Items excluded from core earnings | (6) | (3) | (408) | - | 1 | (416) |
NCI | 18 | - | - | - | - | 18 |
Participating policyholders | 51 | 7 | - | - | - | 58 |
Core net insurance service result | 482 | 326 | 151 | - | 70 | 1,029 |
Core net insurance service result, CER adjustment(2) | (2) | - | (1) | - | - | (3) |
Core net insurance service result, CER basis | $480 | $326 | $150 | $- | $70 | $1,026 |
Total investment result reconciliation | ||||||
Total investment result per financial statements | $279 | $612 | $369 | $(316) | $615 | $1,559 |
Less: Reclassify Manulife Bank(3) and Global WAM to their own DOE lines | - | 382 | - | (316) | - | 66 |
Add: Consolidation and other adjustments from Other DOE line | 1 | 1 | - | - | (198) | (196) |
Less: Net investment result attributed to: | ||||||
Items excluded from core earnings | (56) | 85 | (16) | - | 287 | 300 |
NCI | 14 | - | - | - | 4 | 18 |
Participating policyholders | (3) | 15 | - | - | - | 12 |
Core net investment result | 325 | 131 | 385 | - | 126 | 967 |
Core net investment result, CER adjustment(2) | (1) | - | (2) | - | - | (3) |
Core net investment result, CER basis | $324 | $131 | $383 | $- | $126 | $964 |
Manulife Bank and Global WAM by DOE line reconciliation | ||||||
Manulife Bank and Global WAM net income attributed to shareholders | $- | $53 | $- | $420 | $- | $473 |
Less: Manulife Bank and Global WAM attributed to: | ||||||
Items excluded from core earnings | - | (7) | - | (122) | - | (129) |
Core earnings in Manulife Bank and Global WAM | - | 60 | - | 542 | - | 602 |
Core earnings in Manulife Bank and Global WAM, CER adjustment(2) | - | - | - | (1) | - | (1) |
Core earnings in Manulife Bank and Global WAM, CER basis | $- | $60 | $- | $541 | $- | $601 |
Other reconciliation | ||||||
Other revenue per financial statements | $79 | $72 | $45 | $2,005 | $(198) | $2,003 |
General expenses per financial statements | (112) | (162) | (45) | (883) | (126) | (1,328) |
Commissions related to non-insurance contracts | (1) | (16) | 2 | (385) | 10 | (390) |
Interest expenses per financial statements | (9) | (257) | (2) | (2) | (150) | (420) |
Total financial statements values included in Other | (43) | (363) | - | 735 | (464) | (135) |
Less: Reclassifications: | ||||||
Manulife Bank and Global WAM to their own DOE lines | - | (328) | - | 735 | - | 407 |
Consolidation and other adjustments to net investment result DOE line | 1 | - | - | 1 | (198) | (196) |
Less: Other attributed to: | ||||||
Items excluded from core earnings | 40 | - | 26 | (1) | (46) | 19 |
NCI | 1 | - | - | - | - | 1 |
Participating policyholders | - | (2) | - | - | - | (2) |
Add: Participating policyholders’ earnings transfer to shareholders | 15 | 3 | - | - | - | 18 |
Other core earnings | (70) | (30) | (26) | - | (220) | (346) |
Other core earnings, CER adjustment(2) | - | - | - | - | (1) | (1) |
Other core earnings, CER basis | $(70) | $(30) | $(26) | $- | $(221) | $(347) |
Income tax (expenses) recoveries reconciliation | ||||||
Income tax (expenses) recoveries per financial statements | $(156) | $(117) | $(9) | $(35) | $(89) | $(406) |
Less: Income tax (expenses) recoveries attributed to: | ||||||
Items excluded from core earnings | (35) | (26) | 89 | 48 | (119) | (43) |
NCI | (15) | - | - | - | - | (15) |
Participating policyholders | (9) | 6 | - | - | - | (3) |
Core income tax (expenses) recoveries | (97) | (97) | (98) | (83) | 30 | (345) |
Core income tax (expenses) recoveries, CER adjustment(2) | (1) | - | 1 | - | 1 | 1 |
Core income tax (expenses) recoveries, CER basis | $(98) | $(97) | $(97) | $(83) | $31 | $(344) |
(1)This reconciliation has been updated to align with the presentation of GMT in 2025. See the “Global Minimum Taxes” section for more information.
(2)The impact of updating foreign exchange rates to that which was used in 4Q25.
(3)Manulife Bank is part of Canada segment.
117 | 2025 Annual Report | Management’s Discussion and Analysis |
Common share core dividend payout ratio is a ratio that measures the percentage of core earnings paid to common
shareholders as dividends. It is calculated as dividends per common share divided by core EPS.
Quarterly Results | Full Year Results | ||||||
4Q25 | 3Q25 | 2Q25 | 1Q25 | 4Q24 | 2025 | 2024 | |
Per share dividend | $0.44 | $0.44 | $0.44 | $0.44 | $0.40 | $1.76 | $1.60 |
Core EPS | $1.12 | $1.16 | $0.95 | $0.99 | $1.03 | $4.21 | $3.85 |
Common share core dividend payout ratio(1) | 39% | 38% | 46% | 44% | 39% | 42% | 42% |
(1)2024 core EPS and common share core dividend ratio have been updated to align with the presentation of GMT in 2025. See the “Global Minimum Taxes” section
above for more information.
The contractual service margin (“CSM”) is a liability that represents future unearned profits on insurance contracts written. It is
a component of insurance and reinsurance contract liabilities on the Statement of Financial Position and includes amounts
attributed to common shareholders, participating policyholders and NCI.
Our reporting of CSM is net of NCI. Changes in the CSM net of NCI are classified as organic and inorganic. CSM growth is the
percentage change in the CSM net of NCI compared with a prior period on a constant exchange rate basis.
Changes in CSM net of NCI that are classified as organic include the following impacts:
•Impact of new insurance business (“impact of new business” or “new business CSM”) is the impact from insurance
contracts initially recognized in the period and includes acquisition expense related gains (losses) which impact the CSM in
the period. It excludes the impact from entering into new in-force reinsurance contracts which would generally be considered
a management action;
•Expected movement related to finance income or expenses (“interest accretion”) includes interest accreted on the CSM
net of NCI during the period and the expected change on VFA contracts if returns are as expected;
•CSM recognized for service provided (“CSM amortization”) is the portion of the CSM net of NCI that is recognized in net
income for service provided in the period; and
•Insurance experience gains (losses) and other is primarily the change from experience variances that relate to future
periods. This includes persistency experience and changes in future period cash flows caused by other current period
experience.
Changes in CSM net of NCI that are classified as inorganic include the following impacts:
•Updates to actuarial methods and assumptions that adjust the CSM;
•Effect of movement in exchange rates over the reporting period;
•Impact of markets; and
•Reinsurance transactions, tax-related and other items that reflect the impact related to future cash flows from items such
as gains or losses on disposition of a business, the impact of enacted or substantively enacted income tax rate changes,
material adjustments that are exceptional in nature and other amounts not specifically captured in the previous inorganic
items.
Post-tax CSM is used in the definition of financial leverage ratio and consolidated capital and is calculated as the CSM adjusted
for the marginal income tax rate in the jurisdictions that report a CSM balance. Post-tax CSM net of NCI is used in the adjusted
book value per share calculation and is calculated as the CSM net of NCI adjusted for the marginal income tax rate in the
jurisdictions that report this balance.
New business CSM growth is the percentage change in the new business CSM compared with a prior period on a constant
exchange rate basis.
| 118 | |
CSM and post-tax CSM information
($ millions pre-tax and based on actual foreign exchange rates in effect in the applicable reporting period, unless otherwise stated)
As at | Dec 31, 2025 | Sept 30, 2025 | June 30, 2025 | Mar 31, 2025 | Dec 31, 2024 |
CSM | $26,568 | $26,283 | $23,722 | $23,713 | $23,425 |
Less: CSM for NCI | 1,599 | 1,565 | 1,406 | 1,417 | 1,298 |
CSM, net of NCI | $24,969 | $24,718 | $22,316 | $22,296 | $22,127 |
CER adjustment(1) | - | (387) | (93) | (834) | (684) |
CSM, net of NCI, CER basis | $24,969 | $24,331 | $22,223 | $21,462 | $21,443 |
CSM by segment | |||||
Asia | $17,750 | $17,580 | $15,786 | $15,904 | $15,540 |
Asia NCI | 1,599 | 1,565 | 1,406 | 1,417 | 1,298 |
Canada | 4,459 | 4,490 | 4,133 | 4,052 | 4,109 |
U.S. | 2,760 | 2,649 | 2,386 | 2,329 | 2,468 |
Corporate and Other | - | (1) | 11 | 11 | 10 |
CSM | $26,568 | $26,283 | $23,722 | $23,713 | $23,425 |
CSM, CER adjustment(1) | |||||
Asia | $- | $(348) | $(104) | $(724) | $(566) |
Asia NCI | - | 5 | 40 | (16) | (5) |
Canada | - | - | - | - | - |
U.S. | - | (39) | 11 | (111) | (118) |
Corporate and Other | - | - | 1 | - | - |
Total | $- | $(382) | $(52) | $(851) | $(689) |
CSM, CER basis | |||||
Asia | $17,750 | $17,232 | $15,682 | $15,180 | $14,974 |
Asia NCI | 1,599 | 1,570 | 1,446 | 1,401 | 1,293 |
Canada | 4,459 | 4,490 | 4,133 | 4,052 | 4,109 |
U.S. | 2,760 | 2,610 | 2,397 | 2,218 | 2,350 |
Corporate and Other | - | (1) | 12 | 11 | 10 |
Total CSM, CER basis | $26,568 | $25,901 | $23,670 | $22,862 | $22,736 |
Post-tax CSM | |||||
CSM | $26,568 | $26,283 | $23,722 | $23,713 | $23,425 |
Marginal tax rate on CSM | (4,403) | (4,347) | (3,940) | (3,929) | (3,928) |
Post-tax CSM(2) | $22,165 | $21,936 | $19,782 | $19,784 | $19,497 |
CSM, net of NCI | $24,969 | $24,718 | $22,316 | $22,296 | $22,127 |
Marginal tax rate on CSM net of NCI | (4,236) | (4,181) | (3,789) | (3,772) | (3,774) |
Post-tax CSM net of NCI(2) | $20,733 | $20,537 | $18,527 | $18,524 | $18,353 |
(1)The impact of reflecting CSM and CSM net of NCI using the foreign exchange rates for the Statement of Financial Position in effect for 4Q25.
(2)2024 post-tax CSM and post-tax CSM, net of NCI have been updated to align with the presentation of GMT in 2025. See the “Global Minimum Taxes” section for
more information.
119 | 2025 Annual Report | Management’s Discussion and Analysis |
New business CSM(1) detail, CER basis
($ millions pre-tax, and based on actual foreign exchange rates in effect in the applicable reporting period, unless otherwise stated)
Quarterly Results | Full Year Results | ||||||
4Q25 | 3Q25 | 2Q25 | 1Q25 | 4Q24 | 2025 | 2024 | |
New business CSM | |||||||
Hong Kong | $244 | $287 | $286 | $316 | $299 | $1,133 | $921 |
Japan | 159 | 76 | 74 | 81 | 66 | 390 | 290 |
Asia Other | 294 | 349 | 303 | 318 | 221 | 1,264 | 937 |
International High Net Worth | 189 | 187 | |||||
Mainland China | 356 | 270 | |||||
Singapore | 619 | 391 | |||||
Vietnam | 22 | 17 | |||||
Other Emerging Markets | 78 | 72 | |||||
Asia | 697 | 712 | 663 | 715 | 586 | 2,787 | 2,148 |
Canada | 135 | 109 | 100 | 91 | 116 | 435 | 357 |
U.S. | 188 | 145 | 119 | 101 | 140 | 553 | 382 |
Total new business CSM | $1,020 | $966 | $882 | $907 | $842 | $3,775 | $2,887 |
New business CSM, CER adjustment(2),(3) | |||||||
Hong Kong | $- | $4 | $2 | $(8) | $(1) | $(2) | $13 |
Japan | - | (3) | (4) | (3) | (1) | (10) | 2 |
Asia Other | - | 3 | 3 | (1) | 2 | 5 | 32 |
International High Net Worth | 1 | 4 | |||||
Mainland China | 2 | 10 | |||||
Singapore | 3 | 19 | |||||
Vietnam | - | (1) | |||||
Other Emerging Markets | (1) | - | |||||
Asia | - | 4 | 1 | (12) | - | (7) | 47 |
Canada | - | - | - | - | - | - | - |
U.S. | - | 2 | 1 | (3) | - | - | 6 |
Total new business CSM | $- | $6 | $2 | $(15) | $- | $(7) | $53 |
New business CSM, CER basis | |||||||
Hong Kong | $244 | $291 | $288 | $308 | $298 | $1,131 | $934 |
Japan | 159 | 73 | 70 | 78 | 65 | 380 | 292 |
Asia Other | 294 | 352 | 306 | 317 | 223 | 1,269 | 969 |
International High Net Worth | 190 | 191 | |||||
Mainland China | 358 | 280 | |||||
Singapore | 622 | 410 | |||||
Vietnam | 22 | 16 | |||||
Other Emerging Markets | 77 | 72 | |||||
Asia | 697 | 716 | 664 | 703 | 586 | 2,780 | 2,195 |
Canada | 135 | 109 | 100 | 91 | 116 | 435 | 357 |
U.S. | 188 | 147 | 120 | 98 | 140 | 553 | 388 |
Total new business CSM, CER basis | $1,020 | $972 | $884 | $892 | $842 | $3,768 | $2,940 |
(1)New business CSM is net of NCI.
(2)The impact of updating foreign exchange rates to that which was used in 4Q25.
(3)New business CSM for Asia Other is reported by country annually, on a full year basis. Other Emerging Markets within Asia Other include Indonesia, the
Philippines, Malaysia, Thailand, Cambodia and Myanmar.
The Company also uses financial performance measures that are prepared on a constant exchange rate basis, which exclude
the impact of currency fluctuations (from local currency to Canadian dollars at a total Company level and from local currency to
U.S. dollars in Asia). Such financial measures may be stated on a constant exchange rate basis or the percentage growth/
decline in the financial measure on a constant exchange rate basis, using the income statement and balance sheet exchange
rates effective for the fourth quarter of 2025.
Information supporting constant exchange rate basis for GAAP and non-GAAP financial measures is presented below and
throughout this section.
Basic EPS and diluted EPS, CER basis is equal to common shareholders’ net income on a CER basis divided by the weighted
average common shares outstanding and diluted weighted common shares outstanding, respectively.
| 120 | |
General expenses, CER basis
($ millions, and based on actual foreign exchange rates in effect in the applicable reporting period, unless otherwise stated)
Quarterly Results | Full Year Results | ||||||
4Q25 | 3Q25 | 2Q25 | 1Q25 | 4Q24 | 2025 | 2024 | |
General expenses | $1,327 | $1,232 | $1,140 | $1,202 | $1,328 | $4,901 | $4,859 |
CER adjustment(1) | - | 6 | 3 | (17) | (2) | (8) | 52 |
General expenses, CER basis | $1,327 | $1,238 | $1,143 | $1,185 | $1,326 | $4,893 | $4,911 |
(1)The impact of updating foreign exchange rates to that which was used in 4Q25.
Net income financial measures on a CER basis
(Canadian $ in millions, post-tax and based on actual foreign exchange rates in effect in the applicable reporting period, unless otherwise stated)
Quarterly Results | Full Year Results | ||||||
4Q25 | 3Q25 | 2Q25 | 1Q25 | 4Q24 | 2025 | 2024 | |
Net income (loss) attributed to shareholders: | |||||||
Asia | $623 | $895 | $830 | $624 | $583 | $2,972 | $2,355 |
Canada | 252 | 449 | 390 | 222 | 439 | 1,313 | 1,221 |
U.S. | 81 | (75) | 36 | (569) | 103 | (527) | 135 |
Global WAM | 452 | 523 | 482 | 443 | 384 | 1,900 | 1,597 |
Corporate and Other | 91 | 7 | 51 | (235) | 129 | (86) | 77 |
Total net income (loss) attributed to shareholders | 1,499 | 1,799 | 1,789 | 485 | 1,638 | 5,572 | 5,385 |
Preferred share dividends and other equity distributions | (103) | (58) | (103) | (57) | (101) | (321) | (311) |
Common shareholders’ net income (loss) | $1,396 | $1,741 | $1,686 | $428 | $1,537 | $5,251 | $5,074 |
CER adjustment(1) | |||||||
Asia | $- | $18 | $6 | $(28) | $12 | $(4) | $71 |
Canada | - | - | - | - | - | - | 11 |
U.S. | - | 1 | - | 15 | (2) | 16 | 10 |
Global WAM | - | 7 | 3 | (13) | (1) | (3) | 22 |
Corporate and Other | - | - | 4 | 6 | - | 10 | - |
Total net income (loss) attributed to shareholders | - | 26 | 13 | (20) | 9 | 19 | 114 |
Preferred share dividends and other equity distributions | - | - | - | - | - | - | - |
Common shareholders’ net income (loss) | $- | $26 | $13 | $(20) | $9 | $19 | $114 |
Net income (loss) attributed to shareholders, CER basis | |||||||
Asia | $623 | $913 | $836 | $596 | $595 | $2,968 | $2,426 |
Canada | 252 | 449 | 390 | 222 | 439 | 1,313 | 1,232 |
U.S. | 81 | (74) | 36 | (554) | 101 | (511) | 145 |
Global WAM | 452 | 530 | 485 | 430 | 383 | 1,897 | 1,619 |
Corporate and Other | 91 | 7 | 55 | (229) | 129 | (76) | 77 |
Total net income (loss) attributed to shareholders, CER basis | 1,499 | 1,825 | 1,802 | 465 | 1,647 | 5,591 | 5,499 |
Preferred share dividends and other equity distributions, CER basis | (103) | (58) | (103) | (57) | (101) | (321) | (311) |
Common shareholders’ net income (loss), CER basis | $1,396 | $1,767 | $1,699 | $408 | $1,546 | $5,270 | $5,188 |
Asia net income attributed to shareholders, U.S. dollars | |||||||
Asia net income (loss) attributed to shareholders, US $(2) | $447 | $649 | $600 | $435 | $417 | $2,131 | $1,717 |
CER adjustment, US $(1) | - | 6 | 1 | (9) | 9 | (2) | 23 |
Asia net income (loss) attributed to shareholders, U.S. $, CER basis(1) | $447 | $655 | $601 | $426 | $426 | $2,129 | $1,740 |
Net income (loss) attributed to shareholders (pre-tax) | |||||||
Net income (loss) attributed to shareholders (post-tax) | $1,499 | $1,799 | $1,789 | $485 | $1,638 | $5,572 | $5,385 |
Tax on net income attributed to shareholders | 292 | 283 | 307 | 47 | 388 | 929 | 1,102 |
Net income (loss) attributed to shareholders (pre-tax) | 1,791 | 2,082 | 2,096 | 532 | 2,026 | 6,501 | 6,487 |
CER adjustment(1) | - | 5 | 1 | (11) | (2) | (5) | 75 |
Net income (loss) attributed to shareholders (pre-tax), CER basis | $1,791 | $2,087 | $2,097 | $521 | $2,024 | $6,496 | $6,562 |
(1)The impact of updating foreign exchange rates to that which was used in 4Q25.
(2)Asia net income attributed to shareholders (post-tax) in Canadian dollars is translated to U.S. dollars using the U.S. dollar Statement of Income rate for the
respective reporting period.
121 | 2025 Annual Report | Management’s Discussion and Analysis |
AUMA is a financial measure of the size of the Company. It is comprised of AUM and AUA. AUM includes assets of the General
Account, consisting of total invested assets and segregated funds net assets, and external client assets for which we provide
investment management services, consisting of mutual fund, institutional asset management and other fund net assets. AUA are
assets for which we provide administrative services only. Assets under management and administration is a common industry
metric for wealth and asset management businesses.
Our Global WAM business also manages assets on behalf of other segments of the Company. Global WAM-managed AUMA is
a financial measure equal to the sum of Global WAM’s AUMA and assets managed by Global WAM on behalf of other segments.
It is an important measure of the assets managed by Global WAM.
Segment share of total Company AUMA is a measure of the relative AUMA from each segment, expressed as a percentage. It is
calculated as the AUMA in that segment divided by the total Company AUMA. This measure is reported for our operating
segments and as at December 31, 2025, the segment share of total Company AUMA for Asia, Canada, U.S. and Global WAM
was 13%, 9%, 12% and 65%, respectively (as at December 31, 2024 – 12%, 9%, 13% and 64%, respectively).
AUM and AUMA reconciliations
(Canadian $ in millions, and based on actual foreign exchange rates in effect in the applicable reporting period, unless otherwise stated)
CAD $ | US $(5) | ||||||||
December 31, 2025 | December 31, 2025 | ||||||||
As at | Asia | Canada | U.S. | Global WAM | Corporate and Other | Total | Asia | U.S. | |
Total invested assets | |||||||||
Manulife Bank(1) | $- | $29,896 | $- | $- | $- | $29,896 | $- | $- | |
Derivative reclassification(2) | - | - | - | - | 4,737 | 4,737 | - | - | |
Other | 185,848 | 84,587 | 122,591 | 9,787 | 22,482 | 425,295 | 135,597 | 89,434 | |
Total | 185,848 | 114,483 | 122,591 | 9,787 | 27,219 | 459,928 | 135,597 | 89,434 | |
Segregated funds net assets | |||||||||
Institutional | - | - | - | 3,075 | - | 3,075 | - | - | |
Other(3) | 32,245 | 38,218 | 77,272 | 310,491 | (47) | 458,179 | 23,527 | 56,372 | |
Total | 32,245 | 38,218 | 77,272 | 313,566 | (47) | 461,254 | 23,527 | 56,372 | |
AUM per financial statements | 218,093 | 152,701 | 199,863 | 323,353 | 27,172 | 921,182 | 159,124 | 145,806 | |
Mutual funds | - | - | - | 338,443 | - | 338,443 | - | - | |
Institutional asset management(4) | - | - | - | 176,402 | - | 176,402 | - | - | |
Other funds | - | - | - | 22,371 | - | 22,371 | - | - | |
Total AUM | 218,093 | 152,701 | 199,863 | 860,569 | 27,172 | 1,458,398 | 159,124 | 145,806 | |
Assets under administration | - | - | - | 246,021 | - | 246,021 | - | - | |
Total AUMA | $218,093 | $152,701 | $199,863 | $1,106,590 | $27,172 | $1,704,419 | $159,124 | $145,806 | |
Total AUMA, US $(5) | $1,243,422 | ||||||||
Total AUMA | $218,093 | $152,701 | $199,863 | $1,106,590 | $27,172 | $1,704,419 | |||
CER adjustment(6) | - | - | - | - | - | - | |||
Total AUMA, CER basis | $218,093 | $152,701 | $199,863 | $1,106,590 | $27,172 | $1,704,419 | |||
Global WAM Managed AUMA | |||||||||
Global WAM AUMA | $1,106,590 | ||||||||
AUM managed by Global WAM for Manulife’s other segments | 234,370 | ||||||||
Total | $1,340,960 | ||||||||
(1)Represents net lending assets.
(2)Corporate and Other consolidation amount is related to net derivative assets reclassified from total invested assets to other lines on the Statement of Financial
Position.
(3)Corporate and Other segregated funds net assets represent elimination of amounts held by the Company.
(4)Institutional asset management excludes Institutional segregated funds net assets.
(5)US $ AUMA is calculated as total AUMA in Canadian $ divided by the US $ exchange rate in effect at the end of the quarter.
(6)The impact of updating foreign exchange rates to that which was used in 4Q25.
| 122 | |
AUM and AUMA reconciliations
(Canadian $ in millions, and based on actual foreign exchange rates in effect in the applicable reporting period, unless otherwise stated)
CAD $ | US $(5) | ||||||||
September 30, 2025 | September 30, 2025 | ||||||||
As at | Asia | Canada | U.S. | Global WAM | Corporate and Other | Total | Asia | U.S. | |
Total invested assets | |||||||||
Manulife Bank(1) | $- | $29,112 | $- | $- | $- | $29,112 | $- | $- | |
Derivative reclassification(2) | - | - | - | - | 3,308 | 3,308 | - | - | |
Other | 184,344 | 84,860 | 124,710 | 10,999 | 21,634 | 426,547 | 132,487 | 89,629 | |
Total | 184,344 | 113,972 | 124,710 | 10,999 | 24,942 | 458,967 | 132,487 | 89,629 | |
Segregated funds net assets | |||||||||
Institutional | - | - | - | 3,106 | - | 3,106 | - | - | |
Other(3) | 31,646 | 38,654 | 78,304 | 311,195 | (51) | 459,748 | 22,747 | 56,277 | |
Total | 31,646 | 38,654 | 78,304 | 314,301 | (51) | 462,854 | 22,747 | 56,277 | |
AUM per financial statements | 215,990 | 152,626 | 203,014 | 325,300 | 24,891 | 921,821 | 155,234 | 145,906 | |
Mutual funds | - | - | - | 350,545 | - | 350,545 | - | - | |
Institutional asset management(4) | - | - | - | 159,321 | - | 159,321 | - | - | |
Other funds | - | - | - | 21,518 | - | 21,518 | - | - | |
Total AUM | 215,990 | 152,626 | 203,014 | 856,684 | 24,891 | 1,453,205 | 155,234 | 145,906 | |
Assets under administration | - | - | - | 241,359 | - | 241,359 | - | - | |
Total AUMA | $215,990 | $152,626 | $203,014 | $1,098,043 | $24,891 | $1,694,564 | $155,234 | $145,906 | |
Total AUMA, US $(5) | $1,217,884 | ||||||||
Total AUMA | $215,990 | $152,626 | $203,014 | $1,098,043 | $24,891 | $1,694,564 | |||
CER adjustment(6) | (3,570) | - | (3,008) | (12,907) | - | (19,485) | |||
Total AUMA, CER basis | $212,420 | $152,626 | $200,006 | $1,085,136 | $24,891 | $1,675,079 | |||
Global WAM Managed AUMA | |||||||||
Global WAM AUMA | $1,098,043 | ||||||||
AUM managed by Global WAM for Manulife’s other segments | 233,702 | ||||||||
Total | $1,331,745 | ||||||||
Note: For footnotes (1) to (6), refer to the “AUM and AUMA reconciliation” table as at December 31, 2025 above.
123 | 2025 Annual Report | Management’s Discussion and Analysis |
AUM and AUMA reconciliations
(Canadian $ in millions, and based on actual foreign exchange rates in effect in the applicable reporting period, unless otherwise stated)
CAD $ | US $(5) | ||||||||
June 30, 2025 | June 30, 2025 | ||||||||
As at | Asia | Canada | U.S. | Global WAM | Corporate and Other | Total | Asia | U.S. | |
Total invested assets | |||||||||
Manulife Bank(1) | $- | $28,138 | $- | $- | $- | $28,138 | $- | $- | |
Derivative reclassification(2) | - | - | - | - | 4,531 | 4,531 | - | - | |
Other | 173,265 | 83,059 | 119,981 | 10,352 | 19,140 | 405,797 | 126,978 | 87,930 | |
Total | 173,265 | 111,197 | 119,981 | 10,352 | 23,671 | 438,466 | 126,978 | 87,930 | |
Segregated funds net assets | |||||||||
Institutional | - | - | - | 3,045 | - | 3,045 | - | - | |
Other(3) | 29,239 | 37,567 | 74,322 | 292,416 | (31) | 433,513 | 21,433 | 54,468 | |
Total | 29,239 | 37,567 | 74,322 | 295,461 | (31) | 436,558 | 21,433 | 54,468 | |
AUM per financial statements | 202,504 | 148,764 | 194,303 | 305,813 | 23,640 | 875,024 | 148,411 | 142,398 | |
Mutual funds | - | - | - | 331,290 | - | 331,290 | - | - | |
Institutional asset management(4) | - | - | - | 156,878 | - | 156,878 | - | - | |
Other funds | - | - | - | 19,697 | - | 19,697 | - | - | |
Total AUM | 202,504 | 148,764 | 194,303 | 813,678 | 23,640 | 1,382,889 | 148,411 | 142,398 | |
Assets under administration | - | - | - | 225,360 | - | 225,360 | - | - | |
Total AUMA | $202,504 | $148,764 | $194,303 | $1,039,038 | $23,640 | $1,608,249 | $148,411 | $142,398 | |
Total AUMA, US $(5) | $1,178,636 | ||||||||
Total AUMA | $202,504 | $148,764 | $194,303 | $1,039,038 | $23,640 | $1,608,249 | |||
CER adjustment(6) | (172) | - | 902 | 2,266 | - | 2,996 | |||
Total AUMA, CER basis | $202,332 | $148,764 | $195,205 | $1,041,304 | $23,640 | $1,611,245 | |||
Global WAM Managed AUMA | |||||||||
Global WAM AUMA | $1,039,038 | ||||||||
AUM managed by Global WAM for Manulife’s other segments | 222,676 | ||||||||
Total | $1,261,714 | ||||||||
Note: For footnotes (1) to (6), refer to the “AUM and AUMA reconciliation” table as at December 31, 2025 above.
| 124 | |
AUM and AUMA reconciliations
(Canadian $ in millions, and based on actual foreign exchange rates in effect in the applicable reporting period, unless otherwise stated)
CAD $ | US $(5) | ||||||||
March 31, 2025 | March 31, 2025 | ||||||||
As at | Asia | Canada | U.S. | Global WAM | Corporate and Other | Total | Asia | U.S. | |
Total invested assets | |||||||||
Manulife Bank(1) | $- | $27,135 | $- | $- | $- | $27,135 | $- | $- | |
Derivative reclassification(2) | - | - | - | - | 4,541 | 4,541 | - | - | |
Other | 171,732 | 84,180 | 125,793 | 9,983 | 22,373 | 414,061 | 119,318 | 87,401 | |
Total | 171,732 | 111,315 | 125,793 | 9,983 | 26,914 | 445,737 | 119,318 | 87,401 | |
Segregated funds net assets | |||||||||
Institutional | - | - | - | 3,199 | - | 3,199 | - | - | |
Other(3) | 28,560 | 37,373 | 75,103 | 284,407 | (32) | 425,411 | 19,839 | 52,182 | |
Total | 28,560 | 37,373 | 75,103 | 287,606 | (32) | 428,610 | 19,839 | 52,182 | |
AUM per financial statements | 200,292 | 148,688 | 200,896 | 297,589 | 26,882 | 874,347 | 139,157 | 139,583 | |
Mutual funds | - | - | - | 334,612 | - | 334,612 | - | - | |
Institutional asset management(4) | - | - | - | 156,560 | - | 156,560 | - | - | |
Other funds | - | - | - | 19,057 | - | 19,057 | - | - | |
Total AUM | 200,292 | 148,688 | 200,896 | 807,818 | 26,882 | 1,384,576 | 139,157 | 139,583 | |
Assets under administration | - | - | - | 218,501 | - | 218,501 | - | - | |
Total AUMA | $200,292 | $148,688 | $200,896 | $1,026,319 | $26,882 | $1,603,077 | $139,157 | $139,583 | |
Total AUMA, US $(5) | $1,113,827 | ||||||||
Total AUMA | $200,292 | $148,688 | $200,896 | $1,026,319 | $26,882 | $1,603,077 | |||
CER adjustment(6) | (7,547) | - | (9,496) | (36,044) | - | (53,087) | |||
Total AUMA, CER basis | $192,745 | $148,688 | $191,400 | $990,275 | $26,882 | $1,549,990 | |||
Global WAM Managed AUMA | |||||||||
Global WAM AUMA | $1,026,319 | ||||||||
AUM managed by Global WAM for Manulife’s other segments | 225,108 | ||||||||
Total | $1,251,427 | ||||||||
Note: For footnotes (1) to (6), refer to the “AUM and AUMA reconciliation” table as at December 31, 2025 above.
125 | 2025 Annual Report | Management’s Discussion and Analysis |
AUM and AUMA reconciliations
(Canadian $ in millions, and based on actual foreign exchange rates in effect in the applicable reporting period, unless otherwise stated)
CAD $ | US $(5) | ||||||||
December 31, 2024 | December 31, 2024 | ||||||||
As at | Asia | Canada | U.S. | Global WAM | Corporate and Other | Total | Asia | U.S. | |
Total invested assets | |||||||||
Manulife Bank(1) | $- | $26,718 | $- | $- | $- | $26,718 | $- | $- | |
Derivative reclassification(2) | - | - | - | - | 5,600 | 5,600 | - | - | |
Other | 166,590 | 80,423 | 136,833 | 9,743 | 16,590 | 410,179 | 115,843 | 95,142 | |
Total | 166,590 | 107,141 | 136,833 | 9,743 | 22,190 | 442,497 | 115,843 | 95,142 | |
Segregated funds net assets | |||||||||
Institutional | - | - | - | 3,393 | - | 3,393 | - | - | |
Other(3) | 28,622 | 38,099 | 77,440 | 288,467 | (33) | 432,595 | 19,904 | 53,845 | |
Total | 28,622 | 38,099 | 77,440 | 291,860 | (33) | 435,988 | 19,904 | 53,845 | |
AUM per financial statements | 195,212 | 145,240 | 214,273 | 301,603 | 22,157 | 878,485 | 135,747 | 148,987 | |
Mutual funds | - | - | - | 333,598 | - | 333,598 | - | - | |
Institutional asset management(4) | - | - | - | 154,096 | - | 154,096 | - | - | |
Other funds | - | - | - | 19,174 | - | 19,174 | - | - | |
Total AUM | 195,212 | 145,240 | 214,273 | 808,471 | 22,157 | 1,385,353 | 135,747 | 148,987 | |
Assets under administration | - | - | - | 222,614 | - | 222,614 | - | - | |
Total AUMA | $195,212 | $145,240 | $214,273 | $1,031,085 | $22,157 | $1,607,967 | $135,747 | $148,987 | |
Total AUMA, US $(5) | $1,118,042 | ||||||||
Total AUMA | $195,212 | $145,240 | $214,273 | $1,031,085 | $22,157 | $1,607,967 | |||
CER adjustment(6) | (5,809) | - | (9,974) | (34,744) | - | (50,527) | |||
Total AUMA, CER basis | $189,403 | $145,240 | $204,299 | $996,341 | $22,157 | $1,557,440 | |||
Global WAM Managed AUMA | |||||||||
Global WAM AUMA | $1,031,085 | ||||||||
AUM managed by Global WAM for Manulife’s other segments | 226,752 | ||||||||
Total | $1,257,837 | ||||||||
Note: For footnotes (1) to (6), refer to the “AUM and AUMA reconciliation” table as at December 31, 2025 above.
| 126 | |
Global WAM AUMA and Managed AUMA by business line and geographic source
($ millions, and based on actual foreign exchange rates in effect in the applicable reporting period, unless otherwise stated)
As at | Dec 31, 2025 | Sept 30, 2025 | June 30, 2025 | Mar 31, 2025 | Dec 31, 2024 |
Global WAM AUMA by business line | |||||
Retirement | $572,613 | $575,220 | $536,639 | $522,751 | $521,979 |
Retail | 350,180 | 356,419 | 338,616 | 339,653 | 348,938 |
Institutional asset management | 183,797 | 166,404 | 163,783 | 163,915 | 160,168 |
Total | $1,106,590 | $1,098,043 | $1,039,038 | $1,026,319 | $1,031,085 |
Global WAM AUMA by business line, CER basis(1) | |||||
Retirement | $572,613 | $568,533 | $538,621 | $503,175 | $502,657 |
Retail | 350,180 | 352,529 | 339,109 | 328,858 | 338,246 |
Institutional asset management | 183,797 | 164,074 | 163,574 | 158,242 | 155,438 |
Total | $1,106,590 | $1,085,136 | $1,041,304 | $990,275 | $996,341 |
Global WAM AUMA by geographic source | |||||
Asia | $156,030 | $153,921 | $143,573 | $144,660 | $141,098 |
Canada | 273,978 | 275,486 | 266,913 | 259,446 | 260,651 |
U.S. | 676,582 | 668,636 | 628,552 | 622,213 | 629,336 |
Total | $1,106,590 | $1,098,043 | $1,039,038 | $1,026,319 | $1,031,085 |
Global WAM AUMA by geographic source, CER basis(1) | |||||
Asia | $156,030 | $150,560 | $142,575 | $137,824 | $135,823 |
Canada | 273,978 | 275,486 | 266,913 | 259,446 | 260,651 |
U.S. | 676,582 | 659,090 | 631,816 | 593,005 | 599,867 |
Total | $1,106,590 | $1,085,136 | $1,041,304 | $990,275 | $996,341 |
Global WAM Managed AUMA by business line | |||||
Retirement | $572,613 | $575,220 | $536,639 | $522,751 | $521,979 |
Retail | 432,834 | 440,149 | 419,133 | 419,844 | 431,047 |
Institutional asset management | 335,513 | 316,376 | 305,942 | 308,832 | 304,811 |
Total | $1,340,960 | $1,331,745 | $1,261,714 | $1,251,427 | $1,257,837 |
Global WAM Managed AUMA by business line, CER basis(1) | |||||
Retirement | $572,613 | $568,533 | $538,621 | $503,175 | $502,657 |
Retail | 432,834 | 429,822 | 414,068 | 400,754 | 417,933 |
Institutional asset management | 335,513 | 312,164 | 306,296 | 297,308 | 294,316 |
Total | $1,340,960 | $1,310,519 | $1,258,985 | $1,201,237 | $1,214,906 |
Global WAM Managed AUMA by geographic source | |||||
Asia | $248,228 | $242,968 | $227,797 | $228,948 | $225,325 |
Canada | 327,177 | 328,891 | 317,864 | 311,252 | 312,816 |
U.S. | 765,555 | 759,886 | 716,053 | 711,227 | 719,696 |
Total | $1,340,960 | $1,331,745 | $1,261,714 | $1,251,427 | $1,257,837 |
Global WAM Managed AUMA by geographic source, CER basis(1) | |||||
Asia | $248,228 | $238,193 | $226,941 | $218,091 | $216,102 |
Canada | 327,177 | 328,891 | 317,864 | 311,252 | 312,816 |
U.S. | 765,555 | 743,435 | 714,180 | 671,894 | 685,988 |
Total | $1,340,960 | $1,310,519 | $1,258,985 | $1,201,237 | $1,214,906 |
(1)AUMA adjusted to reflect the foreign exchange rates for the Statement of Financial Position in effect for 4Q25.
Average assets under management and administration (“average AUMA”) is the average of Global WAM’s AUMA during
the reporting period. It is a measure used in analyzing and explaining fee income and earnings of our Global WAM segment. It is
calculated as the average of the opening balance of AUMA and the ending balance of AUMA using daily balances where
available and month-end or quarter-end averages when daily averages are unavailable. Similarly, Global WAM average
managed AUMA and average AUA are the average of Global WAM’s managed AUMA and AUA, respectively, and are
calculated in a manner consistent with average AUMA. Manulife Bank net lending assets is a financial measure equal to the
sum of Manulife Bank’s loans and mortgages, net of allowances. Manulife Bank average net lending assets is a financial
measure which is calculated as the quarter-end average of the opening and the ending balance of net lending assets. Both of
these financial measures are a measure of the size of Manulife Bank’s portfolio of loans and mortgages and are used to analyze
and explain its earnings.
127 | 2025 Annual Report | Management’s Discussion and Analysis |
As at ($ millions) | Dec 31, 2025 | Sept 30, 2025 | June 30, 2025 | Mar 31, 2025 | Dec 31, 2024 |
Mortgages | $57,119 | $56,747 | $55,479 | $55,105 | $54,447 |
Less: mortgages not held by Manulife Bank | 29,958 | 30,185 | 29,847 | 30,352 | 30,039 |
Total mortgages held by Manulife Bank | 27,161 | 26,562 | 25,632 | 24,753 | 24,408 |
Loans to Bank clients | 2,735 | 2,550 | 2,506 | 2,382 | 2,310 |
Manulife Bank net lending assets | $29,896 | $29,112 | $28,138 | $27,135 | $26,718 |
Manulife Bank average net lending assets | |||||
Beginning of period | $29,112 | $28,138 | $27,135 | $26,718 | $26,371 |
End of period | 29,896 | 29,112 | 28,138 | 27,135 | 26,718 |
Manulife Bank average net lending assets by quarter | $29,504 | $28,625 | $27,637 | $26,927 | $26,545 |
Manulife Bank average net lending assets – full year | $28,307 | $26,020 |
Financial leverage ratio is calculated as the sum of long-term debt, capital instruments and preferred shares and other equity
instruments, divided by the sum of long-term debt, capital instruments, equity and post-tax CSM.
Adjusted book value is the sum of common shareholders’ equity and post-tax CSM net of NCI. It is an important measure for
monitoring growth and measuring insurance businesses’ value. Adjusted book value per common share is calculated by
dividing adjusted book value by the number of common shares outstanding at the end of the period.
As at ($ millions) | Dec 31, 2025 | Sept 30, 2025 | June 30, 2025 | Mar 31, 2025 | Dec 31, 2024 |
Common shareholders’ equity | $43,461 | $44,056 | $42,420 | $44,475 | $44,312 |
Post-tax CSM, net of NCI(1) | 20,733 | 20,537 | 18,527 | 18,524 | 18,353 |
Adjusted book value | $64,194 | $64,593 | $60,947 | $62,999 | $62,665 |
(1)2024 quarterly post-tax CSM, net of NCI has been updated to align with the presentation of GMT in 2025. See the “Global Minimum Taxes” section for more
information.
Consolidated capital serves as a foundation of our capital management activities at the MFC level. Consolidated capital is
calculated as the sum of: (i) total equity excluding accumulated other comprehensive income (“AOCI”) on cash flow hedges; (ii)
post-tax CSM; and (iii) certain other capital instruments that qualify as regulatory capital. For regulatory reporting purposes under
the LICAT framework, the numbers are further adjusted for various additions or deductions to capital as mandated by the
guidelines defined by OSFI.
As at ($ millions) | Dec 31, 2025 | Sept 30, 2025 | June 30, 2025 | Mar 31, 2025 | Dec 31, 2024 |
Total equity | $52,488 | $52,991 | $51,253 | $53,164 | $52,960 |
Less: AOCI gain/(loss) on cash flow hedges | 87 | 58 | 68 | 89 | 119 |
Total equity excluding AOCI on cash flow hedges | 52,401 | 52,933 | 51,185 | 53,075 | 52,841 |
Post-tax CSM(1) | 22,165 | 21,936 | 19,782 | 19,784 | 19,497 |
Qualifying capital instruments | 6,990 | 7,011 | 6,985 | 7,542 | 7,532 |
Consolidated capital | $81,556 | $81,880 | $77,952 | $80,401 | $79,870 |
(1)2024 quarterly post-tax CSM has been updated to align with the presentation of GMT in 2025. See the “Global Minimum Taxes” section for more information.
| 128 | |
Core EBITDA is a financial measure which Manulife uses to better understand the long-term earnings capacity and valuation of
our Global WAM business on a basis more comparable to how the profitability of global asset managers is generally measured.
Core EBITDA presents core earnings before the impact of interest, taxes, depreciation, and amortization. Core EBITDA excludes
certain acquisition expenses related to insurance contracts in our retirement businesses which are deferred and amortized over
the expected lifetime of the customer relationship. Core EBITDA was selected as a key performance indicator for our Global
WAM business, as EBITDA is widely used among asset management peers, and core earnings is a primary profitability metric for
the Company overall.
Reconciliation of Global WAM core earnings to core EBITDA and Global WAM core EBITDA by business line and
geographic source
($ millions, pre-tax and based on actual foreign exchange rates in effect in the applicable reporting period, unless otherwise stated)
Quarterly Results | Full Year Results | ||||||
4Q25 | 3Q25 | 2Q25 | 1Q25 | 4Q24 | 2025 | 2024 | |
Global WAM core earnings (post-tax) | $490 | $525 | $463 | $454 | $459 | $1,932 | $1,673 |
Add back taxes, acquisition costs, other expenses and deferred sales commissions | |||||||
Core income tax (expenses) recoveries (see above) | 93 | 82 | 89 | 86 | 83 | 350 | 234 |
Amortization of deferred acquisition costs and other depreciation | 61 | 44 | 51 | 46 | 49 | 202 | 188 |
Amortization of deferred sales commissions | 24 | 21 | 20 | 22 | 20 | 87 | 78 |
Core EBITDA | $668 | $672 | $623 | $608 | $611 | $2,571 | $2,173 |
CER adjustment(1) | - | 6 | 3 | (13) | (2) | (4) | 24 |
Core EBITDA, CER basis | $668 | $678 | $626 | $595 | $609 | $2,567 | $2,197 |
Core EBITDA by business line | |||||||
Retirement | $373 | $387 | $358 | $351 | $330 | $1,469 | $1,199 |
Retail | 210 | 204 | 191 | 190 | 214 | 795 | 773 |
Institutional asset management | 85 | 81 | 74 | 67 | 67 | 307 | 201 |
Total | $668 | $672 | $623 | $608 | $611 | $2,571 | $2,173 |
Core EBITDA by geographic source | |||||||
Asia | $153 | $185 | $170 | $186 | $167 | $694 | $607 |
Canada | 174 | 180 | 161 | 164 | 160 | 679 | 589 |
U.S. | 341 | 307 | 292 | 258 | 284 | 1,198 | 977 |
Total | $668 | $672 | $623 | $608 | $611 | $2,571 | $2,173 |
Core EBITDA by business line, CER basis(2) | |||||||
Retirement | $373 | $391 | $360 | $343 | $330 | $1,467 | $1,213 |
Retail | 210 | 205 | 192 | 187 | 213 | 794 | 780 |
Institutional asset management | 85 | 82 | 74 | 65 | 66 | 306 | 204 |
Total, CER basis | $668 | $678 | $626 | $595 | $609 | $2,567 | $2,197 |
Core EBITDA by geographic source, CER basis(2) | |||||||
Asia | $153 | $187 | $171 | $180 | $166 | $691 | $615 |
Canada | 174 | 180 | 161 | 164 | 160 | 679 | 589 |
U.S. | 341 | 311 | 294 | 251 | 283 | 1,197 | 993 |
Total, CER basis | $668 | $678 | $626 | $595 | $609 | $2,567 | $2,197 |
(1)The impact of updating foreign exchange rates to that which was used in 4Q25.
(2)Core EBITDA adjusted to reflect the foreign exchange rates for the Statement of Income in effect for 4Q25.
129 | 2025 Annual Report | Management’s Discussion and Analysis |
Core EBITDA margin is a financial measure which Manulife uses to better understand the long-term profitability of our Global
WAM business on a more comparable basis to how profitability of global asset managers are measured. Core EBITDA margin
presents core earnings before the impact of interest, taxes, depreciation, and amortization divided by core revenue from these
businesses. Core revenue is used to calculate our core EBITDA margin, and is equal to the sum of pre-tax other revenue and
investment income in Global WAM included in core EBITDA, and it excludes such items as revenue related to integration and
acquisitions and market experience gains (losses). Core EBITDA margin was selected as a key performance indicator for our
Global WAM business, as EBITDA margin is widely used among asset management peers, and core earnings is a primary
profitability metric for the Company overall.
Quarterly Results | Full Year Results | ||||||
($ millions, unless otherwise stated) | 4Q25 | 3Q25 | 2Q25 | 1Q25 | 4Q24 | 2025 | 2024 |
Core EBITDA margin | |||||||
Core EBITDA | $668 | $672 | $623 | $608 | $611 | $2,571 | $2,173 |
Core revenue | $2,285 | $2,175 | $2,069 | $2,140 | $2,140 | $8,669 | $8,016 |
Core EBITDA margin | 29.2% | 30.9% | 30.1% | 28.4% | 28.6% | 29.7% | 27.1% |
Global WAM core revenue | |||||||
Other revenue per financial statements | $2,147 | $2,145 | $1,851 | $1,986 | $2,003 | $8,129 | $7,588 |
Less: Other revenue in segments other than Global WAM | 28 | 121 | (53) | 11 | (2) | 107 | 149 |
Other revenue in Global WAM (fee income) | $2,119 | $2,024 | $1,904 | $1,975 | $2,005 | $8,022 | $7,439 |
Investment income per financial statements | $5,358 | $4,682 | $4,740 | $4,234 | $5,250 | $19,014 | $18,249 |
Realized and unrealized gains (losses) on assets supporting insurance and investment contract liabilities per financial statements | 1,106 | 3,784 | 2,377 | (992) | (622) | 6,275 | 2,210 |
Total investment income | 6,464 | 8,466 | 7,117 | 3,242 | 4,628 | 25,289 | 20,459 |
Less: Investment income in segments other than Global WAM | 6,300 | 8,275 | 6,924 | 3,089 | 4,550 | 24,588 | 19,877 |
Investment income in Global WAM | $164 | $191 | $193 | $153 | $78 | $701 | $582 |
Total other revenue and investment income in Global WAM | $2,283 | $2,215 | $2,097 | $2,128 | $2,083 | $8,723 | $8,021 |
Less: Total revenue reported in items excluded from core earnings | |||||||
Market experience gains (losses) | (1) | 24 | 20 | (14) | (28) | 29 | 4 |
Revenue related to integration and acquisitions | (1) | 16 | 8 | 2 | (29) | 25 | 1 |
Global WAM core revenue | $2,285 | $2,175 | $2,069 | $2,140 | $2,140 | $8,669 | $8,016 |
Core expenses is used to calculate our expense efficiency ratio and is equal to total expenses that are included in core earnings
and excludes such items as legal provisions for settlements, restructuring charges, amortization of acquisition-related intangible
assets and expenses related to integration and acquisitions, that have been excluded from core earnings. Consistent with our
definition of core earnings, amortization and impairment of intangible assets acquired in a business combination, except for
amortization of software and distribution agreements, is now excluded from core expenses commencing in 3Q25. For more
information, please see above for details of our definition of core earnings.
Total expenses include the following amounts from our financial statements:
1.General expenses that flow directly through income;
2.Directly attributable maintenance expenses, which are reported in insurance service expenses and flow directly through
income; and
3.Directly attributable acquisition expenses for contracts measured using the PAA method and for other products without a
CSM, both of which are reported in insurance service expenses, and flow directly through income.
| 130 | |
Quarterly Results | Full Year Results | ||||||
($ millions, and based on actual foreign exchange rates in effect in the applicable reporting period, unless otherwise stated) | 4Q25 | 3Q25 | 2Q25 | 1Q25 | 4Q24 | 2025 | 2024 |
Core expenses | |||||||
General expenses - Statements of Income | $1,327 | $1,232 | $1,140 | $1,202 | $1,328 | $4,901 | $4,859 |
Directly attributable acquisition expense for contracts measured using the PAA method and for other products without a CSM(1) | 48 | 42 | 40 | 42 | 43 | 172 | 156 |
Directly attributable maintenance expense(1) | 542 | 524 | 514 | 532 | 517 | 2,112 | 2,074 |
Total expenses | 1,917 | 1,798 | 1,694 | 1,776 | 1,888 | 7,185 | 7,089 |
Less: General expenses included in items excluded from core earnings | |||||||
Restructuring charge | 16 | - | - | - | 67 | 16 | 92 |
Amortization of acquisition-related intangible assets | 16 | 8 | - | - | - | 24 | - |
Integration and acquisition | 7 | 22 | - | - | - | 29 | 57 |
Legal provisions and Other expenses | 5 | 10 | 5 | - | 24 | 20 | 41 |
Total | 44 | 40 | 5 | - | 91 | 89 | 190 |
Core expenses | $1,873 | $1,758 | $1,689 | $1,776 | $1,797 | $7,096 | $6,899 |
CER adjustment(2) | - | 10 | 2 | (24) | - | (12) | 75 |
Core expenses, CER basis | $1,873 | $1,768 | $1,691 | $1,752 | $1,797 | $7,084 | $6,974 |
Total expenses | $1,917 | $1,798 | $1,694 | $1,776 | $1,888 | $7,185 | $7,089 |
CER adjustment(2) | - | 10 | 3 | (25) | (1) | (12) | 77 |
Total expenses, CER basis | $1,917 | $1,808 | $1,697 | $1,751 | $1,887 | $7,173 | $7,166 |
(1)Expenses are components of insurance service expenses on the Statements of Income that flow directly through income.
(2)The impact of updating foreign exchange rates to that which was used in 4Q25.
Expense efficiency ratio is a financial measure which Manulife uses to measure progress towards our target to be more
efficient. It is defined as core expenses divided by the sum of core earnings before income taxes (“pre-tax core earnings”) and
core expenses.
Net annualized fee income yield on average AUMA (“Net fee income yield”) is a financial measure that represents the net
annualized fee income from Global WAM channels over average AUMA. This measure provides information on Global WAM’s
adjusted return generated from managing AUMA.
Net annualized fee income is a financial measure that represents Global WAM income before income taxes, adjusted to
exclude items unrelated to net fee income, including general expenses, investment income, non-AUMA related net benefits and
claims, and net premium taxes. It also excludes the components of Global WAM net fee income from managing assets on behalf
of other segments. This measure is annualized based on the number of days in the year divided by the number of days in the
reporting period.
Reconciliation of income before income taxes to net fee income yield
Quarterly Results | Full Year Results | ||||||
($ millions, unless otherwise stated) | 4Q25 | 3Q25 | 2Q25 | 1Q25 | 4Q24 | 2025 | 2024 |
Income before income taxes | $1,905 | $2,229 | $2,261 | $699 | $2,113 | $7,094 | $7,090 |
Less: Income before income taxes for segments other than Global WAM | 1,363 | 1,623 | 1,686 | 171 | 1,694 | 4,843 | 5,343 |
Global WAM income before income taxes | 542 | 606 | 575 | 528 | 419 | 2,251 | 1,747 |
Items unrelated to net fee income | 834 | 715 | 667 | 739 | 882 | 2,955 | 2,995 |
Global WAM net fee income | 1,376 | 1,321 | 1,242 | 1,267 | 1,301 | 5,206 | 4,742 |
Less: Net fee income from other segments | 196 | 176 | 171 | 170 | 181 | 713 | 674 |
Global WAM net fee income excluding net fee income from other segments | 1,180 | 1,145 | 1,071 | 1,097 | 1,120 | 4,493 | 4,068 |
Net annualized fee income | $4,682 | $4,543 | $4,297 | $4,451 | $4,455 | $4,492 | $4,068 |
Average Assets under Management and Administration | $1,115,108 | $1,065,832 | $1,005,290 | $1,041,116 | $1,015,454 | $1,070,839 | $946,087 |
Net fee income yield (bps) | 42.0 | 42.6 | 42.7 | 42.7 | 43.9 | 41.9 | 43.0 |
131 | 2025 Annual Report | Management’s Discussion and Analysis |
New business value (“NBV”) is calculated as the present value of shareholders’ interests in expected future distributable
earnings, after the cost of capital calculated under the LICAT framework in Canada and the International High Net Worth
business, and the local capital requirements in Asia and the U.S., on actual new business sold in the period using assumptions
with respect to future experience. NBV excludes businesses with immaterial insurance risks, Global WAM, Manulife Bank, and
the P&C Reinsurance business. NBV is a useful metric to evaluate the value created by the Company’s new business franchise.
New business value margin (“NBV margin”) is calculated as NBV divided by APE sales excluding NCI. APE sales are
calculated as 100% of regular premiums and deposits sales and 10% of single premiums and deposits sales. NBV margin is a
useful metric to help understand the profitability of our new business.
Sales are measured according to product type:
For individual insurance, sales include 100% of new annualized premiums and 10% of both excess and single premiums. For
individual insurance, new annualized premiums reflect the annualized premium expected in the first year of a policy that requires
premium payments for more than one year. Single premium is the lump sum premium from the sale of a single premium product,
e.g., travel insurance. Sales are reported gross before the impact of reinsurance.
For group insurance, sales include new annualized premiums and administrative services only premium equivalents on new
cases, as well as the addition of new coverages and amendments to contracts, excluding rate increases.
Insurance-based wealth accumulation product sales include all new deposits into variable and fixed annuity contracts. As we
discontinued sales of new variable annuity contracts in the U.S. in the first quarter of 2013, subsequent deposits into existing
U.S. variable annuity contracts are not reported as sales. Asia variable annuity deposits are included in APE sales.
APE sales are comprised of 100% of regular premiums and deposits and 10% of excess and single premiums and deposits for
both insurance and insurance-based wealth accumulation products.
Gross flows is a new business measure presented for our Global WAM business and includes all deposits into mutual funds,
group pension/retirement savings products, private wealth and institutional asset management products. Gross flows is a
common industry metric for WAM businesses as it provides a measure of how successful the businesses are at attracting assets.
Net flows is presented for our Global WAM business and includes gross flows less redemptions for mutual funds, group pension/
retirement savings products, private wealth and institutional asset management products. In addition, net flows include the net
flows of exchange traded funds and non-proprietary products sold by Manulife Securities. Net flows is a common industry metric
for WAM businesses as it provides a measure of how successful the businesses are at attracting and retaining assets. When net
flows are positive, they are referred to as net inflows. Conversely, negative net flows are referred to as net outflows.
Remittances is defined as the cash remitted or made available for distribution to Manulife Financial Corporation from its
subsidiaries, prior to payment of financing costs, dividends, and other capital deployments. It is a key metric used by
management to evaluate our financial flexibility.
| 132 | |
14. Additional Disclosures
Contractual Obligations
In the normal course of business, the Company enters into contracts that give rise to obligations fixed by agreement as to the
timing and dollar amount of payment.
As at December 31, 2025, the Company’s contractual obligations and commitments were as follows:
Payments due by period ($ millions) | Total | Less than 1 year | 1 to 3 years | 3 to 5 years | Over 5 years |
Long-term debt(1) | $11,541 | $2,016 | $1,391 | $420 | $7,714 |
Liabilities for capital instruments(1) | 9,430 | 295 | 616 | 568 | 7,951 |
Investment commitments | 16,879 | 4,952 | 5,322 | 4,447 | 2,158 |
Lease liabilities | 334 | 101 | 138 | 49 | 46 |
Insurance contract liabilities(2) | 1,439,208 | 3,783 | 12,296 | 26,264 | 1,396,865 |
Reinsurance contract held liabilities(2) | (8,944) | 254 | 995 | 815 | (11,008) |
Investment contract liabilities(3) | 347,497 | 340,567 | 2,372 | 1,183 | 3,375 |
Deposits from Bank clients | 24,707 | 17,462 | 4,441 | 2,804 | - |
Other | 7,703 | 2,885 | 2,926 | 1,829 | 63 |
Total contractual obligations | $1,848,355 | $372,315 | $30,497 | $38,379 | $1,407,164 |
(1)The contractual payments include principal and interest, and reflect the amounts payable up to and including the final contractual maturity date. The contractual
payments reflect the amounts payable from January 1, 2026 up to and including the final contractual maturity date. In the case of floating rate obligations, the
floating rate index is based on the interest rates as at December 31, 2025 and is assumed to remain constant to the final contractual maturity date. For the 4.061%
MFC Subordinated notes, the reset rate is equal to the Secured Overnight Financing Rate (“SOFR”) Swap Rate as at December 31, 2025, plus a spread
adjustment of 0.26161%, plus 1.647%. For the 2.818% MFC Subordinated notes, the reset rate is equal to the Canadian Overnight Repo Rate Average
(“CORRA”) as at December 31, 2025, plus a spread adjustment of 0.32138%, plus 1.82%. The Company may have the contractual right to redeem or repay
obligations prior to maturity and if such right is exercised, total contractual obligations paid and the timing of payment could vary significantly from the amounts and
timing included in the table.
(2)Insurance contract liabilities cash flows include estimates related to the timing and payment of death and disability claims, policy surrenders, policy maturities,
annuity payments, minimum guarantees on segregated fund products, policyholder dividends, commissions and premium taxes offset by contractual future
premiums on in-force contracts and exclude amounts from insurance contract liabilities for account of segregated fund holders. These estimated cash flows are
based on the best estimate assumptions used in the determination of insurance contract liabilities. These amounts are undiscounted. Reinsurance contract held
liabilities cash flows include estimates related to the timing and payment of future reinsurance premiums offset by recoveries on in-force reinsurance agreements.
Due to the use of assumptions, actual cash flows may differ from these estimates. Cash flows include embedded derivatives measured separately at fair value.
(3)Due to the nature of the products, the timing of net cash flows may be before contract maturity. Cash flows are undiscounted.
Legal and Regulatory Proceedings
We are regularly involved in legal actions, both as a defendant and as a plaintiff. Information on legal and regulatory proceedings
can be found in note 18 of the 2025 Annual Consolidated Financial Statements.
133 | 2025 Annual Report | Management’s Discussion and Analysis |
Quarterly Financial Information
The following table provides summary information related to our eight most recently completed quarters.
As at and for the three months ended | Dec 31, 2025 | Sept 30, 2025 | June 30, 2025 | Mar 31, 2025 | Dec 31, 2024 | Sept 30, 2024 | June 30, 2024 | Mar 31, 2024 |
($ millions, except per share amounts or otherwise stated) | ||||||||
Revenue | ||||||||
Insurance revenue | $7,414 | $7,422 | $6,990 | $7,062 | $6,834 | $6,746 | $6,515 | $6,497 |
Net investment result | 6,008 | 8,197 | 6,796 | 2,946 | 4,194 | 5,912 | 4,512 | 4,493 |
Other revenue | 2,147 | 2,145 | 1,851 | 1,986 | 2,003 | 1,928 | 1,849 | 1,808 |
Total revenue | $15,569 | $17,764 | $15,637 | $11,994 | $13,031 | $14,586 | $12,876 | $12,798 |
Income (loss) before income taxes | $1,905 | $2,229 | $2,261 | $699 | $2,113 | $2,341 | $1,384 | $1,252 |
Income tax (expense) recovery | (310) | (310) | (338) | (76) | (406) | (274) | (252) | (280) |
Net income (loss) | $1,595 | $1,919 | $1,923 | $623 | $1,707 | $2,067 | $1,132 | $972 |
Net income (loss) attributed to shareholders | $1,499 | $1,799 | $1,789 | $485 | $1,638 | $1,839 | $1,042 | $866 |
Basic earnings (loss) per common share | $0.83 | $1.03 | $0.99 | $0.25 | $0.88 | $1.01 | $0.53 | $0.45 |
Diluted earnings (loss) per common share | $0.83 | $1.02 | $0.98 | $0.25 | $0.88 | $1.00 | $0.52 | $0.45 |
Segregated funds deposits | $13,811 | $12,860 | $12,408 | $14,409 | $11,927 | $11,545 | $11,324 | $12,206 |
Total assets (in billions) | $1,025 | $1,027 | $977 | $981 | $979 | $953 | $915 | $907 |
Weighted average common shares (in millions) | 1,683 | 1,697 | 1,710 | 1,723 | 1,746 | 1,774 | 1,793 | 1,805 |
Diluted weighted average common shares (in millions) | 1,688 | 1,701 | 1,715 | 1,729 | 1,752 | 1,780 | 1,799 | 1,810 |
Dividends per common share | $0.440 | $0.440 | $0.440 | $0.440 | $0.400 | $0.400 | $0.400 | $0.400 |
CDN$ to US$1 - Statement of Financial Position | 1.3707 | 1.3914 | 1.3645 | 1.4393 | 1.4382 | 1.3510 | 1.3684 | 1.3533 |
CDN$ to US$1 - Statement of Income | 1.3939 | 1.3773 | 1.3837 | 1.4349 | 1.3987 | 1.3639 | 1.3682 | 1.3485 |
| 134 | |
Selected Annual Financial Information
The following table provides selected annual financial information related to our three most recently completed years.
As at and for the years ended December 31, | 2025 | 2024 | 2023 |
($ millions, except per share amounts) | |||
Revenue | |||
Asia | $18,148 | $13,641 | $11,996 |
Canada | 15,657 | 14,624 | 13,793 |
U.S. | 18,317 | 16,279 | 15,322 |
Global Wealth and Asset Management | 7,395 | 6,698 | 5,896 |
Corporate and Other | 1,447 | 2,049 | 1,732 |
Total revenue | $60,964 | $53,291 | $48,739 |
Total assets | $1,025,433 | $978,818 | $875,574 |
Long-term financial liabilities | |||
Long-term debt | $7,685 | $6,629 | $6,071 |
Capital instruments | 6,990 | 7,532 | 6,667 |
Total financial liabilities | $14,675 | $14,161 | $12,738 |
Dividend per common share | $1.76 | $1.60 | $1.46 |
Cash dividend per Class A Share, Series 2 | 1.1625 | 1.1625 | 1.1625 |
Cash dividend per Class A Share, Series 3 | 1.125 | 1.125 | 1.125 |
Cash dividend per Class 1 Share, Series 3 | 0.5870 | 0.5870 | 0.5870 |
Cash dividend per Class 1 Share, Series 4 | 1.0010 | 1.5578 | 1.4946 |
Cash dividend per Class 1 Share, Series 9 | 1.4945 | 1.4945 | 1.4945 |
Cash dividend per Class 1 Share, Series 11 | 1.5398 | 1.5398 | 1.4505 |
Cash dividend per Class 1 Share, Series 13 | 1.5875 | 1.5875 | 1.2245 |
Cash dividend per Class 1 Share, Series 15 | 1.4438 | 1.1951 | 0.9465 |
Cash dividend per Class 1 Share, Series 17 | 1.386 | 0.950 | 0.950 |
Cash dividend per Class 1 Share, Series 19 | 1.2923 | 0.9188 | 0.9188 |
Cash dividend per Class 1 Share, Series 25 | 1.4855 | 1.4855 | 1.3303 |
Revenue
Total revenue in 4Q25 was $15.6 billion compared with $13.0 billion in 4Q24. The increase in total revenue of $2.6 billion was
due to higher net investment income, insurance revenue and other revenue.
By segment, the increase in total revenue in 4Q25 compared to 4Q24 reflected higher net investment income primarily in Asia,
the U.S., Global WAM and Canada, partially offset by lower investment income in Corporate and Other, higher insurance
revenue in Asia, Canada and the U.S., and higher other revenue in Global WAM and Corporate and Other.
On a full year basis, total revenue in 2025 was $61.0 billion compared with $53.3 billion in 2024. The increase in total revenue of
$7.7 billion was due to higher net investment income, insurance revenue and other revenue.
By segment, the increase in total revenue in 2025 compared with 2024 reflected higher net investment income primarily in Asia,
the U.S., Canada and Global WAM, partially offset lower investment income in Corporate and Other, higher insurance revenue in
Asia, the U.S and Canada, and higher other revenue in Global WAM, partially offset by lower other revenue in Asia.
135 | 2025 Annual Report | Management’s Discussion and Analysis |
Revenue
Quarterly Results | Full Year Results | |||
($ millions) | 4Q25 | 4Q24 | 2025 | 2024 |
Insurance revenue | $7,414 | $6,834 | $28,888 | $26,592 |
Net investment income | 6,008 | 4,194 | 23,947 | 19,111 |
Other revenue | 2,147 | 2,003 | 8,129 | 7,588 |
Total revenue | $15,569 | $13,031 | $60,964 | $53,291 |
Asia | $4,385 | $2,927 | $18,148 | $13,641 |
Canada | 3,919 | 3,682 | 15,657 | 14,624 |
U.S. | 4,918 | 4,055 | 18,317 | 16,279 |
Global Wealth and Asset Management | 1,935 | 1,738 | 7,395 | 6,698 |
Corporate and Other | 412 | 629 | 1,447 | 2,049 |
Total revenue | $15,569 | $13,031 | $60,964 | $53,291 |
Outstanding Common Shares
As at January 31, 2026, MFC had 1,676,743,043 common shares outstanding.
Additional Information Available
Additional information relating to Manulife, including MFC’s Annual Information Form, is available on the Company’s website at
www.manulife.com and on the SEDAR+ website at www.sedarplus.ca.