Pay vs Performance Disclosure - USD ($)
|
12 Months Ended |
Oct. 31, 2025 |
Oct. 31, 2024 |
Oct. 31, 2023 |
Oct. 31, 2022 |
Oct. 31, 2021 |
| Pay vs Performance Disclosure |
|
|
|
|
|
| Pay vs Performance Disclosure, Table |
| | | | | | | | | | | | | | | | | | | | | | | | | | | | Summary Compensation Table total for Principal Executive Officer (“PEO”) ($)(1) | Compensation actually paid to PEO ($)(1)(2) | Average Summary Compensation Table total for Non-PEO NEOs ($)(1) | Average compensation actually paid to Non-PEO NEOs ($)(1)(2) | Value of initial fixed $100
investment based on: | Net income (millions) ($)(5) | Non-GAAP net earnings (millions) ($)(6) | | Year | HPE Total shareholder return ($)(3) | Peer group total shareholder return ($)(4) | 2025 | 23,482,721 | | 30,748,204 | | 11,770,259 | | 14,398,224 | | 329 | | 319 | | 57 | | 2,753 | | 2024 | 21,411,197 | | 24,011,398 | | 8,419,980 | | 9,842,051 | | 256 | | 232 | | 2,579 | | 2,655 | | | 2023 | 20,066,549 | | 27,183,439 | | 6,469,361 | | 4,718,843 | | 196 | | 153 | | 2,025 | | 2,832 | | | 2022 | 17,366,365 | | 12,260,283 | | 6,430,178 | | 4,807,054 | | 176 | | 117 | | 868 | | 2,664 | | | 2021 | 19,052,415 | | 31,328,118 | | 7,668,183 | | 11,531,681 | | 175 | | 147 | | 3,427 | | 2,602 | |
|
|
|
|
|
| Named Executive Officers, Footnote |
Mr. Neri served as our CEO in fiscal years 2025, 2024, 2023, 2022, and 2021. Non-PEO NEOs in fiscal year 2025 include Mmes. Marie Myers and Fidelma Russo and Messrs. John Schultz and Rami Rahim. Non-PEO NEOs in fiscal year 2024 included Mmes. Marie Myers and Fidelma Russo and Messrs. John Schultz, Neil MacDonald, and Jeremy Cox. Non-PEO NEOs in fiscal year 2023 included Messrs. Jeremy Cox, John Schultz, Phil Mottram, Neil MacDonald, and Tarek Robbiati. Non-PEO NEOs in fiscal year 2022 included Messrs. Tarek Robbiati, John Schultz, Alan May, and Neil MacDonald. Non-PEO NEOs in fiscal year 2021 included Messrs. Tarek Robbiati, John Schultz, Alan May, Tom Black, and Keerti Melkote.
|
|
|
|
|
| Peer Group Issuers, Footnote |
The Peer Group TSR is based on the S&P Information Technology Index and the value of an initial fixed investment of $100 on October 31, 2020, assuming the reinvestment of any dividends.
|
|
|
|
|
| PEO Total Compensation Amount |
$ 23,482,721
|
$ 21,411,197
|
$ 20,066,549
|
$ 17,366,365
|
$ 19,052,415
|
| PEO Actually Paid Compensation Amount |
$ 30,748,204
|
24,011,398
|
27,183,439
|
12,260,283
|
31,328,118
|
| Adjustment To PEO Compensation, Footnote |
The amounts shown as Compensation Actually Paid have been calculated in accordance with Item 402(v) of Regulation S-K and do not reflect compensation actually earned, realized or received by the Company’s NEOs. These amounts reflect total compensation as set forth in the Summary Compensation Table for each year, adjusted as described in the table below. The unvested equity fair values were calculated on each of the required measurement dates using valuation assumptions based on criteria that did not materially differ from those used for grant date fair value calculations and in accordance with the methodology used for financial reporting purposes. For unvested awards subject to performance-based vesting conditions, the fair values were based on the probable outcome of such performance-based vesting conditions as of the last day of the fiscal year. Deductions from, and additions to, total compensation in the Summary Compensation Table by year to calculate Compensation Actually Paid consist of: | | | | | | | | | | | | | | | | | | | | | | | | | | | | | | | | | | | | | | | | | | | | | | | | | 2025 | | 2024 | | 2023 | | 2022 | | 2021 | | PEO
($) | Average Non-PEO NEOs ($) | | PEO
($) | Average Non-PEO NEOs ($) | | PEO
($) | Average Non-PEO NEOs ($) | | PEO
($) | Average Non-PEO NEOs ($) | | PEO
($) | Average Non-PEO NEOs ($) | | Total compensation from Summary Compensation Table | 23,482,721 | 11,770,259 | | 21,411,197 | 8,419,980 | | 20,066,549 | 6,469,361 | | 17,366,365 | 6,430,178 | | 19,052,415 | 7,668,183 | | Less: Change in actuarial present value reported in the "change in pension value and nonqualified deferred compensation earnings" column of the SCT | (13,695) | — | | (35,225) | — | | — | — | | — | — | | (16,091) | — | | Less: Amount reported in the "Stock awards" column of the SCT | (19,628,955) | (9,712,718) | | (17,646,855) | (6,716,926) | | (15,577,803) | (4,873,350) | | (13,386,710) | (4,666,732) | | (13,118,823) | (5,096,141) |
| | | | | | | | | | | | | | | | | | | | | | | | | | | | | | | | | | | | | | | | | | | | | | | | | 2025 | | 2024 | | 2023 | | 2022 | | 2021 | | PEO
($) | Average Non-PEO NEOs ($) | | PEO
($) | Average Non-PEO NEOs ($) | | PEO
($) | Average Non-PEO NEOs ($) | | PEO
($) | Average Non-PEO NEOs ($) | | PEO
($) | Average Non-PEO NEOs ($) | | Plus: Year end fair value of equity awards granted in the year | 19,993,440 | 14,652,601 | | 16,913,981 | 7,106,175 | | 16,871,925 | 3,675,699 | | 9,272,474 | 3,316,605 | | 19,334,854 | 6,435,366 | | Year over year change in fair value of outstanding and unvested equity awards | 1,785,398 | (775,543) | | 1,514,794 | 504,028 | | 1,448,323 | 271,467 | | (1,077,275) | (314,568) | | 3,119,548 | 1,095,667 | | Fair value as of vesting date of equity awards granted and vested in the year | | — | — | | — | — | | — | — | | — | — | | — | 456,387 | | Change from prior year end in fair value of equity awards granted in prior years that vested in the year | 3,639,653 | (2,033,900) | | 775,249 | 226,441 | | 3,137,192 | 542,955 | | (759,020) | (249,551) | | 1,586,632 | 515,924 | | Fair value at the end of the prior year of equity awards that failed to meet vesting conditions in the year | — | — | | — | — | | — | (1,518,675) | | — | — | | — | — | | Value of dividends or other earnings paid on stock or option awards not otherwise reflected in fair value or total compensation | | 1,489,642 | 497,525 | | 1,078,256 | 302,353 | | 1,237,254 | 151,385 | | 844,449 | 291,123 | | 1,369,583 | 456,296 | | CAP total | | 30,748,204 | 14,398,224 | | 24,011,398 | 9,842,051 | | 27,183,439 | 4,718,843 | | 12,260,283 | 4,807,054 | | 31,328,118 | 11,531,681 |
|
|
|
|
|
| Non-PEO NEO Average Total Compensation Amount |
$ 11,770,259
|
8,419,980
|
6,469,361
|
6,430,178
|
7,668,183
|
| Non-PEO NEO Average Compensation Actually Paid Amount |
$ 14,398,224
|
9,842,051
|
4,718,843
|
4,807,054
|
11,531,681
|
| Adjustment to Non-PEO NEO Compensation Footnote |
The amounts shown as Compensation Actually Paid have been calculated in accordance with Item 402(v) of Regulation S-K and do not reflect compensation actually earned, realized or received by the Company’s NEOs. These amounts reflect total compensation as set forth in the Summary Compensation Table for each year, adjusted as described in the table below. The unvested equity fair values were calculated on each of the required measurement dates using valuation assumptions based on criteria that did not materially differ from those used for grant date fair value calculations and in accordance with the methodology used for financial reporting purposes. For unvested awards subject to performance-based vesting conditions, the fair values were based on the probable outcome of such performance-based vesting conditions as of the last day of the fiscal year. Deductions from, and additions to, total compensation in the Summary Compensation Table by year to calculate Compensation Actually Paid consist of: | | | | | | | | | | | | | | | | | | | | | | | | | | | | | | | | | | | | | | | | | | | | | | | | | 2025 | | 2024 | | 2023 | | 2022 | | 2021 | | PEO
($) | Average Non-PEO NEOs ($) | | PEO
($) | Average Non-PEO NEOs ($) | | PEO
($) | Average Non-PEO NEOs ($) | | PEO
($) | Average Non-PEO NEOs ($) | | PEO
($) | Average Non-PEO NEOs ($) | | Total compensation from Summary Compensation Table | 23,482,721 | 11,770,259 | | 21,411,197 | 8,419,980 | | 20,066,549 | 6,469,361 | | 17,366,365 | 6,430,178 | | 19,052,415 | 7,668,183 | | Less: Change in actuarial present value reported in the "change in pension value and nonqualified deferred compensation earnings" column of the SCT | (13,695) | — | | (35,225) | — | | — | — | | — | — | | (16,091) | — | | Less: Amount reported in the "Stock awards" column of the SCT | (19,628,955) | (9,712,718) | | (17,646,855) | (6,716,926) | | (15,577,803) | (4,873,350) | | (13,386,710) | (4,666,732) | | (13,118,823) | (5,096,141) |
| | | | | | | | | | | | | | | | | | | | | | | | | | | | | | | | | | | | | | | | | | | | | | | | | 2025 | | 2024 | | 2023 | | 2022 | | 2021 | | PEO
($) | Average Non-PEO NEOs ($) | | PEO
($) | Average Non-PEO NEOs ($) | | PEO
($) | Average Non-PEO NEOs ($) | | PEO
($) | Average Non-PEO NEOs ($) | | PEO
($) | Average Non-PEO NEOs ($) | | Plus: Year end fair value of equity awards granted in the year | 19,993,440 | 14,652,601 | | 16,913,981 | 7,106,175 | | 16,871,925 | 3,675,699 | | 9,272,474 | 3,316,605 | | 19,334,854 | 6,435,366 | | Year over year change in fair value of outstanding and unvested equity awards | 1,785,398 | (775,543) | | 1,514,794 | 504,028 | | 1,448,323 | 271,467 | | (1,077,275) | (314,568) | | 3,119,548 | 1,095,667 | | Fair value as of vesting date of equity awards granted and vested in the year | | — | — | | — | — | | — | — | | — | — | | — | 456,387 | | Change from prior year end in fair value of equity awards granted in prior years that vested in the year | 3,639,653 | (2,033,900) | | 775,249 | 226,441 | | 3,137,192 | 542,955 | | (759,020) | (249,551) | | 1,586,632 | 515,924 | | Fair value at the end of the prior year of equity awards that failed to meet vesting conditions in the year | — | — | | — | — | | — | (1,518,675) | | — | — | | — | — | | Value of dividends or other earnings paid on stock or option awards not otherwise reflected in fair value or total compensation | | 1,489,642 | 497,525 | | 1,078,256 | 302,353 | | 1,237,254 | 151,385 | | 844,449 | 291,123 | | 1,369,583 | 456,296 | | CAP total | | 30,748,204 | 14,398,224 | | 24,011,398 | 9,842,051 | | 27,183,439 | 4,718,843 | | 12,260,283 | 4,807,054 | | 31,328,118 | 11,531,681 |
|
|
|
|
|
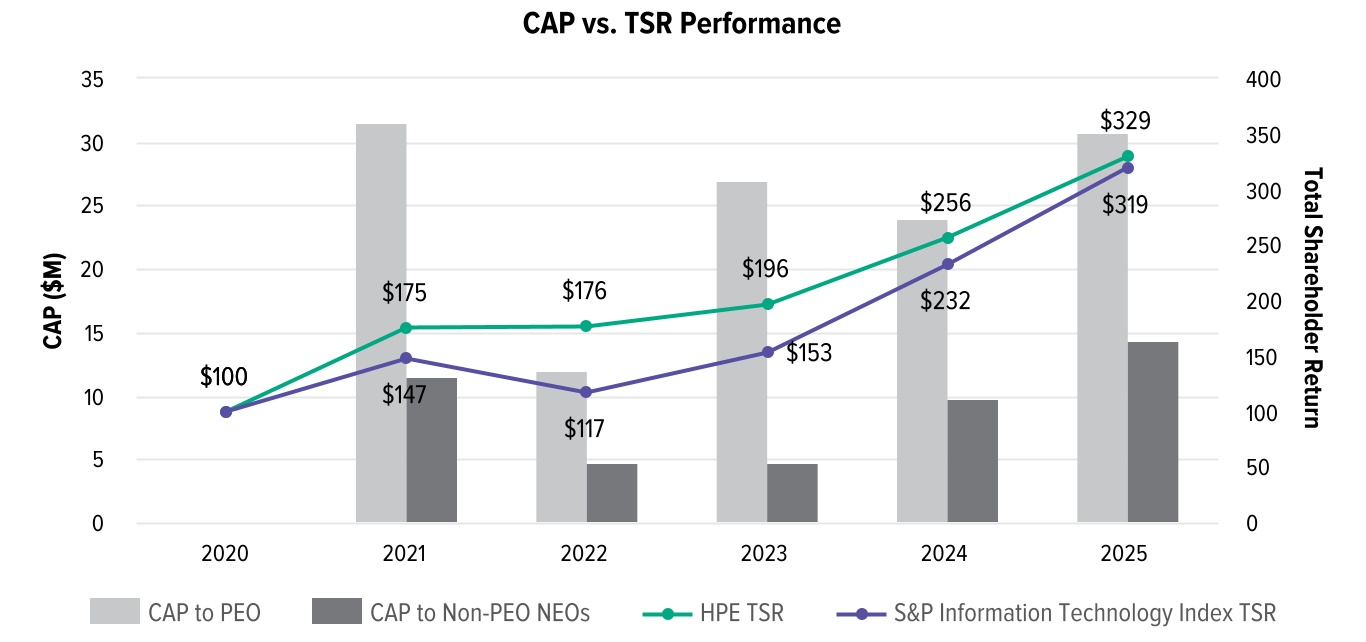
| Compensation Actually Paid vs. Total Shareholder Return |
Relationship between CAP, TSR, and peer group TSR The following chart sets forth the relationship between CAP to our PEO, the average CAP to our other NEOs, the Company’s cumulative TSR, and the cumulative TSR of the S&P Information Technology Index, each over the five most recently completed fiscal years.
|
|
|
|
|
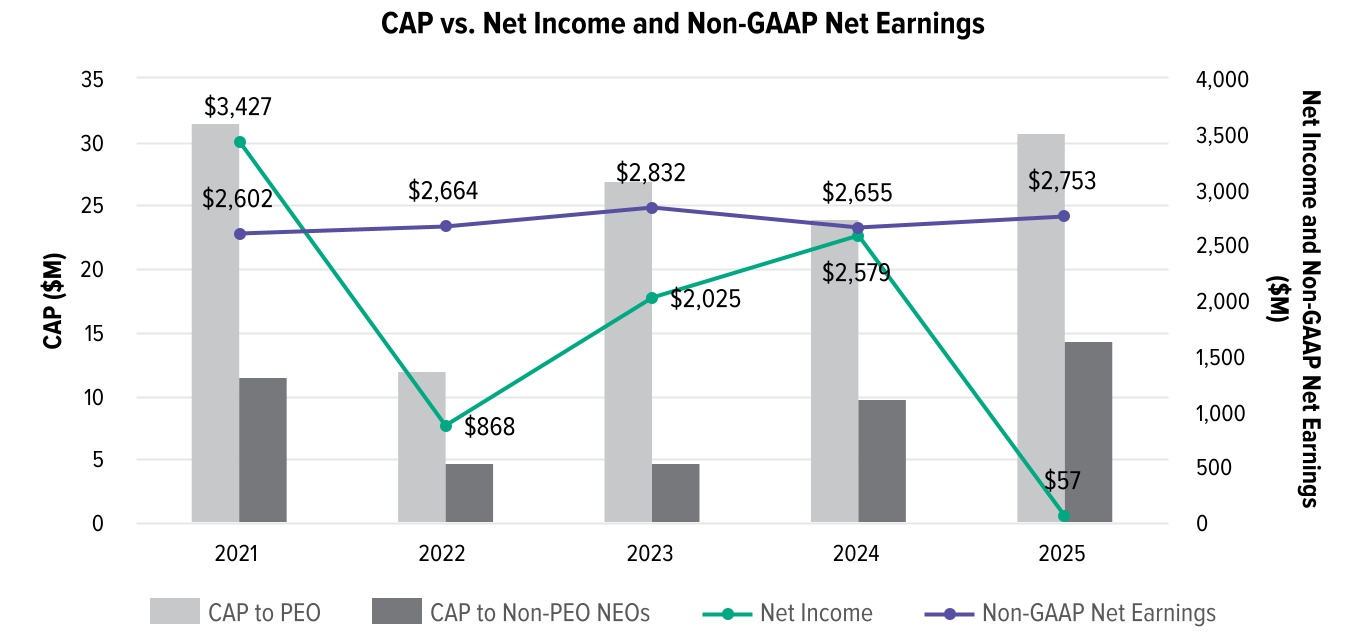
| Compensation Actually Paid vs. Company Selected Measure |
Relationship between CAP, net income, and non-GAAP net earnings The following chart sets forth the relationship between CAP to our PEO, the average CAP to our other NEOs, the Company’s net income, and the Company’s non-GAAP net earnings, each over the five most recently completed fiscal years.
|
|
|
|
|
| Total Shareholder Return Vs Peer Group |
Relationship between CAP, TSR, and peer group TSR The following chart sets forth the relationship between CAP to our PEO, the average CAP to our other NEOs, the Company’s cumulative TSR, and the cumulative TSR of the S&P Information Technology Index, each over the five most recently completed fiscal years.
|
|
|
|
|
| Tabular List, Table |
| | | | (in alphabetical order) | | Net revenue | Non-GAAP earnings from operations | Non-GAAP net earnings | | Relative TSR |
|
|
|
|
|
| Total Shareholder Return Amount |
$ 329
|
256
|
196
|
176
|
175
|
| Peer Group Total Shareholder Return Amount |
319
|
232
|
153
|
117
|
147
|
| Net Income (Loss) |
$ 57,000,000
|
$ 2,579,000,000
|
$ 2,025,000,000
|
$ 868,000,000
|
$ 3,427,000,000
|
| Company Selected Measure Amount |
2,753,000,000
|
2,655,000,000
|
2,832,000,000
|
2,664,000,000
|
2,602,000,000
|
| PEO Name |
Mr. Neri
|
|
|
|
|
| Additional 402(v) Disclosure |
Represents the cumulative TSR of the Company of an initial investment of $100 for the measurement period beginning October 31, 2020, and ending October 31, 2025, 2024, 2023, 2022, and 2021, respectively, calculated in accordance with Item 201(e) of Regulation S-K as required under Item 402(v) of Regulation S-K.Reflects GAAP net earnings (or, in the case of fiscal 2025 and fiscal 2024, GAAP net earnings attributable to HPE) as shown in the Company’s Annual Report on Form 10-K for the fiscal years ended October 31, 2025, 2024, 2023, 2022, and 2021, respectively.
|
|
|
|
|
| Measure:: 1 |
|
|
|
|
|
| Pay vs Performance Disclosure |
|
|
|
|
|
| Name |
Net revenue
|
|
|
|
|
| Measure:: 2 |
|
|
|
|
|
| Pay vs Performance Disclosure |
|
|
|
|
|
| Name |
Non-GAAP earnings from operations
|
|
|
|
|
| Non-GAAP Measure Description |
on-GAAP net earnings, as calculated and described in the Company’s Annual Report on Form 10-K for the year ended October 31, 2025 (described therein as non-GAAP net earnings attributable to HPE in the case of fiscal 2025 and 2024), was selected as the company-selected measure for fiscal year 2025, as it was deemed to be the most important financial performance measure used to link Company performance to CAP to our PEO and average CAP to our other NEOs for fiscal 2025. Please note non-GAAP net earnings may not have been the most important financial performance measure for fiscal years 2022 and 2021, and we may determine a different financial measure to be the company-selected measure in future years.
|
|
|
|
|
| Measure:: 3 |
|
|
|
|
|
| Pay vs Performance Disclosure |
|
|
|
|
|
| Name |
Non-GAAP net earnings
|
|
|
|
|
| Measure:: 4 |
|
|
|
|
|
| Pay vs Performance Disclosure |
|
|
|
|
|
| Name |
Relative TSR
|
|
|
|
|
| PEO | Aggregate Change in Present Value of Accumulated Benefit for All Pension Plans Reported in Summary Compensation Table |
|
|
|
|
|
| Pay vs Performance Disclosure |
|
|
|
|
|
| Adjustment to Compensation, Amount |
$ (13,695)
|
$ (35,225)
|
$ 0
|
$ 0
|
$ (16,091)
|
| PEO | Aggregate Grant Date Fair Value of Equity Award Amounts Reported in Summary Compensation Table |
|
|
|
|
|
| Pay vs Performance Disclosure |
|
|
|
|
|
| Adjustment to Compensation, Amount |
(19,628,955)
|
(17,646,855)
|
(15,577,803)
|
(13,386,710)
|
(13,118,823)
|
| PEO | Year-end Fair Value of Equity Awards Granted in Covered Year that are Outstanding and Unvested |
|
|
|
|
|
| Pay vs Performance Disclosure |
|
|
|
|
|
| Adjustment to Compensation, Amount |
19,993,440
|
16,913,981
|
16,871,925
|
9,272,474
|
19,334,854
|
| PEO | Year-over-Year Change in Fair Value of Equity Awards Granted in Prior Years That are Outstanding and Unvested |
|
|
|
|
|
| Pay vs Performance Disclosure |
|
|
|
|
|
| Adjustment to Compensation, Amount |
1,785,398
|
1,514,794
|
1,448,323
|
(1,077,275)
|
3,119,548
|
| PEO | Vesting Date Fair Value of Equity Awards Granted and Vested in Covered Year |
|
|
|
|
|
| Pay vs Performance Disclosure |
|
|
|
|
|
| Adjustment to Compensation, Amount |
0
|
0
|
0
|
0
|
0
|
| PEO | Change in Fair Value as of Vesting Date of Prior Year Equity Awards Vested in Covered Year |
|
|
|
|
|
| Pay vs Performance Disclosure |
|
|
|
|
|
| Adjustment to Compensation, Amount |
3,639,653
|
775,249
|
3,137,192
|
(759,020)
|
1,586,632
|
| PEO | Prior Year End Fair Value of Equity Awards Granted in Any Prior Year that Fail to Meet Applicable Vesting Conditions During Covered Year |
|
|
|
|
|
| Pay vs Performance Disclosure |
|
|
|
|
|
| Adjustment to Compensation, Amount |
0
|
0
|
0
|
0
|
0
|
| PEO | Dividends or Other Earnings Paid on Equity Awards not Otherwise Reflected in Total Compensation for Covered Year |
|
|
|
|
|
| Pay vs Performance Disclosure |
|
|
|
|
|
| Adjustment to Compensation, Amount |
1,489,642
|
1,078,256
|
1,237,254
|
844,449
|
1,369,583
|
| Non-PEO NEO | Aggregate Change in Present Value of Accumulated Benefit for All Pension Plans Reported in Summary Compensation Table |
|
|
|
|
|
| Pay vs Performance Disclosure |
|
|
|
|
|
| Adjustment to Compensation, Amount |
0
|
0
|
0
|
0
|
0
|
| Non-PEO NEO | Aggregate Grant Date Fair Value of Equity Award Amounts Reported in Summary Compensation Table |
|
|
|
|
|
| Pay vs Performance Disclosure |
|
|
|
|
|
| Adjustment to Compensation, Amount |
(9,712,718)
|
(6,716,926)
|
(4,873,350)
|
(4,666,732)
|
(5,096,141)
|
| Non-PEO NEO | Year-end Fair Value of Equity Awards Granted in Covered Year that are Outstanding and Unvested |
|
|
|
|
|
| Pay vs Performance Disclosure |
|
|
|
|
|
| Adjustment to Compensation, Amount |
14,652,601
|
7,106,175
|
3,675,699
|
3,316,605
|
6,435,366
|
| Non-PEO NEO | Year-over-Year Change in Fair Value of Equity Awards Granted in Prior Years That are Outstanding and Unvested |
|
|
|
|
|
| Pay vs Performance Disclosure |
|
|
|
|
|
| Adjustment to Compensation, Amount |
(775,543)
|
504,028
|
271,467
|
(314,568)
|
1,095,667
|
| Non-PEO NEO | Vesting Date Fair Value of Equity Awards Granted and Vested in Covered Year |
|
|
|
|
|
| Pay vs Performance Disclosure |
|
|
|
|
|
| Adjustment to Compensation, Amount |
0
|
0
|
0
|
0
|
456,387
|
| Non-PEO NEO | Change in Fair Value as of Vesting Date of Prior Year Equity Awards Vested in Covered Year |
|
|
|
|
|
| Pay vs Performance Disclosure |
|
|
|
|
|
| Adjustment to Compensation, Amount |
(2,033,900)
|
226,441
|
542,955
|
(249,551)
|
515,924
|
| Non-PEO NEO | Prior Year End Fair Value of Equity Awards Granted in Any Prior Year that Fail to Meet Applicable Vesting Conditions During Covered Year |
|
|
|
|
|
| Pay vs Performance Disclosure |
|
|
|
|
|
| Adjustment to Compensation, Amount |
0
|
0
|
(1,518,675)
|
0
|
0
|
| Non-PEO NEO | Dividends or Other Earnings Paid on Equity Awards not Otherwise Reflected in Total Compensation for Covered Year |
|
|
|
|
|
| Pay vs Performance Disclosure |
|
|
|
|
|
| Adjustment to Compensation, Amount |
$ 497,525
|
$ 302,353
|
$ 151,385
|
$ 291,123
|
$ 456,296
|