
Fourth Quarter 2025 Key Metrics | ||||||||||||||||||||||||||||||||||||||
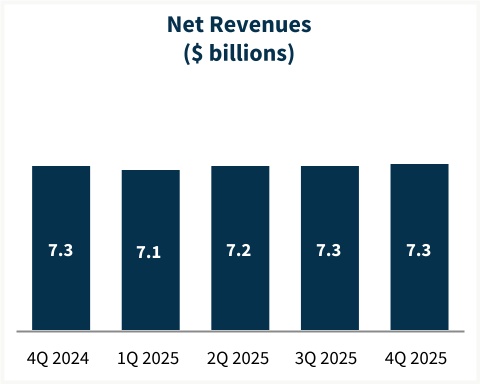
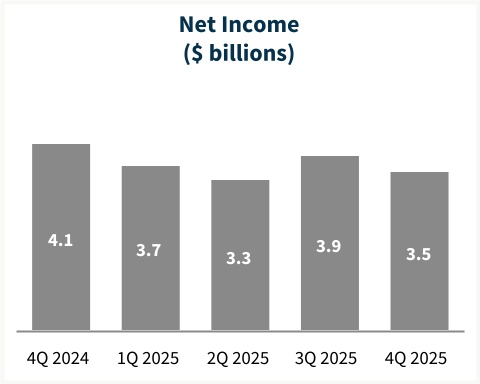
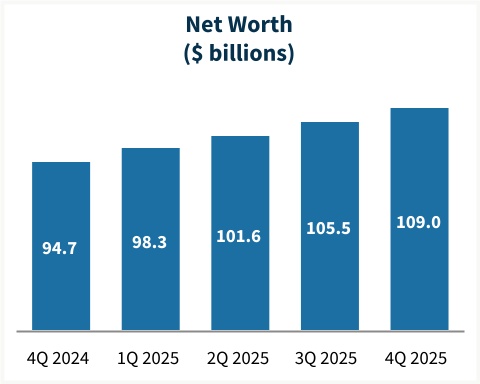
$3.5 billion | $109.0 billion | $7.3 billion | ||||||||||||||||||||||||||||||||||||
| Net Income | Net Worth | Net Revenues(1) | ||||||||||||||||||||||||||||||||||||
($3.9 billion in 3Q 2025) | ($105.5 billion in 3Q 2025) | ($7.3 billion in 3Q 2025) | ||||||||||||||||||||||||||||||||||||
$4.1 trillion | 12.6% | 10.2% | ||||||||||||||||||||||||||||||||||||
| Guaranty Book of Business | Administrative Expense Ratio(2) | Illust. Return on Avg. Req. CET1(3) | ||||||||||||||||||||||||||||||||||||
($4.1 trillion in 3Q 2025) | (11.2% in 3Q 2025) | (10.3% in 3Q 2025) | ||||||||||||||||||||||||||||||||||||
| Business Impact and 2025 Highlights | ||||||||||||||||||||||||||||||||||||||
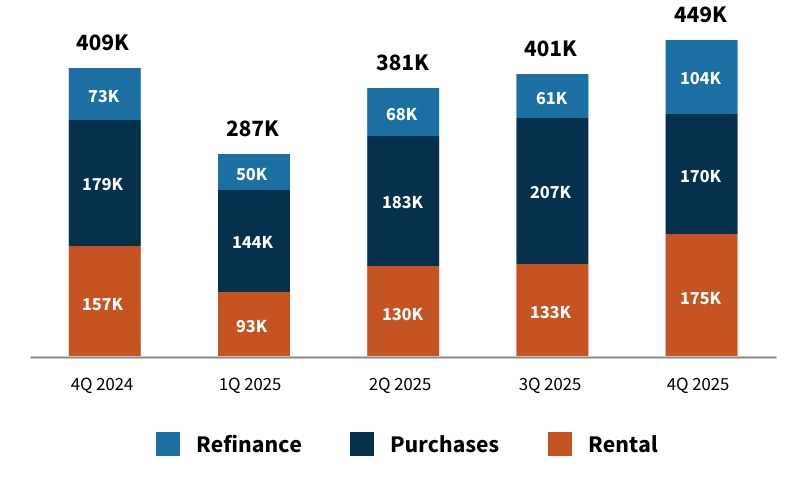
$409 billion in liquidity provided to mortgage market, supporting approximately 704,000 home purchases, 283,000 refinancings, and 531,000 rental units. | |||||||||||||||||
Renters earning less than 100% of area median income made up more than 80% of the multifamily units we financed. | |||||||||||||||||
First-time homebuyers accounted for more than half of our single-family purchase mortgages. | |||||||||||||||||
Our foreclosure prevention solutions allowed nearly 99,000 homeowners to remain in their homes. | |||||||||||||||||
Increased MBS purchase activity to support market and lender liquidity. | |||||||||||||||||
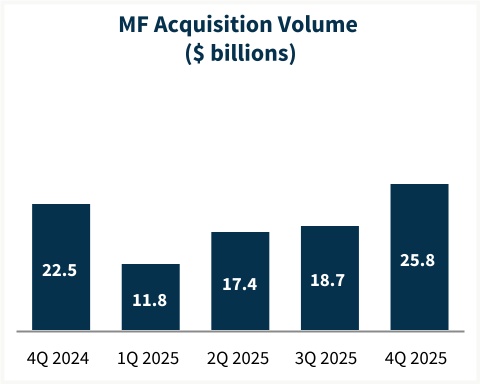
Multifamily acquisition volume totaled $73.7 billion, the highest in five years. | |||||||||||||||||
Fourth Quarter 2025 | 1 | |||||||
Key Highlights — Fourth Quarter 2025 | |||||
| • | Net revenues of $7.3 billion, primarily driven by guaranty fees on the company’s $4.1 trillion guaranty book of business. | ||||
◦Single-family net revenues of $6.1 billion from a $3.6 trillion conventional guaranty book with an average charged guaranty fee of 48.7 basis points. | |||||
◦Multifamily net revenues of $1.2 billion from a $534.7 billion guaranty book with an average charged guaranty fee of 71.6 basis points. | |||||
| • | Provision for credit losses of $298 million, largely driven by a provision for newly acquired single-family loans during the period and increased delinquencies. | ||||
| • | Non-interest expense of $2.4 billion compared with $2.3 billion in the third quarter; increase driven primarily by higher administrative expense. | ||||
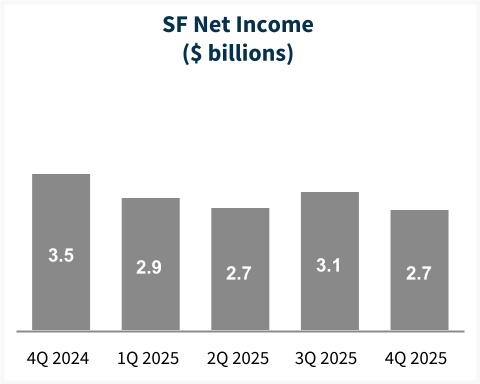
| • | Net income of $3.5 billion, compared with $3.9 billion in 3Q 2025; net worth increased to $109.0 billion. | ||||
| Summary of Consolidated Financial Results | ||||||||||||||||||||||||||||||||||||||||||||||||||
| (Dollars in millions) | 4Q25 | 3Q25 | Variance | % Change | 2025 | 2024 | Variance | % Change | ||||||||||||||||||||||||||||||||||||||||||
| Net interest income | $ | 7,268 | $ | 7,184 | $ | 84 | 1 | % | $ | 28,608 | $ | 28,748 | $ | (140) | — | %* | ||||||||||||||||||||||||||||||||||
| Fee and other income | 63 | 123 | (60) | (49) | % | 356 | 321 | 35 | 11 | % | ||||||||||||||||||||||||||||||||||||||||
| Net revenues | 7,331 | 7,307 | 24 | — | %* | 28,964 | 29,069 | (105) | — | %* | ||||||||||||||||||||||||||||||||||||||||
| Fair value gains (losses), net | (257) | 13 | (270) | NM | 90 | 1,821 | $ | (1,731) | (95) | % | ||||||||||||||||||||||||||||||||||||||||
Investment gains (losses), net(4) | 5 | 120 | (115) | (96) | % | 105 | (96) | 201 | NM | |||||||||||||||||||||||||||||||||||||||||
| Other gains (losses), net | (252) | 133 | (385) | NM | 195 | 1,725 | (1,530) | (89) | % | |||||||||||||||||||||||||||||||||||||||||
| (Provision) benefit for credit losses | (298) | (338) | 40 | 12 | % | (1,606) | 186 | (1,792) | NM | |||||||||||||||||||||||||||||||||||||||||
| Non-interest expense: | ||||||||||||||||||||||||||||||||||||||||||||||||||
Administrative expenses(5) | (921) | (819) | (102) | (12) | % | (3,579) | (3,619) | 40 | 1 | % | ||||||||||||||||||||||||||||||||||||||||
Legislative assessments(6) | (936) | (943) | 7 | 1 | % | (3,749) | (3,766) | 17 | — | %* | ||||||||||||||||||||||||||||||||||||||||
Credit enhancement expense(7) | (368) | (409) | 41 | 10 | % | (1,656) | (1,641) | (15) | (1) | % | ||||||||||||||||||||||||||||||||||||||||
Other income (expense), net(4)(8) | (146) | (96) | (50) | (52) | % | (586) | (685) | 99 | 14 | % | ||||||||||||||||||||||||||||||||||||||||
| Total non-interest expense | (2,371) | (2,267) | (104) | (5) | % | (9,570) | (9,711) | 141 | 1 | % | ||||||||||||||||||||||||||||||||||||||||
| Income before federal income taxes | 4,410 | 4,835 | (425) | (9) | % | 17,983 | 21,269 | (3,286) | (15) | % | ||||||||||||||||||||||||||||||||||||||||
| Provision for federal income taxes | (883) | (976) | 93 | 10 | % | (3,619) | (4,291) | 672 | 16 | % | ||||||||||||||||||||||||||||||||||||||||
| Net income | $ | 3,527 | $ | 3,859 | $ | (332) | (9) | % | $ | 14,364 | $ | 16,978 | $ | (2,614) | (15) | % | ||||||||||||||||||||||||||||||||||
| 3,849 | (3,849) | (100) | % | — | ||||||||||||||||||||||||||||||||||||||||||||||
| Total comprehensive income | $ | 3,527 | $ | 3,849 | $ | (322) | (8) | % | $ | 14,355 | $ | 16,975 | $ | (2,620) | (15) | % | ||||||||||||||||||||||||||||||||||
| Net worth | $ | 109,012 | $ | 105,485 | $ | 3,527 | 3 | % | $ | 109,012 | $ | 94,657 | $ | 14,355 | 15 | % | ||||||||||||||||||||||||||||||||||
| NM - Not meaningful | ||||||||||||||||||||||||||||||||||||||||||||||||||
| * Represents less than 0.5% | ||||||||||||||||||||||||||||||||||||||||||||||||||
Fourth Quarter 2025 | 2 | |||||||
Single-Family Highlights — Fourth Quarter 2025 | |||||
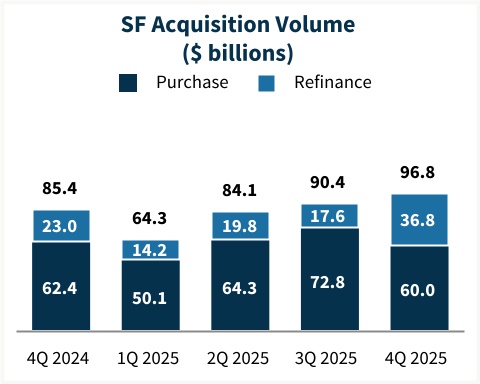
| • | Single-family conventional acquisition volume rose to $96.8 billion in 4Q 2025, compared with $90.4 billion in 3Q 2025, driven by a $19.2 billion increase in refinance acquisition volume, partially offset by a $12.8 billion decrease in purchase acquisition volume. | ||||
| • | Average single-family conventional guaranty book decreased to $3.58 trillion for 4Q 2025, from $3.59 trillion for 3Q 2025. | ||||
| • | The average charged guaranty fee, net of TCCA fees, on the single-family conventional guaranty book increased to 48.7 basis points in 4Q 2025, compared with 48.5 basis points in 3Q 2025. The average charged guaranty fee on newly acquired conventional loans, net of TCCA fees, decreased to 55.4 basis points in 4Q 2025, compared with 56.3 basis points in 3Q 2025. | ||||
| • | Credit characteristics on the single-family conventional guaranty book remained largely unchanged compared to the prior quarter, with a weighted-average mark-to-market loan-to-value ratio of 51% and a weighted-average FICO credit score at origination of 753 as of Dec. 31, 2025. | ||||
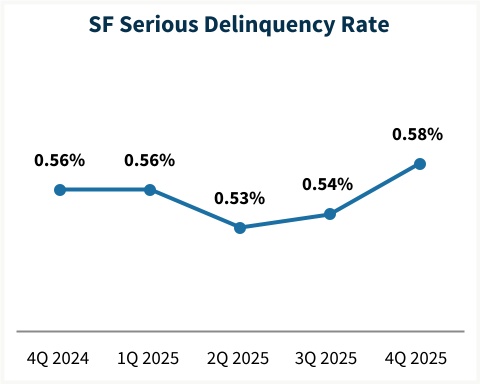
| • | Single-family serious delinquency rate increased to 0.58% as of Dec. 31, 2025, from 0.54% as of Sep. 30, 2025.(9) | ||||
| • | Provision for single-family credit losses of $293 million was recorded for 4Q 2025, driven primarily by newly acquired loans during the period and increased delinquencies. This compares with a provision for single-family credit losses of $269 million for 3Q 2025. | ||||
| Single-Family Business Financial Results | ||||||||||||||||||||||||||||||||||||||||||||||||||
| (Dollars in millions) | 4Q25 | 3Q25 | Variance | % Change | 2025 | 2024 | Variance | % Change | ||||||||||||||||||||||||||||||||||||||||||
| Net interest income | $ | 6,043 | $ | 5,992 | $ | 51 | 1 | % | $ | 23,893 | $ | 24,130 | $ | (237) | (1) | % | ||||||||||||||||||||||||||||||||||
| Fee and other income | 43 | 104 | (61) | (59) | % | 281 | 245 | 36 | 15 | % | ||||||||||||||||||||||||||||||||||||||||
| Net revenues | 6,086 | 6,096 | (10) | — | %* | 24,174 | 24,375 | (201) | (1) | % | ||||||||||||||||||||||||||||||||||||||||
| Fair value gains (losses), net | (273) | (22) | (251) | NM | (16) | 1,745 | (1,761) | NM | ||||||||||||||||||||||||||||||||||||||||||
Investment gains (losses), net(4) | (14) | 127 | (141) | NM | 94 | (99) | 193 | NM | ||||||||||||||||||||||||||||||||||||||||||
| Other gains (losses), net | (287) | 105 | (392) | NM | 78 | 1,646 | (1,568) | (95) | % | |||||||||||||||||||||||||||||||||||||||||
| (Provision) benefit for credit losses | (293) | (269) | (24) | (9) | % | (1,323) | 938 | (2,261) | NM | |||||||||||||||||||||||||||||||||||||||||
| Non-interest expense: | ||||||||||||||||||||||||||||||||||||||||||||||||||
Administrative expenses(5) | (750) | (669) | (81) | (12) | % | (2,918) | (3,000) | 82 | 3 | % | ||||||||||||||||||||||||||||||||||||||||
Legislative assessments(6) | (921) | (929) | 8 | 1 | % | (3,688) | (3,719) | 31 | 1 | % | ||||||||||||||||||||||||||||||||||||||||
Credit enhancement expense(7) | (288) | (330) | 42 | 13 | % | (1,343) | (1,349) | 6 | — | %* | ||||||||||||||||||||||||||||||||||||||||
Other income (expense), net(4)(8) | (173) | (129) | (44) | (34) | % | (606) | (771) | 165 | 21 | % | ||||||||||||||||||||||||||||||||||||||||
| Total non-interest expense | (2,132) | (2,057) | (75) | (4) | % | (8,555) | (8,839) | 284 | 3 | % | ||||||||||||||||||||||||||||||||||||||||
| Income before federal income taxes | 3,374 | 3,875 | (501) | (13) | % | 14,374 | 18,120 | (3,746) | (21) | % | ||||||||||||||||||||||||||||||||||||||||
| Provision for federal income taxes | (697) | (790) | 93 | 12 | % | (2,958) | (3,690) | 732 | 20 | % | ||||||||||||||||||||||||||||||||||||||||
| Net income | $ | 2,677 | $ | 3,085 | $ | (408) | (13) | % | $ | 11,416 | $ | 14,430 | $ | (3,014) | (21) | % | ||||||||||||||||||||||||||||||||||
| Average charged guaranty fee on new conventional acquisitions, net of TCCA fees | 55.4 bps | 56.3 bps | (0.9) bps | (2) | % | 56.3 bps | 54.1 bps | 2.2 bps | 4 | % | ||||||||||||||||||||||||||||||||||||||||
| Average charged guaranty fee on conventional guaranty book of business, net of TCCA fees | 48.7 bps | 48.5 bps | 0.2 bps | — | %* | 48.4 bps | 47.6 bps | 0.8 bps | 2 | % | ||||||||||||||||||||||||||||||||||||||||
Fourth Quarter 2025 | 3 | |||||||
Multifamily Highlights — Fourth Quarter 2025 | |||||
| • | Multifamily acquisition volume rose to $25.8 billion in 4Q 2025, compared with $18.7 billion in 3Q 2025. | ||||
| • | Multifamily book of business grew to $534.7 billion as of Dec. 31, 2025, a $13.4 billion increase from Sep. 30, 2025. | ||||
| • | Average charged guaranty fees on overall multifamily book decreased by 0.8 basis points to 71.6 basis points as of 4Q 2025, compared with 72.4 basis points as of 3Q 2025. | ||||
| • | Multifamily guaranty book credit characteristics remained stable, with weighted-average original loan-to-value ratio of 63% and a weighted-average debt service coverage ratio of 1.9 as of Dec. 31, 2025, both unchanged from Sep. 30, 2025. | ||||
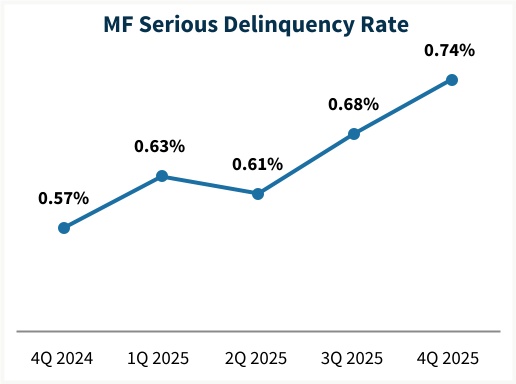
| • | Multifamily serious delinquency rate increased to 0.74% as of Dec. 31, 2025, from 0.68% as of Sep. 30, 2025.(10) | ||||
| • | Provision for multifamily credit losses of $5 million was recorded for 4Q 2025, primarily driven by increased delinquencies. This compares to a multifamily provision for credit losses of $69 million for 3Q 2025. | ||||
Multifamily Business Financial Results | ||||||||||||||||||||||||||||||||||||||||||||||||||
| (Dollars in millions) | 4Q25 | 3Q25 | Variance | % Change | 2025 | 2024 | Variance | % Change | ||||||||||||||||||||||||||||||||||||||||||
| Net interest income | $ | 1,225 | $ | 1,192 | $ | 33 | 3 | % | $ | 4,715 | $ | 4,618 | $ | 97 | 2 | % | ||||||||||||||||||||||||||||||||||
| Fee and other income | 20 | 19 | 1 | 5 | % | 75 | 76 | (1) | (1) | % | ||||||||||||||||||||||||||||||||||||||||
| Net revenues | 1,245 | 1,211 | 34 | 3 | % | 4,790 | 4,694 | 96 | 2 | % | ||||||||||||||||||||||||||||||||||||||||
| Fair value gains (losses), net | 16 | 35 | (19) | (54) | % | 106 | 76 | 30 | 39 | % | ||||||||||||||||||||||||||||||||||||||||
Investment gains (losses), net(4) | 19 | (7) | 26 | NM | 11 | 3 | 8 | NM | ||||||||||||||||||||||||||||||||||||||||||
| Other gains (losses), net | 35 | 28 | 7 | 25 | % | 117 | 79 | 38 | 48 | % | ||||||||||||||||||||||||||||||||||||||||
| (Provision) benefit for credit losses | (5) | (69) | 64 | 93 | % | (283) | (752) | 469 | 62 | % | ||||||||||||||||||||||||||||||||||||||||
| Non-interest expense: | ||||||||||||||||||||||||||||||||||||||||||||||||||
Administrative expenses(5) | (171) | (150) | (21) | (14) | % | (661) | (619) | (42) | (7) | % | ||||||||||||||||||||||||||||||||||||||||
Legislative assessments(6) | (15) | (14) | (1) | (7) | % | (61) | (47) | (14) | (30) | % | ||||||||||||||||||||||||||||||||||||||||
Credit enhancement expense(7) | (80) | (79) | (1) | (1) | % | (313) | (292) | (21) | (7) | % | ||||||||||||||||||||||||||||||||||||||||
Other income (expense), net(4)(8) | 27 | 33 | (6) | (18) | % | 20 | 86 | (66) | (77) | % | ||||||||||||||||||||||||||||||||||||||||
| Total non-interest expense | (239) | (210) | (29) | (14) | % | (1,015) | (872) | (143) | (16) | % | ||||||||||||||||||||||||||||||||||||||||
| Income before federal income taxes | 1,036 | 960 | 76 | 8 | % | 3,609 | 3,149 | 460 | 15 | % | ||||||||||||||||||||||||||||||||||||||||
| Provision for federal income taxes | (186) | (186) | — | — | %* | (661) | (601) | (60) | (10) | % | ||||||||||||||||||||||||||||||||||||||||
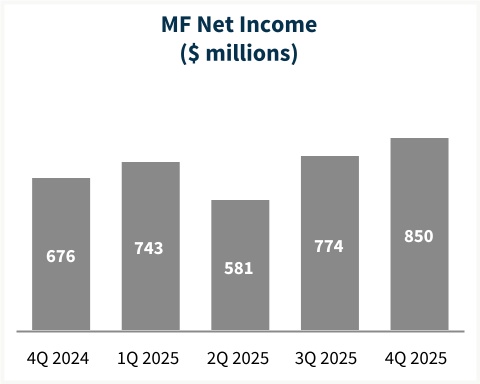
| Net income | $ | 850 | $ | 774 | $ | 76 | 10 | % | $ | 2,948 | $ | 2,548 | $ | 400 | 16 | % | ||||||||||||||||||||||||||||||||||
| Average charged guaranty fee rate on multifamily guaranty book of business, at period end | 71.6 bps | 72.4 bps | (0.8) bps | (1) | % | 71.6 bps | 74.4 bps | (2.8) bps | (4) | % | ||||||||||||||||||||||||||||||||||||||||
Fourth Quarter 2025 | 4 | |||||||
| Additional Matters | ||
| Endnotes | |||||
| NM | Not meaningful | ||||
| * | Represents less than 0.5% | ||||
| (1) | As presented in our Form 10-K, net revenues consists of net interest income, and fee and other income. | ||||
| (2) | Administrative expense ratio is calculated as administrative expenses divided by net revenues during the period. Administrative expense consists of salaries and employee benefits and professional services, technology and occupancy expenses. | ||||
| (3) | Illustrative return on average required Common Equity Tier 1 (CET1) is designed to show what our return on capital would have been if our actual CET1 available capital had been equal to the CET1 capital requirement for the applicable periods. CET1 requirement as presented represents the company's average CET1 capital requirement including prescribed capital conservation buffer amount under the enterprise regulatory capital framework (which is not currently in effect while the company is in conservatorship) for the period as described below and not the amount of the company's actual available CET1 capital. As of December 31, 2025, the company's actual available CET1 capital was a deficit of $41 billion. For each applicable period, the illustrative return on average required CET1 ratio is calculated based on annualized year-to-date net income for the period divided by the average CET1 capital requirement for each quarter to date during the applicable year plus the fourth quarter of the previous year. | ||||
| (4) | Beginning in the fourth quarter of 2025, the company changed the presentation of debt extinguishment gains and losses from “Other income (expense), net” to “Investment gains (losses), net.” Prior periods have been recast to conform with the current period presentation. | ||||
| (5) | Consists of salaries and employee benefits and professional services, technology and occupancy expenses. | ||||
| (6) | For single-family, consists of the portion of our single-family guaranty fees that is paid to Treasury pursuant to the TCCA, affordable housing allocations and FHFA assessments. For multifamily, consists of affordable housing allocations and FHFA assessments. | ||||
| (7) | Consists of costs associated with freestanding credit enhancements, which primarily include the company’s Connecticut Avenue Securities® (“CAS”) and Credit Insurance Risk TransferTM programs, enterprise-paid mortgage insurance, and certain lender risk-sharing programs. | ||||
| (8) | Primarily consists of foreclosed property income (expense), change in the expected benefits from our freestanding credit enhancements, and gains (losses) from partnership investments. | ||||
| (9) | Single-family seriously delinquent loans are loans that are 90 days or more past due or in the foreclosure process. Our single-family serious delinquency rate is expressed as a percentage of our single-family conventional guaranty book of business based on loan count. | ||||
| (10) | Multifamily serious delinquency rate consists of multifamily loans that were 60 days or more past due based on unpaid principal balance, expressed as a percentage of our multifamily guaranty book of business. | ||||
Fourth Quarter 2025 | 5 | |||||||
| For the Year Ended December 31, | |||||||||||||||||||||||||||||||||||
| 2025 | 2024 | 2023 | |||||||||||||||||||||||||||||||||
| Interest income: | |||||||||||||||||||||||||||||||||||
| Mortgage loans | $ | 152,149 | $ | 144,152 | $ | 133,234 | |||||||||||||||||||||||||||||
| Securities purchased under agreements to resell | 3,354 | 4,170 | 4,427 | ||||||||||||||||||||||||||||||||
| Investments in securities and other | 3,115 | 2,244 | 2,053 | ||||||||||||||||||||||||||||||||
| Total interest income | 158,618 | 150,566 | 139,714 | ||||||||||||||||||||||||||||||||
| Interest expense: | |||||||||||||||||||||||||||||||||||
| Short-term debt | (585) | (595) | (672) | ||||||||||||||||||||||||||||||||
| Long-term debt | (129,425) | (121,223) | (110,269) | ||||||||||||||||||||||||||||||||
| Total interest expense | (130,010) | (121,818) | (110,941) | ||||||||||||||||||||||||||||||||
| Net interest income | 28,608 | 28,748 | 28,773 | ||||||||||||||||||||||||||||||||
| Non-interest Income: | |||||||||||||||||||||||||||||||||||
| Fair value gains (losses), net | 90 | 1,821 | 1,304 | ||||||||||||||||||||||||||||||||
| Fee and other income | 356 | 321 | 275 | ||||||||||||||||||||||||||||||||
| Investment gains (losses), net | 105 | (96) | (265) | ||||||||||||||||||||||||||||||||
| Non-interest income | 551 | 2,046 | 1,314 | ||||||||||||||||||||||||||||||||
| (Provision) benefit for credit losses | (1,606) | 186 | 1,670 | ||||||||||||||||||||||||||||||||
| Non-interest expense: | |||||||||||||||||||||||||||||||||||
| Salaries and employee benefits | (2,094) | (2,004) | (1,906) | ||||||||||||||||||||||||||||||||
| Professional services, technology, and occupancy | (1,485) | (1,615) | (1,539) | ||||||||||||||||||||||||||||||||
| Legislative assessments | (3,749) | (3,766) | (3,745) | ||||||||||||||||||||||||||||||||
| Credit enhancement expense | (1,656) | (1,641) | (1,512) | ||||||||||||||||||||||||||||||||
| Other income (expense), net | (586) | (685) | (1,099) | ||||||||||||||||||||||||||||||||
| Total non-interest expense | (9,570) | (9,711) | (9,801) | ||||||||||||||||||||||||||||||||
| Income before federal income taxes | 17,983 | 21,269 | 21,956 | ||||||||||||||||||||||||||||||||
| Provision for federal income taxes | (3,619) | (4,291) | (4,548) | ||||||||||||||||||||||||||||||||
| Net income | 14,364 | 16,978 | 17,408 | ||||||||||||||||||||||||||||||||
| Other comprehensive income (loss) | (9) | (3) | (3) | ||||||||||||||||||||||||||||||||
| Total comprehensive income | $ | 14,355 | $ | 16,975 | $ | 17,405 | |||||||||||||||||||||||||||||
| Net income | $ | 14,364 | $ | 16,978 | $ | 17,408 | |||||||||||||||||||||||||||||
| Dividends distributed or amounts attributable to senior preferred stock | (14,355) | (16,975) | (17,405) | ||||||||||||||||||||||||||||||||
| Net income attributable to common stockholders | $ | 9 | $ | 3 | $ | 3 | |||||||||||||||||||||||||||||
| Earnings per share: | |||||||||||||||||||||||||||||||||||
| Basic | $ | 0.00 | $ | 0.00 | $ | 0.00 | |||||||||||||||||||||||||||||
| Diluted | 0.00 | 0.00 | 0.00 | ||||||||||||||||||||||||||||||||
| Weighted-average common shares outstanding: | |||||||||||||||||||||||||||||||||||
| Basic | 5,867 | 5,867 | 5,867 | ||||||||||||||||||||||||||||||||
| Diluted | 5,893 | 5,893 | 5,893 | ||||||||||||||||||||||||||||||||
Fourth Quarter 2025 | 6 | |||||||
| As of December 31, | |||||||||||||||||||||||
| 2025 | 2024 | ||||||||||||||||||||||
| ASSETS | |||||||||||||||||||||||
| Cash | $ | 11,452 | $ | 13,477 | |||||||||||||||||||
| Restricted cash (includes $22,848 and $16,994, respectively, related to consolidated trusts) | 31,131 | 25,059 | |||||||||||||||||||||
| Securities purchased under agreements to resell (includes $18,425 and $14,899, respectively, related to consolidated trusts) | 45,650 | 56,250 | |||||||||||||||||||||
| Investments in securities, at fair value | 69,889 | 79,197 | |||||||||||||||||||||
| Mortgage loans: | |||||||||||||||||||||||
| Loans held for sale, at lower of cost or fair value | 209 | 373 | |||||||||||||||||||||
| Loans held for investment, at amortized cost: | |||||||||||||||||||||||
| Of Fannie Mae | 57,970 | 50,053 | |||||||||||||||||||||
| Of consolidated trusts | 4,069,498 | 4,095,287 | |||||||||||||||||||||
| Total loans held for investment (includes $5,464 and $3,744, respectively, at fair value) | 4,127,468 | 4,145,340 | |||||||||||||||||||||
| Allowance for loan losses | (8,364) | (7,707) | |||||||||||||||||||||
| Total loans held for investment, net of allowance | 4,119,104 | 4,137,633 | |||||||||||||||||||||
| Total mortgage loans | 4,119,313 | 4,138,006 | |||||||||||||||||||||
| Advances to lenders | 3,595 | 1,825 | |||||||||||||||||||||
| Deferred tax assets, net | 9,828 | 10,545 | |||||||||||||||||||||
| Accrued interest receivable (includes $11,129 and $10,666, respectively, related to consolidated trusts) | 11,689 | 11,364 | |||||||||||||||||||||
| Other assets | 14,991 | 14,008 | |||||||||||||||||||||
| Total assets | $ | 4,317,538 | $ | 4,349,731 | |||||||||||||||||||
| LIABILITIES AND EQUITY | |||||||||||||||||||||||
| Liabilities: | |||||||||||||||||||||||
| Accrued interest payable (includes $11,320 and $10,858, respectively, related to consolidated trusts) | $ | 12,035 | $ | 11,585 | |||||||||||||||||||
| Debt: | |||||||||||||||||||||||
| Of Fannie Mae (includes $256 and $385, respectively, at fair value) | 127,289 | 139,422 | |||||||||||||||||||||
| Of consolidated trusts (includes $15,060 and $13,292, respectively, at fair value) | 4,053,140 | 4,088,675 | |||||||||||||||||||||
| Other liabilities (includes $1,719 and $1,699, respectively, related to consolidated trusts) | 16,062 | 15,392 | |||||||||||||||||||||
| Total liabilities | 4,208,526 | 4,255,074 | |||||||||||||||||||||
| Commitments and contingencies (Note 17) | — | — | |||||||||||||||||||||
| Fannie Mae stockholders’ equity: | |||||||||||||||||||||||
| Senior preferred stock (liquidation preference of $226,984 and $212,029, respectively) | 120,836 | 120,836 | |||||||||||||||||||||
| Preferred stock, 700,000,000 shares are authorized—555,374,922 shares issued and outstanding | 19,130 | 19,130 | |||||||||||||||||||||
| Common stock, no par value, no maximum authorization—1,308,762,703 shares issued and 1,158,087,567 shares outstanding | 687 | 687 | |||||||||||||||||||||
| Accumulated deficit | (24,261) | (38,625) | |||||||||||||||||||||
| Accumulated other comprehensive income | 20 | 29 | |||||||||||||||||||||
| Treasury stock, at cost, 150,675,136 shares | (7,400) | (7,400) | |||||||||||||||||||||
Total stockholders’ equity | 109,012 | 94,657 | |||||||||||||||||||||
| Total liabilities and equity | $ | 4,317,538 | $ | 4,349,731 | |||||||||||||||||||
Fourth Quarter 2025 | 7 | |||||||