Shareholder Report
Nov. 30, 2025
USD ($)
Holding
This report describes changes to the Fund that occurred during or after the reporting period.
WHAT WERE THE FUND COSTS FOR THE LAST YEAR?
(Based on a hypothetical $10,000 investment)
| Fund | Costs of a $10,000 investment | Costs paid as a percentage of a $10,000 investment |
| First Trust Active Global Quality Income ETF | $47 | 0.43%(1) |
|
(1) |
Includes payment received from insurance during the fiscal year ended November 30, 2025 related to extraordinary legal fees paid by the Fund during the fiscal year ended November 30, 2024 and the fiscal period ended November 30, 2023. If the insurance payment had not been received, the expense ratio would have been 0.85%. |
HOW DID THE FUND PERFORM LAST YEAR? WHAT AFFECTED THE FUND’S PERFORMANCE?
The Fund returned 19.52% for the 12 months ended November 30, 2025. The Fund outperformed its benchmark, the MSCI ACWI High Dividend Yield Index, which returned 13.59% for the same Period.
Key contributors to the Fund’s performance during the Period were:
-
In an interest-rate environment that was positive for financial companies, stock selection in the Financials sector was positive for relative returns. Positions in Nordea Bank Abp, BNP Paribas S.A., Dai-Ichi Life Holdings, Inc., CME Group, Inc. and AIA Group Ltd. all outperformed over the Period after reporting strong sets of corporate results. We feel the sector continues to offer attractive valuation and dividend yields despite the strong performance this Period.
-
Despite an uncertain environment for the global consumer, holdings in media company, Sony Group Corp. (“Sony”), and luxury goods maker, Cie Financiere Richemont S.A. (“Richemont”), performed well. Sony’s share price was supported by earnings upgrades, driven by the outlook for its music, games and films divisions with the new CEO prioritizing profit growth. Meanwhile, Richemont has been successful with its jewelry franchise and delivered sales higher than expected.
-
The Fund’s overweight position in the Technology sector also helped drive positive performance. The excitement around artificial intelligence (“AI”) and its many applications led to a record amount of capital expenditure from major technology companies as well as governments. Holdings in semiconductor company Taiwan Semiconductor Manufacturing Co., Ltd. and technology conglomerate Samsung Electronics Co., Ltd. rallied as AI investment surprised positively, with both share prices hitting all-time highs during the year.
Key detractors from the Fund’s performance during the Period were:
-
Holdings that were seen to face business disruption from the adoption of AI or where the growth outlook was delayed versus previous expectations. This included holdings in the industrials sector such as RELX PLC, Schneider Electric SE and Daimler Truck Holding AG as well as the holding in the copper mining Freeport-McMoRan, Inc. in the Materials sector.
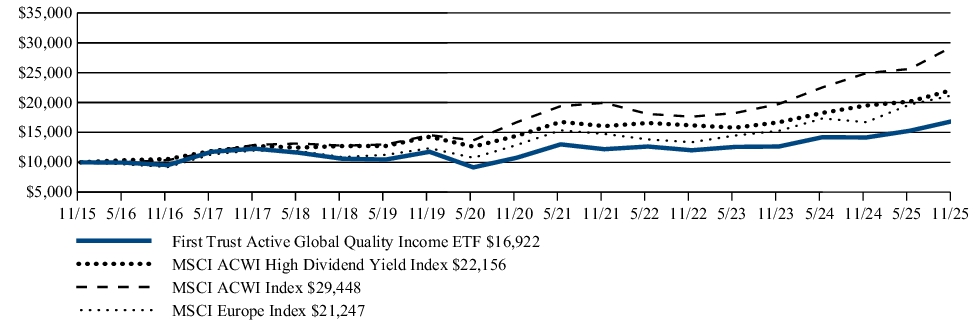
FUND PERFORMANCE (November 30, 2015 to November 30, 2025)
The performance line graph below shows the performance of a hypothetical $10,000 initial investment in the Fund over a ten-year period (or for the life of the Fund, if shorter). The subsequent account value as of the end of the Period is listed next to the name of the Fund or index, as applicable. The performance table below shows the average annual total returns of the Fund for the past one-, five-, and ten-year periods, as applicable (or for the life of the Fund, if shorter), as of the end of the Period. Both the line graph and performance table compare the Fund’s performance to an appropriate broad-based index and may compare to additional indices reflecting the market segment(s) in which the Fund invests over the same periods.
Investment Performance of $10,000
| Average Annual Total Returns (as of November 30, 2025) | 1 Year | 5 Year | 10 Year |
| First Trust Active Global Quality Income ETF | 19.52% | 9.43% | 5.40% |
| MSCI ACWI High Dividend Yield Index | 13.59% | 8.94% | 8.28% |
| MSCI ACWI Index | 18.21% | 11.97% | 11.41% |
| MSCI Europe Index | 27.14% | 10.47% | 7.83% |
Visit www.ftportfolios.com/etf/AGQI for more recent performance information.
KEY FUND STATISTICS (As of November 30, 2025)
| Fund net assets | $57,075,888 |
| Total number of portfolio holdings | 33 |
| Total advisory fee paid | $475,118 |
| Portfolio turnover rate | 64% |
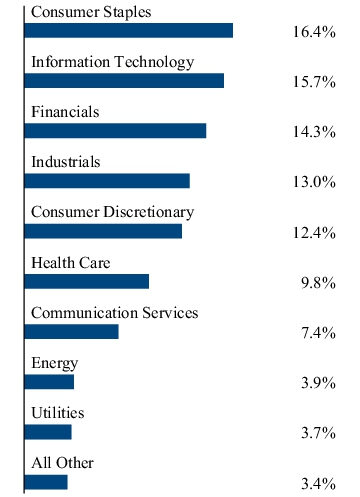
WHAT DID THE FUND INVEST IN? (As of November 30, 2025)
The tables below show the investment makeup of the Fund, representing the percentage of total investments of the Fund.
Top Ten Holdings
| Taiwan Semiconductor Manufacturing Co., Ltd. | 4.6% |
| Alphabet, Inc., Class C | 4.3% |
| Carlsberg A/S, Class B | 4.2% |
| Chevron Corp. | 4.0% |
| AstraZeneca PLC | 3.9% |
| Cie Financiere Richemont S.A., Class A | 3.8% |
| Iberdrola S.A. | 3.7% |
| Microsoft Corp. | 3.7% |
| Coca-Cola (The) Co. | 3.6% |
| AIA Group Ltd. | 3.5% |
Sector Allocation
Top Ten Holdings
| Taiwan Semiconductor Manufacturing Co., Ltd. | 4.6% |
| Alphabet, Inc., Class C | 4.3% |
| Carlsberg A/S, Class B | 4.2% |
| Chevron Corp. | 4.0% |
| AstraZeneca PLC | 3.9% |
| Cie Financiere Richemont S.A., Class A | 3.8% |
| Iberdrola S.A. | 3.7% |
| Microsoft Corp. | 3.7% |
| Coca-Cola (The) Co. | 3.6% |
| AIA Group Ltd. | 3.5% |
HOW HAS THE FUND MATERIALLY CHANGED?
This is a summary of certain changes to the Fund since December 1, 2024. For more complete information, you may review the Fund’s prospectus and any applicable supplements at www.ftportfolios.com/fund-documents/etf/AGQI or upon request at 1-800-621-1675 or info@ftportfolios.com.
The Fund’s net expense ratio for the fiscal year ended November 30, 2025 was 0.43% of the Fund's average daily net assets, a decrease from a net expense ratio for the fiscal year ended November 30, 2024 of 2.27% of the Fund’s average daily net assets. This ratio reflects a payment received from insurance during the fiscal year ended November 30, 2025 related to extraordinary legal fees paid by the Fund during the fiscal year ended November 30, 2024 and the fiscal period ended November 30, 2023.
The Fund’s net expense ratio for the fiscal year ended November 30, 2025 was 0.43% of the Fund's average daily net assets, a decrease from a net expense ratio for the fiscal year ended November 30, 2024 of 2.27% of the Fund’s average daily net assets. This ratio reflects a payment received from insurance during the fiscal year ended November 30, 2025 related to extraordinary legal fees paid by the Fund during the fiscal year ended November 30, 2024 and the fiscal period ended November 30, 2023.
This is a summary of certain changes to the Fund since December 1, 2024. For more complete information, you may review the Fund’s prospectus and any applicable supplements at www.ftportfolios.com/fund-documents/etf/AGQI or upon request at 1-800-621-1675 or info@ftportfolios.com.
WHAT WERE THE FUND COSTS FOR THE LAST YEAR?
(Based on a hypothetical $10,000 investment)
| Fund | Costs of a $10,000 investment | Costs paid as a percentage of a $10,000 investment |
| FT Energy Income Partners Enhanced Income ETF | $117 | 1.13%(1) |
|
(1)
|
Includes extraordinary expenses. If these extraordinary expenses were not included, the expense ratio would have been 1.10%.
|
HOW DID THE FUND PERFORM LAST YEAR? WHAT AFFECTED THE FUND’S PERFORMANCE?
The Fund returned 6.39% for the 12 months ended November 30, 2025. The Fund outperformed its benchmark, the S&P Global 1200 Energy Index, which returned 6.25% for the same Period.
This outperformance was attributable to overweight positions in natural gas pipeline companies, pipeline master limited partnerships, and electric utilities that outperformed the benchmark and were either underweight or were not included in the benchmark. These companies, in the opinion of the Fund’s sub-advisor, Energy Income Partners, LLC, are well positioned to benefit from growing electricity demand and the need for more natural gas generation, along with increasing liquefied natural gas export capacity. Underweight positions in various cyclical energy companies relative to the benchmark also contributed to the Fund’s relative performance. The Fund tends to be overweight in companies that have more stable and growing earnings such as pipeline and utility companies relative to the benchmark, while the benchmark tends to be overweight in cyclical energy companies such as oil and gas producers and international oil companies.
The Fund posted positive returns for the Period as dividend income and earnings growth of natural gas pipeline companies, pipeline master limited partnerships and electric utilities offset the Fund’s exposure to some liquids pipeline and renewable companies. Selling covered calls had a negative impact on the performance of the Fund which was partially offset by the premiums collected over the Period.
Top Contributors:
-
DT Midstream, Inc
-
TotalEnergies SE
-
MPLX, L.P.
-
American Electric Power Co., Inc.
-
Shell PLC
Top Detractors:
-
ONEOK, Inc.
-
Energy Transfer, L.P.
-
XPLR Infrastructure, L.P.
-
Targa Resources Corp.
-
Public Service Enterprise Group, Inc.
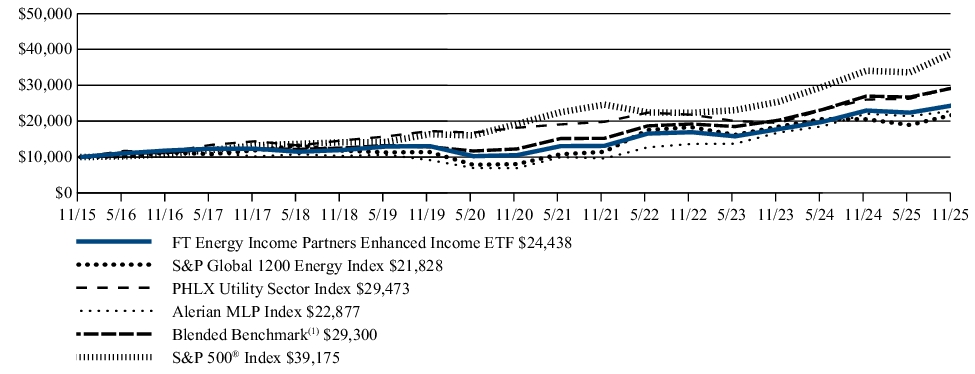
FUND PERFORMANCE (November 30, 2015 to November 30, 2025)
The performance line graph below shows the performance of a hypothetical $10,000 initial investment in the Fund over a ten-year period (or for the life of the Fund, if shorter). The subsequent account value as of the end of the Period is listed next to the name of the Fund or index, as applicable. The performance table below shows the average annual total returns of the Fund for the past one-, five-, and ten-year periods, as applicable (or for the life of the Fund, if shorter), as of the end of the Period. Both the line graph and performance table compare the Fund’s performance to an appropriate broad-based index and may compare to additional indices reflecting the market segment(s) in which the Fund invests over the same periods.
Investment Performance of $10,000
|
(1)
|
The Blended Benchmark consists of the following: PHLX Utility Sector Index (50%) and Alerian MLP Index (50%). The Blended Benchmark reflects the diverse allocation of companies engaged in the energy infrastructure sector in the Fund’s portfolio. The indices do not charge management fees or brokerage expenses, and no such fees or expenses were deducted from the performance shown. Indexes are unmanaged and an investor cannot invest directly in an index. The Blended Benchmark returns are calculated by using the monthly return of the two indices during each period shown above. At the beginning of each month the two indices are rebalanced to a 50-50 ratio to account for divergence from that ratio that occurred during the course of each month. The monthly returns are then compounded for each period shown above, giving the performance for the Blended Benchmark for each period shown above.
|
| Average Annual Total Returns (as of November 30, 2025) | 1 Year | 5 Year | 10 Year |
| FT Energy Income Partners Enhanced Income ETF | 6.39% | 18.31% | 9.35% |
| S&P Global 1200 Energy Index | 6.25% | 22.06% | 8.12% |
| PHLX Utility Sector Index | 13.25% | 10.14% | 11.41% |
| Alerian MLP Index | 3.55% | 27.00% | 8.63% |
| Blended Benchmark(1) | 8.55% | 19.01% | 11.35% |
| S&P 500® Index | 15.00% | 15.28% | 14.63% |
|
(1)
|
The Blended Benchmark consists of the following: PHLX Utility Sector Index (50%) and Alerian MLP Index (50%). The Blended Benchmark reflects the diverse allocation of companies engaged in the energy infrastructure sector in the Fund’s portfolio. The indices do not charge management fees or brokerage expenses, and no such fees or expenses were deducted from the performance shown. Indexes are unmanaged and an investor cannot invest directly in an index. The Blended Benchmark returns are calculated by using the monthly return of the two indices during each period shown above. At the beginning of each month the two indices are rebalanced to a 50-50 ratio to account for divergence from that ratio that occurred during the course of each month. The monthly returns are then compounded for each period shown above, giving the performance for the Blended Benchmark for each period shown above.
|
Visit www.ftportfolios.com/etf/EIPI for more recent performance information.
KEY FUND STATISTICS (As of November 30, 2025)
| Fund net assets | $967,974,853 |
| Total number of portfolio holdings | 125 |
| Total advisory fee paid | $10,165,815 |
| Portfolio turnover rate | 103% |
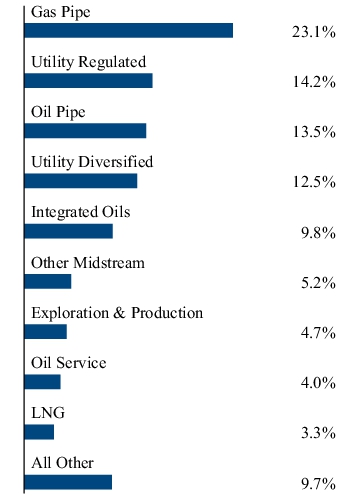
WHAT DID THE FUND INVEST IN? (As of November 30, 2025)
The tables below show the investment makeup of the Fund, representing the percentage of total investments of the Fund.
Top Ten Holdings
| Enterprise Products Partners, L.P. | 8.0% |
| Energy Transfer, L.P. | 6.0% |
| MPLX, L.P. | 4.9% |
| Kinder Morgan, Inc. | 4.1% |
| Exxon Mobil Corp. | 3.4% |
| Shell PLC, ADR | 3.3% |
| Williams (The) Cos., Inc. | 3.1% |
| Enbridge, Inc. | 2.7% |
| ONEOK, Inc. | 2.7% |
| National Fuel Gas Co. | 2.6% |
Sector Allocation
Top Ten Holdings
| Enterprise Products Partners, L.P. | 8.0% |
| Energy Transfer, L.P. | 6.0% |
| MPLX, L.P. | 4.9% |
| Kinder Morgan, Inc. | 4.1% |
| Exxon Mobil Corp. | 3.4% |
| Shell PLC, ADR | 3.3% |
| Williams (The) Cos., Inc. | 3.1% |
| Enbridge, Inc. | 2.7% |
| ONEOK, Inc. | 2.7% |
| National Fuel Gas Co. | 2.6% |
This report describes changes to the Fund that occurred during or after the reporting period.
WHAT WERE THE FUND COSTS FOR THE LAST YEAR?
(Based on a hypothetical $10,000 investment)
| Fund | Costs of a $10,000 investment | Costs paid as a percentage of a $10,000 investment |
| FT Confluence BDC & Specialty Finance Income ETF | $222(1) (2) | 2.25%(1) (2) |
|
(1)
|
Excludes any Acquired Fund Fees and Expenses of underlying investment companies in which the Fund invests.
|
|
(2)
|
Includes costs from the First Trust Specialty Finance and Financial Opportunities Fund (“FGB”) for the period November 1, 2024 to June 30, 2025. After FGB reorganized into the Fund, the Fund began charging an annual unitary management fee of 0.95%.
|
HOW DID THE FUND PERFORM LAST YEAR? WHAT AFFECTED THE FUND’S PERFORMANCE?
The Fund returned -2.61% for the fiscal year ended November 30, 2025. Performance prior to June 30, 2025 is for FGB. The Fund outperformed its benchmark, the MarketVector™ US Business Development Companies Liquid Index, which returned -3.16% for the same Period.
This outperformance was in part derived from higher relative exposure to certain internally managed business development companies (“BDCs”) that delivered higher returns and lower relative allocations to certain large index constituents that underperformed during the Period.
The following key factors affected the Fund’s performance during the Period:
-
BDCs delivered steady operating results and significant dividend income during the Period. In turn, the Fund also delivered a high level of income, derived from BDCs with stable operating fundamentals.
-
However, late in the third quarter of 2025, some high-profile bankruptcies created widespread concerns about credit quality in private debt markets and a thesis formed that the large capital inflows had formed a speculative bubble.
-
Concerns among BDC investors rose based upon the belief that the first signs of a speculative bubble burst were attached to the high-profile bankruptcies. However, the issues related to those bankruptcies appeared idiosyncratic and not indicative of widespread problems.
-
Private credit market concerns drove BDC valuations lower, erasing much of the industry’s positive returns earned earlier in the Period. But from our perspective, we don’t believe a speculative bubble in private credit markets formed. Lending standards in the BDC industry remained intact.
Regardless of market conditions, we believe monitoring risk should be a continuous effort. One of the most helpful ways to address BDC investment risk is to actively focus on experienced managers employing high-quality underwriting, with long track records of delivering attractive risk-adjusted returns. Also important are BDC capital allocation policies, fee levels, and the alignment of incentives alongside those of shareholders.
Looking forward, we believe the environment for BDCs is fairly well balanced. On one side, BDCs are likely to face downward pressure on profitability as short-term rates decline; however, on the other side, BDC loan portfolios may benefit from a credit quality uplift as their borrowers experience declining interest expense burdens.
Through active portfolio management, we believe investors can benefit from exposure to BDCs with the breadth and depth in their business models to deliver attractive returns, regardless of where interest rates go.
BDCs provide a unique and liquid way to gain exposure to private credit with a high level of current income. We believe the Fund is well positioned to deliver the utility of this alternative asset class and that active management can help improve risk-adjusted returns.
FUND PERFORMANCE (November 30, 2015 to November 30, 2025)
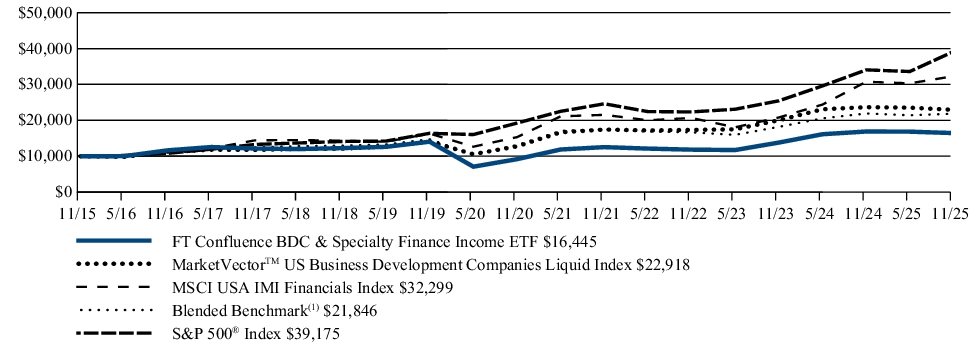
The performance line graph below shows the performance of a hypothetical $10,000 initial investment in the Fund over a ten-year period (or for the life of the Fund, if shorter). The subsequent account value as of the end of the Period is listed next to the name of the Fund or index, as applicable. The performance table below shows the average annual total returns of the Fund for the past one-, five-, and ten-year periods, as applicable (or for the life of the Fund, if shorter), as of the end of the Period. Both the line graph and performance table compare the Fund’s performance to an appropriate broad-based index and may compare to additional indices reflecting the market segment(s) in which the Fund invests over the same periods.
Investment Performance of $10,000
|
(1)
|
The Blended Benchmark consists of a 70/20/10 blend of the MVIS U.S. Business Development Companies Index, the FTSE NARIET Mortgage REIT Index and the S&P SmallCap Financials Index. The Blended Benchmark returns are calculated by using the monthly return of the three indices during each period shown above. At the beginning of each month, the three indices are rebalanced, to account for divergence from that ratio that occurred during the course of each month to the ratios noted above. The monthly returns are then compounded for each period shown above, giving the performance for the Blended Benchmark for each period shown above.
|
| Average Annual Total Returns (as of November 30, 2025) | 1 Year | 5 Year | 10 Year |
| FT Confluence BDC & Specialty Finance Income ETF | -2.61% | 12.37% | 5.10% |
| MarketVectorTM US Business Development Companies Liquid Index | -3.16% | 12.45% | 8.65% |
| MSCI USA IMI Financials Index | 4.99% | 16.09% | 12.44% |
| Blended Benchmark(1) | -0.32% | 10.77% | 8.13% |
| S&P 500® Index | 15.00% | 15.28% | 14.63% |
|
(1)
|
The Blended Benchmark consists of a 70/20/10 blend of the MVIS U.S. Business Development Companies Index, the FTSE NARIET Mortgage REIT Index and the S&P SmallCap Financials Index. The Blended Benchmark returns are calculated by using the monthly return of the three indices during each period shown above. At the beginning of each month, the three indices are rebalanced, to account for divergence from that ratio that occurred during the course of each month to the ratios noted above. The monthly returns are then compounded for each period shown above, giving the performance for the Blended Benchmark for each period shown above.
|
Visit www.ftportfolios.com/etf/FBDC for more recent performance information.
KEY FUND STATISTICS (As of November 30, 2025)
| Fund net assets | $39,272,281 |
| Total number of portfolio holdings | 22 |
| Total advisory fee paid | $576,206 |
| Portfolio turnover rate | 28% |
WHAT DID THE FUND INVEST IN? (As of November 30, 2025)
The tables below show the investment makeup of the Fund, representing the percentage of total investments of the Fund.
Top Ten Holdings
| Main Street Capital Corp. | 11.4% |
| Hercules Capital, Inc. | 10.5% |
| Ares Capital Corp. | 10.1% |
| Golub Capital BDC, Inc. | 9.0% |
| Sixth Street Specialty Lending, Inc. | 8.8% |
| Blackstone Secured Lending Fund | 8.2% |
| Blue Owl Capital Corp. | 5.8% |
| New Mountain Finance Corp. | 4.9% |
| FS KKR Capital Corp. | 4.7% |
| Barings BDC, Inc. | 4.7% |
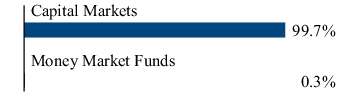
Industry Allocation
Top Ten Holdings
| Main Street Capital Corp. | 11.4% |
| Hercules Capital, Inc. | 10.5% |
| Ares Capital Corp. | 10.1% |
| Golub Capital BDC, Inc. | 9.0% |
| Sixth Street Specialty Lending, Inc. | 8.8% |
| Blackstone Secured Lending Fund | 8.2% |
| Blue Owl Capital Corp. | 5.8% |
| New Mountain Finance Corp. | 4.9% |
| FS KKR Capital Corp. | 4.7% |
| Barings BDC, Inc. | 4.7% |
HOW HAS THE FUND MATERIALLY CHANGED?
This is a summary of certain changes to the Fund since its reorganization on June 30, 2025. For more complete information, you may review the Fund’s prospectus and any applicable supplements at www.ftportfolios.com/fund-documents/etf/FBDC or upon request at 1-800-621-1675 or info@ftportfolios.com.
The Fund’s expense ratio for the fiscal year ended November 30, 2025 was 2.25% of the Fund’s average daily net assets, a decrease from the expense ratio for the fiscal year ended November 30, 2024 of 2.62% of the Fund’s average daily net assets. The expense ratio includes costs from FGB for the period November 1, 2024 to June 30, 2025. After FGB reorganized into the Fund, the Fund began charging an annual unitary management fee of 0.95%.
The Fund’s expense ratio for the fiscal year ended November 30, 2025 was 2.25% of the Fund’s average daily net assets, a decrease from the expense ratio for the fiscal year ended November 30, 2024 of 2.62% of the Fund’s average daily net assets. The expense ratio includes costs from FGB for the period November 1, 2024 to June 30, 2025. After FGB reorganized into the Fund, the Fund began charging an annual unitary management fee of 0.95%.
This is a summary of certain changes to the Fund since its reorganization on June 30, 2025. For more complete information, you may review the Fund’s prospectus and any applicable supplements at www.ftportfolios.com/fund-documents/etf/FBDC or upon request at 1-800-621-1675 or info@ftportfolios.com.
| [1] | Includes payment received from insurance during the fiscal year ended November 30, 2025 related to extraordinary legal fees paid by the Fund during the fiscal year ended November 30, 2024 and the fiscal period ended November 30, 2023. If the insurance payment had not been received, the expense ratio would have been 0.85%. |
| [2] | Includes extraordinary expenses. If these extraordinary expenses were not included, the expense ratio would have been 1.10%. |
| [3] | Excludes any Acquired Fund Fees and Expenses of underlying investment companies in which the Fund invests. |
| [4] | Includes costs from the First Trust Specialty Finance and Financial Opportunities Fund (“FGB”) for the period November 1, 2024 to June 30, 2025. After FGB reorganized into the Fund, the Fund began charging an annual unitary management fee of 0.95%. |