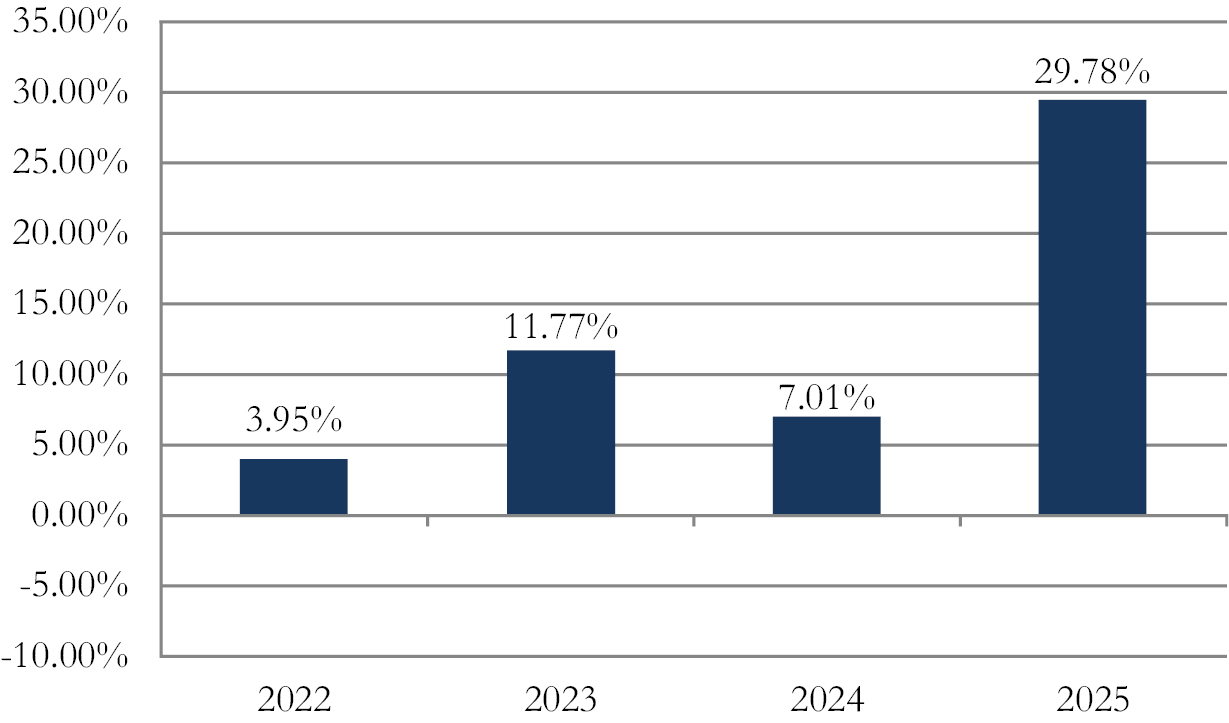
The bar chart and table below provide some indication of the risks of investing in the Fund by showing changes in the Fund’s performance from year to year and by showing how the average annual total returns of the Fund compare with the average annual total returns of the MSCI ACWI (Net) Index, a broad-based securities market index, as well as the Bloomberg Commodity Total Return Index, the Bloomberg U.S. TIPS 1-3 Year (USD) Index and the AXS Astoria Blended Benchmark Index. The MSCI ACWI (Net) Index has been included as the primary broad-based securities market index in order to satisfy regulatory requirements. The Fund also compares its performance with the returns of Bloomberg Commodity Total Return Index, the Bloomberg U.S. TIPS 1-3 Year (USD) Index and the AXS Astoria Blended Benchmark Index, which the Advisor believes are better performance benchmarks for comparison to the Fund’s performance in light of the Fund’s investment strategies. Updated performance information is available at the Fund’s website, www.axsinvestments.com or by calling the Fund collect at 1-833-297-2587. The Fund’s past performance, before and after taxes, is not necessarily an indication of how the Fund will perform in the future.
| Highest Calendar Quarter Return at NAV | 15.81% | Quarter ended 3/31/2024 |
| Lowest Calendar Quarter Return at NAV | (17.42)% | Quarter ended 6/30/2022 |
| Average Annual Total Returns | One Year | Since |
| Return Before Taxes | 29.78% | 12.72% |
| Return After Taxes on Distributions* | 29.41% | 12.11% |
| Return After Taxes on Distributions and Sale of Fund Shares* | 17.83% | 9.87% |
| MSCI ACWI (Net) Index | 22.34% | 9.36% |
| AXS Astoria Blended Benchmark Index | 19.42% | 8.50% |
| Bloomberg Commodity Total Return Index | 15.77% | 6.59% |
| Bloomberg U.S. TIPS 1-3 Year (USD) Index | 5.68% | 3.38% |
* After-tax returns are calculated using the historical highest individual federal marginal income tax rates and do not reflect the impact of state and local taxes. Actual after-tax returns depend on an investor’s tax situation and may differ from those shown. After-tax returns shown are not relevant to investors who hold their Fund shares through tax-deferred arrangements, such as 401(k) plans or individual retirement accounts.