Shareholder Report
Nov. 30, 2025
USD ($)
Holding
Shareholder Report |
12 Months Ended |
|---|---|
|
Nov. 30, 2025
USD ($)
Holding
| |
| Shareholder Report [Line Items] | |
| Document Type | N-CSR |
| Amendment Flag | false |
| Registrant Name | Northern Lights Fund Trust II |
| Entity Central Index Key | 0001518042 |
| Entity Investment Company Type | N-1A |
| Document Period End Date | Nov. 30, 2025 |
| Shareholder Report Annual or Semi-Annual | Annual Shareholder Report |
| C000142876 | |
| Shareholder Report [Line Items] | |
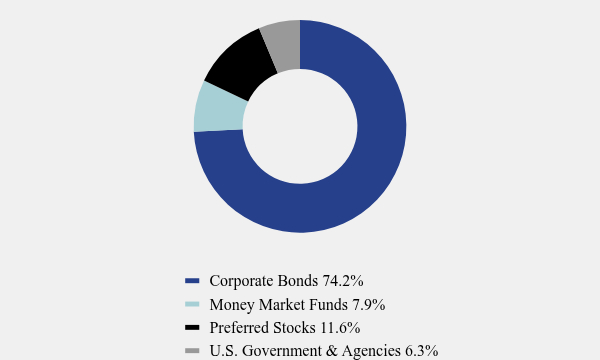
| Fund Name | North Star Bond Fund |
| Class Name | Class I |
| Trading Symbol | NSBDX |
| Annual or Semi-Annual Statement [Text Block] | This annual shareholder report contains important information about North Star Bond Fund for the period of December 1, 2024 to November 30, 2025. |
| Additional Information [Text Block] | You can find additional information about the Fund at https://nsinvest.com/mutual-funds/bond-fund/. You can also request this information by contacting us at 1-855-580-0900. |
| Additional Information Phone Number | 1-855-580-0900 |
| Additional Information Website | https://nsinvest.com/mutual-funds/bond-fund/ |
| Expenses [Text Block] | |
| Expenses Paid, Amount | $ 159 |
| Expense Ratio, Percent | 1.56% |
| Performance Past Does Not Indicate Future [Text] | The Fund's past performance is not a good predictor of how the Fund will perform in the future. |
| No Deduction of Taxes [Text Block] | The graph and table do not reflect the deduction of taxes that a shareholder would pay on fund distributions or redemption of fund shares. |
| AssetsNet | $ 35,112,737 |
| Holdings Count | Holding | 36 |
| Advisory Fees Paid, Amount | $ 287,733 |
| InvestmentCompanyPortfolioTurnover | 34.00% |
| Additional Fund Statistics [Text Block] | |
| Holdings [Text Block] | |
| Largest Holdings [Text Block] | |
| Material Fund Change [Text Block] | |
| C000125620 | |
| Shareholder Report [Line Items] | |
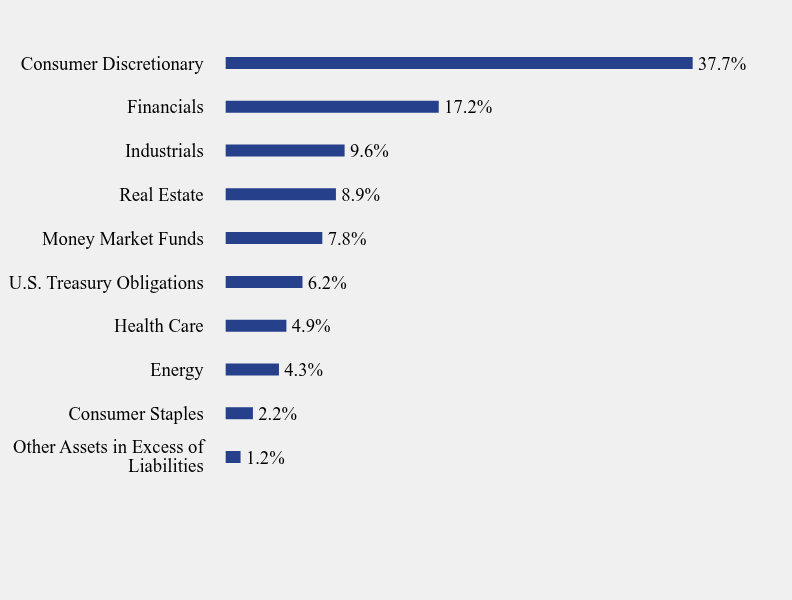
| Fund Name | North Star Dividend Fund |
| Class Name | Class I |
| Trading Symbol | NSDVX |
| Annual or Semi-Annual Statement [Text Block] | This annual shareholder report contains important information about North Star Dividend Fund for the period of December 1, 2024 to November 30, 2025. |
| Shareholder Report Annual or Semi-Annual | Annual Shareholder Report |
| Additional Information [Text Block] | You can find additional information about the Fund at https://nsinvest.com/mutual-funds/dividend-fund/. You can also request this information by contacting us at 1-855-580-0900. |
| Additional Information Phone Number | 1-855-580-0900 |
| Additional Information Website | https://nsinvest.com/mutual-funds/dividend-fund/ |
| Expenses [Text Block] | |
| Expenses Paid, Amount | $ 139 |
| Expense Ratio, Percent | 1.43% |
| Performance Past Does Not Indicate Future [Text] | The Fund's past performance is not a good predictor of how the Fund will perform in the future. |
| No Deduction of Taxes [Text Block] | The graph and table do not reflect the deduction of taxes that a shareholder would pay on fund distributions or redemption of fund shares. |
| AssetsNet | $ 83,482,549 |
| Holdings Count | Holding | 53 |
| Advisory Fees Paid, Amount | $ 864,299 |
| InvestmentCompanyPortfolioTurnover | 14.00% |
| Additional Fund Statistics [Text Block] | |
| Holdings [Text Block] | |
| Largest Holdings [Text Block] | |
| Material Fund Change [Text Block] | |
| C000125617 | |
| Shareholder Report [Line Items] | |
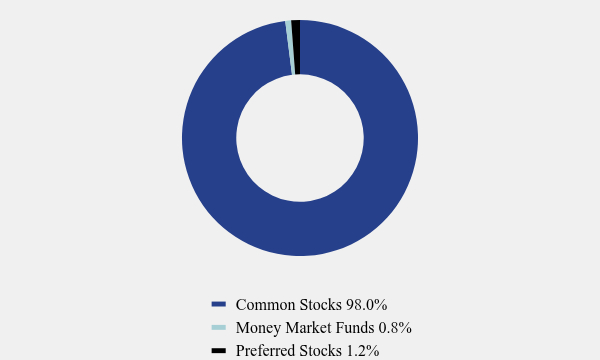
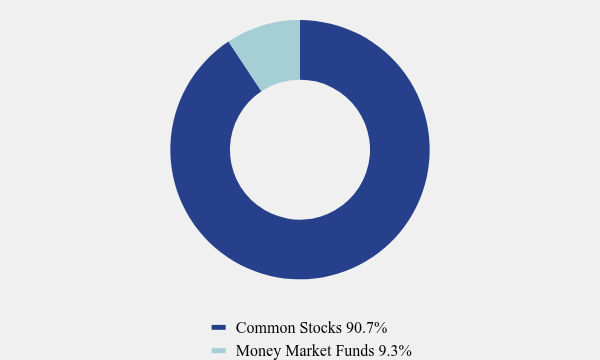
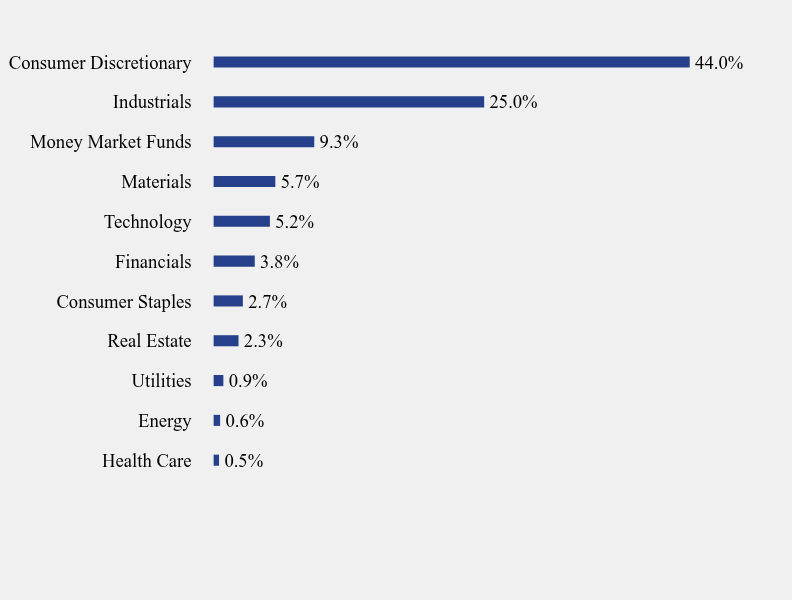
| Fund Name | North Star Micro Cap Fund |
| Class Name | Class I |
| Trading Symbol | NSMVX |
| Annual or Semi-Annual Statement [Text Block] | This annual shareholder report contains important information about North Star Micro Cap Fund for the period of December 1, 2024 to November 30, 2025. |
| Additional Information [Text Block] | You can find additional information about the Fund at https://nsinvest.com/mutual-funds/micro-cap-fund/. You can also request this information by contacting us at 1-855-580-0900. |
| Additional Information Phone Number | 1-855-580-0900 |
| Additional Information Website | https://nsinvest.com/mutual-funds/micro-cap-fund/ |
| Expenses [Text Block] | |
| Expenses Paid, Amount | $ 134 |
| Expense Ratio, Percent | 1.38% |
| Performance Past Does Not Indicate Future [Text] | The Fund's past performance is not a good predictor of how the Fund will perform in the future. |
| No Deduction of Taxes [Text Block] | The graph and table do not reflect the deduction of taxes that a shareholder would pay on fund distributions or redemption of fund shares. |
| AssetsNet | $ 110,555,244 |
| Holdings Count | Holding | 53 |
| Advisory Fees Paid, Amount | $ 1,105,000 |
| InvestmentCompanyPortfolioTurnover | 24.00% |
| Additional Fund Statistics [Text Block] | |
| Holdings [Text Block] | |
| Largest Holdings [Text Block] | |
| Material Fund Change [Text Block] | |
| C000106068 | |
| Shareholder Report [Line Items] | |
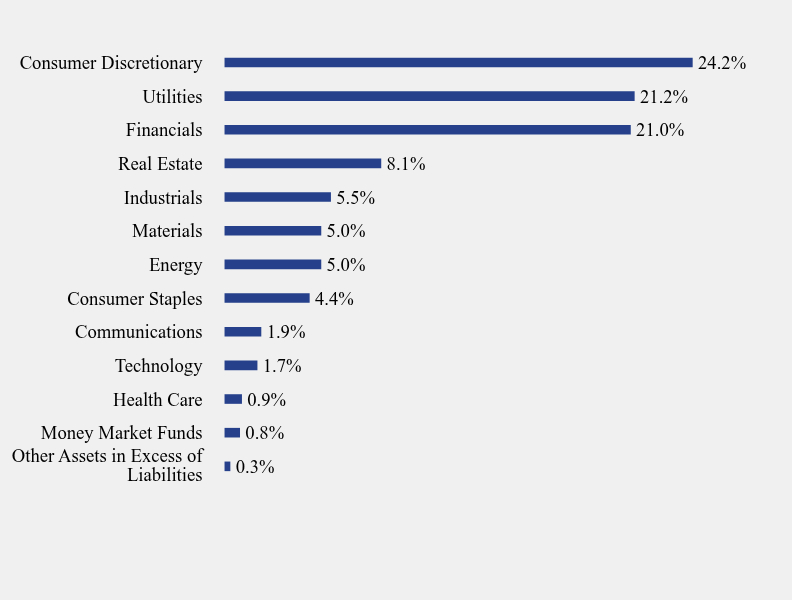
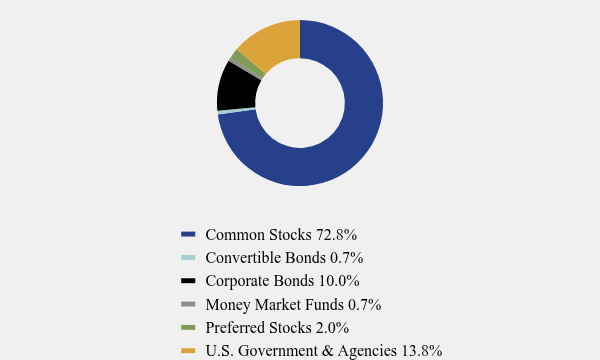
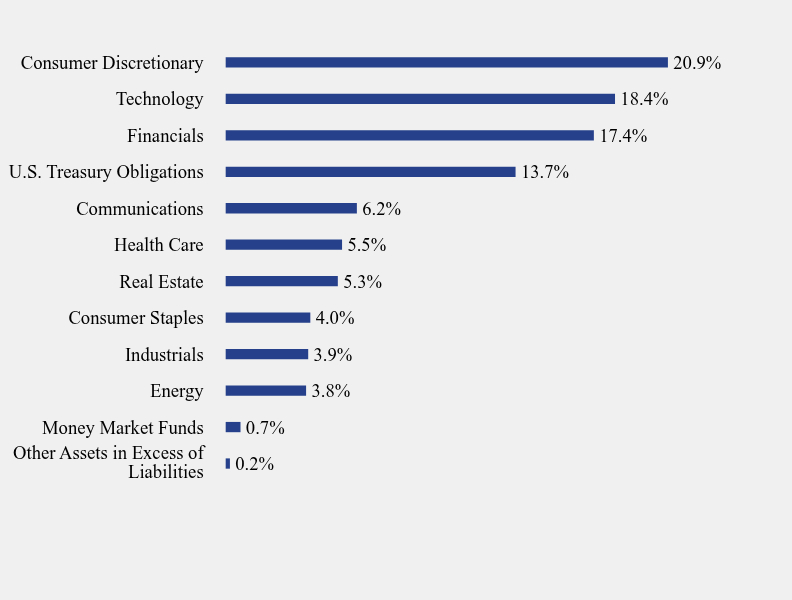
| Fund Name | North Star Opportunity Fund |
| Class Name | Class A |
| Trading Symbol | NSOPX |
| Annual or Semi-Annual Statement [Text Block] | This annual shareholder report contains important information about North Star Opportunity Fund for the period of December 1, 2024 to November 30, 2025. |
| Additional Information [Text Block] | You can find additional information about the Fund at https://nsinvest.com/mutual-funds/opportunity-fund/. You can also request this information by contacting us at 1-855-580-0900. |
| Additional Information Phone Number | 1-855-580-0900 |
| Additional Information Website | https://nsinvest.com/mutual-funds/opportunity-fund/ |
| Expenses [Text Block] | |
| Expenses Paid, Amount | $ 161 |
| Expense Ratio, Percent | 1.55% |
| Performance Past Does Not Indicate Future [Text] | The Fund's past performance is not a good predictor of how the Fund will perform in the future. |
| No Deduction of Taxes [Text Block] | The graph and table do not reflect the deduction of taxes that a shareholder would pay on fund distributions or redemption of fund shares. |
| AssetsNet | $ 137,849,917 |
| Holdings Count | Holding | 50 |
| Advisory Fees Paid, Amount | $ 1,174,239 |
| InvestmentCompanyPortfolioTurnover | 25.00% |
| Additional Fund Statistics [Text Block] | |
| Holdings [Text Block] | |
| Largest Holdings [Text Block] | |
| Material Fund Change [Text Block] | |
| C000106067 | |
| Shareholder Report [Line Items] | |
| Fund Name | North Star Opportunity Fund |
| Class Name | Class I |
| Trading Symbol | NSOIX |
| Annual or Semi-Annual Statement [Text Block] | This annual shareholder report contains important information about North Star Opportunity Fund for the period of December 1, 2024 to November 30, 2025. |
| Additional Information [Text Block] | You can find additional information about the Fund at https://nsinvest.com/mutual-funds/opportunity-fund/. You can also request this information by contacting us at 1-855-580-0900. |
| Additional Information Phone Number | 1-855-580-0900 |
| Additional Information Website | https://nsinvest.com/mutual-funds/opportunity-fund/ |
| Expenses [Text Block] | |
| Expenses Paid, Amount | $ 135 |
| Expense Ratio, Percent | 1.30% |
| Performance Past Does Not Indicate Future [Text] | The Fund's past performance is not a good predictor of how the Fund will perform in the future. |
| No Deduction of Taxes [Text Block] | The graph and table do not reflect the deduction of taxes that a shareholder would pay on fund distributions or redemption of fund shares. |
| AssetsNet | $ 137,849,917 |
| Holdings Count | Holding | 50 |
| Advisory Fees Paid, Amount | $ 1,174,239 |
| InvestmentCompanyPortfolioTurnover | 25.00% |
| Additional Fund Statistics [Text Block] | |
| Holdings [Text Block] | |
| Largest Holdings [Text Block] | |
| Material Fund Change [Text Block] | |
| C000241411 | |
| Shareholder Report [Line Items] | |
| Fund Name | North Star Small Cap Value Fund |
| Class Name | Institutional Class |
| Trading Symbol | WFICX |
| Annual or Semi-Annual Statement [Text Block] | This annual shareholder report contains important information about North Star Small Cap Value Fund for the period of December 1, 2024 to November 30, 2025. |
| Additional Information [Text Block] | You can find additional information about the Fund at https://nsinvest.com/mutual-funds/small-cap-value-fund/. You can also request this information by contacting us at 1-855-580-0900. |
| Additional Information Phone Number | 1-855-580-0900 |
| Additional Information Website | https://nsinvest.com/mutual-funds/small-cap-value-fund/ |
| Expenses [Text Block] | |
| Expenses Paid, Amount | $ 101 |
| Expense Ratio, Percent | 0.98% |
| Performance Past Does Not Indicate Future [Text] | The Fund's past performance is not a good predictor of how the Fund will perform in the future. |
| Performance Inception Date | Dec. 31, 2018 |
| No Deduction of Taxes [Text Block] | The graph and table do not reflect the deduction of taxes that a shareholder would pay on fund distributions or redemption of fund shares. |
| AssetsNet | $ 31,316,771 |
| Holdings Count | Holding | 48 |
| Advisory Fees Paid, Amount | $ 74,234 |
| InvestmentCompanyPortfolioTurnover | 23.00% |
| Additional Fund Statistics [Text Block] | |
| Holdings [Text Block] | |
| Largest Holdings [Text Block] | |
| Material Fund Change [Text Block] | |
| C000241410 | |
| Shareholder Report [Line Items] | |
| Fund Name | North Star Small Cap Value Fund |
| Class Name | Investor Class |
| Trading Symbol | WSCVX |
| Annual or Semi-Annual Statement [Text Block] | This annual shareholder report contains important information about North Star Small Cap Value Fund for the period of December 1, 2024 to November 30, 2025. |
| Additional Information [Text Block] | You can find additional information about the Fund at https://nsinvest.com/mutual-funds/small-cap-value-fund/. You can also request this information by contacting us at 1-855-580-0900. |
| Additional Information Phone Number | 1-855-580-0900 |
| Additional Information Website | https://nsinvest.com/mutual-funds/small-cap-value-fund/ |
| Expenses [Text Block] | |
| Expenses Paid, Amount | $ 124 |
| Expense Ratio, Percent | 1.21% |
| Performance Past Does Not Indicate Future [Text] | The Fund's past performance is not a good predictor of how the Fund will perform in the future. |
| No Deduction of Taxes [Text Block] | The graph and table do not reflect the deduction of taxes that a shareholder would pay on fund distributions or redemption of fund shares. |
| AssetsNet | $ 31,316,771 |
| Holdings Count | Holding | 48 |
| Advisory Fees Paid, Amount | $ 74,234 |
| InvestmentCompanyPortfolioTurnover | 23.00% |
| Additional Fund Statistics [Text Block] | |
| Holdings [Text Block] | |
| Largest Holdings [Text Block] | |
| Material Fund Change [Text Block] |