Shareholder Report
Aug. 31, 2025
USD ($)
Holding
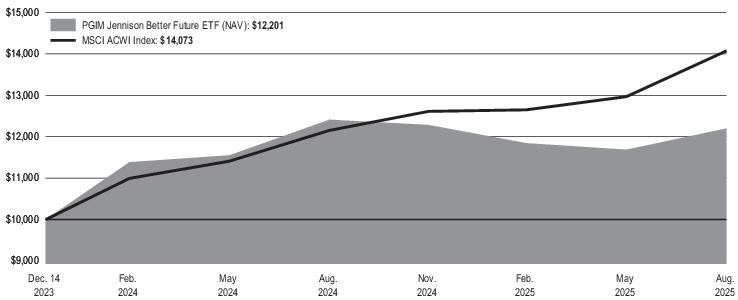
This annual shareholder report contains important information about the PGIM Jennison Better Future ETF (the “Fund”) for the period of
September 1, 2024 to August 31, 2025.
You can find additional information about the Fund at
pgim.com/investments/etfs/prospectuses-fact-sheets
. You can also request this information by contacting us at (888) 247-8090 or (973) 802-2093 from outside the US.
WHAT WERE THE FUND COSTS FOR THE LAST YEAR?
(Based on a hypothetical $10,000 investment)
Costs of a $10,000 investment |
Costs paid as a percentage of a $10,000 investment | |
PGIM Jennison Better Future ETF |
$52 |
0.52% |
WHAT AFFECTED THE FUND’S PERFORMANCE DURING THE REPORTING PERIOD?
■
Global equities, as represented by the Fund’s benchmark, the MSCI ACWI Index (the “Index”), advanced during the reporting period, with all
regions posting solid returns, albeit not without notable volatility. The period was marked by a US Federal Reserve interest rate cut; heightened
uncertainties about US tariff and trade policies; the surprise launch of China’s Deep Seek artificial intelligence model, which fueled volatility in
the technology sector; increased defense and infrastructure spending in Europe, especially Germany; and new policy initiatives in China to
address challenges stemming from weaknesses in the real estate and equity markets.
■
The Fund’s underweight exposure to consumer staples and lack of exposure to energy, materials, and real estate added the most value relative
to the Index.
■
Holdings in the consumer discretionary sector, especially in the automobiles and luxury goods industries, were the most significant detractors
from results relative to the Index. Software names drove underperformance in the information technology sector, while pharmaceuticals hurt
results in the health care sector.
Average Annual Total Returns as of 8/31/2025 | ||
One Year (%) |
Since Inception (%) | |
Net Asset Value (NAV) |
-1.71% |
12.28% (12/14/2023) |
MSCI ACWI Index |
15.79% |
21.56% |
Since Inception returns are provided for the Fund since it has less than 10 fiscal years of returns. Since Inception returns for the Index are measured from the closest month-end to
the Fund’s inception date.
The returns do not reflect the deduction of
taxes that a shareholder would pay on Fund distributions or redemption of Fund shares.
Visit
pgim.com/investments/etfs/prospectuses-fact-sheets
or call (888) 247-8090 or (973) 802-2093 from outside the US for more recent performance data.
WHAT ARE SOME
KEY
FUND STATISTICS AS OF 8/31/2025?Fund’s net assets |
$ 10,355,145 |
Number of fund holdings |
33 |
Total advisory fees paid for the year |
$ 88,190 |
Portfolio turnover rate for the year |
138% |
WHAT ARE SOME CHARACTERISTICS THE
OF
FUND’S
HOLDINGS AS
OF 8/31/2025?Industry Classification |
% of Net Assets |
Software |
16.6% |
Semiconductors & Semiconductor Equipment |
14.4% |
Broadline Retail |
13.0% |
IT Services |
7.2% |
Affiliated Mutual Fund - Short-Term Investment |
6.3% |
Pharmaceuticals |
6.1% |
Textiles, Apparel & Luxury Goods |
5.7% |
Technology Hardware, Storage & Peripherals |
5.6% |
Financial Services |
5.3% |
Health Care Equipment & Supplies |
3.7% |
Automobiles |
3.5% |
Industry Classification |
% of Net Assets |
Interactive Media & Services |
3.3% |
Personal Care Products |
2.6% |
Specialty Retail |
2.3% |
Electric Utilities |
2.2% |
Banks |
1.2% |
Capital Markets |
0.9% |
99.9% | |
Other assets in excess of liabilities |
0.1% |
100.0% |
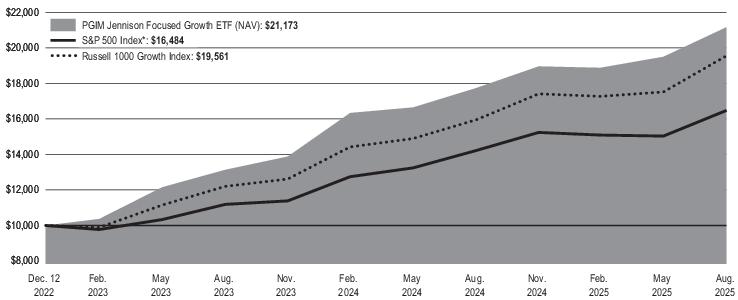
This annual shareholder report contains important information about the PGIM Jennison Focused Growth ETF (the “Fund”) for the period of
September 1, 2024 to August 31, 2025.
You can find additional information about the Fund at
pgim.com/investments/etfs/prospectuses-fact-sheets
. You can also request this information by contacting us at (888) 247-8090 or (973) 802-2093 from outside the US.
WHAT WERE THE FUND COSTS FOR THE LAST YEAR?
(Based on a hypothetical $10,000 investment)
Costs of a $10,000 investment |
Costs paid as a percentage of a $10,000 investment | |
PGIM Jennison Focused Growth ETF |
$81 |
0.74% |
WHAT AFFECTED THE FUND’S PERFORMANCE DURING THE REPORTING PERIOD?
■
US equities posted solid gains for the reporting period, though returns were marked by bouts of elevated volatility. Key influences included a US
Federal Reserve interest rate cut, the US presidential election, and uncertainty regarding the US administration’s tariff and trade policies.
■
Strong stock selection within the information technology sector, particularly in semiconductor & equipment companies, was the strongest driver
of performance relative to the Fund’s benchmark, the Russell 1000 Growth Index (the “Index”). Additional contributions came from the
interactive media industry within the communication services sector and the aerospace & defense industry within the industrials sector, both of
which also added meaningful value.
■
Conversely, the largest detractors from relative performance were positions in the health care sector, driven primarily by pharmaceuticals, and in
the consumer discretionary sector, led by broadline retail. An underweight allocation to the information technology sector, coupled with an
overweight in the health care sector, also weighed on results relative to the Index.
Average Annual Total Returns as of 8/31/2025 | ||
One Year (%) |
Since Inception (%) | |
Net Asset Value (NAV) |
19.32% |
31.75% (12/12/2022) |
S&P 500 Index* |
15.88% |
19.93% |
Russell 1000 Growth Index |
22.58% |
27.63% |
*The Fund compares its performance against this broad-based index in response to regulatory requirements.
Since Inception returns are provided for the Fund since it has less than 10 fiscal years of returns. Since Inception returns for the Indexes are measured from the closest month-end to
the Fund’s inception date.
The returns do not reflect the deduction of
taxes that a shareholder would pay on Fund distributions or redemption of Fund shares.
Visit
pgim.com/investments/etfs/prospectuses-fact-sheets
or call (888) 247-8090 or (973) 802-2093 from outside the US for more recent performance data.
WHAT ARE SOME KEY FUND STATISTICS AS OF 8/31/2025?
Fund’s net assets |
$ 121,748,546 |
Number of fund holdings |
35 |
Total advisory fees paid for the year |
$ 848,016 |
Portfolio turnover rate for the year |
37% |
WHAT
ARE
SOME CHARACTERISTICS
OF THE FUND’S HOLDINGS AS OF 8/31/2025?Industry Classification |
% of Net Assets |
Semiconductors & Semiconductor Equipment |
18.1% |
Software |
17.0% |
Interactive Media & Services |
11.1% |
Broadline Retail |
10.0% |
Entertainment |
8.1% |
Technology Hardware, Storage & Peripherals |
7.7% |
Financial Services |
5.3% |
Aerospace & Defense |
4.8% |
Consumer Staples Distribution & Retail |
3.7% |
Pharmaceuticals |
2.5% |
IT Services |
2.5% |
Automobiles |
2.1% |
Health Care Equipment & Supplies |
1.5% |
Industry Classification |
% of Net Assets |
Biotechnology |
1.5% |
Electric Utilities |
1.4% |
Ground Transportation |
0.9% |
Specialty Retail |
0.8% |
Media |
0.6% |
Affiliated Mutual Fund - Short-Term Investment |
0.4% |
100.0% | |
Liabilities in excess of other assets |
(0.0)%* |
100.0% |
* |
Less than 0.05% |
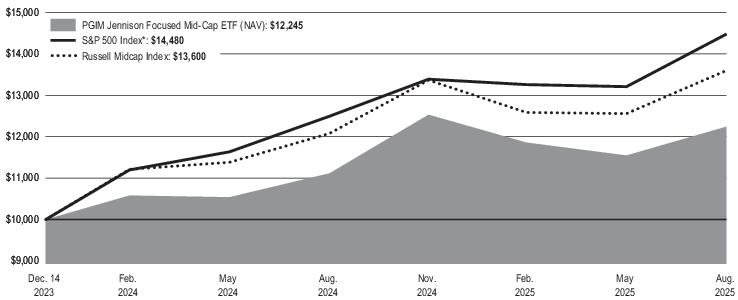
This annual shareholder report contains important information about the PGIM Jennison Focused Mid-Cap ETF (the “Fund”) for the period of
September 1, 2024 to August 31, 2025.
You can find additional information about the Fund at
pgim.com/investments/etfs/prospectuses-fact-sheets
. You can also request this information by contacting us at (888) 247-8090 or (973) 802-2093 from outside the US.
WHAT WERE THE FUND COSTS FOR THE LAST YEAR?
(Based on a hypothetical $10,000 investment)
Costs of a $10,000 investment |
Costs paid as a percentage of a $10,000 investment | |
PGIM Jennison Focused Mid-Cap ETF |
$43 |
0.41% |
WHAT AFFECTED THE FUND’S PERFORMANCE DURING THE REPORTING PERIOD?
■
Over the reporting period, equities generally advanced but experienced significant volatility. The period was marked by a US Federal Reserve
interest rate cut, a US presidential election, the surprise launch of China’s Deep Seek artificial intelligence model, and heightened uncertainties
about the US administration’s tariff and trade policies, among other developments. Mid-cap stocks, as represented by the Fund’s benchmark,
the Russell Midcap Index (the “Index”), generated solid gains but lagged the broad market, as represented by the S&P 500 Index.
■
Security selection within the materials sector (primarily metals & mining) and consumer staples sector (driven by distribution) added the most to
the Fund’s performance relative to the Index. Underweight exposure to health care also bolstered results relative to the Index.
■
Stock selection within the information technology sector (led by software), industrials sector (driven by aerospace & defense), consumer
discretionary sector (especially hotels, restaurants & leisure), and communication services sector (primarily interactive media & services) were
the primary sources of underperformance relative to the Index.
Average Annual Total Returns as of 8/31/2025 | ||
One Year (%) |
Since Inception (%) | |
Net Asset Value (NAV) |
10.14% |
12.51% (12/14/2023) |
S&P 500 Index* |
15.88% |
23.56% |
Russell Midcap Index |
12.58% |
19.21% |
*The Fund compares its performance against this broad-based index in response to regulatory requirements.
Since Inception returns are provided for the Fund since it has less than 10 fiscal years of returns. Since Inception returns for the Indexes are measured from the closest month-end to
the Fund’s inception date.
The returns do not reflect the deduction of
taxes that a shareholder would pay on Fund distributions or redemption of Fund shares.
Visit
pgim.com/investments/etfs/prospectuses-fact-sheets
or call (888) 247-8090 or (973) 802-2093 from outside the US for more recent performance data.
WHAT ARE SOME KEY FUND STATISTICS AS OF 8/31/2025?
Fund’s net assets |
$ 15,180,177 |
Number of fund holdings |
43 |
Total advisory fees paid for the year |
$ 54,701 |
Portfolio turnover rate for the year |
102% |
WHAT ARE SOME CHARACTERISTICS OF THE FUND’S HOLDINGS AS OF 8/31/2025?
Industry Classification |
% of Net Assets |
Multi-Utilities |
7.4% |
Software |
6.6% |
Insurance |
6.6% |
Textiles, Apparel & Luxury Goods |
6.6% |
Banks |
6.6% |
Trading Companies & Distributors |
6.1% |
Specialized REITs |
4.8% |
Hotels, Restaurants & Leisure |
4.7% |
Interactive Media & Services |
4.6% |
Metals & Mining |
4.3% |
Electrical Equipment |
4.1% |
Semiconductors & Semiconductor Equipment |
4.0% |
Containers & Packaging |
3.6% |
Financial Services |
3.2% |
Consumer Staples Distribution & Retail |
3.0% |
Residential REITs |
3.0% |
Health Care Providers & Services |
2.9% |
Industry Classification |
% of Net Assets |
Marine Transportation |
2.8% |
Specialty Retail |
2.5% |
Capital Markets |
2.5% |
Oil, Gas & Consumable Fuels |
2.0% |
Communications Equipment |
1.8% |
Machinery |
1.6% |
Health Care Equipment & Supplies |
1.4% |
Broadline Retail |
1.2% |
Real Estate Management & Development |
1.1% |
Affiliated Mutual Fund - Short-Term Investment |
1.0% |
100.0% | |
Liabilities in excess of other assets |
(0.0)%* |
100.0% |
* |
Less than 0.05% |
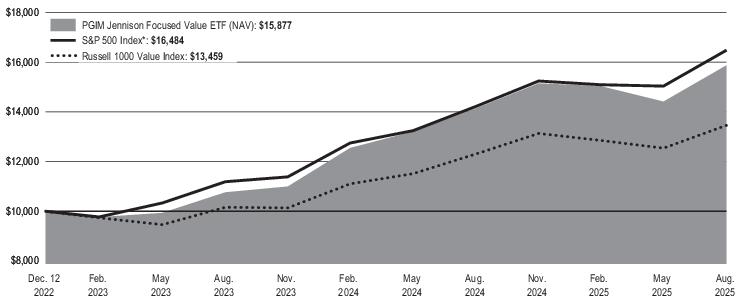
This annual shareholder report contains important information about the PGIM Jennison Focused Value ETF (the “Fund”) for the period of
September 1, 2024 to August 31, 2025.
You can find additional information about the Fund at
pgim.com/investments/etfs/prospectuses-fact-sheets
. You can also request this information by contacting us at (888) 247-8090 or (973) 802-2093 from outside the US.
WHAT WERE THE FUND COSTS FOR THE LAST YEAR?
(Based on a hypothetical $10,000 investment)
Costs of a $10,000 investment |
Costs paid as a percentage of a $10,000 investment | |
PGIM Jennison Focused Value ETF |
$72 |
0.68% |
WHAT AFFECTED THE FUND’S PERFORMANCE DURING THE REPORTING PERIOD?
■
Over the reporting period, equities generally advanced but experienced significant volatility. The period was marked by a US Federal Reserve
interest rate cut, a US presidential election, the surprise launch of China’s Deep Seek artificial intelligence model, and heightened uncertainties
about the US administration’s tariff and trade policies, among other developments. Generally speaking, growth outperformed value during
the period.
■
Positions within consumer staples sector (led by distribution), information technology sector (driven by software and semiconductors), and
industrials sector (boosted by aerospace & defense) added the most to the Fund’s performance relative to its benchmark, the Russell 1000
Value Index (the “Index”).
■
Conversely, positions within financials sector (especially banks) detracted the most from results relative to the Index.
Average Annual Total Returns as of 8/31/2025 | ||
One Year (%) |
Since Inception (%) | |
Net Asset Value (NAV) |
12.22% |
18.52% (12/12/2022) |
S&P 500 Index* |
15.88% |
19.93% |
Russell 1000 Value Index |
9.33% |
11.41% |
*The Fund compares its performance against this broad-based index in response to regulatory requirements.
Since Inception returns are provided for the Fund since it has less than 10 fiscal years of returns. Since Inception returns for the Indexes are measured from the closest month-end to
the Fund’s inception date.
The returns do not reflect the deduction of
taxes that a shareholder would pay on Fund distributions or redemption of Fund shares.
Visit
pgim.com/investments/etfs/prospectuses-fact-sheets
or call (888) 247-8090 or (973) 802-2093 from outside the US for more recent performance data.
WHAT ARE SOME KEY FUND STATISTICS AS OF 8/31/2025?
Fund’s net assets |
$ 20,110,566 |
Number of fund holdings |
36 |
Total advisory fees paid for the year |
$ 114,947 |
Portfolio turnover rate for the year |
56% |
WHAT ARE SOME CHARACTERISTICS OF THE FUND’S HOLDINGS AS OF 8/31/2025?
Industry Classification |
% of Net Assets |
Banks |
13.0% |
Oil, Gas & Consumable Fuels |
9.2% |
Aerospace & Defense |
7.7% |
Multi-Utilities |
7.1% |
Semiconductors & Semiconductor Equipment |
6.3% |
Pharmaceuticals |
5.3% |
Software |
5.2% |
Insurance |
5.1% |
Capital Markets |
4.5% |
Consumer Staples Distribution & Retail |
4.5% |
Household Durables |
4.1% |
Interactive Media & Services |
3.9% |
Industrial Conglomerates |
3.4% |
Industry Classification |
% of Net Assets |
Automobiles |
3.1% |
Ground Transportation |
3.1% |
Affiliated Mutual Fund - Short-Term Investment |
3.1% |
Chemicals |
2.9% |
Broadline Retail |
2.5% |
Biotechnology |
2.3% |
Health Care Equipment & Supplies |
2.0% |
Technology Hardware, Storage & Peripherals |
1.6% |
99.9% | |
Other assets in excess of liabilities |
0.1% |
100.0% |
This annual shareholder report contains important information about the PGIM Jennison International Opportunities ETF (the “Fund”) for the
period of September 1, 2024 to August 31, 2025.
You can find additional information about the Fund at
pgim.com/investments/etfs/prospectuses-fact-sheets
. You can also request this information by contacting us at (888) 247-8090 or (973) 802-2093 from outside the US.
WHAT WERE THE FUND COSTS FOR THE LAST YEAR?
(Based on a hypothetical $10,000
investment
)Costs of a $10,000 investment |
Costs paid as a percentage of a $10,000 investment | |
PGIM Jennison International Opportunities ETF |
$83 |
0.80% |
WHAT AFFECTED THE FUND’S PERFORMANCE DURING THE REPORTING PERIOD?
■
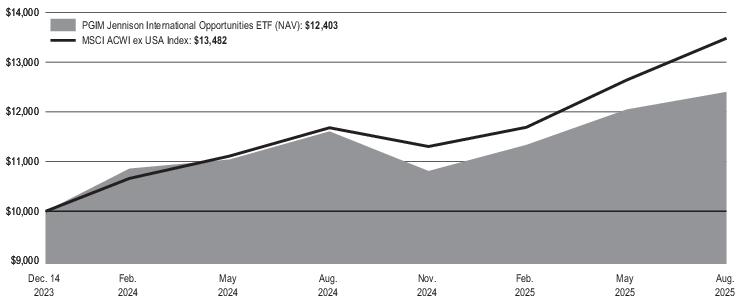
International equities, as represented by the Fund’s benchmark, the MSCI ACWI ex USA Index (the “Index”), advanced during the reporting
period, with all regions posting positive results, while modestly lagging US equities, as represented by the S&P 500 Index. Macro themes
influencing international markets included heightened uncertainties about new US tariff and trade policies; the surprise launch of China’s Deep
Seek artificial intelligence model, which fueled volatility in the technology sector; increased defense and infrastructure spending in Europe,
especially Germany; and new policy initiatives in China to address challenges stemming from weaknesses in the real estate and
equity markets.
■
The Fund’s security selection within the industrials sector, especially aerospace & defense, added the most value relative to the Index.
Entertainment holdings drove outperformance in the communication services sector. Lack of exposure to the energy and materials sectors also
bolstered performance relative to the Index.
■
Conversely, consumer discretionary sector positions were the most significant detractors from returns relative to the Index, as retail and
automobile holdings underperformed. Banks drove underperformance in the financials sector, while software weighed on results in the
information technology sector.
Average Annual Total Returns as of 8/31/2025 | ||
One Year (%) |
Since Inception (%) | |
Net Asset Value (NAV) |
6.85% |
13.35% (12/14/2023) |
MSCI ACWI ex USA Index |
15.42% |
18.62% |
Since Inception returns are provided for the Fund since it
has
less than 10 fiscal years of returns. Since Inception returns for the Index are measured from the closest month-end to the Fund’s inception date.
The returns do not reflect the deduction of
taxes that a shareholder would pay on Fund distributions or redemption of Fund shares.
Visit or call (888) 247-8090 or (973) 802-2093 from outside the US for more recent performance data.
pgim.com/investments/etfs/prospectuses-fact-sheets
WHAT ARE SOME KEY FUND STATISTICS AS OF 8/31/2025?
Fund’s net assets |
$ 27,227,772 |
Number of fund holdings |
34 |
Total advisory fees paid for the year |
$ 117,883 |
Portfolio turnover rate for the year |
89% |
WHAT ARE SOME CHARACTERISTICS OF THE
FUND’S
HOLDINGS AS OF 8/31/2025?Industry Classification |
% of Net Assets |
Aerospace & Defense |
10.7% |
Software |
10.2% |
Broadline Retail |
10.1% |
Entertainment |
7.8% |
Textiles, Apparel & Luxury Goods |
7.8% |
Semiconductors & Semiconductor Equipment |
6.3% |
Hotels, Restaurants & Leisure |
5.9% |
Pharmaceuticals |
5.4% |
Automobiles |
4.9% |
IT Services |
4.7% |
Affiliated Mutual Fund - Short-Term Investment |
4.2% |
Electrical Equipment |
3.3% |
Technology Hardware, Storage & Peripherals |
3.2% |
Personal Care Products |
2.9% |
Industry Classification |
% of Net Assets |
Biotechnology |
2.5% |
Specialty Retail |
2.2% |
Banks |
2.2% |
Financial Services |
1.8% |
Health Care Equipment & Supplies |
1.4% |
Life Sciences Tools & Services |
1.4% |
Electronic Equipment, Instruments & Components |
1.1% |
100.0% | |
Other assets in excess of liabilities |
0.0%* |
100.0% |
* |
Less than 0.05% |
This annual shareholder report contains important information about the PGIM Portfolio Ballast ETF (the “Fund”) for the period of September 1,
2024 to August 31, 2025.
You can find additional information about the Fund at
pgim.com/investments/etfs/prospectuses-fact-sheets
. You can
also request this information by contacting us at (888) 247-8090 or (973) 802-2093 from outside the US
WHAT WERE THE FUND COSTS FOR THE LAST YEAR?
(Based on a hypothetical $10,000 investment)
Costs of a $10,000 investment |
Costs paid as a percentage of a $10,000 investment | |
PGIM Portfolio Ballast ETF |
$45 |
0.43% |
WHAT AFFECTED THE FUND’S PERFORMANCE DURING THE REPORTING PERIOD?
■
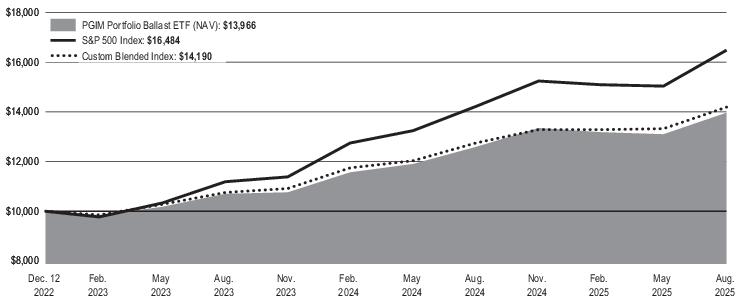
US equities performed strongly during the reporting period, with the S&P 500 Index up over 18%. US bonds also gained, with the Bloomberg
Intermediate Government Index up over 4%. Implied volatility peaked at 52.3 on April 8, 2025, but finished the reporting period nearly
unchanged, with the CBOE Volatility Index closing out the period at 15.4 versus 15.6 at the beginning of the period.
■
The Fund benefited from equity market appreciation as average equity exposure during the period was 65%, slightly higher than the
baseline 60%.
■
Fixed income exposure also added value during the period, as bonds appreciated.
■
As expected, option time decay, which is the reduction in the value of an option as the time to the expiration date approaches, was a drag on
performance. Overall, the Fund performed as expected during the period, providing 60% participation in the S&P 500 Index.
■
The Fund invests primarily in FLEX long-term call options on the SPDR
®
S&P 500 ETF (SPY) and other exchange-traded funds (“ETFs”)
designed to track the S&P 500 to implement equity exposure and provide market participation. Additionally, the Fund invests in US Treasuries
and cash for managing targeted duration to help reduce equity downside, and at times uses S&P 500 index futures and US Treasury futures to
manage exposures to those asset classes. These exposures had a positive impact on the Fund’s performance during the period.
Average Annual Total Returns as of 8/31/2025 | ||
One Year (%) |
Since Inception (%) | |
Net Asset Value (NAV) |
10.90% |
13.06% (12/12/2022) |
S&P 500 Index |
15.88% |
19.93% |
Custom Blended Index |
11.28% |
13.57% |
Since Inception returns are provided for the Fund since it has less than 10 fiscal years of returns. Since Inception returns for the Indexes are measured from the closest month-end to
the Fund’s inception date.
The returns do not reflect the deduction of
taxes that a shareholder would pay on Fund distributions or redemption of Fund shares.
Visit
pgim.com/investments/etfs/prospectuses-fact-sheets
or call (888) 247-8090 or (973) 802-2093 from outside the US for more recent performance data.
WHAT ARE SOME KEY FUND STATISTICS AS OF 8/31/2025?
Fund’s net assets |
$ 68,988,242 |
Number of fund holdings |
13 |
Total advisory fees paid for the year |
$ 231,213 |
Portfolio turnover rate for the year |
20% |
WHAT ARE SOME CHARACTERISTICS OF THE FUND’S HOLDINGS AS OF 8/31/2025?
Investment Allocation |
% of Net Assets |
U.S. Treasury Obligations |
65.3% |
Options Purchased |
23.3% |
Affiliated Mutual Fund - Short-Term Investment |
7.9% |
Unaffiliated Exchange-Traded Funds - Domestic Equity |
5.7% |
102.2% | |
Liabilities in excess of other assets |
(2.2)% |
100.0% |
This annual shareholder report contains important information about the PGIM AAA CLO ETF (the “Fund”) for the period of September 1, 2024 to
August 31, 2025.
You can find additional information about the Fund at
pgim.com/investments/etfs/prospectuses-fact-sheets
. You can also
request this information by contacting us at (888) 247-8090 or (973) 802-2093 from outside the US.
WHAT WERE THE FUND COSTS FOR THE LAST YEAR?
(Based on a hypothetical $10,000 investment)
Costs of a $10,000 investment |
Costs paid as a percentage of a $10,000 investment | |
PGIM AAA CLO ETF |
$20 |
0.19% |
WHAT AFFECTED THE FUND’S PERFORMANCE DURING THE REPORTING PERIOD?
■
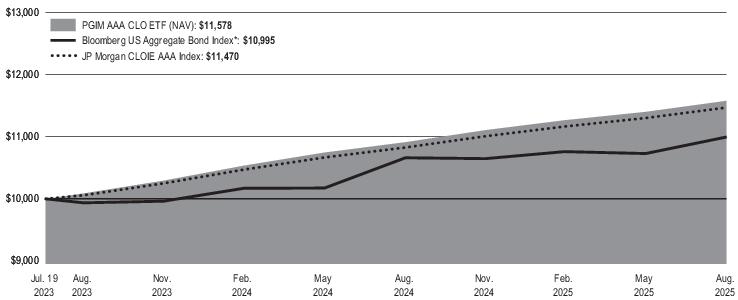
Collateralized loan obligation (CLO) AAA spreads rallied approximately 11 basis points (bps) over the 12-month period ending August 31, 2025.
The spread-tightening environment was driven by robust demand for the asset class despite elevated supply throughout the period. The Fund
outperformed its benchmark, the JP Morgan CLOIE AAA Index (the “Index”), by 35 bps over the period.
■
The following strategies contributed most to the Fund’s performance during the period: The portfolio was positioned longer in spread duration
relative to the Index, and as such, benefited from additional price appreciation, as longer spread-duration assets outperformed the shorter end
of the term curve. The portfolio’s rating composition largely matched the Index throughout the period.
■
The following strategies detracted from the Fund’s performance during the period: The Fund received approximately $3.7 billion in net flows
over the period, causing some marginal cash drag. However, the team was largely able to stay invested, with an average CLO balance of
approximately 98.5%.
Average Annual Total Returns as of 8/31/2025 | ||
One Year (%) |
Since Inception (%) | |
Net Asset Value (NAV) |
6.10% |
7.15% (7/19/2023) |
Bloomberg US Aggregate Bond Index* |
3.14% |
4.66% |
JP Morgan CLOIE AAA Index |
5.94% |
6.80% |
*The Fund compares its performance against this broad-based index in response to regulatory requirements.
Since Inception returns are provided for the Fund
since
it has less than 10 fiscal years of returns. Since Inception returns for the Indexes are measured from the closest month-end to the Fund’s inception date.
The returns do not reflect the deduction of
taxes that a shareholder would pay on Fund distributions or redemption of Fund shares.
Visit
pgim.com/investments/etfs/prospectuses-fact-sheets
or call (888) 247-8090 or (973) 802-2093 from outside the US for more recent performance data.
WHAT ARE SOME KEY FUND STATISTICS AS OF 8/31/2025?
Fund’s net assets |
$ 4,233,291,809 |
Number of fund holdings |
327 |
Total advisory fees paid for the year |
$ 4,555,310 |
Portfolio turnover rate for the year |
68% |
WHAT ARE SOME CHARACTERISTICS OF THE FUND’S HOLDINGS AS OF 8/31/2025?
Credit Quality expressed as a percentage of total investments as of 8/31/2025 (%) | |
AAA |
98.8 |
Cash/Cash Equivalents |
1.2 |
Total |
100.0 |
Credit ratings reflect the highest rating assigned by a nationally recognized statistical rating organization (NRSRO) such as Moody’s Investors Service, Inc. (Moody’s), S&P Global
Ratings (S&P), or Fitch Ratings, Inc. (Fitch). Credit ratings reflect the common nomenclature used by both S&P and Fitch. Where applicable, ratings are converted to the comparable
S&P/Fitch rating tier nomenclature. The Not Rated category consists of securities that have not been rated by an NRSRO. Credit ratings are subject to change. Values may not sum to
100.0% due to rounding.
This annual shareholder report contains important information about the PGIM Active Aggregate Bond ETF (the “Fund”) for the period of
September 1, 2024 to August 31, 2025.
You can find additional information about the Fund at
pgim.com/investments/etfs/prospectuses-fact-sheets
.
You can also request this information by contacting us at (888) 247-8090 or (973) 802-2093 from outside the US.WHAT WERE THE FUND COSTS FOR THE LAST YEAR?
(Based on a hypothetical $10,000 investment)
Costs of a $10,000 investment |
Costs paid as a percentage of a $10,000 investment | |
PGIM Active Aggregate Bond ETF |
$16 |
0.16% |
WHAT AFFECTED THE FUND’S PERFORMANCE DURING THE REPORTING PERIOD?
■
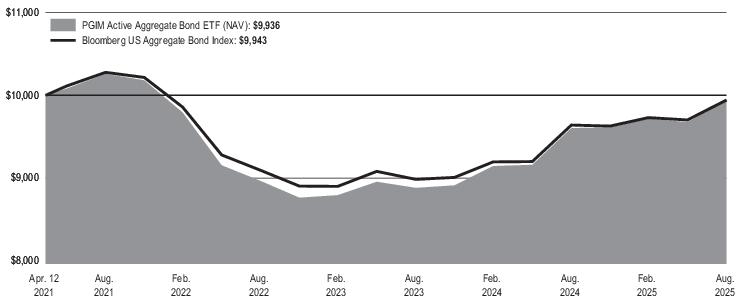
During the reporting period, credit spreads across a broad spectrum of fixed income asset classes generally tightened, recovering from the
reciprocal tariffs introduced on April 2, 2025. The US Federal Reserve's easing cycle, which began with three rate cuts in the second half of
2024, was paused in the first half of 2025 amid increased uncertainty over the impact of US policy changes on the domestic labor market and
inflation. Indeed, Core PCE, a key inflation metric that tracks price changes (excluding volatile food and energy prices), came in higher than
expected for the reporting period. In addition, revisions to the nonfarm payroll report at the end of the period revealed a weaker labor market
than previously indicated, causing investors to reprice their expectations for a September rate cut and a steepening of the US Treasury
yield curve.
■
The following strategies contributed most to the Fund’s performance relative to the Bloomberg US Aggregate Bond Index (the “Index”) during
the period: positioning in AAA non-agency commercial mortgage-backed securities (CMBS) and AAA collateralized loan obligations (CLO);
overweights to the US investment-grade corporate, emerging-market investment grade, and asset-backed securities (ABS) sectors, along with
an underweight to the mortgage-backed securities (MBS) sector; yield curve positioning; security selection in US Treasuries, and ABS; and
credit positioning in REITs.
■
The Fund’s duration positioning detracted most from the Fund’s performance relative to the Index during the period.
■
The Fund uses derivatives to facilitate the implementation of the overall investment approach. During the reporting period, the Fund used
swaps and futures to help manage duration positioning and yield curve exposure. In aggregate, these positions detracted from performance.
Average Annual Total Returns as of 8/31/2025 | ||
One Year (%) |
Since Inception (%) | |
Net Asset Value (NAV) |
3.45% |
-0.15% (4/12/2021) |
Bloomberg US Aggregate Bond Index |
3.14% |
-0.13% |
Since Inception returns are provided for the Fund since it has less than 10 fiscal years of
returns
. Since Inception returns for the Index are measured from the closest month-end to the Fund’s inception date.
The returns do not reflect the deduction of
taxes that a shareholder would pay on Fund distributions or redemption of Fund shares.
Visit
pgim.com/investments/etfs/prospectuses-fact-sheets
or call (888) 247-8090 or (973) 802-2093 from outside the US for more recent performance data.
WHAT ARE SOME KEY FUND STATISTICS AS OF 8/31/2025?
Fund’s net assets |
$ 84,110,813 |
Number of fund holdings |
470 |
Total advisory fees paid for the year |
$ 100,469 |
Portfolio turnover rate for the year |
134% |
WHAT ARE SOME CHARACTERISTICS OF THE FUND’S HOLDINGS AS OF 8/31/2025?
Credit Quality expressed as a percentage of total investments as of 8/31/2025 (%) | |
AAA |
35.6 |
AA |
37.3 |
A |
9.3 |
BBB |
13.2 |
BB |
0.1 |
Not Rated |
5.0 |
Cash/Cash Equivalents |
(0.4) |
Total |
100.0 |
Credit ratings reflect the highest rating assigned by a nationally recognized statistical rating organization (NRSRO) such as Moody’s Investors Service, Inc. (Moody’s), S&P Global
Ratings (S&P), or Fitch Ratings, Inc. (Fitch). Credit ratings reflect the common nomenclature used by both S&P and Fitch. Where applicable, ratings are converted to the comparable
S&P/Fitch rating tier nomenclature. The Not Rated category consists of securities that have not been rated by an NRSRO. Credit ratings are subject to change. Values may not sum to
100.0% due to rounding.
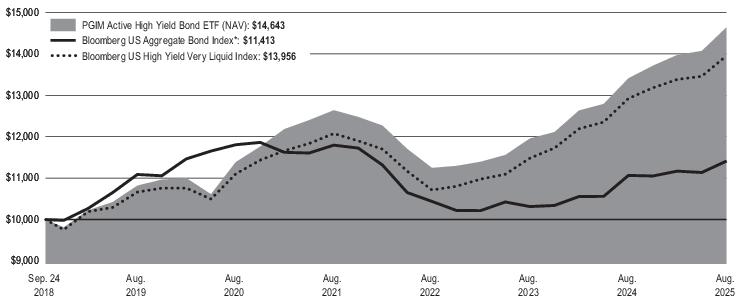
This annual shareholder report contains important information about the PGIM Active High Yield Bond ETF (the “Fund”) for the period of
September 1, 2024 to August 31, 2025
.
You can find additional information about the Fund at
pgim.com/investments/etfs/prospectuses-fact-sheets
. You can also request this information by contacting us at (888) 247-8090 or (973) 802-2093 from outside the US.
WHAT WERE THE FUND COSTS FOR THE LAST YEAR?
(Based on a hypothetical $10,000 investment)
Costs of a $10,000 investment |
Costs paid as a percentage of a $10,000 investment | |
PGIM Active High Yield Bond ETF |
$39 |
0.37% |
WHAT AFFECTED THE FUND’S
PERF
ORMANCE DURING THE REPORTING PERIOD?■
US high yield bonds posted gains over the reporting period, as overall solid corporate earnings and resilient market technicals held firm against
a challenging environment marked by the 2024 US election cycle, geopolitical tensions on multiple fronts, a broad-based increase in US tariffs,
and elevated inflation. In addition, despite macro uncertainty and tight financial conditions, the high yield market continued to grow in 2025.
■
The following strategies contributed the most to the Fund’s performance relative to the Bloomberg US High Yield Very Liquid Index (the “Index”)
during the period: security selection in cable & satellite, health care & pharmaceuticals, and retailers & restaurants industries; industry
underweights to midstream energy and cable & satellite, along with an industry overweight to telecom; an underweight to the US high yield
corporate sector and overweights to the AAA collateralized loan obligation and emerging-market high yield sectors.
■
The following strategies detracted the most from the Fund’s performance relative to the Index during the period: security selection in consumer
non-cyclicals, chemicals, and building materials & home construction industries; industry underweights to media & entertainment and consumer
non-cyclicals, and an industry overweight to health care & pharmaceuticals.
■
The Fund uses derivatives to facilitate the implementation of the overall investment approach. During the reporting period, the Fund used
swaps, forwards, and futures to help manage duration positioning and yield curve exposure. In aggregate, these positions contributed
to performance.
Average Annual Total Returns as of 8/31/2025 | |||
One Year (%) |
Five Years (%) |
Since Inception (%) | |
Net Asset Value (NAV) |
9.18% |
5.16% |
5.65% (9/24/2018) |
Bloomberg US Aggregate Bond Index* |
3.14% |
-0.68% |
1.93% |
Bloomberg US High Yield Very Liquid Index |
7.98% |
4.68% |
4.94% |
*The Fund compares its performance against this broad-based index in response to regulatory requirements.
Since Inception returns are provided for the Fund since it has less than 10 fiscal years of returns. Since Inception returns for the Indexes are measured from the closest month-end to
the Fund’s inception date.
The returns do not reflect the deduction of
taxes that a shareholder would pay on Fund distributions or redemption of Fund shares.
Visit
pgim.com/investments/etfs/prospectuses-fact-sheets
or call (888) 247-8090 or (973) 802-2093 from outside the US for more recent performance data.
WHAT ARE SOME KEY FUND STATISTICS AS OF 8/31/2025?
Fund’s net assets |
$ 422,217,137 |
Number of fund holdings |
746 |
Total advisory fees paid for the year |
$ 913,409 |
Portfolio turnover rate for the year |
56% |
WHAT ARE SOME
CHARACTERISTICS
OF THE FUND’S HOLDINGS AS OF 8/31/2025?Credit Quality expressed as a percentage of total investments as of 8/31/2025 (%) | |
AAA |
4.8 |
A |
0.1 |
BBB |
5.9 |
BB |
50.4 |
B |
24.3 |
CCC |
10.3 |
Not Rated |
4.0 |
Cash/Cash Equivalents |
0.3 |
Total |
100.0 |
Credit ratings reflect the highest rating assigned by a nationally recognized statistical rating organization (NRSRO)
such
as Moody’s Investors Service, Inc. (Moody’s), S&P Global Ratings (S&P), or Fitch Ratings, Inc. (Fitch). Credit ratings reflect the common nomenclature used by both S&P and Fitch. Where applicable, ratings are converted to the comparable
S&P/Fitch rating tier nomenclature. The Not Rated category consists of securities that have not been rated by an NRSRO. Credit ratings are subject to change. Values may not sum to
100.0% due to rounding.
This annual shareholder report contains important information about the PGIM Corporate Bond 0-5 Year ETF (the “Fund”) for the period of
July 29, 2025 to August 31, 2025.
You can find additional information about the Fund at
pgim.com/investments/etfs/prospectuses-fact-sheets
.
You can also request this information by contacting us at (888) 247-8090 or (973) 802-2093 from outside the US.
WHAT WERE THE FUND COSTS FOR THE LAST YEAR?
(Based on a hypothetical $10,000 investment)
Costs of a $10,000 investment |
Costs paid as a percentage of a $10,000 investment | |
PGIM Corporate Bond 0-5 Year ETF |
$2 |
0.20% |
This report covers a period less than full fiscal year. Expenses for a full
fiscal
year would be higher than the figures shown.WHAT AFFECTED THE FUND’S PERFORMANCE DURING THE REPORTING PERIOD?
■
In August, the US economy showed signs of strain as job growth slowed and unemployment rate rose to 4.2%. Inflation pressures persisted,
partly driven by reciprocal tariffs effective August 1st and newly implemented duties, while consumer spending remained strong. Fed Chair
Jerome Powell indicated the FOMC’s openness to a possible rate cut at the September meeting, citing sufficiently restrictive monetary policy
and a shift in the balance of risks toward employment as key factors supporting a cut. This fueled gains across most equity indexes. On an
excess return basis, the long end of the IG curve performed in line with the short end of the curve.
■
Positioning in investment grade corporates; and security selection in automotive, gaming/lodging/leisure, and cable & satellite contributed the
most to the Fund's performance relative to the Bloomberg US Corporate 0-5 Year Index (the “Index”) during the period.
■
Security selection in chemicals; an overweight in midstream energy and an underweight in banking detracted from the Fund's performance
relative to the Index during the period.
■
The Fund uses derivatives to facilitate the implementation of the overall investment approach. During the reporting period, the Fund used
financial futures to help manage duration positioning and yield curve exposure. These positions detracted slightly from performance.

Total Returns as of 8/31/2025 | |
Since Inception (%) | |
Net Asset Value (NAV) |
0.96% (7/29/2025) |
Bloomberg US Aggregate Bond Index* |
1.20% |
Bloomberg US Corporate 0-5 Year Index |
0.97% |
*The Fund compares its performance against this broad-based index in response to regulatory requirements.
Since Inception returns are provided for the Fund since it has less than 10 fiscal years of returns. Since Inception returns for the Indexes are measured from the closest month-end to
the Fund’s inception date.
The returns do not reflect the deduction of
taxes that a shareholder would pay on Fund distributions or redemption of Fund shares.
Visit
pgim.com/investments/etfs/prospectuses-fact-sheets
or call (888) 247-8090 or (973) 802-2093 from outside the US for more recent performance data.
WHAT ARE SOME KEY FUND STATISTICS AS OF 8/31/2025?
Fund’s net assets |
$ 142,591,903 |
Number of fund holdings |
209 |
Total advisory fees paid for the year |
$ 23,819 |
Portfolio turnover rate for the year |
14% |
WHAT ARE SOME CHARACTERISTICS OF THE FUND’S HOLDINGS AS OF 8/31/2025?
Credit Quality expressed as a percentage of total investments as of 8/31/2025 (%) | |
AAA |
0.3 |
AA |
13.3 |
A |
34.8 |
BBB |
49.9 |
Cash/Cash Equivalents |
1.6 |
Total |
100.0 |
Credit ratings reflect the highest rating assigned by a nationally recognized statistical rating organization (NRSRO) such as Moody’s Investors Service, Inc. (Moody’s), S&P Global
Ratings (S&P), or Fitch Ratings, Inc. (Fitch). Credit ratings reflect the common nomenclature used by both S&P and Fitch. Where applicable, ratings are converted to the comparable
S&P/Fitch rating tier nomenclature. The Not Rated category consists of securities that have not been rated by an NRSRO. Credit ratings are subject to change. Values may not sum to
100.0% due to rounding.
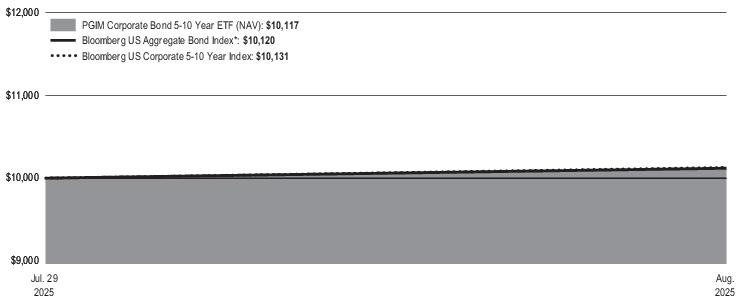
This annual shareholder report contains important information about the PGIM Corporate Bond 5-10 Year ETF (the “Fund”) for the period of
July 29, 2025 to August 31, 2025.
You can find additional information about the Fund at
pgim.com/investments/etfs/prospectuses-fact-sheets
.
You can also request this information by contacting us at (888) 247-8090 or (973) 802-2093 from outside the US.
WHAT WERE THE FUND COSTS FOR THE LAST YEAR?
(Based on a hypothetical $10,000 investment)
Costs of a $10,000 investment |
Costs paid as a percentage of a $10,000 investment | |
PGIM Corporate Bond 5-10 Year ETF |
$2 |
0.25% |
This report covers a period less than full fiscal year. Expenses for a full fiscal year would be higher than the figures shown.
WHAT AFFECTED THE FUND’S PERFORMANCE DURING THE REPORTING PERIOD?
■
In August, the US economy showed signs of strain as job growth slowed and unemployment rate rose to 4.2%. Inflation pressures persisted,
partly driven by reciprocal tariffs effective August 1st and newly implemented duties, while consumer spending remained strong. Fed Chair
Jerome Powell indicated the FOMC’s openness to a possible rate cut at the September meeting, citing sufficiently restrictive monetary policy
and a shift in the balance of risks toward employment as key factors supporting a cut. This fueled gains across most equity indexes. On an
excess return basis, the long end of the IG curve performed in line with the short end of the curve.
■
Underweights in technology, retailers & restaurants, and capital goods contributed to the Fund's performance relative to the Bloomberg US
Corporate 5-10 Year Index (the “Index”) during the period.
■
Positioning in investment grade corporates; security selection in upstream energy; and overweights in midstream energy and REITS detracted
the most from the Fund's performance relative to the Index during the period.
■
The Fund uses derivatives to facilitate the implementation of the overall investment approach. During the reporting period, the Fund used
financial futures to help manage duration positioning and yield curve exposure. These positions contributed to performance.
Total Returns as of 8/31/2025 | |
Since Inception (%) | |
Net Asset Value (NAV) |
1.17% (7/29/2025) |
Bloomberg US Aggregate Bond Index* |
1.20% |
Bloomberg US Corporate 5-10 Year Index |
1.31% |
*The Fund compares its performance against this broad-based index in response to regulatory requirements.
Since Inception returns are provided for the Fund since it has less than 10 fiscal years of returns. Since Inception returns for the Indexes are measured from the closest month-end to
the Fund’s inception date.
The returns do not reflect the deduction of
taxes that a shareholder would pay on Fund distributions or redemption of Fund shares.
Visit
pgim.com/investments/etfs/prospectuses-fact-sheets
or call (888) 247-8090 or (973) 802-2093 from outside the US for more recent performance data.
WHAT ARE SOME KEY FUND STATISTICS AS OF 8/31/2025?
Fund’s net assets |
$ 146,675,925 |
Number of fund holdings |
196 |
Total advisory fees paid for the year |
$ 30,616 |
Portfolio turnover rate for the year |
10% |
WHAT ARE SOME CHARACTERISTICS OF THE FUND’S HOLDINGS AS OF 8/31/2025?
Credit Quality expressed as a percentage of total investments as of 8/31/2025 (%) | |
AAA |
0.2 |
AA |
13.3 |
A |
40.3 |
BBB |
43.9 |
Cash/Cash Equivalents |
2.2 |
Total |
100.0 |
Credit ratings reflect the highest rating assigned by a nationally recognized statistical rating organization (NRSRO) such as Moody’s Investors Service, Inc. (Moody’s), S&P Global
Ratings (S&P), or Fitch Ratings, Inc. (Fitch). Credit ratings reflect the common nomenclature used by both S&P and Fitch. Where applicable, ratings are converted to the comparable
S&P/Fitch rating tier nomenclature. The Not Rated category consists of securities that have not been rated by an NRSRO. Credit ratings are subject to change. Values may not sum to
100.0% due to rounding.
This annual shareholder report contains important information about the PGIM Corporate Bond 10+ Year ETF (the “Fund”) for the period of
July 29, 2025 to August 31, 2025.
You can find additional information about the Fund at
pgim.com/investments/etfs/prospectuses-fact-sheets
.
You can also request this information by contacting us at (888) 247-8090 or (973) 802-2093 from outside the US.
WHAT WERE THE FUND COSTS FOR THE LAST YEAR?
(Based on a hypothetical $10,000 investment)
Costs of a $10,000 investment |
Costs paid as a percentage of a $10,000 investment | |
PGIM Corporate Bond 10+ Year ETF |
$2 |
0.25% |
This report covers a period less than full fiscal year. Expenses for a full fiscal year would be higher than the figures shown.
WHAT AFF
EC
TED THE FUND’S PERFORMANCE DURING THE REPORTING PERIOD?■
In August, the US economy showed signs of strain as job growth slowed and unemployment rate rose to 4.2%. Inflation pressures persisted,
partly driven by reciprocal tariffs effective August 1st and newly implemented duties, while consumer spending remained strong. Fed Chair
Jerome Powell indicated the FOMC’s openness to a possible rate cut at the September meeting, citing sufficiently restrictive monetary policy
and a shift in the balance of risks toward employment as key factors supporting a cut. This fueled gains across most equity indexes. On an
excess return basis, the long end of the IG curve performed in line with the short end of the curve.
■
The following strategies contributed most to the Fund’s performance relative to the Bloomberg US Corporate 10+ Year Index (the “Index”)
during the period: positioning in investment grade corporates; and security selection in electric utilities, retailers & restaurants, and property
& casualty.
■
The following strategies detracted performance relative to the Index during the period: security selection in banking and revenue health care
municipals; and an overweight in midstream energy.
■
The Fund uses derivatives to facilitate the implementation of the overall investment approach. During the reporting period, the Fund used
financial futures to help manage duration positioning and yield curve exposure. These positions detracted from performance.

Total Returns as of 8/31/2025 | |
Since Inception (%) | |
Net Asset Value (NAV) |
0.44% (7/29/2025) |
Bloomberg US Aggregate Bond Index* |
1.20% |
Bloomberg US Corporate 10+ Year Index |
0.67% |
*The Fund compares its performance against this broad-based index in response to regulatory requirements.
Since Inception returns are provided for the Fund since it has less than 10 fiscal years of returns. Since Inception returns for the Indexes are measured from the closest month-end to
the Fund’s inception date.
The returns do not reflect the deduction of
taxes that a shareholder would pay on Fund distributions or redemption of Fund shares.
Visit
pgim.com/investments/etfs/prospectuses-fact-sheets
or call (888) 247-8090 or (973) 802-2093 from outside the US for more recent performance data.
WHAT ARE SOME KEY FUND STATISTICS AS OF 8/31/2025?
Fund’s net assets |
$ 75,317,927 |
Number of fund holdings |
139 |
Total advisory fees paid for the year |
$ 16,369 |
Portfolio turnover rate for the year |
17% |
WHAT ARE SOME CHARACTERISTICS OF THE FUND’S HOLDINGS AS OF 8/31/2025?
Credit Quality expressed as a percentage of total investments as of 8/31/2025 (%) | |
AAA |
7.1 |
AA |
20.7 |
A |
34.9 |
BBB |
36.3 |
Cash/Cash Equivalents |
1.0 |
Total |
100.0 |
Credit ratings reflect the highest rating assigned by a nationally recognized statistical rating organization (NRSRO) such as Moody’s Investors Service, Inc. (Moody’s), S&P Global
Ratings (S&P), or Fitch Ratings, Inc. (Fitch). Credit ratings reflect the common nomenclature used by both S&P and Fitch. Where applicable, ratings are converted to the comparable
S&P/Fitch rating tier nomenclature. The Not Rated category consists of securities that have not been rated by an NRSRO. Credit ratings are subject to change. Values may not sum to
100.0% due to rounding.
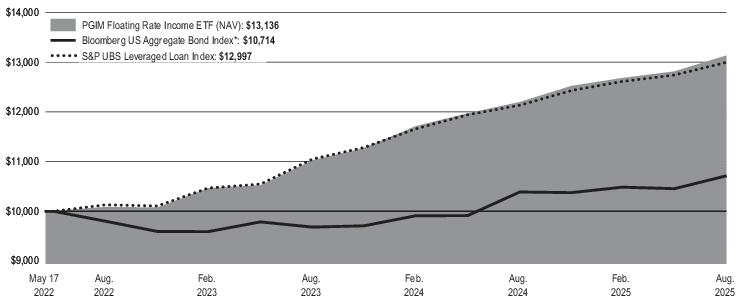
This annual shareholder report contains important information about the PGIM Floating Rate Income ETF (the “Fund”) for the period of
September 1, 2024 to August 31, 2025.
You can find additional information about the Fund at
pgim.com/investments/etfs/prospectuses-fact-sheets
. You can also request this information by contacting us at (888) 247-8090 or (973) 802-2093 from outside the US.
WHAT WERE THE FUND COSTS FOR THE LAST YEAR?
(Based on a hypothetical $10,000 investment)
| |
Costs of a $10,000 investment |
Costs paid as a percentage of a $10,000 investment |
| PGIM Floating Rate Income ETF |
$84 |
0.81% |
WHAT AFFECTED THE FUND’S PERFORMANCE DURING THE REPORTING PERIOD?
■
US leveraged loans posted gains over the reporting period, as generally solid corporate earnings and supportive technicals held firm overall
against a challenging environment marked by the 2024 US election cycle, geopolitical and US-driven trade tensions on multiple fronts, and
elevated inflation. Thus far in 2025, loan mutual funds reported inflows of approximately $6.3 billion, while collateralized loan obligation
(CLO) formation remained robust at over $138 billion.
■
The following contributed the most to the Fund’s performance during the period: security selection in the health care & pharmaceuticals,
banking, and electric & water industries; overweights relative to the S&P UBS Leveraged Loan Index (the “Index”) in the CLO AA sector; and an
underweight relative to the Index in the technology industry. The market risk of the portfolio was higher than the Index over the period, which
also contributed.
■
The following detracted the most from the Fund’s performance during the period: security selection in the consumer noncyclicals, chemicals,
and technology industries, and an overweight relative to the Index in the US high yield corporate sector.
■
The Fund held interest rate futures and swaps to help manage the portfolio’s duration and yield curve exposure and to reduce its sensitivity to
changes in the levels of interest rates. Overall, this strategy had a positive impact on performance during the period. The Fund also participated
in credit default swaps to increase or reduce credit risk. This strategy had a negative impact on performance.
| Average Annual Total Returns as of 8/31/2025 | ||
| |
One Year (%) |
Since Inception (%) |
| Net Asset Value (NAV) |
7.68% |
8.64% (5/17/2022) |
| Bloomberg US Aggregate Bond Index* |
3.14% |
2.14% |
| S&P UBS Leveraged Loan Index |
7.36% |
8.53% |
*The Fund compares its performance against this broad-based index in response to regulatory requirements.
Since Inception returns are provided for the Fund since it has less than 10 fiscal years of returns. Since Inception returns for the Indexes are measured from the closest month-end to
the Fund’s inception date.
The returns do not reflect the deduction of
taxes that a shareholder would pay on Fund distributions or redemption of Fund shares.
Visit
pgim.com/investments/etfs/prospectuses-fact-sheets
or call (888) 247-8090 or (973) 802-2093 from outside the US for more recent performance data.
WHAT ARE SOME KEY FUND STATISTICS AS OF 8/31/2025?
| Fund’s net assets |
$ 79,321,838 |
| Number of fund holdings |
364 |
| Total advisory fees paid for the year |
$ 615,408 |
| Portfolio turnover rate for the year |
112% |
WHAT ARE SOME CHARACTERISTICS OF THE FUND’S HOLDINGS AS OF 8/31/2025?
| Credit Quality expressed as a percentage of total investments as of 8/31/2025 (%) | |
| AAA |
1.6 |
| AA |
7.0 |
| A |
2.4 |
| BBB |
10.8 |
| BB |
24.2 |
| B |
49.0 |
| CCC |
1.0 |
| C |
0.1 |
| Not Rated |
3.2 |
| Cash/Cash Equivalents |
0.8 |
| Total |
100.0 |
Credit ratings reflect the highest rating assigned by a nationally recognized statistical rating organization (NRSRO) such as Moody’s Investors Service, Inc. (Moody’s), S&P Global
Ratings (S&P), or Fitch Ratings, Inc. (Fitch). Credit ratings reflect the common nomenclature used by both S&P and Fitch. Where applicable, ratings are converted to the comparable
S&P/Fitch rating tier nomenclature. The Not Rated category consists of securities that have not been rated by an NRSRO. Credit ratings are subject to change. Values may not sum to
100.0% due to rounding.
WERE THERE ANY SIGNIFICANT CHANGES TO THE FUND THIS YEAR?
The following is a summary of certain changes to the Fund since September 1, 2024:
For the year ended August 31, 2025, the total annual Fund operating expenses after waivers and/or expense reimbursement increased from
0.70% in the year ended August 31, 2024 to 0.81% due to interest expense on reverse repurchase agreements.
For more complete information, you should review the Fund’s next prospectus, which we expect to be available by October 30, 2025
at
pgim.com/investments/etfs/prospectuses-fact-sheets
or by request at (800) 225-1852.
For the year ended August 31, 2025, the total annual Fund operating expenses after waivers and/or expense reimbursement increased from
0.70% in the year ended August 31, 2024 to 0.81% due to interest expense on reverse repurchase agreements.
The following is a summary of certain changes to the Fund since September 1, 2024:
For the year ended August 31, 2025, the total annual Fund operating expenses after waivers and/or expense reimbursement increased from
0.70% in the year ended August 31, 2024 to 0.81% due to interest expense on reverse repurchase agreements.
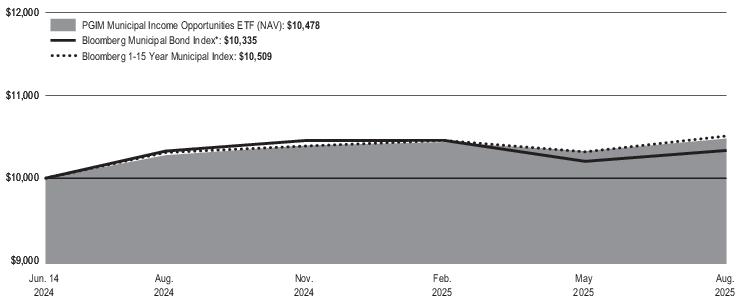
This annual shareholder report contains important information about the PGIM Municipal Income Opportunities ETF (the “Fund”) for the period of
September 1, 2024 to August 31, 2025.
You can find additional information about the Fund at
pgim.com/investments/etfs/prospectuses-fact-sheets
. You can also request this information by contacting us at (888) 247-8090 or (973) 802-2093 from outside the US.
WHAT WERE THE FUND COSTS FOR THE LAST YEAR?
(Based on a hypothetical $10,000 investment)
Costs of a $10,000 investment |
Costs paid as a percentage of a $10,000 investment | |
PGIM Municipal Income Opportunities ETF |
$21 |
0.21% |
WHAT AFFECTED THE FUND’S PERFORMANCE DURING THE REPORTING PERIOD?
■
During the reporting period, the US Federal Reserve's easing cycle was paused amid increased uncertainty over the impact of US policies and
actions (e.g., taxes and higher education). Issuance in the municipal bond market, as of August 2025, exceeded last year's record by
approximately 15–20%, driven by issuers in the health care, university, and transportation sectors. Investor demand was skewed toward
short-dated municipal bonds, resulting in a steeper municipal bond yield curve and relative values that exceeded their long-term averages.
■
The following contributed most to the Fund’s performance relative to the Bloomberg 1-15 Year Municipal Index (the “Index”) during the reporting
period: an overweight to specific health care credits and to the transportation sector as spreads tightened; and security selection in a specific
charter school bond.
■
The following detracted most from the Fund’s performance relative to the Index during the reporting period: yield curve positioning (flattener);
and an overweight to the special assessment sector.
■
The Fund uses derivatives when they facilitate implementation of the overall investment approach. During the reporting period, the Fund used
futures to help manage duration positioning and yield curve exposure. The Fund’s positions in futures contributed to performance during the
reporting period.
Average Annual Total Returns as of 8/31/2025 | ||
One Year (%) |
Since Inception (%) | |
Net Asset Value (NAV) |
1.96% |
3.91% (6/14/2024) |
Bloomberg Municipal Bond Index* |
0.08% |
2.67% |
Bloomberg 1-15 Year Municipal Index |
1.94% |
4.05% |
*The Fund compares its performance against this broad-based index in response to regulatory requirements.
Since Inception returns are provided for the Fund since it
has
less than 10 fiscal years of returns. Since Inception returns for the Index are measured from the closest month-end to the Fund’s inception date.
The returns do not reflect the deduction of
taxes that a shareholder would pay on Fund distributions or redemption of Fund shares.
Visit
pgim.com/investments/etfs/prospectuses-fact-sheets
or call (888) 247-8090 or (973) 802-2093 from outside the US for more recent performance data.
WHAT ARE SOME KEY FUND STATISTICS AS OF 8/31/2025?
Fund’s net assets |
$ 26,285,796 |
Number of fund holdings |
45 |
Total advisory fees paid for the year |
$ 55,031 |
Portfolio turnover rate for the year |
49% |
WHAT ARE SOME CHARACTERISTICS OF THE FUND’S HOLDINGS AS OF 8/31/2025?
Credit Quality expressed as a percentage of total investments as of 8/31/2025 (%) | |
AAA |
0.7 |
AA |
40.5 |
A |
18.7 |
BBB |
4.0 |
BB |
3.5 |
Not Rated |
30.7 |
Cash/Cash Equivalents |
2.0 |
Total |
100.0 |
Credit ratings reflect the highest rating assigned by a nationally recognized statistical rating organization (NRSRO) such as Moody’s Investors Service, Inc. (Moody’s), S&P Global
Ratings (S&P), or Fitch Ratings, Inc. (Fitch). Credit ratings reflect the common nomenclature used by both S&P and Fitch. Where applicable, ratings are converted to the comparable
S&P/Fitch rating tier nomenclature. The Not Rated category consists of securities that have not been rated by an NRSRO. Credit ratings are subject to change. Values may not sum to
100.0% due to rounding.
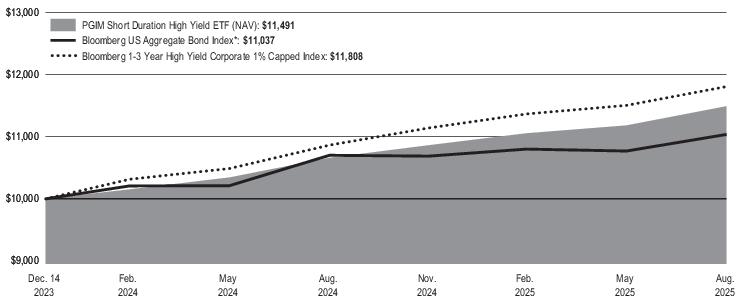
This annual shareholder report contains important information about the PGIM Short Duration High Yield ETF (the “Fund”) for the period of
September 1, 2024 to August 31, 2025.
You can find additional information about the Fund at
pgim.com/investments/etfs/prospectuses-fact-sheets
. You can also request this information by contacting us at (888) 247-8090 or (973) 802-2093 from outside the US.
WHAT WERE THE FUND COSTS FOR THE LAST YEAR?
(Based on a hypothetical $10,000 investment)
Costs of a $10,000 investment |
Costs paid as a percentage of a $10,000 investment | |
PGIM Short Duration High Yield ETF |
$44 |
0.42% |
WHAT AFFECTED THE FUND’S PERFORMANCE DURING THE REPORTING PERIOD?
■
US high yield bonds posted gains over the reporting period, as overall solid corporate earnings and resilient market technicals held firm against
a challenging environment marked by the 2024 US election cycle, geopolitical tensions on multiple fronts, a broad-based increase in US tariffs,
and elevated inflation. In addition, despite macro uncertainty and tight financial conditions, the high yield market continued to grow in 2025.
■
The following strategies contributed the most to the Fund’s performance relative to the Bloomberg 1-3 Year High Yield Corporate 1% Capped
Index (the “Index”) during the period: security selection in the electric & water, health care & pharmaceuticals, and capital goods industries;
industry underweights to telecom and paper & packaging, along with a neutral weighting to midstream energy.
■
The following strategies detracted the most from the Fund’s performance relative to the Index during the period: security selection in the
telecom, cable & satellite, and media & entertainment industries; an underweight to the US high yield corporate sector and overweights to the
US bank loan and emerging-market high yield corporate sectors; and industry underweights to media & entertainment, chemicals, and retailers
& restaurants.
■
The Fund uses derivatives to facilitate the implementation of the overall investment approach. During the reporting period, the Fund used
swaps, forwards, and futures to help manage duration positioning and yield curve exposure. In aggregate, these positions had a modestly
positive impact on performance.
Average Annual Total Returns as of 8/31/2025 | ||
One Year (%) |
Since Inception (%) | |
Net Asset Value (NAV) |
7.78% |
8.43% (12/14/2023) |
Bloomberg US Aggregate Bond Index* |
3.14% |
5.80% |
Bloomberg 1-3 Year High Yield Corporate 1% Capped Index |
8.68% |
9.96% |
*The Fund compares its performance against this broad-based index in response to regulatory requirements.
Since Inception returns are provided for the Fund since it has less than 10 fiscal years of returns. Since Inception
returns
for the Indexes are measured from the closest month-end to the Fund’s inception date.
The returns do not reflect the deduction of
taxes that a shareholder would pay on Fund distributions or redemption of Fund shares.
Visit
pgim.com/investments/etfs/prospectuses-fact-sheets
or call (888) 247-8090 or (973) 802-2093 from outside the US for more recent performance data.
WHAT ARE SOME KEY FUND STATISTICS AS OF 8/31/2025?
Fund’s net assets |
$ 58,350,225 |
Number of fund holdings |
358 |
Total advisory fees paid for the year |
$ 195,344 |
Portfolio turnover rate for the year |
100% |
WHAT ARE SOME CHARACTERISTICS OF THE FUND’S HOLDINGS AS OF 8/31/2025?
Credit Quality expressed as a percentage of total investments as of 8/31/2025 (%) | |
AAA |
11.1 |
BBB |
4.8 |
BB |
50.5 |
B |
21.0 |
CCC |
9.2 |
Not Rated |
3.1 |
Cash/Cash Equivalents |
0.3 |
Total |
100.0 |
Credit ratings reflect the highest rating assigned by a nationally recognized statistical rating organization (NRSRO) such as Moody’s Investors Service, Inc. (Moody’s), S&P Global
Ratings (S&P), or Fitch Ratings, Inc. (Fitch). Credit ratings reflect the common nomenclature used by both S&P and Fitch. Where applicable, ratings are converted to the comparable
S&P/Fitch rating tier nomenclature. The Not Rated category consists of securities that have not been rated by an NRSRO. Credit ratings are subject to change. Values may not sum to
100.0% due to rounding.
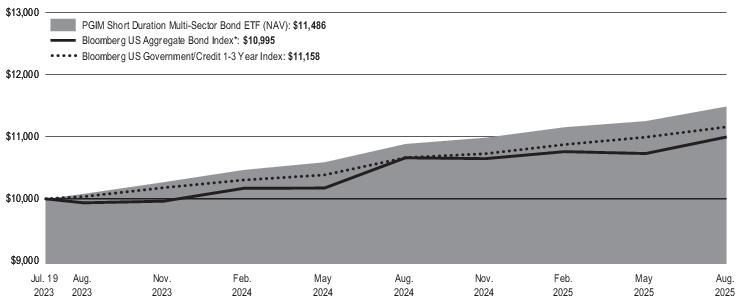
This annual shareholder report contains important information about the PGIM Short Duration Multi-Sector Bond ETF (the “Fund”) for the period
of September 1, 2024 to August 31, 2025.
You can find additional information about the Fund at
pgim.com/investments/etfs/prospectuses-fact-sheets
. You can also request this information by contacting us at (888) 247-8090 or (973) 802-2093 from outside the US.
WHAT WERE THE FUND COSTS FOR THE LAST YEAR?
(Based on a hypothetical $10,000 investment)
Costs of a $10,000 investment |
Costs paid as a percentage of a $10,000 investment | |
PGIM Short Duration Multi-Sector Bond ETF |
$38 |
0.37% |
WHAT AFFECTED THE FUND’S PERFORMANCE DURING THE REPORTING PERIOD?
■
During the reporting period, credit spreads across a broad spectrum of fixed income asset classes generally tightened, recovering from the
reciprocal tariffs introduced on April 2, 2025. The US Federal Reserve's easing cycle, which began with three rate cuts in the second half of
2024, was paused in the first half of 2025 amid increased uncertainty over the impact of US policy changes on the domestic labor market and
inflation. Indeed, Core PCE, a key inflation metric that tracks price changes (excluding volatile food and energy prices), came in higher than
expected for the period. In addition, revisions to the nonfarm payroll report at the end of the period revealed a weaker labor market than
previously indicated, causing investors to reprice their expectations for a September rate cut and a steepening of the US Treasury yield curve.
■
The following strategies contributed most to the Fund’s performance relative to the Bloomberg US Government/Credit 1-3 Year Index (the
“Index”) during the period: positioning in AAA collateralized loan obligations (CLO) and non-agency AAA commercial mortgage-backed
securities (CMBS); yield curve positioning; overweights to the emerging-market high yield, AA CLO, and non-agency CMBS AA-and-below
sectors; security selection in US high yield corporates, non-agency MBS, US Treasuries, non-agency CMBS AA-and-below, European high
yield corporates, mortgage-backed securities (MBS), and GBP high yield corporates; and credit positioning in cable & satellite, consumer
noncyclicals: retailers & restaurants industries, and transportation & environmental services.
■
The following strategies detracted most from the Fund’s performance relative to the Index during the period: duration positioning; security
selection in emerging-market high yield bonds; and overweights to the MBS and US investment-grade corporate sectors.
■
The Fund uses derivatives when they facilitate implementation of the overall investment approach. During the period, the Fund used swaps,
options, and futures to help manage duration positioning and yield curve exposure. In aggregate, these positions detracted from performance.
Average Annual Total Returns as of 8/31/2025 | ||
One Year (%) |
Since Inception (%) | |
Net Asset Value (NAV) |
5.54% |
6.75% (7/19/2023) |
Bloomberg US Aggregate Bond Index* |
3.14% |
4.66% |
Bloomberg US Government/Credit 1-3 Year Index |
4.64% |
5.40% |
*The Fund compares its performance against this broad-based index in response to
regulatory
requirements.Since Inception returns are provided for the Fund since it has less than 10 fiscal years of returns. Since Inception returns for the Indexes are measured from the closest month-end to
the Fund’s inception date.
The returns do not reflect the deduction of
taxes that a shareholder would pay on Fund distributions or redemption of Fund shares.
Visit
pgim.com/investments/etfs/prospectuses-fact-sheets
or call (888) 247-8090 or (973) 802-2093 from outside the US for more recent performance data.
WHAT ARE SOME KEY FUND STATISTICS AS OF 8/31/2025?
Fund’s net assets |
$ 87,571,154 |
Number of fund holdings |
599 |
Total advisory fees paid for the year |
$ 244,807 |
Portfolio turnover rate for the year |
108% |
WHAT ARE SOME CHARACTERISTICS OF THE FUND’S HOLDINGS AS OF 8/31/2025?
Credit Quality expressed as a percentage of total investments as of 8/31/2025 (%) | |
AAA |
36.7 |
AA |
33.1 |
A |
7.6 |
BBB |
12.4 |
BB |
5.5 |
B |
1.9 |
CCC |
0.2 |
Not Rated |
5.9 |
Cash/Cash Equivalents |
(3.3) |
Total |
100.0 |
Credit ratings reflect the highest rating assigned by a nationally recognized statistical rating organization (NRSRO) such as Moody’s Investors Service, Inc. (Moody’s), S&P Global
Ratings (S&P), or Fitch Ratings, Inc. (Fitch). Credit ratings reflect the common nomenclature used by both S&P and Fitch. Where applicable, ratings are converted to the comparable
S&P/Fitch rating tier nomenclature. The Not Rated category consists of securities that have not been rated by an NRSRO. Credit ratings are subject to change. Values may not sum to
100.0% due to rounding.
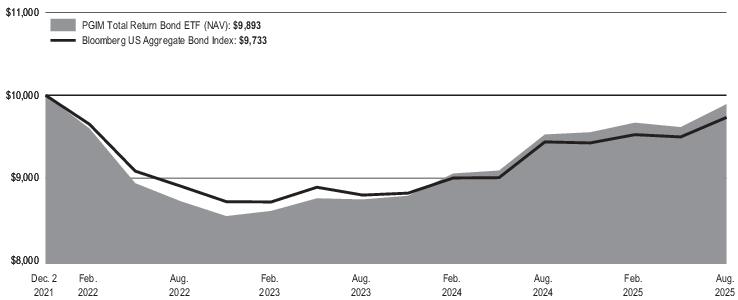
This annual shareholder report contains important information about the PGIM Total Return Bond ETF (the “Fund”) for the period of September 1,
2024 to August 31, 2025.
You can find additional information about the Fund at
pgim.com/investments/etfs/prospectuses-fact-sheets
. You can
also request this information by contacting us at (888) 247-8090 or (973) 802-2093 from outside the US.
WHAT WERE THE FUND COSTS FOR THE LAST YEAR?
(Based on a hypothetical $10,000 investment)
Costs of a $10,000 investment |
Costs paid as a percentage of a $10,000 investment | |
PGIM Total Return Bond ETF |
$49 |
0.48% |
WHAT AFFECTED THE FUND’S PERFORMANCE DURING THE REPORTING PERIOD?
■
During the reporting period, credit spreads across a broad spectrum of fixed income asset classes generally tightened, recovering from the
reciprocal tariffs introduced on April 2, 2025. The US Federal Reserve's easing cycle, which began with three rate cuts in the second half of
2024, was paused in the first half of 2025 amid increased uncertainty over the impact of US policy changes on the domestic labor market and
inflation. Indeed, Core PCE, a key inflation metric that tracks price changes (excluding volatile food and energy prices), came in higher than
expected for the period. In addition, revisions to the nonfarm payroll report at the end of the period revealed a weaker labor market than
previously indicated, causing investors to reprice their expectations for a September rate cut and a steepening of the US Treasury yield curve.
■
The following strategies contributed most to the Fund’s performance relative to the Bloomberg US Aggregate Bond Index (the “Index”) during
the period: positioning in AAA collateralized loan obligations (CLO) and non-agency AAA commercial mortgage-backed securities (CMBS);
yield curve positioning; overweights to the US investment-grade corporate, emerging-market high yield, AA CLO, non-agency CMBS
AA-and-below, and ABS sectors, along with an underweight to the mortgage-backed securities (MBS) and emerging-market investment grade
sectors; security selection in US high yield corporates, non-agency MBS, US Treasuries, non-agency CMBS AA-and-below, US bank loans, and
European high-yield corporates; credit positioning in cable & satellite, telecom, retailers & restaurants, transportation & environmental services,
aerospace & defense, and automotives.
■
The following strategies detracted from the Fund’s performance relative to the Index during the period: duration positioning; security selection in
MBS, emerging-market high yield bonds, GBP high yield corporates, and US investment-grade corporates; and an overweight to the US high
yield corporate sector.
■
The Fund uses derivatives when they facilitate implementation of the overall investment approach. During the period, the Fund used swaps,
forwards, options, and futures to help manage duration positioning and yield curve exposure. In aggregate, these positions detracted
from performance.
Average Annual Total Returns as of 8/31/2025 | ||
One Year (%) |
Since Inception (%) | |
Net Asset Value (NAV) |
3.85% |
-0.29% (12/2/2021) |
Bloomberg US Aggregate Bond Index |
3.14% |
-0.72% |
Since
Inception returns are provided for the Fund since it has less than 10 fiscal years of returns. Since Inception returns for the Index are measured from the closest month-end to the Fund’s inception date.
The returns do not reflect the deduction of
taxes that a shareholder would pay on Fund distributions or redemption of Fund shares.
Visit
pgim.com/investments/etfs/prospectuses-fact-sheets
or call (888) 247-8090 or (973) 802-2093 from outside the US for more recent performance data.
WHAT ARE SOME KEY FUND STATISTICS AS OF 8/31/2025?
Fund’s net assets |
$ 529,417,848 |
Number of fund holdings |
1,162 |
Total advisory fees paid for the year |
$ 1,903,901 |
Portfolio turnover rate for the year |
109% |
WHAT ARE SOME CHARACTERISTICS OF THE FUND’S HOLDINGS AS OF 8/31/2025?
Credit Quality expressed as a percentage of total investments as of 8/31/2025 (%) | |
AAA |
33.0 |
AA |
29.6 |
A |
8.2 |
BBB |
15.3 |
BB |
4.6 |
B |
2.2 |
CCC |
0.3 |
Not Rated |
6.7 |
Cash/Cash Equivalents |
0.1 |
Total |
100.0 |
Credit ratings reflect the highest rating assigned by a nationally recognized statistical rating organization (NRSRO) such as Moody’s Investors Service, Inc. (Moody’s), S&P Global
Ratings (S&P), or Fitch Ratings, Inc. (Fitch). Credit ratings reflect the common nomenclature used by both S&P and Fitch. Where applicable, ratings are converted to the comparable
S&P/Fitch rating tier nomenclature. The Not Rated category consists of securities that have not been rated by an NRSRO. Credit ratings are subject to change. Values may not sum to
100.0% due to rounding.
This annual shareholder report contains important information about the PGIM Ultra Short Bond ETF (the “Fund”) for the period of September 1,
2024 to August 31, 2025.
You can find additional information about the Fund at
pgim.com/investments/etfs/prospectuses-fact-sheets
. You can
also request this information by contacting us at (888) 247-8090 or (973) 802-2093 from outside the US.
WHAT WERE THE FUND COSTS FOR THE LAST YEAR?
(Based on a hypothetical $10,000 investment)
| |
Costs of a $10,000 investment |
Costs paid as a percentage of a $10,000 investment |
| PGIM Ultra Short Bond ETF |
$15 |
0.15% |
WHAT AFFECTED THE FUND’S PERFORMANCE DURING THE REPORTING PERIOD?
■
The US Federal Reserve's easing cycle, which began with three rate cuts in the second half of 2024, was paused in the first half of 2025 amid
increased uncertainty over the impact of US policy changes on the domestic labor market and inflation. However, the July and August nonfarm
payrolls reports revealed a weakening labor market and opened the door to further rate cuts over the near term. As a result, the US Treasury
yield curve steepened, with the three-month Treasury bill declining from 5.21% to 4.51% during the 12-month period. Meanwhile, the Secured
Overnight Financing Rate (SOFR) declined to 4.34% from 5.32%.
■
The following strategies contributed most to the Fund’s performance during the period: allocations to short-term investment-grade corporates,
as well as high-quality collateralized loan obligations, non-agency commercial mortgage-backed securities, and asset-backed securities. Within
credit, positioning in banking, technology, and automotive contributed the most.
■
No strategies detracted materially from relative performance during the period.
■
During the reporting period, the Fund used interest rate swaps and futures to help manage duration positioning and yield curve exposure.
These instruments allowed the Fund to capture higher yields available farther out on the short-term portion of the yield curve and in
spread-sector assets versus US Treasuries, while mitigating interest rate risk. Overall, the positions added to performance during the period.
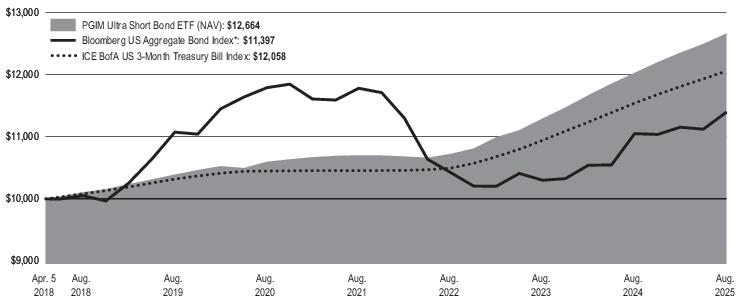
| Average Annual Total Returns as of 8/31/2025 | |||
| |
One Year (%) |
Five Years (%) |
Since Inception (%) |
Net Asset Value (NAV) |
5.28% |
3.63% |
3.24% (4/5/2018) |
| Bloomberg US Aggregate Bond Index* |
3.14% |
-0.68% |
1.78% |
ICE BofA US 3-Month Treasury Bill Index |
4.48% |
2.91% |
2.56% |
*The Fund compares its performance against this broad-based index in response to regulatory requirements.
Since Inception returns are
provided
for the Fund since it has less than 10 fiscal years of returns. Since Inception returns for the Indexes are measured from the closest month-end to the Fund’s inception date.
The returns do not reflect the deduction of
taxes that a shareholder would pay on Fund distributions or redemption of Fund shares.
Visit
pgim.com/investments/etfs/prospectuses-fact-sheets
or call (888) 247-8090 or (973) 802-2093 from outside the US for more recent performance data.
WHAT ARE SOME KEY FUND STATISTICS AS OF 8/31/2025?
| Fund’s net assets |
$ 12,406,577,847 |
| Number of fund holdings |
601 |
| Total advisory fees paid for the year |
$ 14,888,596 |
| Portfolio turnover rate for the year |
39% |
WHAT ARE SOME CHARACTERISTICS OF THE FUND’S HOLDINGS AS OF 8/31/2025?
| Credit Quality expressed as a percentage of total investments as of 8/31/2025 (%) | |
| AAA |
30.2 |
| AA |
19.9 |
| A |
24.6 |
| BBB |
23.2 |
| Cash/Cash Equivalents |
1.0 |
| Other |
0.9 |
| Total |
100.0 |
Credit ratings reflect the highest rating assigned by a nationally recognized statistical rating organization (NRSRO) such as Moody’s Investors Service, Inc. (Moody’s), S&P Global
Ratings (S&P), or Fitch Ratings, Inc. (Fitch). Credit ratings reflect the common nomenclature used by both S&P and Fitch. Where applicable, ratings are converted to the comparable
S&P/Fitch rating tier nomenclature. The Not Rated category consists of securities that have not been rated by an NRSRO. Credit ratings are subject to change. Values may not sum to
100.0% due to rounding
This annual shareholder report contains important information about the PGIM Ultra Short Municipal Bond ETF (the “Fund”) for the period of
September 1, 2024 to August 31, 2025.
You can find additional information about the Fund at
pgim.com/investments/etfs/prospectuses-fact-sheets
. You can also request this information by contacting us at (888) 247-8090 or (973) 802-2093 from outside the US.
WHAT WERE THE FUND COSTS FOR THE LAST YEAR?
(Based on a hypothetical $10,000 investment)
| |
Costs of a $10,000 investment |
Costs paid as a percentage of a $10,000 investment |
| PGIM Ultra Short Municipal Bond ETF |
$12 |
0.12% |
WHAT AFFECTED THE FUND’S PERFORMANCE DURING THE REPORTING PERIOD?
■
During the reporting period, the US Federal Reserve's easing cycle was paused amid increased uncertainty over the impact of US policies and
actions (e.g., taxes and higher education). Issuance in the municipal bond market, as of August 2025, exceeded last year's record by
approximately 15–20%, driven by issuers in the health care, university, and transportation sectors. Investor demand was skewed toward
short-dated municipal bonds, resulting in a steeper municipal bond yield curve and relative values that exceeded their long-term averages.
■
The following contributed most to the Fund’s performance relative to the Bloomberg 1 Year Municipal Bond Index (the “Index”) during the
period: overweights to prepay gas bonds, as spreads tightened, and to escrowed housing bonds, which provided ample yield for high credit
quality; and an overweight to, and security selection in, transportation bonds.
■
The following detracted most from the Fund’s performance relative to the Index during the reporting period: a modest yield curve flattener as
well as an overweight to, and security selection in, an airport bond that underperformed given its structure in a rising yield environment.
■
The Fund uses derivatives when they facilitate implementation of the overall investment approach. During the reporting period, the Fund used
swaps and futures to help manage duration positioning and yield curve exposure. The Fund’s positions in SIFMA swaps and US Treasury
futures contributed to performance during the period.
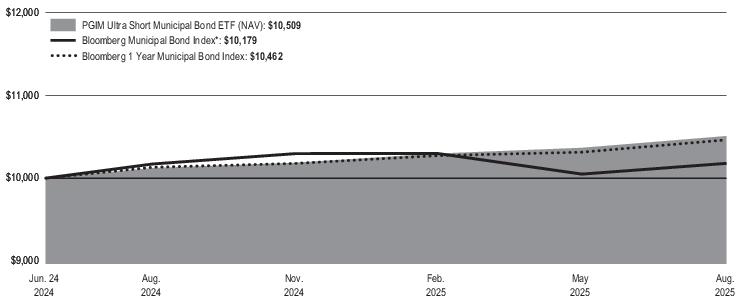
| Average Annual Total Returns as of 8/31/2025 | ||
| |
One Year (%) |
Since Inception (%) |
Net Asset Value (NAV) |
3.82% |
4.26% (6/24/2024) |
| Bloomberg Municipal Bond Index* |
0.08% |
1.53% |
Bloomberg 1 Year Municipal Bond Index |
3.26% |
3.95% |
*The Fund compares its performance against this broad-based index in response to regulatory requirements.
Since Inception returns are provided for the Fund since it has less than 10 fiscal
years
of returns. Since Inception returns for the Indexes are measured from the closest month-end to the Fund’s inception date.
The returns do not reflect the deduction of
taxes that a shareholder would pay on Fund distributions or redemption of Fund shares.
Visit
pgim.com/investments/etfs/prospectuses-fact-sheets
or call (888) 247-8090 or (973) 802-2093 from outside the US for more recent performance data.
WHAT ARE SOME KEY FUND STATISTICS AS OF 8/31/2025?
| Fund’s net assets |
$ 36,608,810 |
| Number of fund holdings |
106 |
| Total advisory fees paid for the year |
$ 34,199 |
| Portfolio turnover rate for the year |
87% |
WHAT ARE SOME CHARACTERISTICS OF THE FUND’S HOLDINGS AS OF 8/31/2025?
| Credit Quality expressed as a percentage of total investments as of 8/31/2025 (%) | |
| AAA |
8.3 |
| AA |
41.2 |
| A |
35.5 |
| BBB |
7.1 |
| BB |
1.7 |
| Not Rated |
3.6 |
| Cash/Cash Equivalents |
2.8 |
| Total |
100.0 |
Credit ratings reflect the highest rating assigned by a nationally recognized statistical rating organization (NRSRO) such as Moody’s Investors Service, Inc. (Moody’s), S&P Global
Ratings (S&P), or Fitch Ratings, Inc. (Fitch). Credit ratings reflect the common nomenclature used by both S&P and Fitch. Where applicable, ratings are converted to the comparable
S&P/Fitch rating tier nomenclature. The Not Rated category consists of securities that have not been rated by an NRSRO. Credit ratings are subject to change. Values may not sum to
100.0% due to rounding.