Shareholder Report
Aug. 31, 2025
USD ($)
Holding
This annual shareholder report contains important information about the Class A shares of PGIM Muni High Income Fund (the “Fund”) for the
period of September 1, 2024 to August 31, 2025.
You can find additional information about the Fund at
pgim.com/investments/mutual-funds/prospectuses-fact-sheets
. You can also request
this information by contacting us at (800) 225-1852 or (973) 367-3529 from outside the US.
WHAT WERE THE FUND COSTS FOR THE LAST YEAR?
(Based on a hypothetical $10,000 investment)
Costs of a $10,000 investment |
Costs paid as a percentage of a $10,000 investment | |
PGIM Muni High Income Fund—Class A |
$80 |
0.81% |
WHAT AFFECTED THE FUND’S PERFORMANCE DURING THE REPORTING PERIOD?
■
During the reporting period, the US Federal Reserve's easing cycle was paused amid increased uncertainty over the impact of US policies and
actions (e.g., taxes and higher education). Issuance in the municipal bond market, as of August 2025, exceeded last year's record by
approximately 15–20%, driven by issuers in the health care, university, and transportation sectors. Investor demand was skewed toward
short-dated municipal bonds, resulting in a steeper municipal bond yield curve and relative values that exceeded their long-term averages.
■
The following contributed most to the Fund’s performance relative to the Bloomberg Municipal Bond Index (the “Index”) during the period: an
overweight position in housing bonds (particularly Freddie Mac multifamily deals) and prepay gas bonds as spreads tightened; an underweight
to a commuter train project in Florida, which underperformed as its spreads wid
ened.
■
The following detracted most from the Fund’s performance relative to the Index during the reporting period: yield curve positioning (flattener);
and security selection in charter schools that underperformed.
■
The Fund uses derivatives when they facilitate implementation of the overall investment approach. During the reporting period, the Fund used
futures to help manage duration positioning and yield curve exposure. The Fund’s positions in futures contributed modestly to performance
during the reporting period.
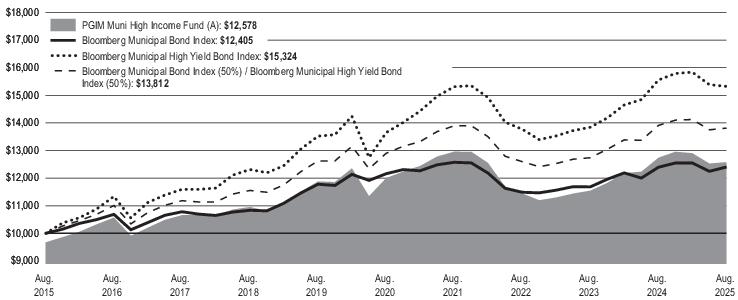
Average Annual Total Returns as of 8/31/2025 | |||
One Year (%) |
Five Years (%) |
Ten Years (%) | |
Class A with sales charges |
-4.48% |
0.28% |
2.32% |
Class A without sales charges |
-1.28% |
0.94% |
2.66% |
Bloomberg Municipal Bond Index |
0.08% |
0.40% |
2.18% |
Bloomberg Municipal High Yield Bond Index |
-1.49% |
2.34% |
4.36% |
Bloomberg Municipal Bond Index (50%) / Bloomberg Municipal High Yield Bond Index (50%) |
-0.71% |
1.37% |
3.28% |
The returns do not reflect the deduction of
taxes that a shareholder would pay on Fund distributions or redemption of Fund shares.
Visit
pgim.com/investments/mutual-funds/prospectuses-fact-sheets
or call (800) 225-1852 or (973) 367-3529 from outside the US for more recent performance data.
WHAT ARE SOME KEY FUND STATISTICS AS OF 8/31/2025?
Fund’s net assets |
$ 861,233,995 |
Number of fund holdings |
401 |
Total advisory fees paid for the year |
$ 3,616,661 |
Portfolio turnover rate for the year |
56% |
WHAT ARE SOME CHARACTERISTICS OF THE FUND’S HOLDINGS AS OF 8/31/2025?
Credit Quality expressed as a percentage of total investments as of 8/31/2025 (%) | |
AAA |
2.6 |
AA |
16.0 |
A |
13.9 |
BBB |
17.7 |
BB |
7.4 |
B |
1.3 |
Not Rated |
40.2 |
Cash/Cash Equivalents |
0.9 |
Total |
100.0 |
Credit ratings reflect the highest rating assigned by a nationally recognized statistical rating organization (NRSRO) such as Moody’s Investors Service, Inc. (Moody’s), S&P Global
Ratings (S&P), or Fitch Ratings, Inc. (Fitch). Credit ratings reflect the common nomenclature used by both S&P and Fitch. Where applicable, ratings are converted to the comparable
S&P/Fitch rating tier nomenclature. The Not Rated category consists of securities that have not been rated by an NRSRO. Credit ratings are subject to change. Values may not sum to
100.0% due to rounding.
This
annual shareholder report contains important
information about the Class C shares of PGIM Muni High Income Fund (the “Fund”) for the period of September 1, 2024 to August 31, 2025.
You can find additional information about the Fund at
pgim.com/investments/mutual-funds/prospectuses-fact-sheets
. You can also request
this information by contacting us at (800) 225-1852 or (973) 367-3529 from outside the US.
WHAT WERE THE FUND COSTS FOR THE LAST YEAR?
(Based on a hypothetical $10,000 investment)
Costs of a $10,000 investment |
Costs paid as a percentage of a $10,000 investment | |
PGIM Muni High Income Fund—Class C |
$162 |
1.64% |
WHAT AFFECTED THE FUND’S PERFORMANCE DURING THE REPORTING PERIO
D
?■
During the reporting period, the US Federal Reserve's easing cycle was paused amid increased uncertainty over the impact of US policies and
actions (e.g., taxes and higher education). Issuance in the municipal bond market, as of August 2025, exceeded last year's record by
approximately 15–20%, driven by issuers in the health care, university, and transportation sectors. Investor demand was skewed toward
short-dated municipal bonds, resulting in a steeper municipal bond yield curve and relative values that exceeded their long-term averages.
■
The following contributed most to the Fund’s performance relative to the Bloomberg Municipal Bond Index (the “Index”) during the period: an
overweight position in housing bonds (particularly Freddie Mac multifamily deals) and prepay gas bonds as spreads tightened; an underweight
to a commuter train project in Florida, which underperformed as its spreads widened.
■
The following detracted most from the Fund’s performance relative to
the
Index during the reporting period: yield curve positioning (flattener); and security selection in charter schools that underperformed.
■
The Fund uses derivatives when they facilitate implementation of the overall investment approach. During the reporting period, the Fund used
futures to help manage duration positioning and yield curve exposure. The Fund’s positions in futures contributed modestly to performance
during the reporting period.
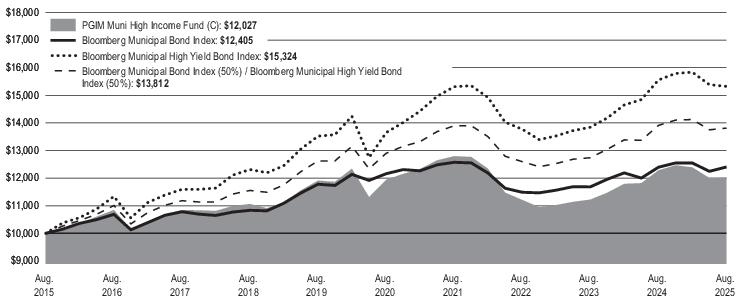
Average Annual Total Returns as of 8/31/2025 | |||
One Year (%) |
Five Years (%) |
Ten Years (%) | |
Class C with sales charges |
-3.04% |
0.14% |
1.86% |
Class C without sales charges |
-2.09% |
0.14% |
1.86% |
Bloomberg Municipal Bond Index |
0.08% |
0.40% |
2.18% |
Bloomberg Municipal High Yield Bond Index |
-1.49% |
2.34% |
4.36% |
Bloomberg Municipal Bond Index (50%) / Bloomberg Municipal High Yield Bond Index (50%) |
-0.71% |
1.37% |
3.28% |
The returns do not reflect the deduction of
taxes that a shareholder would pay on Fund distributions or redemption of Fund shares.
Visit
pgim.com/investments/mutual-funds/prospectuses-fact-sheets
or call (800) 225-1852 or (973) 367-3529 from outside the US for more recent performance data.
WHAT ARE SOME KEY FUND STATISTICS AS OF 8/31/2025?
Fund’s net assets |
$ 861,233,995 |
Number of fund holdings |
401 |
Total advisory fees paid for the year |
$ 3,616,661 |
Portfolio turnover rate for the year |
56% |
WHAT ARE SOME CHARACTERISTICS OF THE FUND’S HOLDINGS AS OF 8/31/2025?
Credit Quality expressed as a percentage of total investments as of 8/31/2025 (%) | |
AAA |
2.6 |
AA |
16.0 |
A |
13.9 |
BBB |
17.7 |
BB |
7.4 |
B |
1.3 |
Not Rated |
40.2 |
Cash/Cash Equivalents |
0.9 |
Total |
100.0 |
Credit ratings reflect the highest rating assigned by a nationally recognized statistical rating organization (NRSRO) such as Moody’s Investors Service, Inc. (Moody’s), S&P Global
Ratings (S&P), or Fitch Ratings, Inc. (Fitch). Credit ratings reflect the common nomenclature used by both S&P and Fitch. Where applicable, ratings are converted to the comparable
S&P/Fitch rating tier nomenclature. The Not Rated category consists of securities that have not been rated by an NRSRO. Credit ratings are subject to change. Values may not sum to
100.0% due to rounding.
This annual shareholder report contains important information about the Class Z shares of PGIM Muni High Income Fund (the “Fund”) for the
period of September 1, 2024 to August 31, 2025.
You can find additional information about the Fund at
pgim.com/investments/mutual-funds/prospectuses-fact-sheets
. You can also req
ue
st this information by contacting us at (800) 225-1852 or (973) 367-3529 from outside the US.
WHAT WERE THE FUND COSTS FOR THE LAST YEAR?
(Based on a hypothetical $10,000 investment)
Costs of a $10,000 investment |
Costs paid as a percentage of a $10,000 investment | |
PGIM Muni High Income Fund—Class Z |
$58 |
0.58% |
WHAT AFFECTED THE FUND’S PERFORMANCE DURING THE REPORTING PERIOD?
■
During the reporting period, the US Federal Reserve's easing cycle was paused amid increased uncertainty over the impact of US policies and
actions (e.g., taxes and higher education). Issuance in the municipal bond market, as of August 2025, exceeded last year's record by
approximately 15–20%, driven by issuers in the health care, university, and transportation sectors. Investor demand was skewed toward
short-dated municipal bonds, resulting in a steeper municipal bond yield curve and relative values that exceeded their long-term averages.
■
The following contributed most to the Fund’s performance relative to the Bloomberg Municipal Bond Index (the “Index”) during the period: an
overweight position in housing bonds (particularly Freddie Mac multifamily deals) and prepay gas bonds as spreads tightened; an underweight
to a commuter train project in Florida, which underperformed as its spreads widened.
■
The following detracted most from the Fund’s performance relative to the Index during the reporting period: yield curve positioning (flattener);
and security selection in charter schools that underperformed.
■
The Fund uses derivatives when they facilitate implementation of the overall investment approach. During the reporting period, the Fund used
futures to help manage duration positioning and yield curve exposure. The Fund’s positio
ns in f
utures contributed modestly to performance during the reporting period.
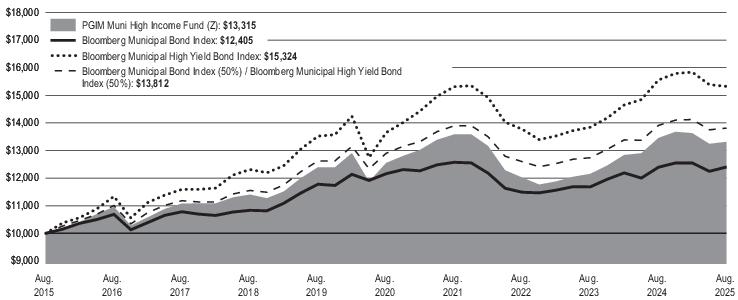
Average Annual Total Returns as of 8/31/2025 | |||
One Year (%) |
Five Years (%) |
Ten Years (%) | |
Class Z |
-1.05% |
1.19% |
2.90% |
Bloomberg Municipal Bond Index |
0.08% |
0.40% |
2.18% |
Bloomberg Municipal High Yield Bond Index |
-1.49% |
2.34% |
4.36% |
Bloomberg Municipal Bond Index (50%) / Bloomberg Municipal High Yield Bond Index (50%) |
-0.71% |
1.37% |
3.28% |
The returns do not reflect the deduction of
taxes that a shareholder would pay on Fund distributions or redemption of Fund shares.
Visit
pgim.com/investments/mutual-funds/prospectuses-fact-sheets
or call (800) 225-1852 or (973) 367-3529 from outside the US for more recent performance data.
WHAT ARE SOME KEY FUND STATISTICS AS OF 8/31/2025?
Fund’s net assets |
$ 861,233,995 |
Number of fund holdings |
401 |
Total advisory fees paid for the year |
$ 3,616,661 |
Portfolio turnover rate for the year |
56% |
WHAT ARE SOME CHARACTERISTICS OF THE FUND’S HOLDINGS AS OF 8/31/2025?
Credit Quality expressed as a percentage of total investments as of 8/31/2025 (%) | |
AAA |
2.6 |
AA |
16.0 |
A |
13.9 |
BBB |
17.7 |
BB |
7.4 |
B |
1.3 |
Not Rated |
40.2 |
Cash/Cash Equivalents |
0.9 |
Total |
100.0 |
Credit ratings reflect the highest rating assigned by a nationally recognized statistical rating organization (NRSRO) such as Moody’s Investors Service, Inc. (Moody’s), S&P Global
Ratings (S&P), or Fitch Ratings, Inc. (Fitch). Credit ratings reflect the common nomenclature used by both S&P and Fitch. Where applicable, ratings are converted to the comparable
S&P/Fitch rating tier nomenclature. The Not Rated category consists of securities that have not been rated by an NRSRO. Credit ratings are subject to change. Values may not sum to
100.0% due to rounding.
This annual shareholder report contains important information about the Class R6 shares of PGIM Muni High Income Fund (the “Fund”) for the
period of September 1, 2024 to August 31, 2025.
You can find additional information about the Fund at
pgim.com/investments/mutual-funds/prospectuses-fact-sheets
. You can also request
this information by contacting us at (800) 225-1852 or (973) 367-3529 from outside the US.
WHAT WERE THE FUND COSTS FOR THE LAST YEAR?
(Based on a hypothetical $10,000 investment)
Costs of a $10,000 investment |
Costs paid as a percentage of a $10,000 investment | |
PGIM Muni High Income Fund—Class R6 |
$49 |
0.49% |
WHAT AFFECTED THE FUND’S PERFORMANCE DURING THE REPORTING PERIOD?
■
During the reporting period, the US Federal Reserve's easing cycle was paused amid increased uncertainty over the impact of US policies and
actions (e.g., taxes and higher education). Issuance in the municipal bond market, as of August 2025, exceeded last year's record by
approximately 15–20%, driven by issuers in the health care, university, and transportation sectors. Investor demand was skewed toward
short-dated municipal bonds, resulting in a steeper municipal bond yield curve and relative values that exceeded their long-term averages.
■
The following contributed most to the Fund’s performance relative to the Bloomberg Municipal Bond Index (the “Index”) during the period: an
overweight position in housing bonds (particularly Freddie Mac multifamily deals) and prepay gas bonds as spreads tightened; an underweight
to a commuter train project in Florida, which underperformed as its spreads widened.
■
The following detracted most from the Fund’s performance relative to the Index during the reporting period: yield curve positioning (flattener);
and security selection in charter schools that underperformed.
■
The Fund uses derivatives when they facilitate implementation of the overall investment approach. Durin
g the repo
rting period, the Fund used futures to help manage duration positioning and yield curve exposure. The Fund’s positions in futures contributed modestly to performance
during the reporting period.
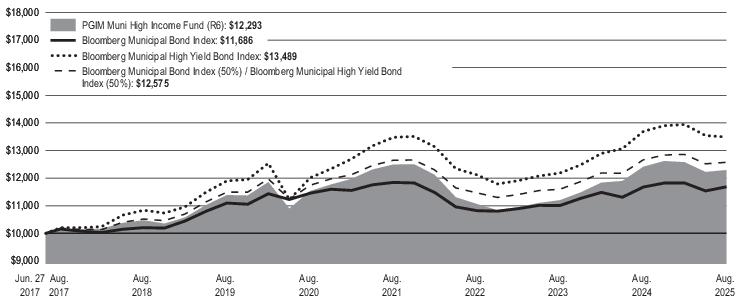
Average Annual Total Returns as of 8/31/2025 | |||
One Year (%) |
Five Years (%) |
Since Inception (%) | |
Class R6 |
-0.96% |
1.28% |
2.56% (6/27/2017) |
Bloomberg Municipal Bond Index |
0.08% |
0.40% |
1.93% |
Bloomberg Municipal High Yield Bond Index |
-1.49% |
2.34% |
3.73% |
Bloomberg Municipal Bond Index (50%) / Bloomberg Municipal High Yield Bond Index (50%) |
-0.71% |
1.37% |
2.85% |
The returns do not reflect the deduction of
taxes that a shareholder would pay on Fund distributions or redemption of Fund shares.
Visit
pgim.com/investments/mutual-funds/prospectuses-fact-sheets
or call (800) 225-1852 or (973) 367-3529 from outside the US for more recent performance data.
WHAT ARE SOME KEY FUND STATISTICS AS OF 8/31/2025?
Fund’s net assets |
$ 861,233,995 |
Number of fund holdings |
401 |
Total advisory fees paid for the year |
$ 3,616,661 |
Portfolio turnover rate for the year |
56% |
WHAT ARE SOME CHARACTERISTICS OF THE FUND’S HOLDINGS AS OF 8/31/2025?
Credit Quality expressed as a percentage of total investments as of 8/31/2025 (%) | |
AAA |
2.6 |
AA |
16.0 |
A |
13.9 |
BBB |
17.7 |
BB |
7.4 |
B |
1.3 |
Not Rated |
40.2 |
Cash/Cash Equivalents |
0.9 |
Total |
100.0 |
Credit ratings reflect the highest rating assigned by a nationally recognized statistical rating organization (NRSRO) such as Moody’s Investors Service, Inc. (Moody’s), S&P Global
Ratings (S&P), or Fitch Ratings, Inc. (Fitch). Credit ratings reflect the common nomenclature used by both S&P and Fitch. Where applicable, ratings are converted to the comparable
S&P/Fitch rating tier nomenclature. The Not Rated category consists of securities that have not been rated by an NRSRO. Credit ratings are subject to change. Values may not sum to
100.0% due to rounding.