| PRESS RELEASE Third quarter 2025 results Despite oil prices down by more than $10/b, TotalEnergies generates adjusted net income at the same level as last year and $7.1 billion of cash flow during the quarter, an increase of 4%, thanks to accretive hydrocarbon production growth and improved Downstream results 1 Paris, October 30, 2025 – The Board of Directors of TotalEnergies SE, chaired by CEO Patrick Pouyanné, met on October 29, 2025, to approve the 3rd quarter 2025 financial statements. On the occasion, Patrick Pouyanné said: “Despite a $10/b drop in oil prices year-on-year, TotalEnergies posted adjusted net income at the same level as the third quarter 2024 at $4.0 billion and $7.1 billion of cash flow during the quarter, which is up 4% year-on-year. The Company’s strong financials are underpinned by accretive hydrocarbon production growth of more than 4% year-on-year and improved Downstream results that highlight the Company’s profitable growth strategy and integrated model. Exploration & Production reported adjusted net operating income of $2.2 billion and cash flow of $4.0 billion in the third quarter, increasing by 10% and 6% quarter-to-quarter, respectively. New projects have already generated around $400 million of additional cash flow year-on-year due to margins that are significantly above the portfolio average. The Company also continued to replenish its exploration portfolio, securing license awards in the Republic of Congo, Nigeria and Liberia. Integrated LNG achieved cash flow of $1.1 billion this quarter, in line with the second quarter in a similar price environment (average LNG price around $9/Mbtu). TotalEnergies further progressed its integration strategy in the U.S. LNG value chain through the final investment decision of Rio Grande LNG Train 4 and the acquisition of new shale gas interests. Integrated Power posted adjusted net operating income and cash flow of $0.6 billion this quarter, in line with the second quarter with electricity production during the first nine months up almost 20% year-on-year. The value of TotalEnergies’ unique integrated model is illustrated by production assets (renewables and gas-fired power plants) and sales activities (B2B, B2C, trading) contributing equally to third quarter results. As part of its business model, TotalEnergies signed an agreement to divest 50% of two renewable asset portfolios in North America and France for ~$1.5 billion, demonstrating the ability to successfully valorize its portfolio. Downstream delivered adjusted net operating income of $1.1 billion and cash flow of $1.7 billion, increasing by almost $500 million year-on-year as good availability of assets allowed the Company to successfully capture improved refining margins in Europe. (1) Refer to Glossary pages 23 & 24 for the definitions and further information on alternative performance measures (Non-GAAP measures) and to page 19 and following for reconciliation tables. 3Q25 2Q25 Change vs 2Q25 9M25 Change vs 9M24 Cash flow from operations excluding working capital (CFFO)(1) (B$) 7.1 6.6 +7% 20.7 -9% Adjusted net income (TotalEnergies share)(1) - in billions of dollars (B$) 4.0 3.6 +11% 11.8 -15% - in dollars per share (fully-diluted) 1.77 1.57 +13% 5.17 -12% Net income (TotalEnergies share) (B$) 3.7 2.7 +37% 10.2 -13% Adjusted EBITDA(1) (B$) 10.3 9.7 +6% 30.5 -7% 1 |
| In the third quarter 2025, net investments reached $3.1 billion, benefiting from around $400 million of disposals net of acquisitions. Gearing at the end of the third quarter now stands at 17.3%, improving by 0.6% compared to the end of the second quarter 2025, benefiting from a $1.3 billion positive contribution of working capital. Upon observing the Company’s ability to deliver on its energy production growth objective, the Board of Directors has decided the distribution of the third interim dividend of 0.85 €/share for fiscal year 2025, an increase close to 7.6% compared to 2024 and at the same level as previous interim dividends. As announced on September 24th, the Board of Directors authorized share buybacks for up to $1.5 billion for the fourth quarter of 2025. The Board of Directors also approved the effective termination of its ADR (American Depositary Receipts) program, wherein the ADRs will be transformed into ordinary shares that will be listed on the NYSE from December 8, 2025.” 2 |
| 1. Highlights (2)* Upstream Start-up of Begonia and CLOV Phase 3 offshore fields, for a combined capacity of 60,000 b/d, in Angola Launch of Ratawi full field redevelopment phase 2 and of the construction of seawater treatment plant construction, part of the GGIP project in Iraq Divestment of interests in two unconventional blocks in the Vaca Muerta, in Argentina Divestment of interests in three Ekofisk satellite fields, in Norway Appointment of Nicola Mavilla as Senior Vice President Exploration Award of Nzombo offshore exploration license, in Congo Award of two offshore exploration blocks, in Nigeria Award of four offshore exploration blocks, in Liberia Integrated LNG FID of RGLNG T4, with a direct stake of 10% and offtake agreement of 1.5Mt/y for 20 years, in Texas Acquisition from Continental Resources of a 49% interest in producing natural gas assets in the Anadarko basin, in the United States Signature of an agreement with KOGAS for the supply of 1Mt/y of LNG over 10 years, starting in 2027 Integrated Power Signature of an agreement for the sale of 50% of a 1.4 GW renewables portfolio, in North America Award of ‘Centre Manche 2’ tender for the development of a 1.5 GW offshore wind project, in France Closing of the sale of 50% of a 270 MW renewables portfolio, in France Signature of an agreement for the sale of GreenFlex, a consulting firm in energy savings, to French Oteis Carbon footprint reduction and low-carbon molecules Transportation and storage of the first CO2 volumes in Northern Lights, in Norway Signature of an agreement for the farm-down of the Bifrost CO2 storage project, in Denmark Joint venture creation with Banque des Territoires to finance the deployment of EV (B2G) charging infrastructure, in France Signature of a memorandum of understanding with Veolia for further cooperation regarding the energy transition and the circular economy Signature of an agreement with NativState for sustainable forestry operations and preservation of carbon sinks, in the United States Innovation and Performance Signature of a partnership with Cognite for the deployment of industrial AI across all of TotalEnergies’ operated Upstream assets worldwide Signature of a strategic partnership with Emerson for the deployment of a global industrial data platform on all of TotalEnergies’ operational sites (2) Some of the transactions mentioned in the highlights remain subject to the agreement of the authorities or to the fulfilment of conditions precedent under the terms of the agreements. 3 |
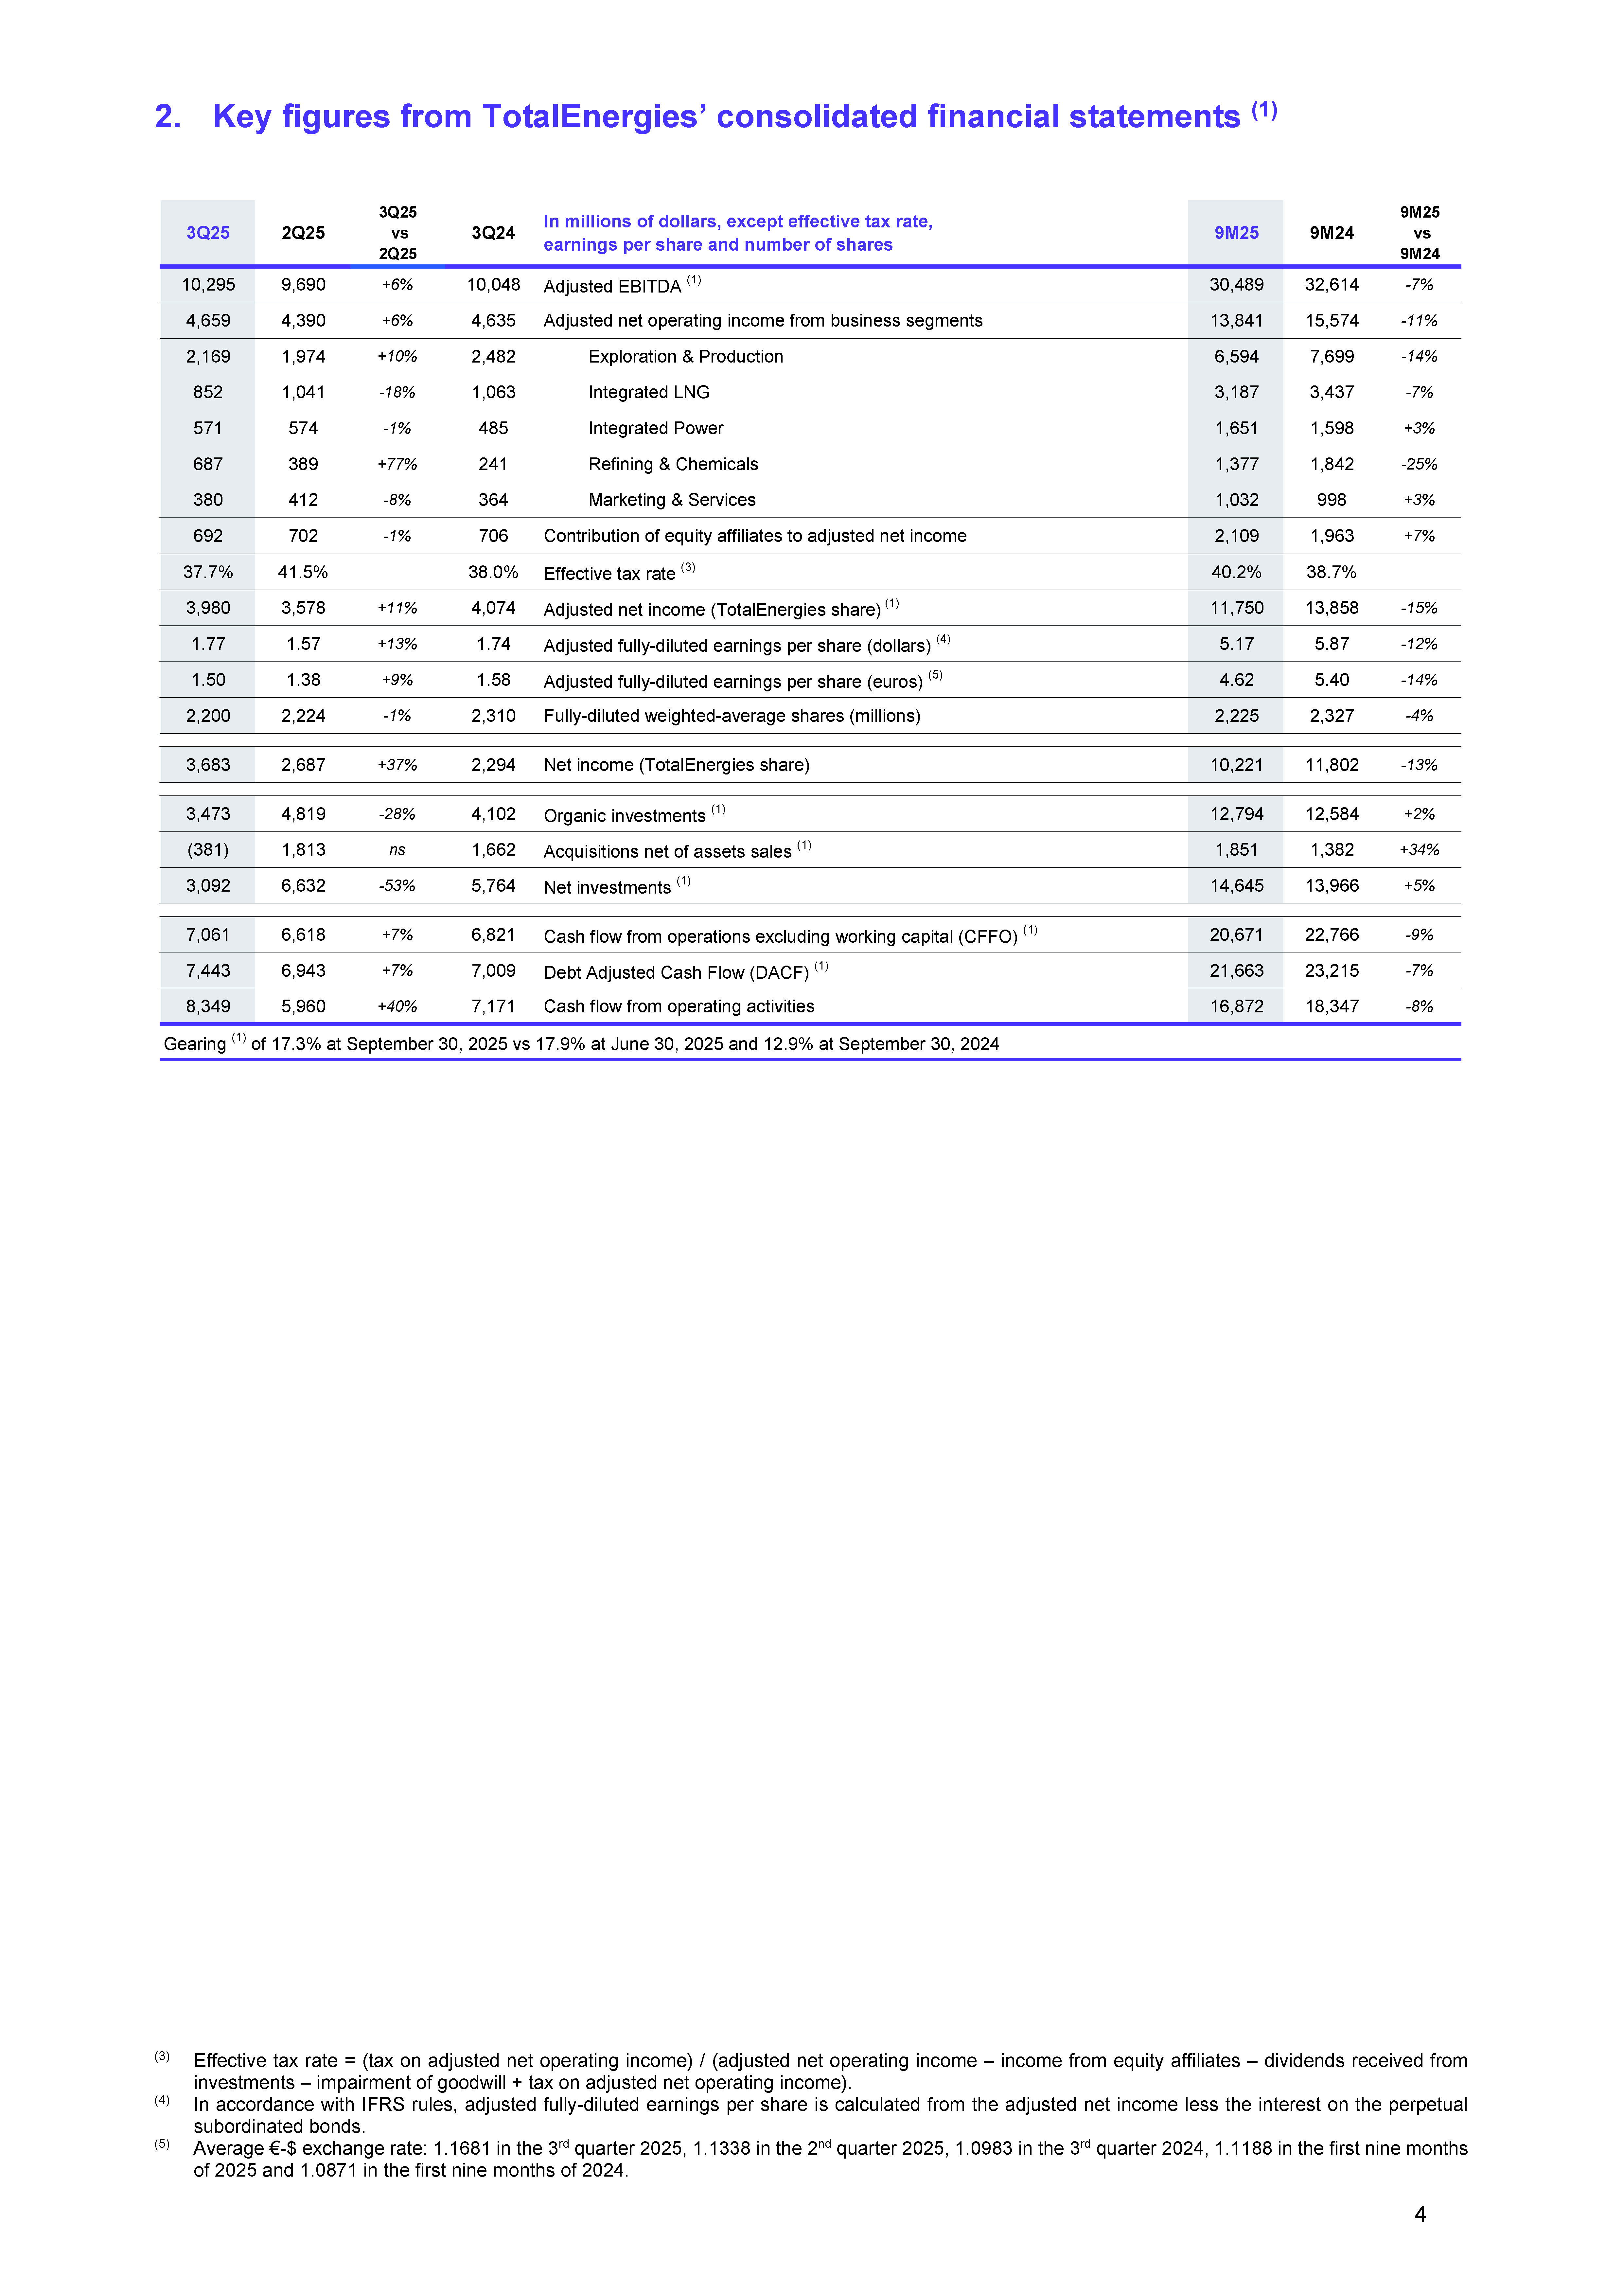
| 2. Key figures from TotalEnergies’ consolidated financial statements (1) * (3) Effective tax rate = (tax on adjusted net operating income) / (adjusted net operating income – income from equity affiliates – dividends received from investments – impairment of goodwill + tax on adjusted net operating income). (4) In accordance with IFRS rules, adjusted fully-diluted earnings per share is calculated from the adjusted net income less the interest on the perpetual subordinated bonds. (5) Average €-$ exchange rate: 1.1681 in the 3rd quarter 2025, 1.1338 in the 2nd quarter 2025, 1.0983 in the 3rd quarter 2024, 1.1188 in the first nine months of 2025 and 1.0871 in the first nine months of 2024. 3Q25 2Q25 3Q25 vs 2Q25 3Q24 In millions of dollars, except effective tax rate, earnings per share and number of shares 9M25 9M24 9M25 vs 9M24 10,295 9,690 +6% 10,048 Adjusted EBITDA (1) 30,489 32,614 -7% 4,659 4,390 +6% 4,635 Adjusted net operating income from business segments 13,841 15,574 -11% 2,169 1,974 +10% 2,482 Exploration & Production 6,594 7,699 -14% 852 1,041 -18% 1,063 Integrated LNG 3,187 3,437 -7% 571 574 -1% 485 Integrated Power 1,651 1,598 +3% 687 389 +77% 241 Refining & Chemicals 1,377 1,842 -25% 380 412 -8% 364 Marketing & Services 1,032 998 +3% 692 702 -1% 706 Contribution of equity affiliates to adjusted net income 2,109 1,963 +7% 37.7% 41.5% 38.0% Effective tax rate (3) 40.2% 38.7% 3,980 3,578 +11% 4,074 Adjusted net income (TotalEnergies share) (1) 11,750 13,858 -15% 1.77 1.57 +13% 1.74 Adjusted fully-diluted earnings per share (dollars) (4) 5.17 5.87 -12% 1.50 1.38 +9% 1.58 Adjusted fully-diluted earnings per share (euros) (5) 4.62 5.40 -14% 2,200 2,224 -1% 2,310 Fully-diluted weighted-average shares (millions) 2,225 2,327 -4% 3,683 2,687 +37% 2,294 Net income (TotalEnergies share) 10,221 11,802 -13% 3,473 4,819 -28% 4,102 Organic investments (1) 12,794 12,584 +2% (381) 1,813 ns 1,662 Acquisitions net of assets sales (1) 1,851 1,382 +34% 3,092 6,632 -53% 5,764 Net investments (1) 14,645 13,966 +5% 7,061 6,618 +7% 6,821 Cash flow from operations excluding working capital (CFFO) (1) 20,671 22,766 -9% 7,443 6,943 +7% 7,009 Debt Adjusted Cash Flow (DACF) (1) 21,663 23,215 -7% 8,349 5,960 +40% 7,171 Cash flow from operating activities 16,872 18,347 -8% Gearing (1) of 17.3% at September 30, 2025 vs 17.9% at June 30, 2025 and 12.9% at September 30, 2024 4 |
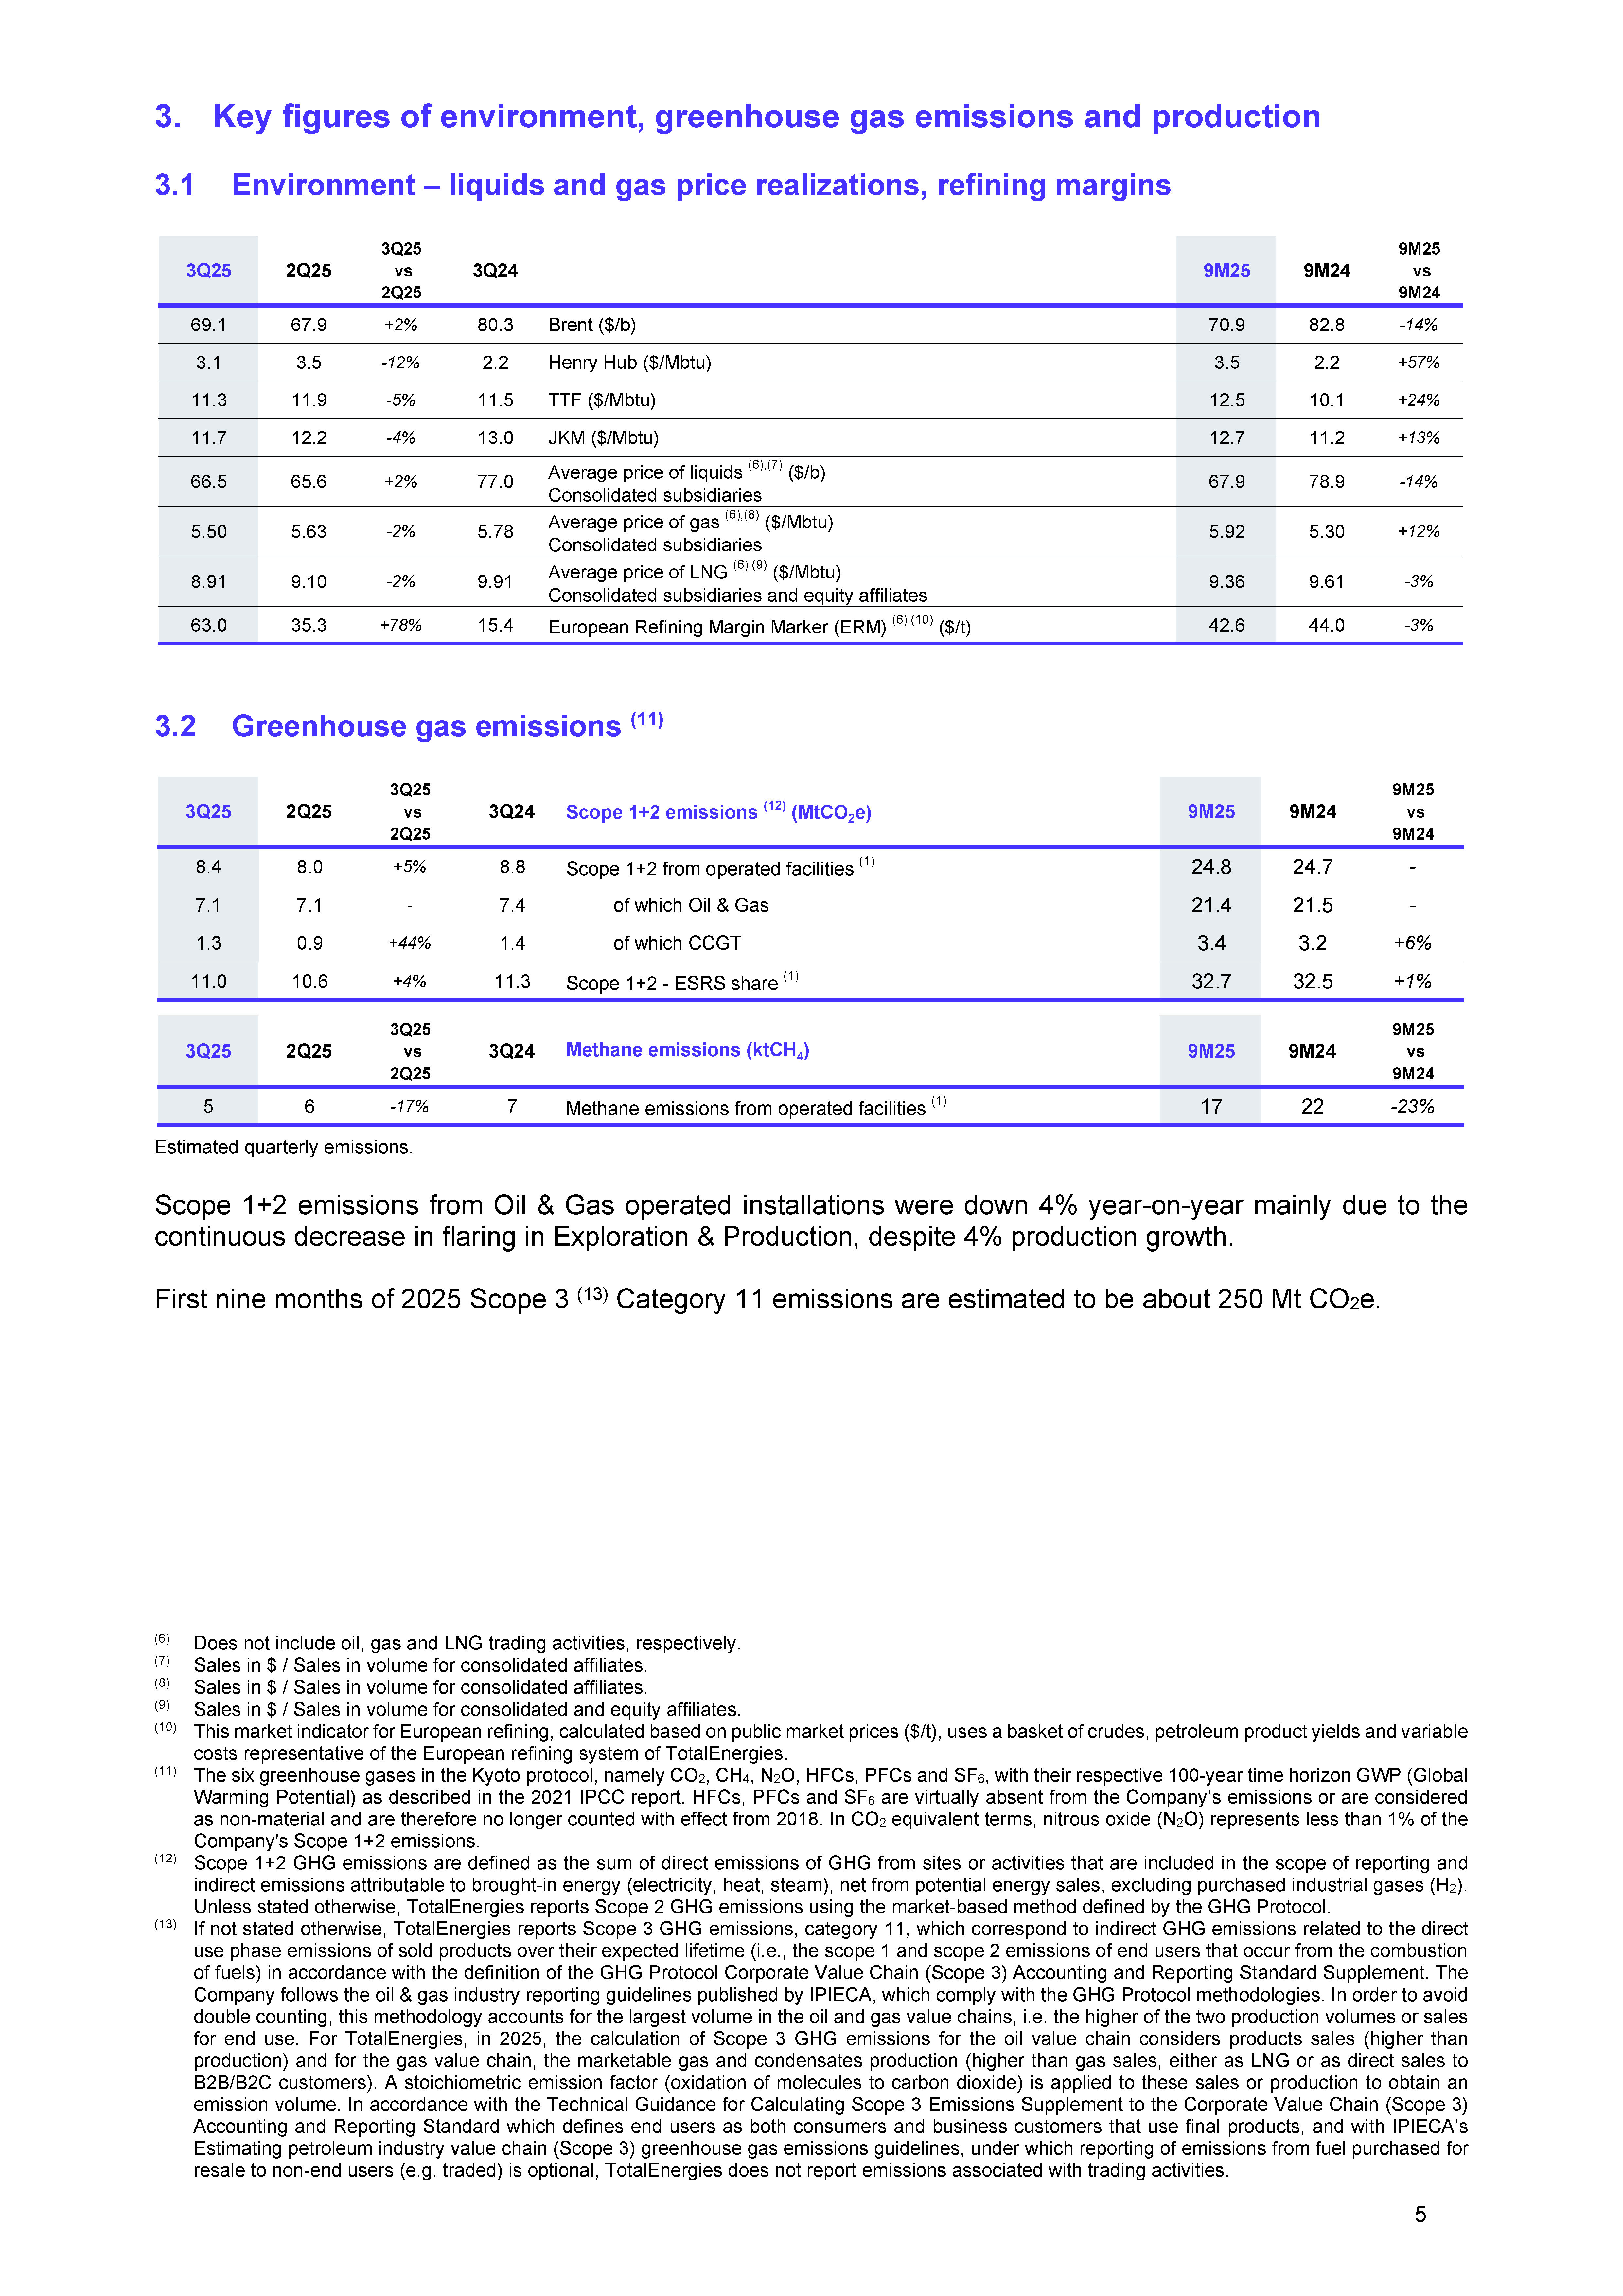
| 3. Key figures of environment, greenhouse gas emissions and production 3.1 Environment – liquids and gas price realizations, refining margins * 3.2 Greenhouse gas emissions (11) Estimated quarterly emissions. Scope 1+2 emissions from Oil & Gas operated installations were down 4% year-on-year mainly due to the continuous decrease in flaring in Exploration & Production, despite 4% production growth. First nine months of 2025 Scope 3 (13) Category 11 emissions are estimated to be about 250 Mt CO2e. (6) Does not include oil, gas and LNG trading activities, respectively. (7) Sales in $ / Sales in volume for consolidated affiliates. (8) Sales in $ / Sales in volume for consolidated affiliates. (9) Sales in $ / Sales in volume for consolidated and equity affiliates. (10) This market indicator for European refining, calculated based on public market prices ($/t), uses a basket of crudes, petroleum product yields and variable costs representative of the European refining system of TotalEnergies. (11) The six greenhouse gases in the Kyoto protocol, namely CO2, CH4, N2O, HFCs, PFCs and SF6, with their respective 100-year time horizon GWP (Global Warming Potential) as described in the 2021 IPCC report. HFCs, PFCs and SF6 are virtually absent from the Company’s emissions or are considered as non-material and are therefore no longer counted with effect from 2018. In CO2 equivalent terms, nitrous oxide (N2O) represents less than 1% of the Company's Scope 1+2 emissions. (12) Scope 1+2 GHG emissions are defined as the sum of direct emissions of GHG from sites or activities that are included in the scope of reporting and indirect emissions attributable to brought-in energy (electricity, heat, steam), net from potential energy sales, excluding purchased industrial gases (H2). Unless stated otherwise, TotalEnergies reports Scope 2 GHG emissions using the market-based method defined by the GHG Protocol. (13) If not stated otherwise, TotalEnergies reports Scope 3 GHG emissions, category 11, which correspond to indirect GHG emissions related to the direct use phase emissions of sold products over their expected lifetime (i.e., the scope 1 and scope 2 emissions of end users that occur from the combustion of fuels) in accordance with the definition of the GHG Protocol Corporate Value Chain (Scope 3) Accounting and Reporting Standard Supplement. The Company follows the oil & gas industry reporting guidelines published by IPIECA, which comply with the GHG Protocol methodologies. In order to avoid double counting, this methodology accounts for the largest volume in the oil and gas value chains, i.e. the higher of the two production volumes or sales for end use. For TotalEnergies, in 2025, the calculation of Scope 3 GHG emissions for the oil value chain considers products sales (higher than production) and for the gas value chain, the marketable gas and condensates production (higher than gas sales, either as LNG or as direct sales to B2B/B2C customers). A stoichiometric emission factor (oxidation of molecules to carbon dioxide) is applied to these sales or production to obtain an emission volume. In accordance with the Technical Guidance for Calculating Scope 3 Emissions Supplement to the Corporate Value Chain (Scope 3) Accounting and Reporting Standard which defines end users as both consumers and business customers that use final products, and with IPIECA’s Estimating petroleum industry value chain (Scope 3) greenhouse gas emissions guidelines, under which reporting of emissions from fuel purchased for resale to non-end users (e.g. traded) is optional, TotalEnergies does not report emissions associated with trading activities. 3Q25 2Q25 3Q25 vs 2Q25 3Q24 9M25 9M24 9M25 vs 9M24 69.1 67.9 +2% 80.3 Brent ($/b) 70.9 82.8 -14% 3.1 3.5 -12% 2.2 Henry Hub ($/Mbtu) 3.5 2.2 +57% 11.3 11.9 -5% 11.5 TTF ($/Mbtu) 12.5 10.1 +24% 11.7 12.2 -4% 13.0 JKM ($/Mbtu) 12.7 11.2 +13% 66.5 65.6 +2% 77.0 Average price of liquids (6),(7) ($/b) Consolidated subsidiaries 67.9 78.9 -14% 5.50 5.63 -2% 5.78 Average price of gas (6),(8) ($/Mbtu) Consolidated subsidiaries 5.92 5.30 +12% 8.91 9.10 -2% 9.91 Average price of LNG (6),(9) ($/Mbtu) Consolidated subsidiaries and equity affiliates 9.36 9.61 -3% 63.0 35.3 +78% 15.4 European Refining Margin Marker (ERM) (6),(10) ($/t) 42.6 44.0 -3% 3Q25 2Q25 3Q25 vs 2Q25 3Q24 Scope 1+2 emissions (12) (MtCO2e) 9M25 9M24 9M25 vs 9M24 8.4 8.0 +5% 8.8 Scope 1+2 from operated facilities (1) 24.8 24.7 - 7.1 7.1 - 7.4 of which Oil & Gas 21.4 21.5 - 1.3 0.9 +44% 1.4 of which CCGT 3.4 3.2 +6% 11.0 10.6 +4% 11.3 Scope 1+2 - ESRS share (1) 32.7 32.5 +1% 3Q25 2Q25 3Q25 vs 2Q25 3Q24 Methane emissions (ktCH4 ) 9M25 9M24 9M25 vs 9M24 5 6 -17% 7 Methane emissions from operated facilities (1) 17 22 -23% 5 |
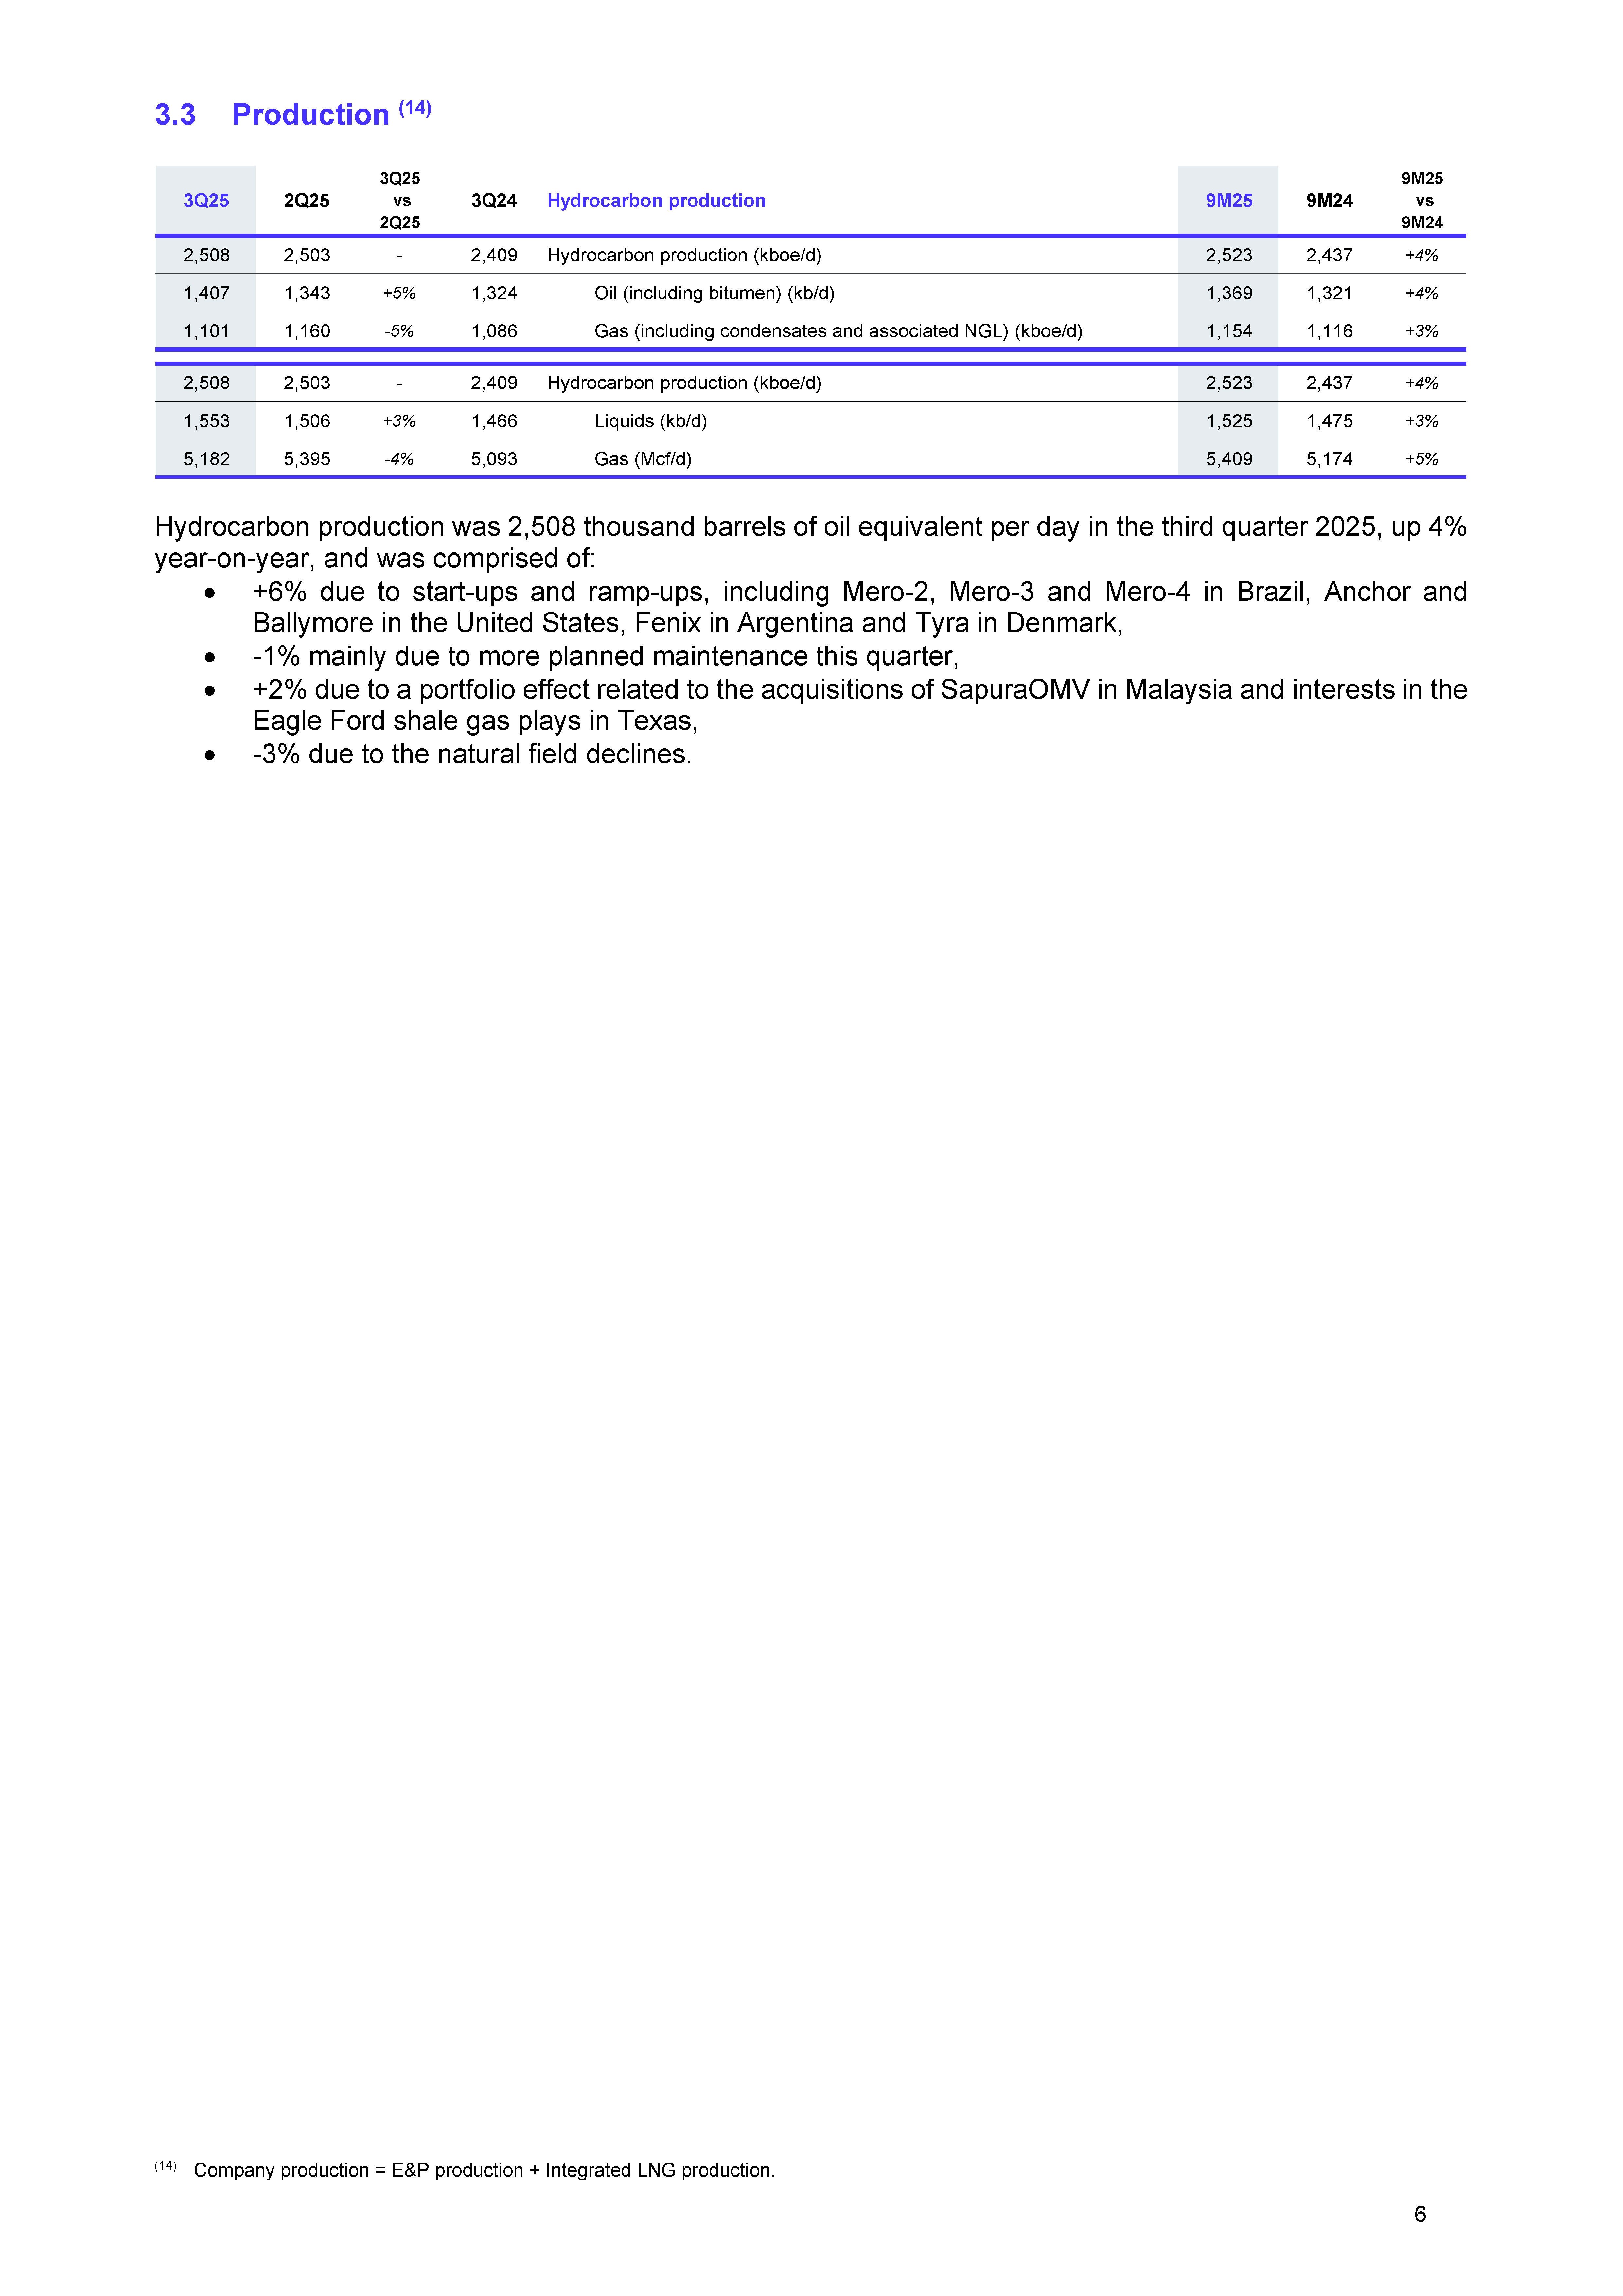
| 3.3 Production (14)* Hydrocarbon production was 2,508 thousand barrels of oil equivalent per day in the third quarter 2025, up 4% year-on-year, and was comprised of: +6% due to start-ups and ramp-ups, including Mero-2, Mero-3 and Mero-4 in Brazil, Anchor and Ballymore in the United States, Fenix in Argentina and Tyra in Denmark, -1% mainly due to more planned maintenance this quarter, +2% due to a portfolio effect related to the acquisitions of SapuraOMV in Malaysia and interests in the Eagle Ford shale gas plays in Texas, -3% due to the natural field declines. (14) Company production = E&P production + Integrated LNG production. 3Q25 2Q25 3Q25 vs 2Q25 3Q24 Hydrocarbon production 9M25 9M24 9M25 vs 9M24 2,508 2,503 - 2,409 Hydrocarbon production (kboe/d) 2,523 2,437 +4% 1,407 1,343 +5% 1,324 Oil (including bitumen) (kb/d) 1,369 1,321 +4% 1,101 1,160 -5% 1,086 Gas (including condensates and associated NGL) (kboe/d) 1,154 1,116 +3% 2,508 2,503 - 2,409 Hydrocarbon production (kboe/d) 2,523 2,437 +4% 1,553 1,506 +3% 1,466 Liquids (kb/d) 1,525 1,475 +3% 5,182 5,395 -4% 5,093 Gas (Mcf/d) 5,409 5,174 +5% 6 |
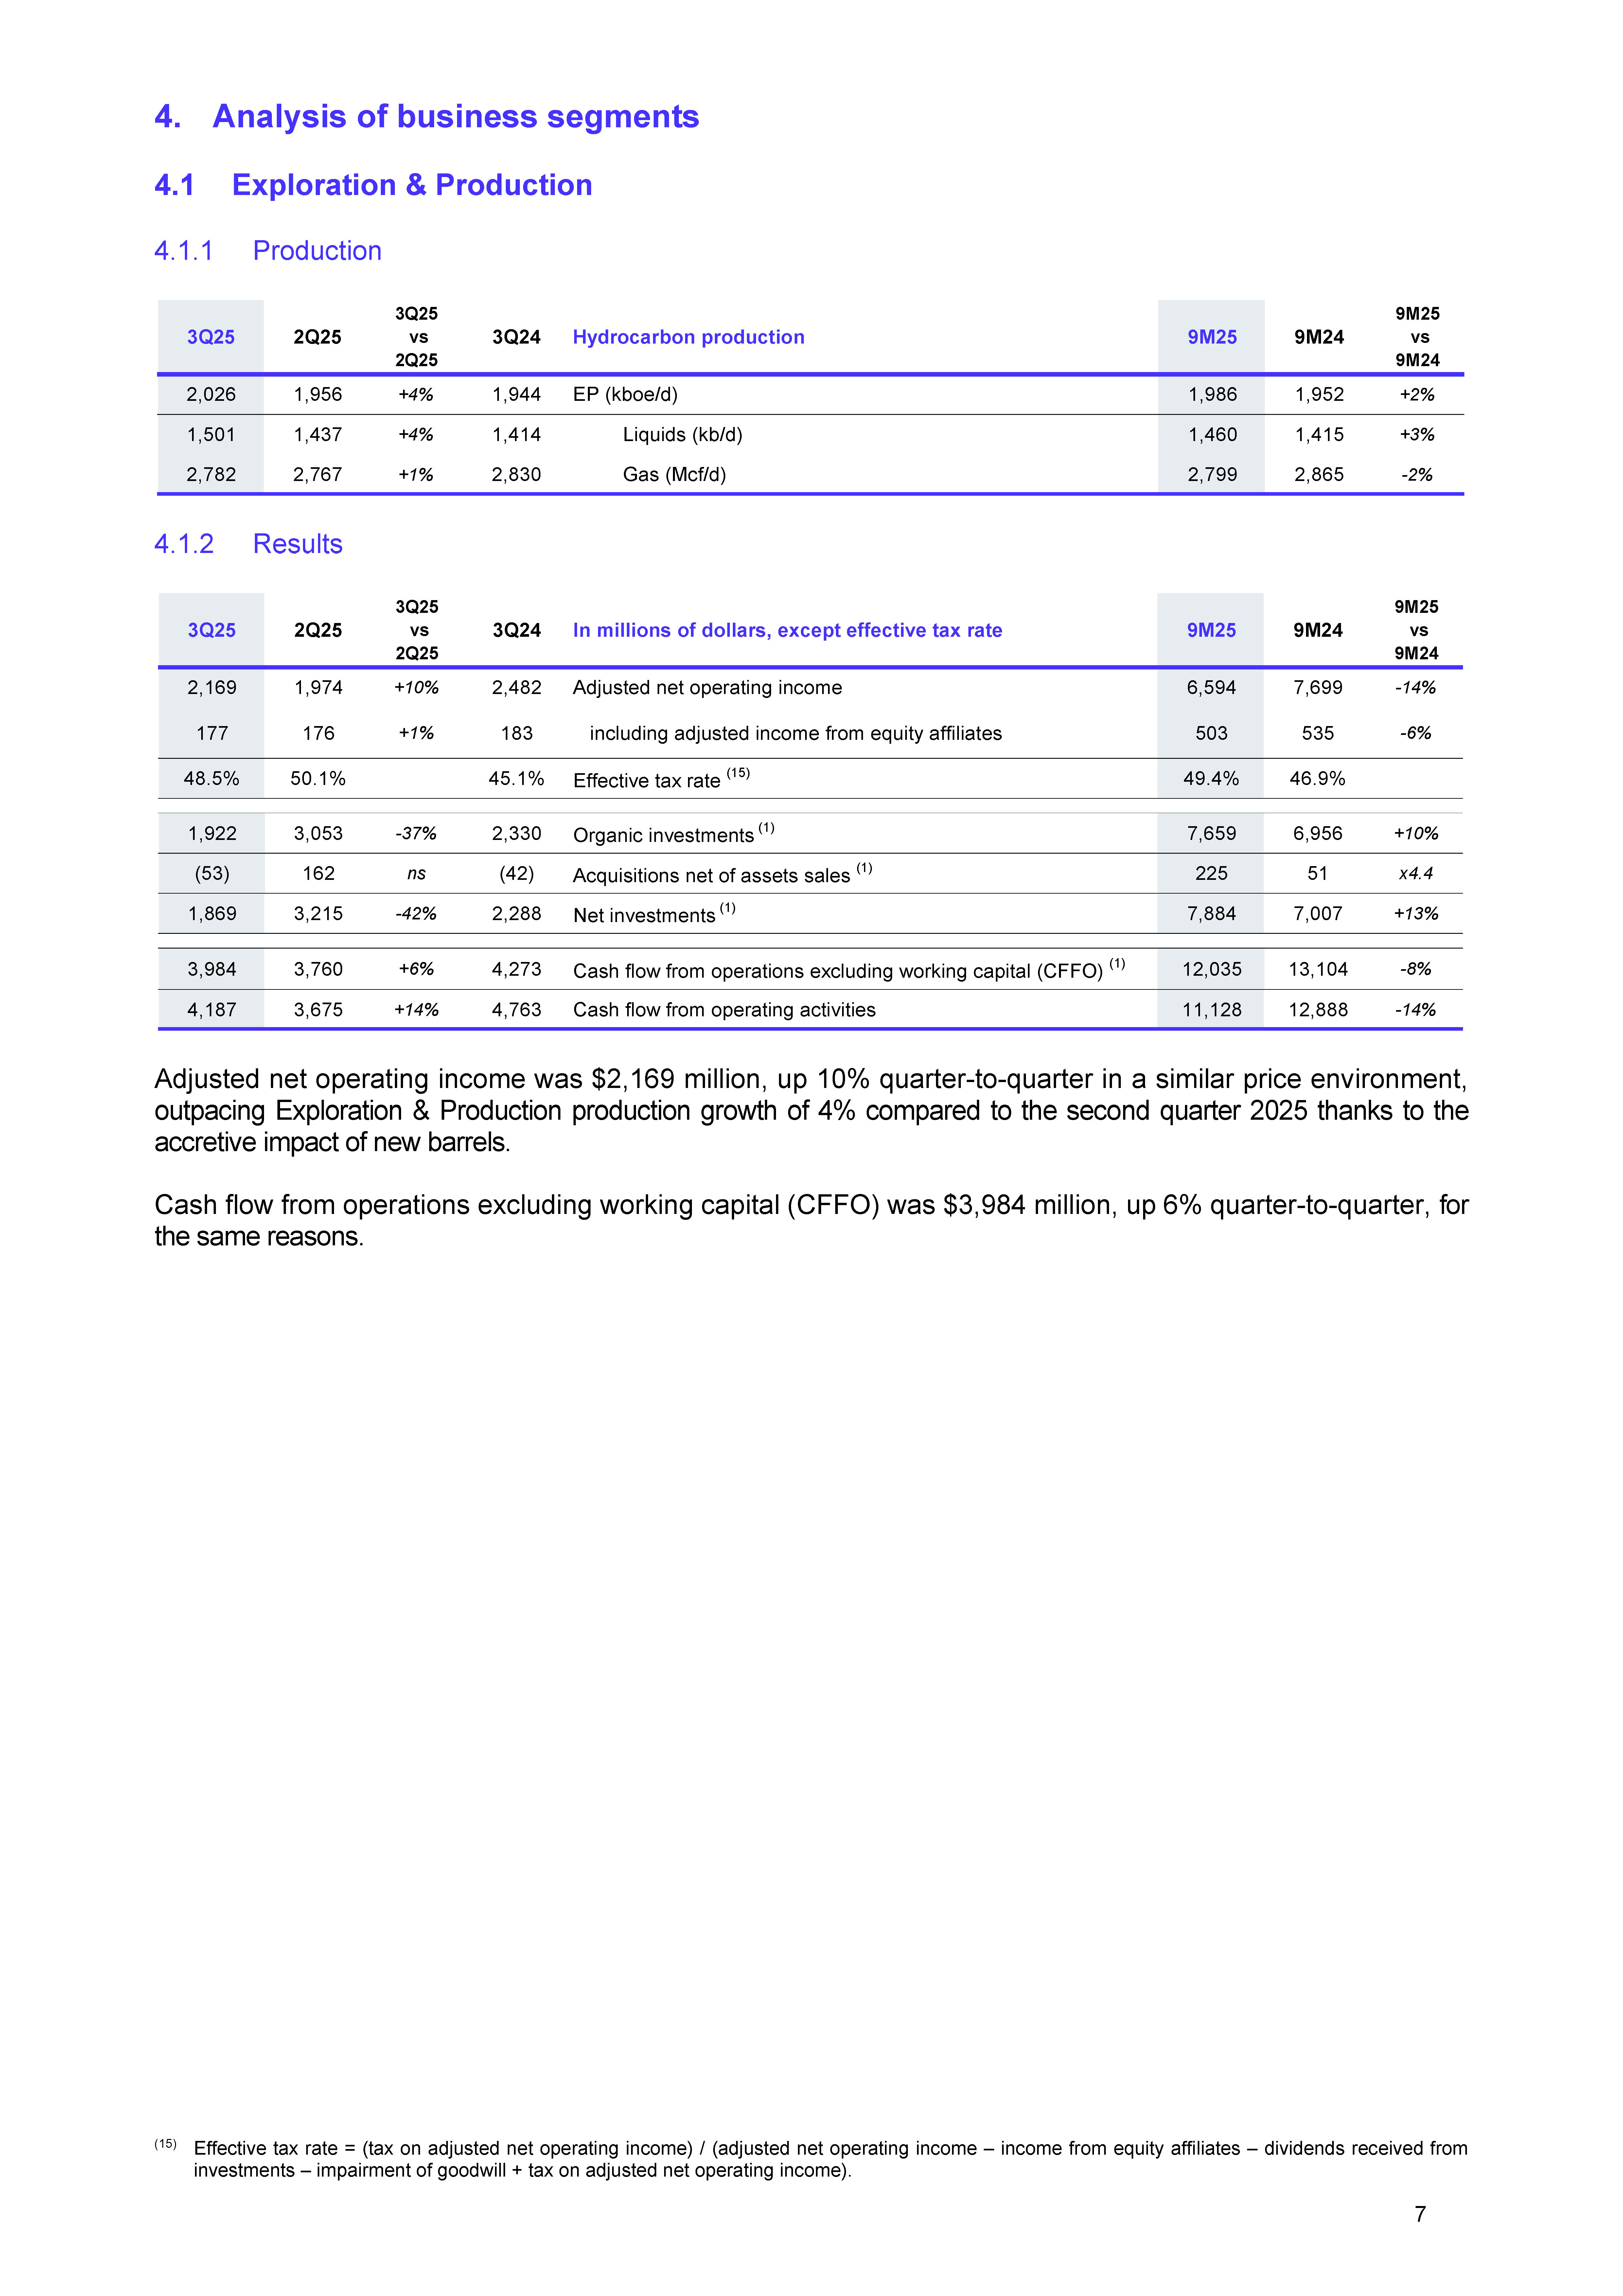
| 4. Analysis of business segments 4.1 Exploration & Production 4.1.1 Production 4.1.2 Results * Adjusted net operating income was $2,169 million, up 10% quarter-to-quarter in a similar price environment, outpacing Exploration & Production production growth of 4% compared to the second quarter 2025 thanks to the accretive impact of new barrels. Cash flow from operations excluding working capital (CFFO) was $3,984 million, up 6% quarter-to-quarter, for the same reasons. (15) Effective tax rate = (tax on adjusted net operating income) / (adjusted net operating income – income from equity affiliates – dividends received from investments – impairment of goodwill + tax on adjusted net operating income). 3Q25 2Q25 3Q25 vs 2Q25 3Q24 Hydrocarbon production 9M25 9M24 9M25 vs 9M24 2,026 1,956 +4% 1,944 EP (kboe/d) 1,986 1,952 +2% 1,501 1,437 +4% 1,414 Liquids (kb/d) 1,460 1,415 +3% 2,782 2,767 +1% 2,830 Gas (Mcf/d) 2,799 2,865 -2% 3Q25 2Q25 3Q25 vs 2Q25 3Q24 In millions of dollars, except effective tax rate 9M25 9M24 9M25 vs 9M24 2,169 1,974 +10% 2,482 Adjusted net operating income 6,594 7,699 -14% 177 176 +1% 183 including adjusted income from equity affiliates 503 535 -6% 48.5% 50.1% 45.1% Effective tax rate (15) 49.4% 46.9% 1,922 3,053 -37% 2,330 Organic investments (1) 7,659 6,956 +10% (53) 162 ns (42) Acquisitions net of assets sales (1) 225 51 x4.4 1,869 3,215 -42% 2,288 Net investments (1) 7,884 7,007 +13% 3,984 3,760 +6% 4,273 Cash flow from operations excluding working capital (CFFO) (1) 12,035 13,104 -8% 4,187 3,675 +14% 4,763 Cash flow from operating activities 11,128 12,888 -14% 7 |
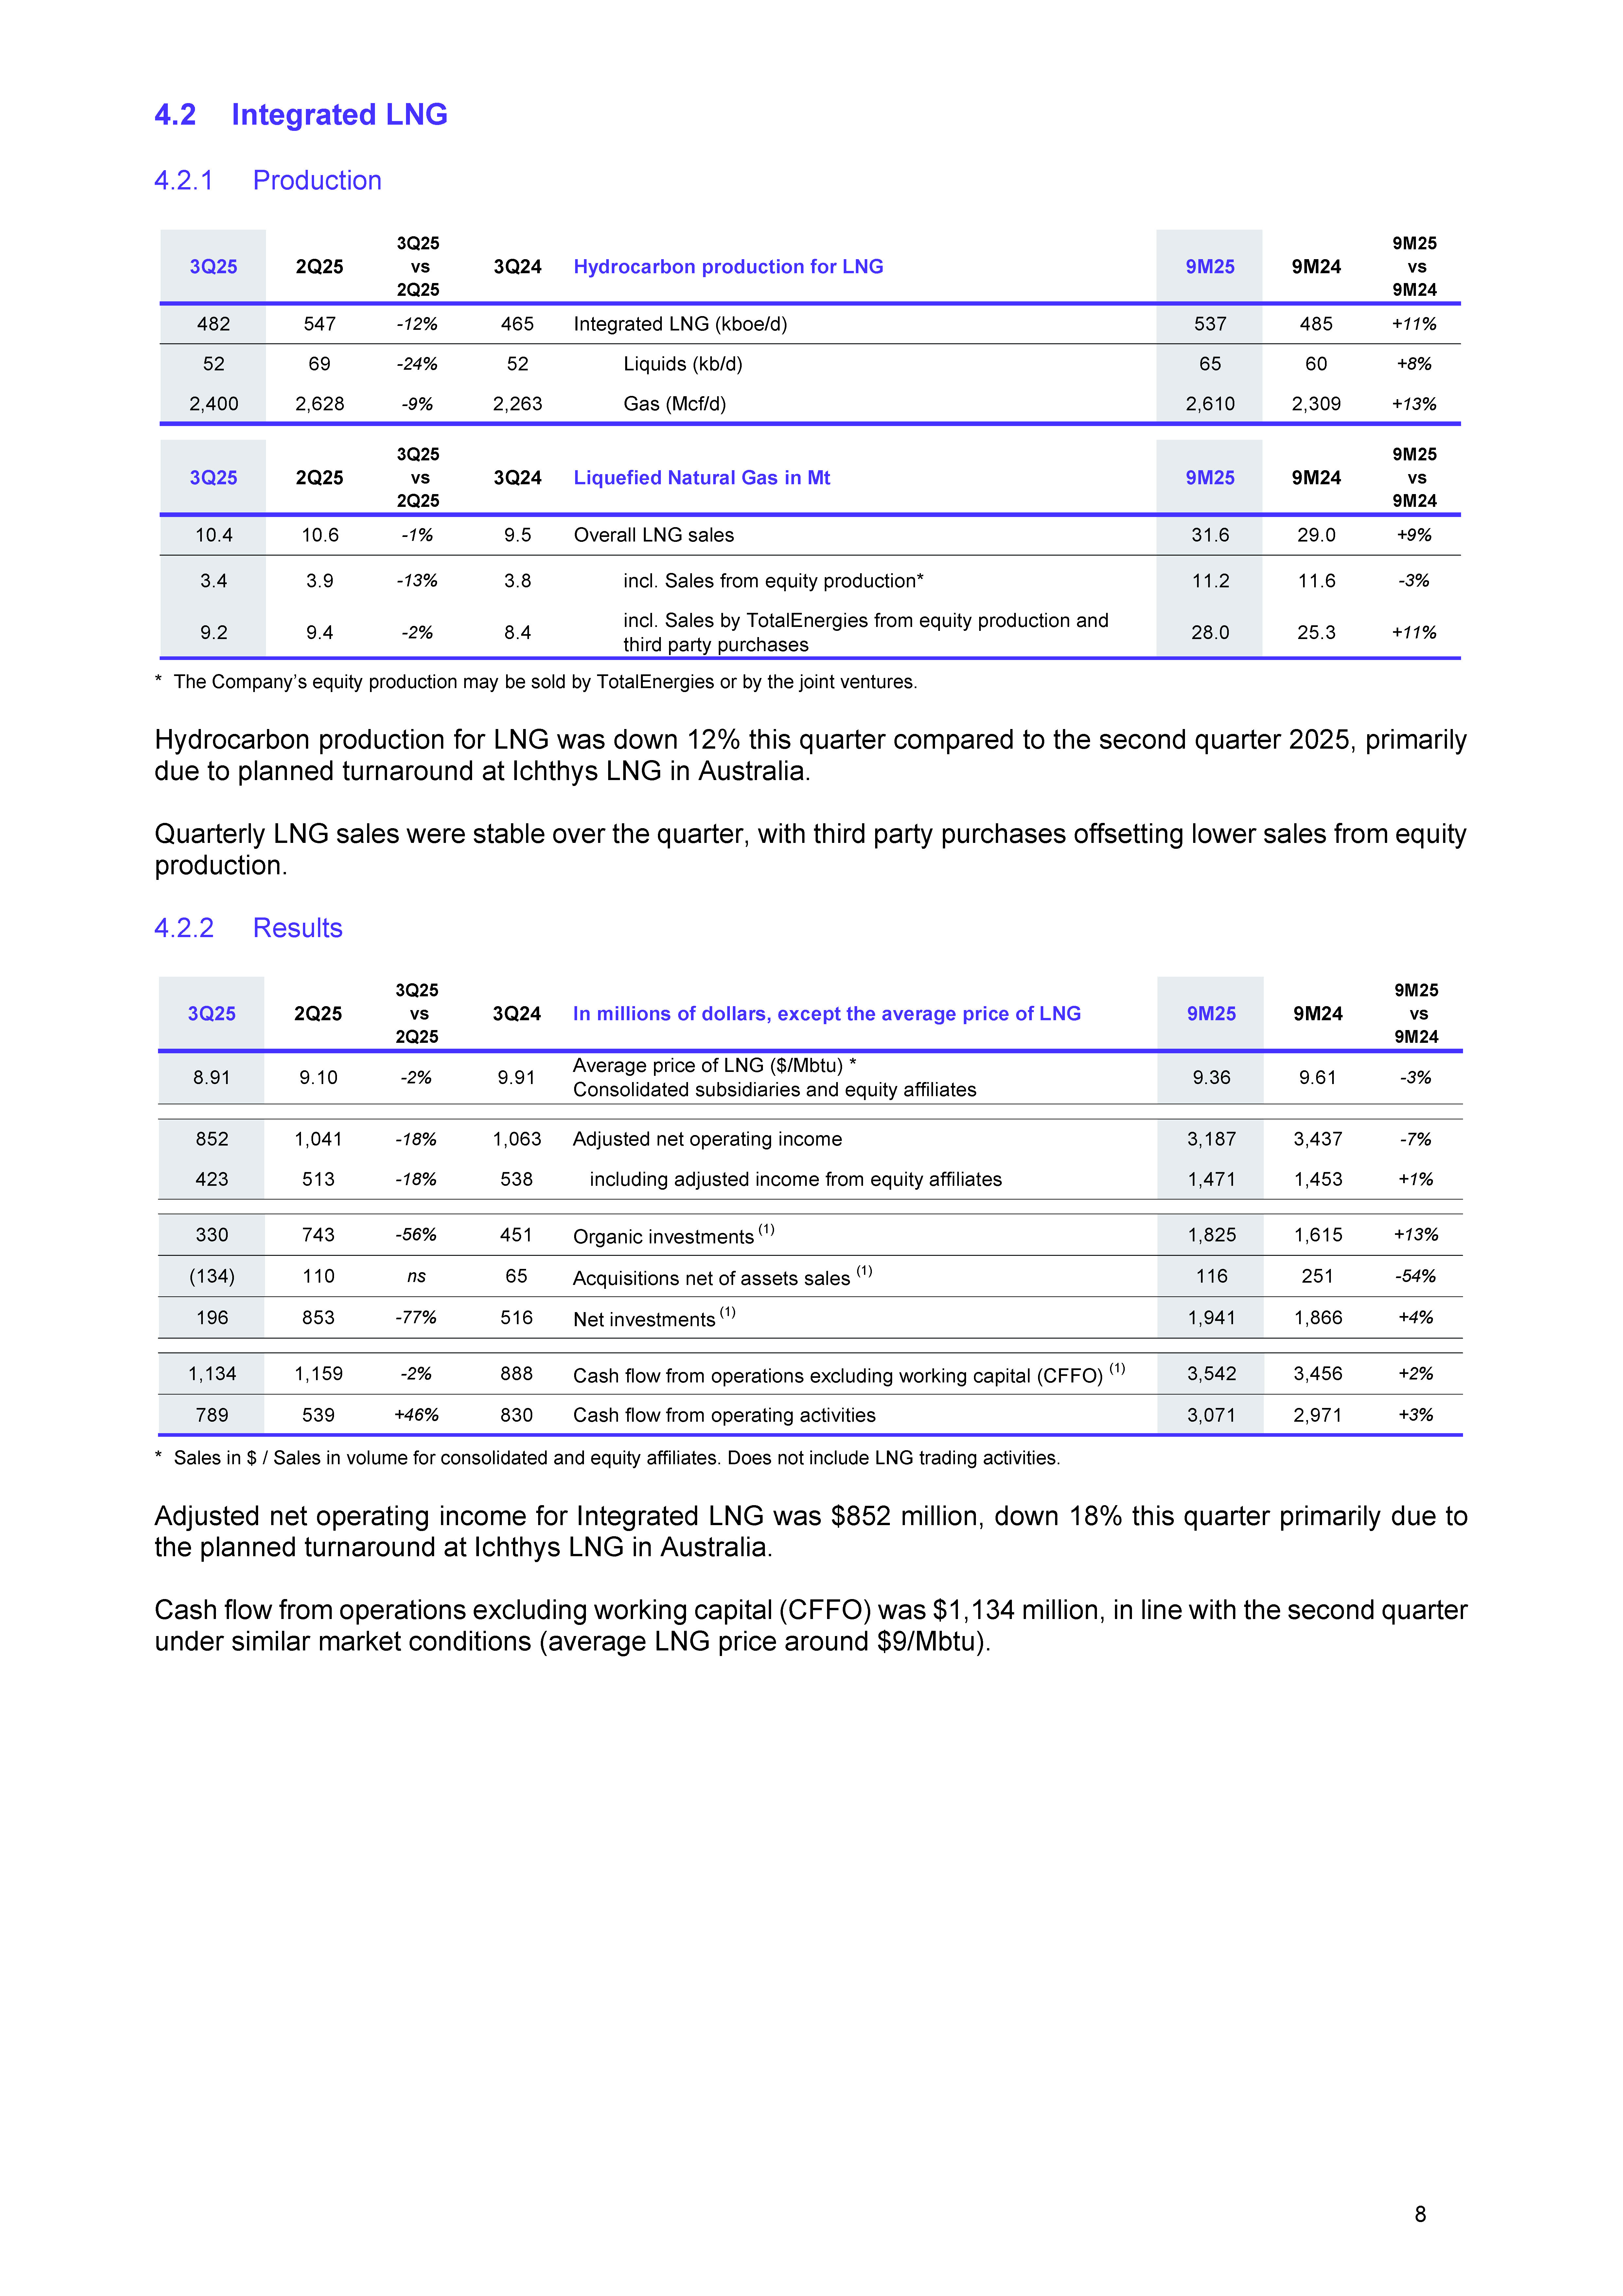
| 4.2 Integrated LNG 4.2.1 Production * The Company’s equity production may be sold by TotalEnergies or by the joint ventures. Hydrocarbon production for LNG was down 12% this quarter compared to the second quarter 2025, primarily due to planned turnaround at Ichthys LNG in Australia. Quarterly LNG sales were stable over the quarter, with third party purchases offsetting lower sales from equity production. 4.2.2 Results * Sales in $ / Sales in volume for consolidated and equity affiliates. Does not include LNG trading activities. Adjusted net operating income for Integrated LNG was $852 million, down 18% this quarter primarily due to the planned turnaround at Ichthys LNG in Australia. Cash flow from operations excluding working capital (CFFO) was $1,134 million, in line with the second quarter under similar market conditions (average LNG price around $9/Mbtu). 3Q25 2Q25 3Q25 vs 2Q25 3Q24 Hydrocarbon production for LNG 9M25 9M24 9M25 vs 9M24 482 547 -12% 465 Integrated LNG (kboe/d) 537 485 +11% 52 69 -24% 52 Liquids (kb/d) 65 60 +8% 2,400 2,628 -9% 2,263 Gas (Mcf/d) 2,610 2,309 +13% 3Q25 2Q25 3Q25 vs 2Q25 3Q24 Liquefied Natural Gas in Mt 9M25 9M24 9M25 vs 9M24 10.4 10.6 -1% 9.5 Overall LNG sales 31.6 29.0 +9% 3.4 3.9 -13% 3.8 incl. Sales from equity production* 11.2 11.6 -3% 9.2 9.4 -2% 8.4 incl. Sales by TotalEnergies from equity production and third party purchases 28.0 25.3 +11% 3Q25 2Q25 3Q25 vs 2Q25 3Q24 In millions of dollars, except the average price of LNG 9M25 9M24 9M25 vs 9M24 8.91 9.10 -2% 9.91 Average price of LNG ($/Mbtu) * Consolidated subsidiaries and equity affiliates 9.36 9.61 -3% 852 1,041 -18% 1,063 Adjusted net operating income 3,187 3,437 -7% 423 513 -18% 538 including adjusted income from equity affiliates 1,471 1,453 +1% 330 743 -56% 451 Organic investments (1) 1,825 1,615 +13% (134) 110 ns 65 Acquisitions net of assets sales (1) 116 251 -54% 196 853 -77% 516 Net investments (1) 1,941 1,866 +4% 1,134 1,159 -2% 888 Cash flow from operations excluding working capital (CFFO) (1) 3,542 3,456 +2% 789 539 +46% 830 Cash flow from operating activities 3,071 2,971 +3% 8 |
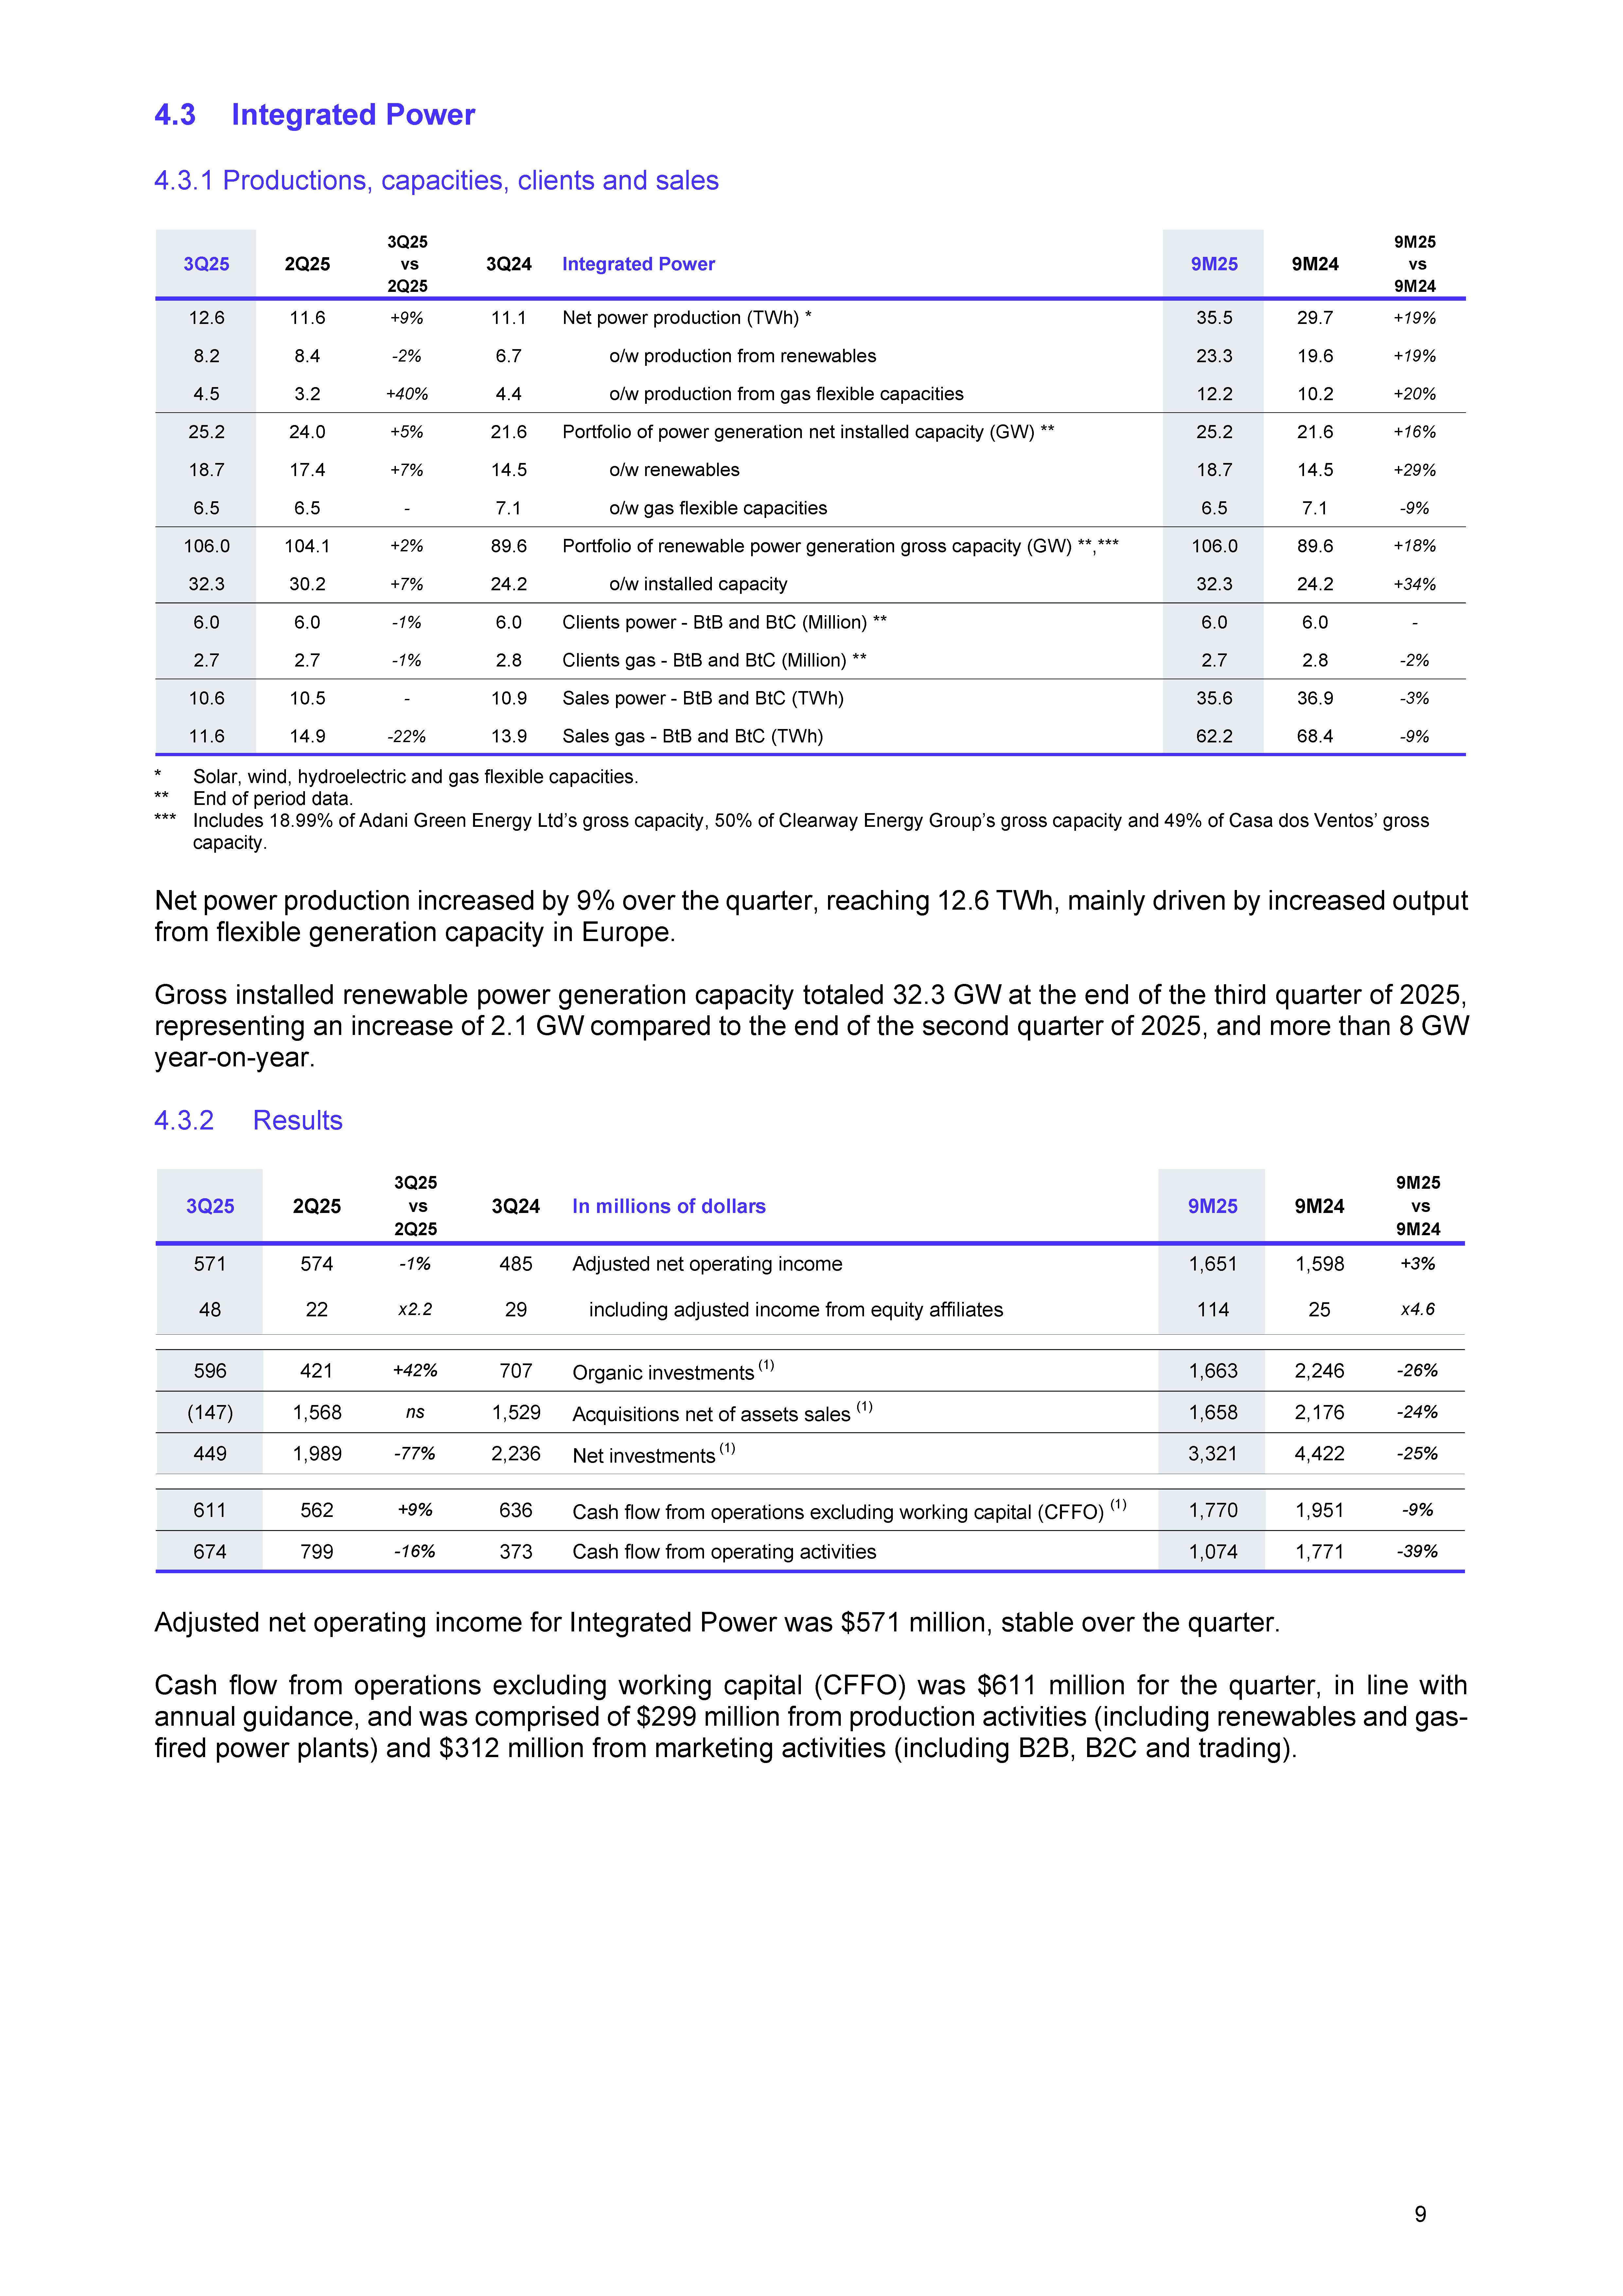
| 4.3 Integrated Power 4.3.1 Productions, capacities, clients and sales * Solar, wind, hydroelectric and gas flexible capacities. ** End of period data. *** Includes 18.99% of Adani Green Energy Ltd’s gross capacity, 50% of Clearway Energy Group’s gross capacity and 49% of Casa dos Ventos’ gross capacity. Net power production increased by 9% over the quarter, reaching 12.6 TWh, mainly driven by increased output from flexible generation capacity in Europe. Gross installed renewable power generation capacity totaled 32.3 GW at the end of the third quarter of 2025, representing an increase of 2.1 GW compared to the end of the second quarter of 2025, and more than 8 GW year-on-year. 4.3.2 Results Adjusted net operating income for Integrated Power was $571 million, stable over the quarter. Cash flow from operations excluding working capital (CFFO) was $611 million for the quarter, in line with annual guidance, and was comprised of $299 million from production activities (including renewables and gas-fired power plants) and $312 million from marketing activities (including B2B, B2C and trading). 3Q25 2Q25 3Q25 vs 2Q25 3Q24 Integrated Power 9M25 9M24 9M25 vs 9M24 12.6 11.6 +9% 11.1 Net power production (TWh) * 35.5 29.7 +19% 8.2 8.4 -2% 6.7 o/w production from renewables 23.3 19.6 +19% 4.5 3.2 +40% 4.4 o/w production from gas flexible capacities 12.2 10.2 +20% 25.2 24.0 +5% 21.6 Portfolio of power generation net installed capacity (GW) ** 25.2 21.6 +16% 18.7 17.4 +7% 14.5 o/w renewables 18.7 14.5 +29% 6.5 6.5 - 7.1 o/w gas flexible capacities 6.5 7.1 -9% 106.0 104.1 +2% 89.6 Portfolio of renewable power generation gross capacity (GW) **,*** 106.0 89.6 +18% 32.3 30.2 +7% 24.2 o/w installed capacity 32.3 24.2 +34% 6.0 6.0 -1% 6.0 Clients power - BtB and BtC (Million) ** 6.0 6.0 - 2.7 2.7 -1% 2.8 Clients gas - BtB and BtC (Million) ** 2.7 2.8 -2% 10.6 10.5 - 10.9 Sales power - BtB and BtC (TWh) 35.6 36.9 -3% 11.6 14.9 -22% 13.9 Sales gas - BtB and BtC (TWh) 62.2 68.4 -9% 3Q25 2Q25 3Q25 vs 2Q25 3Q24 In millions of dollars 9M25 9M24 9M25 vs 9M24 571 574 -1% 485 Adjusted net operating income 1,651 1,598 +3% 48 22 x2.2 29 including adjusted income from equity affiliates 114 25 x4.6 596 421 +42% 707 Organic investments (1) 1,663 2,246 -26% (147) 1,568 ns 1,529 Acquisitions net of assets sales (1) 1,658 2,176 -24% 449 1,989 -77% 2,236 Net investments (1) 3,321 4,422 -25% 611 562 +9% 636 Cash flow from operations excluding working capital (CFFO) (1) 1,770 1,951 -9% 674 799 -16% 373 Cash flow from operating activities 1,074 1,771 -39% 9 |
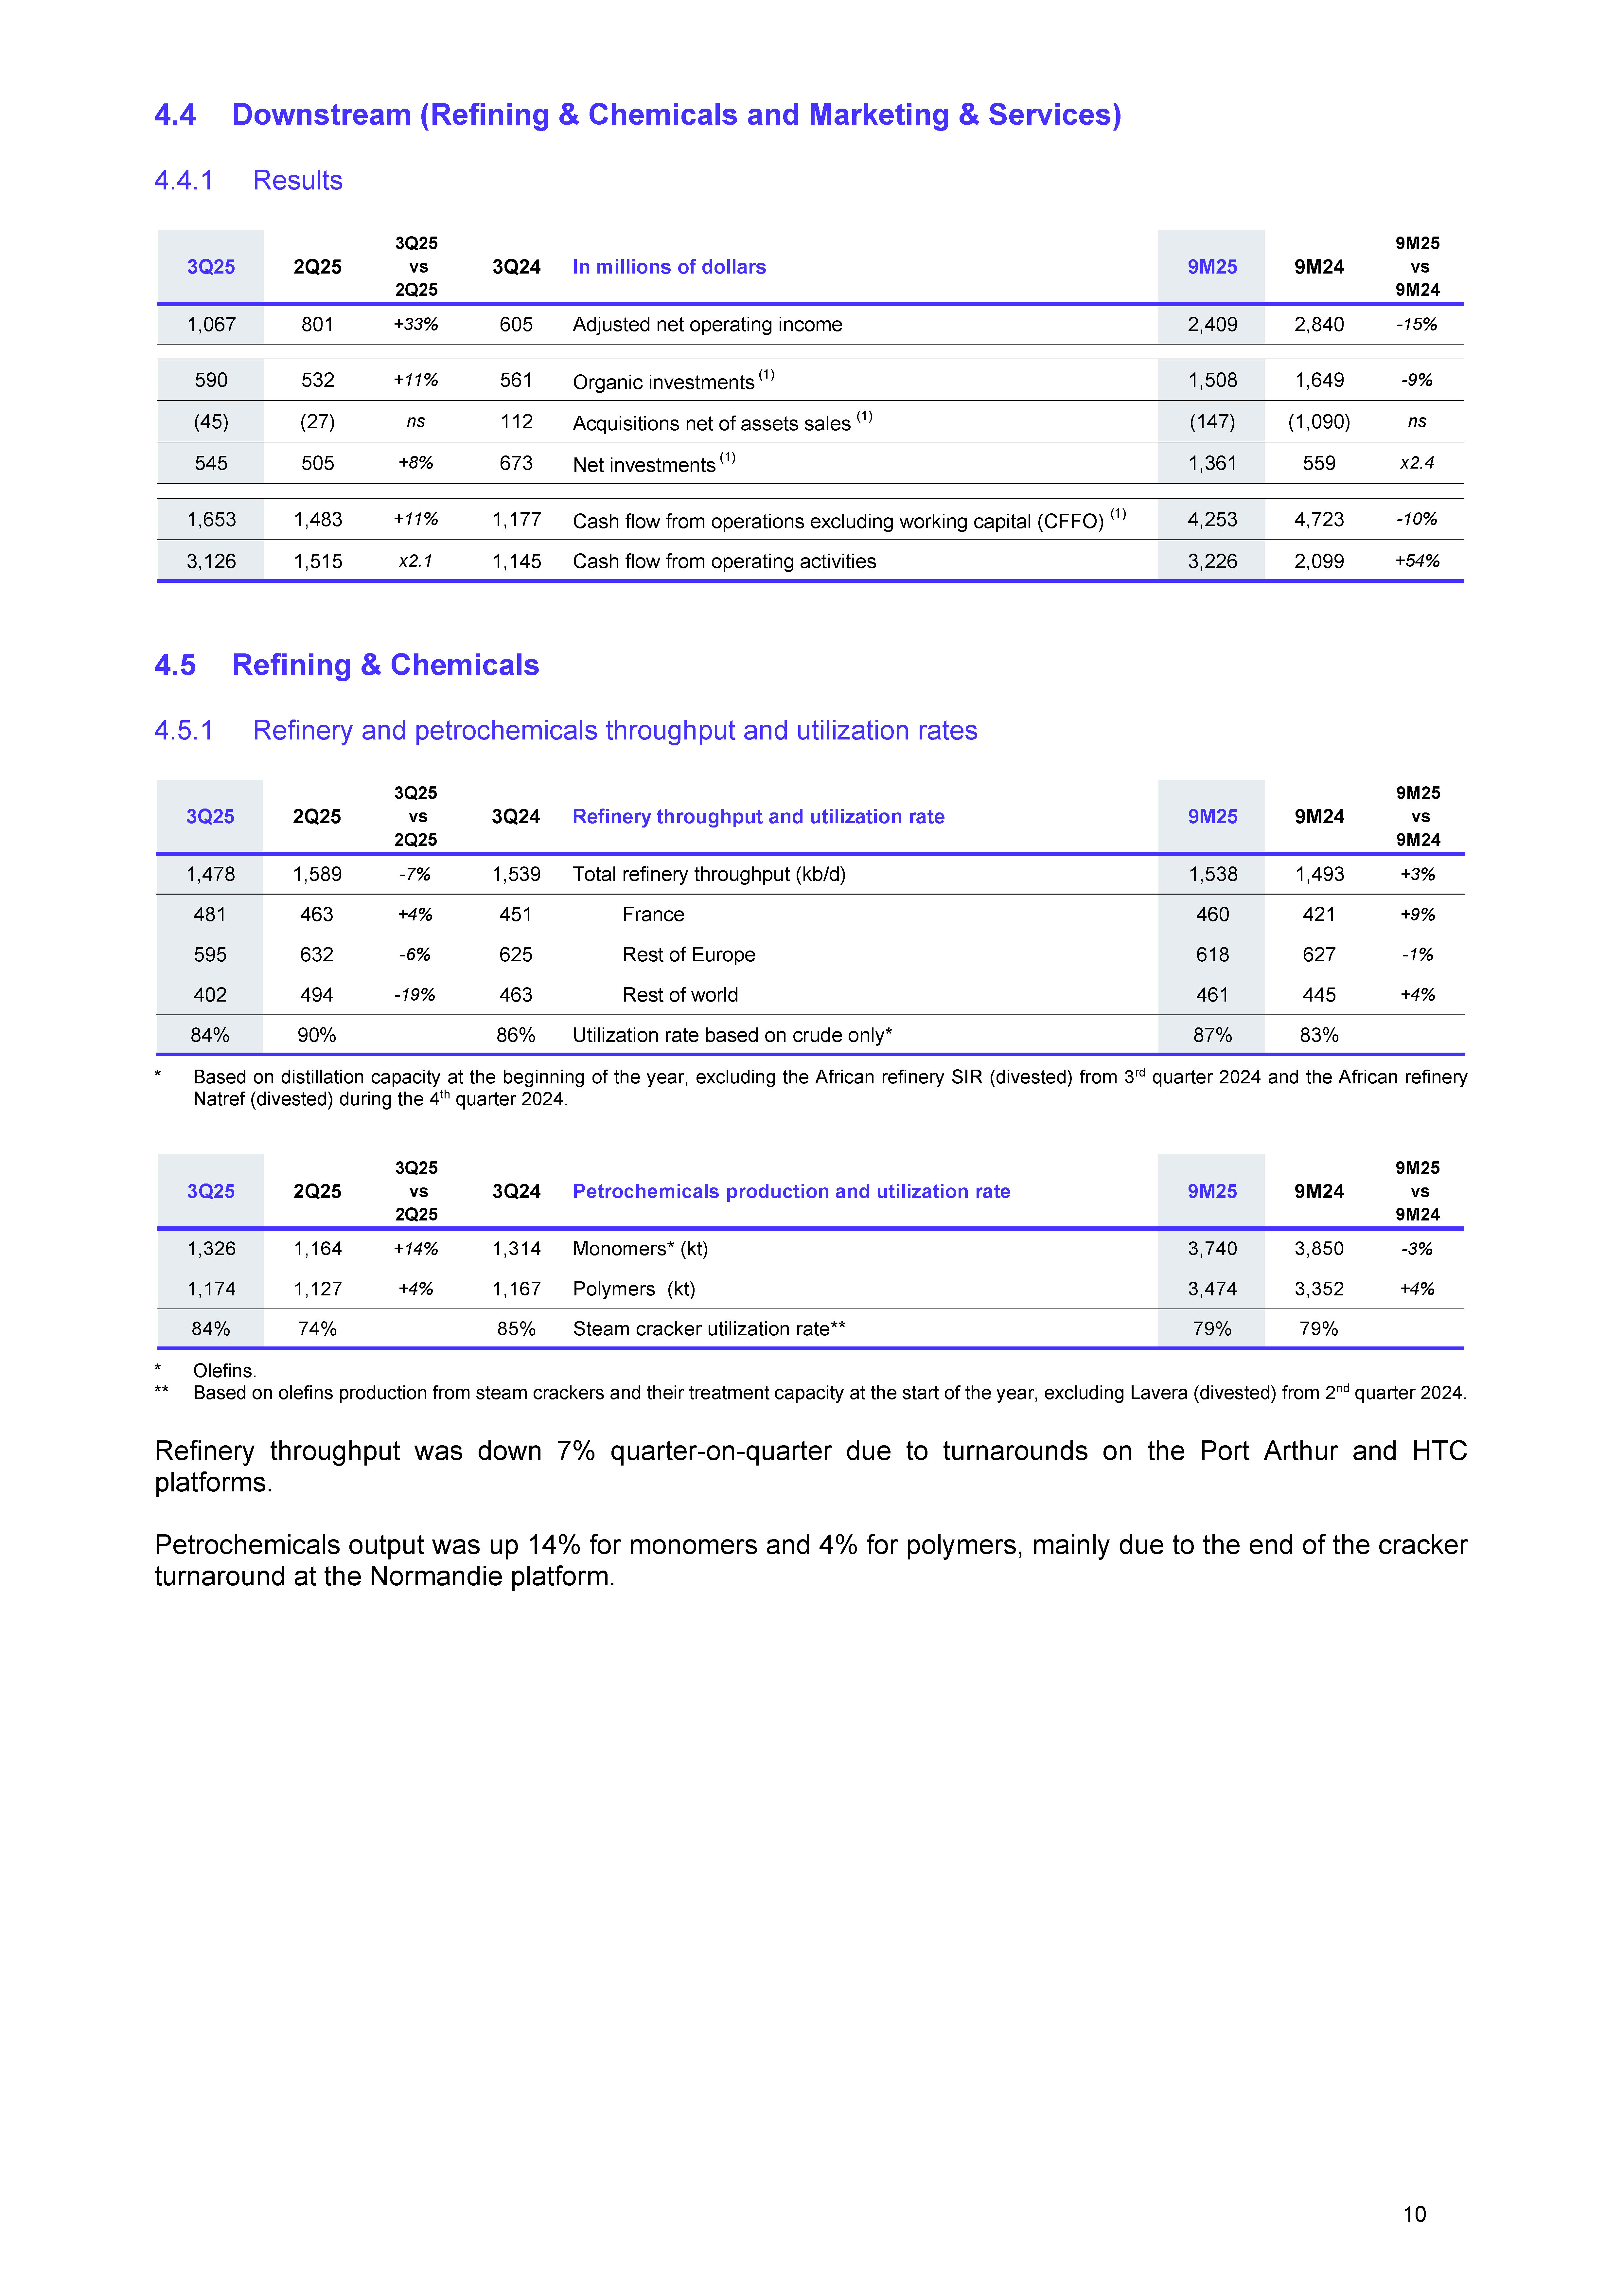
| 4.4 Downstream (Refining & Chemicals and Marketing & Services) 4.4.1 Results 4.5 Refining & Chemicals 4.5.1 Refinery and petrochemicals throughput and utilization rates * Based on distillation capacity at the beginning of the year, excluding the African refinery SIR (divested) from 3rd quarter 2024 and the African refinery Natref (divested) during the 4th quarter 2024. * Olefins. ** Based on olefins production from steam crackers and their treatment capacity at the start of the year, excluding Lavera (divested) from 2nd quarter 2024. Refinery throughput was down 7% quarter-on-quarter due to turnarounds on the Port Arthur and HTC platforms. Petrochemicals output was up 14% for monomers and 4% for polymers, mainly due to the end of the cracker turnaround at the Normandie platform. 3Q25 2Q25 3Q25 vs 2Q25 3Q24 In millions of dollars 9M25 9M24 9M25 vs 9M24 1,067 801 +33% 605 Adjusted net operating income 2,409 2,840 -15% 590 532 +11% 561 Organic investments (1) 1,508 1,649 -9% (45) (27) ns 112 Acquisitions net of assets sales (1) (147) (1,090) ns 545 505 +8% 673 Net investments (1) 1,361 559 x2.4 1,653 1,483 +11% 1,177 Cash flow from operations excluding working capital (CFFO) (1) 4,253 4,723 -10% 3,126 1,515 x2.1 1,145 Cash flow from operating activities 3,226 2,099 +54% 3Q25 2Q25 3Q25 vs 2Q25 3Q24 Refinery throughput and utilization rate 9M25 9M24 9M25 vs 9M24 1,478 1,589 -7% 1,539 Total refinery throughput (kb/d) 1,538 1,493 +3% 481 463 +4% 451 France 460 421 +9% 595 632 -6% 625 Rest of Europe 618 627 -1% 402 494 -19% 463 Rest of world 461 445 +4% 84% 90% 86% Utilization rate based on crude only* 87% 83% 3Q25 2Q25 3Q25 vs 2Q25 3Q24 Petrochemicals production and utilization rate 9M25 9M24 9M25 vs 9M24 1,326 1,164 +14% 1,314 Monomers* (kt) 3,740 3,850 -3% 1,174 1,127 +4% 1,167 Polymers (kt) 3,474 3,352 +4% 84% 74% 85% Steam cracker utilization rate** 79% 79% 10 |
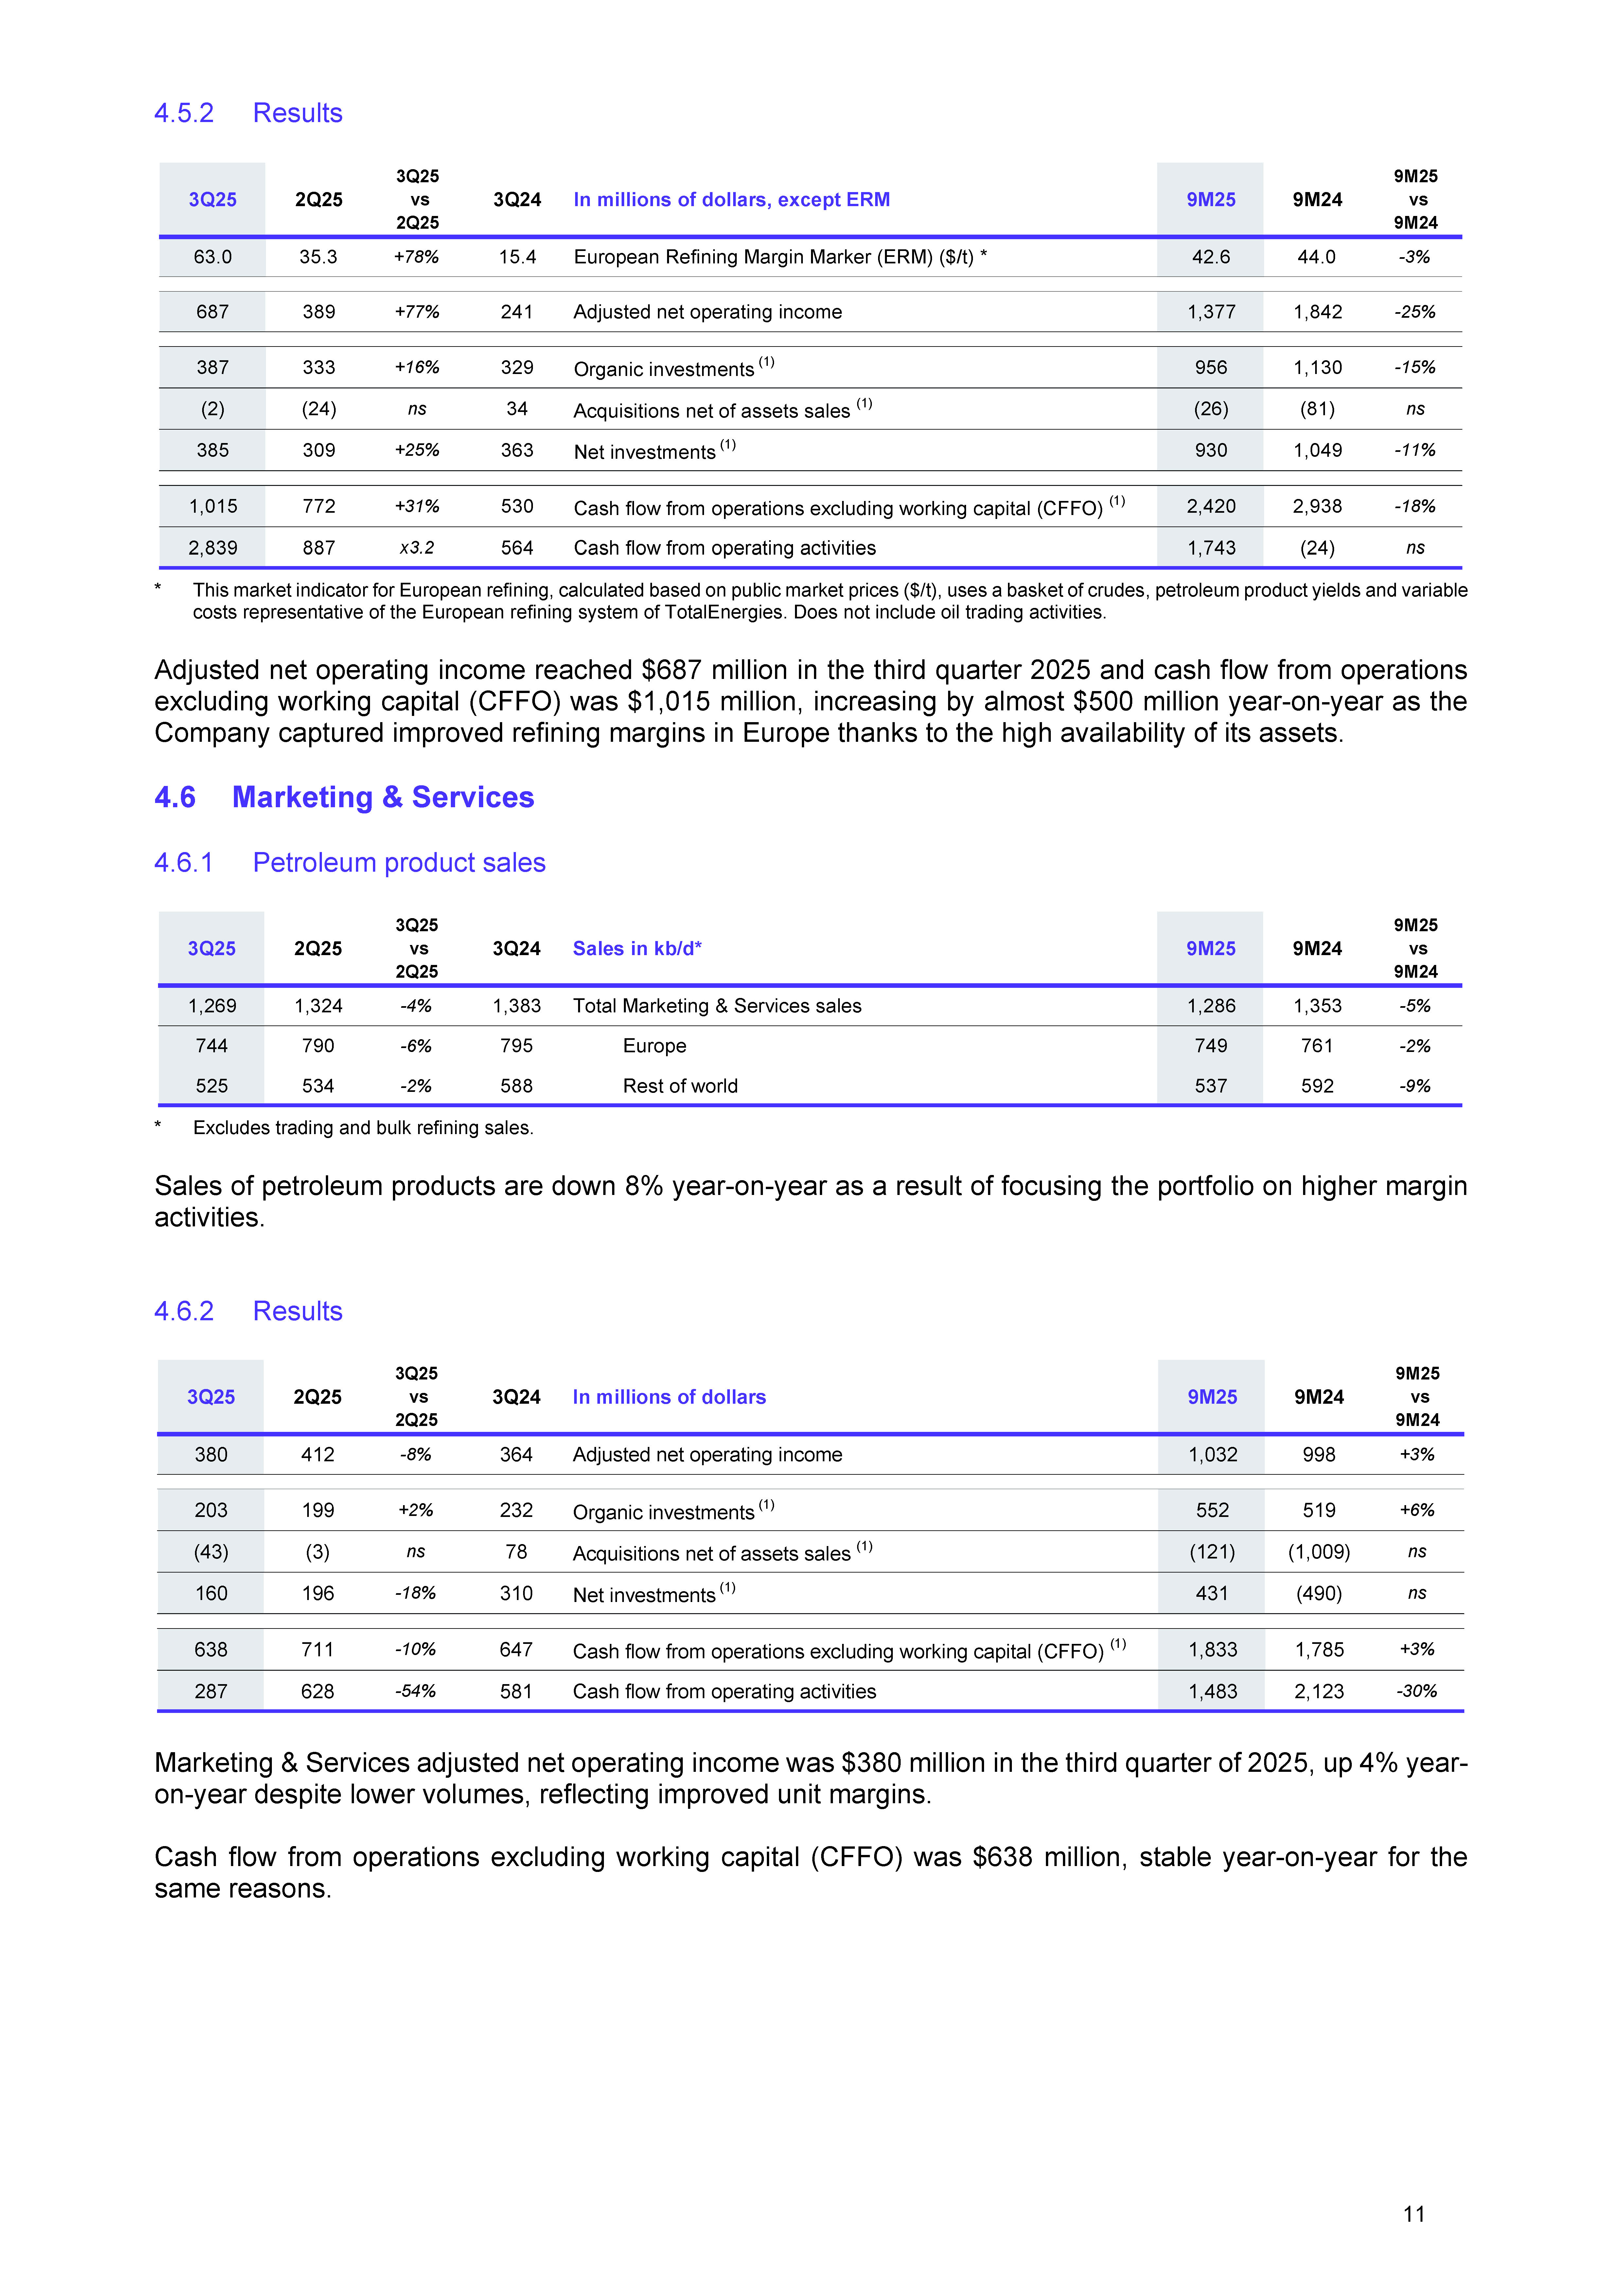
| 4.5.2 Results * This market indicator for European refining, calculated based on public market prices ($/t), uses a basket of crudes, petroleum product yields and variable costs representative of the European refining system of TotalEnergies. Does not include oil trading activities. Adjusted net operating income reached $687 million in the third quarter 2025 and cash flow from operations excluding working capital (CFFO) was $1,015 million, increasing by almost $500 million year-on-year as the Company captured improved refining margins in Europe thanks to the high availability of its assets. 4.6 Marketing & Services 4.6.1 Petroleum product sales * Excludes trading and bulk refining sales. Sales of petroleum products are down 8% year-on-year as a result of focusing the portfolio on higher margin activities. 4.6.2 Results Marketing & Services adjusted net operating income was $380 million in the third quarter of 2025, up 4% year-on-year despite lower volumes, reflecting improved unit margins. Cash flow from operations excluding working capital (CFFO) was $638 million, stable year-on-year for the same reasons. 3Q25 2Q25 3Q25 vs 2Q25 3Q24 In millions of dollars, except ERM 9M25 9M24 9M25 vs 9M24 63.0 35.3 +78% 15.4 European Refining Margin Marker (ERM) ($/t) * 42.6 44.0 -3% 687 389 +77% 241 Adjusted net operating income 1,377 1,842 -25% 387 333 +16% 329 Organic investments (1) 956 1,130 -15% (2) (24) ns 34 Acquisitions net of assets sales (1) (26) (81) ns 385 309 +25% 363 Net investments (1) 930 1,049 -11% 1,015 772 +31% 530 Cash flow from operations excluding working capital (CFFO) (1) 2,420 2,938 -18% 2,839 887 x3.2 564 Cash flow from operating activities 1,743 (24) ns 3Q25 2Q25 3Q25 vs 2Q25 3Q24 Sales in kb/d* 9M25 9M24 9M25 vs 9M24 1,269 1,324 -4% 1,383 Total Marketing & Services sales 1,286 1,353 -5% 744 790 -6% 795 Europe 749 761 -2% 525 534 -2% 588 Rest of world 537 592 -9% 3Q25 2Q25 3Q25 vs 2Q25 3Q24 In millions of dollars 9M25 9M24 9M25 vs 9M24 380 412 -8% 364 Adjusted net operating income 1,032 998 +3% 203 199 +2% 232 Organic investments (1) 552 519 +6% (43) (3) ns 78 Acquisitions net of assets sales (1) (121) (1,009) ns 160 196 -18% 310 Net investments (1) 431 (490) ns 638 711 -10% 647 Cash flow from operations excluding working capital (CFFO) (1) 1,833 1,785 +3% 287 628 -54% 581 Cash flow from operating activities 1,483 2,123 -30% 11 |
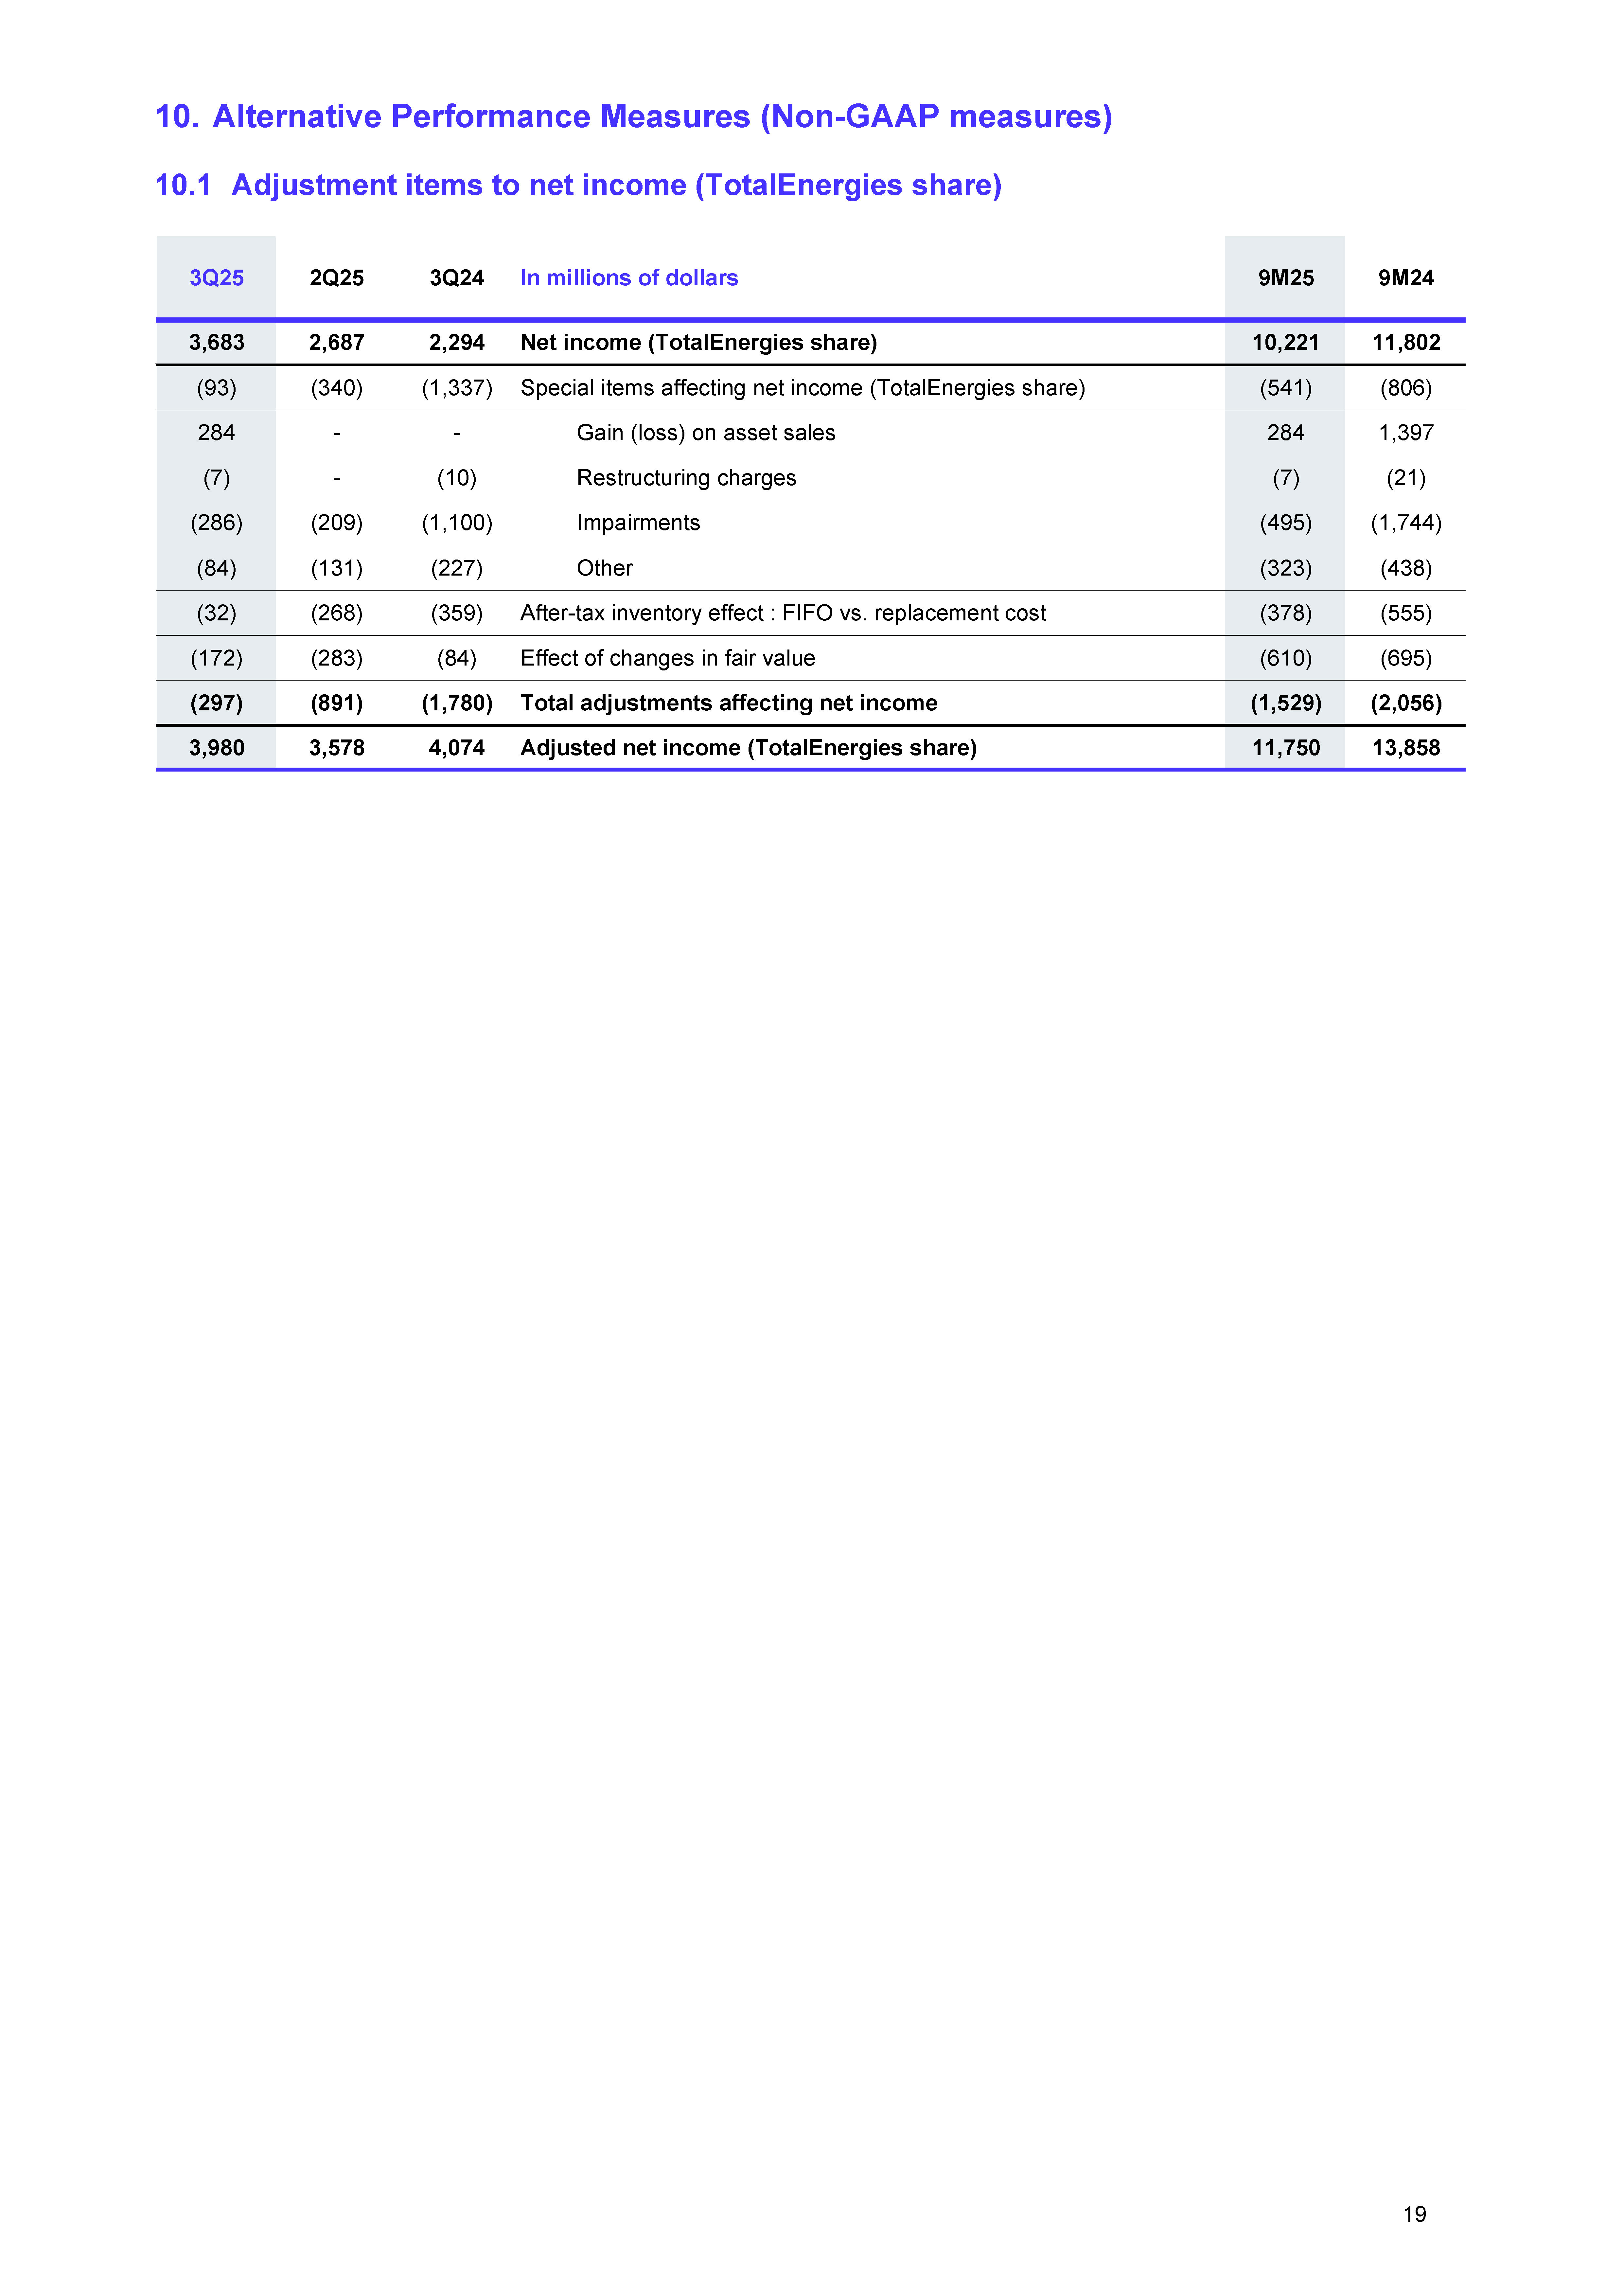
| 5. TotalEnergies results 5.1 Adjusted net operating income from business segments Adjusted net operating income from business segments was $4,659 million in the third quarter of 2025, compared to $4,390 million in the second quarter, driven by the accretive production growth of Exploration & Production and higher refining margins in Europe. 5.2 Adjusted net income (1) (TotalEnergies share) TotalEnergies’ adjusted net income was $3,980 million in the third quarter of 2025 versus $3,578 million in the second quarter, for the same reasons. Adjusted net income excludes the after-tax inventory effect, special items and the impact of changes in fair value. Adjustments to net income were ($0.3) billion in the third quarter of 2025, consisting mainly of: $0.3 billion of capital gains/losses on asset sales, related to the divestment of two blocks in Argentina ($0.3) billion of exceptional provisions and depreciations, ($0.3) billion of changes in fair value, stock variation and other items. TotalEnergies’ average tax rate was 37.7% in the third quarter of 2025 versus 41.5% in the second quarter of 2025 mainly due to the increase of the relative weight of Refining and Chemicals and the reduction of the relative weight of North Sea countries in the Company's results. 5.3 Adjusted earnings per share Adjusted fully-diluted earnings per share were: $1.77 in the third quarter 2025, based on 2,200 million weighted average diluted shares, compared to $1.57 in the second quarter. $5.17 in first nine months of 2025, based on 2,225 million weighted average diluted shares, compared to $5.87 a year ago. As of September 30, 2025, the number of diluted shares was 2,188 million. TotalEnergies repurchased*: 36.8 million shares in the third quarter 2025, for $2.3 billion, 99 million shares in the first nine months of 2025, for $6.0 billion. * 5.4 Acquisitions – asset sales Acquisitions were: $474 million in the third quarter of 2025, notably related to the closing of the acquisition of the Tungsten Explorer drillship in a joint venture with Vantage, $3,416 million in the first nine months of 2025, notably related to the above item, as well as the finalization of the VSB acquisition and the acquisition of an additional 10% interest in the Moho field in Congo. Divestments were: $855 million in the third quarter of 2025, notably related to the divestment of two unconventional blocks in Argentina and the sale of a 50% interest in a renewables portfolio in France, $1,565 million in the first nine months of 2025, notably related to the above items, as well as the sale of a 50% interest in a renewables portfolio in Portugal and the divestment of interests in the Nkossa and Nsoko II permits in Congo and fuel distribution activities in Brazil. * Including coverage of employees share grant plans. 12 |
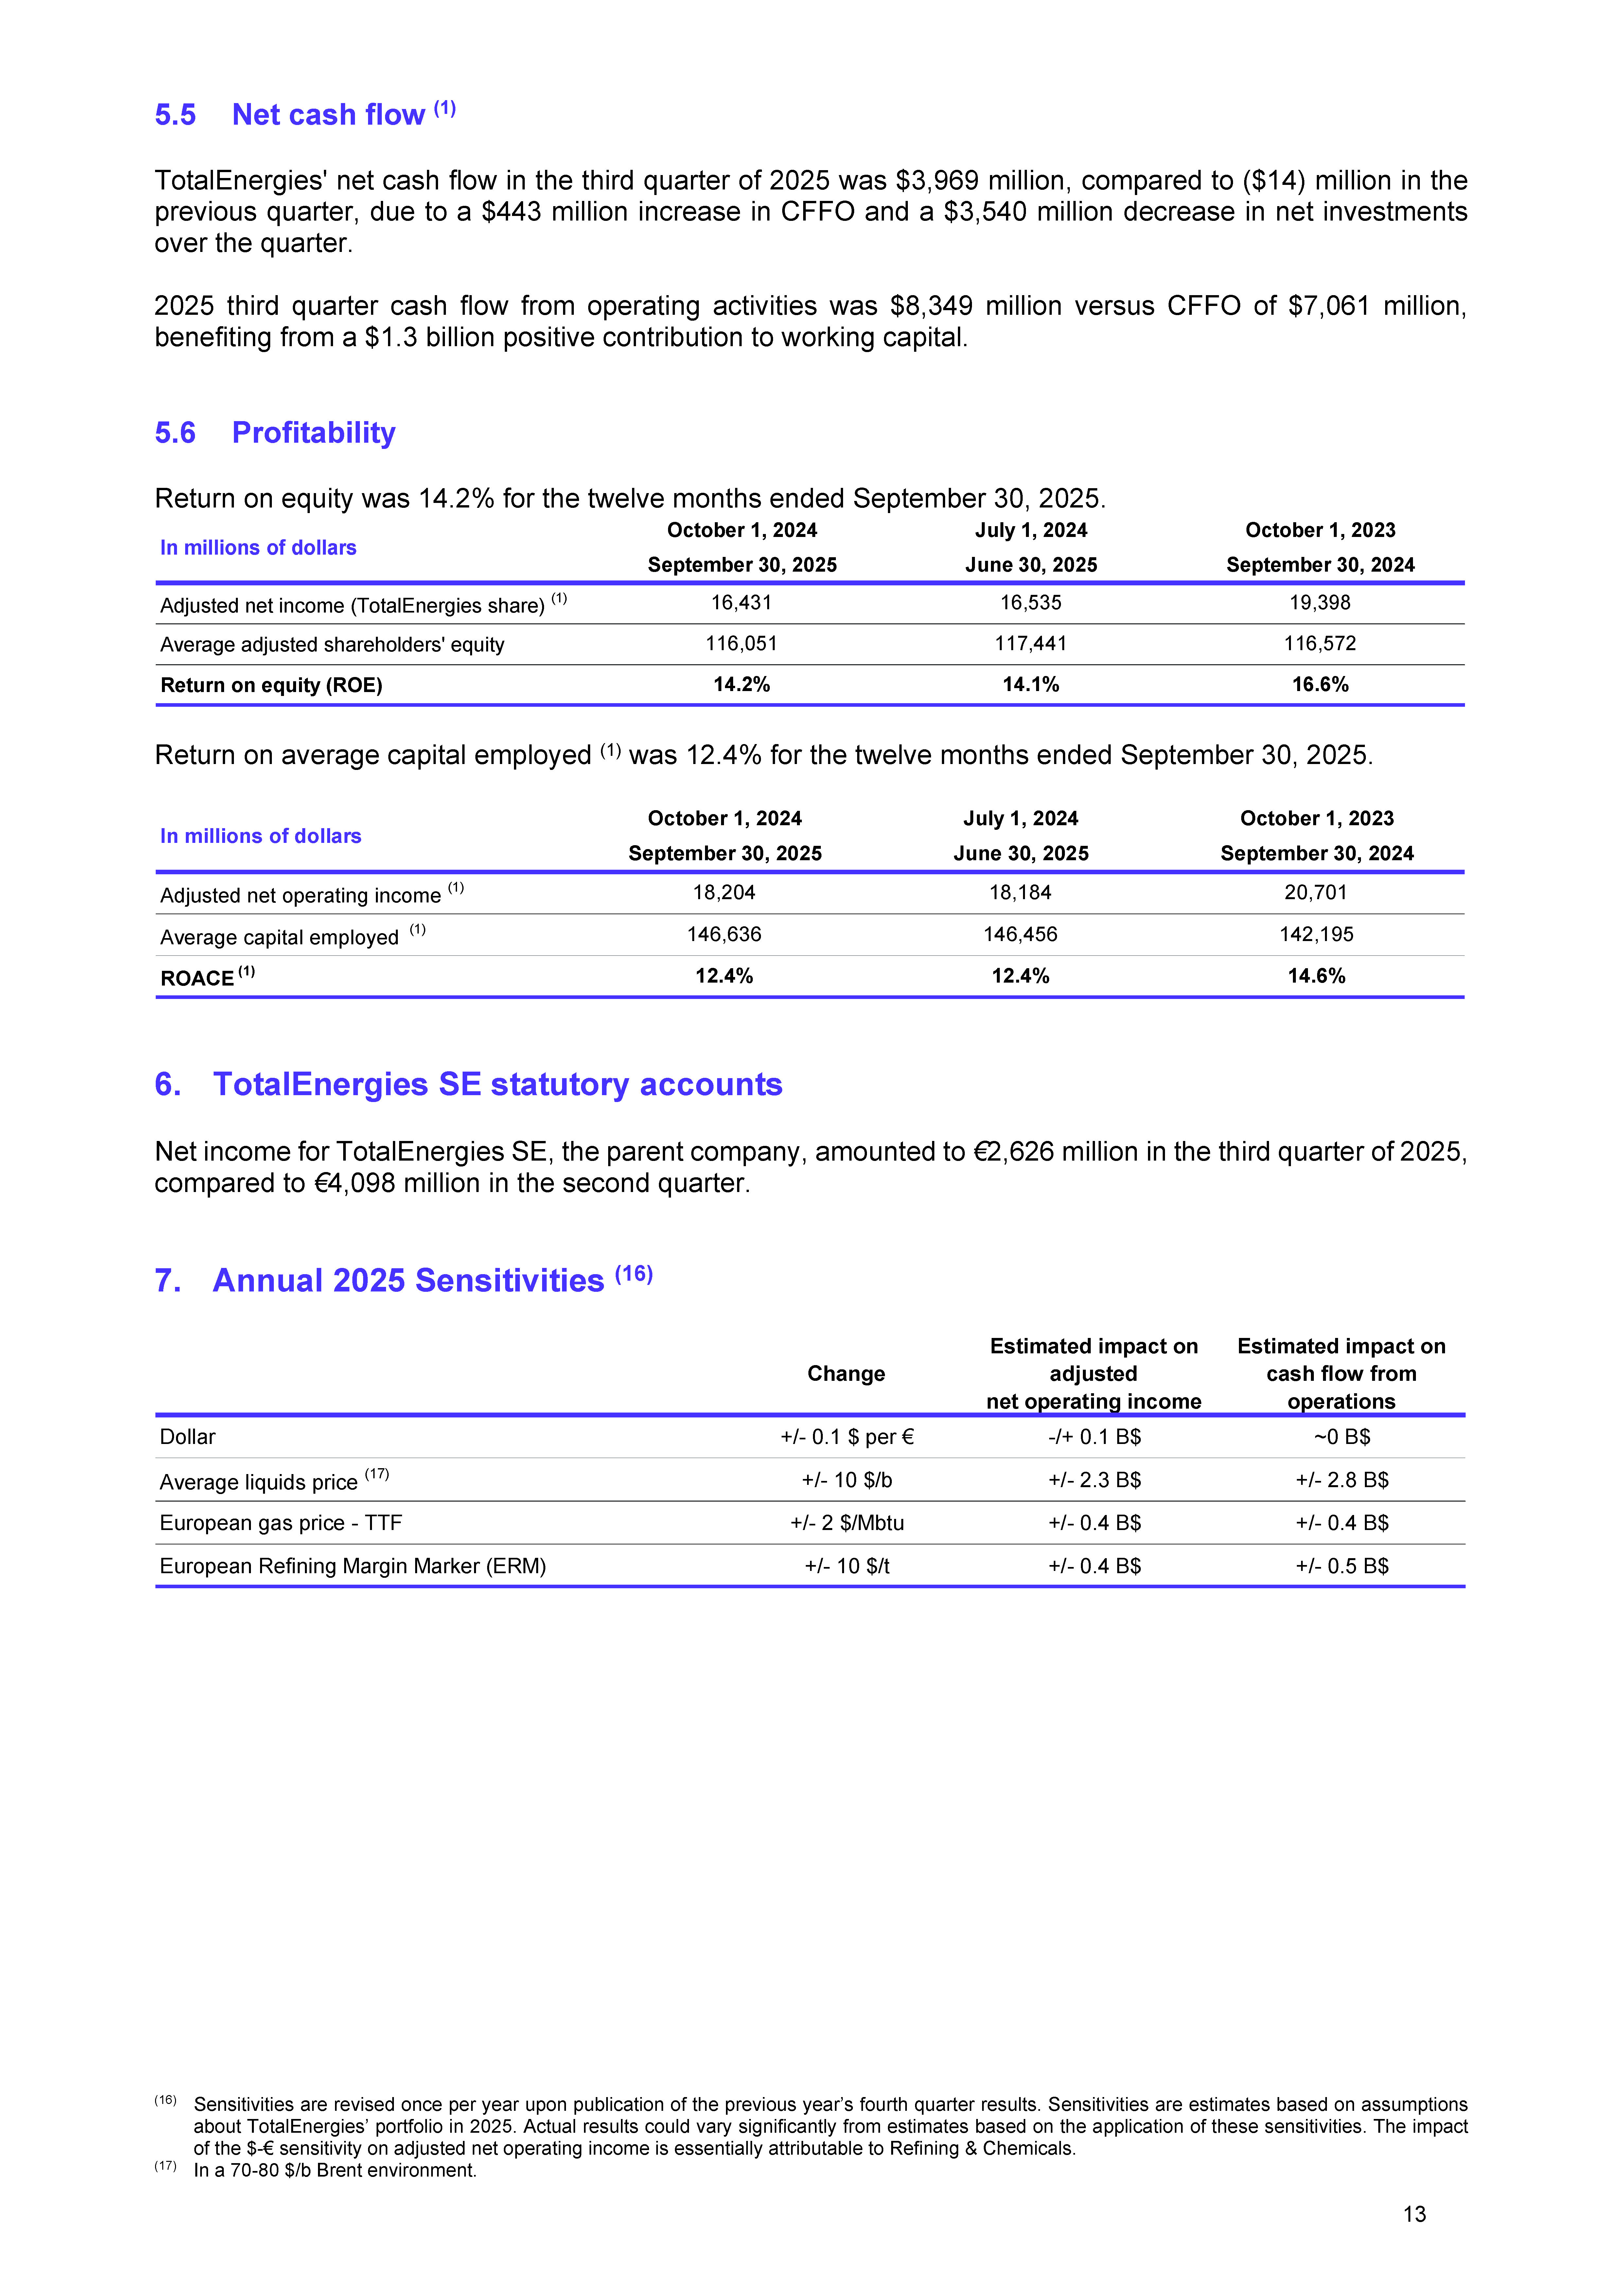
| 5.5 Net cash flow (1) TotalEnergies' net cash flow in the third quarter of 2025 was $3,969 million, compared to ($14) million in the previous quarter, due to a $443 million increase in CFFO and a $3,540 million decrease in net investments over the quarter. 2025 third quarter cash flow from operating activities was $8,349 million versus CFFO of $7,061 million, benefiting from a $1.3 billion positive contribution to working capital. 5.6 Profitability Return on equity was 14.2% for the twelve months ended September 30, 2025. Return on average capital employed (1) was 12.4% for the twelve months ended September 30, 2025. 6. TotalEnergies SE statutory accounts Net income for TotalEnergies SE, the parent company, amounted to €2,626 million in the third quarter of 2025, compared to €4,098 million in the second quarter. 7. Annual 2025 Sensitivities (16) * (16) Sensitivities are revised once per year upon publication of the previous year’s fourth quarter results. Sensitivities are estimates based on assumptions about TotalEnergies’ portfolio in 2025. Actual results could vary significantly from estimates based on the application of these sensitivities. The impact of the $-€ sensitivity on adjusted net operating income is essentially attributable to Refining & Chemicals. (17) In a 70-80 $/b Brent environment. Adjusted net income (TotalEnergies share) (1) Average adjusted shareholders' equity Return on equity (ROE) 14.2% 14.1% 16.6% In millions of dollars October 1, 2024 July 1, 2024 October 1, 2023 September 30, 2025 June 30, 2025 September 30, 2024 19,398 116,572 16,431 16,535 116,051 117,441 Adjusted net operating income (1) Average capital employed (1) ROACE (1) 18,204 18,184 20,701 In millions of dollars October 1, 2024 July 1, 2024 October 1, 2023 September 30, 2025 June 30, 2025 September 30, 2024 146,636 146,456 142,195 12.4% 12.4% 14.6% Change Estimated impact on adjusted net operating income Estimated impact on cash flow from operations Dollar +/- 0.1 $ per € -/+ 0.1 B$ ~0 B$ Average liquids price (17) +/- 10 $/b +/- 2.3 B$ +/- 2.8 B$ European gas price - TTF +/- 2 $/Mbtu +/- 0.4 B$ +/- 0.4 B$ European Refining Margin Marker (ERM) +/- 10 $/t +/- 0.4 B$ +/- 0.5 B$ 13 |
| 8. Outlook In the context of continued uncertainty in the geopolitical and macroeconomic environment, oil prices are trending downwards, facing an abundant supply that is fueled by production from non-OPEC countries (Guyana, Brazil, US) and OPEC+'s decision to unwind some voluntary productions cuts. At the beginning of the fourth quarter of 2025, refining margins remain above $50/t reflecting disruptions of diesel flows and low inventory levels. Forward European gas prices remain sustained at around $11/Mbtu for the fourth quarter of 2025 and winter 2025/26 due to anticipated winter consumption. Given the evolution of oil and gas prices in recent months and the lag effect on pricing formulas, TotalEnergies anticipates an average LNG selling price of $8.5/Mbtu for the fourth quarter of 2025. Hydrocarbon production in the fourth quarter of 2025 is expected to be between 2.525 and 2.575 Mboe/d, growing over 4% compared to the fourth quarter of 2024, notably benefiting from the restart of Ichthys LNG. Taking into account planned turnarounds at Antwerp and SATORP in Saudi Arabia, the utilization rate should be between 80% and 84% in the fourth quarter. The Company anticipates net investments for the full year will be within the $17-17.5 billion guidance range based on organic investments and expected disposals in the fourth quarter. Fourth quarter disposals are estimated to total $2 billion, including the closing of Nigeria and Norway divestitures for Exploration & Production as well as farm-downs of renewable assets in North America and Greece for Integrated Power. Given forecasted divestments net of acquisitions of $1.5 billion in the fourth quarter 2025 and an anticipated positive contribution from working capital, gearing at the end of 2025 is expected to be 15-16%. * * * * To listen to the conference call with Chairman & CEO Patrick Pouyanné and CFO Jean-Pierre Sbraire today at 1:00pm (Paris time), please log on to totalenergies.com or dial +33 (0) 1 70 91 87 04, +44 (0) 12 1281 8004 or +1 718 705 8796. The conference replay will be available on the Company's website totalenergies.com after the event. * * * * TotalEnergies contacts Media Relations: +33 (0)1 47 44 46 99 l presse@totalenergies.com l @TotalEnergiesPR Investor Relations: +33 (0)1 47 44 46 46 l ir@totalenergies.com 14 |
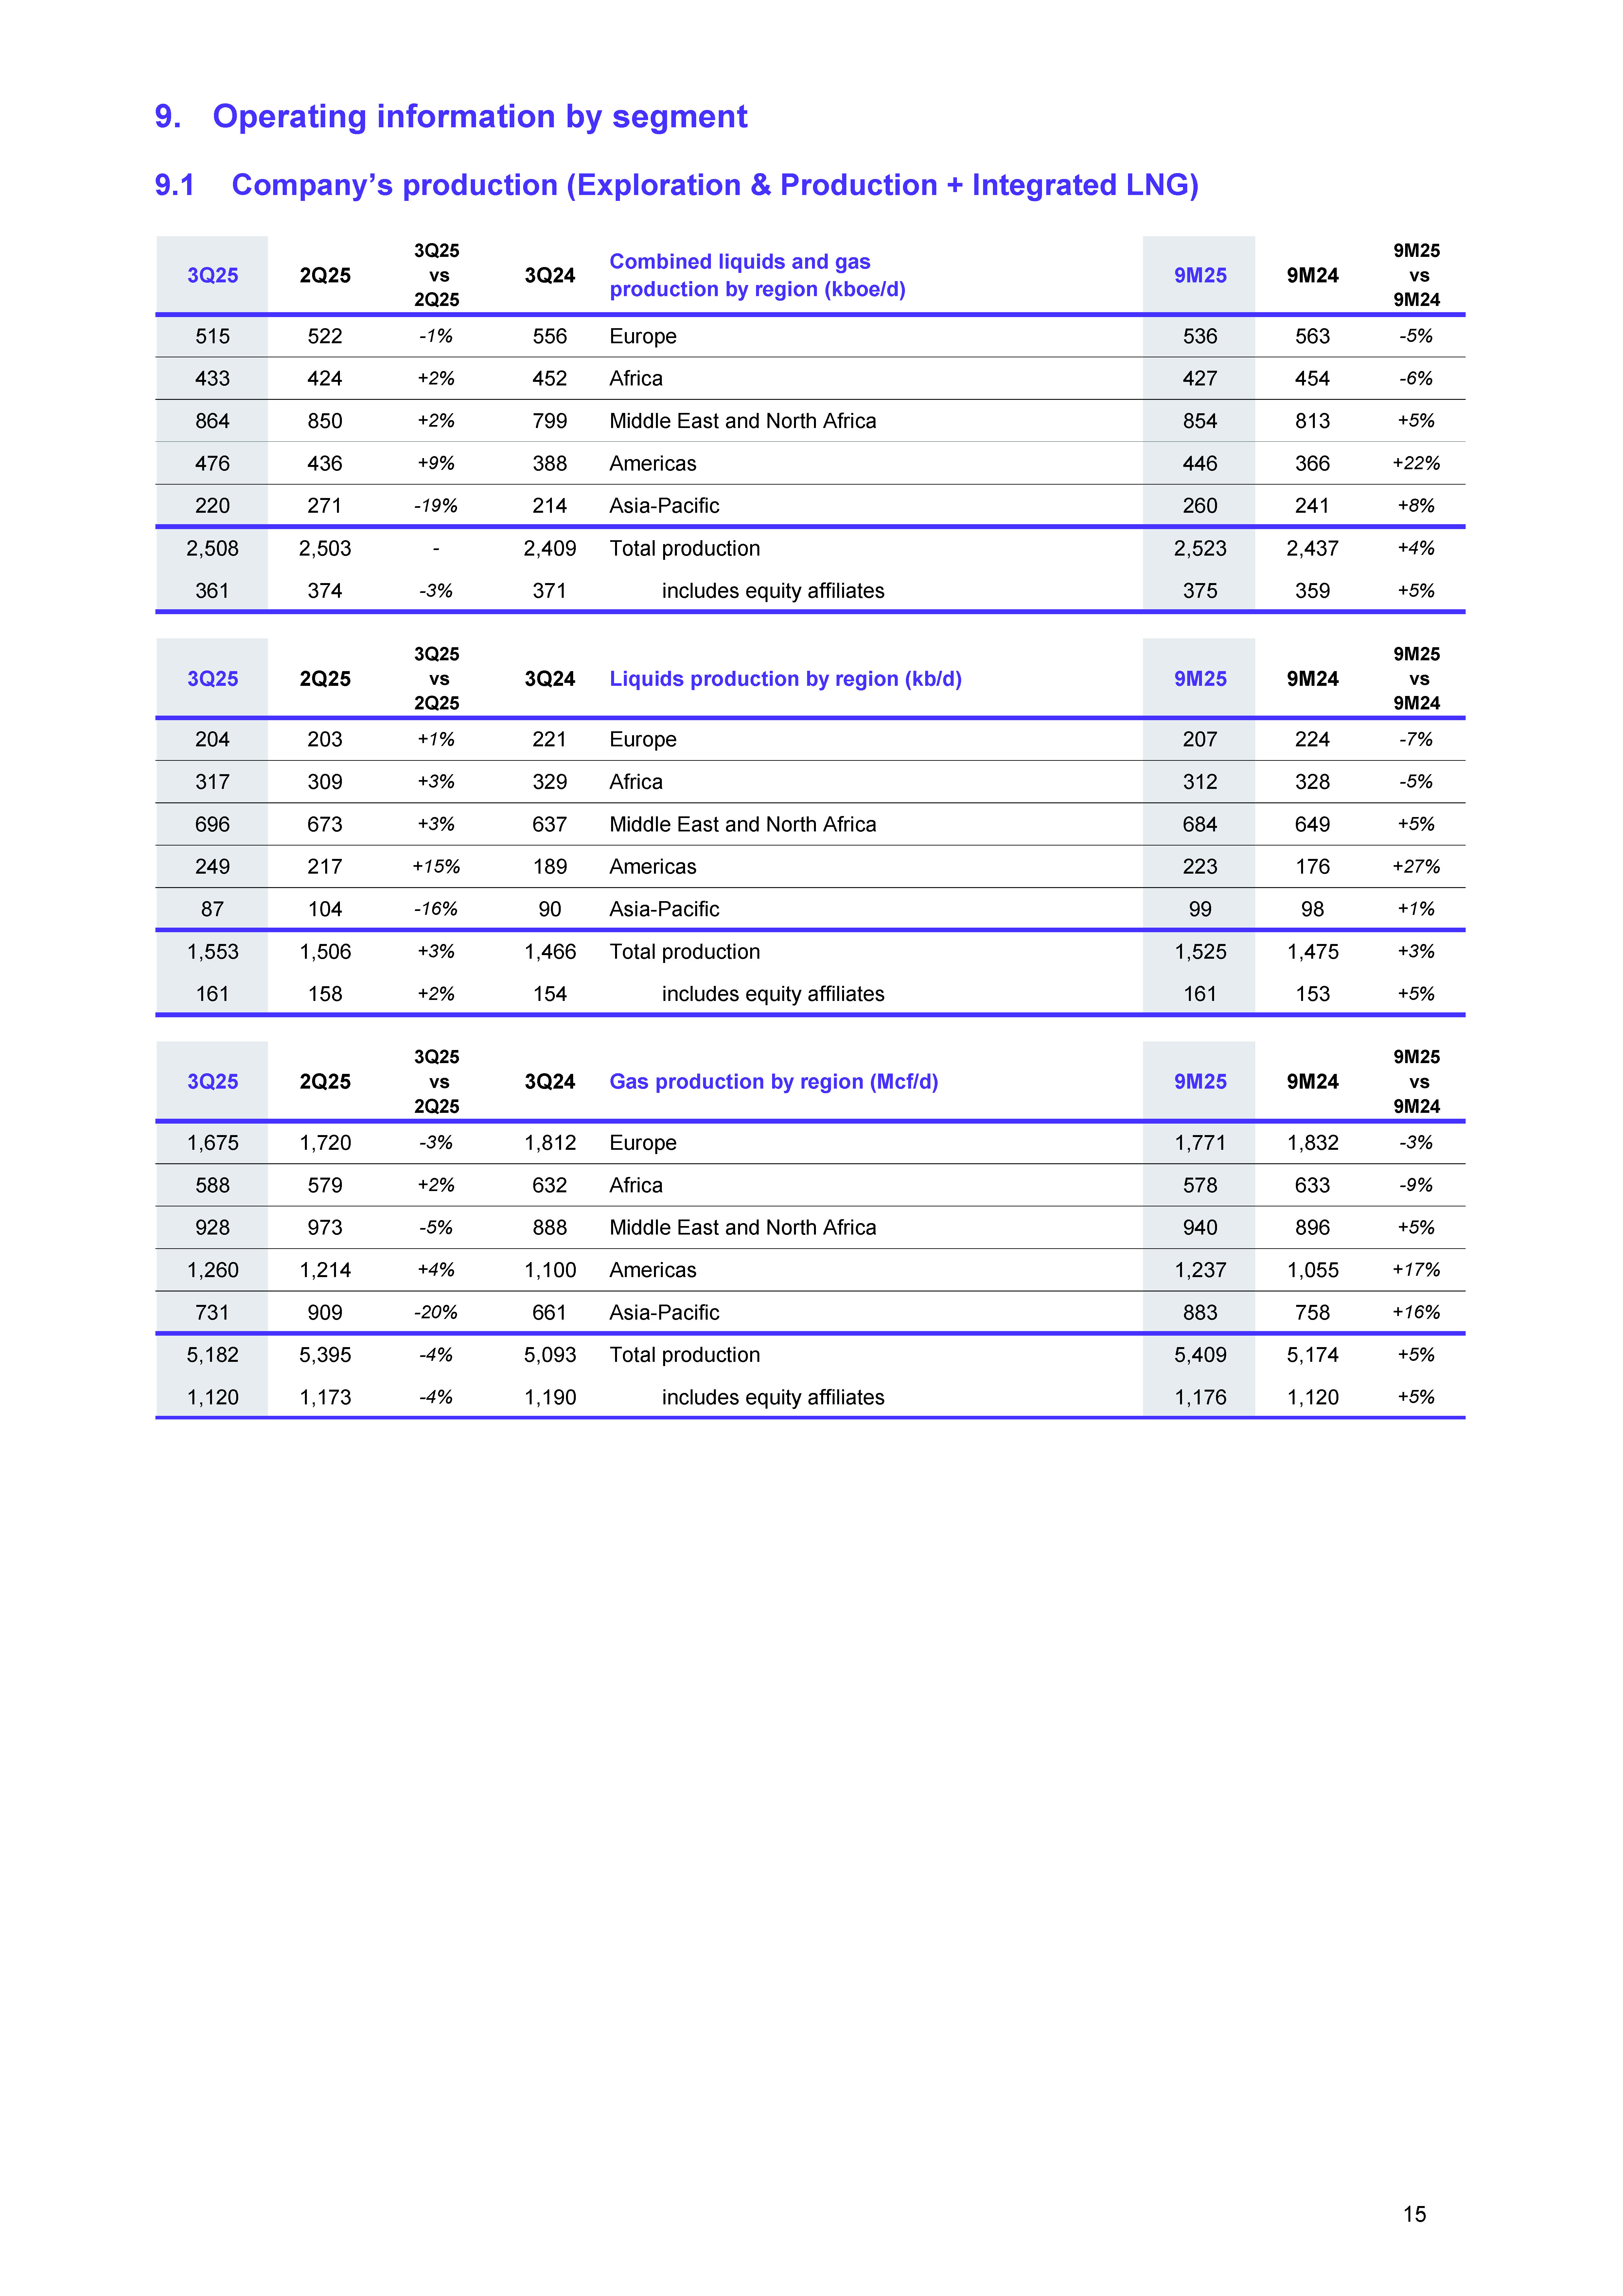
| 9. Operating information by segment 9.1 Company’s production (Exploration & Production + Integrated LNG) 3Q25 2Q25 3Q25 vs 2Q25 3Q24 Combined liquids and gas production by region (kboe/d) 9M25 9M24 9M25 vs 9M24 515 522 -1% 556 Europe 536 563 -5% 433 424 +2% 452 Africa 427 454 -6% 864 850 +2% 799 Middle East and North Africa 854 813 +5% 476 436 +9% 388 Americas 446 366 +22% 220 271 -19% 214 Asia-Pacific 260 241 +8% 2,508 2,503 - 2,409 Total production 2,523 2,437 +4% 361 374 -3% 371 includes equity affiliates 375 359 +5% 3Q25 2Q25 3Q25 vs 2Q25 3Q24 Liquids production by region (kb/d) 9M25 9M24 9M25 vs 9M24 204 203 +1% 221 Europe 207 224 -7% 317 309 +3% 329 Africa 312 328 -5% 696 673 +3% 637 Middle East and North Africa 684 649 +5% 249 217 +15% 189 Americas 223 176 +27% 87 104 -16% 90 Asia-Pacific 99 98 +1% 1,553 1,506 +3% 1,466 Total production 1,525 1,475 +3% 161 158 +2% 154 includes equity affiliates 161 153 +5% 3Q25 2Q25 3Q25 vs 2Q25 3Q24 Gas production by region (Mcf/d) 9M25 9M24 9M25 vs 9M24 1,675 1,720 -3% 1,812 Europe 1,771 1,832 -3% 588 579 +2% 632 Africa 578 633 -9% 928 973 -5% 888 Middle East and North Africa 940 896 +5% 1,260 1,214 +4% 1,100 Americas 1,237 1,055 +17% 731 909 -20% 661 Asia-Pacific 883 758 +16% 5,182 5,395 -4% 5,093 Total production 5,409 5,174 +5% 1,120 1,173 -4% 1,190 includes equity affiliates 1,176 1,120 +5% 15 |
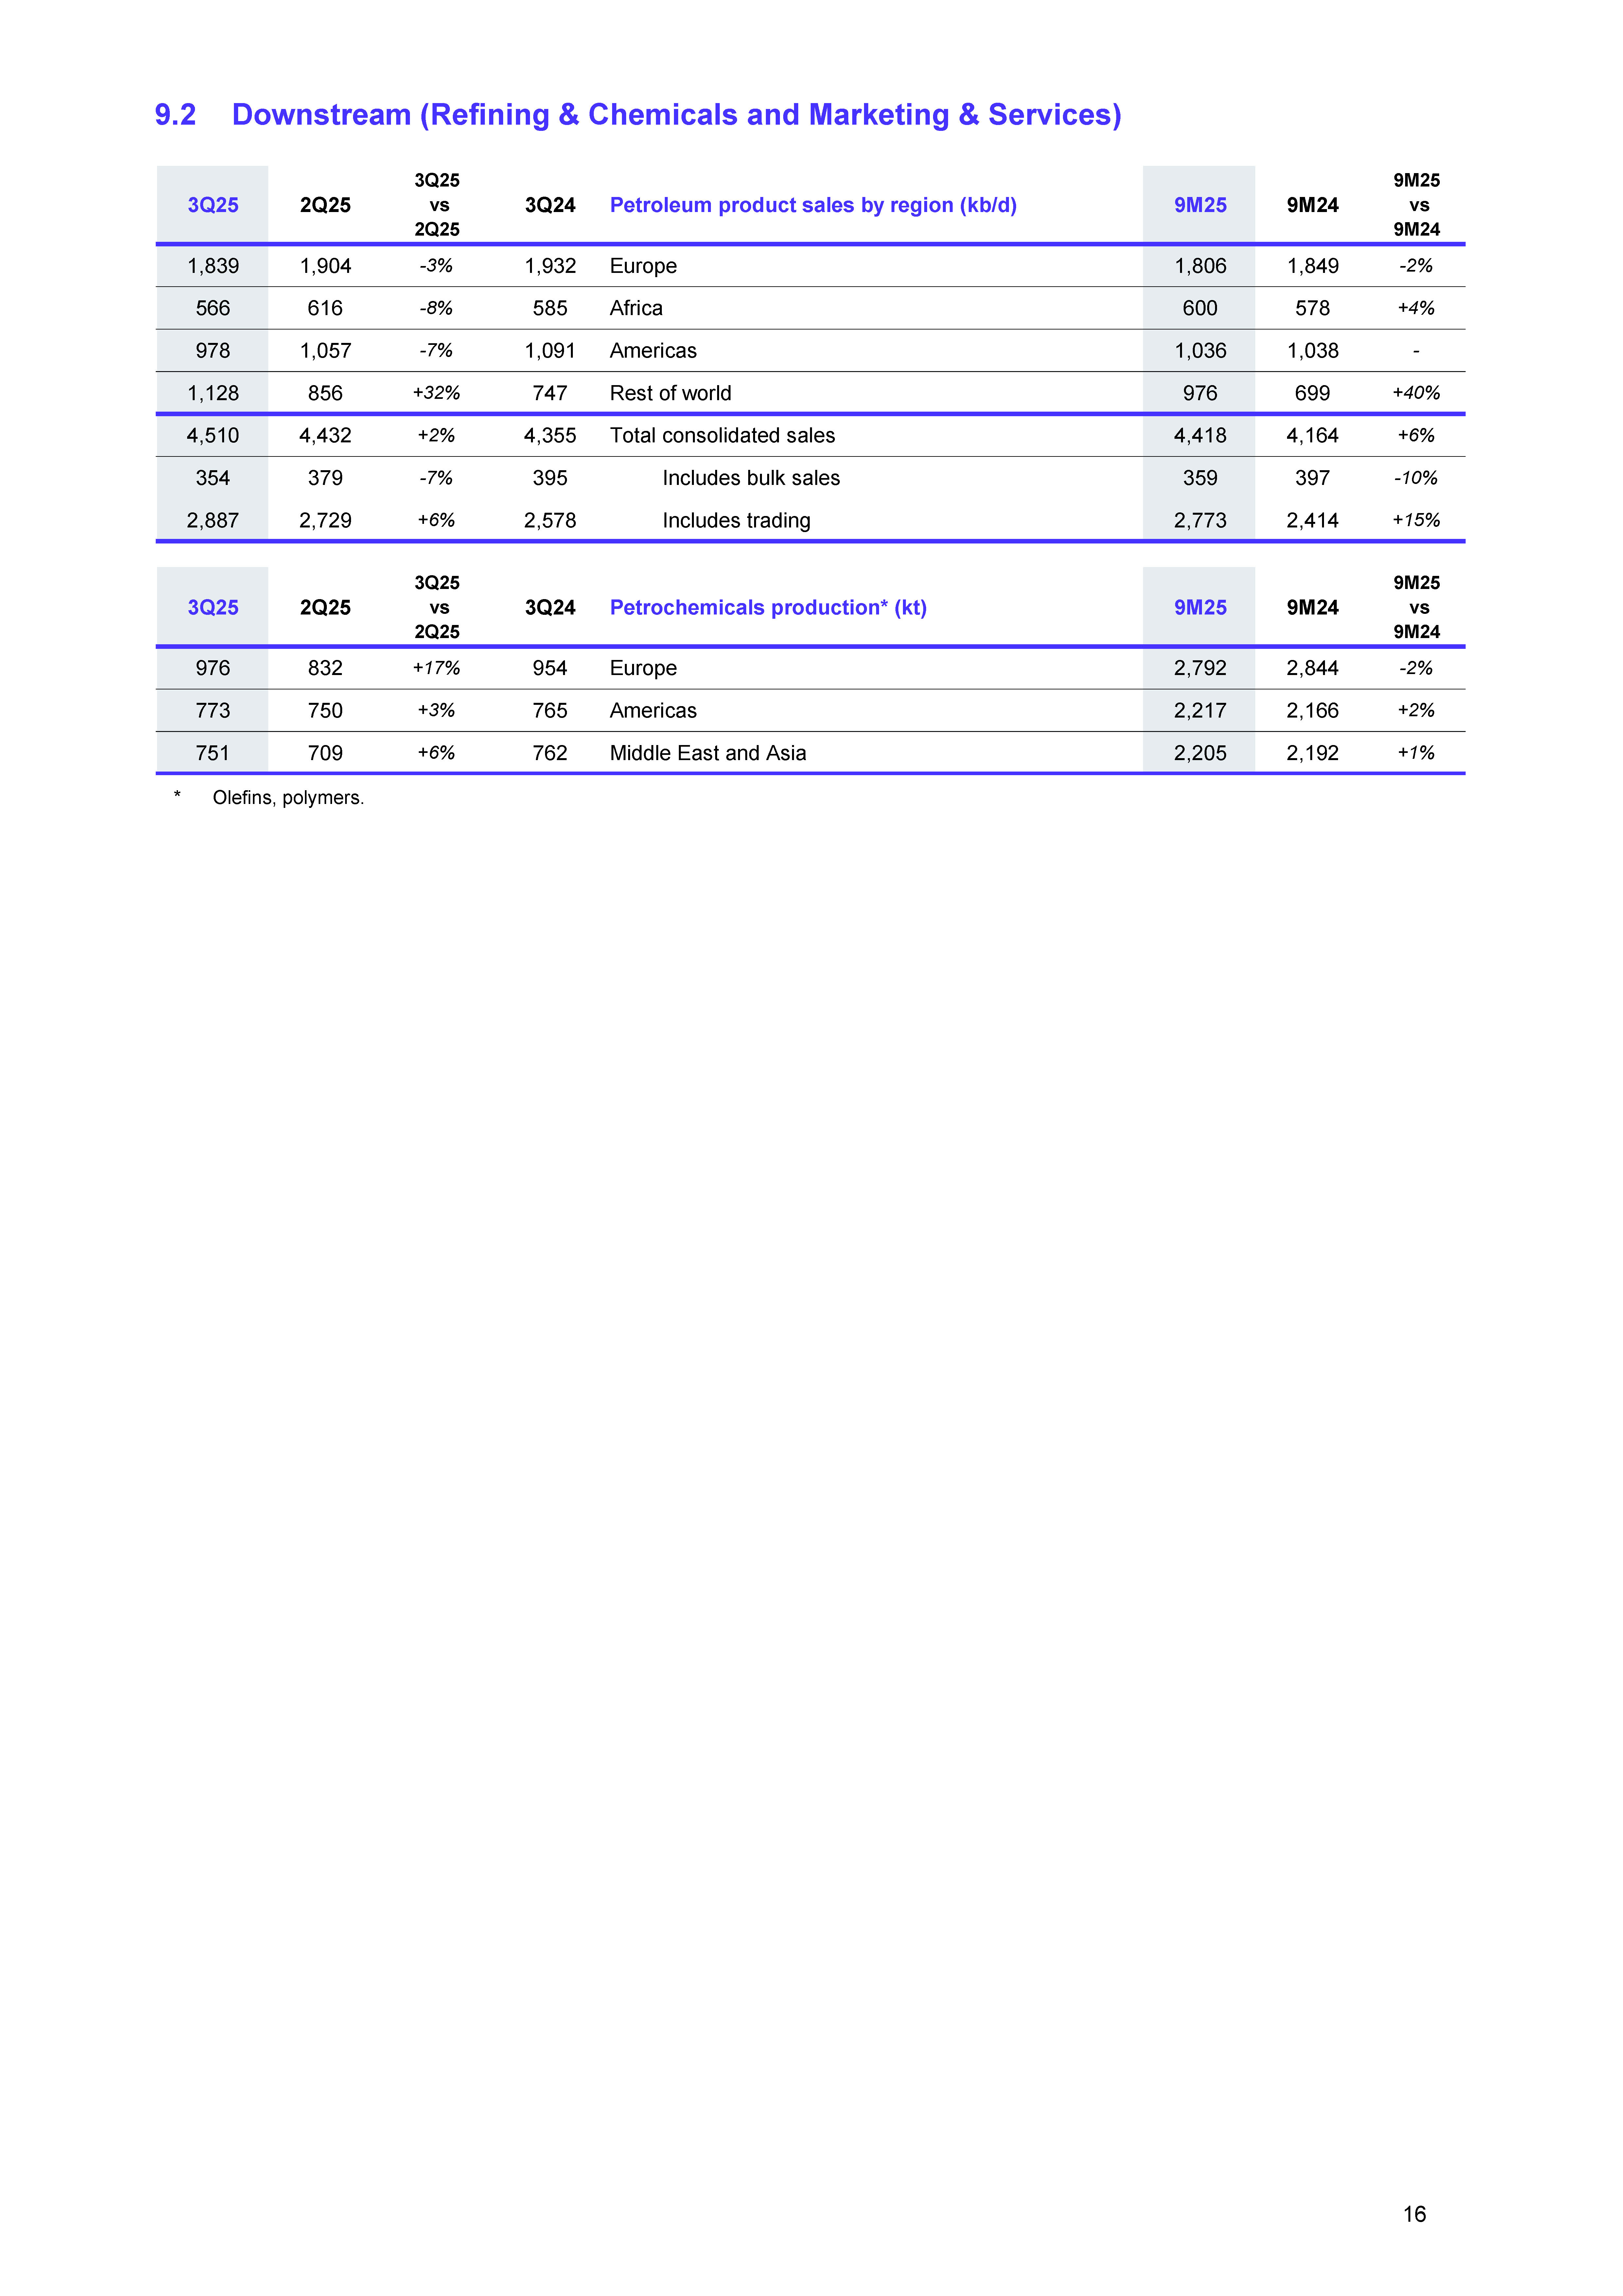
| 9.2 Downstream (Refining & Chemicals and Marketing & Services) * Olefins, polymers. 3Q25 2Q25 3Q25 vs 2Q25 3Q24 Petroleum product sales by region (kb/d) 9M25 9M24 9M25 vs 9M24 1,839 1,904 -3% 1,932 Europe 1,806 1,849 -2% 566 616 -8% 585 Africa 600 578 +4% 978 1,057 -7% 1,091 Americas 1,036 1,038 - 1,128 856 +32% 747 Rest of world 976 699 +40% 4,510 4,432 +2% 4,355 Total consolidated sales 4,418 4,164 +6% 354 379 -7% 395 Includes bulk sales 359 397 -10% 2,887 2,729 +6% 2,578 Includes trading 2,773 2,414 +15% 3Q25 2Q25 3Q25 vs 2Q25 3Q24 Petrochemicals production* (kt) 9M25 9M24 9M25 vs 9M24 976 832 +17% 954 Europe 2,792 2,844 -2% 773 750 +3% 765 Americas 2,217 2,166 +2% 751 709 +6% 762 Middle East and Asia 2,205 2,192 +1% 16 |
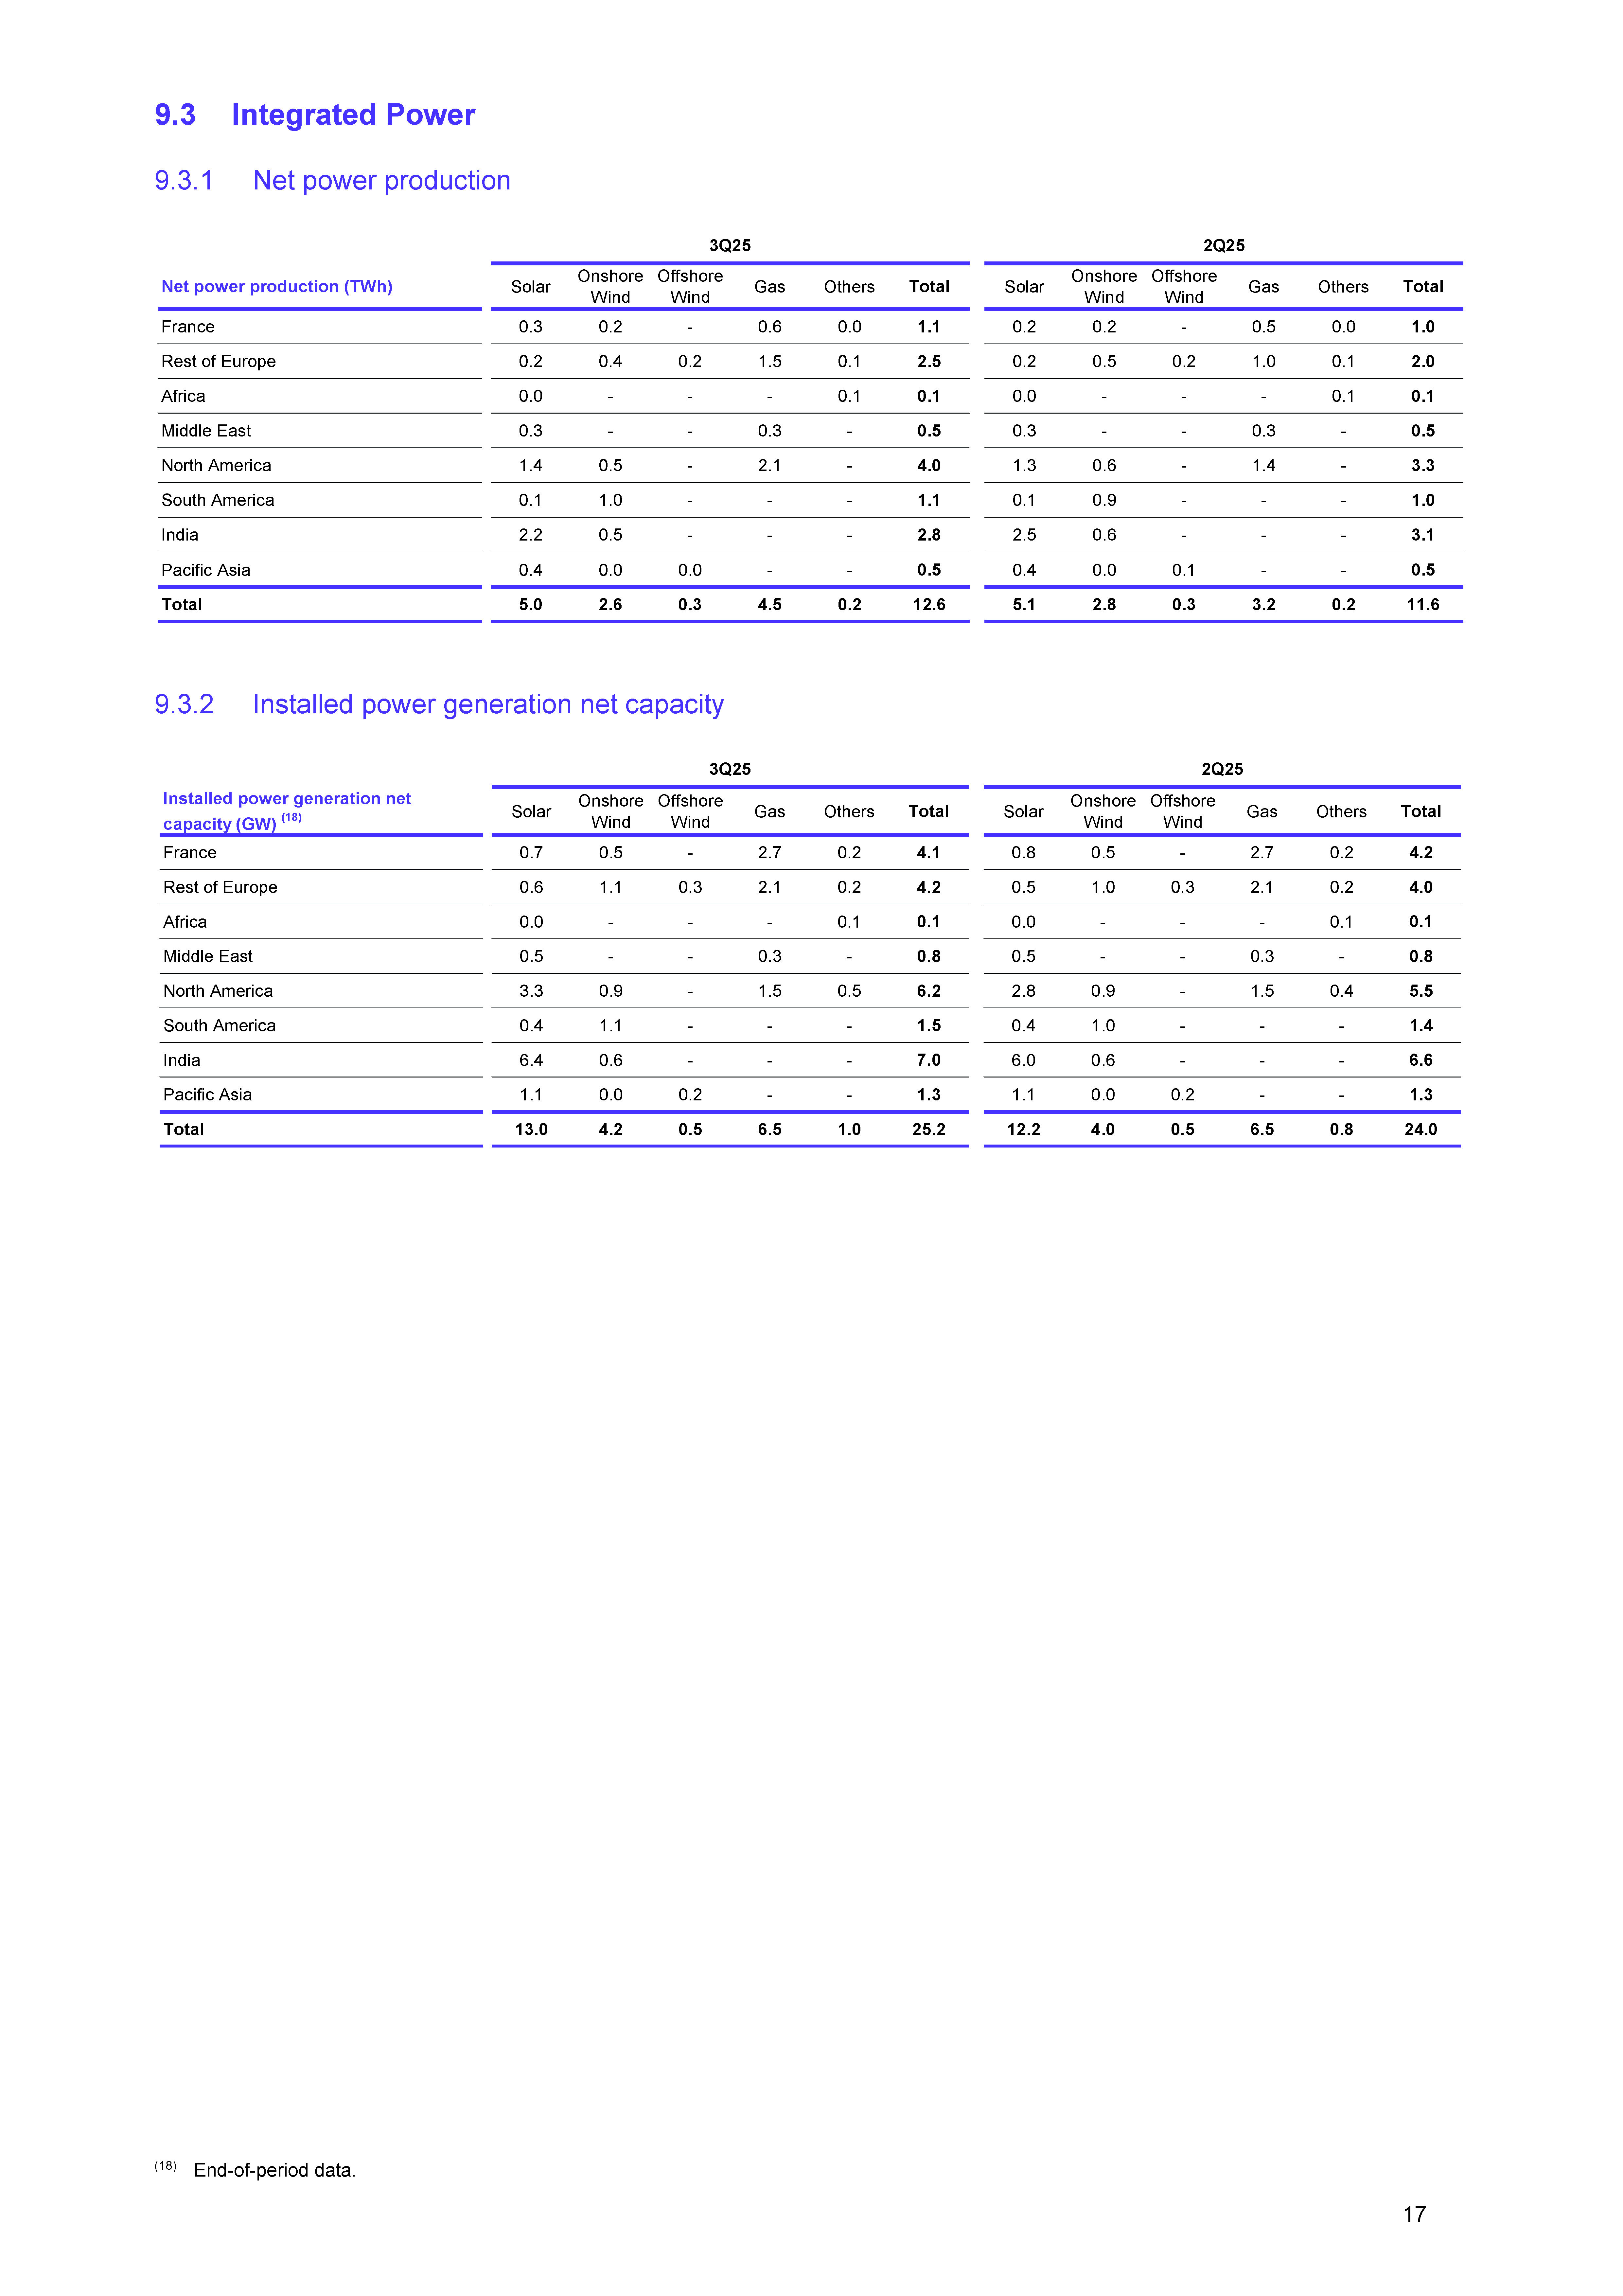
| 9.3 Integrated Power 9.3.1 Net power production 9.3.2 Installed power generation net capacity * (18) End-of-period data. Net power production (TWh) Solar Onshore Wind Offshore Wind Gas Others Total Solar Onshore Wind Offshore Wind Gas Others Total France 0.3 0.2 - 0.6 0.0 1.1 0.2 0.2 - 0.5 0.0 1.0 Rest of Europe 0.2 0.4 0.2 1.5 0.1 2.5 0.2 0.5 0.2 1.0 0.1 2.0 Africa 0.0 - - - 0.1 0.1 0.0 - - - 0.1 0.1 Middle East 0.3 - - 0.3 - 0.5 0.3 - - 0.3 - 0.5 North America 1.4 0.5 - 2.1 - 4.0 1.3 0.6 - 1.4 - 3.3 South America 0.1 1.0 - - - 1.1 0.1 0.9 - - - 1.0 India 2.2 0.5 - - - 2.8 2.5 0.6 - - - 3.1 Pacific Asia 0.4 0.0 0.0 - - 0.5 0.4 0.0 0.1 - - 0.5 Total 5.0 2.6 0.3 4.5 0.2 12.6 5.1 2.8 0.3 3.2 0.2 11.6 3Q25 2Q25 Installed power generation net capacity (GW) (18) Solar Onshore Wind Offshore Wind Gas Others Total Solar Onshore Wind Offshore Wind Gas Others Total France 0.7 0.5 - 2.7 0.2 4.1 0.8 0.5 - 2.7 0.2 4.2 Rest of Europe 0.6 1.1 0.3 2.1 0.2 4.2 0.5 1.0 0.3 2.1 0.2 4.0 Africa 0.0 - - - 0.1 0.1 0.0 - - - 0.1 0.1 Middle East 0.5 - - 0.3 - 0.8 0.5 - - 0.3 - 0.8 North America 3.3 0.9 - 1.5 0.5 6.2 2.8 0.9 - 1.5 0.4 5.5 South America 0.4 1.1 - - - 1.5 0.4 1.0 - - - 1.4 India 6.4 0.6 - - - 7.0 6.0 0.6 - - - 6.6 Pacific Asia 1.1 0.0 0.2 - - 1.3 1.1 0.0 0.2 - - 1.3 Total 13.0 4.2 0.5 6.5 1.0 25.2 12.2 4.0 0.5 6.5 0.8 24.0 3Q25 2Q25 17 |
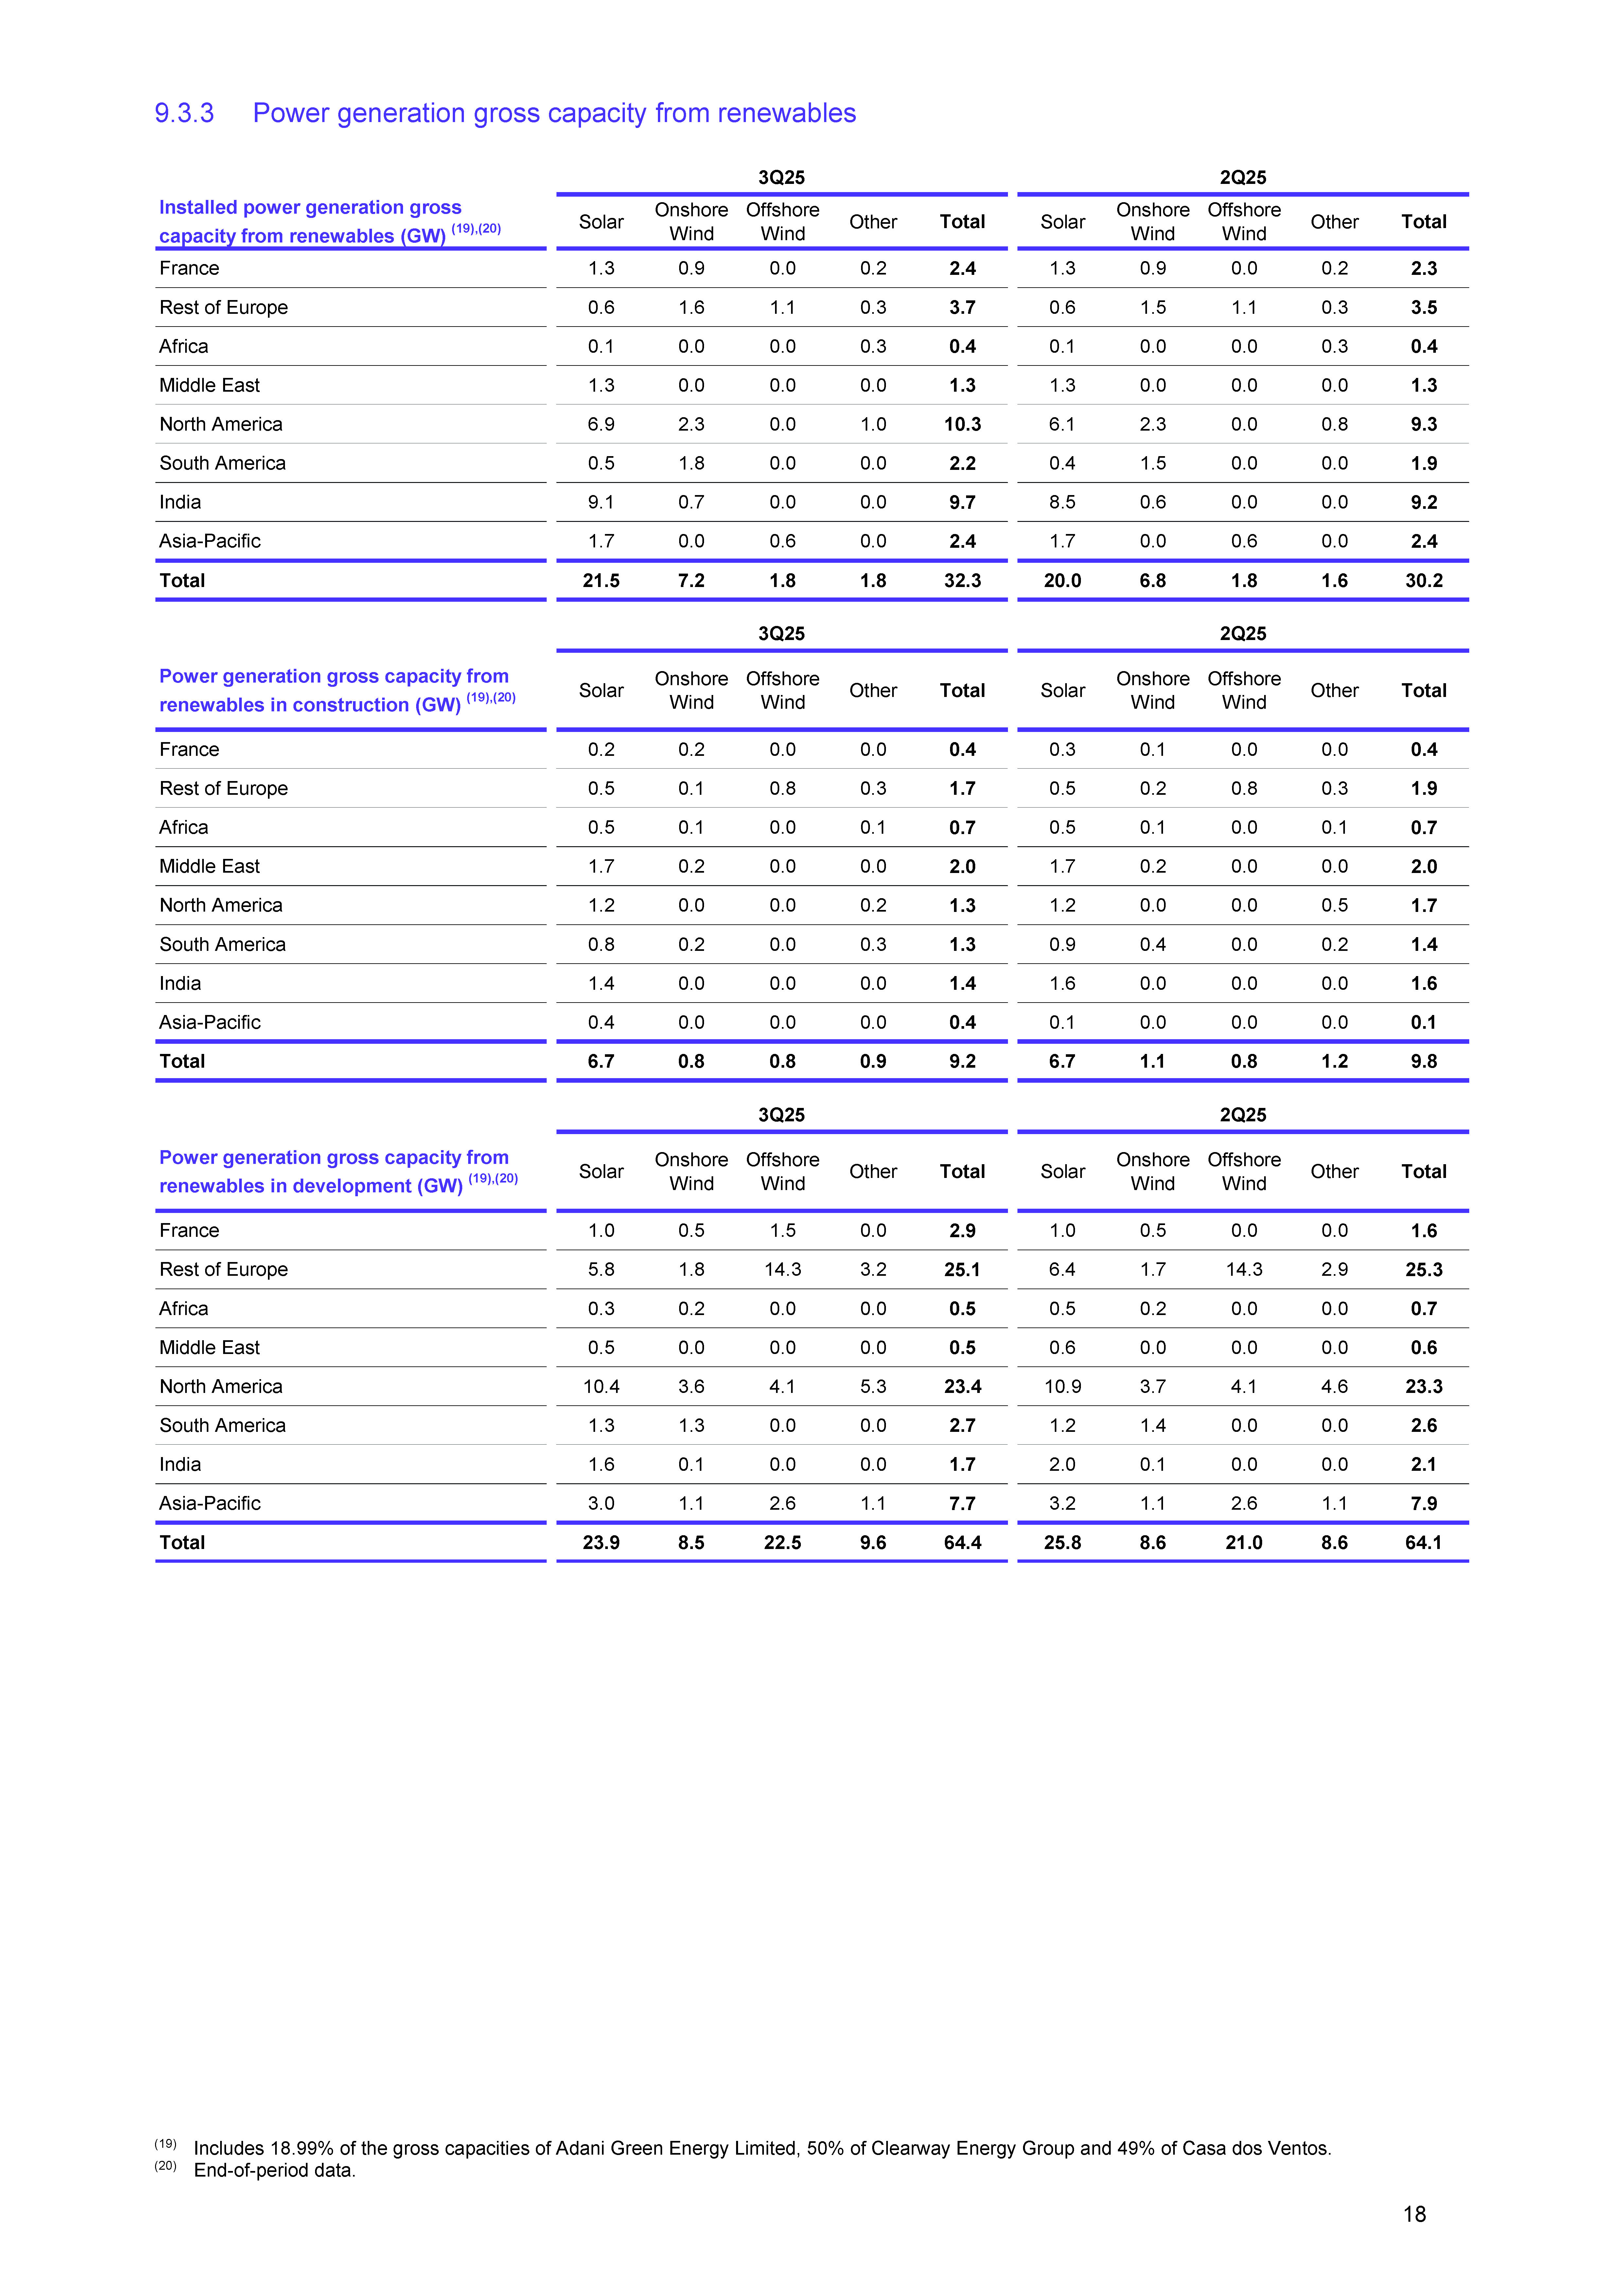
| 9.3.3 Power generation gross capacity from renewables * (19) Includes 18.99% of the gross capacities of Adani Green Energy Limited, 50% of Clearway Energy Group and 49% of Casa dos Ventos. (20) End-of-period data. Installed power generation gross capacity from renewables (GW) (19),(20) Solar Onshore Wind Offshore Wind Other Total Solar Onshore Wind Offshore Wind Other Total France 1.3 0.9 0.0 0.2 2.4 1.3 0.9 0.0 0.2 2.3 Rest of Europe 0.6 1.6 1.1 0.3 3.7 0.6 1.5 1.1 0.3 3.5 Africa 0.1 0.0 0.0 0.3 0.4 0.1 0.0 0.0 0.3 0.4 Middle East 1.3 0.0 0.0 0.0 1.3 1.3 0.0 0.0 0.0 1.3 North America 6.9 2.3 0.0 1.0 10.3 6.1 2.3 0.0 0.8 9.3 South America 0.5 1.8 0.0 0.0 2.2 0.4 1.5 0.0 0.0 1.9 India 9.1 0.7 0.0 0.0 9.7 8.5 0.6 0.0 0.0 9.2 Asia-Pacific 1.7 0.0 0.6 0.0 2.4 1.7 0.0 0.6 0.0 2.4 Total 21.5 7.2 1.8 1.8 32.3 20.0 6.8 1.8 1.6 30.2 Power generation gross capacity from renewables in construction (GW) (19),(20) Solar Onshore Wind Offshore Wind Other Total Solar Onshore Wind Offshore Wind Other Total France 0.2 0.2 0.0 0.0 0.4 0.3 0.1 0.0 0.0 0.4 Rest of Europe 0.5 0.1 0.8 0.3 1.7 0.5 0.2 0.8 0.3 1.9 Africa 0.5 0.1 0.0 0.1 0.7 0.5 0.1 0.0 0.1 0.7 Middle East 1.7 0.2 0.0 0.0 2.0 1.7 0.2 0.0 0.0 2.0 North America 1.2 0.0 0.0 0.2 1.3 1.2 0.0 0.0 0.5 1.7 South America 0.8 0.2 0.0 0.3 1.3 0.9 0.4 0.0 0.2 1.4 India 1.4 0.0 0.0 0.0 1.4 1.6 0.0 0.0 0.0 1.6 Asia-Pacific 0.4 0.0 0.0 0.0 0.4 0.1 0.0 0.0 0.0 0.1 Total 6.7 0.8 0.8 0.9 9.2 6.7 1.1 0.8 1.2 9.8 Power generation gross capacity from renewables in development (GW) (19),(20) Solar Onshore Wind Offshore Wind Other Total Solar Onshore Wind Offshore Wind Other Total France 1.0 0.5 1.5 0.0 2.9 1.0 0.5 0.0 0.0 1.6 Rest of Europe 5.8 1.8 14.3 3.2 25.1 6.4 1.7 14.3 2.9 25.3 Africa 0.3 0.2 0.0 0.0 0.5 0.5 0.2 0.0 0.0 0.7 Middle East 0.5 0.0 0.0 0.0 0.5 0.6 0.0 0.0 0.0 0.6 North America 10.4 3.6 4.1 5.3 23.4 10.9 3.7 4.1 4.6 23.3 South America 1.3 1.3 0.0 0.0 2.7 1.2 1.4 0.0 0.0 2.6 India 1.6 0.1 0.0 0.0 1.7 2.0 0.1 0.0 0.0 2.1 Asia-Pacific 3.0 1.1 2.6 1.1 7.7 3.2 1.1 2.6 1.1 7.9 Total 23.9 8.5 22.5 9.6 64.4 25.8 8.6 21.0 8.6 64.1 3Q25 2Q25 3Q25 2Q25 3Q25 2Q25 18 |
| 10. Alternative Performance Measures (Non-GAAP measures) 10.1 Adjustment items to net income (TotalEnergies share) 3Q25 2Q25 3Q24 In millions of dollars 9M25 9M24 3,683 2,687 2,294 Net income (TotalEnergies share) 10,221 11,802 (93) (340) (1,337) Special items affecting net income (TotalEnergies share) (541) (806) 284 - - Gain (loss) on asset sales 284 1,397 (7) - (10) Restructuring charges (7) (21) (286) (209) (1,100) Impairments (495) (1,744) (84) (131) (227) Other (323) (438) (32) (268) (359) After-tax inventory effect : FIFO vs. replacement cost (378) (555) (172) (283) (84) Effect of changes in fair value (610) (695) (297) (891) (1,780) Total adjustments affecting net income (1,529) (2,056) 3,980 3,578 4,074 Adjusted net income (TotalEnergies share) 11,750 13,858 19 |
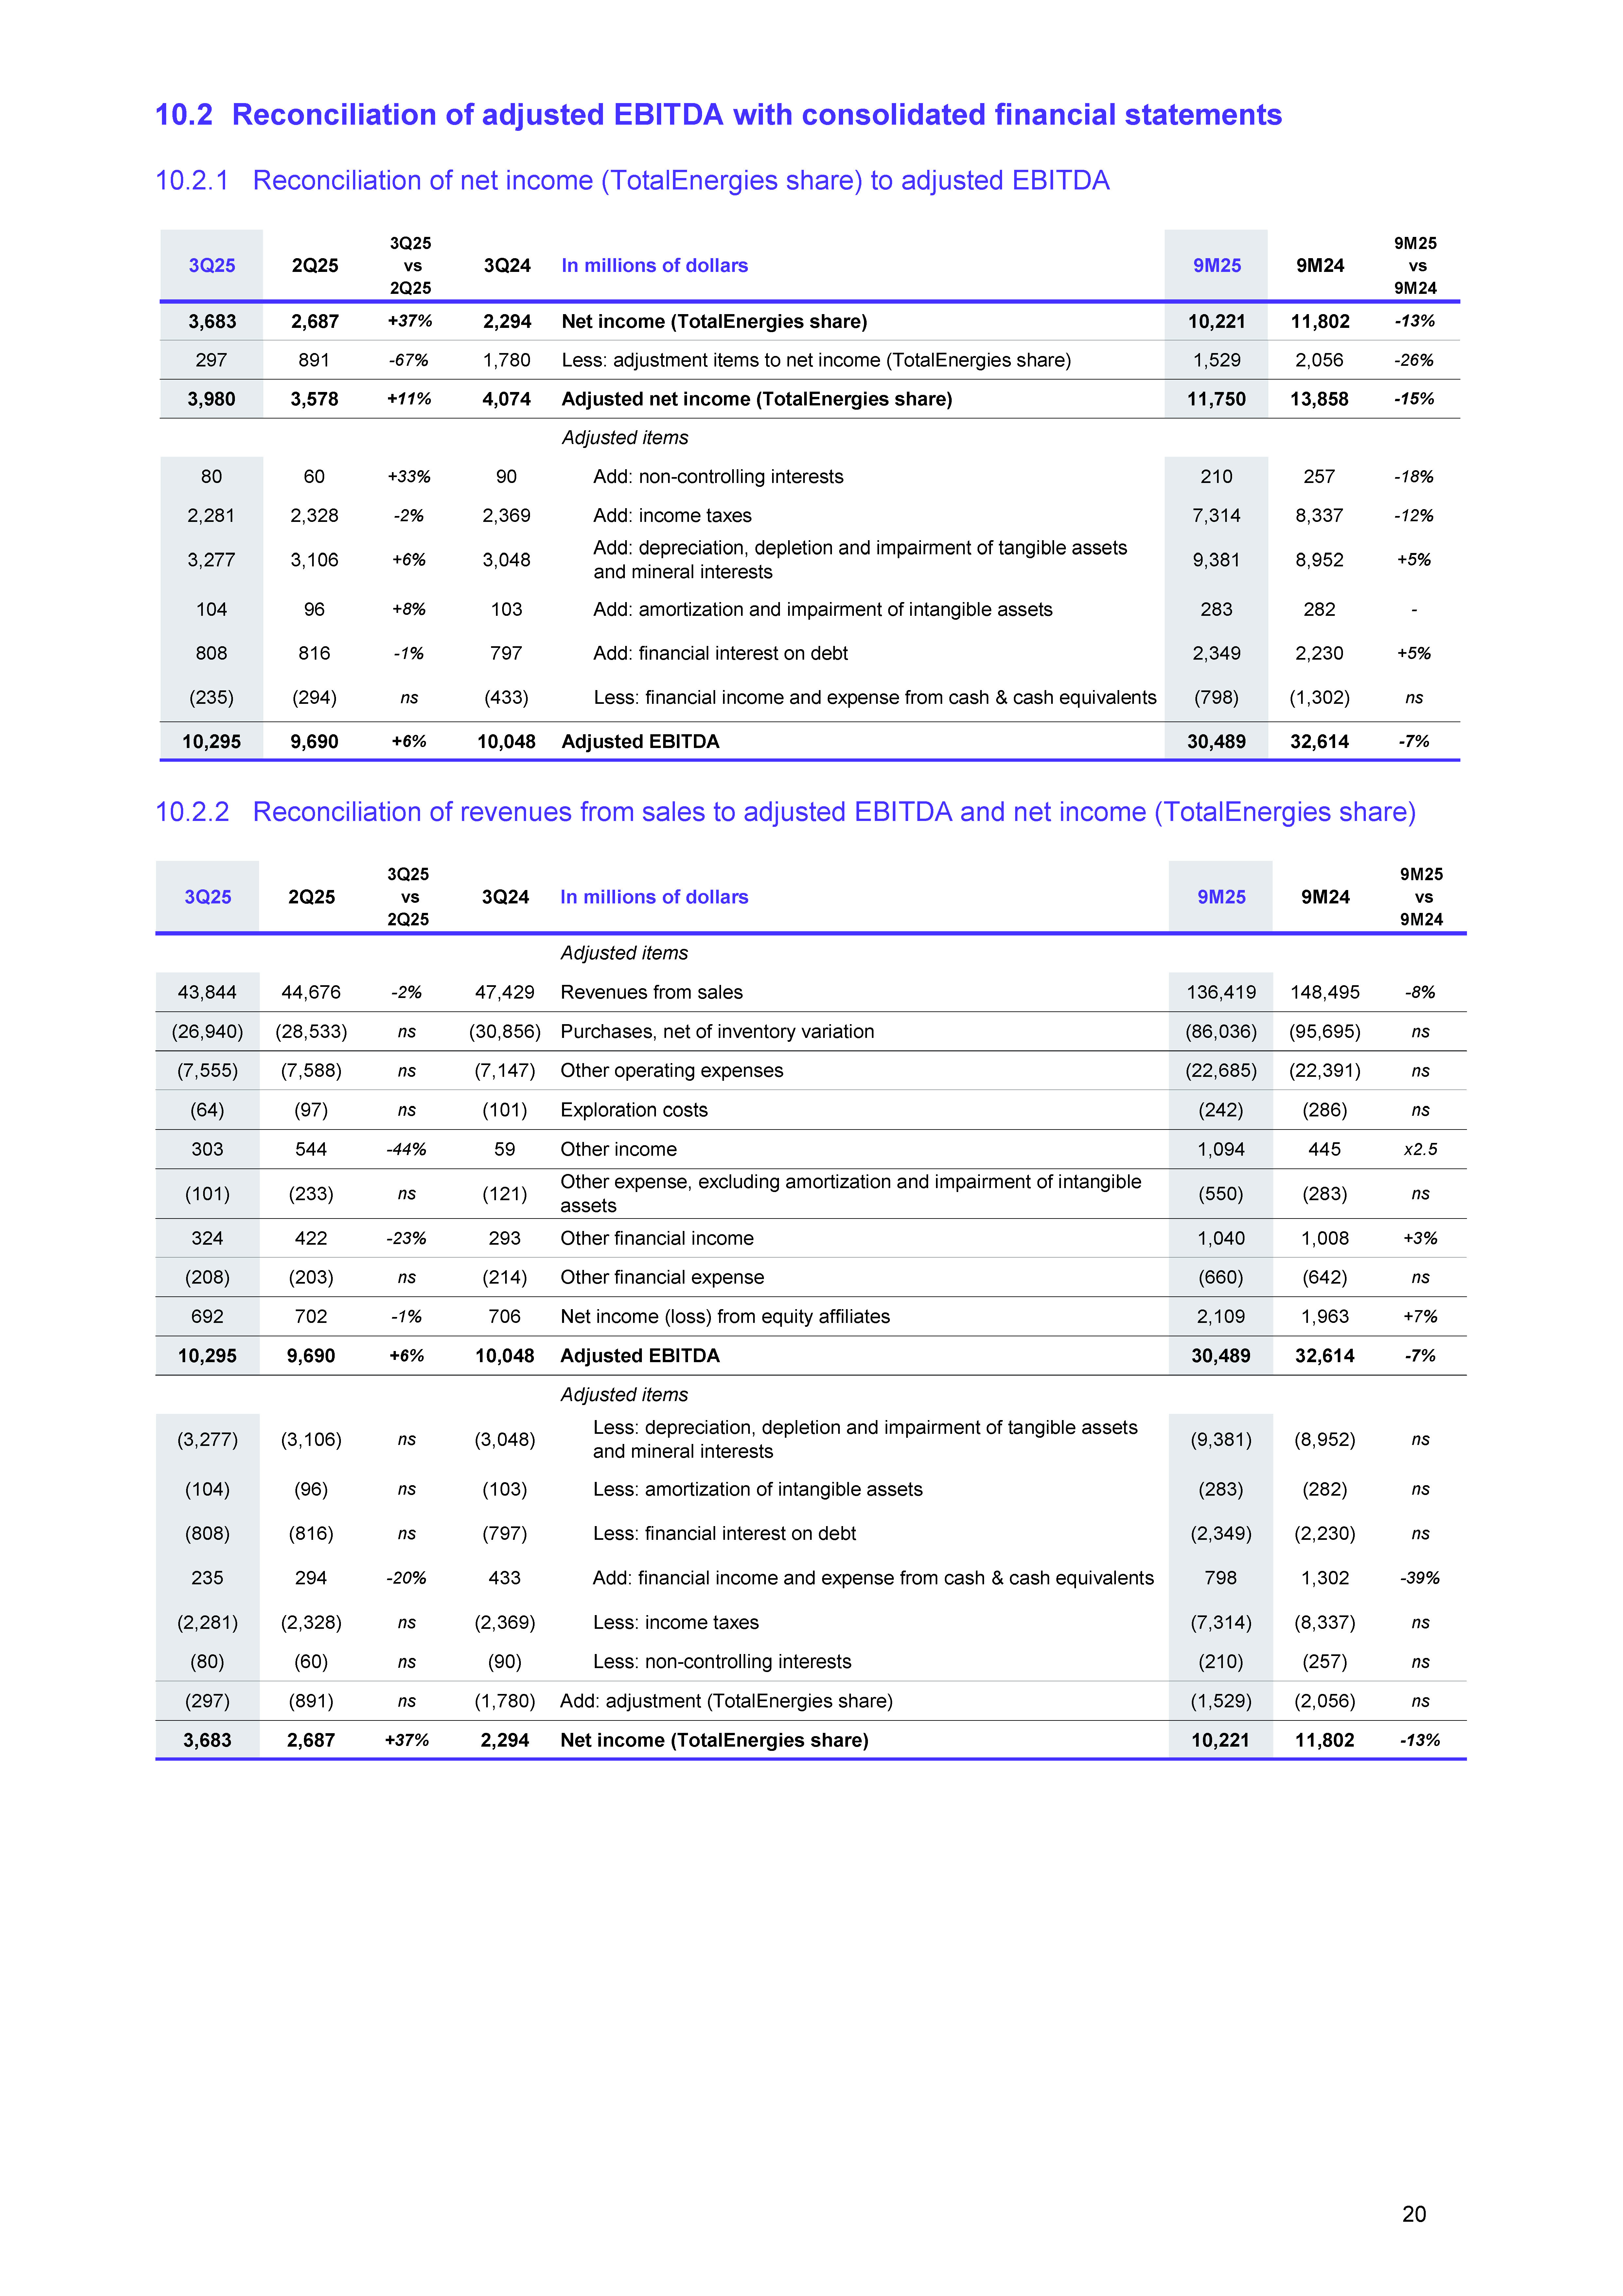
| 10.2 Reconciliation of adjusted EBITDA with consolidated financial statements 10.2.1 Reconciliation of net income (TotalEnergies share) to adjusted EBITDA 10.2.2 Reconciliation of revenues from sales to adjusted EBITDA and net income (TotalEnergies share) 3Q25 2Q25 3Q25 vs 2Q25 3Q24 In millions of dollars 9M25 9M24 9M25 vs 9M24 3,683 2,687 +37% 2,294 Net income (TotalEnergies share) 10,221 11,802 -13% 297 891 -67% 1,780 Less: adjustment items to net income (TotalEnergies share) 1,529 2,056 -26% 3,980 3,578 +11% 4,074 Adjusted net income (TotalEnergies share) 11,750 13,858 -15% Adjusted items 80 60 +33% 90 Add: non-controlling interests 210 257 -18% 2,281 2,328 -2% 2,369 Add: income taxes 7,314 8,337 -12% 3,277 3,106 +6% 3,048 Add: depreciation, depletion and impairment of tangible assets and mineral interests 9,381 8,952 +5% 104 96 +8% 103 Add: amortization and impairment of intangible assets 283 282 - 808 816 -1% 797 Add: financial interest on debt 2,349 2,230 +5% (235) (294) ns (433) Less: financial income and expense from cash & cash equivalents (798) (1,302) ns 10,295 9,690 +6% 10,048 Adjusted EBITDA 30,489 32,614 -7% 3Q25 2Q25 3Q25 vs 2Q25 3Q24 In millions of dollars 9M25 9M24 9M25 vs 9M24 Adjusted items 43,844 44,676 -2% 47,429 Revenues from sales 136,419 148,495 -8% (26,940) (28,533) ns (30,856) Purchases, net of inventory variation (86,036) (95,695) ns (7,555) (7,588) ns (7,147) Other operating expenses (22,685) (22,391) ns (64) (97) ns (101) Exploration costs (242) (286) ns 303 544 -44% 59 Other income 1,094 445 x2.5 (101) (233) ns (121) Other expense, excluding amortization and impairment of intangible assets (550) (283) ns 324 422 -23% 293 Other financial income 1,040 1,008 +3% (208) (203) ns (214) Other financial expense (660) (642) ns 692 702 -1% 706 Net income (loss) from equity affiliates 2,109 1,963 +7% 10,295 9,690 +6% 10,048 Adjusted EBITDA 30,489 32,614 -7% Adjusted items (3,277) (3,106) ns (3,048) Less: depreciation, depletion and impairment of tangible assets and mineral interests (9,381) (8,952) ns (104) (96) ns (103) Less: amortization of intangible assets (283) (282) ns (808) (816) ns (797) Less: financial interest on debt (2,349) (2,230) ns 235 294 -20% 433 Add: financial income and expense from cash & cash equivalents 798 1,302 -39% (2,281) (2,328) ns (2,369) Less: income taxes (7,314) (8,337) ns (80) (60) ns (90) Less: non-controlling interests (210) (257) ns (297) (891) ns (1,780) Add: adjustment (TotalEnergies share) (1,529) (2,056) ns 3,683 2,687 +37% 2,294 Net income (TotalEnergies share) 10,221 11,802 -13% 20 |
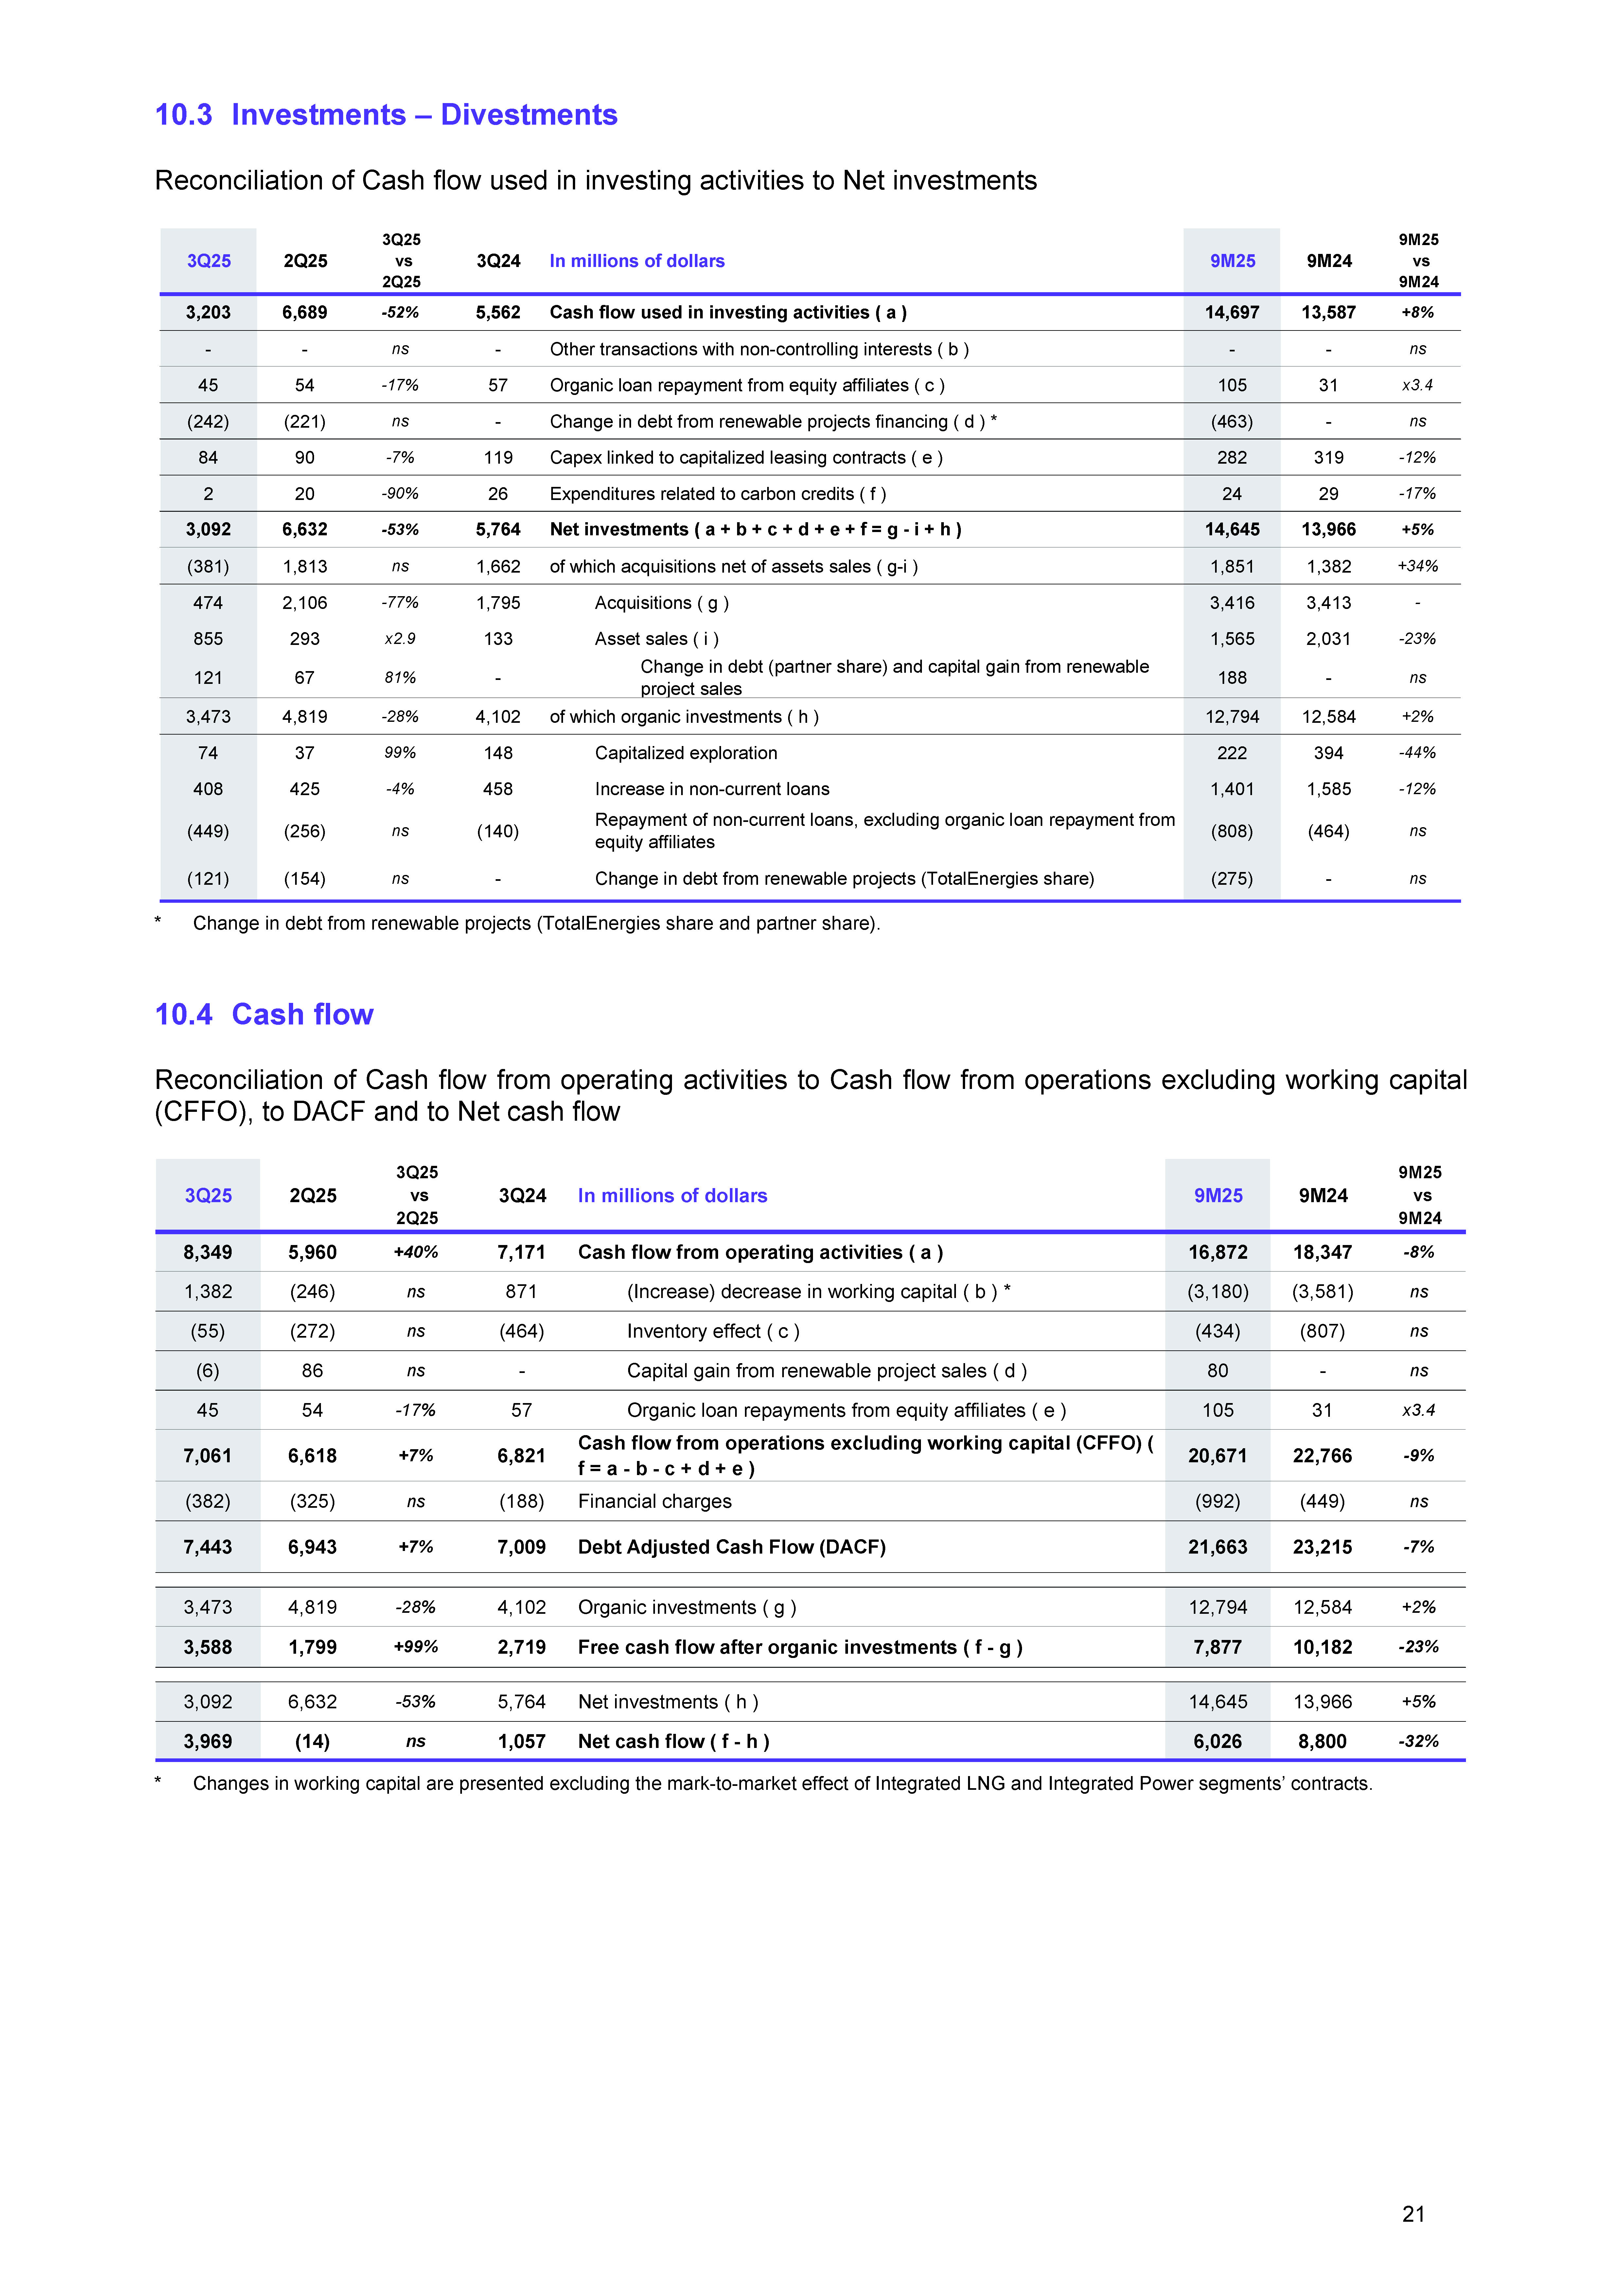
| 10.3 Investments – Divestments Reconciliation of Cash flow used in investing activities to Net investments * Change in debt from renewable projects (TotalEnergies share and partner share). 10.4 Cash flow Reconciliation of Cash flow from operating activities to Cash flow from operations excluding working capital (CFFO), to DACF and to Net cash flow * Changes in working capital are presented excluding the mark-to-market effect of Integrated LNG and Integrated Power segments’ contracts. 3Q25 2Q25 3Q25 vs 2Q25 3Q24 In millions of dollars 9M25 9M24 9M25 vs 9M24 3,203 6,689 -52% 5,562 Cash flow used in investing activities ( a ) 14,697 13,587 +8% - - ns - Other transactions with non-controlling interests ( b ) - - ns 45 54 -17% 57 Organic loan repayment from equity affiliates ( c ) 105 31 x3.4 (242) (221) ns - Change in debt from renewable projects financing ( d ) * (463) - ns 84 90 -7% 119 Capex linked to capitalized leasing contracts ( e ) 282 319 -12% 2 20 -90% 26 Expenditures related to carbon credits ( f ) 24 29 -17% 3,092 6,632 -53% 5,764 Net investments ( a + b + c + d + e + f = g - i + h ) 14,645 13,966 +5% (381) 1,813 ns 1,662 of which acquisitions net of assets sales ( g-i ) 1,851 1,382 +34% 474 2,106 -77% 1,795 Acquisitions ( g ) 3,416 3,413 - 855 293 x2.9 133 Asset sales ( i ) 1,565 2,031 -23% 121 67 81% - Change in debt (partner share) and capital gain from renewable project sales 188 - ns 3,473 4,819 -28% 4,102 of which organic investments ( h ) 12,794 12,584 +2% 74 37 99% 148 Capitalized exploration 222 394 -44% 408 425 -4% 458 Increase in non-current loans 1,401 1,585 -12% (449) (256) ns (140) Repayment of non-current loans, excluding organic loan repayment from equity affiliates (808) (464) ns (121) (154) ns - Change in debt from renewable projects (TotalEnergies share) (275) - ns 3Q25 2Q25 3Q25 vs 2Q25 3Q24 In millions of dollars 9M25 9M24 9M25 vs 9M24 8,349 5,960 +40% 7,171 Cash flow from operating activities ( a ) 16,872 18,347 -8% 1,382 (246) ns 871 (Increase) decrease in working capital ( b ) * (3,180) (3,581) ns (55) (272) ns (464) Inventory effect ( c ) (434) (807) ns (6) 86 ns - Capital gain from renewable project sales ( d ) 80 - ns 45 54 -17% 57 Organic loan repayments from equity affiliates ( e ) 105 31 x3.4 7,061 6,618 +7% 6,821 Cash flow from operations excluding working capital (CFFO) ( f = a - b - c + d + e ) 20,671 22,766 -9% (382) (325) ns (188) Financial charges (992) (449) ns 7,443 6,943 +7% 7,009 Debt Adjusted Cash Flow (DACF) 21,663 23,215 -7% 3,473 4,819 -28% 4,102 Organic investments ( g ) 12,794 12,584 +2% 3,588 1,799 +99% 2,719 Free cash flow after organic investments ( f - g ) 7,877 10,182 -23% 3,092 6,632 -53% 5,764 Net investments ( h ) 14,645 13,966 +5% 3,969 (14) ns 1,057 Net cash flow ( f - h ) 6,026 8,800 -32% 21 |
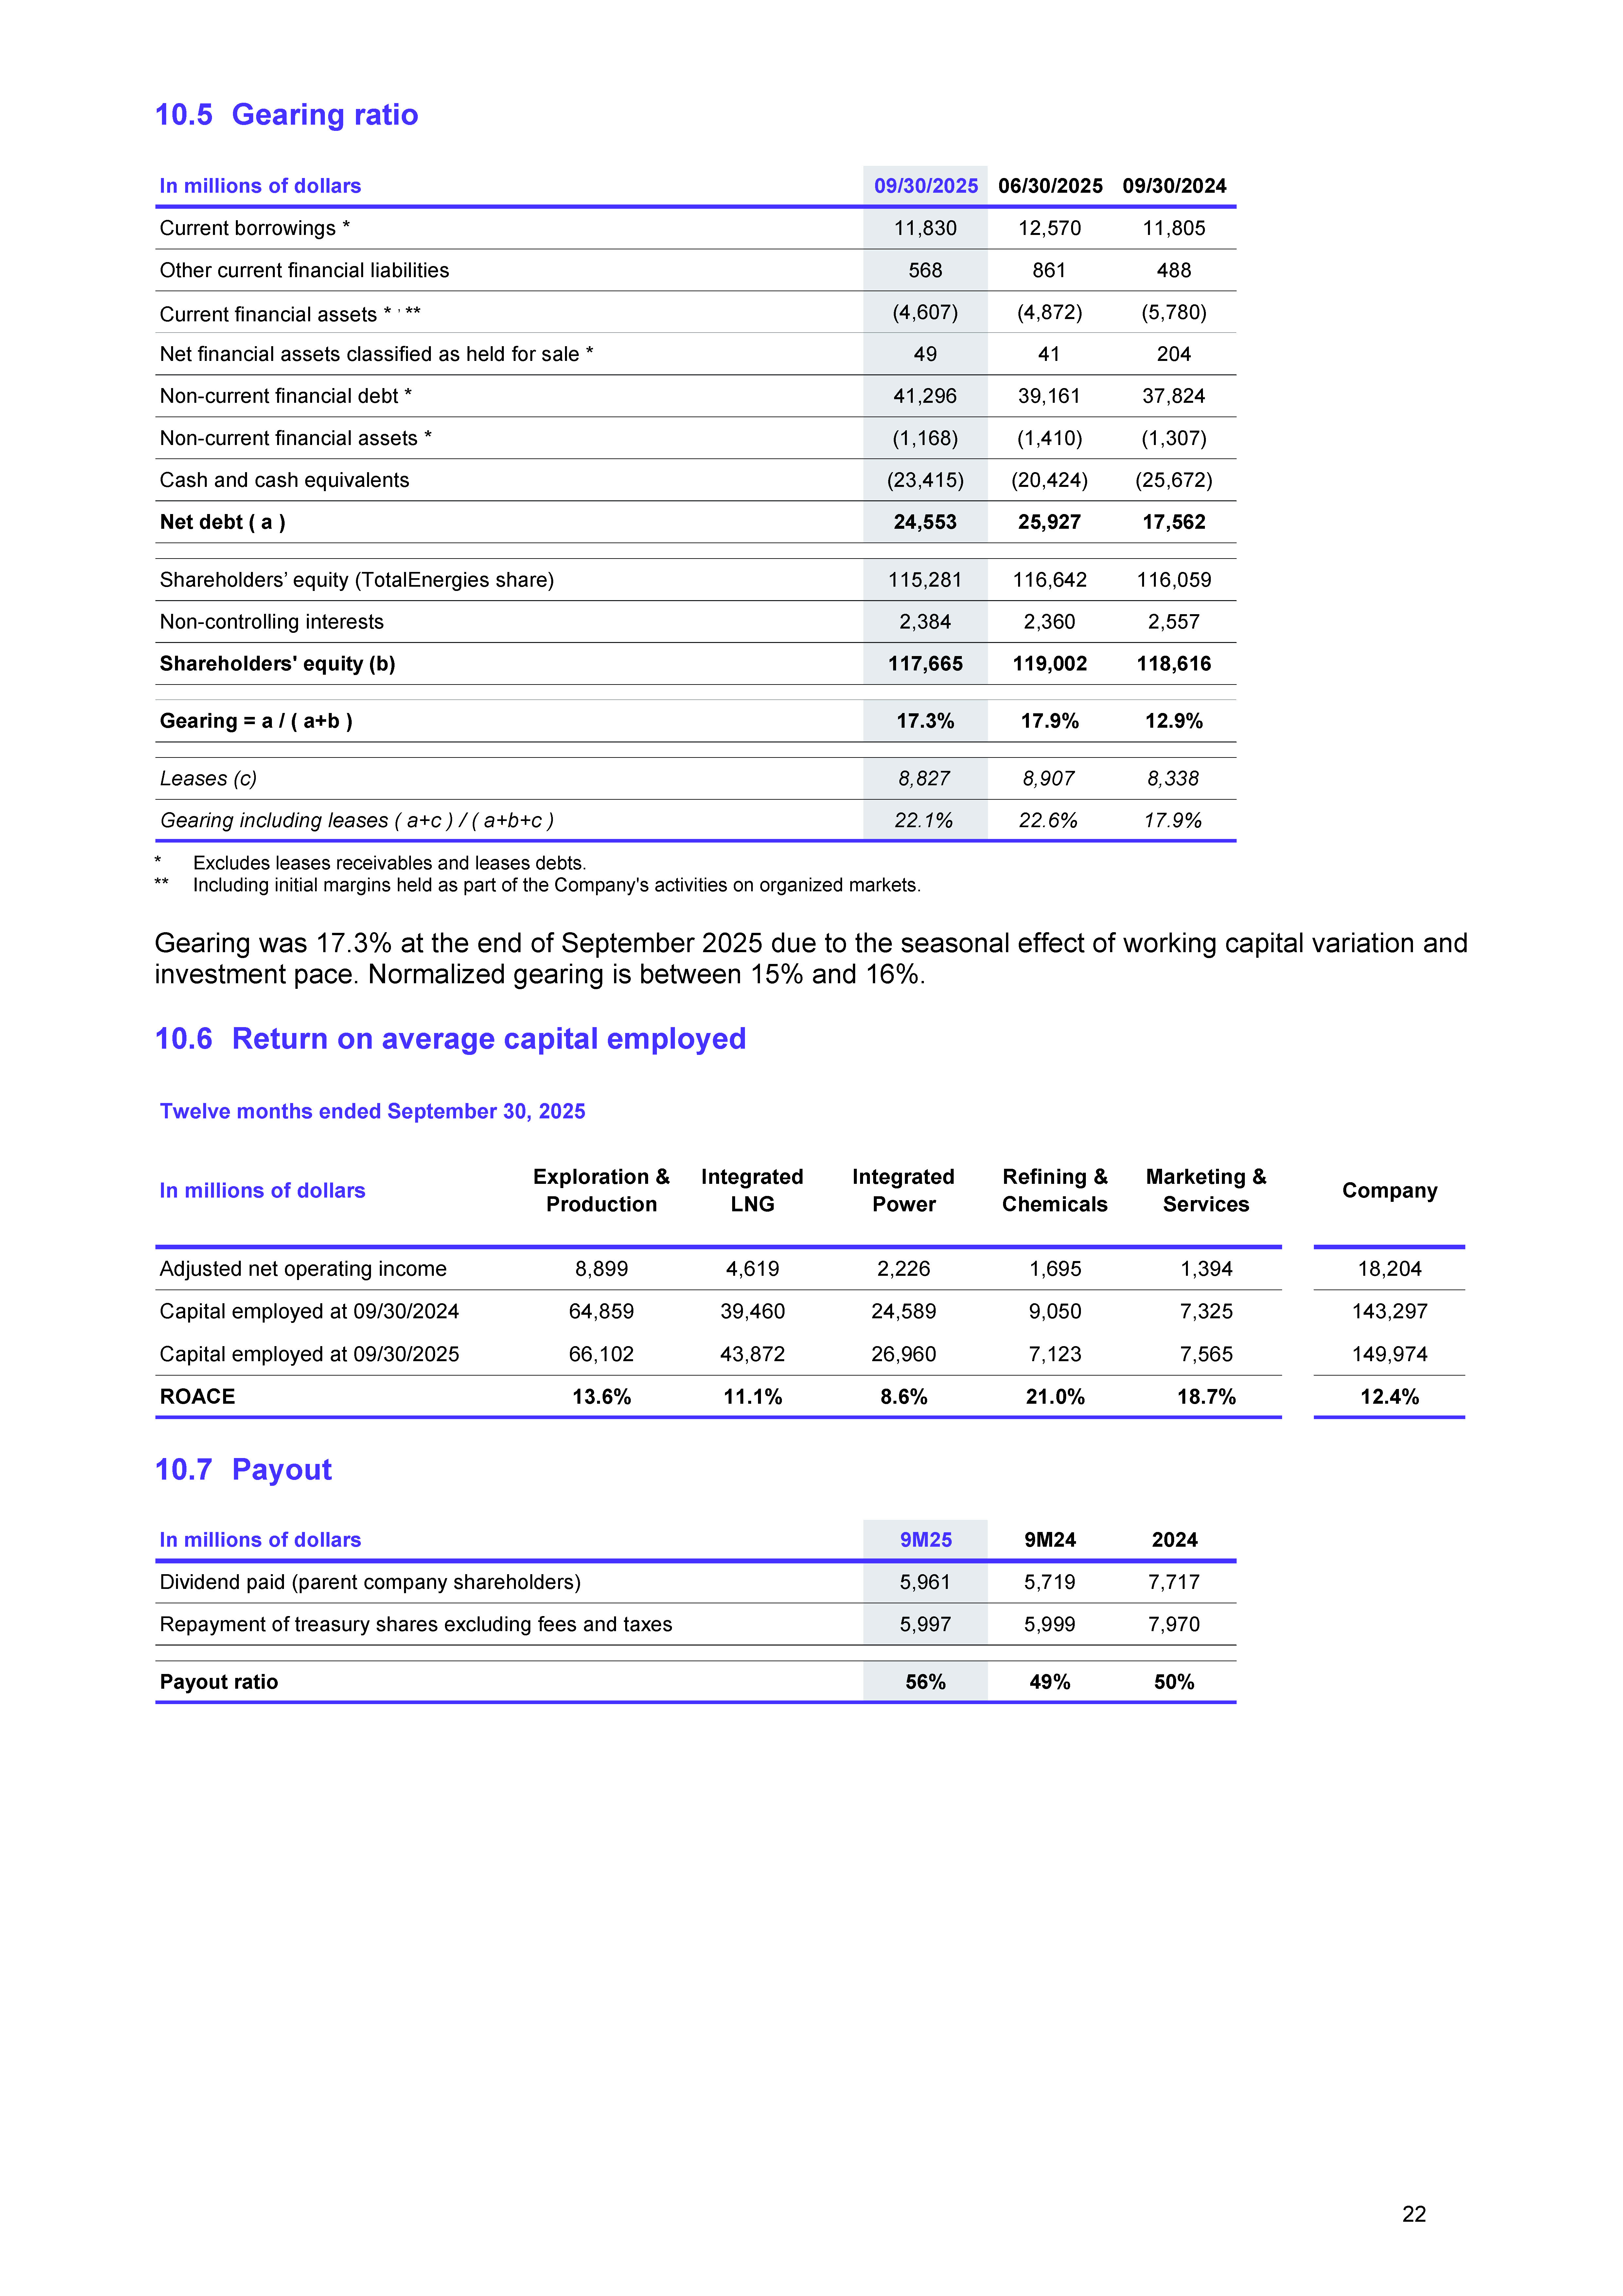
| 10.5 Gearing ratio * Excludes leases receivables and leases debts. ** Including initial margins held as part of the Company's activities on organized markets. Gearing was 17.3% at the end of September 2025 due to the seasonal effect of working capital variation and investment pace. Normalized gearing is between 15% and 16%. 10.6 Return on average capital employed 10.7 Payout In millions of dollars 09/30/2025 06/30/2025 09/30/2024 Current borrowings * 11,830 12,570 11,805 Other current financial liabilities 568 861 488 Current financial assets * , ** (4,607) (4,872) (5,780) Net financial assets classified as held for sale * 49 41 204 Non-current financial debt * 41,296 39,161 37,824 Non-current financial assets * (1,168) (1,410) (1,307) Cash and cash equivalents (23,415) (20,424) (25,672) Net debt ( a ) 24,553 25,927 17,562 Shareholders’ equity (TotalEnergies share) 115,281 116,642 116,059 Non-controlling interests 2,384 2,360 2,557 Shareholders' equity (b) 117,665 119,002 118,616 Gearing = a / ( a+b ) 17.3% 17.9% 12.9% Leases (c) 8,827 8,907 8,338 Gearing including leases ( a+c ) / ( a+b+c ) 22.1% 22.6% 17.9% Twelve months ended September 30, 2025 In millions of dollars Exploration & Production Integrated LNG Integrated Power Refining & Chemicals Marketing & Services Company Adjusted net operating income 8,899 4,619 2,226 1,695 1,394 18,204 Capital employed at 09/30/2024 64,859 39,460 24,589 9,050 7,325 143,297 Capital employed at 09/30/2025 66,102 43,872 26,960 7,123 7,565 149,974 ROACE 13.6% 11.1% 8.6% 21.0% 18.7% 12.4% In millions of dollars 9M25 9M24 2024 Dividend paid (parent company shareholders) 5,961 5,719 7,717 Repayment of treasury shares excluding fees and taxes 5,997 5,999 7,970 Payout ratio 56% 49% 50% 22 |
| GLOSSARY Acquisitions net of assets sales is a non-GAAP financial measure and its most directly comparable IFRS measure is Cash flow used in investing activities. Acquisitions net of assets sales refer to acquisitions minus assets sales (including other operations with non-controlling interests). This indicator can be a valuable tool for decision makers, analysts and shareholders alike because it illustrates the allocation of cash flow used for growing the Company’s asset base via external growth opportunities. Adjusted EBITDA (Earnings Before Interest, Tax, Depreciation and Amortization) is a non-GAAP financial measure and its most directly comparable IFRS measure is Net Income. It refers to the adjusted earnings before depreciation, depletion and impairment of tangible and intangible assets and mineral interests, income tax expense and cost of net debt, i.e., all operating income and contribution of equity affiliates to net income. This indicator can be a valuable tool for decision makers, analysts and shareholders alike to measure and compare the Company’s profitability with utility companies (energy sector). Adjusted net income (TotalEnergies share) is a non-GAAP financial measure and its most directly comparable IFRS measure is Net Income (TotalEnergies share). Adjusted Net Income (TotalEnergies share) refers to Net Income (TotalEnergies share) less adjustment items to Net Income (TotalEnergies share). Adjustment items are inventory valuation effect, effect of changes in fair value, and special items. This indicator can be a valuable tool for decision makers, analysts and shareholders alike to evaluate the Company’s operating results and to understand its operating trends by removing the impact of non-operational results and special items. Adjusted net operating income is a non-GAAP financial measure and its most directly comparable IFRS measure is Net Income. Adjusted Net Operating Income refers to Net Income before net cost of net debt, i.e., cost of net debt net of its tax effects, less adjustment items. Adjustment items are inventory valuation effect, effect of changes in fair value, and special items. Adjusted Net Operating Income can be a valuable tool for decision makers, analysts and shareholders alike to evaluate the Company’s operating results and understanding its operating trends, by removing the impact of non-operational results and special items and is used to evaluate the Return on Average Capital Employed (ROACE) as explained below. Capital Employed is a non-GAAP financial measure. They are calculated at replacement cost and refer to capital employed (balance sheet) less inventory valuations effect. Capital employed (balance sheet) refers to the sum of the following items: (i) Property, plant and equipment, intangible assets, net, (ii) Investments & loans in equity affiliates, (iii) Other non-current assets, (iv) Working capital which is the sum of: Inventories, net, Accounts receivable, net, other current assets, Accounts payable, Other creditors and accrued liabilities, (v) Provisions and other non-current liabilities and (vi) Assets and liabilities classified as held for sale. Capital Employed can be a valuable tool for decision makers, analysts and shareholders alike to provide insight on the amount of capital investment used by the Company or its business segments to operate. Capital Employed is used to calculate the Return on Average Capital Employed (ROACE). Cash Flow From Operations excluding working capital (CFFO) is a non-GAAP financial measure and its most directly comparable IFRS measure is Cash flow from operating activities. Cash Flow From Operations excluding working capital is defined as cash flow from operating activities before changes in working capital at replacement cost, excluding the mark-to-market effect of Integrated LNG and Integrated Power contracts, including capital gain from renewable projects sales and including organic loan repayments from equity affiliates. This indicator can be a valuable tool for decision makers, analysts and shareholders alike to help understand changes in cash flow from operating activities, excluding the impact of working capital changes across periods on a consistent basis and with the performance of peer companies in a manner that, when viewed in combination with the Company’s results prepared in accordance with GAAP, provides a more complete understanding of the factors and trends affecting the Company’s business and performance. This performance indicator is used by the Company as a base for its cash flow allocation and notably to guide on the share of its cash flow to be allocated to the distribution to shareholders. Debt adjusted cash flow (DACF) is a non-GAAP financial measure and its most directly comparable IFRS measure is Cash flow from operating activities. DACF is defined as Cash Flow From Operations excluding working capital (CFFO) without financial charges. This indicator can be a valuable tool for decision makers, analysts and shareholders alike because it corresponds to the funds theoretically available to the Company for investments, debt repayment and distribution to shareholders, and therefore facilitates comparison of the Company’s results of operations with those of other registrants, independent of their capital structure and working capital requirements. ESRS perimeter: the GHG emissions within the ESRS perimeter correspond to 100% of the emissions from operated sites, plus the equity share of emissions from non-operated and financially consolidated assets excluding equity affiliates. Free cash flow after Organic Investments is a non-GAAP financial measure and its most directly comparable IFRS measure is Cash flow from operating activities. Free cash flow after Organic Investments, refers to Cash Flow From Operations excluding working capital minus Organic Investments. Organic Investments refer to Net Investments excluding acquisitions, asset sales and other transactions with non-controlling interests. This indicator can be a valuable tool for decision makers, analysts and shareholders alike because it illustrates operating cash flow generated by the business post allocation of cash for Organic Investments. Gearing is a non-GAAP financial measure and its most directly comparable IFRS measure is the ratio of total financial liabilities to total equity. Gearing is a Net-debt-to-capital ratio, which is calculated as the ratio of Net debt excluding leases to (Equity + Net debt excluding leases). This indicator can be a valuable tool for decision makers, analysts and shareholders alike to assess the strength of the Company’s balance sheet. Normalized Gearing: indicator defined as the gearing excluding the impact of seasonal variations, notably on working capital. Net cash flow (or free cash-flow) is a non-GAAP financial measure and its most directly comparable IFRS measure is Cash flow from operating activities. Net cash flow refers to Cash Flow From Operations excluding working capital minus Net Investments. Net cash flow can be a valuable tool for decision makers, analysts and shareholders alike because it illustrates cash flow generated by the operations of the Company post allocation of cash for Organic Investments and Acquisitions net of assets sales (acquisitions - assets sales - other operations with non-controlling interests). This performance indicator corresponds to the cash flow available to repay debt and allocate cash to shareholder distribution or share buybacks. 23 |
| Net investments is a non-GAAP financial measure and its most directly comparable IFRS measure is Cash flow used in investing activities. Net Investments refer to Cash flow used in investing activities including other transactions with non-controlling interests, including change in debt from renewable projects financing, including expenditures related to carbon credits, including capex linked to capitalized leasing contracts and excluding organic loan repayment from equity affiliates. This indicator can be a valuable tool for decision makers, analysts and shareholders alike to illustrate the cash directed to growth opportunities, both internal and external, thereby showing, when combined with the Company’s cash flow statement prepared under IFRS, how cash is generated and allocated for uses within the organization. Net Investments are the sum of Organic Investments and Acquisitions net of assets sales each of which is described in the Glossary. Organic investments is a non-GAAP financial measure and its most directly comparable IFRS measure is Cash flow used in investing activities. Organic investments refers to Net Investments, excluding acquisitions, asset sales and other operations with non-controlling interests. Organic Investments can be a valuable tool for decision makers, analysts and shareholders alike because it illustrates cash flow used by the Company to grow its asset base, excluding sources of external growth. Operated perimeter: activities, sites and industrial assets of which TotalEnergies SE or one of its subsidiaries has operational control, i.e. has the responsibility of the conduct of operations on behalf of all its partners. For the operated perimeter, the environmental indicators are reported 100%, regardless of the Company’s equity interest in the asset. Payout is a non-GAAP financial measure. Payout is defined as the ratio of the dividends and share buybacks for cancellation to the Cash Flow From Operations excluding working capital. This indicator can be a valuable tool for decision makers, analysts and shareholders as it provides the portion of the Cash Flow From Operations excluding working capital distributed to the shareholder. Return on Average Capital Employed (ROACE) is a non-GAAP financial measure. ROACE is the ratio of Adjusted Net Operating Income to average Capital Employed at replacement cost between the beginning and the end of the period. This indicator can be a valuable tool for decision makers, analysts and shareholders alike to measure the profitability of the Company’s average Capital Employed in its business operations and is used by the Company to benchmark its performance internally and externally with its peers. 24 |
| Disclaimer: The terms “TotalEnergies”, “TotalEnergies company” and “Company” in this document are used to designate TotalEnergies SE and the consolidated entities directly or indirectly controlled by TotalEnergies SE. Likewise, the words “we”, “us” and “our” may also be used to refer to these entities or their employees. The entities in which TotalEnergies SE directly or indirectly owns a shareholding are separate and independent legal entities. This press release presents the results for the third quarter of 2025 and first nine months of 2025 from the condensed consolidated financial statements of TotalEnergies SE as of September 30, 2025 (unaudited). The condensed consolidated financial statements of TotalEnergies SE as of September 30, 2025 have been subject to a limited review by the Statutory Auditors. The notes to the condensed consolidated financial statements are available on the website totalenergies.com. This document contains forward-looking statements (including forward-looking statements within the meaning of the Private Securities Litigation Reform Act of 1995), notably with respect to (i) the financial condition, results of operations, business activities and strategy of TotalEnergies, (ii) expectations regarding returns to stockholders, including with respect to future dividends and share buybacks, (iii) the contemplated conversion of the American Depositary Receipts (ADR), including the termination of the ADR program in connection therewith and (iv) the contemplated listing of TotalEnergies’ ordinary shares on the New York Stock Exchange (“NYSE”). This document may also contain statements regarding the perspectives, objectives and goals of TotalEnergies, including with respect to climate change and carbon neutrality (net zero emissions). An ambition expresses an outcome desired by TotalEnergies, it being specified that the means to be deployed do not depend solely on TotalEnergies. These forward-looking statements may generally be identified by the use of the future or conditional tense or forward-looking words such as “will”, “should”, “could”, “would”, “may”, “likely”, “might”, “envisions”, “intends”, “anticipates”, “believes”, “considers”, “plans”, “expects”, “thinks”, “targets”, “commits”, “aims” or similar terminology. Such forward-looking statements included in this document are based on economic data, estimates and assumptions prepared in a given economic, competitive and regulatory environment and considered to be reasonable by TotalEnergies as of the date of this document. These forward-looking statements are not historical data and should not be interpreted as assurances that the perspectives, objectives or goals announced will be achieved. They may prove to be inaccurate in the future, and may evolve or be modified with a significant difference between the actual results and those initially estimated, due to the uncertainties notably related to the economic, financial, competitive and regulatory environment, or due to the occurrence of risk factors, such as, notably, the price fluctuations in crude oil and natural gas, the evolution of the demand and price of petroleum products, the changes in production results and reserves estimates, the ability to achieve cost reductions and operating efficiencies without unduly disrupting business operations, changes in laws and regulations including those related to the environment and climate, currency fluctuations, technological innovations, meteorological conditions and events, as well as socio-demographic, economic and political developments, changes in market conditions, loss of market share and changes in consumer preferences, pandemics, and other risk factors described from time to time in the Company’s regulatory filings, including its Universal Registration Document filed with the French Autorité des Marchés Financiers, its Annual Report on Form 20 F filed with the United States Securities and Exchange Commission (“SEC”) and its other reports filed or furnished with the SEC. The initial and continued listing of ordinary shares on the NYSE, as well as the contemplated structure to support such listing, remain at the discretion of TotalEnergies’ management, subject to compliance with applicable law and the rules in force on the NYSE, and the implementation and maintenance of the contemplated structure to support such listing. Future interim or final annual dividends payments beyond the interim dividend payable on April 2, 2026 (or April 23, 2026 for holders on the U.S. register) have not yet, respectively, been decided by the Board of Directors or approved by shareholders at a General Meeting. Management’s expectations with respect to such future dividends are “forward-looking statements” and are non-binding. The Board of Directors retains full discretion to decide to distribute an interim dividend and to set the amount and date of the distribution and decide on the dividend to be submitted for approval by shareholders at a General Meeting, based on a number of factors, including TotalEnergies’ financial results, balance sheet strength, cash and liquidity requirements, future prospects, commodity prices, and other factors deemed relevant by the Board. Readers are cautioned not to consider forward-looking statements as accurate, but as an expression of the Company’s views only as of the date this document is published. TotalEnergies SE and its subsidiaries have no obligation, make no commitment and expressly disclaim any responsibility to investors or any stakeholder to update or revise, particularly as a result of new information or future events, any forward-looking information or statement, objectives or trends contained in this document. In addition, the Company has not verified, and is under no obligation to verify any third-party data contained in this document or used in the estimates and assumptions or, more generally, forward-looking statements published in this document. The information on risk factors that could have a significant adverse effect on TotalEnergies’ business, financial condition, including its operating income and cash flow, reputation, outlook or the value of financial instruments issued by TotalEnergies is provided in the most recent version of the Universal Registration Document which is filed by TotalEnergies SE with the French Autorité des Marchés Financiers and the annual report on Form 20-F filed with the SEC. Additionally, the developments of climate change and other environmental-or social related issues in this document are based on various frameworks and the interests of various stakeholders which are subject to evolve independently of our will. Moreover, our disclosures on such issues, including disclosures on climate change and other environmental or social-related issues, may include information that is not necessarily "material" under US securities laws for SEC reporting purposes or under applicable securities law. In addition to IFRS measures, certain alternative performance indicators are presented, such as performance indicators excluding the adjustment items described below (adjusted net operating income, adjusted net income), net cash flow, free cash flow after organic investments, normalized gearing, return on equity (ROE), return on average capital employed (ROACE), gearing ratio, cash flow from operations excluding working capital, debt adjusted cash flow, and the payout ratio. These indicators are meant to facilitate the analysis of the financial performance of TotalEnergies and the comparison of income between periods. They allow investors to track the measures used internally to manage and measure the performance of TotalEnergies. Financial information by business segment is reported in accordance with the internal reporting system and shows internal segment information that is used to manage and measure the performance of TotalEnergies. TotalEnergies measures performance at the segment level on the basis of adjusted net operating income. These adjustment items include: (i) Special items Due to their unusual nature or particular significance, certain transactions qualifying as "special items" are excluded from the business segment figures. In general, special items relate to transactions that are significant, infrequent, or unusual. However, in certain instances, transactions such as restructuring costs or assets disposals, which are not considered to be representative of the normal course of business, may qualify as special items although they may have occurred in prior years or are likely to occur in following years. (ii) The inventory valuation effect In accordance with IAS 2, TotalEnergies values inventories of petroleum products in its financial statements according to the First-In, First-Out (FIFO) method and other inventories using the weighted-average cost method. Under the FIFO method, the cost of inventory is based on the historic cost of acquisition or manufacture rather than the current replacement cost. In volatile energy markets, this can have a significant distorting effect on the reported income. Accordingly, the adjusted results of the Refining & Chemicals and Marketing & Services segments are presented according to the replacement cost method. This method is used to assess the segments’ performance and facilitate the comparability of the segments’ performance with those of its main competitors. 25 |
| In the replacement cost method, which approximates the Last-In, First-Out (LIFO) method, the variation of inventory values in the statement of income is, depending on the nature of the inventory, determined using either the month-end prices differential between one period and another or the average prices of the period rather than the historical value. The inventory valuation effect is the difference between the results under the FIFO and the replacement cost methods. (iii) Effect of changes in fair value The effect of changes in fair value presented as an adjustment item reflects, for trading inventories and storage contracts, differences between internal measures of performance used by TotalEnergies’ Executive Committee and the accounting for these transactions under IFRS. IFRS requires that trading inventories be recorded at their fair value using period-end spot prices. In order to best reflect the management of economic exposure through derivative transactions, internal indicators used to measure performance include valuations of trading inventories based on forward prices. TotalEnergies, in its trading activities, enters into storage contracts, whose future effects are recorded at fair value in TotalEnergies’ internal economic performance. IFRS precludes recognition of this fair value effect. Furthermore, TotalEnergies enters into derivative instruments to risk manage certain operational contracts or assets. Under IFRS, these derivatives are recorded at fair value while the underlying operational transactions are recorded as they occur. Internal indicators defer the fair value on derivatives to match with the transaction occurrence. The adjusted results (adjusted net operating income, adjusted net income) are defined as replacement cost results, adjusted for special items, excluding the effect of changes in fair value. Euro amounts presented for the fully adjusted-diluted earnings per share represent dollar amounts converted at the average euro-dollar (€-$) exchange rate for the applicable period and are not the result of financial statements prepared in euros. Cautionary Note to U.S. Investors – U.S. investors are urged to consider closely the disclosure in the Form 20-F of TotalEnergies SE, File N° 1-10888, available from us at 2, place Jean Millier – Arche Nord Coupole/Regnault - 92078 Paris-La Défense Cedex, France, or at the Company website totalenergies.com. You can also obtain this form from the SEC by calling 1-800-SEC-0330 or on the SEC’s website sec.gov. U.S. Investors are reminded that we are a French Societas Europaea and therefore the rights of our shareholders under French law differ from the rights and obligations of shareholders in companies governed by the laws of U.S. jurisdictions. Société Générale will act in France as registered intermediary (intermédiaire inscrit) for the account of the owners of the Company’s ordinary shares registered on the U.S. register in accordance with Articles L. 228.1 et seq. of the French commercial code, and such provisions may result in differences in the exercise of shareholder rights compared to the expectations of U.S. investors. In the performance of its duties, our Board is required by French law to consider the interests of the Company, its shareholders, its employees, and other stakeholders, in all cases with due consideration to the principles of reasonableness and fairness. It is possible that some of these parties could have interests that are different from, or in addition to, your interests as a shareholder. This communication does not constitute or form part of, and should not be construed as constituting or forming part of, any offer to sell or issue, any invitation to make an investment in, or any solicitation of any offer to purchase or subscribe for, securities of TotalEnergies. 26 |
| TotalEnergies financial statements Third quarter 2025 consolidated accounts, IFRS 27 |
| CONSOLIDATED STATEMENT OF INCOME TotalEnergies (unaudited) 3 rd quarter 2 nd quarter 3 rd quarter (M$)(a) 2025 2025 2024 Sales 48,691 49,627 52,021 Excise taxes (4,847) (4,951) (4,592) Revenues from sales 43,844 44,676 47,429 Purchases, net of inventory variation (27,191) (29,158) (31,425) Other operating expenses (7,591) (7,834) (7,269) Exploration costs (64) (97) (572) Depreciation, depletion and impairment of tangible assets and mineral interests (3,280) (3,258) (3,392) Other income 778 544 45 Other expense (528) (287) (374) Financial interest on debt (808) (816) (797) Financial income and expense from cash & cash equivalents 265 327 457 Cost of net debt (543) (489) (340) Other financial income 366 429 319 Other financial expense (208) (203) (214) Net income (loss) from equity affiliates 602 529 333 Income taxes (2,423) (2,106) (2,179) Consolidated net income 3,762 2,746 2,361 TotalEnergies share 3,683 2,687 2,294 Non-controlling interests 79 59 67 Earnings per share ($) 1.65 1.18 0.97 Fully-diluted earnings per share ($) 1.64 1.17 0.96 (a) Except for per share amounts. 28 |

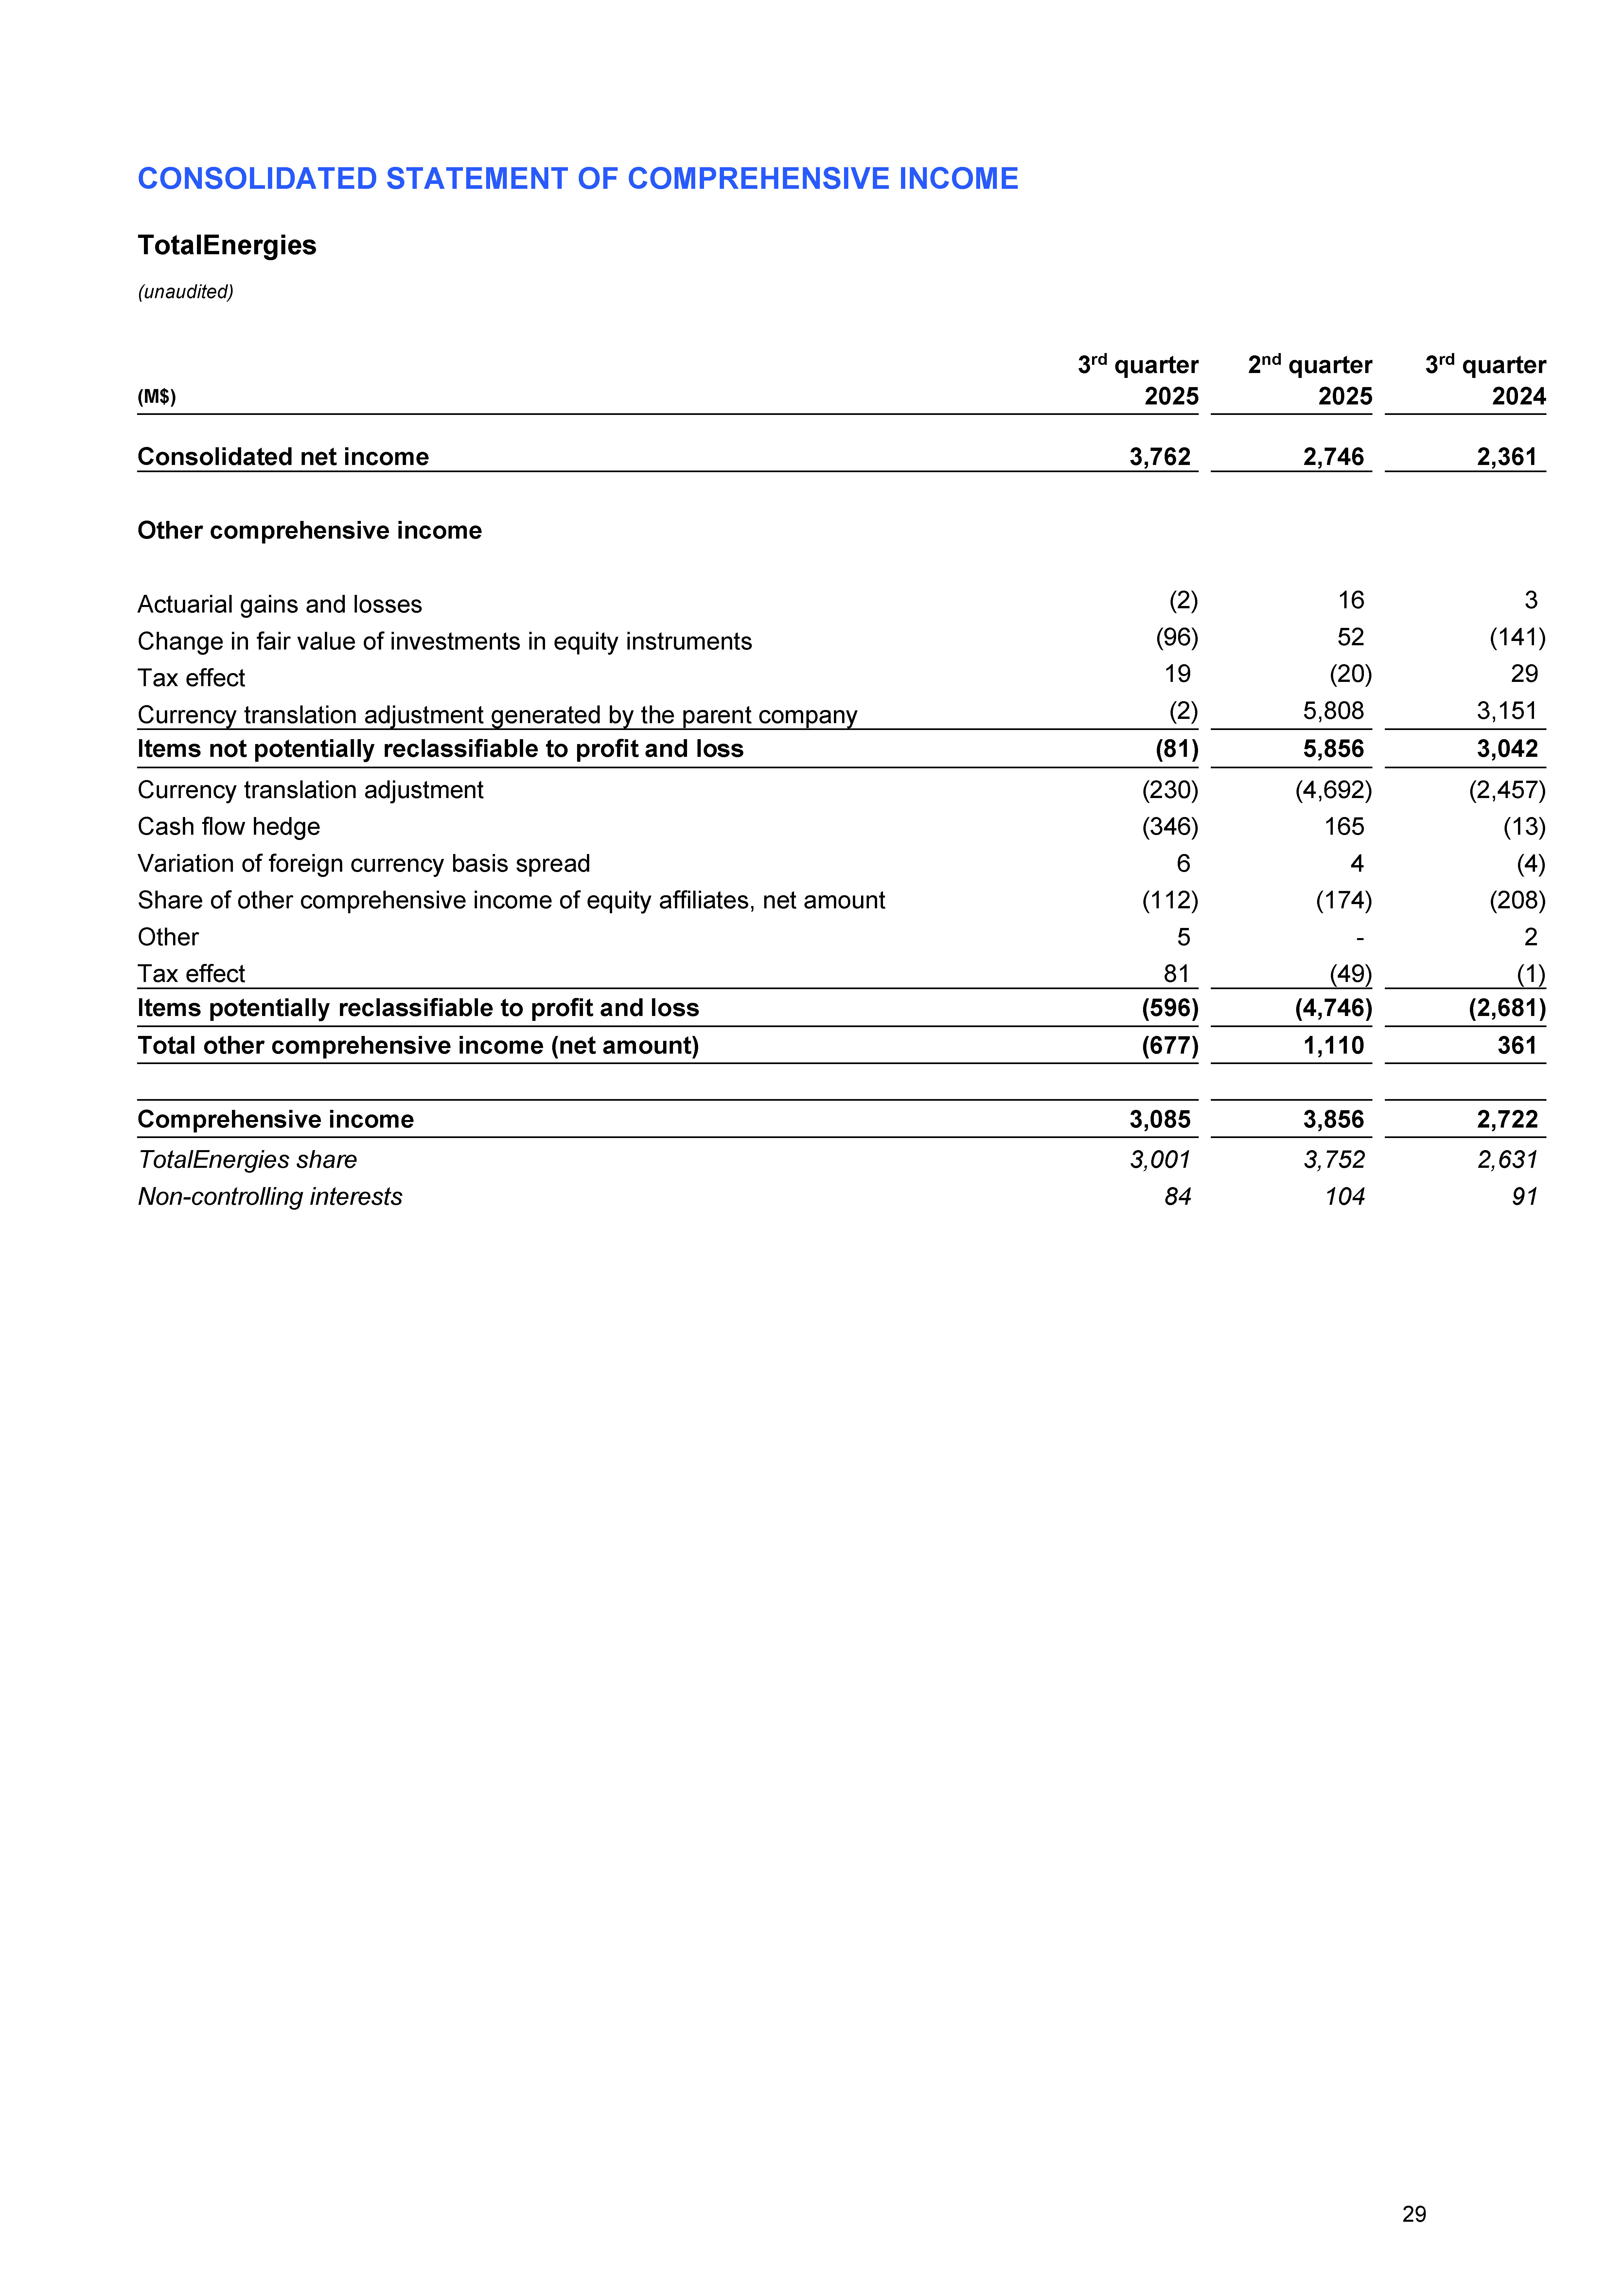
| CONSOLIDATED STATEMENT OF COMPREHENSIVE INCOME TotalEnergies (unaudited) 3 rd quarter 2 nd quarter 3 rd quarter (M$) 2025 2025 2024 Consolidated net income 3,762 2,746 2,361 Other comprehensive income Actuarial gains and losses (2) 16 3 Change in fair value of investments in equity instruments (96) 52 (141) Tax effect 19 (20) 29 Currency translation adjustment generated by the parent company (2) 5,808 3,151 Items not potentially reclassifiable to profit and loss (81) 5,856 3,042 Currency translation adjustment (230) (4,692) (2,457) Cash flow hedge (346) 165 (13) Variation of foreign currency basis spread 6 4 (4) Share of other comprehensive income of equity affiliates, net amount (112) (174) (208) Other 5 - 2 Tax effect 81 (49) (1) Items potentially reclassifiable to profit and loss (596) (4,746) (2,681) Total other comprehensive income (net amount) (677) 1,110 361 Comprehensive income 3,085 3,856 2,722 TotalEnergies share 3,001 3,752 2,631 Non-controlling interests 84 104 91 29 |
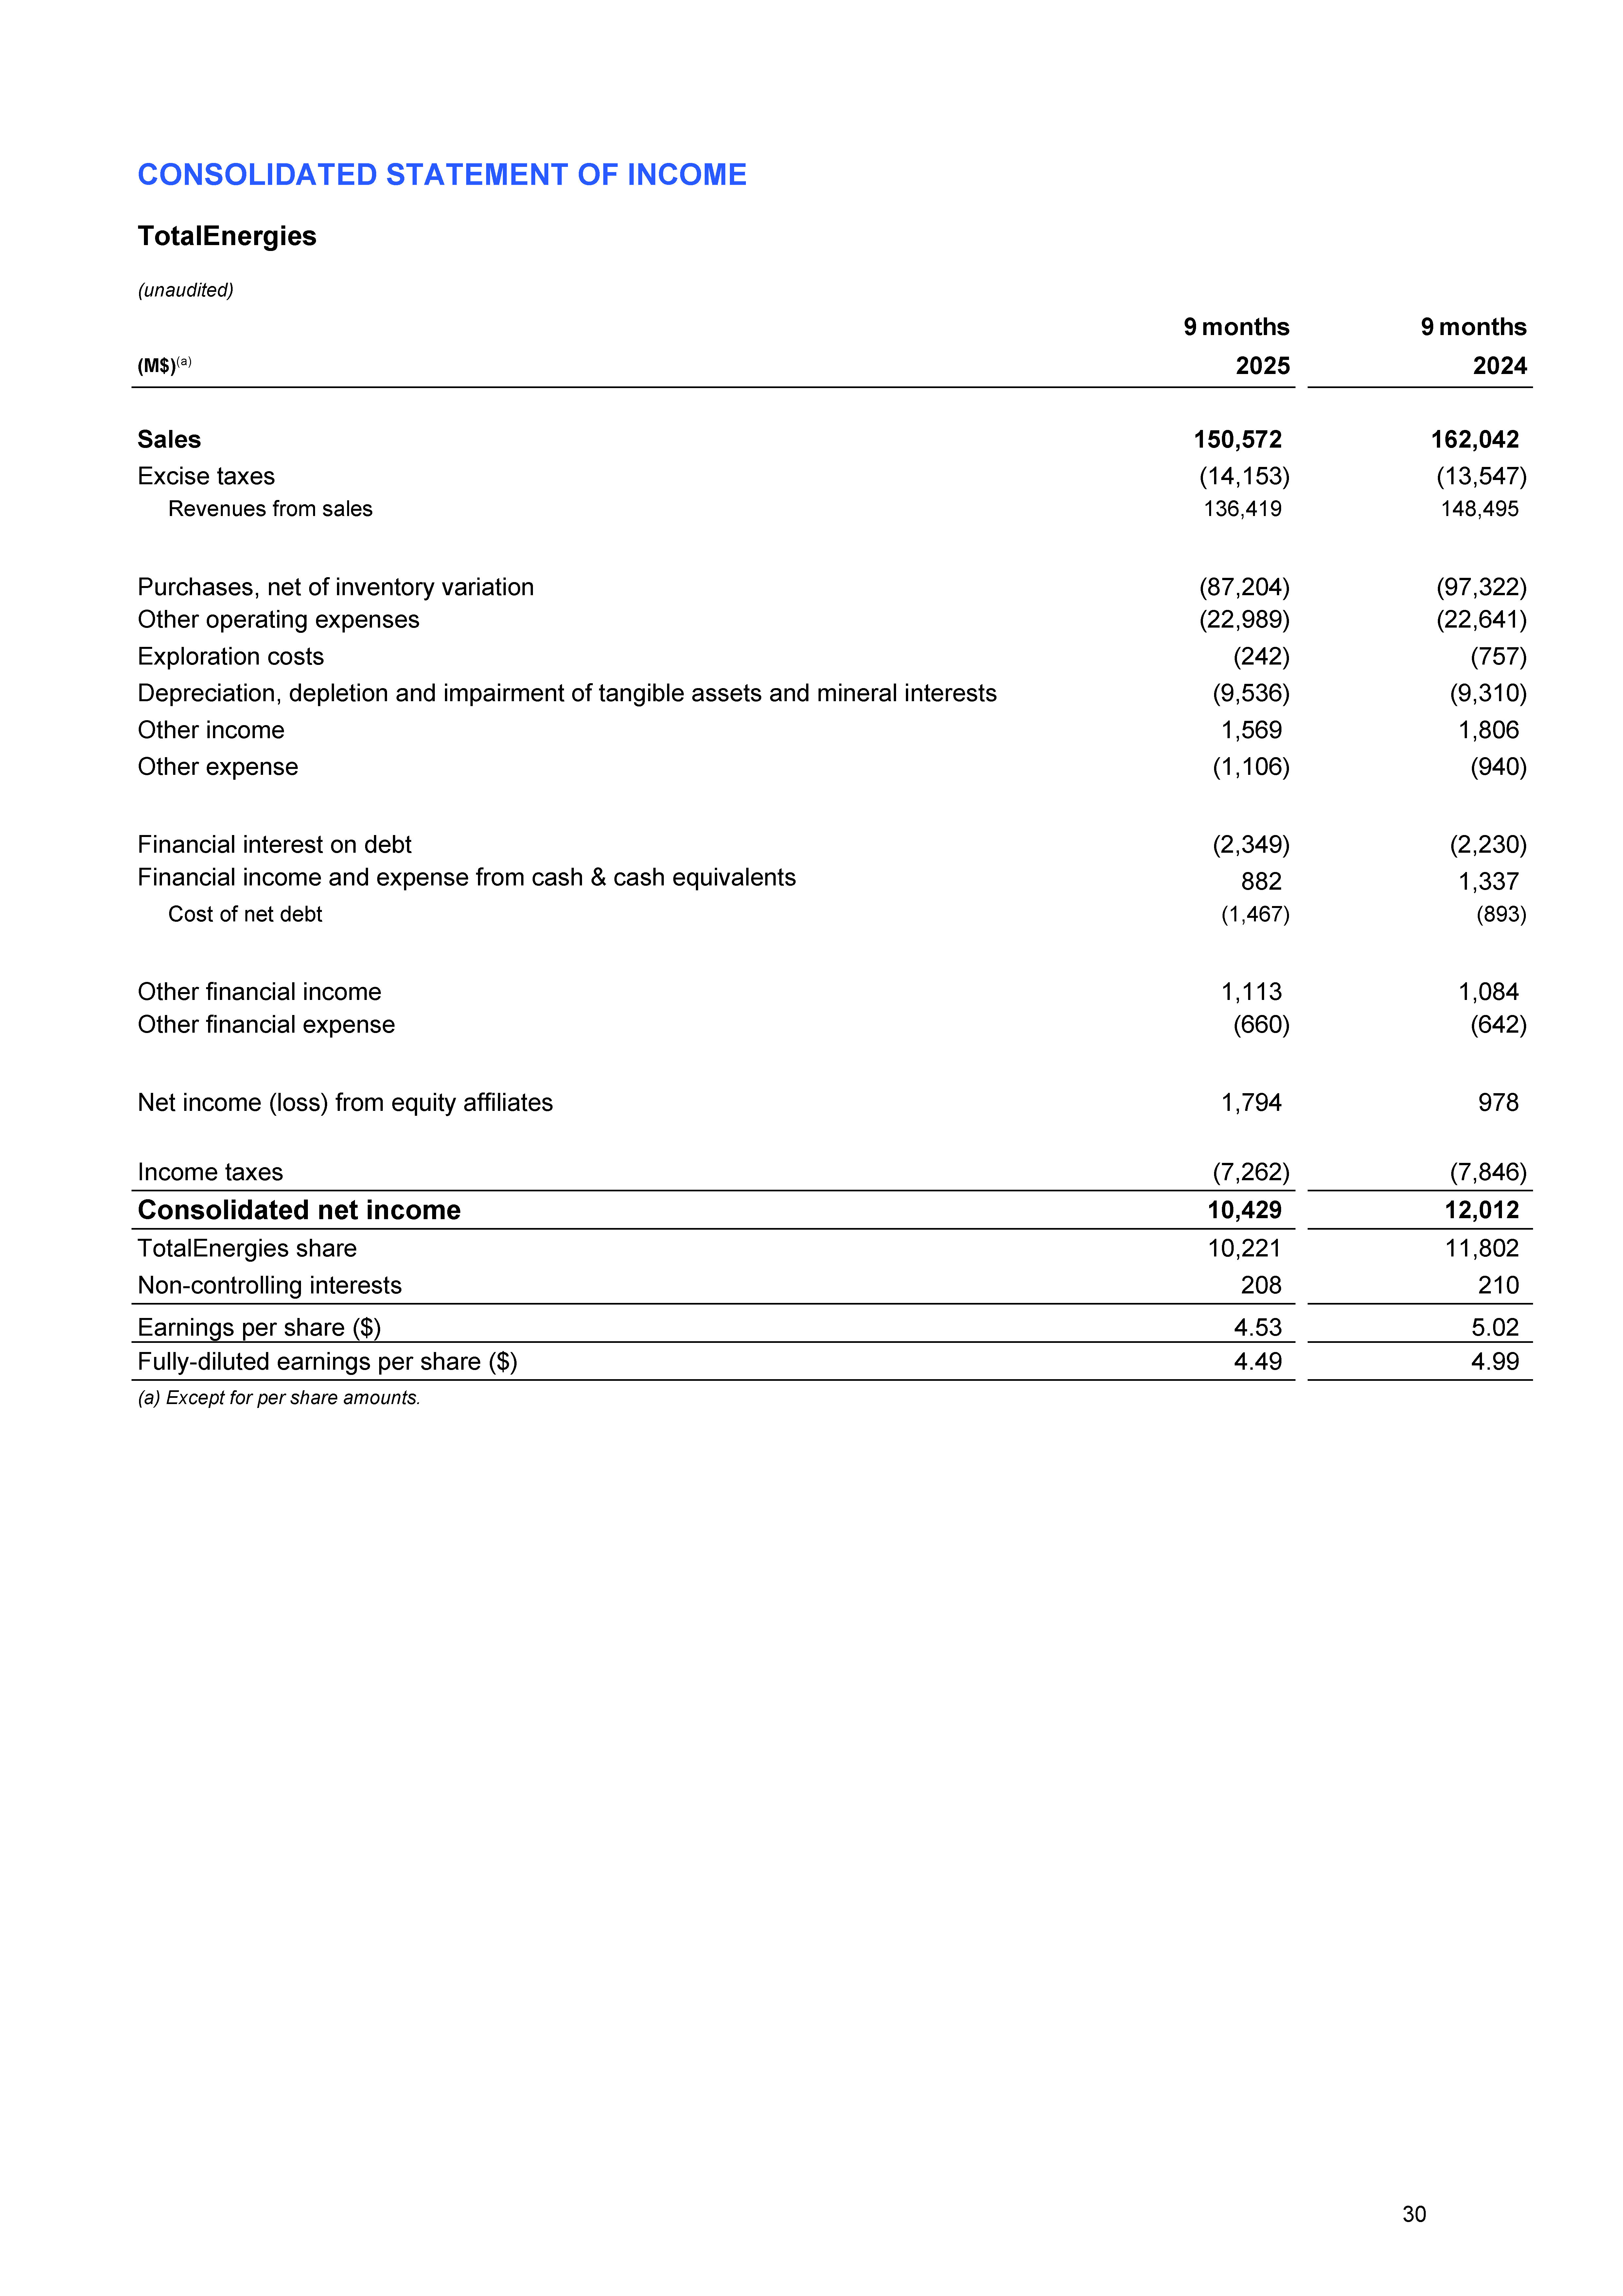
| CONSOLIDATED STATEMENT OF INCOME TotalEnergies (unaudited) 9 months 9 months (M$)(a) 2025 2024 Sales 150,572 162,042 Excise taxes (14,153) (13,547) Revenues from sales 136,419 148,495 Purchases, net of inventory variation (87,204) (97,322) Other operating expenses (22,989) (22,641) Exploration costs (242) (757) Depreciation, depletion and impairment of tangible assets and mineral interests (9,536) (9,310) Other income 1,569 1,806 Other expense (1,106) (940) Financial interest on debt (2,349) (2,230) Financial income and expense from cash & cash equivalents 882 1,337 Cost of net debt (1,467) (893) Other financial income 1,113 1,084 Other financial expense (660) (642) Net income (loss) from equity affiliates 1,794 978 Income taxes (7,262) (7,846) Consolidated net income 10,429 12,012 TotalEnergies share 10,221 11,802 Non-controlling interests 208 210 Earnings per share ($) 4.53 5.02 Fully-diluted earnings per share ($) 4.49 4.99 (a) Except for per share amounts. 30 |
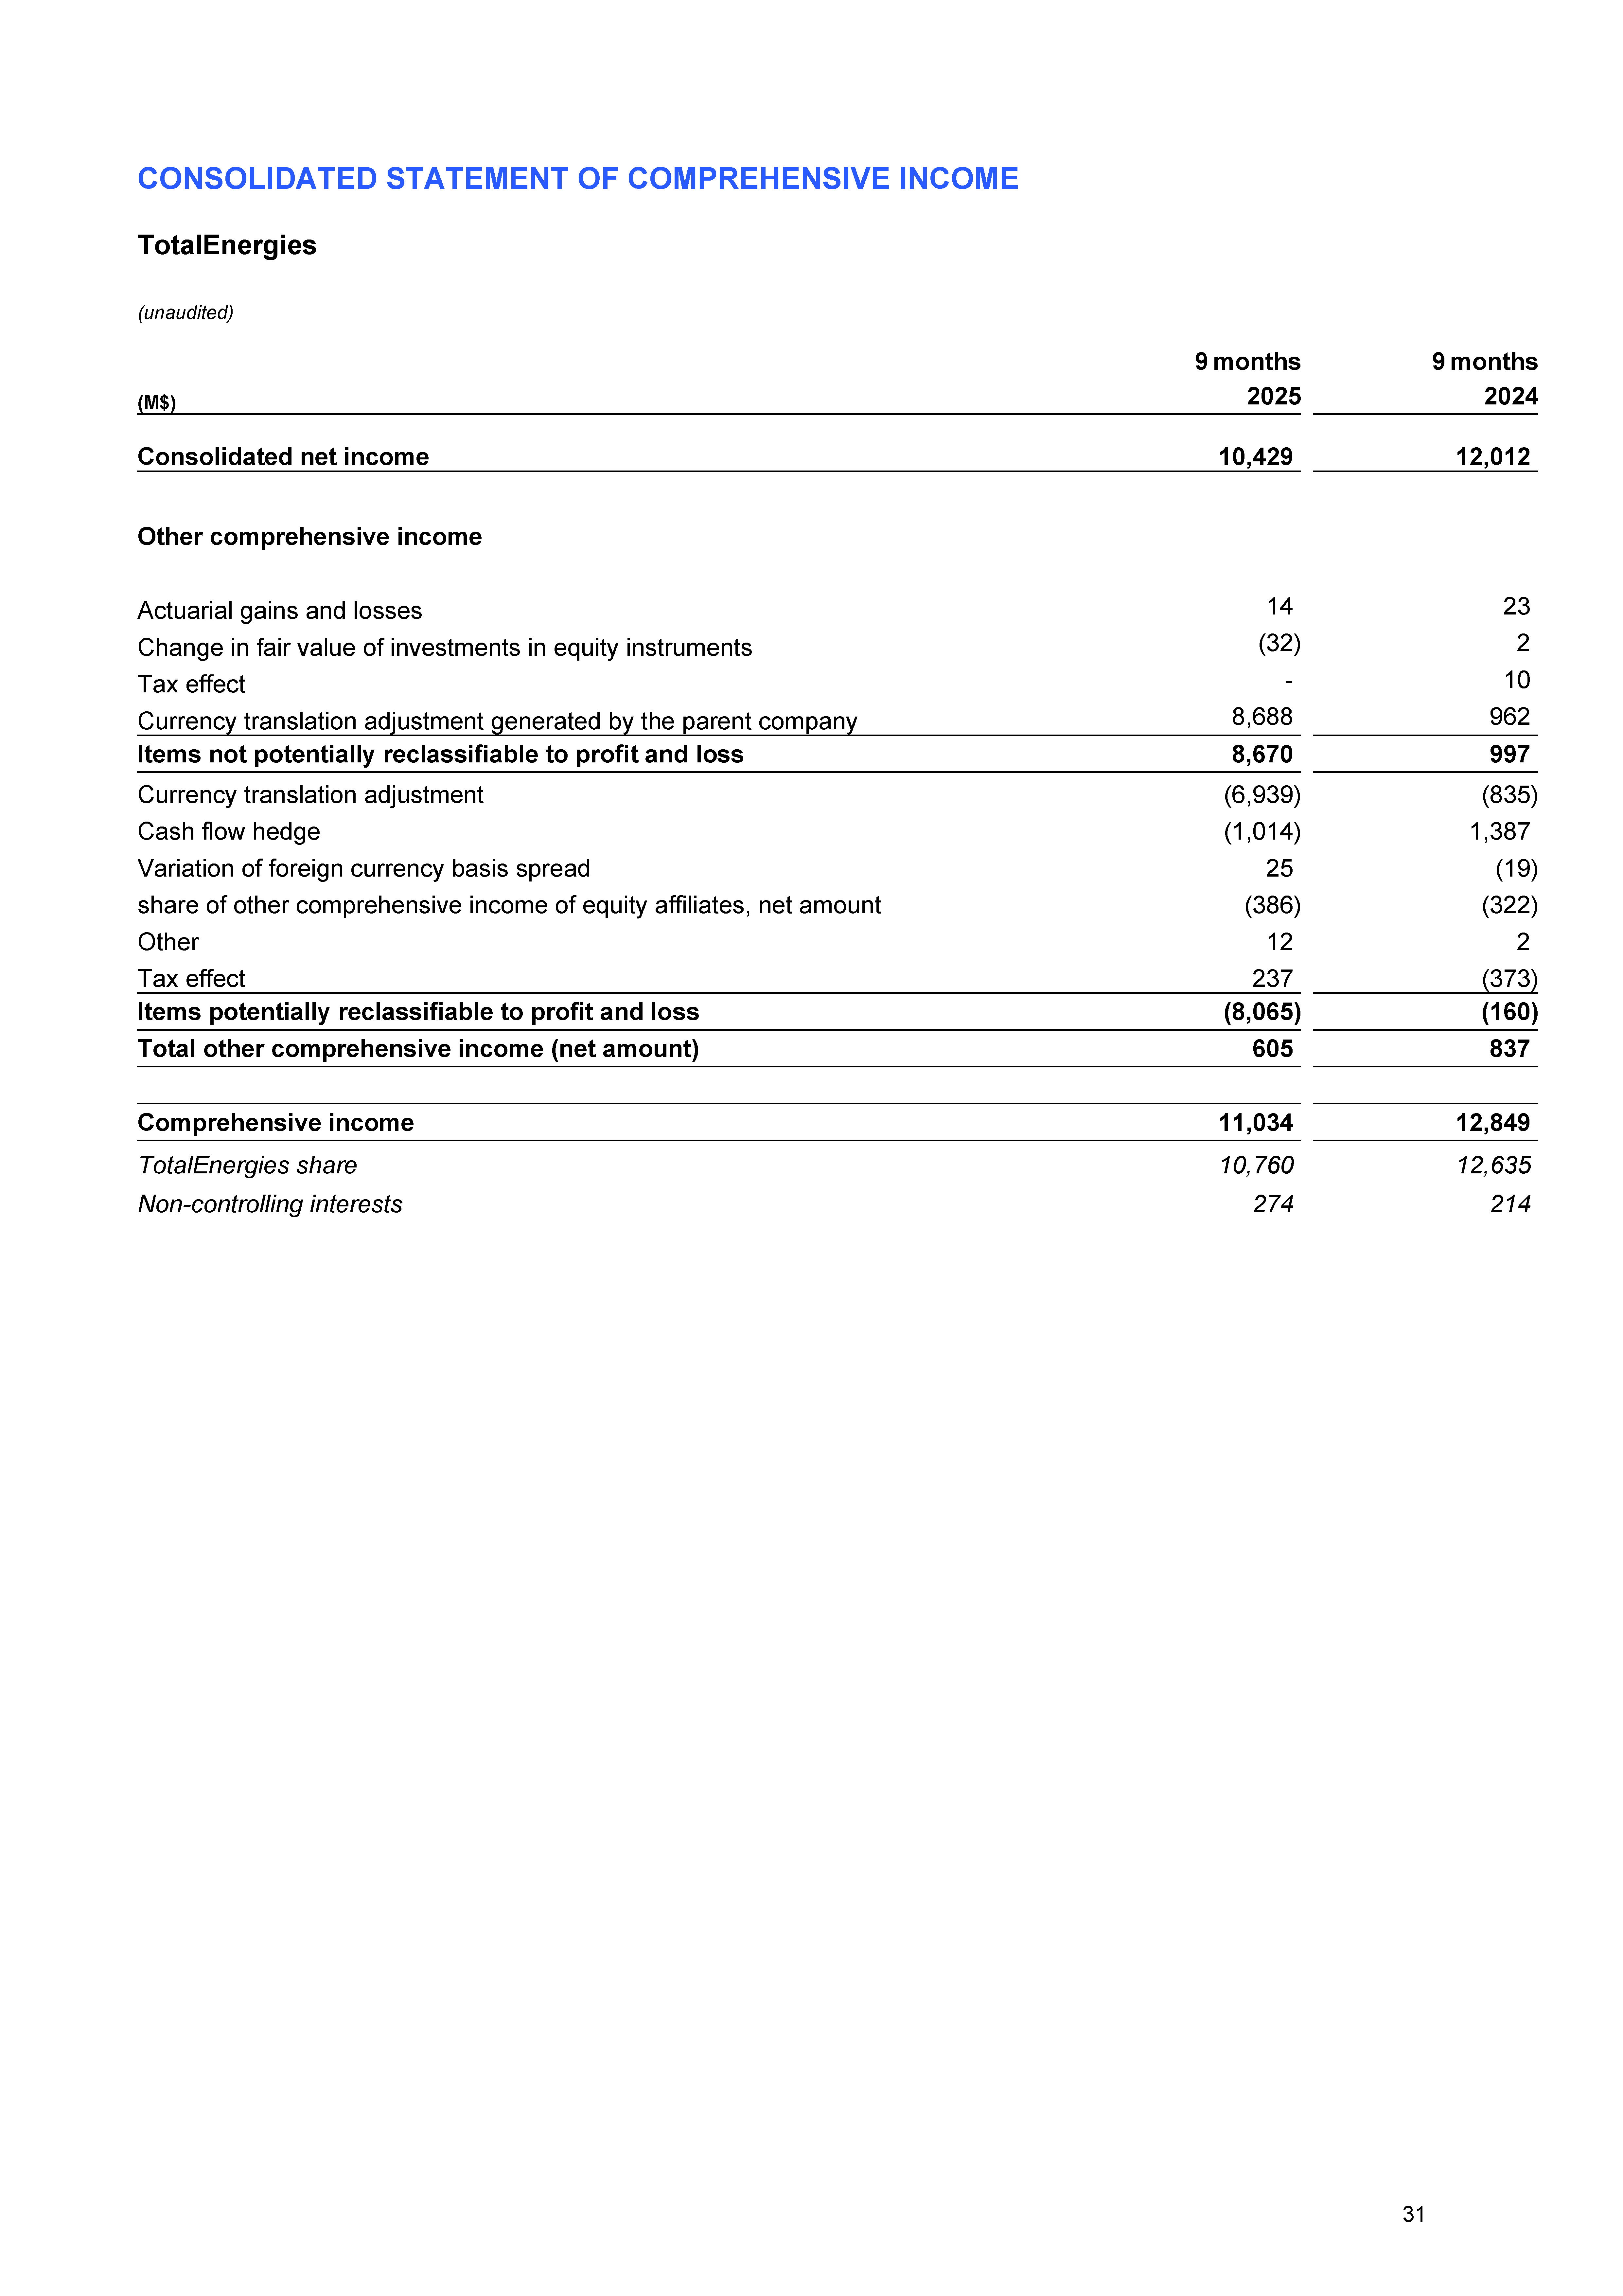
| CONSOLIDATED STATEMENT OF COMPREHENSIVE INCOME TotalEnergies (unaudited) 9 months 9 months (M$) 2025 2024 Consolidated net income 10,429 12,012 Other comprehensive income Actuarial gains and losses 14 23 Change in fair value of investments in equity instruments (32) 2 Tax effect - 10 Currency translation adjustment generated by the parent company 8,688 962 Items not potentially reclassifiable to profit and loss 8,670 997 Currency translation adjustment (6,939) (835) Cash flow hedge (1,014) 1,387 Variation of foreign currency basis spread 25 (19) share of other comprehensive income of equity affiliates, net amount (386) (322) Other 12 2 Tax effect 237 (373) Items potentially reclassifiable to profit and loss (8,065) (160) Total other comprehensive income (net amount) 605 837 Comprehensive income 11,034 12,849 TotalEnergies share 10,760 12,635 Non-controlling interests 274 214 31 |
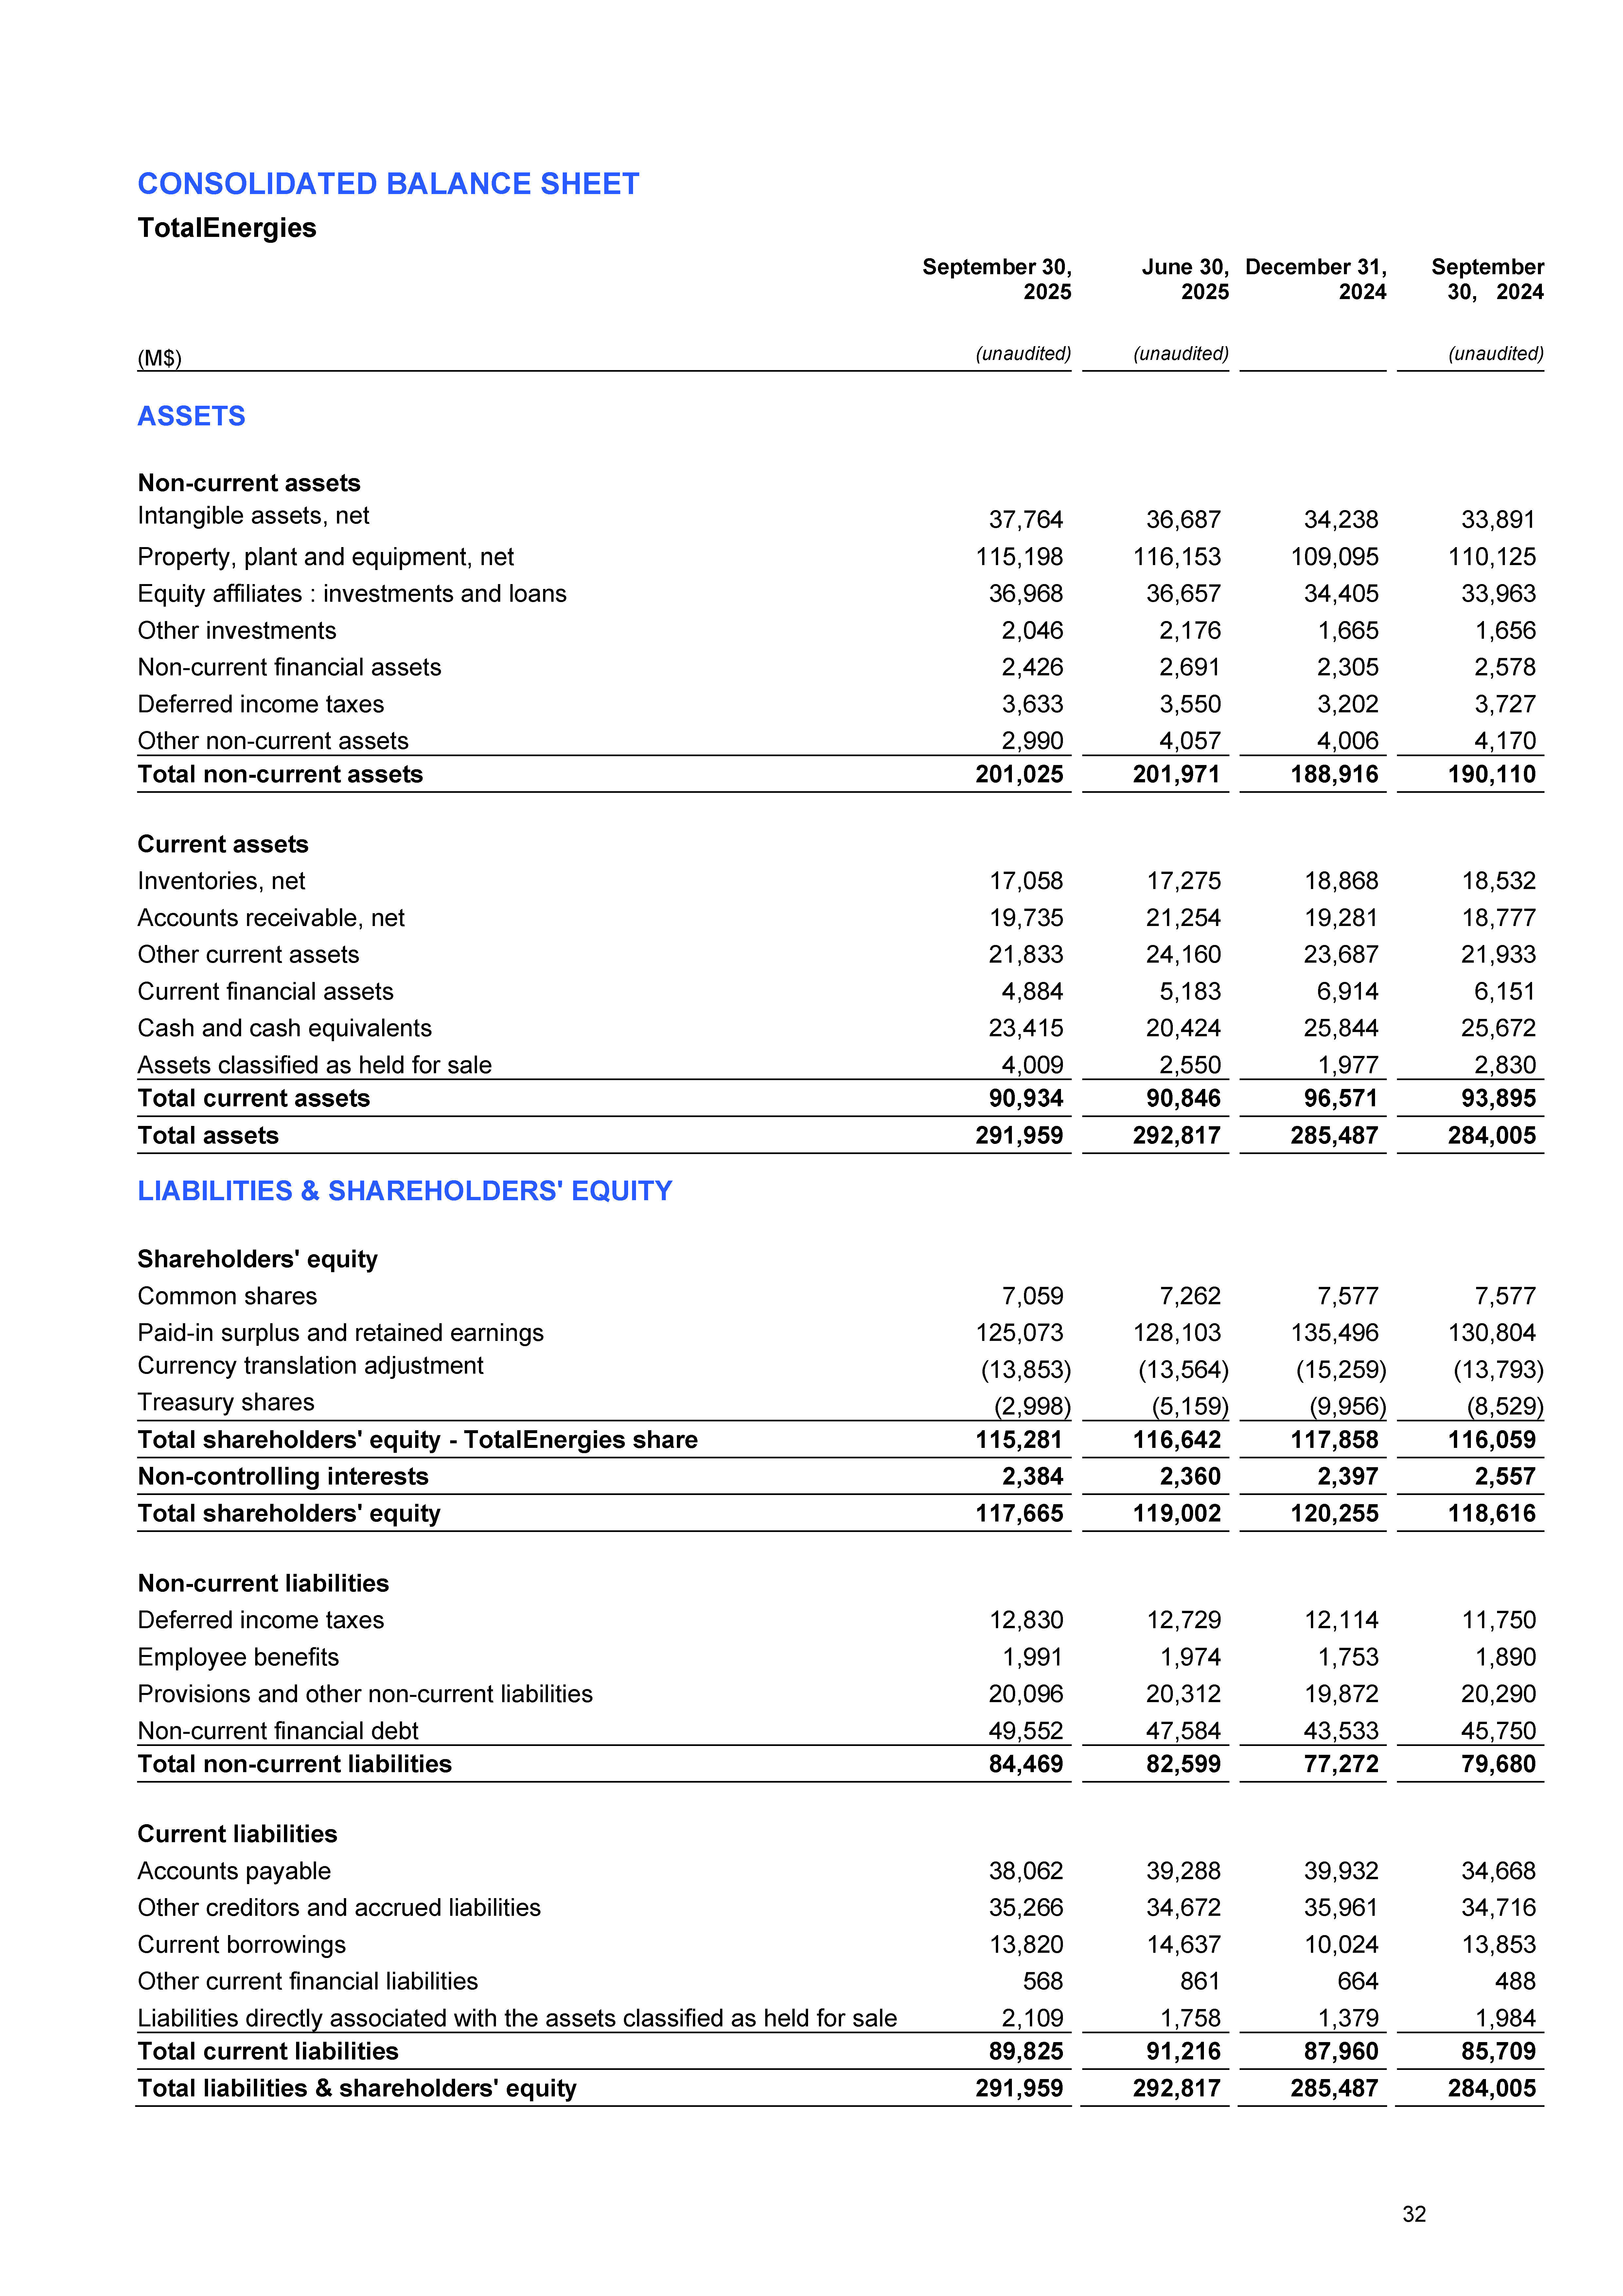
| CONSOLIDATED BALANCE SHEET TotalEnergies September 30, 2025 June 30, 2025 December 31, 2024 September 30, 2024 (M$) (unaudited) (unaudited) (unaudited) ASSETS Non-current assets Intangible assets, net 37,764 36,687 34,238 33,891 Property, plant and equipment, net 115,198 116,153 109,095 110,125 Equity affiliates : investments and loans 36,968 36,657 34,405 33,963 Other investments 2,046 2,176 1,665 1,656 Non-current financial assets 2,426 2,691 2,305 2,578 Deferred income taxes 3,633 3,550 3,202 3,727 Other non-current assets 2,990 4,057 4,006 4,170 Total non-current assets 201,025 201,971 188,916 190,110 Current assets Inventories, net 17,058 17,275 18,868 18,532 Accounts receivable, net 19,735 21,254 19,281 18,777 Other current assets 21,833 24,160 23,687 21,933 Current financial assets 4,884 5,183 6,914 6,151 Cash and cash equivalents 23,415 20,424 25,844 25,672 Assets classified as held for sale 4,009 2,550 1,977 2,830 Total current assets 90,934 90,846 96,571 93,895 Total assets 291,959 292,817 285,487 284,005 LIABILITIES & SHAREHOLDERS' EQUITY Shareholders' equity Common shares 7,059 7,262 7,577 7,577 Paid-in surplus and retained earnings 125,073 128,103 135,496 130,804 Currency translation adjustment (13,853) (13,564) (15,259) (13,793) Treasury shares (2,998) (5,159) (9,956) (8,529) Total shareholders' equity - TotalEnergies share 115,281 116,642 117,858 116,059 Non-controlling interests 2,384 2,360 2,397 2,557 Total shareholders' equity 117,665 119,002 120,255 118,616 Non-current liabilities Deferred income taxes 12,830 12,729 12,114 11,750 Employee benefits 1,991 1,974 1,753 1,890 Provisions and other non-current liabilities 20,096 20,312 19,872 20,290 Non-current financial debt 49,552 47,584 43,533 45,750 Total non-current liabilities 84,469 82,599 77,272 79,680 Current liabilities Accounts payable 38,062 39,288 39,932 34,668 Other creditors and accrued liabilities 35,266 34,672 35,961 34,716 Current borrowings 13,820 14,637 10,024 13,853 Other current financial liabilities 568 861 664 488 Liabilities directly associated with the assets classified as held for sale 2,109 1,758 1,379 1,984 Total current liabilities 89,825 91,216 87,960 85,709 Total liabilities & shareholders' equity 291,959 292,817 285,487 284,005 32 |
| CONSOLIDATED STATEMENT OF CASH FLOW TotalEnergies (unaudited) 3 rd quarter 2 nd quarter 3 rd quarter (M$) 2025 2025 2024 CASH FLOW FROM OPERATING ACTIVITIES Consolidated net income 3,762 2,746 2,361 Depreciation, depletion, amortization and impairment 3,405 3,360 4,020 Non-current liabilities, valuation allowances and deferred taxes 272 127 (93) (Gains) losses on disposals of assets (603) (335) (3) Undistributed affiliates' equity earnings (195) (102) (13) (Increase) decrease in working capital 1,600 49 836 Other changes, net 108 115 63 Cash flow from operating activities 8,349 5,960 7,171 CASH FLOW USED IN INVESTING ACTIVITIES Intangible assets and property, plant and equipment additions (3,812) (4,766) (4,110) Acquisitions of subsidiaries, net of cash acquired - (1,627) (497) Investments in equity affiliates and other securities (215) (419) (845) Increase in non-current loans (408) (425) (458) Total expenditures (4,435) (7,237) (5,910) Proceeds from disposals of intangible assets and property, plant and equipment 613 69 32 Proceeds from disposals of subsidiaries, net of cash sold 133 154 82 Proceeds from disposals of non-current investments (8) 15 37 Repayment of non-current loans 494 310 197 Total divestments 1,232 548 348 Cash flow used in investing activities (3,203) (6,689) (5,562) CASH FLOW FROM FINANCING ACTIVITIES Issuance (repayment) of shares: - Parent company shareholders - 492 - - Treasury shares (2,349) (1,707) (2,005) Dividends paid: - Parent company shareholders (2,216) (1,894) (1,963) - Non-controlling interests (89) (173) (171) Net issuance (repayment) of perpetual subordinated notes - - - Payments on perpetual subordinated notes (26) (27) (23) Other transactions with non-controlling interests 23 (31) (14) Net issuance (repayment) of non-current debt 3,682 257 3,080 Increase (decrease) in current borrowings (1,962) (356) 911 Increase (decrease) in current financial assets and liabilities 529 1,287 760 Cash flow from / (used in) financing activities (2,408) (2,152) 575 Net increase (decrease) in cash and cash equivalents 2,738 (2,881) 2,184 Effect of exchange rates 253 468 277 Cash and cash equivalents at the beginning of the period 20,424 22,837 23,211 Cash and cash equivalents at the end of the period 23,415 20,424 25,672 33 |
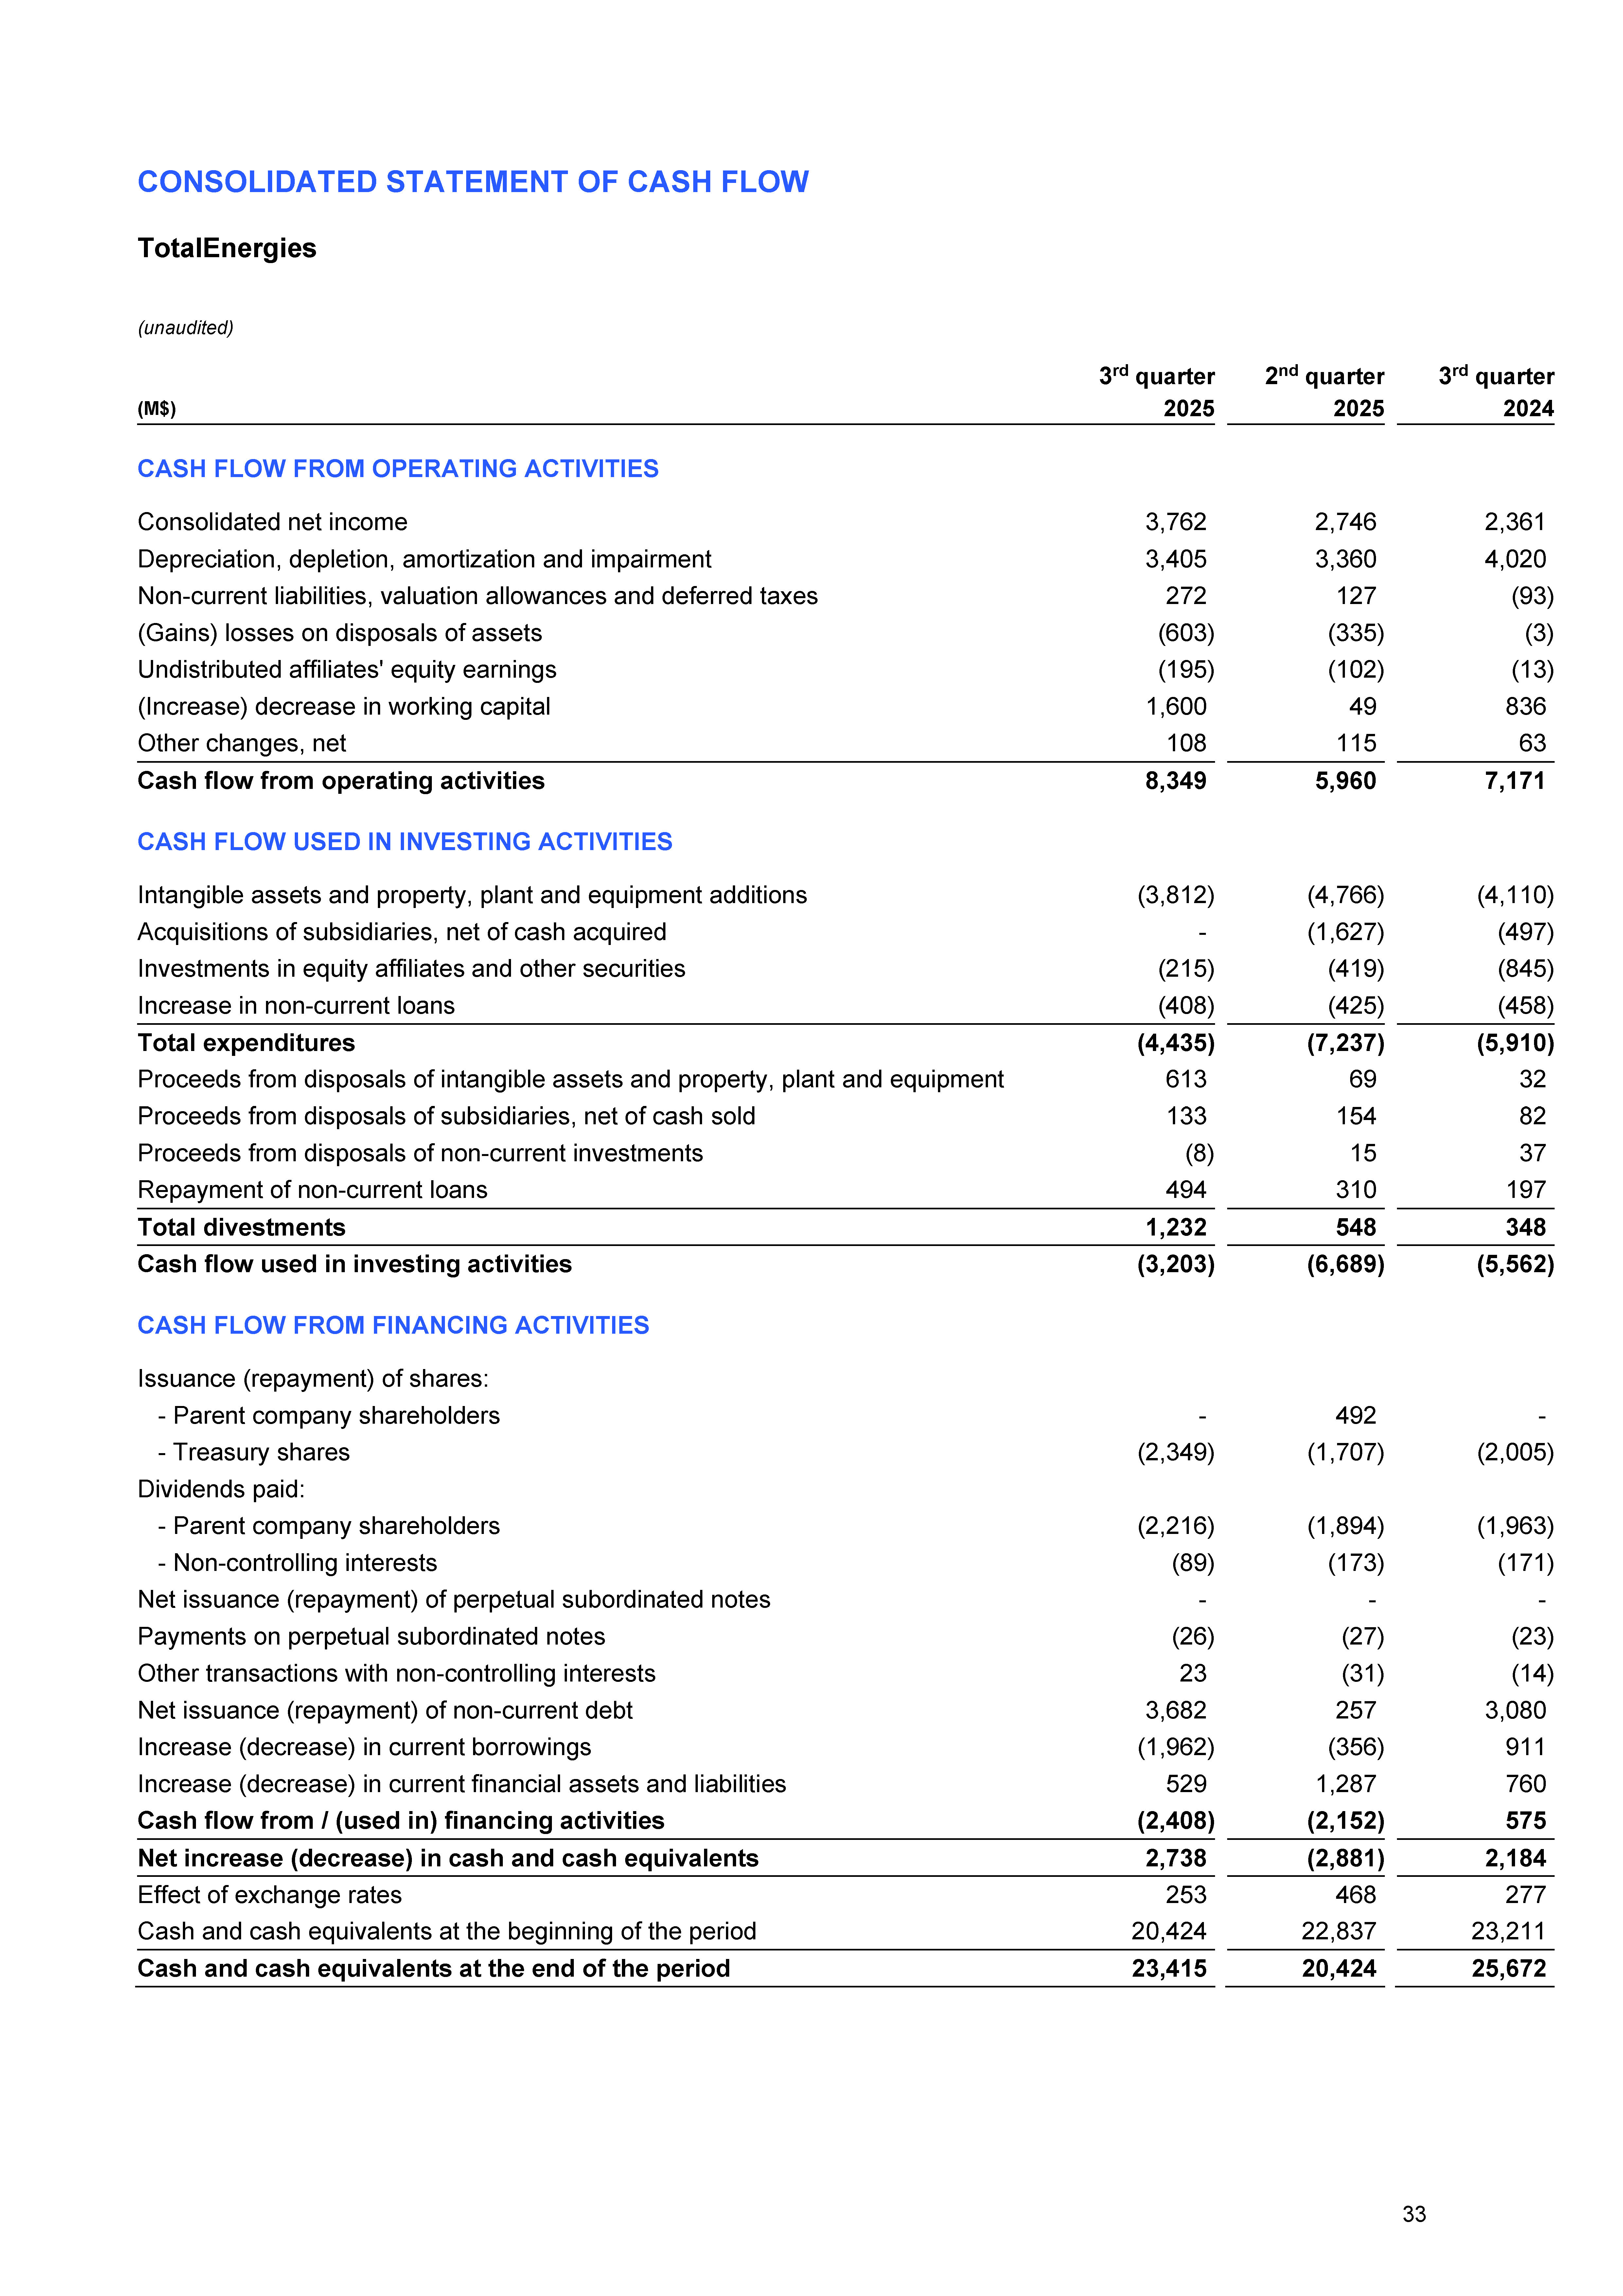
| CONSOLIDATED STATEMENT OF CASH FLOW TotalEnergies (unaudited) 9 months 9 months (M$) 2025 2024 CASH FLOW FROM OPERATING ACTIVITIES Consolidated net income 10,429 12,012 Depreciation, depletion, amortization and impairment 9,851 10,136 Non-current liabilities, valuation allowances and deferred taxes 608 146 (Gains) losses on disposals of assets (913) (1,431) Undistributed affiliates' equity earnings (720) 25 (Increase) decrease in working capital (2,583) (2,837) Other changes, net 200 296 Cash flow from operating activities 16,872 18,347 CASH FLOW USED IN INVESTING ACTIVITIES Intangible assets and property, plant and equipment additions (12,800) (11,229) Acquisitions of subsidiaries, net of cash acquired (1,859) (1,507) Investments in equity affiliates and other securities (945) (1,814) Increase in non-current loans (1,401) (1,617) Total expenditures (17,005) (16,167) Proceeds from disposals of intangible assets and property, plant and equipment 983 413 Proceeds from disposals of subsidiaries, net of cash sold 404 1,513 Proceeds from disposals of non-current investments 8 127 Repayment of non-current loans 913 527 Total divestments 2,308 2,580 Cash flow used in investing activities (14,697) (13,587) CASH FLOW FROM FINANCING ACTIVITIES Issuance (repayment) of shares: - Parent company shareholders 492 521 - Treasury shares (6,208) (6,018) Dividends paid: - Parent company shareholders (5,961) (5,719) - Non-controlling interests (401) (304) Net issuance (repayment) of perpetual subordinated notes (1,139) (1,622) Payments on perpetual subordinated notes (181) (232) Other transactions with non-controlling interests (28) (50) Net issuance (repayment) of non-current debt 7,370 7,441 Increase (decrease) in current borrowings (2,168) (1,006) Increase (decrease) in current financial assets and liabilities 2,534 501 Cash flow from / (used in) financing activities (5,690) (6,488) Net increase (decrease) in cash and cash equivalents (3,515) (1,728) Effect of exchange rates 1,086 137 Cash and cash equivalents at the beginning of the period 25,844 27,263 Cash and cash equivalents at the end of the period 23,415 25,672 34 |
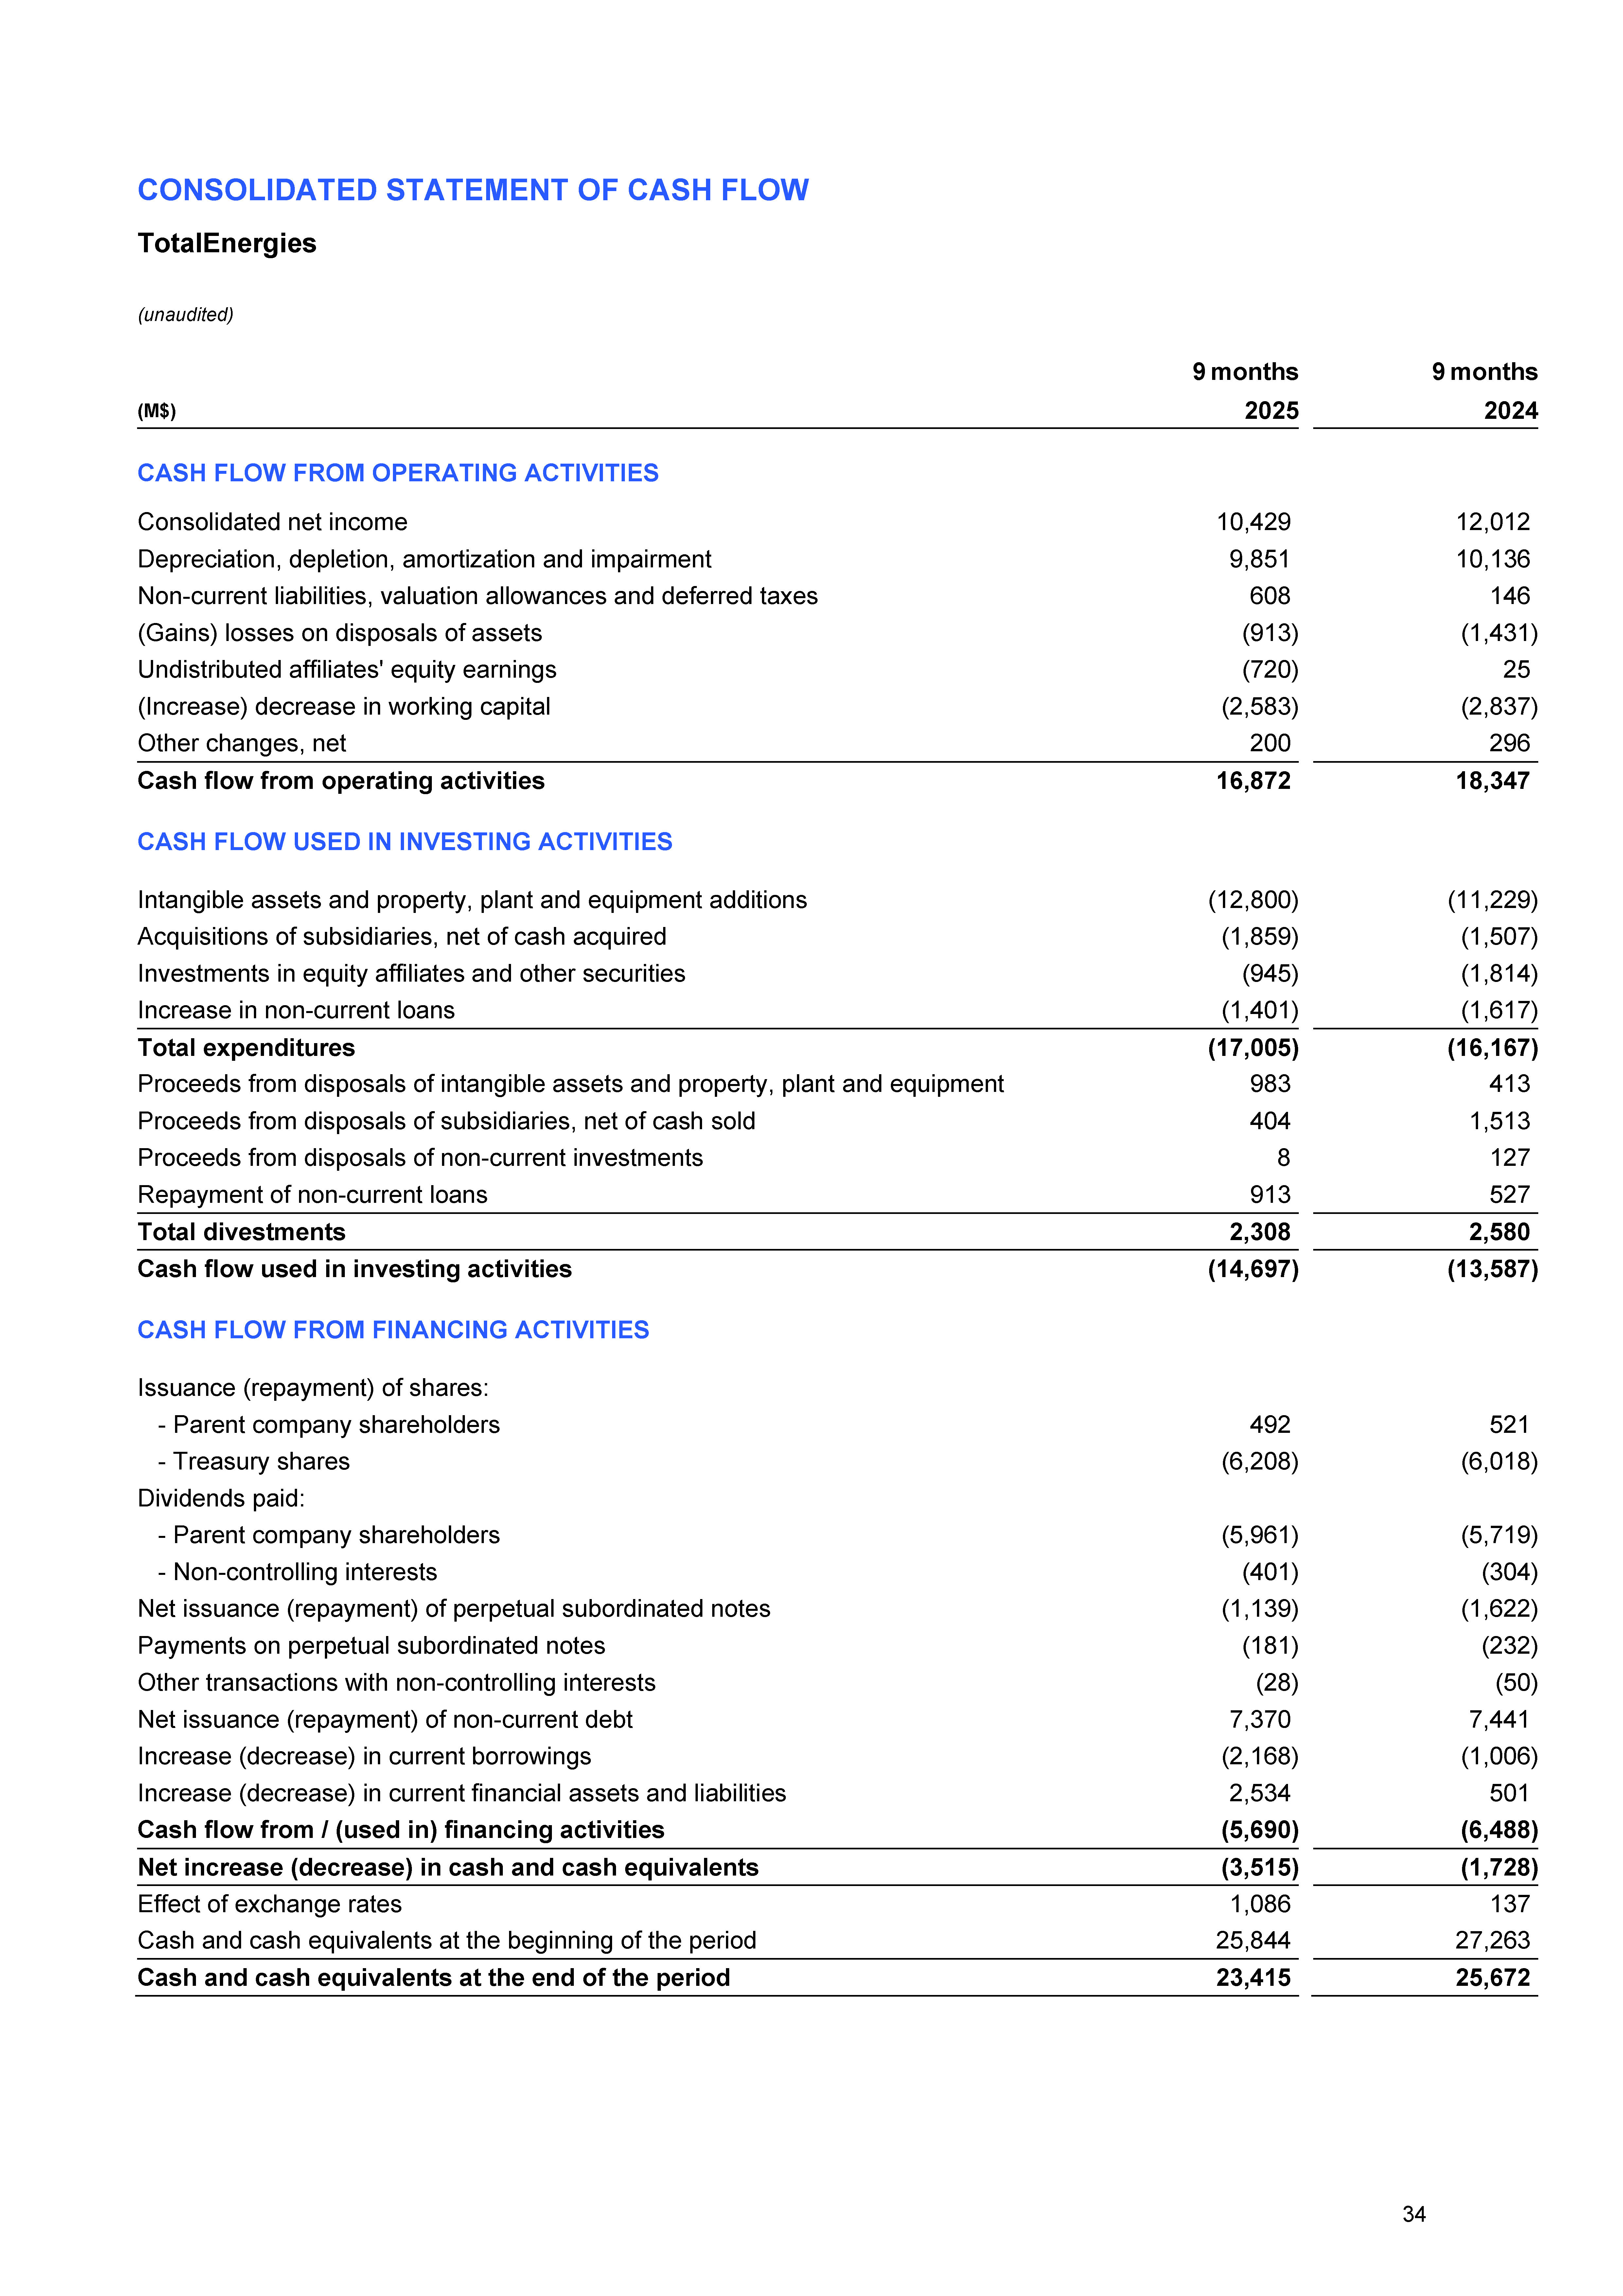
| CONSOLIDATED STATEMENT OF CHANGES IN SHAREHOLDERS' EQUITY TotalEnergies (unaudited) Common shares issued Paid-in surplus and retained earnings Currency translation adjustment Treasury shares Shareholders' equity - TotalEnergies Share Non-controlling interests Total shareholders' equity (M$) Number Amount Number Amount As of January 1, 2024 2,412,251,835 7,616 126,857 (13,701) (60,543,213) (4,019) 116,753 2,700 119,453 Net income of the first nine months 2024 - - 11,802 - - - 11,802 210 12,012 Other comprehensive income - - 924 (91) - - 833 4 837 Comprehensive Income - - 12,726 (91) - - 12,635 214 12,849 Dividend - - (5,863) - - - (5,863) (304) (6,167) Issuance of common shares 10,833,187 29 492 - - - 521 - 521 Purchase of treasury shares - - - - (88,066,669) (6,568) (6,568) - (6,568) Sale of treasury shares(a) - - (395) - 6,067,493 395 - - - Share-based payments - - 458 - - - 458 - 458 Share cancellation (25,405,361) (68) (1,595) - 25,405,361 1,663 - - - Net issuance (repayment) of perpetual subordinated notes - - (1,679) - - - (1,679) - (1,679) Payments on perpetual subordinated notes - - (200) - - - (200) - (200) Other operations with non-controlling interests - - - - - - - (50) (50) Other items - - 3 (1) - - 2 (3) (1) As of September 30, 2024 2,397,679,661 7,577 130,804 (13,793) (117,137,028) (8,529) 116,059 2,557 118,616 Net income of the fourth quarter 2024 - - 3,956 - - - 3,956 63 4,019 Other comprehensive income - - 1,512 (1,467) - - 45 (48) (3) Comprehensive Income - - 5,468 (1,467) - - 4,001 15 4,016 Dividend - - (1,893) - - - (1,893) (151) (2,044) Issuance of common shares - - - - - - - - - Purchase of treasury shares - - - - (32,396,563) (1,427) (1,427) - (1,427) Sale of treasury shares(a) - - - - 3,773 - - - - Share-based payments - - 98 - - - 98 - 98 Share cancellation - - - - - - - - - Net issuance (repayment) of perpetual subordinated notes - - 1,103 - - - 1,103 - 1,103 Payments on perpetual subordinated notes - - (72) - - - (72) - (72) Other operations with non-controlling interests - - - - - - - (17) (17) Other items - - (12) 1 - - (11) (7) (18) As of December 31, 2024 2,397,679,661 7,577 135,496 (15,259) (149,529,818) (9,956) 117,858 2,397 120,255 Net income of the first nine months 2025 - - 10,221 - - - 10,221 208 10,429 Other comprehensive income - - (867) 1,406 - - 539 66 605 Comprehensive Income - - 9,354 1,406 - - 10,760 274 11,034 Dividend - - (6,103) - - - (6,103) (267) (6,370) Issuance of common shares 11,149,053 30 462 - - - 492 - 492 Purchase of treasury shares - - - - (99,060,045) (6,520) (6,520) - (6,520) Sale of treasury shares(a) - - (414) - 6,218,249 414 - - - Share-based payments - - 463 - - - 463 - 463 Share cancellation (202,243,171) (548) (12,704) - 202,243,171 13,064 (188) - (188) Net issuance (repayment) of perpetual subordinated notes - - (1,219) - - - (1,219) - (1,219) Payments on perpetual subordinated notes - - (238) - - - (238) - (238) Other operations with non-controlling interests - - (6) - - - (6) (22) (28) Other items - - (18) - - - (18) 2 (16) As of September 30, 2025 2,206,585,543 7,059 125,073 (13,853) (40,128,443) (2,998) 115,281 2,384 117,665 (a)Treasury shares related to the performance share grants. 35 |
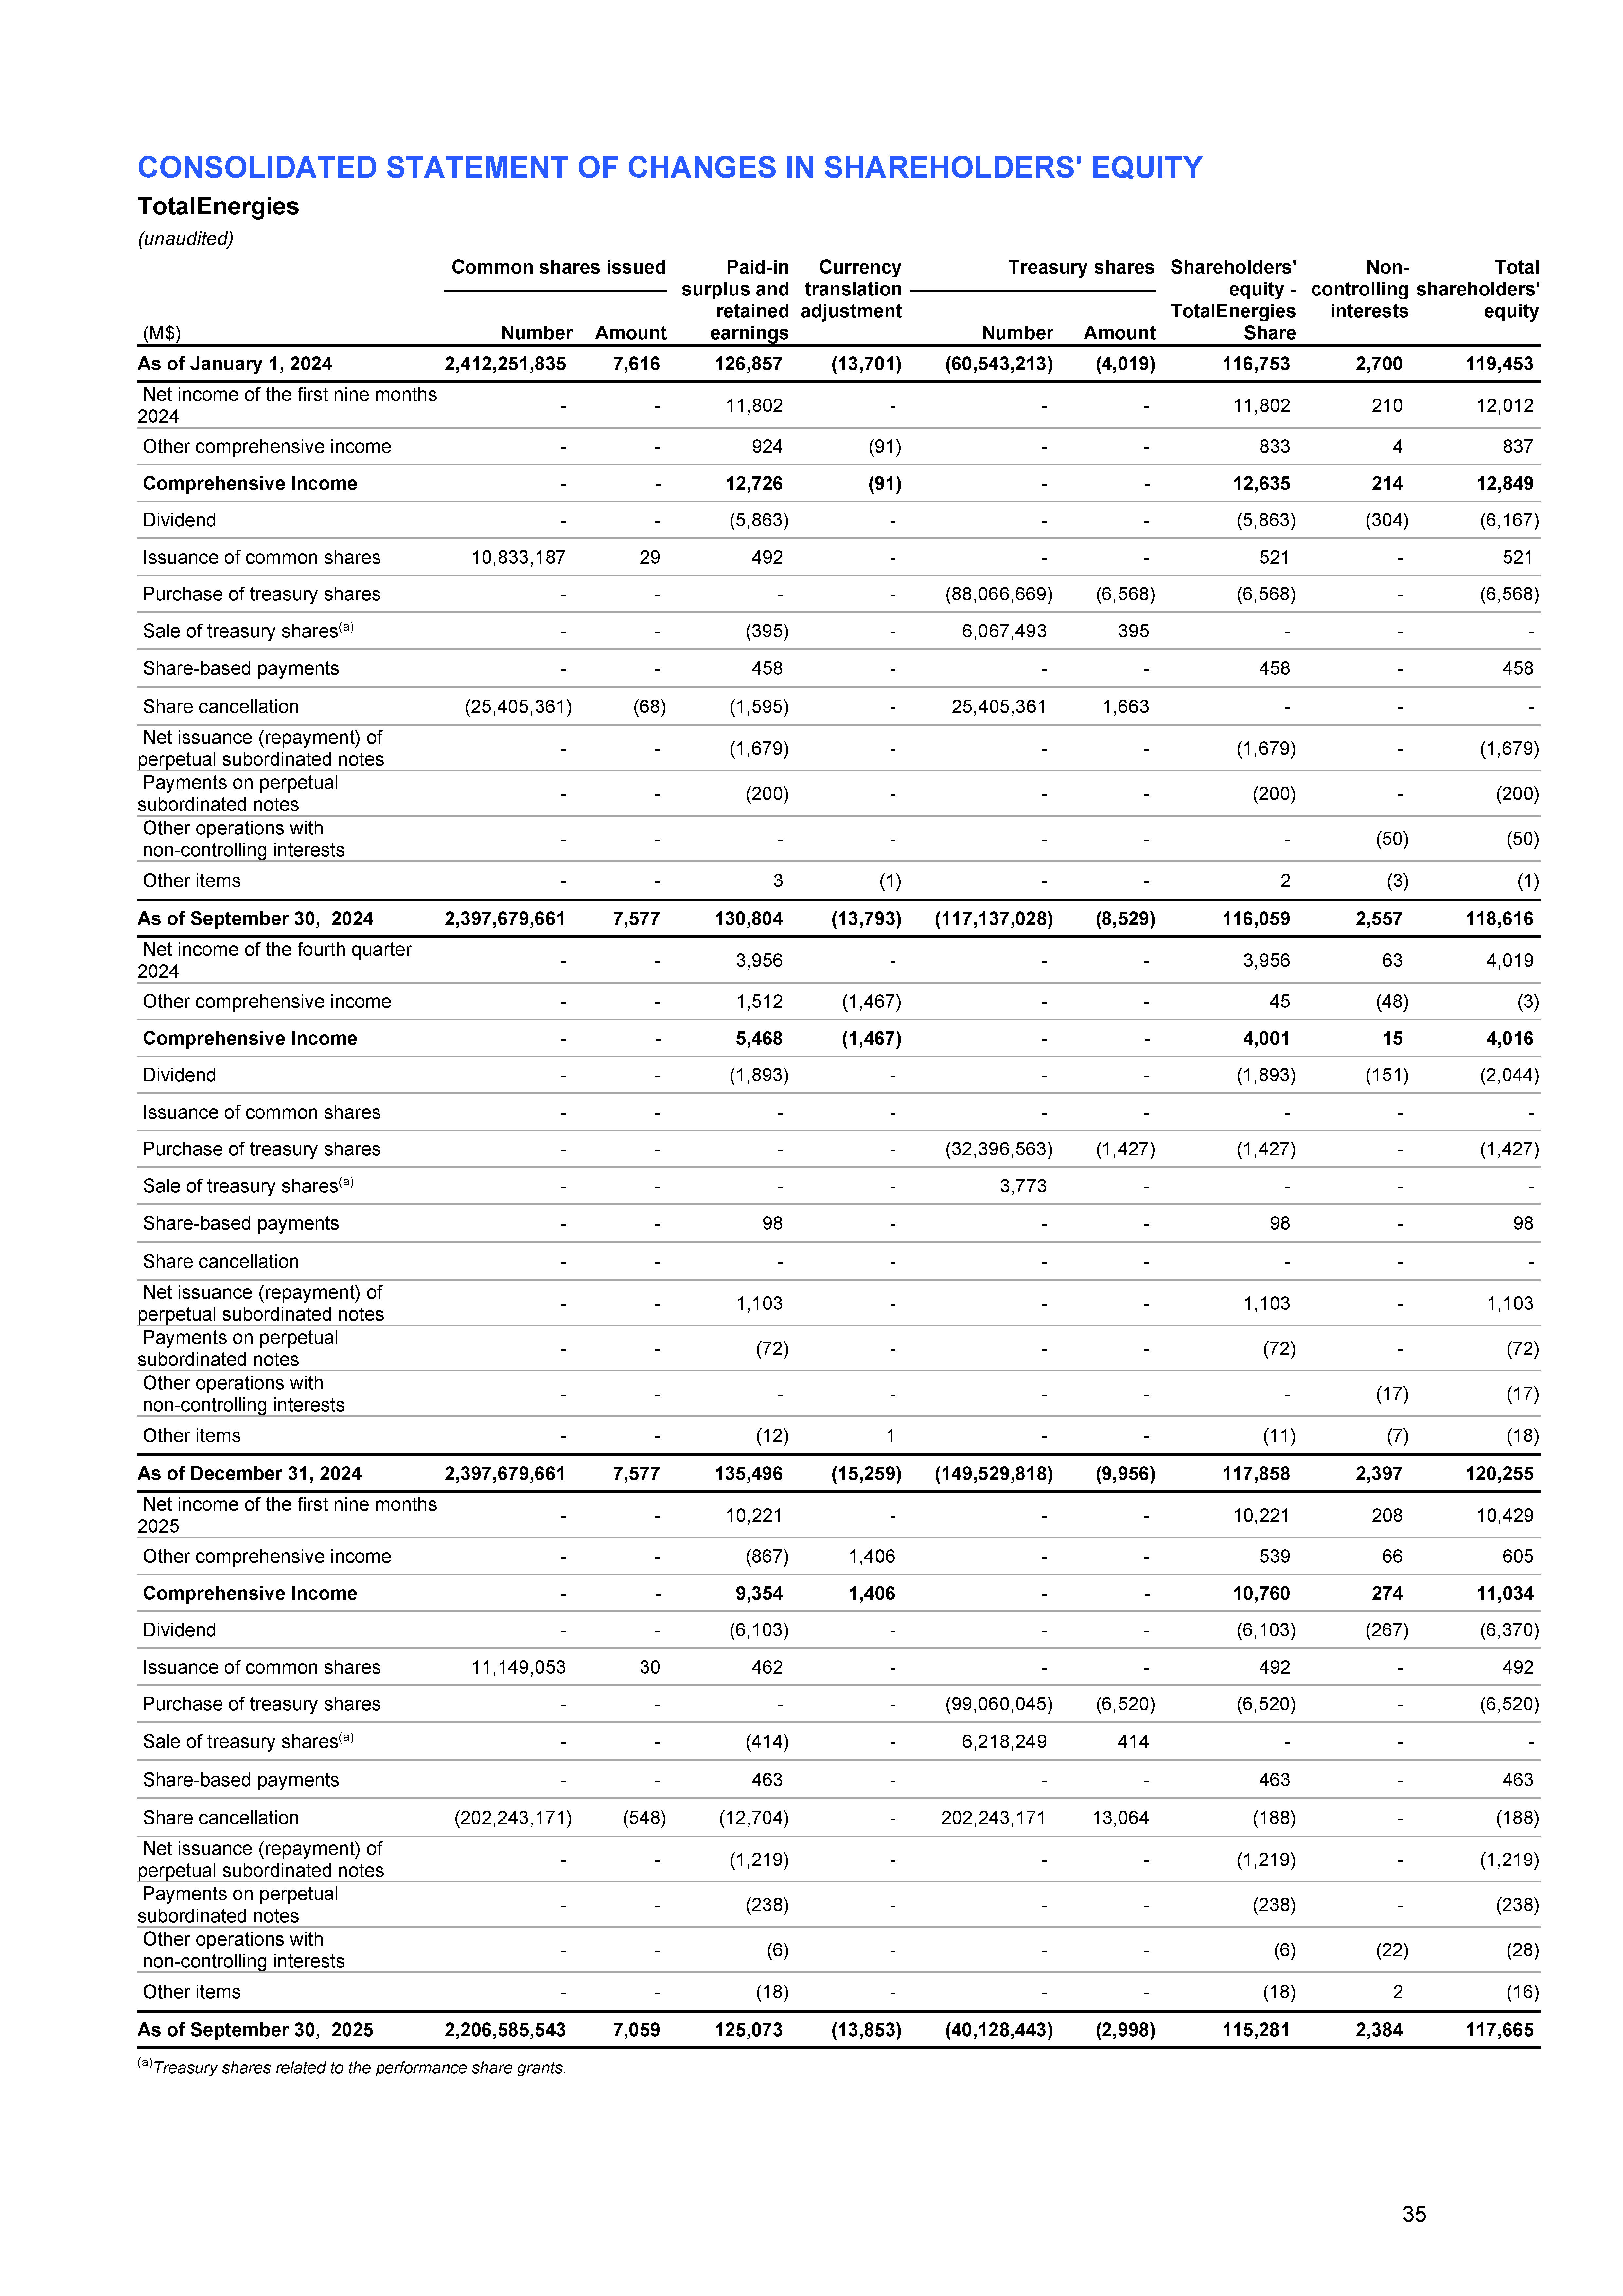
| INFORMATION BY BUSINESS SEGMENT TotalEnergies (unaudited) 3 rd quarter 2025 Exploration & Production Integrated LNG Integrated Power Refining & Chemicals Marketing & Services Corporate Intercompany Total (M$) External sales 1,392 1,995 3,955 21,205 20,138 6 - 48,691 Intersegment sales 8,892 1,587 434 7,122 234 38 (18,307) - Excise taxes - - - (201) (4,646) - - (4,847) Revenues from sales 10,284 3,582 4,389 28,126 15,726 44 (18,307) 43,844 Operating expenses (4,200) (2,880) (3,863) (27,069) (14,916) (225) 18,307 (34,846) Depreciation, depletion and impairment of tangible assets and mineral interests (2,145) (376) (103) (380) (243) (33) - (3,280) Net income (loss) from equity affiliates and other items 522 492 (52) 75 (24) (3) - 1,010 Tax on net operating income (2,055) (97) (110) (143) (177) 115 - (2,467) Adjustments (a) 237 (131) (310) (78) (14) (22) - (318) Adjusted net operating income 2,169 852 571 687 380 (80) - 4,579 Adjustments (a) (318) Net cost of net debt (499) Non-controlling interests (79) Net income - TotalEnergies share 3,683 (a) Adjustments include special items, inventory valuation effect and the effect of changes in fair value. The management of balance sheet positions (including margin calls) related to centralized markets access for LNG, gas and power activities has been fully included in the Integrated LNG segment. Effects of changes in the fair value of gas and LNG positions are allocated to the operating income of Integrated LNG segment. Effects of changes in the fair value of power positions are allocated to the operating income of Integrated Power segment. 3 rd quarter 2025 Exploration & Production Integrated LNG Integrated Power Refining & Chemicals Marketing & Services Corporate Intercompany Total (M$) Total expenditures 2,409 611 773 402 205 35 - 4,435 Total divestments 622 465 81 17 45 2 - 1,232 Cash flow from operating activities 4,187 789 674 2,839 287 (427) - 8,349 36 |
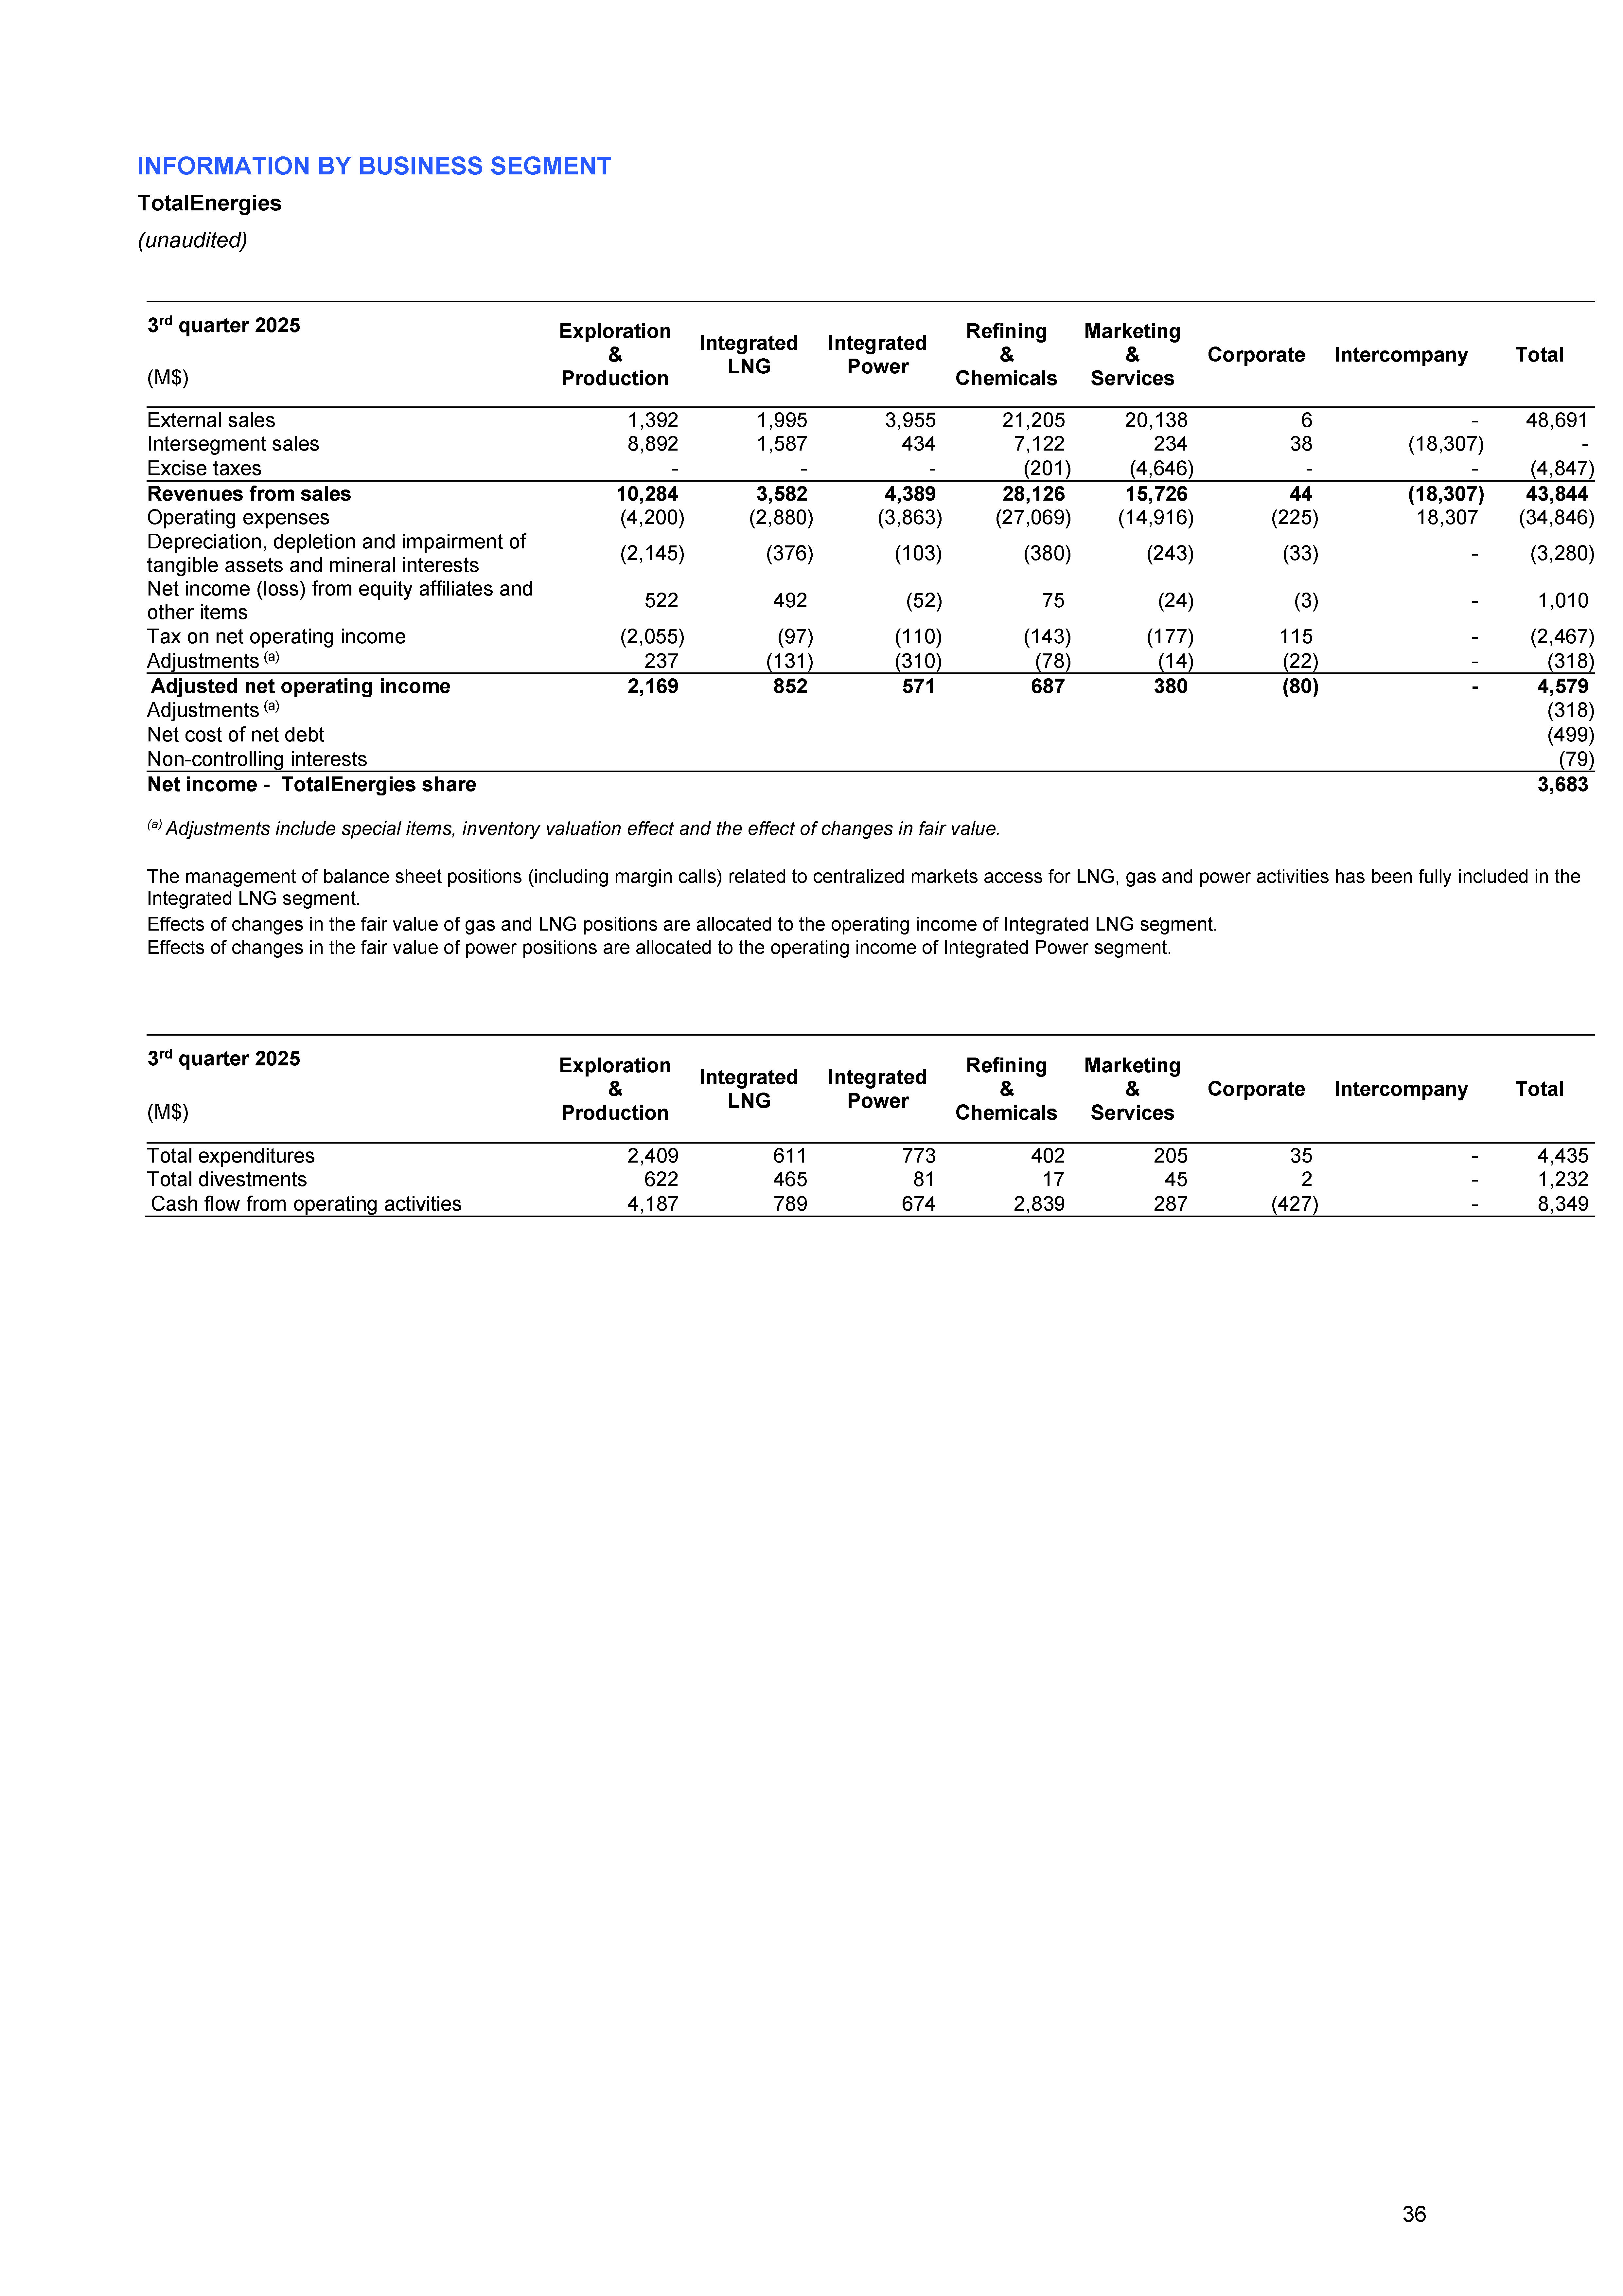
| INFORMATION BY BUSINESS SEGMENT TotalEnergies (unaudited) 2 nd quarter 2025 Exploration & Production Integrated LNG Integrated Power Refining & Chemicals Marketing & Services Corporate Intercompany Total (M$) External sales 1,369 2,586 3,958 21,759 19,944 11 - 49,627 Intersegment sales 8,862 1,869 701 7,006 177 32 (18,647) - Excise taxes - - - (254) (4,697) - - (4,951) Revenues from sales 10,231 4,455 4,659 28,511 15,424 43 (18,647) 44,676 Operating expenses (4,577) (3,632) (4,479) (27,995) (14,751) (302) 18,647 (37,089) Depreciation, depletion and impairment of tangible assets and mineral interests (1,978) (397) (108) (520) (224) (31) - (3,258) Net income (loss) from equity affiliates and other items 58 578 340 (42) 113 (35) - 1,012 Tax on net operating income (1,793) (166) (27) (12) (168) 57 - (2,109) Adjustments (a) (33) (203) (189) (447) (18) (23) - (913) Adjusted net operating income 1,974 1,041 574 389 412 (245) - 4,145 Adjustments (a) (913) Net cost of net debt (486) Non-controlling interests (59) Net income - TotalEnergies share 2,687 (a) Adjustments include special items, inventory valuation effect and the effect of changes in fair value. The management of balance sheet positions (including margin calls) related to centralized markets access for LNG, gas and power activities has been fully included in the Integrated LNG segment. Effects of changes in the fair value of gas and LNG positions are allocated to the operating income of Integrated LNG segment. Effects of changes in the fair value of power positions are allocated to the operating income of Integrated Power segment. 2 nd quarter 2025 Exploration & Production Integrated LNG Integrated Power Refining & Chemicals Marketing & Services Corporate Intercompany Total (M$) Total expenditures 3,186 877 2,503 351 234 86 - 7,237 Total divestments 80 25 347 42 38 16 - 548 Cash flow from operating activities 3,675 539 799 887 628 (568) - 5,960 37 |

| INFORMATION BY BUSINESS SEGMENT TotalEnergies (unaudited) 3 rd quarter 2024 Exploration & Production Integrated LNG Integrated Power Refining & Chemicals Marketing & Services Corporate Intercompany Total (M$) External sales 1,425 2,350 4,444 22,926 20,872 4 - 52,021 Intersegment sales 9,633 2,017 424 7,927 218 58 (20,277) - Excise taxes - - - (213) (4,379) - - (4,592) Revenues from sales 11,058 4,367 4,868 30,640 16,711 62 (20,277) 47,429 Operating expenses (5,257) (3,393) (4,329) (30,273) (16,082) (209) 20,277 (39,266) Depreciation, depletion and impairment of tangible assets and mineral interests (2,324) (294) (114) (400) (229) (31) - (3,392) Net income (loss) from equity affiliates and other items 47 482 (274) (79) (29) (38) - 109 Tax on net operating income (1,879) (250) (66) 40 (102) 117 - (2,140) Adjustments (a) (837) (151) (400) (313) (95) (23) - (1,819) Adjusted net operating income 2,482 1,063 485 241 364 (76) - 4,559 Adjustments (a) (1,819) Net cost of net debt (379) Non-controlling interests (67) Net income - TotalEnergies share 2,294 (a) Adjustments include special items, inventory valuation effect and the effect of changes in fair value. The management of balance sheet positions (including margin calls) related to centralized markets access for LNG, gas and power activities has been fully included in the Integrated LNG segment. Effects of changes in the fair value of gas and LNG positions are allocated to the operating income of Integrated LNG segment. Effects of changes in the fair value of power positions are allocated to the operating income of Integrated Power segment. 3 rd quarter 2024 Exploration & Production Integrated LNG Integrated Power Refining & Chemicals Marketing & Services Corporate Intercompany Total (M$) Total expenditures 2,251 599 2,291 388 329 52 - 5,910 Total divestments 90 99 70 69 19 1 - 348 Cash flow from operating activities 4,763 830 373 564 581 60 - 7,171 38 |
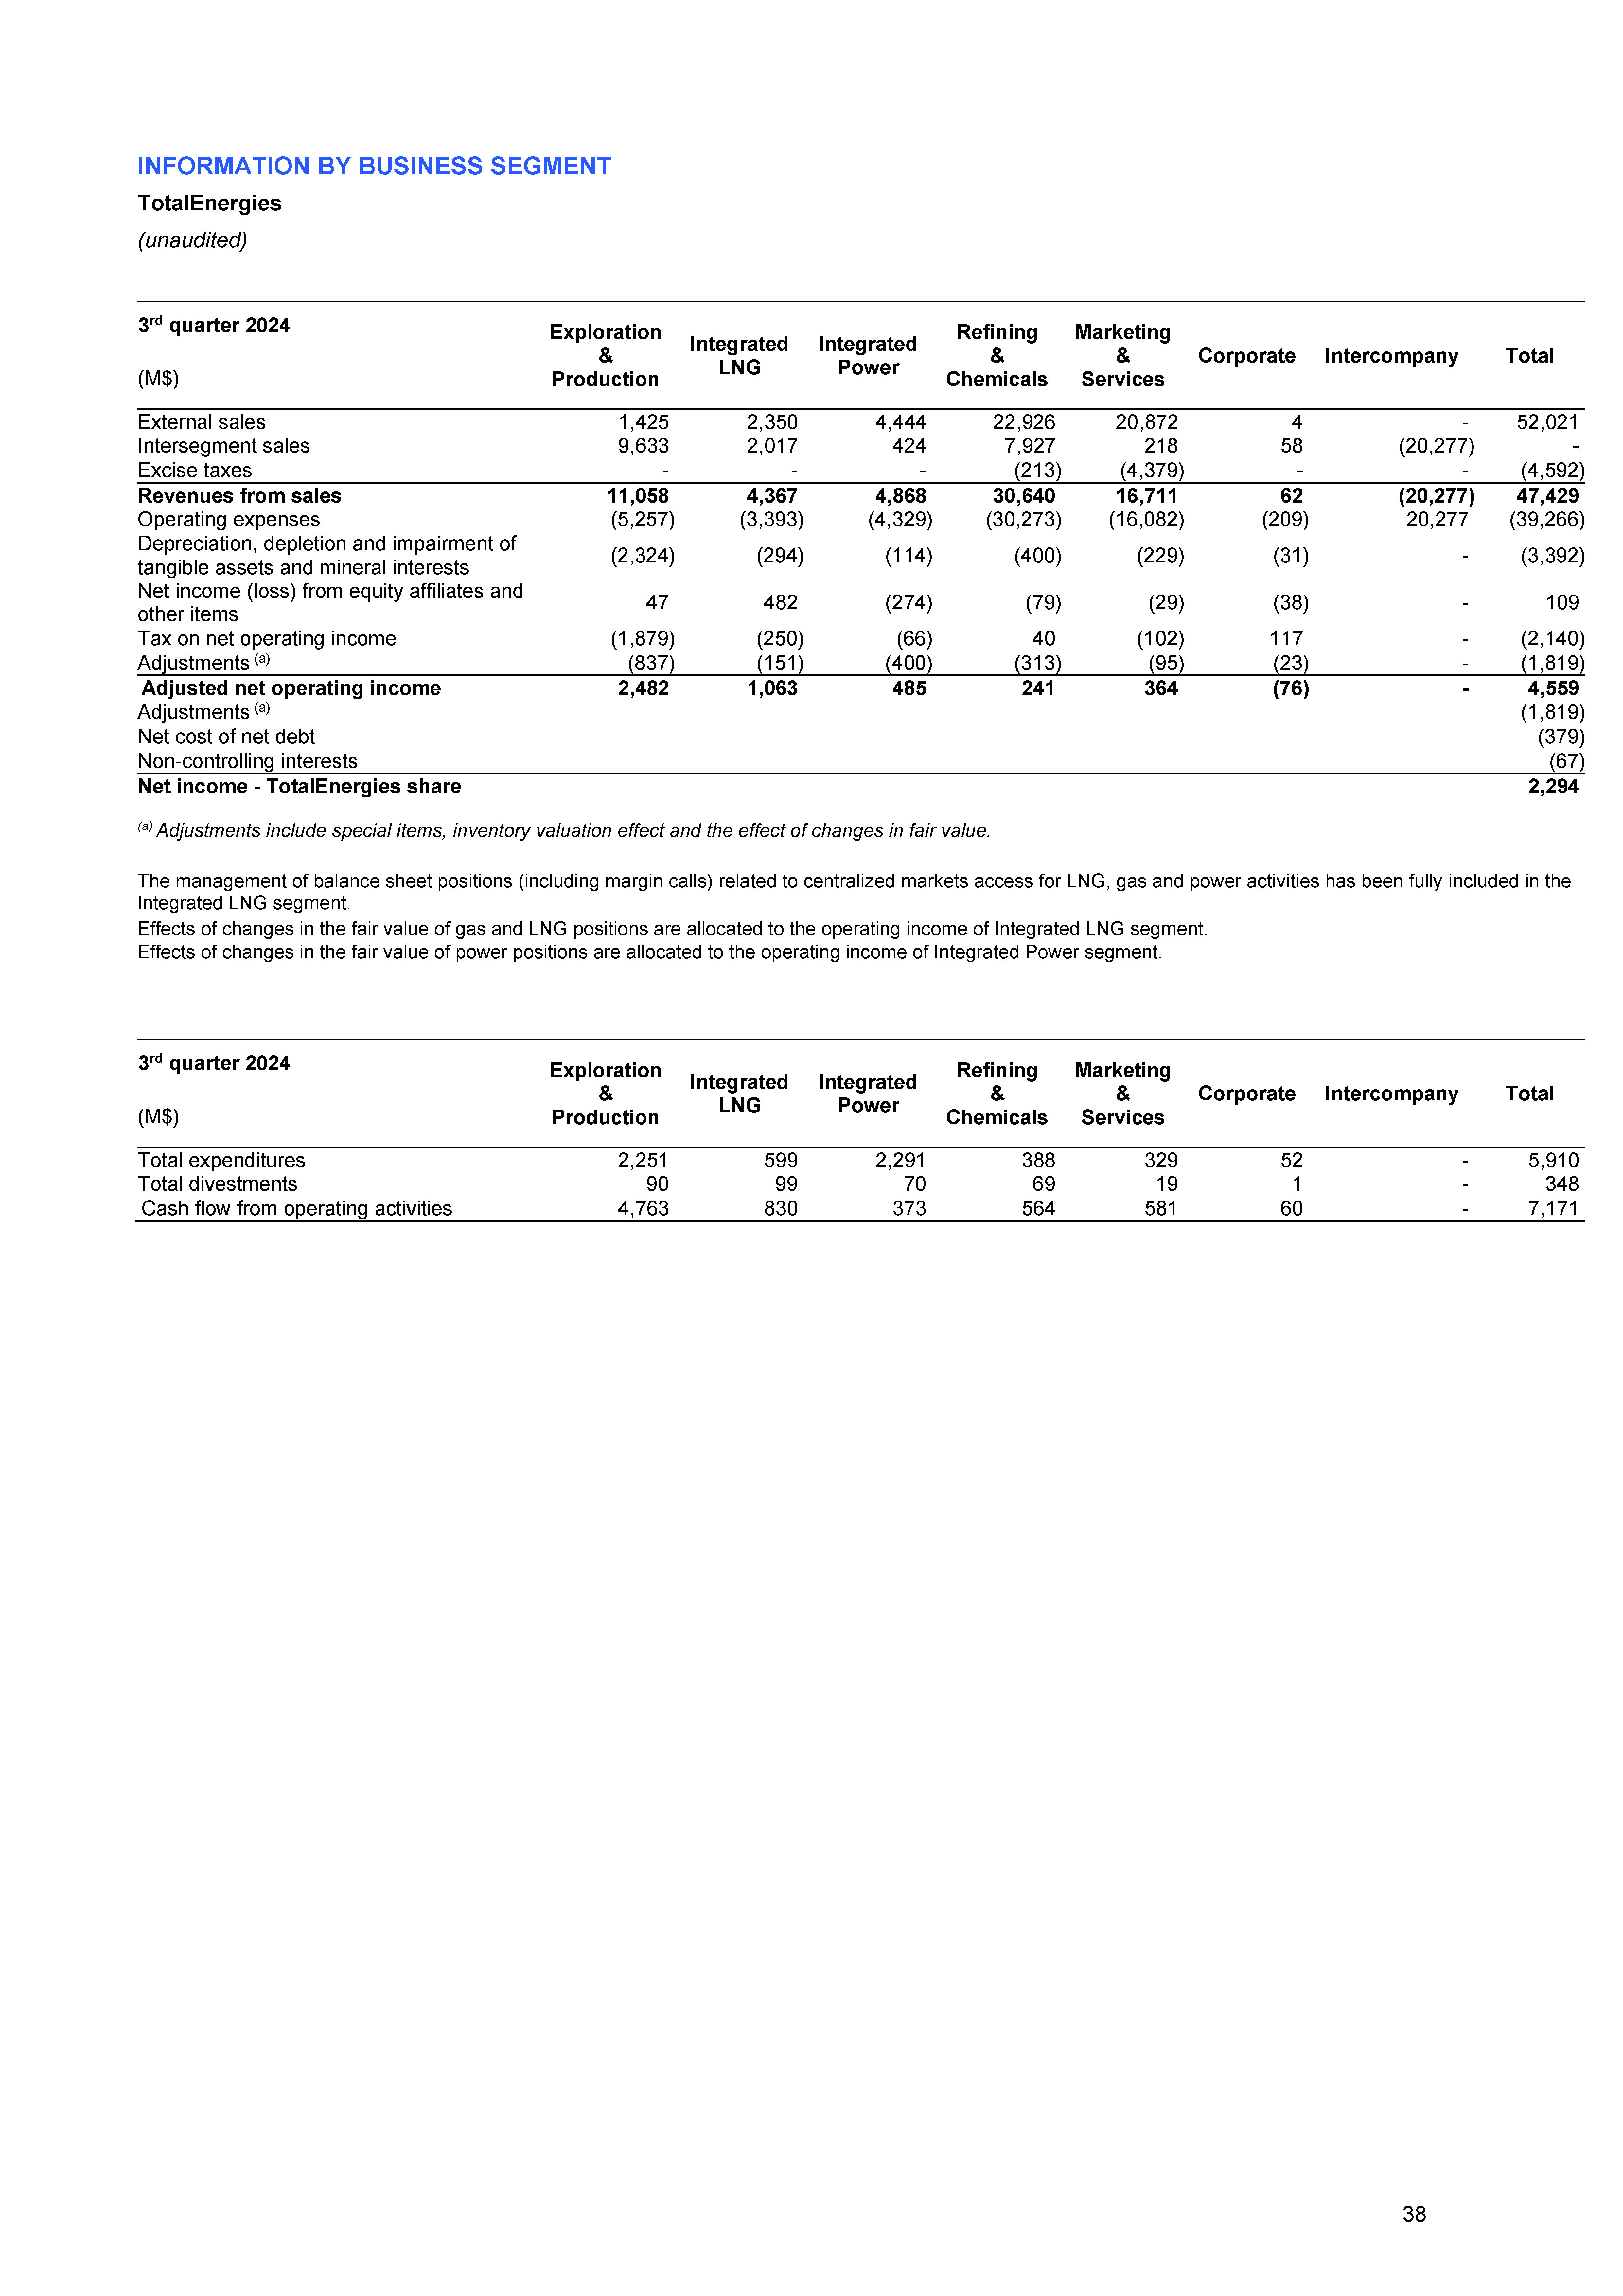
| INFORMATION BY BUSINESS SEGMENT TotalEnergies (unaudited) 9 months 2025 Exploration & Production Integrated LNG Integrated Power Refining & Chemicals Marketing & Services Corporate Intercompany Total (M$) External sales 4,330 7,669 13,880 65,591 59,083 19 - 150,572 Intersegment sales 26,481 6,708 1,819 20,939 567 95 (56,609) - Excise taxes - - - (567) (13,586) - - (14,153) Revenues from sales 30,811 14,377 15,699 85,963 46,064 114 (56,609) 136,419 Operating expenses (12,577) (11,468) (14,527) (83,712) (44,041) (719) 56,609 (110,435) Depreciation, depletion and impairment of tangible assets and mineral interests (6,073) (1,164) (286) (1,239) (684) (90) - (9,536) Net income (loss) from equity affiliates and other items 713 1,635 332 25 79 (74) - 2,710 Tax on net operating income (6,176) (538) (210) (238) (443) 246 - (7,359) Adjustments (a) 104 (345) (643) (578) (57) (67) - (1,586) Adjusted net operating income 6,594 3,187 1,651 1,377 1,032 (456) - 13,385 Adjustments (a) (1,586) Net cost of net debt (1,370) Non-controlling interests (208) Net income - TotalEnergies share 10,221 (a) Adjustments include special items, inventory valuation effect and the effect of changes in fair value. The management of balance sheet positions (including margin calls) related to centralized markets access for LNG, gas and power activities has been fully included in the Integrated LNG segment. Effects of changes in the fair value of gas and LNG positions are allocated to the operating income of Integrated LNG segment. Effects of changes in the fair value of power positions are allocated to the operating income of Integrated Power segment. 9 months 2025 Exploration & Production Integrated LNG Integrated Power Refining & Chemicals Marketing & Services Corporate Intercompany Total (M$) Total expenditures 8,642 2,390 4,212 995 611 155 - 17,005 Total divestments 1,060 500 486 65 180 17 - 2,308 Cash flow from operating activities 11,128 3,071 1,074 1,743 1,483 (1,627) - 16,872 39 |

| INFORMATION BY BUSINESS SEGMENT TotalEnergies (unaudited) 9 months 2024 Exploration & Production Integrated LNG Integrated Power Refining & Chemicals Marketing & Services Corporate Intercompany Total (M$) External sales 4,159 6,995 15,990 71,975 62,901 22 - 162,042 Intersegment sales 29,164 7,623 1,583 24,273 651 198 (63,492) - Excise taxes - - - (591) (12,956) - - (13,547) Revenues from sales 33,323 14,618 17,573 95,657 50,596 220 (63,492) 148,495 Operating expenses (14,370) (11,099) (16,400) (92,808) (48,779) (756) 63,492 (120,720) Depreciation, depletion and impairment of tangible assets and mineral interests (6,148) (925) (316) (1,192) (643) (86) - (9,310) Net income (loss) from equity affiliates and other items 285 1,503 (863) (24) 1,367 18 - 2,286 Tax on net operating income (6,303) (785) (185) (275) (311) 149 - (7,710) Adjustments (a) (912) (125) (1,789) (484) 1,232 (36) - (2,114) Adjusted net operating income 7,699 3,437 1,598 1,842 998 (419) - 15,155 Adjustments (a) (2,114) Net cost of net debt (1,029) Non-controlling interests (210) Net income - TotalEnergies share 11,802 (a) Adjustments include special items, inventory valuation effect and the effect of changes in fair value. The management of balance sheet positions (including margin calls) related to centralized markets access for LNG, gas and power activities has been fully included in the Integrated LNG segment. Effects of changes in the fair value of gas and LNG positions are allocated to the operating income of Integrated LNG segment. Effects of changes in the fair value of power positions are allocated to the operating income of Integrated Power segment. 9 months 2024 Exploration & Production Integrated LNG Integrated Power Refining & Chemicals Marketing & Services Corporate Intercompany Total (M$) Total expenditures 7,242 2,008 4,799 1,266 732 120 - 16,167 Total divestments 545 178 393 234 1,222 8 - 2,580 Cash flow from operating activities 12,888 2,971 1,771 (24) 2,123 (1,382) - 18,347 40 |

| Non GAAP Financial Measures 41 |
| Alternative Performance Measures (Non-GAAP) TotalEnergies (unaudited) 1. Reconciliation of cash flow used in investing activities to Net investments 1.1 Exploration & Production 3 rd quarter 2 nd quarter 3 rd quarter3 rd quarter 2025 vs (in millions of dollars) 9 months 9 months 9 months 2025 vs 2025 2025 2024 3 rd quarter 2024 2025 2024 9 months 2024 1,787 3,106 2,161 -17% Cash flow used in investing activities ( a ) 7,582 6,697 13% - - - ns Other transactions with non-controlling interests ( b ) - - ns - - 1 -100% Organic loan repayment from equity affiliates ( c ) - 1 -100% - - - ns Change in debt from renewable projects financing ( d ) * - - ns 80 89 100 -20% Capex linked to capitalized leasing contracts ( e ) 278 280 -1% 2 20 26 -92% Expenditures related to carbon credits ( f ) 24 29 -17% 1,869 3,215 2,288 -18% Net investments ( a + b + c + d + e + f = g - i + h ) 7,884 7,007 13% (53) 162 (42) ns of which net acquisitions of assets sales ( g - i ) 225 51 x4.4 522 193 36 x14.5 Acquisitions ( g ) 1,160 523 x2.2 575 31 78 x7.4 Assets sales ( i ) 935 472 98% - - - ns Change in debt (partner share) and capital gain from renewable projects sales - - ns 1,922 3,053 2,330 -18% of which organic investments ( h ) 7,659 6,956 10% 70 30 140 -50% Capitalized exploration 209 364 -43% 38 42 46 -17% Increase in non-current loans 162 155 5% (47) (49) (11) ns Repayment of non-current loans, excluding organic loan repayment from equity affiliates (125) (72) ns - - - ns Change in debt from renewable projects (TotalEnergies share) - - ns *Change in debt from renewable projects (TotalEnergies share and partner share) 1.2 Integrated LNG 3 rd quarter 2 nd quarter 3 rd quarter3 rd quarter 2025 vs (in millions of dollars) 9 months 9 months 9 months 2025 vs 2025 2025 2024 3 rd quarter 2024 2025 2024 9 months 2024 146 852 500 -71% Cash flow used in investing activities ( a ) 1,890 1,830 3% - - - ns Other transactions with non-controlling interests ( b ) - - ns 46 - 2 x23 Organic loan repayment from equity affiliates ( c ) 47 3 x15.7 - - - ns Change in debt from renewable projects financing ( d ) * - - ns 4 1 14 -71% Capex linked to capitalized leasing contracts ( e ) 4 33 -88% - - - ns Expenditures related to carbon credits ( f ) - - ns 196 853 516 -62% Net investments ( a + b + c + d + e + f = g - i + h ) 1,941 1,866 4% (134) 110 65 ns of which net acquisitions of assets sales ( g - i ) 116 251 -54% (60) 110 69 ns Acquisitions ( g ) 194 268 -28% 74 - 4 x18.5 Assets sales ( i ) 78 17 x4.6 - - - ns Change in debt (partner share) and capital gain from renewable projects sales - - ns 330 743 451 -27% of which organic investments ( h ) 1,825 1,615 13% 4 7 8 -50% Capitalized exploration 13 30 -57% 174 187 214 -19% Increase in non-current loans 543 540 1% (345) (25) (79) ns Repayment of non-current loans, excluding organic loan repayment from equity affiliates (375) (158) ns - - - ns Change in debt from renewable projects (TotalEnergies share) - - ns *Change in debt from renewable projects (TotalEnergies share and partner share) 42 |
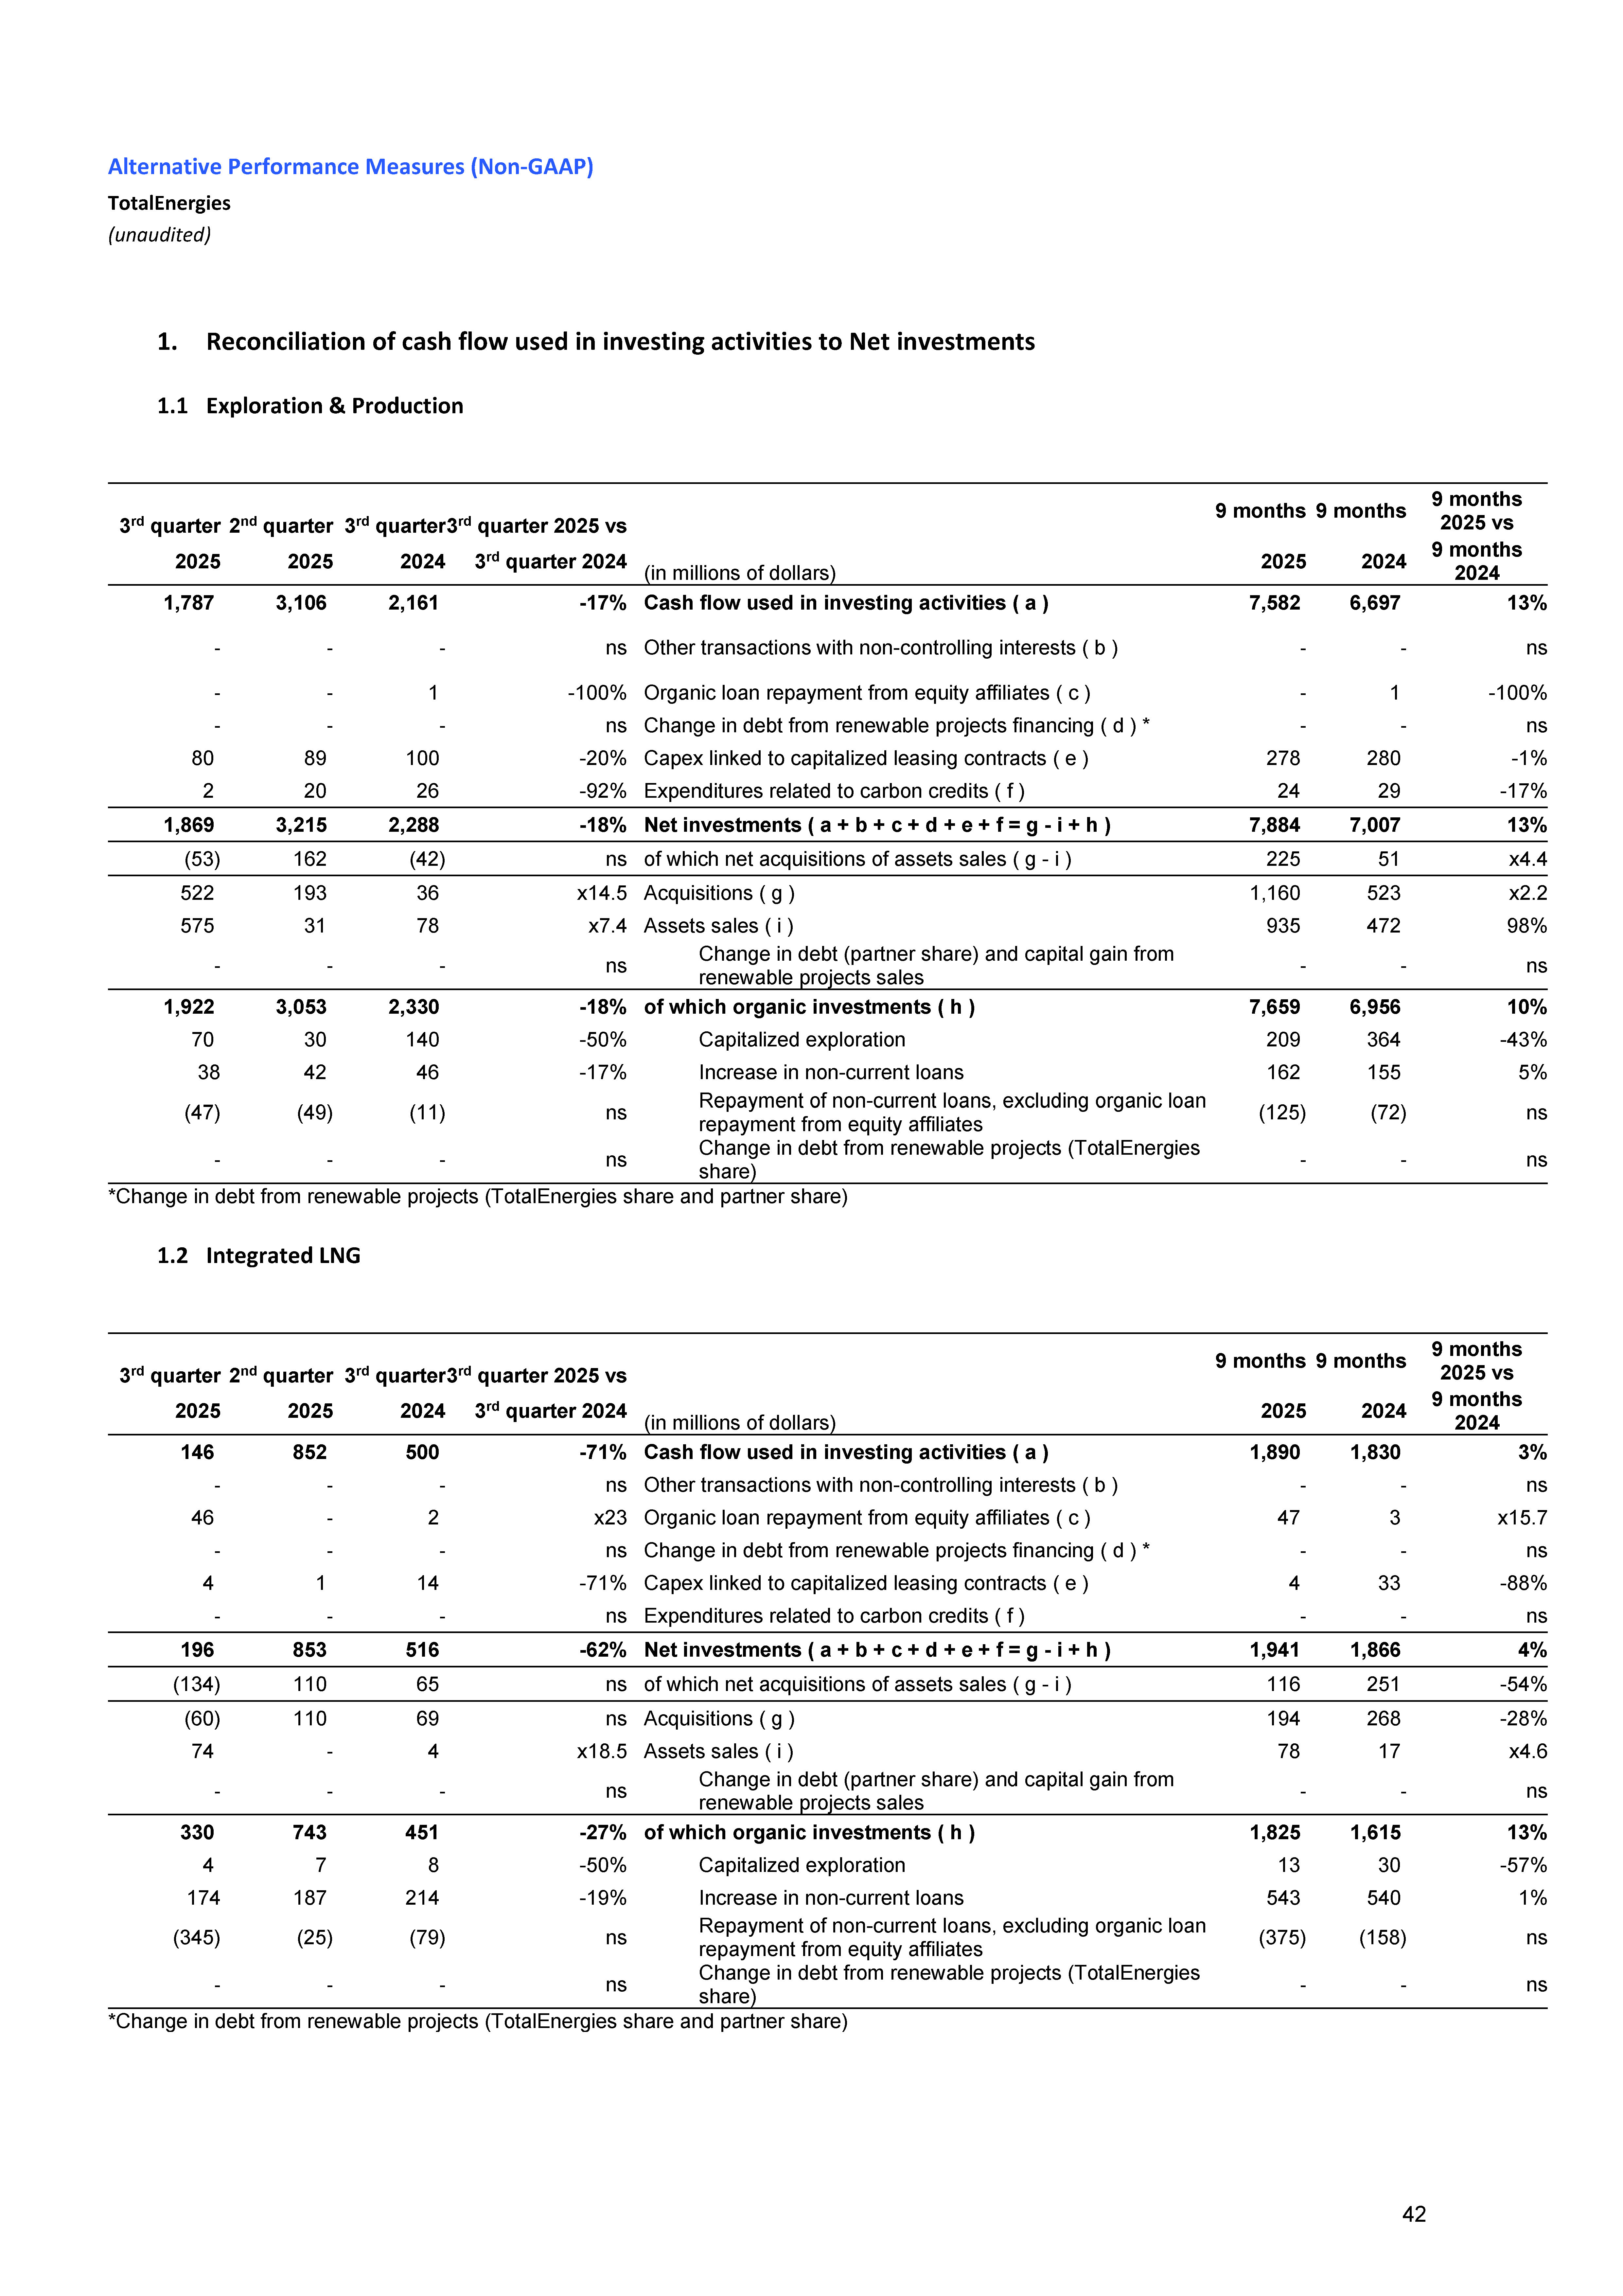
| Alternative Performance Measures (Non-GAAP) TotalEnergies (unaudited) 1.3 Integrated Power 3 rd quarter 2 nd quarter 3 rd quarter3 rd quarter 2025 vs (in millions of dollars) 9 months 9 months 9 months 2025 vs 2025 2025 2024 3 rd quarter 2024 2025 2024 9 months 2024 692 2,156 2,221 -69% Cash flow used in investing activities ( a ) 3,726 4,406 -15% - - - ns Other transactions with non-controlling interests ( b ) - - ns (1) 54 10 ns Organic loan repayment from equity affiliates ( c ) 58 10 x5.8 (242) (221) - ns Change in debt from renewable projects financing ( d ) * (463) - ns - - 5 -100% Capex linked to capitalized leasing contracts ( e ) - 6 -100% - - - ns Expenditures related to carbon credits ( f ) - - ns 449 1,989 2,236 -80% Net investments ( a + b + c + d + e + f = g - i + h ) 3,321 4,422 -25% (147) 1,568 1,529 ns of which net acquisitions of assets sales ( g - i ) 1,658 2,176 -24% 12 1,791 1,565 -99% Acquisitions ( g ) 2,048 2,443 -16% 159 223 36 x4.4 Assets sales ( i ) 390 267 46% 121 67 - ns Change in debt (partner share) and capital gain from renewable projects sales 188 - ns 596 421 707 -16% of which organic investments ( h ) 1,663 2,246 -26% - - - ns Capitalized exploration - - ns 162 150 135 20% Increase in non-current loans 580 679 -15% (43) (137) (24) ns Repayment of non-current loans, excluding organic loan repayment from equity affiliates (226) (116) ns (121) (154) - ns Change in debt from renewable projects (TotalEnergies share) (275) - ns *Change in debt from renewable projects (TotalEnergies share and partner share) 1.4 Refining & Chemicals 3 rd quarter 2 nd quarter 3 rd quarter3 rd quarter 2025 vs (in millions of dollars) 9 months 9 months 9 months 2025 vs 2025 2025 2024 3 rd quarter 2024 2025 2024 9 months 2024 385 309 319 21% Cash flow used in investing activities ( a ) 930 1,032 -10% - - - ns Other transactions with non-controlling interests ( b ) - - ns - - 44 -100% Organic loan repayment from equity affiliates ( c ) - 17 -100% - - - ns Change in debt from renewable projects financing ( d ) * - - ns - - - ns Capex linked to capitalized leasing contracts ( e ) - - ns - - - ns Expenditures related to carbon credits ( f ) - - ns 385 309 363 6% Net investments ( a + b + c + d + e + f = g - i + h ) 930 1,049 -11% (2) (24) 34 ns of which net acquisitions of assets sales ( g - i ) (26) (81) ns - 11 42 -100% Acquisitions ( g ) 11 77 -86% 2 35 8 -75% Assets sales ( i ) 37 158 -77% - - - ns Change in debt (partner share) and capital gain from renewable projects sales - - ns 387 333 329 18% of which organic investments ( h ) 956 1,130 -15% - - - ns Capitalized exploration - - ns 16 17 33 -52% Increase in non-current loans 43 98 -56% (15) (7) (17) ns Repayment of non-current loans, excluding organic loan repayment from equity affiliates (28) (27) ns - - - ns Change in debt from renewable projects (TotalEnergies share) - - ns *Change in debt from renewable projects (TotalEnergies share and partner share) 43 |
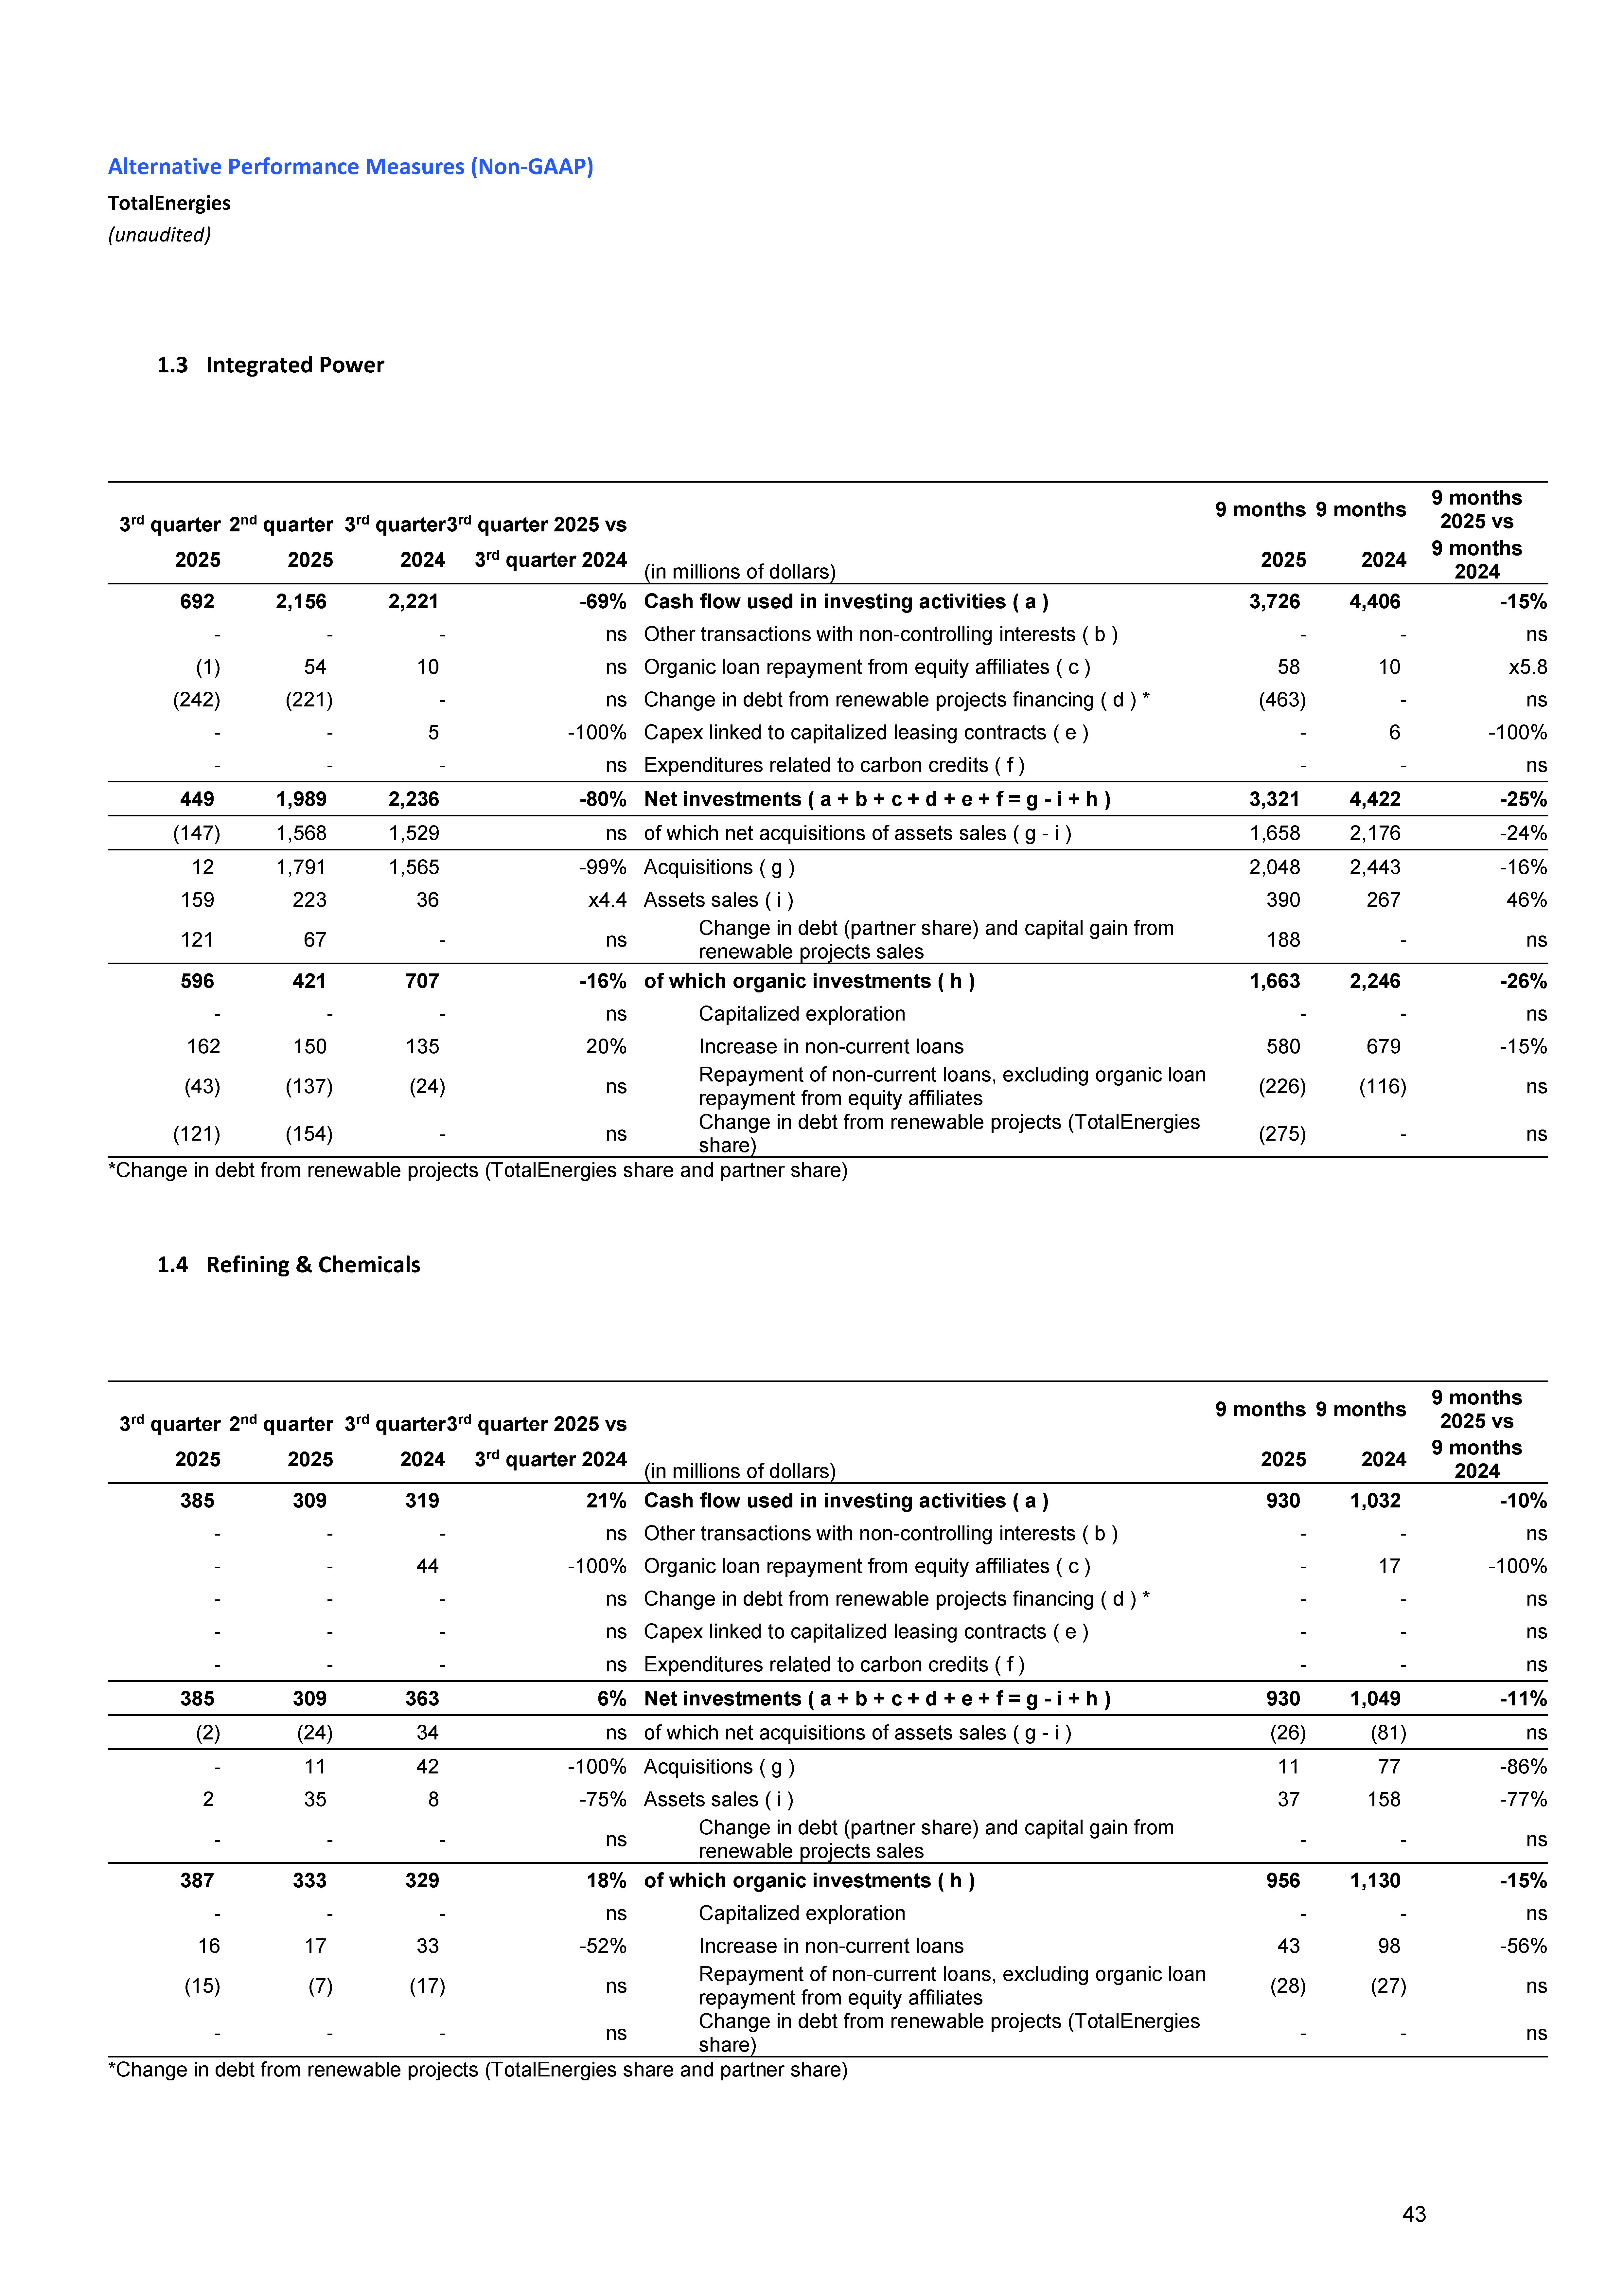
| Alternative Performance Measures (Non-GAAP) TotalEnergies (unaudited) 1.5 Marketing & Services 3 rd quarter 2 nd quarter 3 rd quarter3 rd quarter 2025 vs (in millions of dollars) 9 months 9 months 9 months 2025 vs 2025 2025 2024 3 rd quarter 2024 2025 2024 9 months 2024 160 196 310 -48% Cash flow used in investing activities ( a ) 431 (490) ns - - - ns Other transactions with non-controlling interests ( b ) - - ns - - - ns Organic loan repayment from equity affiliates ( c ) - - ns - - - ns Change in debt from renewable projects financing ( d ) * - - ns - - - ns Capex linked to capitalized leasing contracts ( e ) - - ns - - - ns Expenditures related to carbon credits ( f ) - - ns 160 196 310 -48% Net investments ( a + b + c + d + e + f = g - i + h ) 431 (490) ns (43) (3) 78 ns of which net acquisitions of assets sales ( g - i ) (121) (1,009) ns - 1 83 -100% Acquisitions ( g ) 3 102 -97% 43 4 5 x8.6 Assets sales ( i ) 124 1,111 -89% - - - ns Change in debt (partner share) and capital gain from renewable projects sales - - ns 203 199 232 -13% of which organic investments ( h ) 552 519 6% - - - ns Capitalized exploration - - ns 18 26 16 13% Increase in non-current loans 62 84 -26% 1 (22) (10) ns Repayment of non-current loans, excluding organic loan repayment from equity affiliates (38) (89) ns - - - ns Change in debt from renewable projects (TotalEnergies share) - - ns *Change in debt from renewable projects (TotalEnergies share and partner share) 2. Reconciliation of cash flow from operating activities to CFFO 2.1 Exploration & Production 3 rd quarter 2 nd quarter 3 rd quarter3 rd quarter 2025 vs (in millions of dollars) 9 months 9 months 9 months 2025 vs 2025 2025 2024 3 rd quarter 2024 2025 2024 9 months 2024 4,187 3,675 4,763 -12% Cash flow from operating activities ( a ) 11,128 12,888 -14% 203 (85) 491 -59% (Increase) decrease in working capital ( b ) (907) (215) ns - - - ns Inventory effect ( c ) - - ns - - - ns Capital gain from renewable project sales ( d ) - - ns - - 1 -100% Organic loan repayments from equity affiliates ( e ) - 1 -100% 3,984 3,760 4,273 -7% Cash flow from operations excluding working capital (CFFO) ( f = a - b - c + d + e ) 12,035 13,104 -8% 44 |
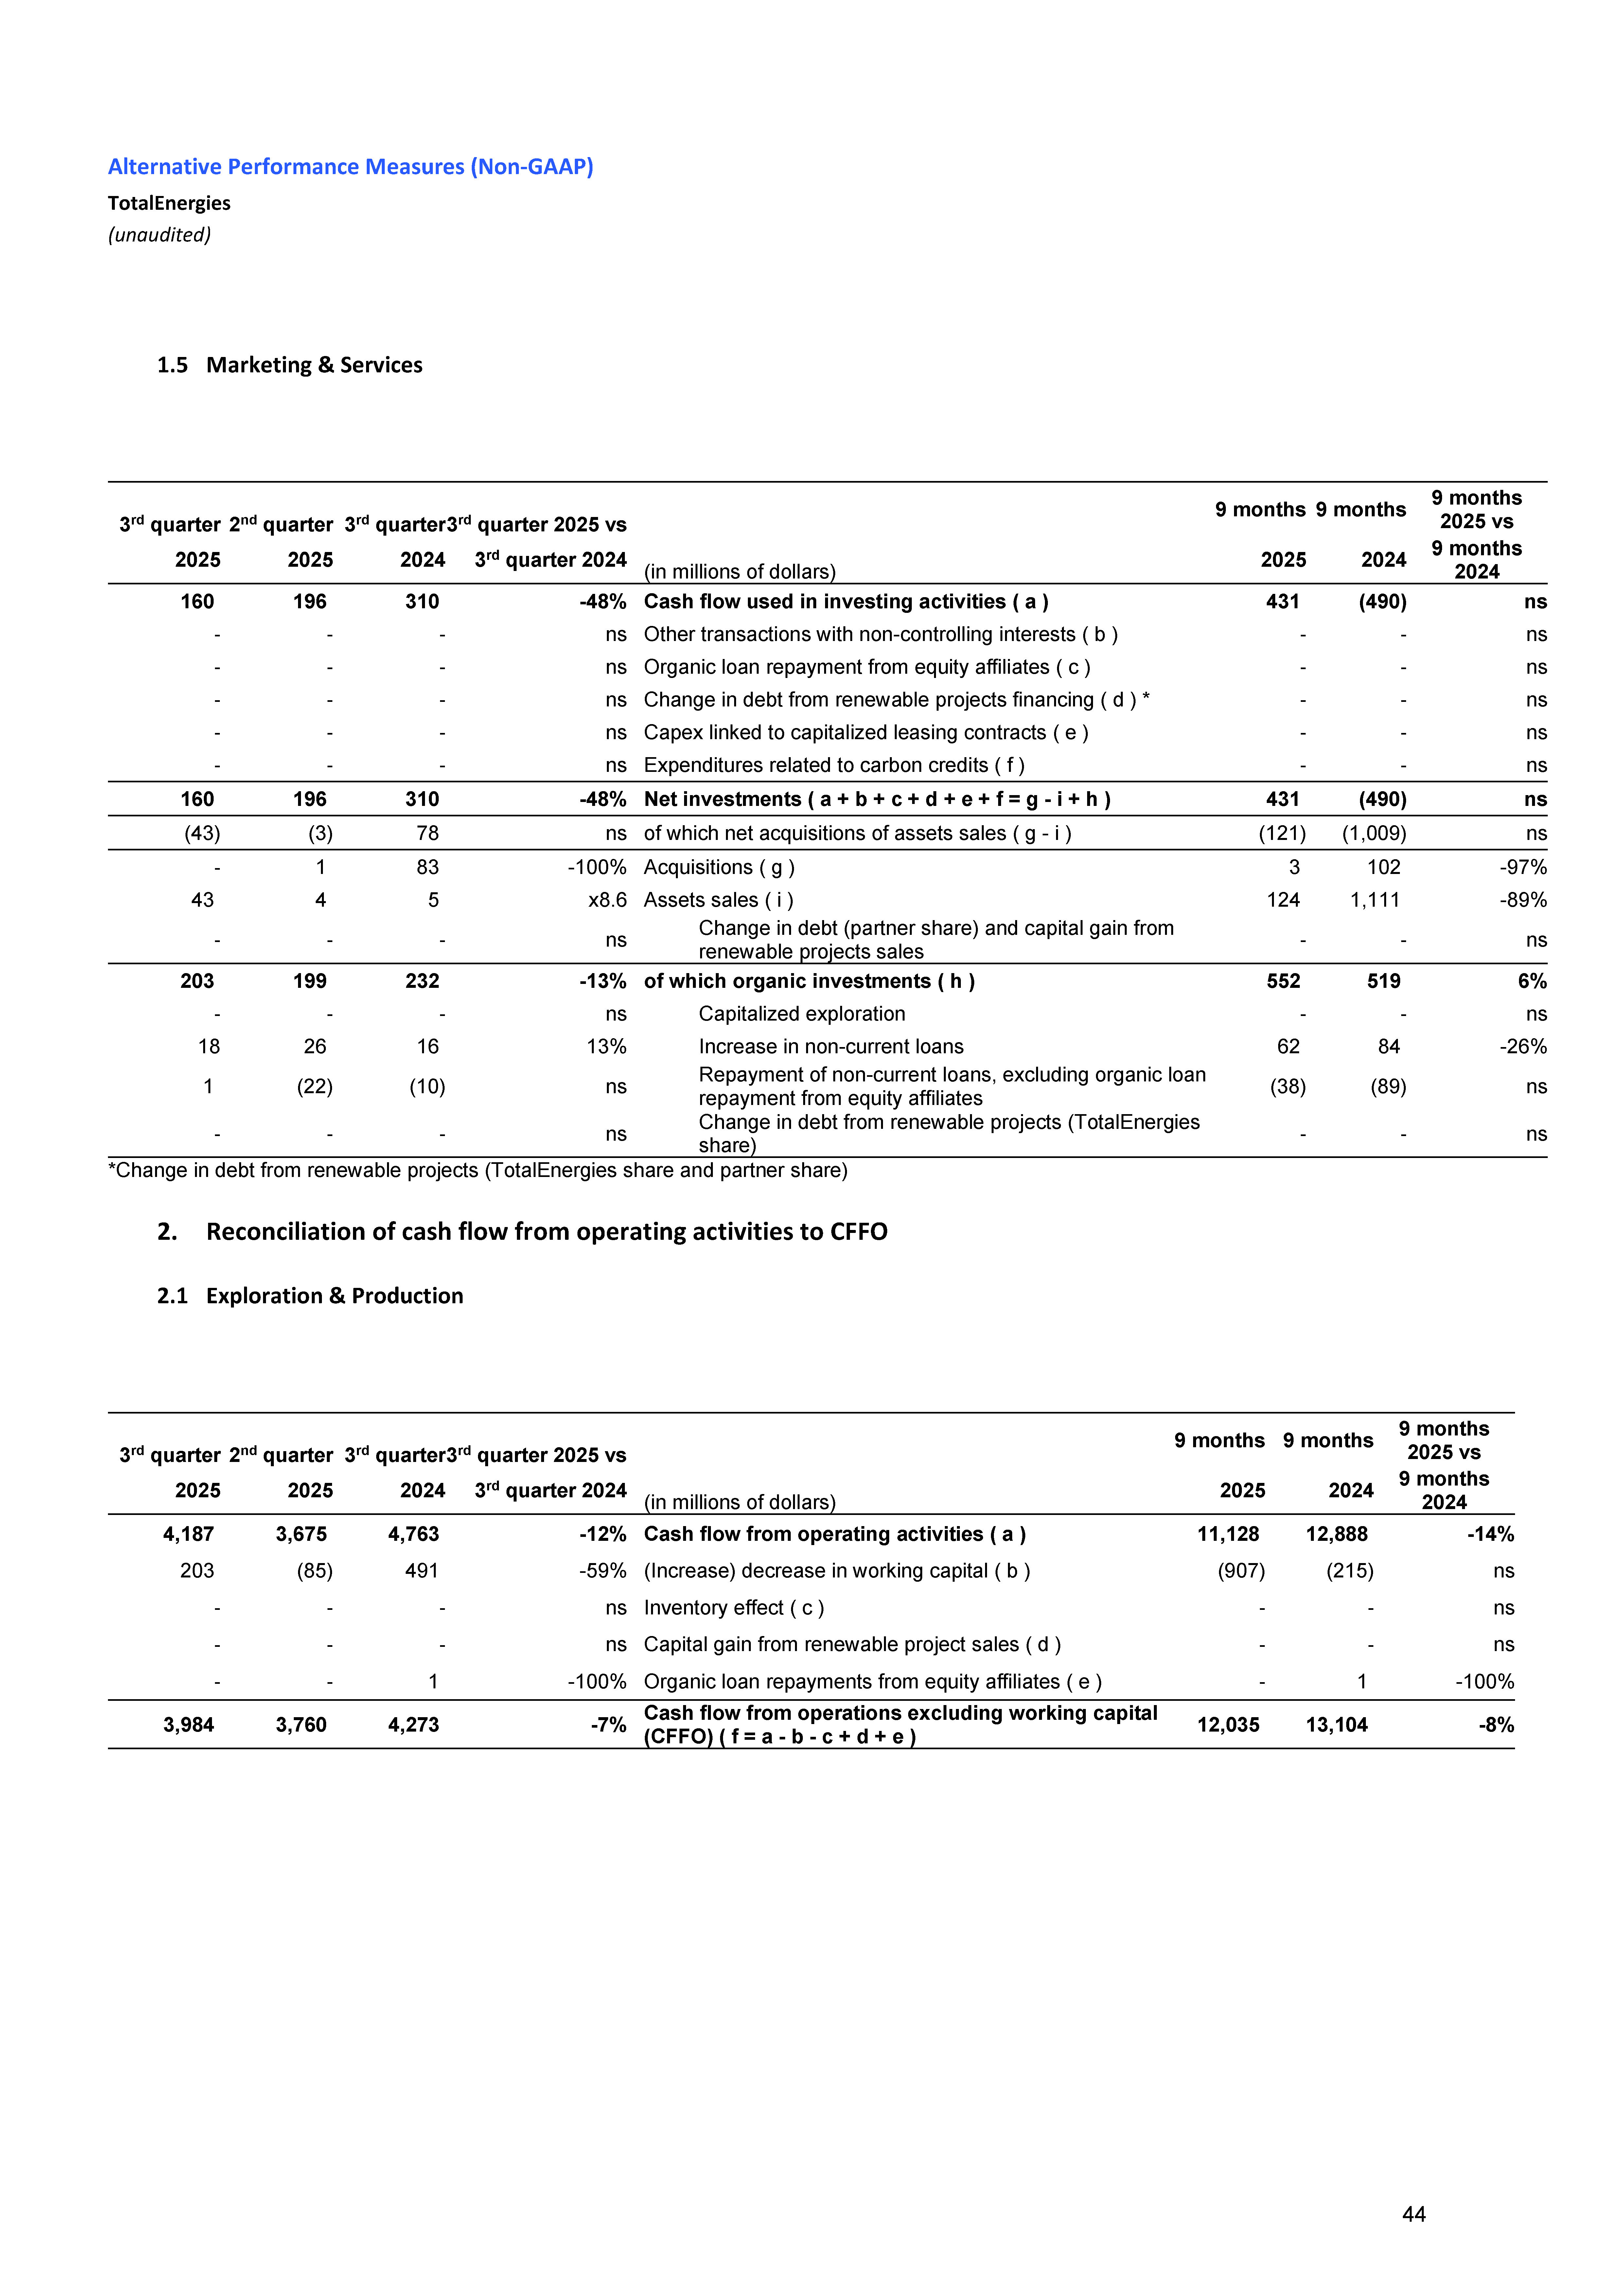
| Alternative Performance Measures (Non-GAAP) TotalEnergies (unaudited) 2.2 Integrated LNG 3 rd quarter 2 nd quarter 3 rd quarter3 rd quarter 2025 vs (in millions of dollars) 9 months 9 months 9 months 2025 vs 2025 2025 2024 3 rd quarter 2024 2025 2024 9 months 2024 789 539 830 -5% Cash flow from operating activities ( a ) 3,071 2,971 3% (299) (620) (56) ns (Increase) decrease in working capital ( b ) * (424) (482) ns - - - ns Inventory effect ( c ) - - ns - - - ns Capital gain from renewable project sales ( d ) - - ns 46 - 2 x23 Organic loan repayments from equity affiliates ( e ) 47 3 x15.7 1,134 1,159 888 28% Cash flow from operations excluding working capital (CFFO) ( f = a - b - c + d + e ) 3,542 3,456 2% *Changes in working capital are presented excluding the mark-to-market effect of Integrated LNG and Integrated Power sectors’ contracts. 2.3 Integrated Power 3 rd quarter 2 nd quarter 3 rd quarter3 rd quarter 2025 vs (in millions of dollars) 9 months 9 months 9 months 2025 vs 2025 2025 2024 3 rd quarter 2024 2025 2024 9 months 2024 674 799 373 81% Cash flow from operating activities ( a ) 1,074 1,771 -39% 56 377 (253) ns (Increase) decrease in working capital ( b ) * (558) (170) ns - - - ns Inventory effect ( c ) - - ns (6) 86 - ns Capital gain from renewable project sales ( d ) 80 - ns (1) 54 10 ns Organic loan repayments from equity affiliates ( e ) 58 10 x5.8 611 562 636 -4% Cash flow from operations excluding working capital (CFFO) ( f = a - b - c + d + e ) 1,770 1,951 -9% * Changes in working capital are presented excluding the mark-to-market effect of Integrated LNG and Integrated Power sectors’ contracts. 45 |
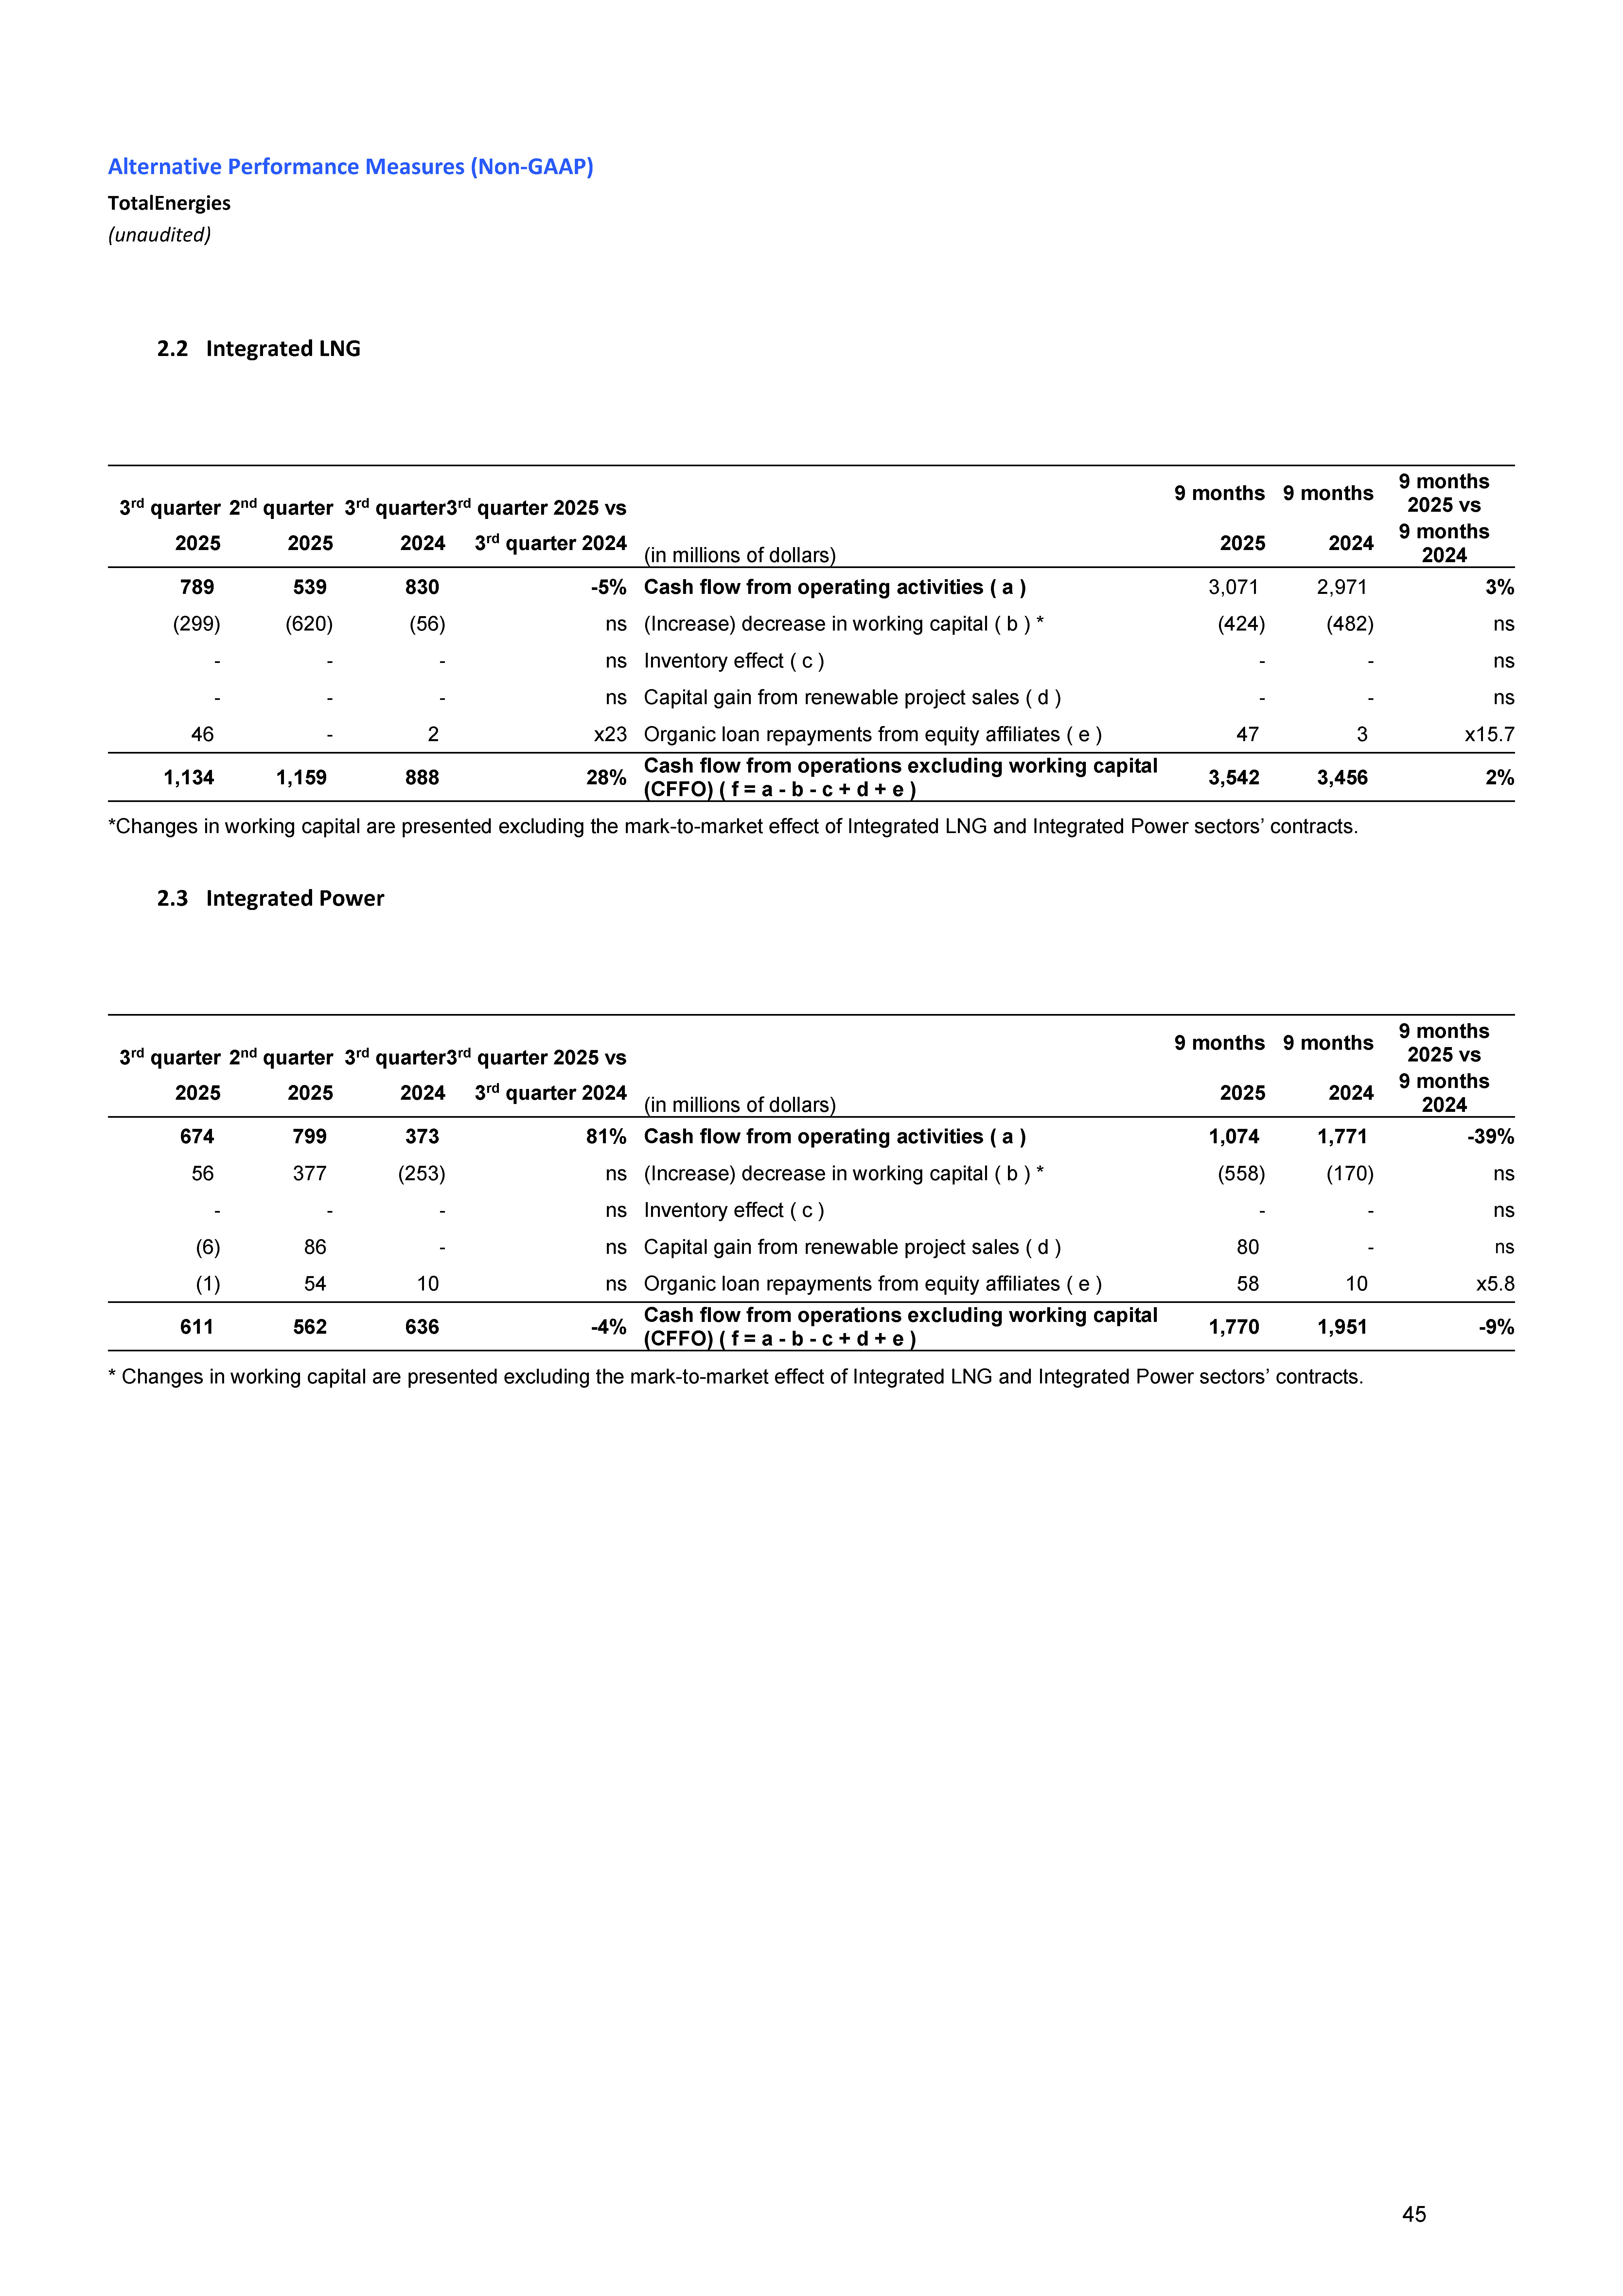
| Alternative Performance Measures (Non-GAAP) TotalEnergies (unaudited) 2.4 Refining & Chemicals 3 rd quarter 2 nd quarter 3 rd quarter3 rd quarter 2025 vs (in millions of dollars) 9 months 9 months 9 months 2025 vs 2025 2025 2024 3 rd quarter 2024 2025 2024 9 months 2024 2,839 887 564 x5 Cash flow from operating activities ( a ) 1,743 (24) ns 1,900 362 413 x4.6 (Increase) decrease in working capital ( b ) (281) (2,325) ns (76) (247) (335) ns Inventory effect ( c ) (396) (620) ns - - - ns Capital gain from renewable project sales ( d ) - - ns - - 44 -100% Organic loan repayments from equity affiliates ( e ) - 17 -100% 1,015 772 530 92% Cash flow from operations excluding working capital (CFFO) ( f = a - b - c + d + e ) 2,420 2,938 -18% 2.5 Marketing & Services 3 rd quarter 2 nd quarter 3 rd quarter3 rd quarter 2025 vs (in millions of dollars) 9 months 9 months 9 months 2025 vs 2025 2025 2024 3 rd quarter 2024 2025 2024 9 months 2024 287 628 581 -51% Cash flow from operating activities ( a ) 1,483 2,123 -30% (372) (58) 63 ns (Increase) decrease in working capital ( b ) (312) 525 ns 21 (25) (129) ns Inventory effect ( c ) (38) (187) ns - - - ns Capital gain from renewable project sales ( d ) - - ns - - - ns Organic loan repayments from equity affiliates ( e ) - - ns 638 711 647 -1% Cash flow from operations excluding working capital (CFFO) ( f = a - b - c + d + e ) 1,833 1,785 3% 46 |
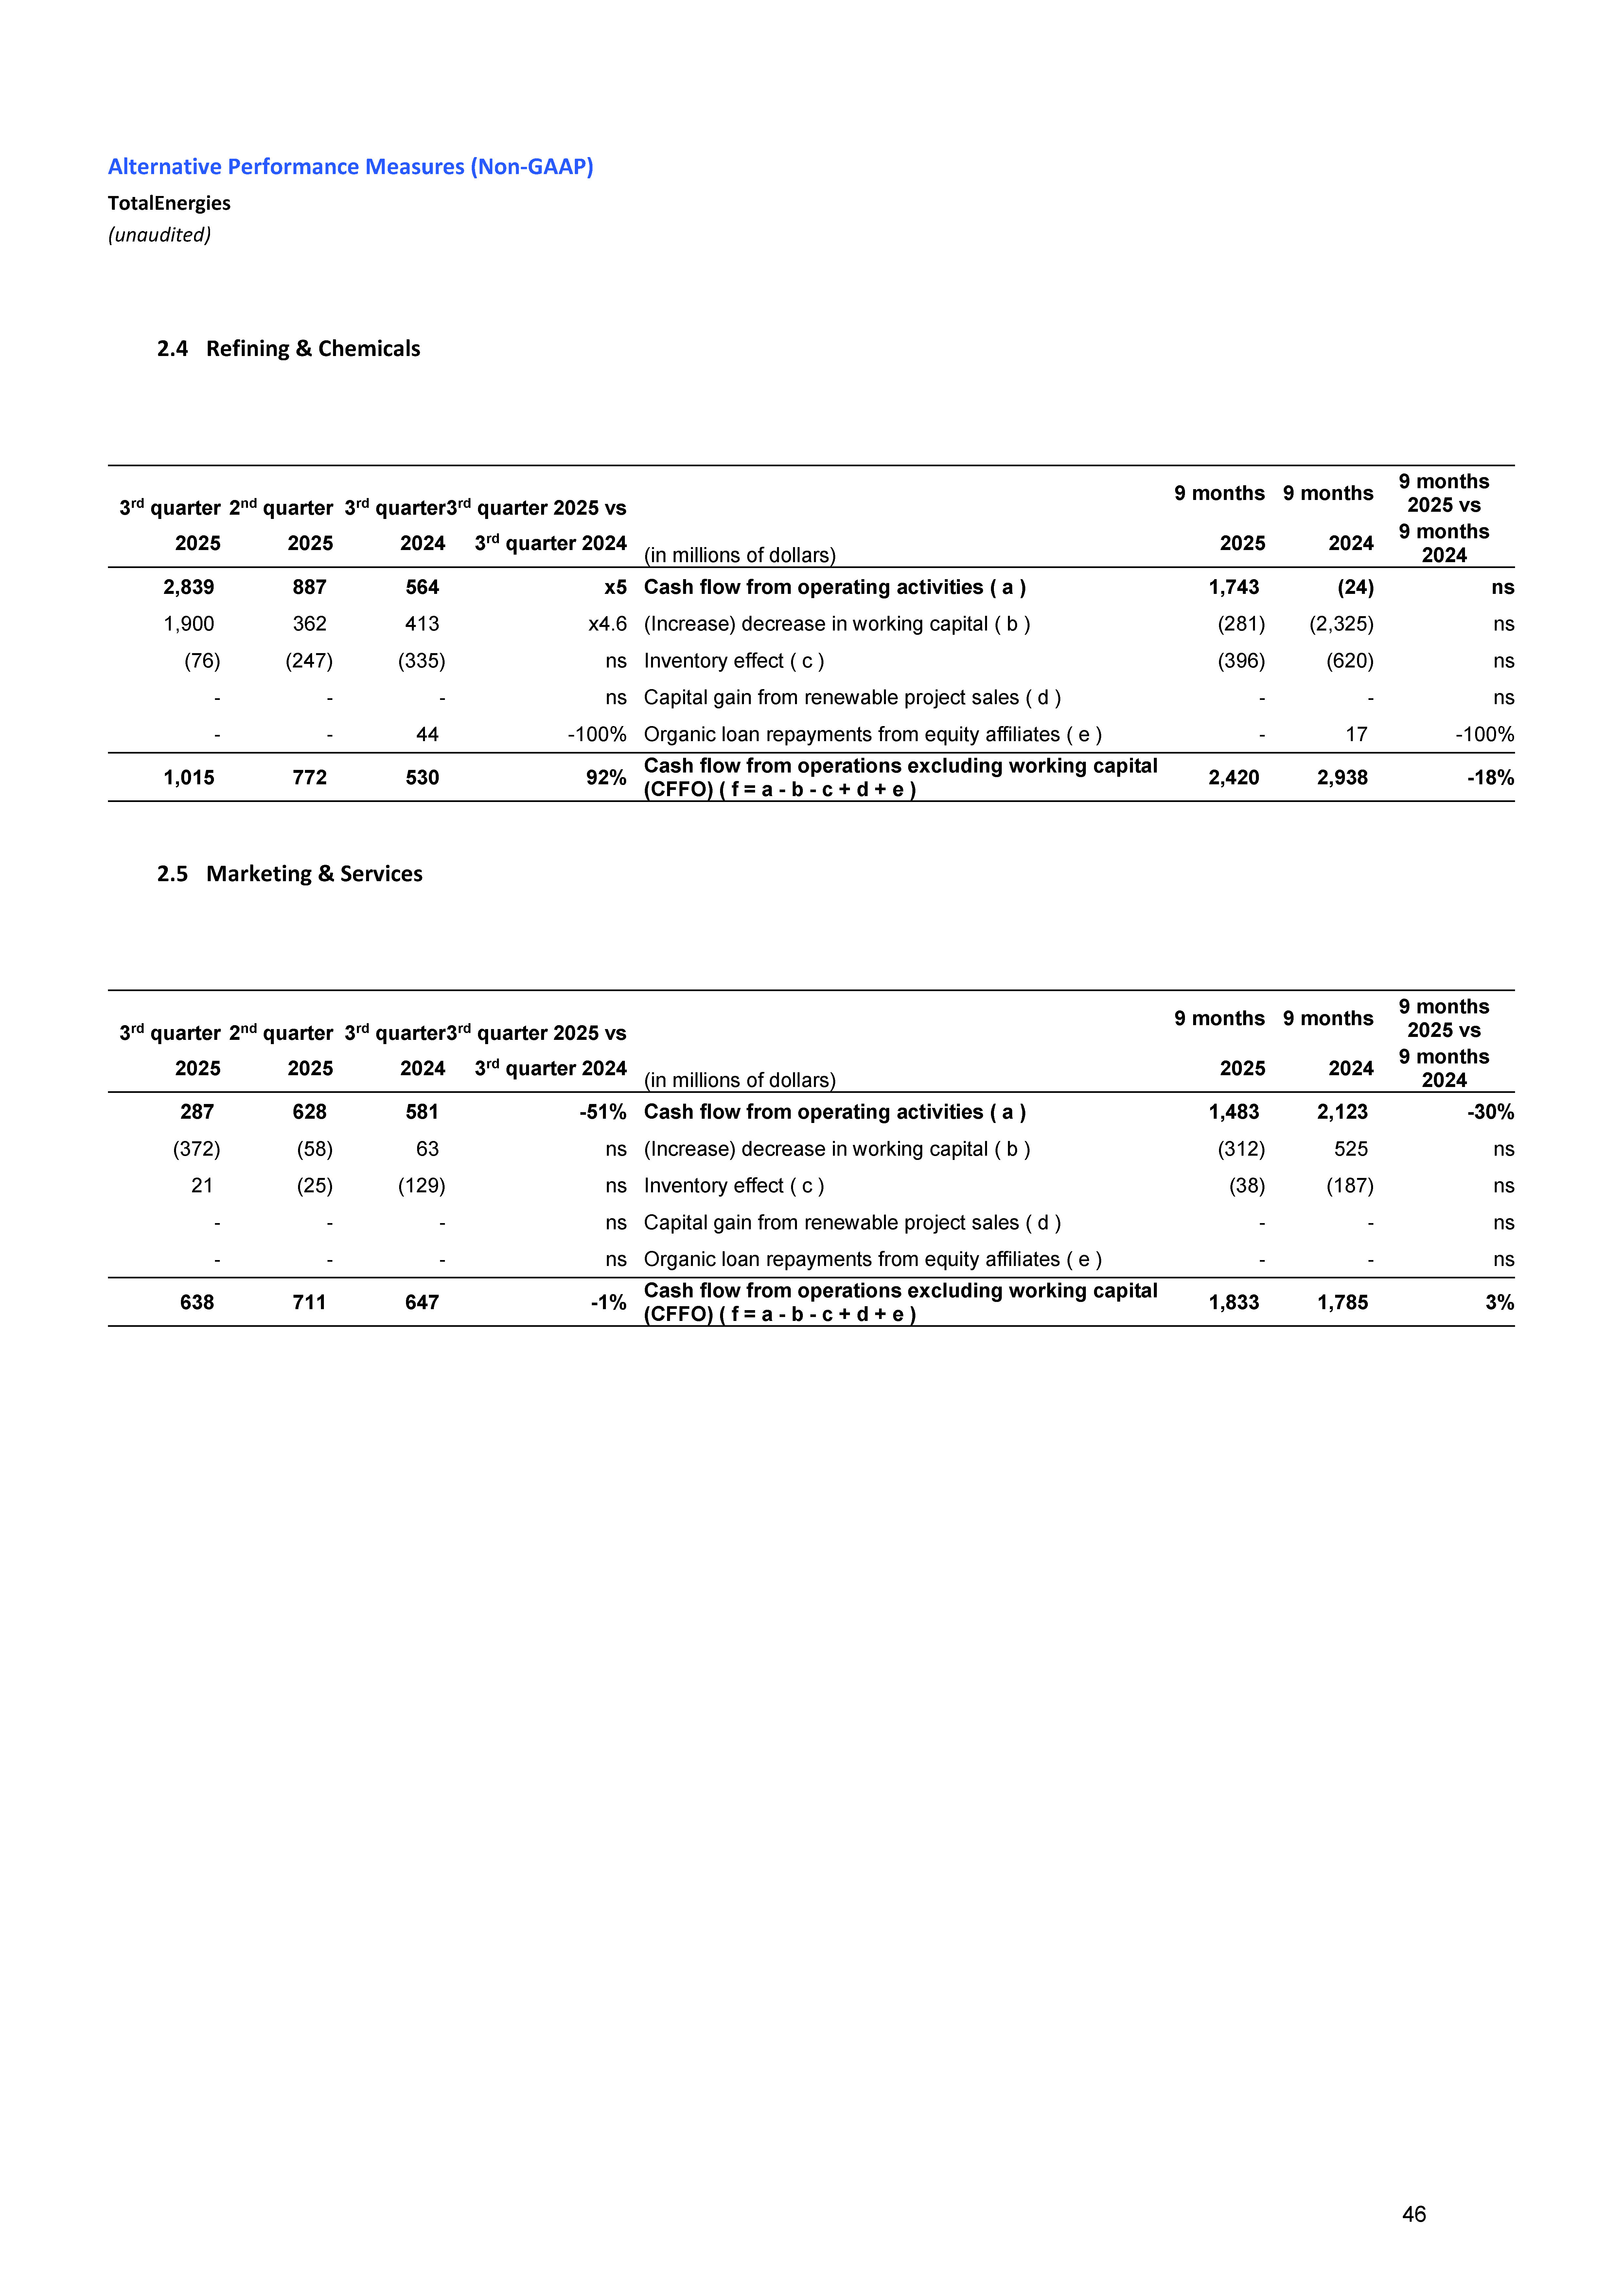
| Alternative Performance Measures (Non-GAAP) TotalEnergies (unaudited) 3. Reconciliation of capital employed (balance sheet) and calculation of ROACE (In millions of dollars) Exploration & Production Integrated LNG Integrated Power Refining & Chemicals Marketing & Services Corporate InterCompa ny Company Adjusted net operating income 3 rd quarter 2025 2,169 852 571 687 380 (80) - 4,579 Adjusted net operating income 2 nd quarter 2025 1,974 1,041 574 389 412 (245) - 4,145 Adjusted net operating income 1 st quarter 2025 2,451 1,294 506 301 240 (131) - 4,661 Adjusted net operating income 4 th quarter 2024 2,305 1,432 575 318 362 (173) - 4,819 Adjusted net operating income ( a ) 8,899 4,619 2,226 1,695 1,394 (629) - 18,204 Balance sheet as of September 30, 2025 Property plant and equipment intangible assets net 87,453 29,195 15,681 12,725 7,111 797 - 152,962 Investments & loans in equity affiliates 4,498 16,983 10,257 4,137 1,093 - - 36,968 Other non-current assets 2,504 2,285 1,705 748 1,083 344 - 8,669 Inventories, net 1,674 1,076 596 10,196 3,516 - - 17,058 Accounts receivable, net 5,533 5,828 4,045 17,547 8,328 1,300 (22,846) 19,735 Other current assets 7,020 7,252 5,567 2,251 2,889 2,600 (5,746) 21,833 Accounts payable (6,668) (6,661) (6,309) (30,876) (9,472) (901) 22,825 (38,062) Other creditors and accrued liabilities (11,225) (7,587) (4,810) (5,175) (5,546) (6,690) 5,767 (35,266) Working capital (3,666) (92) (911) (6,057) (285) (3,691) - (14,702) Provisions and other non-current liabilities (25,136) (4,499) (1,388) (3,569) (1,227) 902 - (34,917) Assets and liabilities classified as held for sale - Capital employed 449 - 1,616 - - - - 2,065 Capital Employed (Balance sheet) 66,102 43,872 26,960 7,984 7,775 (1,648) - 151,045 Less inventory valuation effect - - - (861) (210) - - (1,071) Capital Employed at replacement cost ( b ) 66,102 43,872 26,960 7,123 7,565 (1,648) - 149,974 Balance sheet as of September 30, 2024 Property plant and equipment intangible assets net 83,224 25,426 15,517 12,365 6,808 676 - 144,016 Investments & loans in equity affiliates 3,850 15,609 9,341 4,117 1,046 - - 33,963 Other non-current assets 3,896 2,096 1,286 741 1,210 324 - 9,553 Inventories, net 1,444 1,595 617 11,277 3,599 - - 18,532 Accounts receivable, net 5,801 6,146 4,270 16,506 8,770 1,067 (23,783) 18,777 Other current assets 7,363 7,814 4,788 2,415 3,154 2,357 (5,958) 21,933 Accounts payable (7,035) (6,771) (5,459) (28,346) (9,809) (994) 23,746 (34,668) Other creditors and accrued liabilities (9,658) (8,693) (4,542) (5,596) (6,015) (6,207) 5,995 (34,716) Working capital (2,085) 91 (326) (3,744) (301) (3,777) - (10,142) Provisions and other non-current liabilities (24,510) (3,762) (1,801) (3,415) (1,233) 791 - (33,930) Assets and liabilities classified as held for sale - Capital employed 484 - 572 - - - - 1,056 Capital Employed (Balance sheet) 64,859 39,460 24,589 10,064 7,530 (1,986) - 144,516 Less inventory valuation effect - - - (1,014) (205) - - (1,219) Capital Employed at replacement cost ( c ) 64,859 39,460 24,589 9,050 7,325 (1,986) - 143,297 ROACE as a percentage ( a / average ( b + c )) 13.6% 11.1% 8.6% 21.0% 18.7% 12.4% 47 |
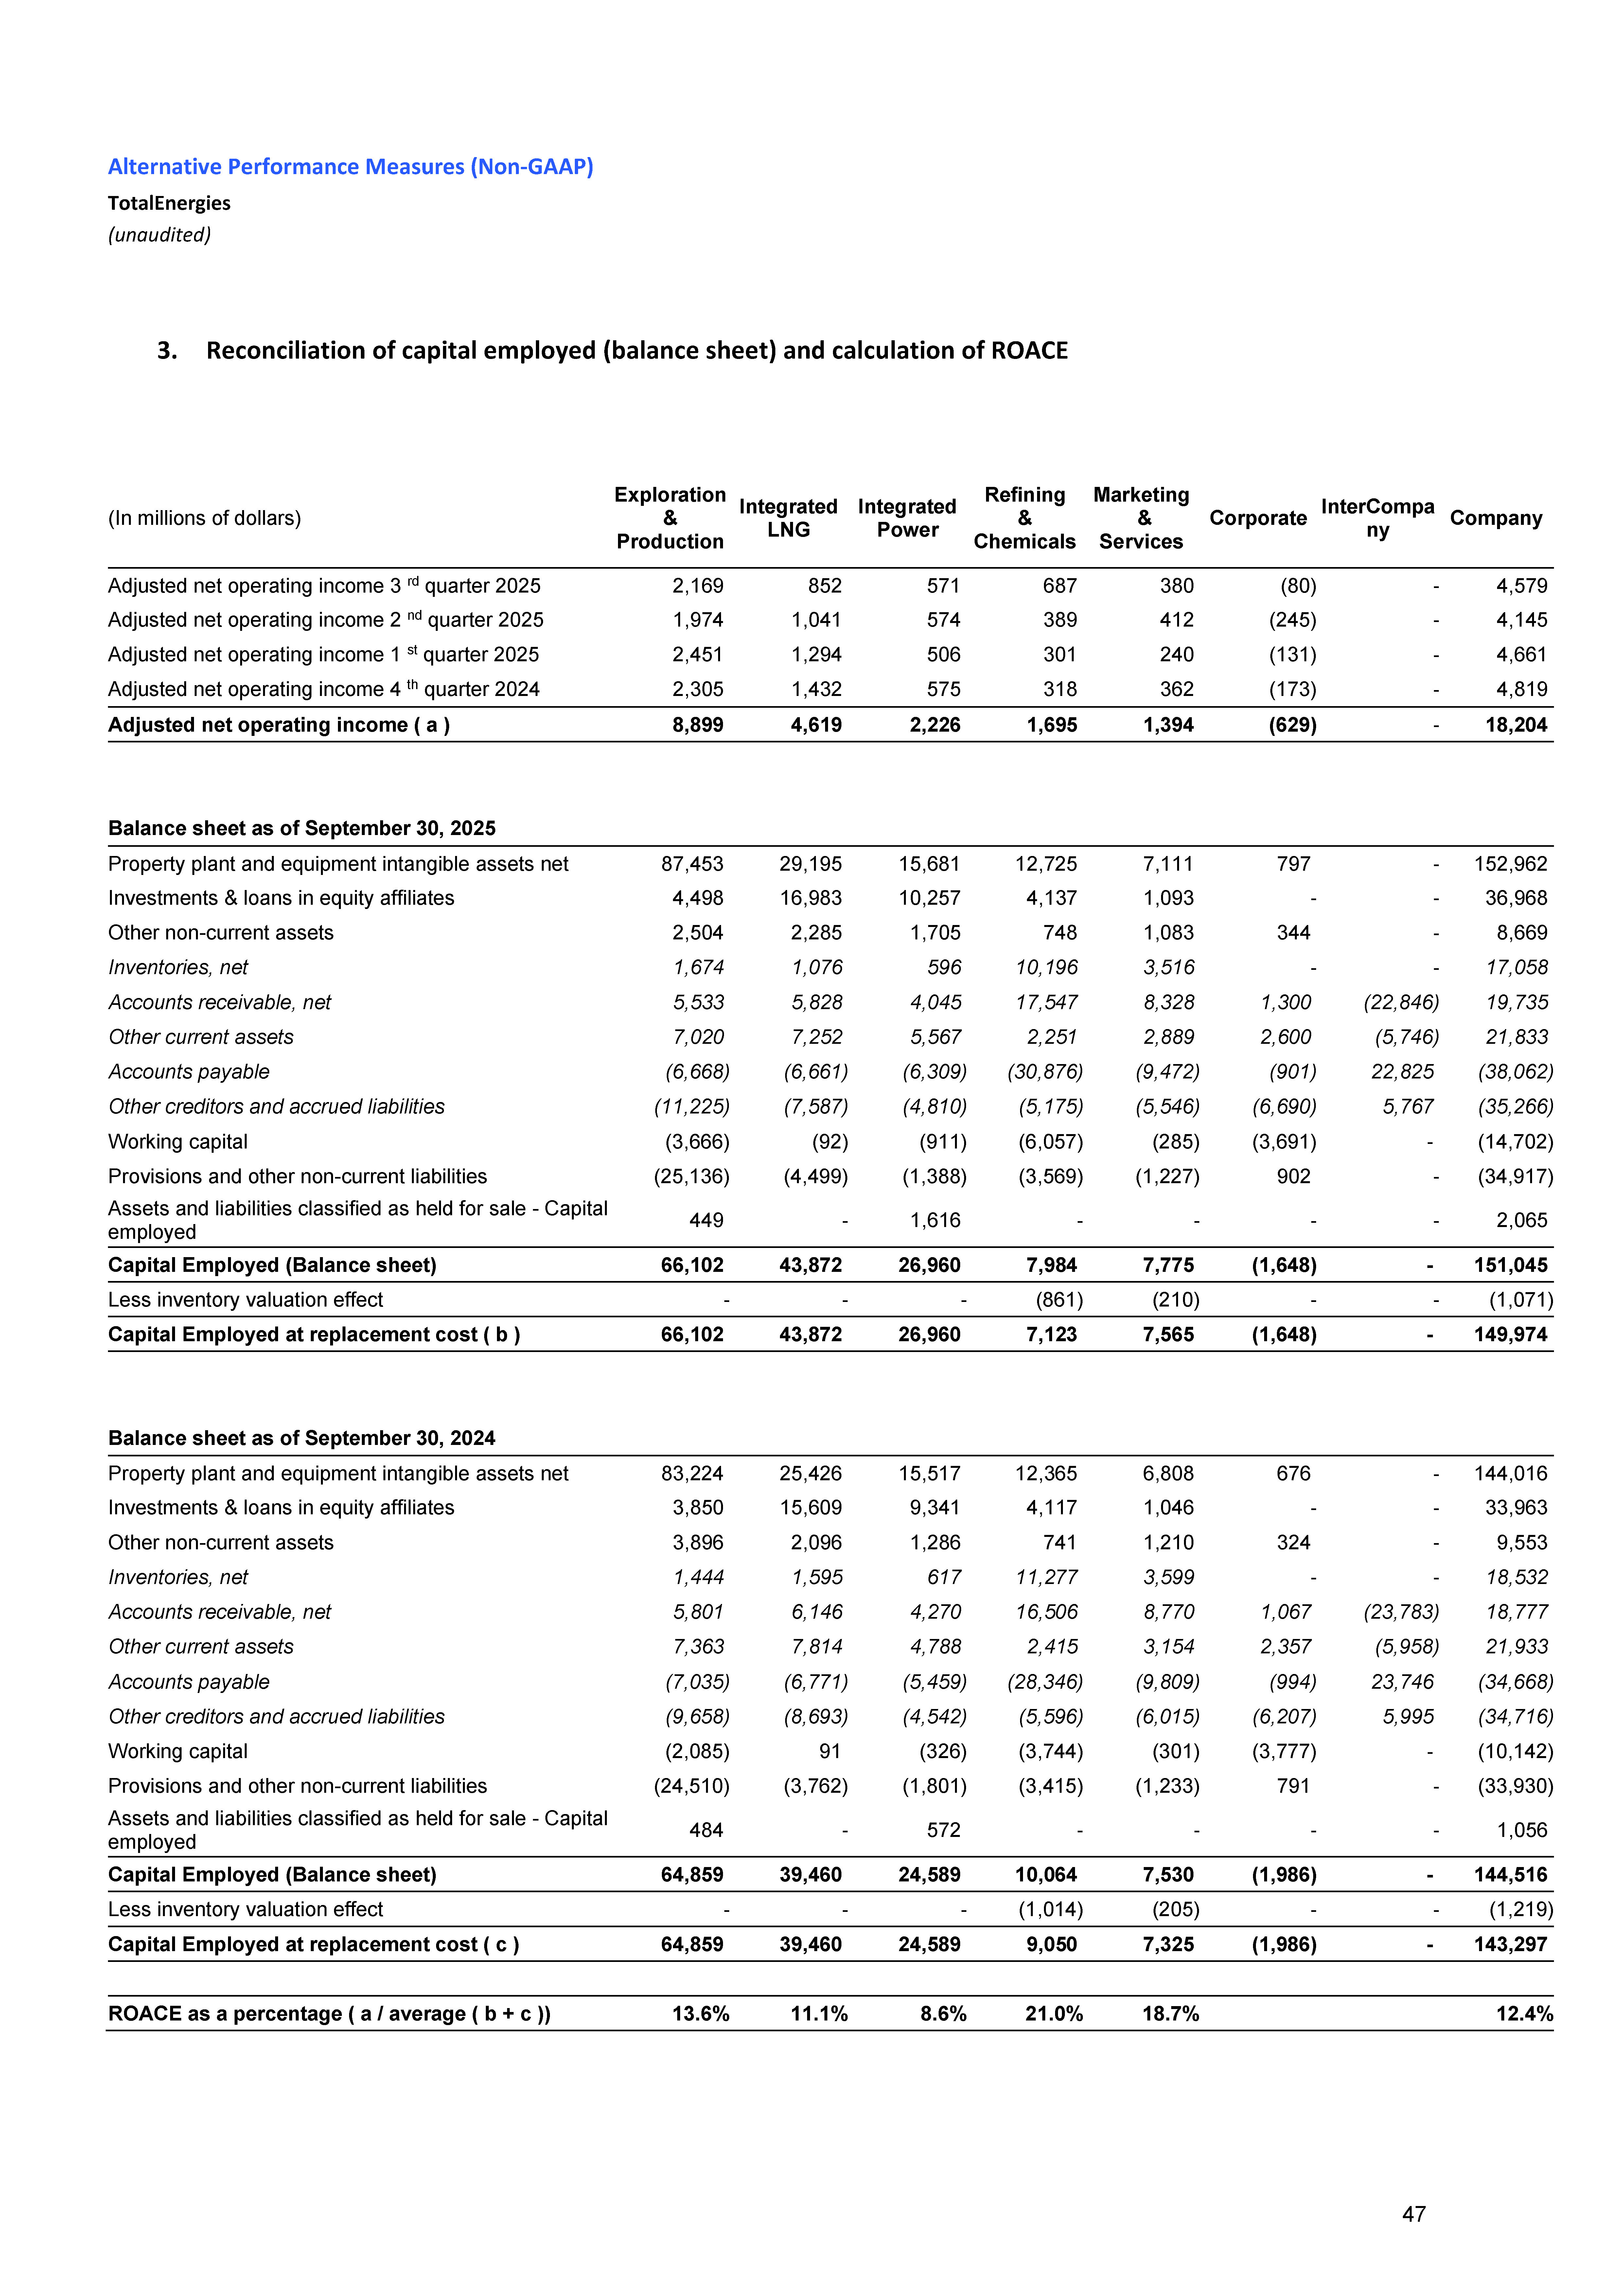
| Alternative Performance Measures (Non-GAAP) TotalEnergies (unaudited) 4. Reconciliation of consolidated net income to adjusted net operating income (in millions of dollars) 3 rd quarter 2 nd quarter 3 rd quarter 9 months 9 months 2025 2025 2024 2025 2024 Consolidated net income ( a ) 3,762 2,746 2,361 10,429 12,012 Net cost of net debt ( b ) (499) (486) (379) (1,370) (1,029) Special items affecting net operating income (113) (361) (1,360) (596) (824) Gains (losses) on disposals of assets 284 - - 284 1,397 Restructuring charges (7) - (10) (7) (21) Asset impairment and provisions charges (286) (209) (1,107) (495) (1,751) Other items (104) (152) (243) (378) (449) After-tax inventory effect : FIFO vs. replacement cost (33) (269) (375) (380) (595) Effect of changes in fair value (172) (283) (84) (610) (695) Total adjustments affecting net operating income ( c ) (318) (913) (1,819) (1,586) (2,114) Adjusted net operating income ( a - b - c ) 4,579 4,145 4,559 13,385 15,155 48 |