| November 3, 2025 Business Combination with Husky Technologies |
| Disclaimer 2 Forward-Looking Statements This presentation includes “forward looking statements.” Forward-looking statements may be identified by the use of words such as "forecast," "intend," "seek," "target," “anticipate,” “believe,” “expect,” “estimate,” “plan,” “outlook,” “pro forma” and “project,” years to which the suffix “E” is appended, and other similar expressions that predict or indicate future events or trends or that are not statements of historical matters. Such forward looking statements include projected financial information. Such forward looking statements with respect to revenues, earnings, performance, strategies, synergies, prospects and other aspects of the businesses of CompoSecure, Inc. (together with its subsidiaries, “CompoSecure”), Husky Technologies Limited (“Husky”) or the combined company after completion of the proposed combination described herein (the “Combination”), including anticipated financial results, expectations regarding the benefits of the Combination, future opportunities, demand and other market conditions, competitiveness, are based on current expectations that are subject to risks and uncertainties. A number of factors could cause actual results or outcomes to differ materially from those indicated by such forward looking statements. These factors include, but are not limited to: (1) the inability to complete the transactions contemplated herein, including the Combination, on favorable terms or at all; (2) the inability to recognize the anticipated benefits of the proposed transactions, including the Combination, which may be affected by, among other things, competition, and the ability of the post-transaction business to grow and manage growth profitably; (3) costs related to the proposed transactions, including the Combination; (4) changes in applicable laws or regulations; (5) risks relating to the respective businesses of CompoSecure and Husky; (6) the possibility that CompoSecure and/or Husky may be adversely affected by other economic, business, and/or competitive factors; and (7) other risks and uncertainties indicated from time to time in documents filed or to be filed with the SEC by CompoSecure. You are cautioned not to place undue reliance upon any forward-looking statements, including the projections, which speak only as of the date made. CompoSecure does not undertake any commitment to update or revise the forward-looking statements, whether as a result of new information, future events or otherwise. Industry and Market Data In this presentation, CompoSecure relies on and refers to information and statistics regarding market shares in the sectors in which CompoSecure and/or Husky compete and other industry data. CompoSecure obtained such information and statistics from third-party sources, including reports by market research firms. CompoSecure has supplemented this information where necessary with information from discussions with its and CompoSecure’s own internal estimates, taking into account publicly available information about other industry participants and CompoSecure’s management’s best view as to information that is not publicly available. Use of Non-GAAP Financial Measures Some of the financial information and data contained in this presentation, such as Pro Forma Adjusted Revenue, Adjusted EBITDA, Annual EBITDA Growth, Adjusted EBITDA Margin, Pro Forma Net Adjusted EBITDA, Pro Forma Cash Conversion, Pro Forma Net Adjusted EBITDA Less Capex, Net Adjusted EBITDA, Net Adjusted EBITDA Margin, Organic Growth, Gross Margin, Free Cash Flow Yield, Free Cash Flow Conversion, Pro Forma Adjusted Revenue, Pro Forma Net Adjusted EBITDA, Pro Forma Cash Conversion and Pro Forma Net Adjusted EBITDA Less Capex, have not been prepared in accordance with GAAP. Management believes that these non-GAAP measures of financial results provide useful information to management and investors regarding certain financial and business trends relating to CompoSecure’s financial condition and results of operations. CompoSecure’s management uses these non-GAAP measures to compare CompoSecure’s performance to that of prior periods for trend analyses, and for budgeting, planning and other purposes. CompoSecure believes that the use of these non-GAAP financial measures provides an additional tool for investors to use in evaluating ongoing operating results and trends. Management does not consider these non-GAAP measures in isolation or as an alternative to financial measures determined in accordance with GAAP. Other companies may calculate non-GAAP measures differently, and therefore the non-GAAP measures of CompoSecure included in this presentation may not be directly comparable to similarly titled measures of other companies. When CompoSecure provides our expectations for Annual EBITDA Growth, Adjusted EBITDA Margin, Net Adjusted EBITDA, Net Adjusted EBITDA Margin, Organic Growth, Gross Margin, Free Cash Flow Yield, Free Cash Flow Conversion, Pro Forma Adjusted Revenue, Pro Forma Net Adjusted EBITDA, Pro Forma Cash Conversion and Pro Forma Net Adjusted EBITDA Less Capex of CompoSecure and Husky on a forward-looking basis, a reconciliation of the differences between the non-GAAP expectations and the corresponding GAAP measures generally is not available without unreasonable effort due to potentially high variability, complexity and low visibility as to the items that would be excluded from the GAAP measure in the relevant future period, such as unusual gains and losses, fluctuations in foreign currency exchange rates, the impact and timing of potential acquisitions and divestitures, future restructuring costs, and other structural changes or their probable significance. The variability of the excluded items may have a significant, and potentially unpredictable, impact on our future GAAP results. No Offer or Solicitation This presentation is for informational purposes only and does not constitute an offer to sell or purchase, or a solicitation of an offer to sell, buy or subscribe for, any securities in any jurisdiction, or a solicitation of any proxy, vote, consent or approval relating to the transactions described herein or otherwise in any jurisdiction, nor shall there be any sale of securities in any jurisdiction in which the offer, solicitation or sale would be unlawful prior to the registration or qualification under the securities laws of any such jurisdictions. This presentation is restricted by law; it is not intended for distribution to, or use by any person in, any jurisdiction where such distribution or use would be contrary to local law or regulation. NEITHER THE SEC NOR ANY OTHER SECURITIES COMMISSION OR SIMILAR REGULATORY AUTHORITY, IN THE UNITED STATES OR ELSEWHERE, HAS REVIEWED, APPROVED OR DISAPPROVED OF THE SECURITIES OF COMPOSECURE OR THIS PRESENTATION OR DETERMINED IF THIS PRESENTATION IS TRUTHFUL OR COMPLETE, AND ANY REPRESENTATION TO THE CONTRARY IS A CRIMINAL OFFENSE. Use of Projections This presentation contains financial forecasts, including with respect to projected Revenue, Net Adjusted EBITDA, Adjusted EBITDA Growth, Net Adjusted EBITDA Margin, EBITDA less Capital Expenditures, Annual Margin Expansion Opportunity, Free Cash Flow Yield, Free Cash Flow Conversion, Organic Growth, Recurring Revenue Mix, Stock Compensation Expense, Pro Forma Adjusted Revenue, Pro Forma Net Adjusted EBITDA, Pro Forma Cash Conversion, Pro Forma Net Adjusted EBITDA Less Capex, Net Debt/Net Adjusted LTM EBITDA, sources and uses, capitalization and ownership giving effect to the consummation of the proposed transactions described herein, including the Combination. The independent registered public accounting firms of CompoSecure and Husky have not audited, reviewed, compiled, or performed any procedures with respect to the projections for the purpose of their inclusion in this presentation, and accordingly, neither of them expressed an opinion or provided any other form of assurance with respect thereto for the purpose of this presentation. These projections should not be relied upon as being necessarily indicative of future results. CompoSecure does not undertake any commitment to update or revise the projections, whether as a result of new information, future events or otherwise. In this presentation, certain of the above-mentioned projected information has been repeated (in each case, with an indication that the information is an estimate and is subject to the qualifications presented herein), for purposes of providing comparisons with historical data. The assumptions and estimates underlying the prospective financial information are inherently uncertain and are subject to a wide variety of significant business, economic and competitive risks and uncertainties that could cause actual results to differ materially from those contained in the prospective financial information. Accordingly, there can be no assurance that the prospective results are indicative of the future performance of CompoSecure or that actual results will not differ materially from those presented in the prospective financial information. Inclusion of the prospective financial information in this presentation should not be regarded as a representation by any person that the results contained in the prospective financial information will be achieved. |
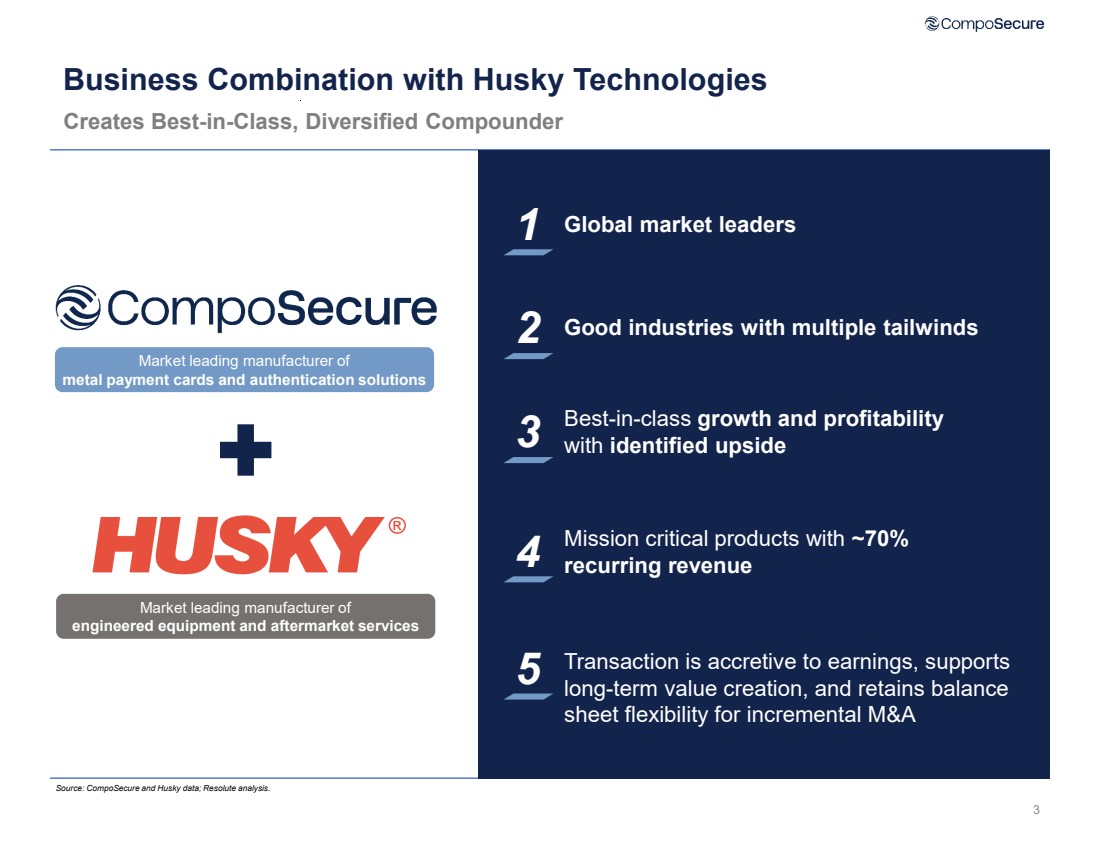
| 3 Business Combination with Husky Technologies Creates Best-in-Class, Diversified Compounder 1 Global market leaders 2 Good industries with multiple tailwinds 3 Best-in-class growth and profitability with identified upside 4 Mission critical products with ~70% recurring revenue 5 Transaction is accretive to earnings, supports long-term value creation, and retains balance sheet flexibility for incremental M&A Market leading manufacturer of metal payment cards and authentication solutions Market leading manufacturer of engineered equipment and aftermarket services Source: CompoSecure and Husky data; Resolute analysis. |
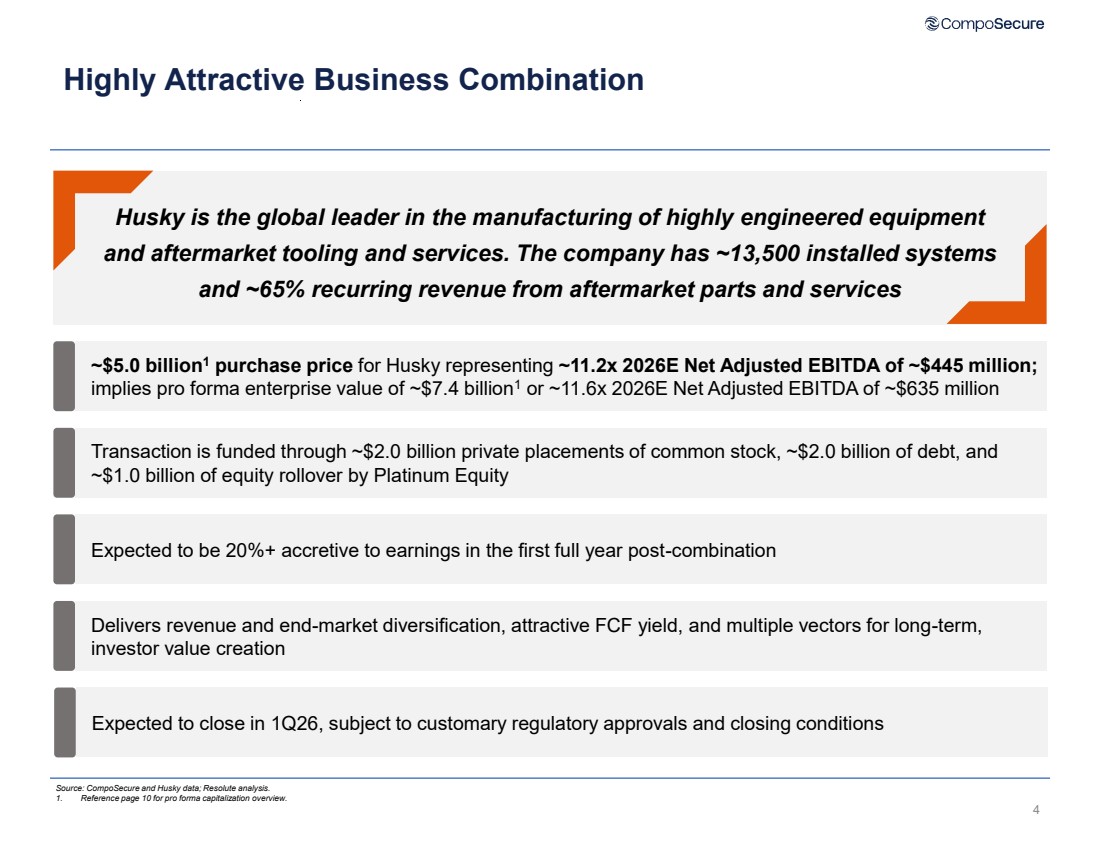
| Highly Attractive Business Combination 4 ~$5.0 billion1 purchase price for Husky representing ~11.2x 2026E Net Adjusted EBITDA of ~$445 million; implies pro forma enterprise value of ~$7.4 billion1 or ~11.6x 2026E Net Adjusted EBITDA of ~$635 million Transaction is funded through ~$2.0 billion private placements of common stock, ~$2.0 billion of debt, and ~$1.0 billion of equity rollover by Platinum Equity Expected to be 20%+ accretive to earnings in the first full year post-combination Delivers revenue and end-market diversification, attractive FCF yield, and multiple vectors for long-term, investor value creation Husky is the global leader in the manufacturing of highly engineered equipment and aftermarket tooling and services. The company has ~13,500 installed systems and ~65% recurring revenue from aftermarket parts and services Expected to close in 1Q26, subject to customary regulatory approvals and closing conditions Source: CompoSecure and Husky data; Resolute analysis. 1. Reference page 10 for pro forma capitalization overview. |
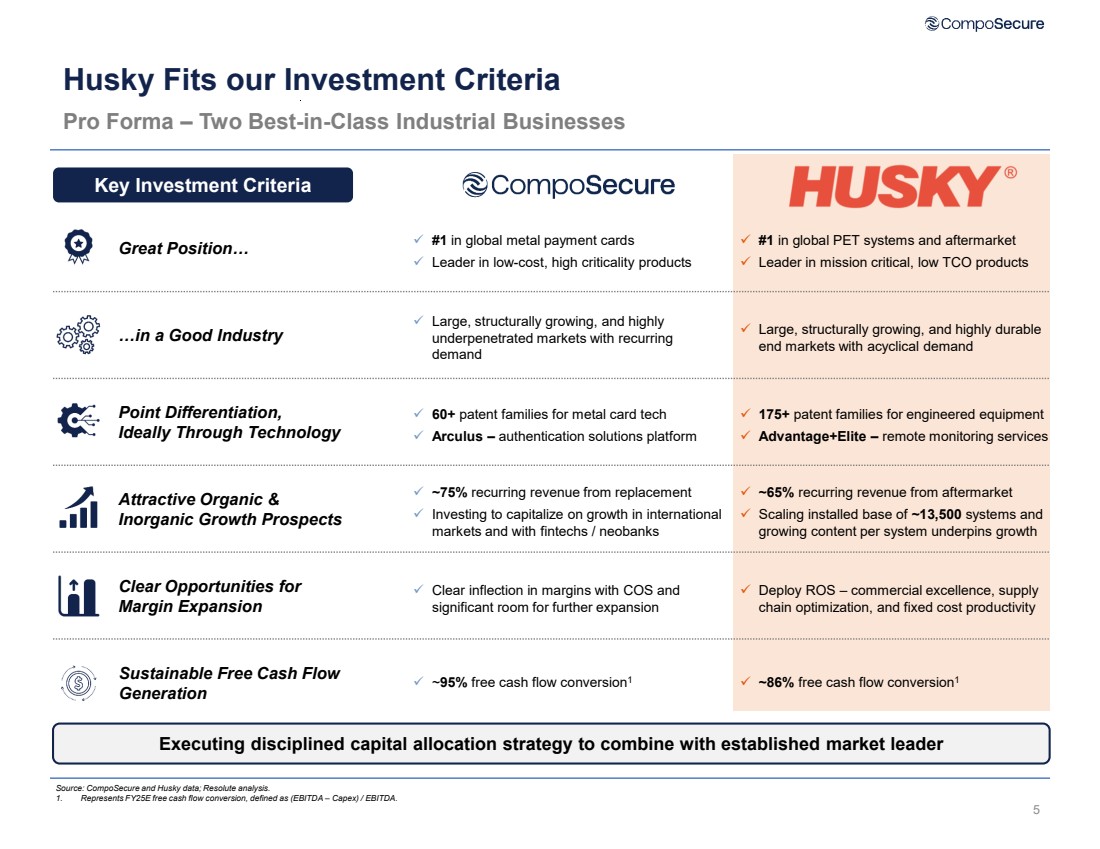
| 5 Husky Fits our Investment Criteria Pro Forma – Two Best-in-Class Industrial Businesses Key Investment Criteria Executing disciplined capital allocation strategy to combine with established market leader #1 in global PET systems and aftermarket Leader in mission critical, low TCO products #1 in global metal payment cards Leader in low-cost, high criticality products Great Position… Point Differentiation, Ideally Through Technology 175+ patent families for engineered equipment Advantage+Elite – remote monitoring services 60+ patent families for metal card tech Arculus – authentication solutions platform Attractive Organic & Inorganic Growth Prospects ~65% recurring revenue from aftermarket Scaling installed base of ~13,500 systems and growing content per system underpins growth ~75% recurring revenue from replacement Investing to capitalize on growth in international markets and with fintechs / neobanks Clear Opportunities for Margin Expansion Deploy ROS – commercial excellence, supply chain optimization, and fixed cost productivity Clear inflection in margins with COS and significant room for further expansion Sustainable Free Cash Flow Generation ~86% free cash flow conversion 1 ~95% free cash flow conversion1 …in a Good Industry Large, structurally growing, and highly durable end markets with acyclical demand Large, structurally growing, and highly underpenetrated markets with recurring demand Source: CompoSecure and Husky data; Resolute analysis. 1. Represents FY25E free cash flow conversion, defined as (EBITDA – Capex) / EBITDA. |
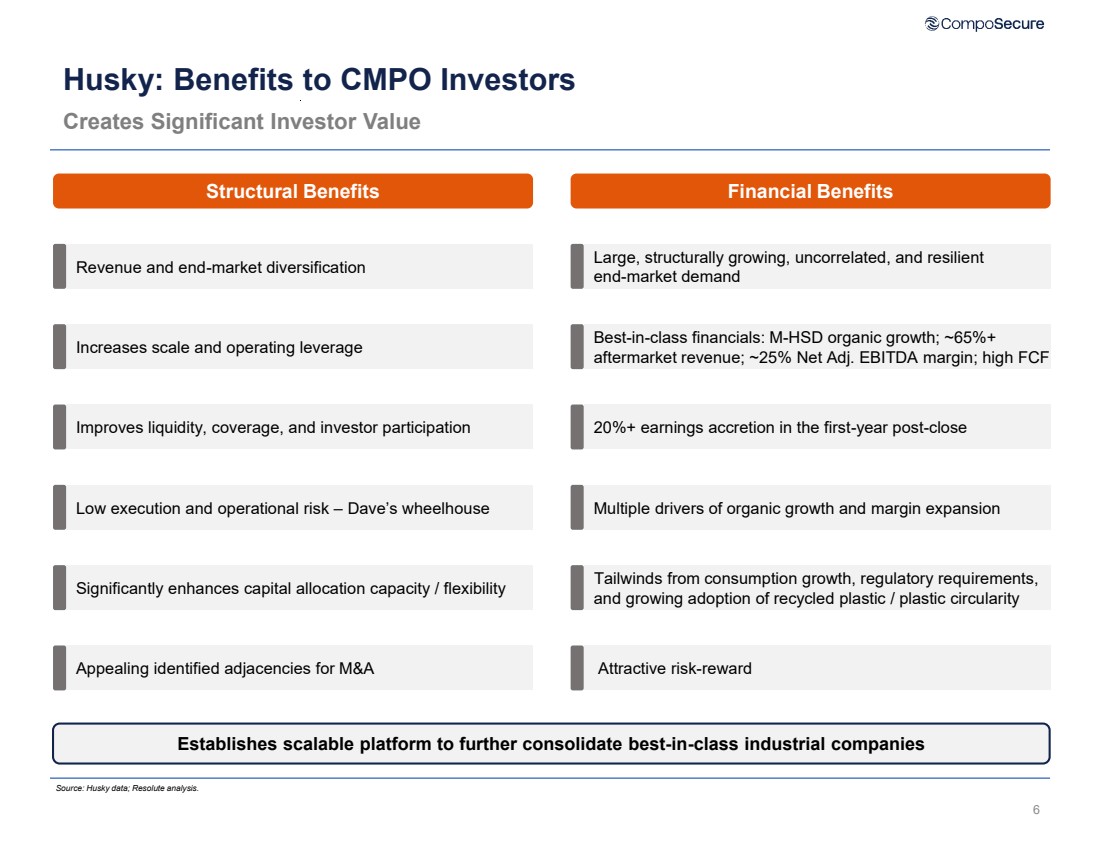
| 6 Husky: Benefits to CMPO Investors Creates Significant Investor Value Structural Benefits Financial Benefits Large, structurally growing, uncorrelated, and resilient end-market demand Best-in-class financials: M-HSD organic growth; ~65%+ aftermarket revenue; ~25% Net Adj. EBITDA margin; high FCF 20%+ earnings accretion in the first-year post-close Multiple drivers of organic growth and margin expansion Revenue and end-market diversification Increases scale and operating leverage Improves liquidity, coverage, and investor participation Low execution and operational risk – Dave’s wheelhouse Tailwinds from consumption growth, regulatory requirements, and growing adoption of recycled plastic / plastic circularity Significantly enhances capital allocation capacity / flexibility Appealing identified adjacencies for M&A Attractive risk-reward Establishes scalable platform to further consolidate best-in-class industrial companies Source: Husky data; Resolute analysis. |
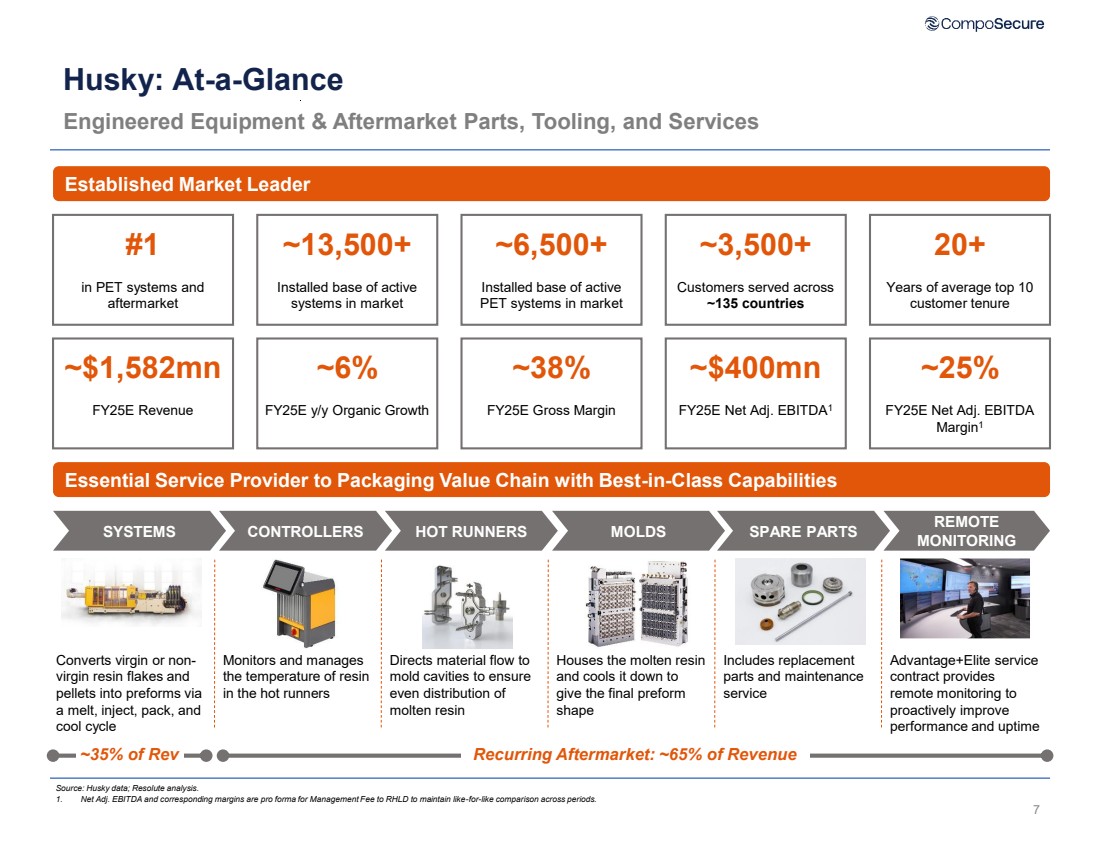
| 7 Husky: At-a-Glance Engineered Equipment & Aftermarket Parts, Tooling, and Services Established Market Leader Essential Service Provider to Packaging Value Chain with Best-in-Class Capabilities SYSTEMS CONTROLLERS HOT RUNNERS MOLDS SPARE PARTS Converts virgin or non-virgin resin flakes and pellets into preforms via a melt, inject, pack, and cool cycle Monitors and manages the temperature of resin in the hot runners Directs material flow to mold cavities to ensure even distribution of molten resin Houses the molten resin and cools it down to give the final preform shape Includes replacement parts and maintenance service REMOTE MONITORING Advantage+Elite service contract provides remote monitoring to proactively improve performance and uptime ~35% of Rev Recurring Aftermarket: ~65% of Revenue Source: Husky data; Resolute analysis. 1. Net Adj. EBITDA and corresponding margins are pro forma for Management Fee to RHLD to maintain like-for-like comparison across periods. #1 in PET systems and aftermarket ~13,500+ Installed base of active systems in market ~6,500+ Installed base of active PET systems in market ~3,500+ Customers served across ~135 countries 20+ Years of average top 10 customer tenure ~$1,582mn FY25E Revenue ~6% FY25E y/y Organic Growth ~38% FY25E Gross Margin ~$400mn FY25E Net Adj. EBITDA1 ~25% FY25E Net Adj. EBITDA Margin1 |
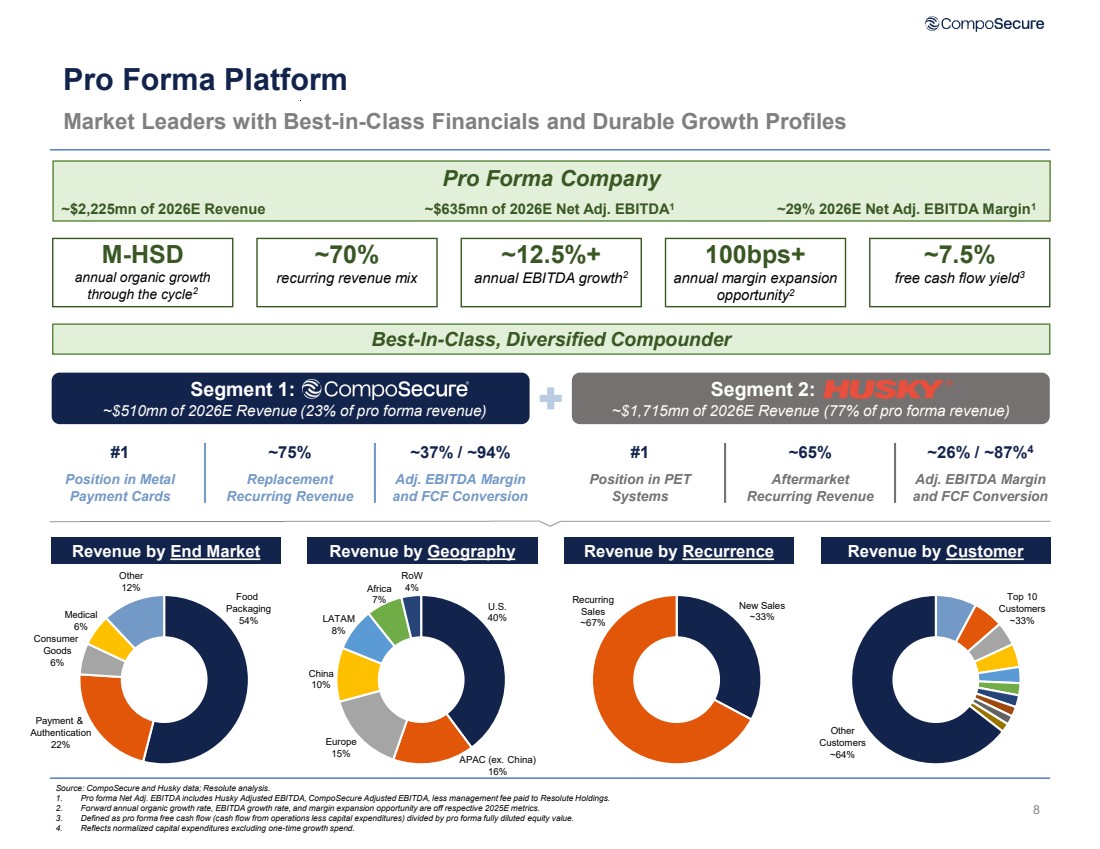
| 8 Pro Forma Platform Market Leaders with Best-in-Class Financials and Durable Growth Profiles Source: CompoSecure and Husky data; Resolute analysis. 1. Pro forma Net Adj. EBITDA includes Husky Adjusted EBITDA, CompoSecure Adjusted EBITDA, less management fee paid to Resolute Holdings. 2. Forward annual organic growth rate, EBITDA growth rate, and margin expansion opportunity are off respective 2025E metrics. 3. Defined as pro forma free cash flow (cash flow from operations less capital expenditures) divided by pro forma fully diluted equity value. 4. Reflects normalized capital expenditures excluding one-time growth spend. Segment 1: ~$510mn of 2026E Revenue (23% of pro forma revenue) Segment 2: ~$1,715mn of 2026E Revenue (77% of pro forma revenue) M-HSD annual organic growth through the cycle2 ~12.5%+ annual EBITDA growth2 100bps+ annual margin expansion opportunity2 ~70% recurring revenue mix ~7.5% free cash flow yield3 #1 Position in Metal Payment Cards ~75% Replacement Recurring Revenue ~37% / ~94% Adj. EBITDA Margin and FCF Conversion #1 Position in PET Systems ~65% Aftermarket Recurring Revenue ~26% / ~87%4 Adj. EBITDA Margin and FCF Conversion Revenue by End Market Top 10 Customers ~33% Other Customers ~64% Food Packaging 54% Payment & Authentication 22% Consumer Goods 6% Medical 6% Other 12% New Sales ~33% Recurring Sales ~67% Revenue by Geography Revenue by Recurrence Revenue by Customer U.S. 40% Europe 15% China 10% LATAM 8% Africa 7% RoW 4% Best-In-Class, Diversified Compounder Pro Forma Company ~$2,225mn of 2026E Revenue ~$635mn of 2026E Net Adj. EBITDA1 ~29% 2026E Net Adj. EBITDA Margin1 APAC (ex. China) 16% |
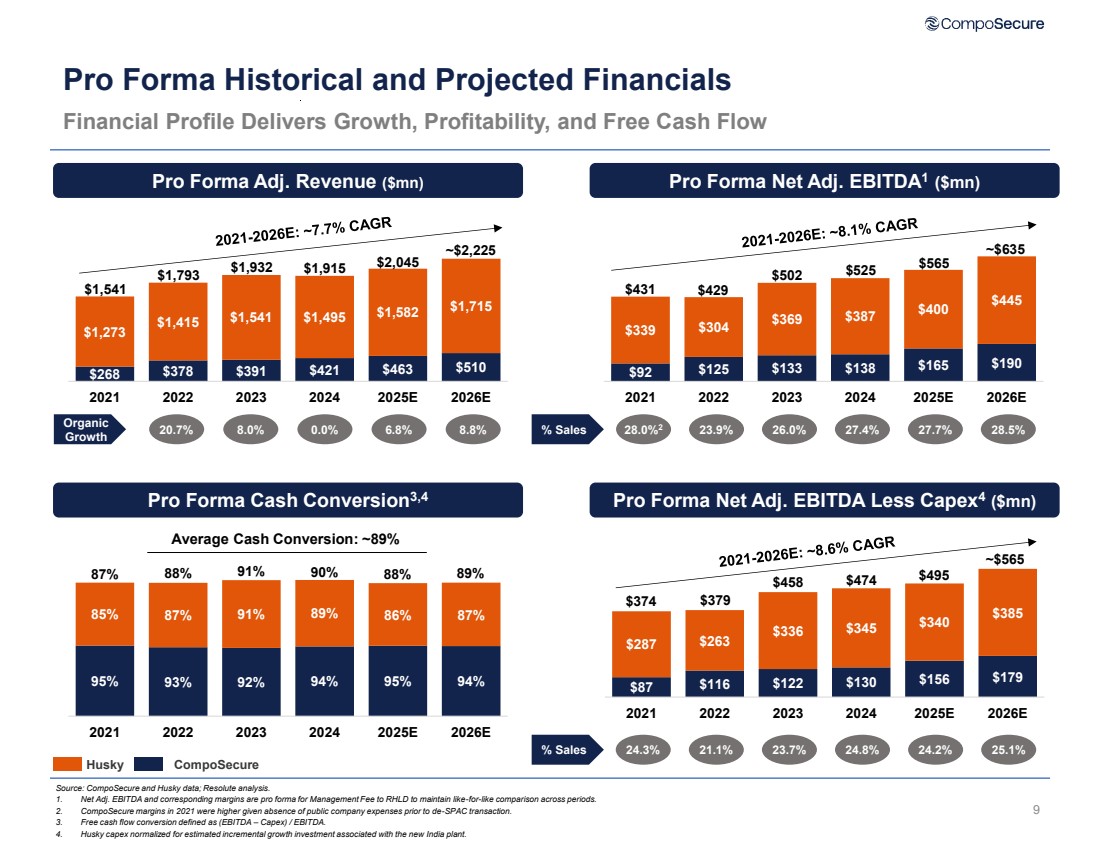
| 9 Pro Forma Historical and Projected Financials Source: CompoSecure and Husky data; Resolute analysis. 1. Net Adj. EBITDA and corresponding margins are pro forma for Management Fee to RHLD to maintain like-for-like comparison across periods. 2. CompoSecure margins in 2021 were higher given absence of public company expenses prior to de-SPAC transaction. 3. Free cash flow conversion defined as (EBITDA – Capex) / EBITDA. 4. Husky capex normalized for estimated incremental growth investment associated with the new India plant. Financial Profile Delivers Growth, Profitability, and Free Cash Flow Pro Forma Adj. Revenue ($mn) Pro Forma Net Adj. EBITDA1 ($mn) Pro Forma Cash Conversion3,4 Pro Forma Net Adj. EBITDA Less Capex4 ($mn) % Sales 28.0%2 8.0% 0.0% 6.8% 8.8% 23.9% 26.0% 27.4% 27.7% 28.5% Organic Growth $268 $378 $391 $421 $463 $510 $1,273 $1,415 $1,541 $1,495 $1,582 $1,715 2021 2022 2023 2024 2025E 2026E ~$2,225 $2,045 $1,932 $1,915 $1,793 $1,541 20.7% $92 $125 $133 $138 $165 $190 $339 $304 $369 $387 $400 $445 2021 2022 2023 2024 2025E 2026E ~$635 $565 $525 $502 $431 $429 95% 93% 92% 94% 95% 94% 85% 87% 91% 89% 86% 87% 2021 2022 2023 2024 2025E 2026E Average Cash Conversion: ~89% Husky CompoSecure 87% 88% 91% 90% 88% 89% % Sales $87 $116 $122 $130 $156 $179 $287 $263 $336 $345 $340 $385 2021 2022 2023 2024 2025E 2026E 24.3% 21.1% 23.7% 24.8% 24.2% 25.1% ~$565 $495 $458 $474 $374 $379 |
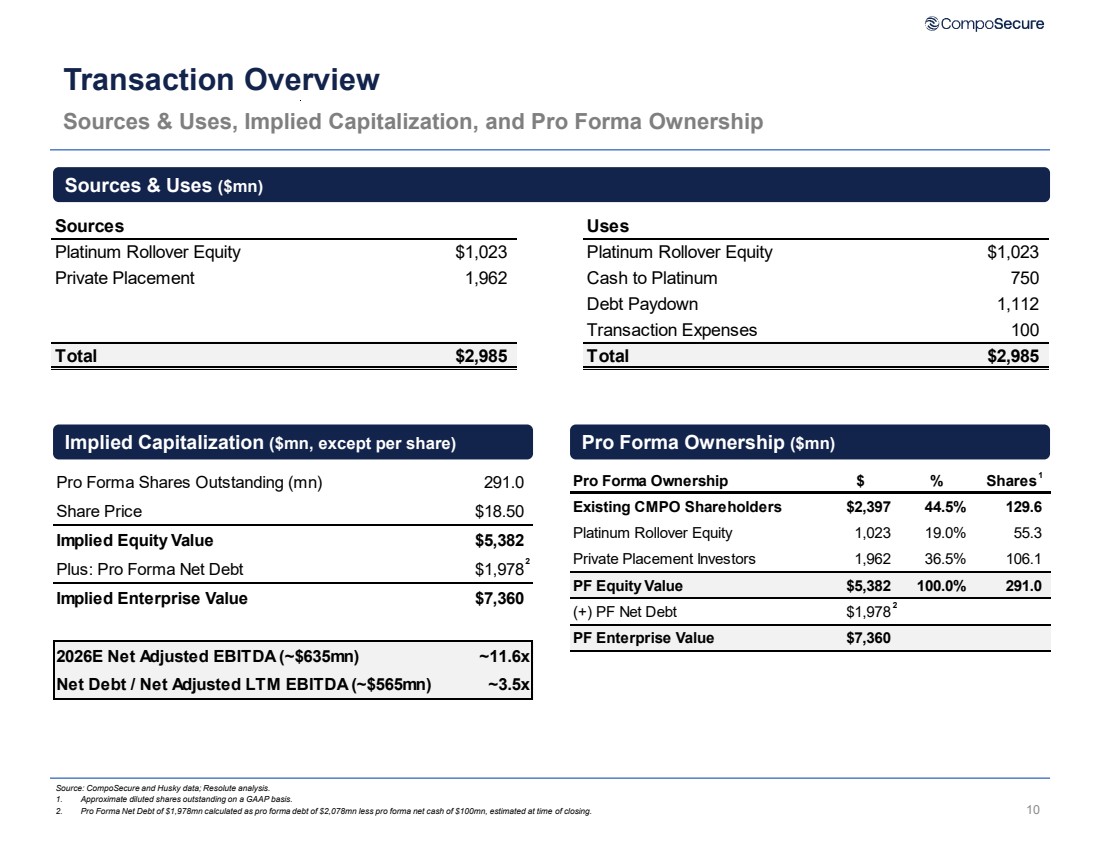
| 10 Transaction Overview Sources & Uses, Implied Capitalization, and Pro Forma Ownership Source: CompoSecure and Husky data; Resolute analysis. 1. Approximate diluted shares outstanding on a GAAP basis. 2. Pro Forma Net Debt of $1,978mn calculated as pro forma debt of $2,078mn less pro forma net cash of $100mn, estimated at time of closing. Sources & Uses ($mn) Implied Capitalization ($mn, except per share) Pro Forma Ownership ($mn) 2 1 2 Sources Uses Platinum Rollover Equity $1,023 Platinum Rollover Equity $1,023 Private Placement 1,962 Cash to Platinum 750 Debt Paydown 1,112 Transaction Expenses 100 Total $2,985 Total $2,985 Pro Forma Shares Outstanding (mn) 291.0 Share Price $18.50 Implied Equity Value $5,382 Plus: Pro Forma Net Debt $1,978 Implied Enterprise Value $7,360 2026E Net Adjusted EBITDA (~$635mn) ~11.6x Net Debt / Net Adjusted LTM EBITDA (~$565mn) ~3.5x Pro Forma Ownership $ % Shares Existing CMPO Shareholders $2,397 44.5% 129.6 Platinum Rollover Equity 1,023 19.0% 55.3 Private Placement Investors 1,962 36.5% 106.1 PF Equity Value $5,382 100.0% 291.0 (+) PF Net Debt $1,978 PF Enterprise Value $7,360 |
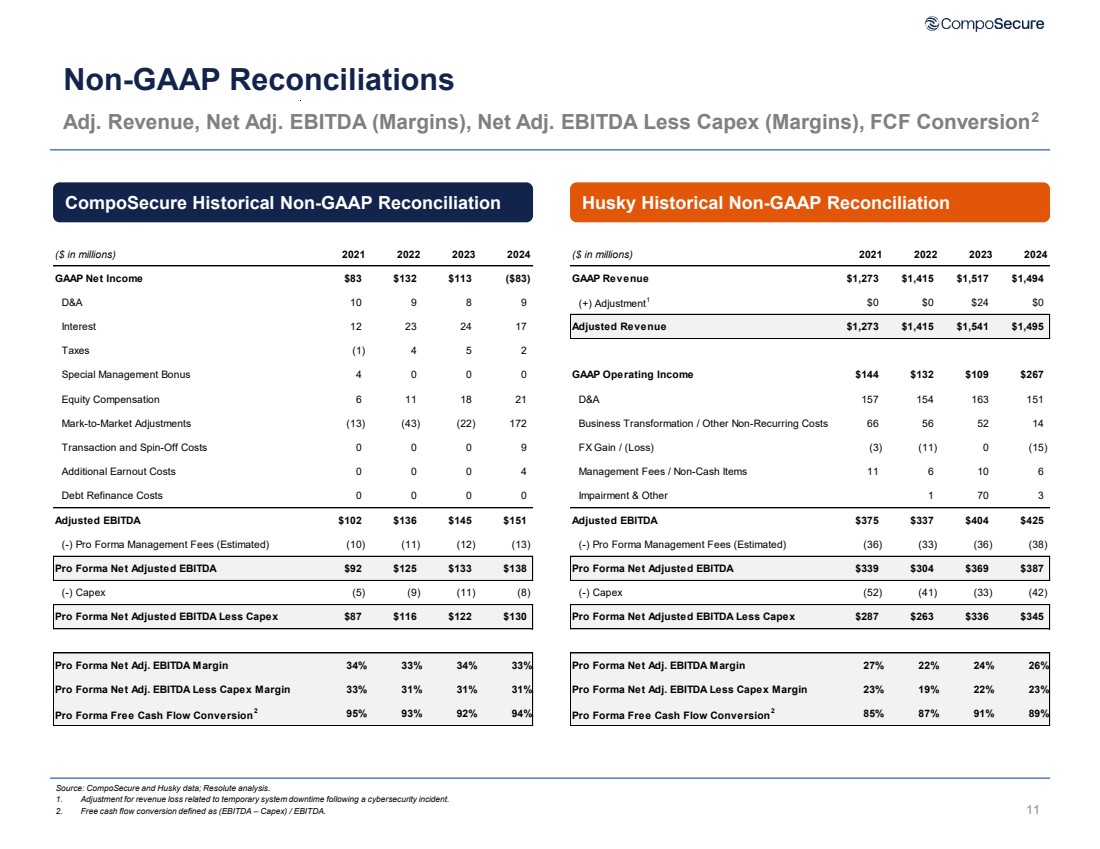
| 11 Non-GAAP Reconciliations Adj. Revenue, Net Adj. EBITDA (Margins), Net Adj. EBITDA Less Capex (Margins), FCF Conversion2 Source: CompoSecure and Husky data; Resolute analysis. 1. Adjustment for revenue loss related to temporary system downtime following a cybersecurity incident. 2. Free cash flow conversion defined as (EBITDA – Capex) / EBITDA. CompoSecure Historical Non-GAAP Reconciliation Husky Historical Non-GAAP Reconciliation ($ in millions) 2021 2022 2023 2024 GAAP Revenue $1,273 $1,415 $1,517 $1,494 (+) Adjustment1 $0 $0 $24 $0 Adjusted Revenue $1,273 $1,415 $1,541 $1,495 GAAP Operating Income $144 $132 $109 $267 D&A 157 154 163 151 Business Transformation / Other Non-Recurring Costs 66 56 52 14 FX Gain / (Loss) (3) (11) 0 (15) Management Fees / Non-Cash Items 11 6 10 6 Impairment & Other 1 70 3 Adjusted EBITDA $375 $337 $404 $425 (-) Pro Forma Management Fees (Estimated) (36) (33) (36) (38) Pro Forma Net Adjusted EBITDA $339 $304 $369 $387 (-) Capex (52) (41) (33) (42) Pro Forma Net Adjusted EBITDA Less Capex $287 $263 $336 $345 Pro Forma Net Adj. EBITDA Margin 27% 22% 24% 26% Pro Forma Net Adj. EBITDA Less Capex Margin 23% 19% 22% 23% Pro Forma Free Cash Flow Conversion2 85% 87% 91% 89% ($ in millions) 2021 2022 2023 2024 GAAP Net Income $83 $132 $113 ($83) D&A 10 9 8 9 Interest 12 23 24 17 Taxes (1) 4 5 2 Special Management Bonus 4 0 0 0 Equity Compensation 6 11 18 21 Mark-to-Market Adjustments (13) (43) (22) 172 Transaction and Spin-Off Costs 0 0 0 9 Additional Earnout Costs 0 0 0 4 Debt Refinance Costs 0 0 0 0 Adjusted EBITDA $102 $136 $145 $151 (-) Pro Forma Management Fees (Estimated) (10) (11) (12) (13) Pro Forma Net Adjusted EBITDA $92 $125 $133 $138 (-) Capex (5) (9) (11) (8) Pro Forma Net Adjusted EBITDA Less Capex $87 $116 $122 $130 Pro Forma Net Adj. EBITDA Margin 34% 33% 34% 33% Pro Forma Net Adj. EBITDA Less Capex Margin 33% 31% 31% 31% Pro Forma Free Cash Flow Conversion2 95% 93% 92% 94% |