Shareholder Report
Aug. 31, 2025
USD ($)
$ / shares
WHAT WERE THE FUND COSTS FOR THE LAST YEAR? (based on a hypothetical $10,000 investment)
|
Fund Name
|
Costs of a $10,000 investment
|
Costs paid as a percentage of a $10,000 investment*
|
|
Franklin Templeton SMACS: Series E1
|
$0
|
0.00%
|
HOW DID THE FUND PERFORM LAST YEAR AND WHAT AFFECTED ITS PERFORMANCE?
For the twelve months ended August 31, 2025, Franklin Templeton SMACS: Series E returned 12.34%. The Fund compares its performance to the MSCI USA High Dividend Yield Index, which returned 6.68% for the same period.
PERFORMANCE HIGHLIGHTS
|
Top contributors to performance:
|
|
|
↑
|
Information technology (IT), industrials, and materials sectors led absolute returns during the period.
|
|
↑
|
Boeing and Broadcom added value within industrials and IT, respectively, while Philip Morris International contributed within consumer staples.
|
|
↑
|
Selection within the industrials and IT sectors assisted relative returns, as did an underweight allocation to consumer staples.
|
|
Top detractors from performance:
|
|
|
↓
|
The energy sector detracted from absolute returns.
|
|
↓
|
In terms of individual issuers, PepsiCo and Target hindered performance within consumer staples. UnitedHealth Group also detracted within health care.
|
|
↓
|
Relative returns were weakened by selection and underweight positioning within the financials and health care sectors, as well as selection within energy.
|
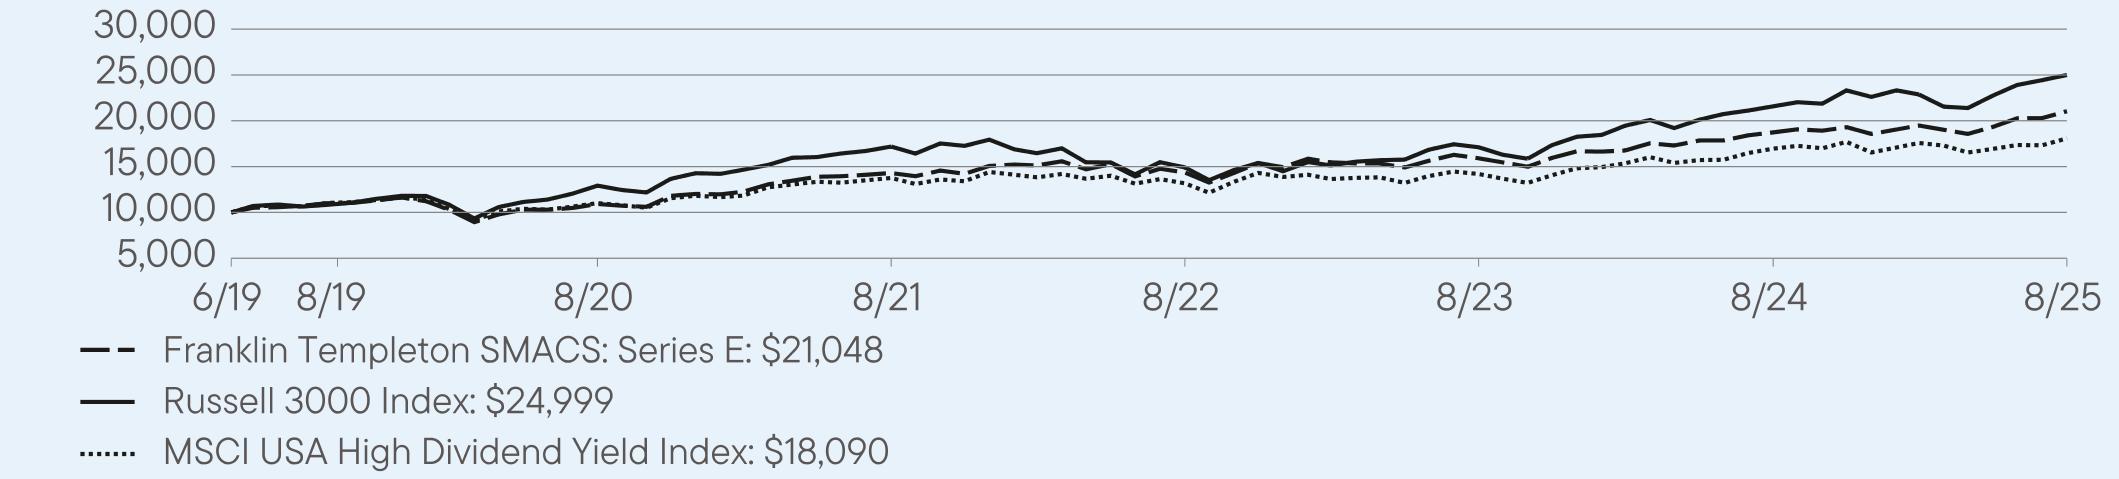
AVERAGE ANNUAL TOTAL RETURNS (%) Period Ended August 31, 2025
|
|
1 Year
|
5 Year
|
Since Inception
(6/3/2019) |
|
Franklin Templeton SMACS: Series E
|
12.34
|
14.02
|
12.66
|
|
Russell 3000 Index
|
15.84
|
14.11
|
16.06
|
|
MSCI USA High Dividend Yield Index
|
6.68
|
10.44
|
9.77
|
For current month-end performance, please call Franklin Templeton at (800) DIAL BEN/342-5236 or visit
https://www.franklintempleton.com/investments/options/mutual-funds.
https://www.franklintempleton.com/investments/options/mutual-funds.
Important data provider notices and terms available at www.franklintempletondatasources.com.
KEY FUND STATISTICS (as of August 31, 2025)
|
Total Net Assets
|
$413,849,433
|
|
Total Number of Portfolio Holdings
|
110
|
|
Total Management Fee Paid
|
$0
|
|
Portfolio Turnover Rate
|
103.34%
|
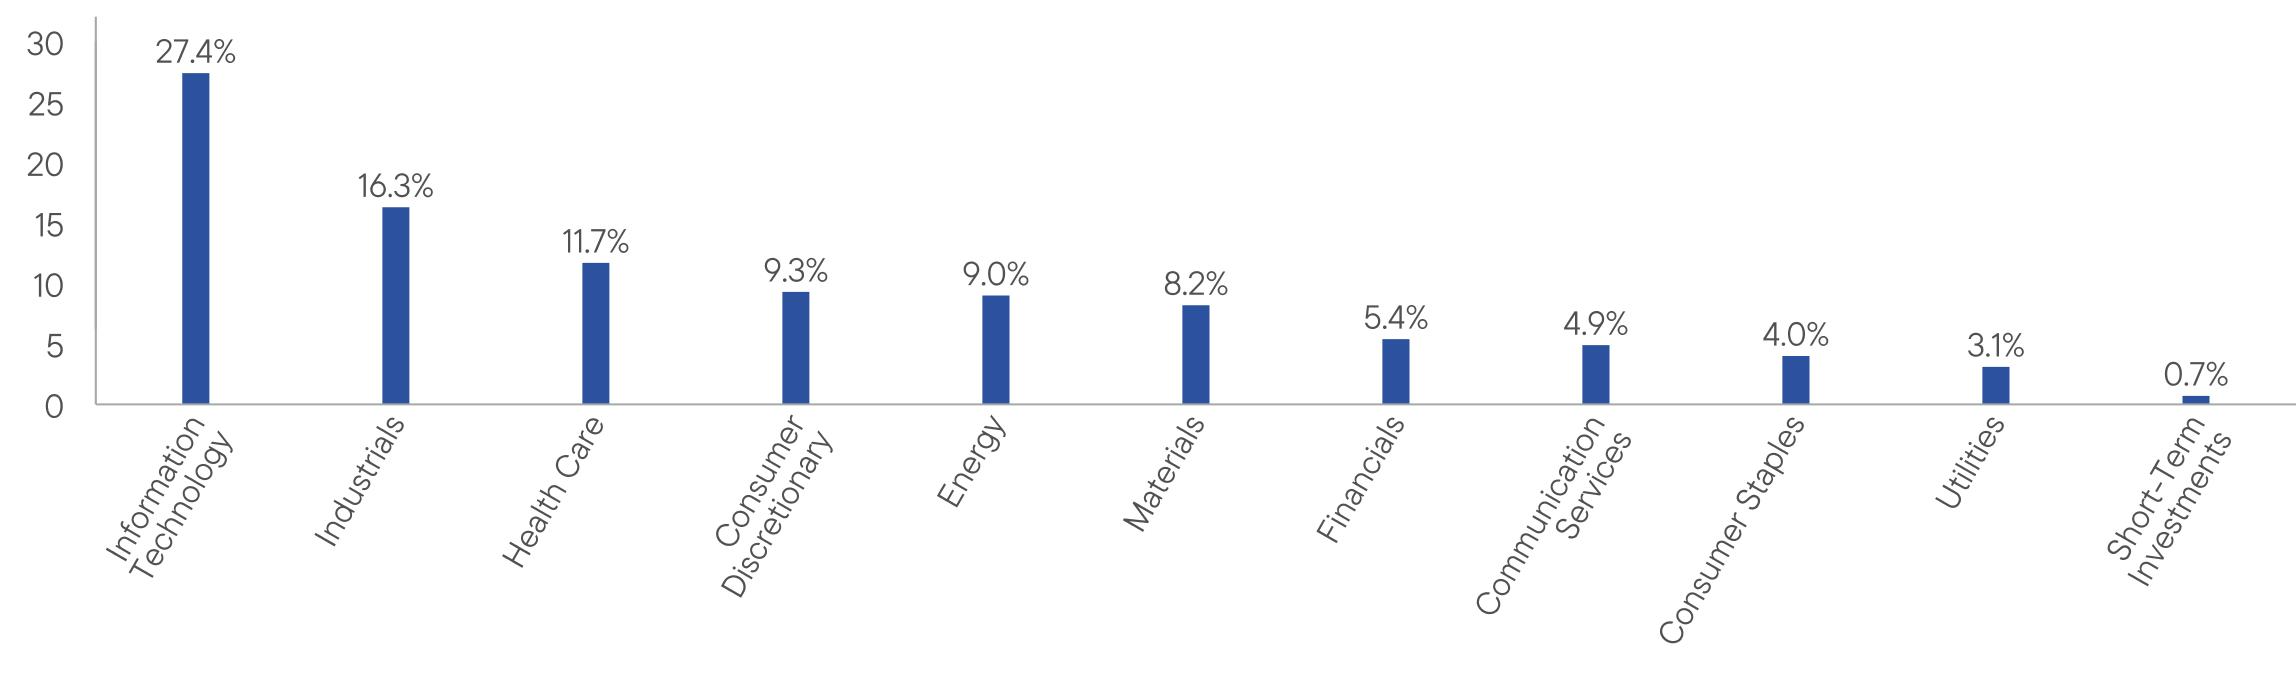
WHAT DID THE FUND INVEST IN? (as of August 31, 2025)
Portfolio Composition* (% of Total Investments)
WHAT WERE THE FUND COSTS FOR THE LAST YEAR? (based on a hypothetical $10,000 investment)
|
Fund Name
|
Costs of a $10,000 investment
|
Costs paid as a percentage of a $10,000 investment*
|
|
Franklin Templeton SMACS: Series I1
|
$0
|
0.00%
|
HOW DID THE FUND PERFORM LAST YEAR AND WHAT AFFECTED ITS PERFORMANCE?
For the twelve months ended August 31, 2025, Franklin Templeton SMACS: Series I returned 7.57%. The Fund compares its performance to the Bloomberg High Yield Very Liquid Index and the 50% Bloomberg High Yield Very Liquid Index and 50% Bloomberg U.S. Corporate Index, which returned 7.98% and 5.95%, respectively, for the same period.
PERFORMANCE HIGHLIGHTS
|
Top contributors to performance:
|
|
|
↑
|
Returns were driven by health care, in addition to securitized products and the consumer discretionary sector.
|
|
↑
|
The Federal Home Loan Mortgage Corporation (Freddie Mac) led returns within securitized products, while Community Health Systems contributed within health care. CommScope Holding also added value within information technology (IT).
|
|
↑
|
Relative performance benefited from selection and underweight allocations to the IT, consumer discretionary, and energy sectors.
|
|
Top detractors from performance:
|
|
|
↓
|
U.S. Treasuries (USTs) detracted from returns.
|
|
↓
|
In addition to USTs, Ardagh Holdings and Pfizer hindered results within the materials and health care sectors, respectively.
|
|
↓
|
Selection and underweight positioning within the communication services sector weakened relative returns, as did overweight allocations to USTs and securitized products.
|
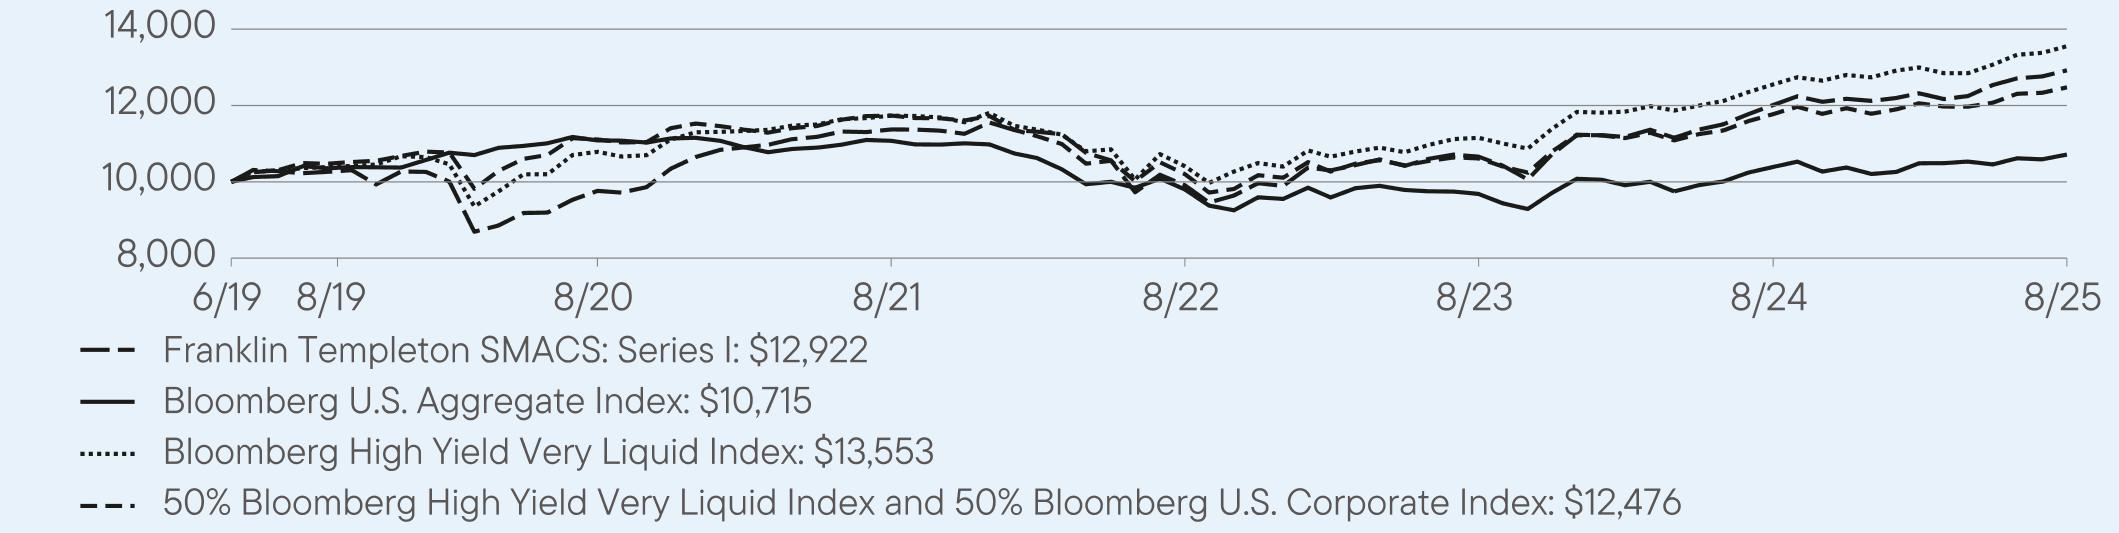
AVERAGE ANNUAL TOTAL RETURNS (%) Period Ended August 31, 2025
|
|
1 Year
|
5 Year
|
Since Inception
(6/3/2019) |
|
Franklin Templeton SMACS: Series I
|
7.57
|
5.77
|
4.19
|
|
Bloomberg U.S. Aggregate Index
|
3.14
|
-0.68
|
1.06
|
|
Bloomberg High Yield Very Liquid Index
|
7.98
|
4.67
|
5.01
|
|
50% Bloomberg High Yield Very Liquid Index and 50% Bloomberg U.S. Corporate Index
|
5.95
|
2.34
|
3.59
|
For current month-end performance, please call Franklin Templeton at (800) DIAL BEN/342-5236 or visit
https://www.franklintempleton.com/investments/options/mutual-funds.
https://www.franklintempleton.com/investments/options/mutual-funds.
Important data provider notices and terms available at www.franklintempletondatasources.com.
KEY FUND STATISTICS (as of August 31, 2025)
|
Total Net Assets
|
$615,016,164
|
|
Total Number of Portfolio Holdings
|
167
|
|
Total Management Fee Paid
|
$0
|
|
Portfolio Turnover Rate
|
52.45%
|
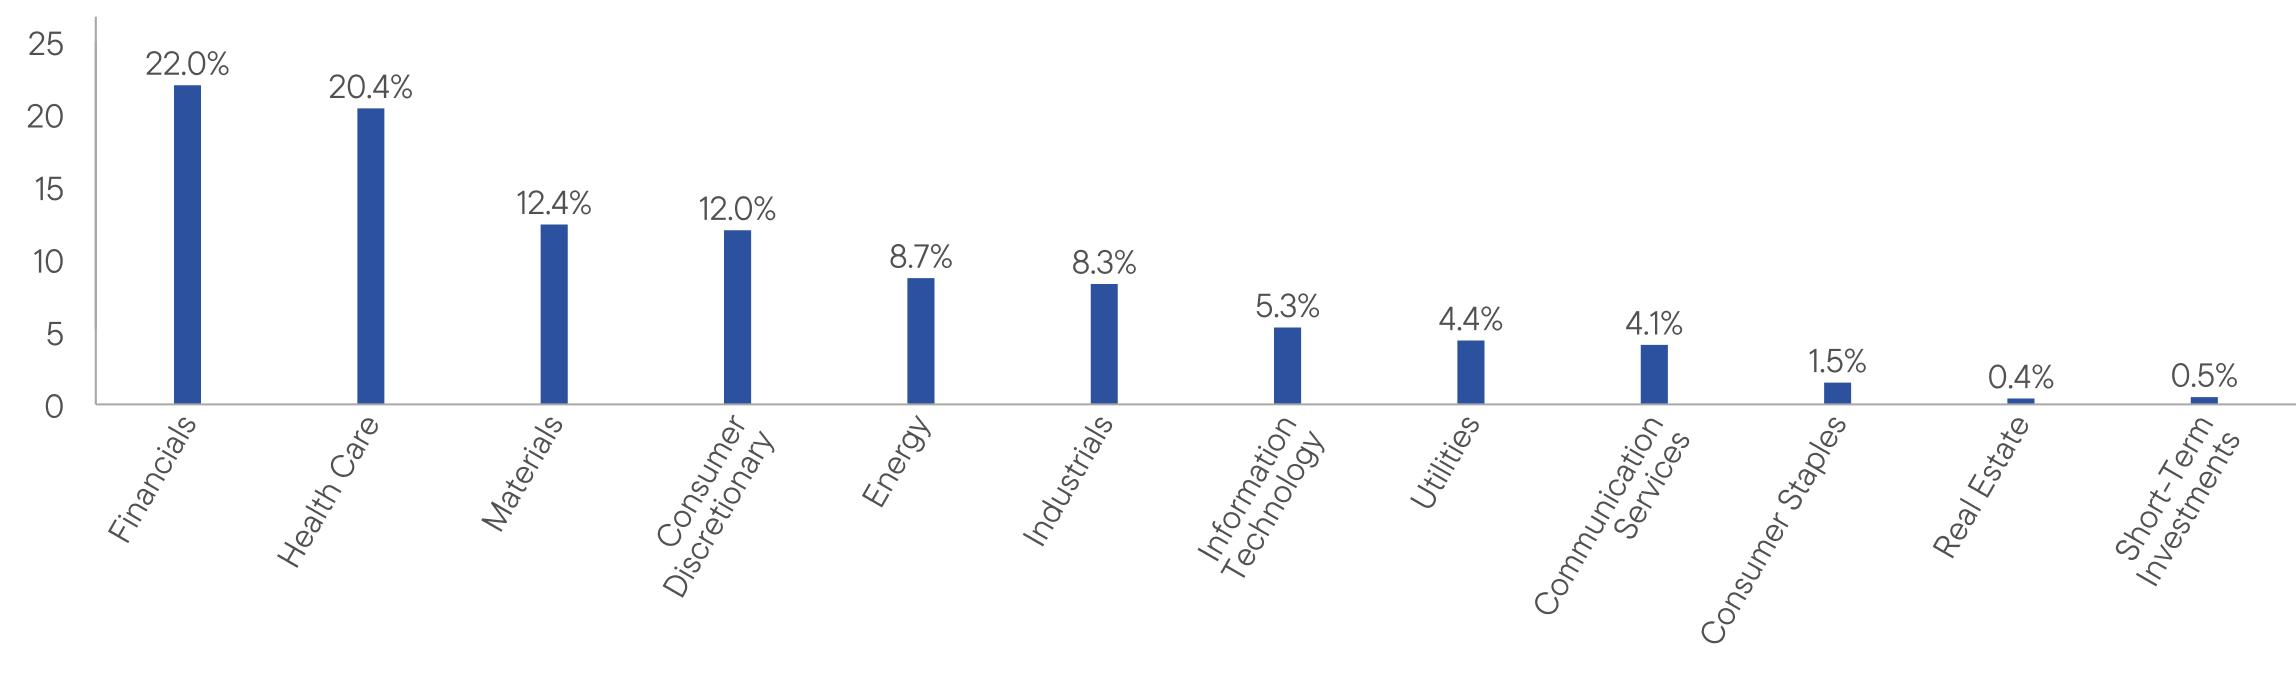
WHAT DID THE FUND INVEST IN? (as of August 31, 2025)
Portfolio Composition* (% of Total Investments)
WHAT WERE THE FUND COSTS FOR THE LAST YEAR? (based on a hypothetical $10,000 investment)
|
Fund Name
|
Costs of a $10,000 investment
|
Costs paid as a percentage of a $10,000 investment*
|
|
Franklin Templeton SMACS: Series CH1
|
$0
|
0.00%
|
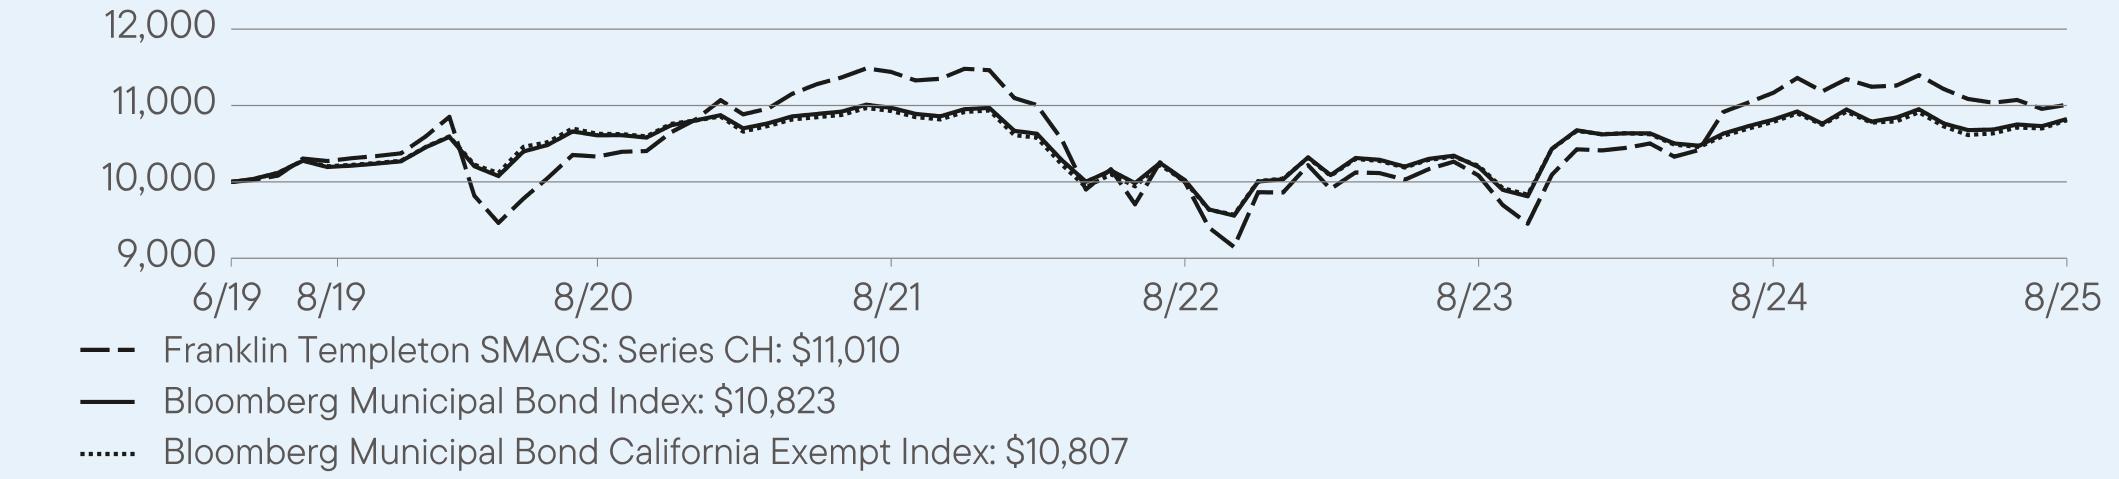
HOW DID THE FUND PERFORM LAST YEAR AND WHAT AFFECTED ITS PERFORMANCE?
For the twelve months ended August 31, 2025, Franklin Templeton SMACS: Series CH Fund returned -1.39%. The Fund compares its performance to the Bloomberg Municipal Bond California Exempt Index, which returned 0.19% for the same period.
PERFORMANCE HIGHLIGHTS
|
Top contributors to performance:
|
|
|
↑
|
Security selection in BBB rated bonds
|
|
↑
|
Overweight allocation to 6% coupon bonds
|
|
↑
|
Security selection in AA rated bonds
|
|
Top detractors from performance:
|
|
|
↓
|
Overweight allocation to bonds five or more years to maturity
|
|
↓
|
Overweight allocation to bonds rated below investment-grade
|
|
↓
|
Security selection in BBB rated bonds
|
AVERAGE ANNUAL TOTAL RETURNS (%) Period Ended August 31, 2025
|
|
1 Year
|
5 Year
|
Since Inception
(6/3/2019) |
|
Franklin Templeton SMACS: Series CH
|
-1.39
|
1.29
|
1.56
|
|
Bloomberg Municipal Bond Index
|
0.08
|
0.40
|
1.26
|
|
Bloomberg Municipal Bond California Exempt Index
|
0.19
|
0.33
|
1.24
|
For current month-end performance, please call Franklin Templeton at (800) DIAL BEN/342-5236 or visit
https://www.franklintempleton.com/investments/options/mutual-funds.
https://www.franklintempleton.com/investments/options/mutual-funds.
Important data provider notices and terms available at www.franklintempletondatasources.com.
KEY FUND STATISTICS (as of August 31, 2025)
|
Total Net Assets
|
$27,406,851
|
|
Total Number of Portfolio Holdings
|
64
|
|
Total Management Fee Paid
|
$0
|
|
Portfolio Turnover Rate
|
28.21%
|
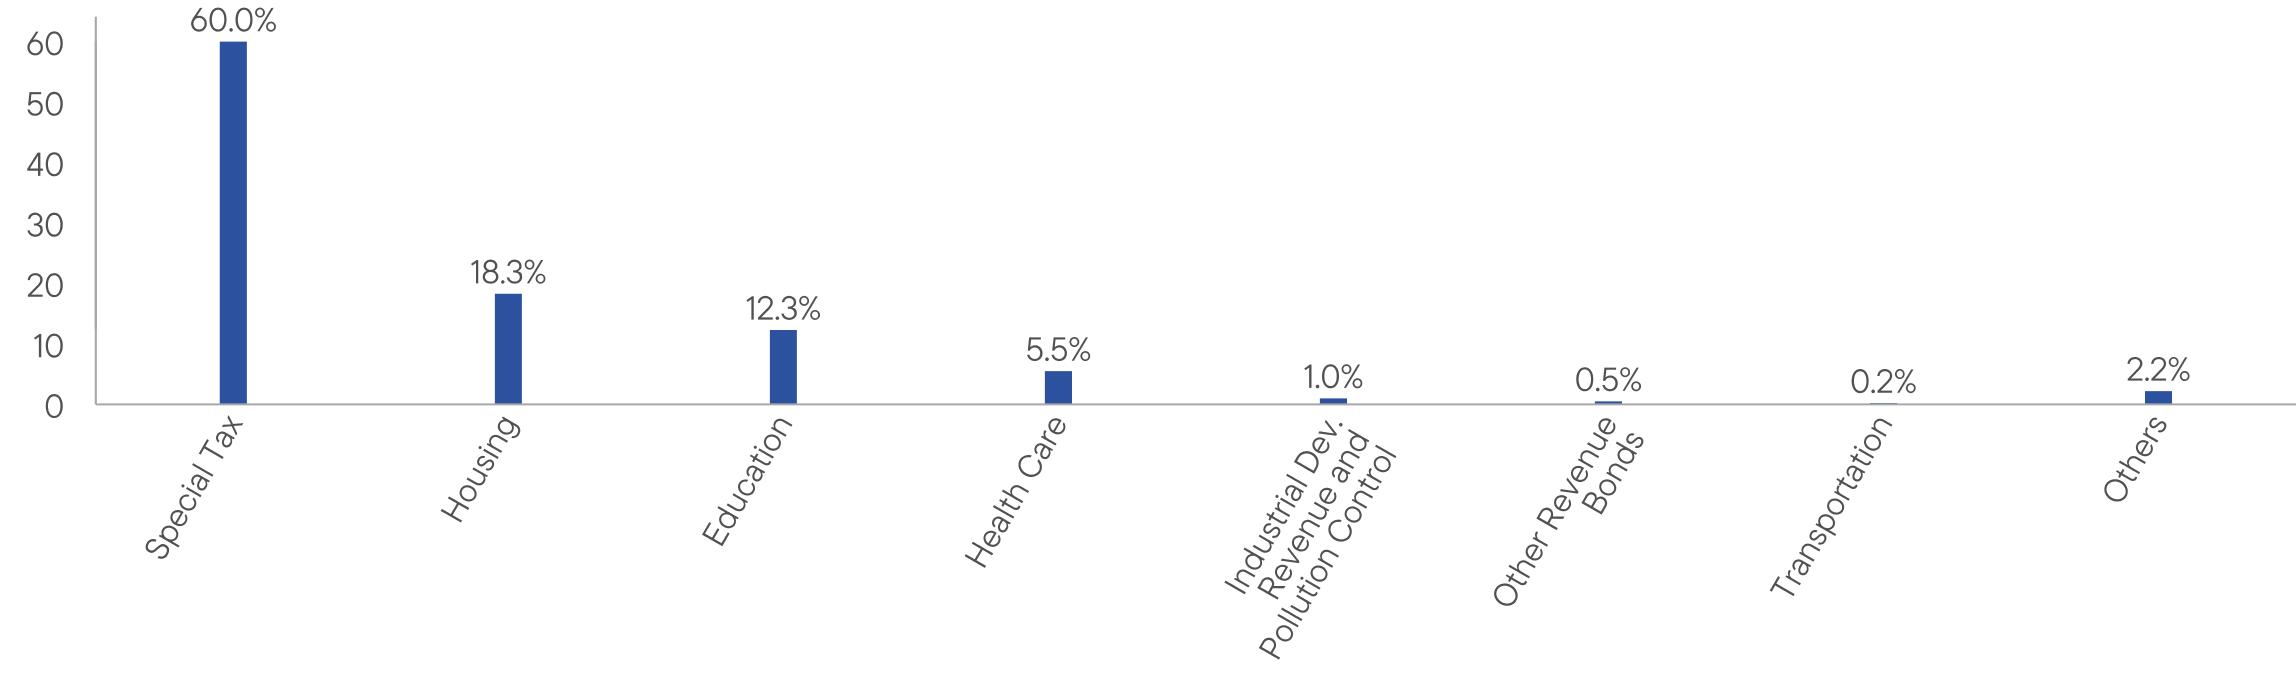
WHAT DID THE FUND INVEST IN? (as of August 31, 2025)
Portfolio Composition* (% of Total Investments)
WHAT WERE THE FUND COSTS FOR THE LAST YEAR? (based on a hypothetical $10,000 investment)
|
Fund Name
|
Costs of a $10,000 investment
|
Costs paid as a percentage of a $10,000 investment*
|
|
Franklin Templeton SMACS: Series H1
|
$0
|
0.00%
|
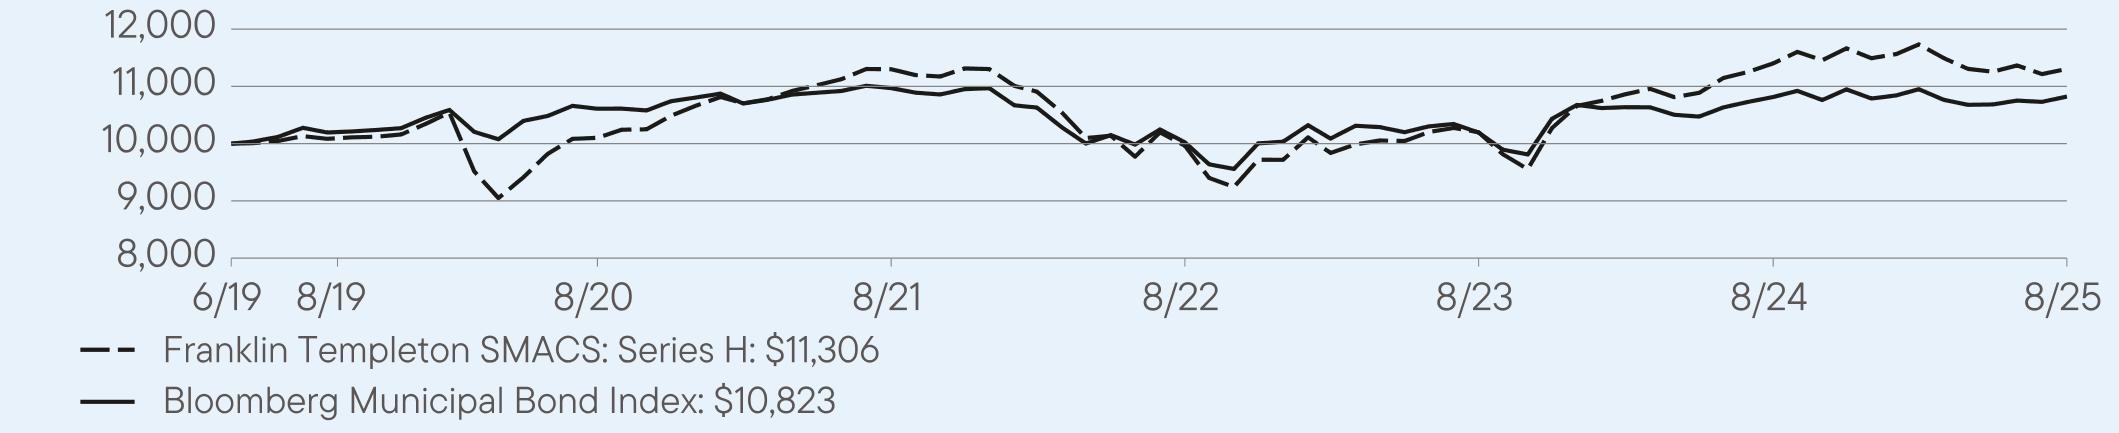
HOW DID THE FUND PERFORM LAST YEAR AND WHAT AFFECTED ITS PERFORMANCE?
For the twelve months ended August 31, 2025, Franklin Templeton SMACS: Series H returned -0.84%. The Fund compares its performance to the Bloomberg Municipal Bond Index, which returned 0.08% for the same period.
PERFORMANCE HIGHLIGHTS
|
Top contributors to performance:
|
|
|
↑
|
Overweight exposure to bonds rated AAA
|
|
↑
|
Overweight exposure to bonds rated below investment-grade
|
|
↑
|
Security selection in bonds rated below investment-grade
|
|
Top detractors from performance:
|
|
|
↓
|
Overweight exposure to municipal bonds with 10 or more years to maturity
|
|
↓
|
Security selection in AAA rated bonds
|
|
↓
|
Underweight exposure to AA rated bonds
|
AVERAGE ANNUAL TOTAL RETURNS (%) Period Ended August 31, 2025
|
|
1 Year
|
5 Year
|
Since Inception
(6/3/2019) |
|
Franklin Templeton SMACS: Series H
|
-0.84
|
2.28
|
1.99
|
|
Bloomberg Municipal Bond Index
|
0.08
|
0.40
|
1.26
|
For current month-end performance, please call Franklin Templeton at (800) DIAL BEN/342-5236 or visit
https://www.franklintempleton.com/investments/options/mutual-funds.
https://www.franklintempleton.com/investments/options/mutual-funds.
Important data provider notices and terms available at www.franklintempletondatasources.com.
KEY FUND STATISTICS (as of August 31, 2025)
|
Total Net Assets
|
$26,831,070
|
|
Total Number of Portfolio Holdings
|
175
|
|
Total Management Fee Paid
|
$0
|
|
Portfolio Turnover Rate
|
7.25%
|
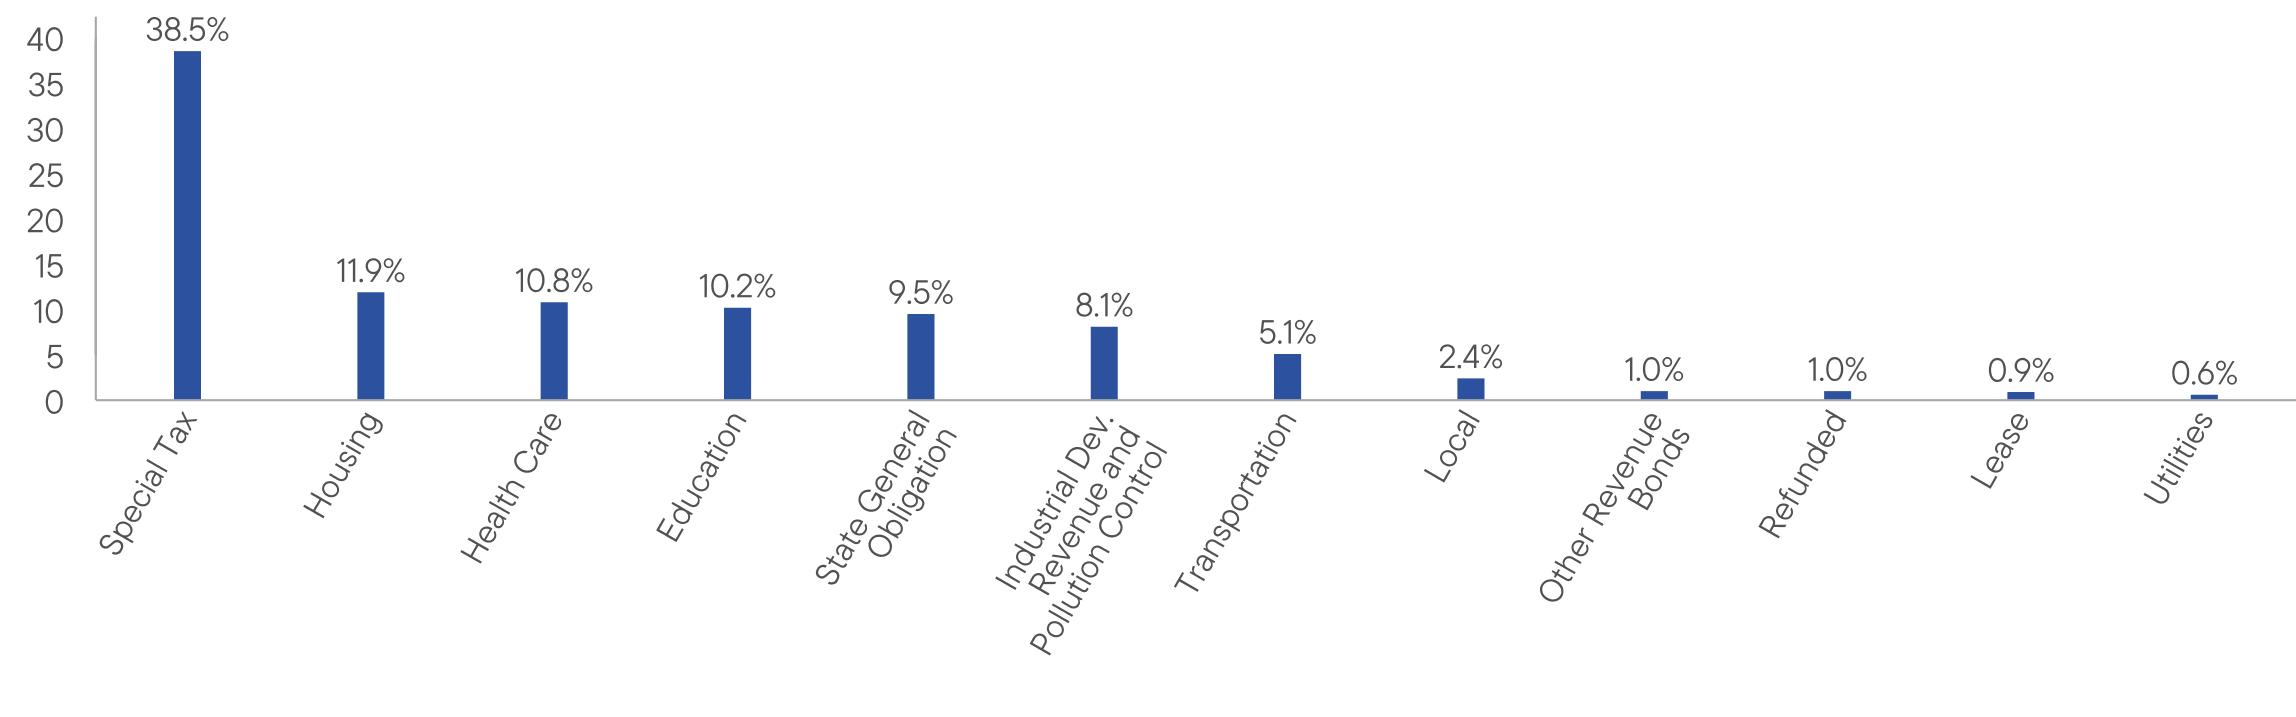
WHAT DID THE FUND INVEST IN? (as of August 31, 2025)
Portfolio Composition* (% of Total Investments)
| [1] |
|
||
| [2] |
|
||
| [3] |
|
||
| [4] |
|
||
| [5] |
|
||
| [6] |
|
||
| [7] |
|
||
| [8] |
|
||
| [9] |
|
||
| [10] |
|
||
| [11] |
|
||
| [12] |
|