

Investor Presentation October 30, 2025 For Investor Relations Purposes Only Exhibit 99.3
Important Cautionary Statement Regarding Forward-looking Statements 2 INVESTOR PRESENTATION | October 2025 This presentation contains certain statements that are forward-looking. Forward-looking statements include, among other things, express and implied statements regarding: the Company’s financial guidance including total net revenue, SUBLOCADE® net revenue, Non-GAAP gross margin, Non-GAAP operating expenses, Non-GAAP SG&A, R&D expenses, and Adjusted EBITDA; expected future operating expense savings; our expectation that we can grow and accelerate SUBLOCADE net revenue, generate immediate accretion from profitability and cash flow growth exceeding revenue growth, and leverage strengthened financial profile to acquire next growth drivers; expectations of increased LAI usage; our product development pipeline and potential future products, the timing of clinical trials, expectations regarding regulatory approval of such product candidates, the timing of such approvals, and the timing of commercial launch of such products or product candidates, and eventual annual revenues of such future products; and other statements containing the words "believe," "anticipate," "plan," "expect," "intend," "estimate," "forecast," “strategy,” “target,” “guidance,” “outlook,” “potential,” "project," "priority," "may," "will," "should," "would," "could," "can," the negatives thereof, and variations thereon and similar expressions. By their nature, forward-looking statements involve risks and uncertainties as they relate to events or circumstances that may or may not occur in the future. Actual results may differ materially from those expressed or implied in these forward-looking statements due to a number of factors, including: lower than expected future sales of our products; greater than expected impacts from competition; unanticipated costs including the effects of potential tariffs and potential retaliatory tariffs; whether we are able to identify efficiencies and fund additional investments that we expect to generate increased revenue, and the timing of such actions; market acceptance of long-acting injectables; and the results of pending and future clinical trials, and the decisions of relevant regulators. For additional information about some of the risks and important factors that could affect our future results and financial condition, see "Risk Factors" in our Annual Report on Form 10-K filed March 3, 2025, in our Quarterly Reports on Forms 10-Q filed May 1, 2025, and July 31, 2025, and our other filings with the U.S. Securities and Exchange Commission. Forward-looking statements speak only as of the date that they are made and should be regarded solely as our current plans, estimates and beliefs. Except as required by law, we do not undertake and specifically decline any obligation to update, republish or revise forward-looking statements to reflect future events or circumstances or to reflect the occurrences of unanticipated events.

Founded to Help Address the Opioid Crisis 1 Laffont CM, et al. Front Pharmacol. 2022;13:105213. doi:10.3389/fphar.2022.105213. 2 Nasser AF, et al. Clin Pharmacokinet. 2014;53(9):813-824. doi:10.1007/s40262-014-0155-0. 3 Jones AK, et al. Clin Pharmacokinet. 2021;60(4):527- 540. doi:10.1007/s40262- 020- 00957- 0. 4 Based on the midpoint of 2025 financial guidance ranges. 5 See Non-GAAP Financial Measures in the Appendix for reconciliation; Net Income for FY 2024 was $7 million. 6 See also discussion of obligations in Note 12 to our financial statements in our annual report on Form 10-K filed March 3, 2025. 7Defined as Total Debt as of September 30, 2025, divided by Adjusted EBITDA for June 2025 trailing 12 months; Total debt excludes legal settlement obligations; See Non-GAAP Financial Measures in the Appendix for reconciliation. See also discussion of obligations in Note 12 to our financial statements in our annual report on Form 10-K filed March 3, 2025. 3 INVESTOR PRESENTATION | October 2025 Leading with Science SUBLOCADE Positioned to be a Durable Growth Driver Leading in discovery and commercialization of buprenorphine evidence-based medicines for opioid dependence for over 30 years 10-year company history of bringing science-based, life-transforming treatments to tackle the opioid crisis, one of the largest and most urgent U.S. public health emergencies of our time SUBLOCADE® is a first-in-class monthly subcutaneous long-acting injectable (LAI) medication for the treatment of moderate to severe opioid use disorder (OUD) No. 1 prescribed LAI in the U.S., with over 435,000 lives treated, supporting OUD recovery Formulated to deliver sustained buprenorphine concentrations of >2ng/mL throughout dosing intervals and helps block opioid-rewarding effects1,2,3 The only once monthly LAI with rapid initiation on day 1 Strong IP management with patents to 2031-2038 Financial Strength TOTAL NET REVENUE ADJUSTED EBITDA5 +1% +15% $473m6 in cash and investments (as of 9/30/25) <1.0x adj. leverage ratio (as of 9/30/25), exclude legal settlements)7 ≥$150m in annual expense savings expected in 2026

1 Financial data provided by Indivior in its Annual Reports on Forms 20-F and 10-K filed with the SEC on June 5, 2023, March 6, 2024 and February 3, 2025. 2 Based on the midpoint of 2025 financial guidance ranges. 3 Other includes Sublingual Film/Tablets, OPVEE® & PERSERIS®. Track Record of Strong Net Revenue Growth 4 U.S. net revenue1 Rest of World net revenue1 SUBLOCADE net revenue1 Net revenue from other products1,3 +13% CAGR +45% CAGR Revenue Growth Driven by the U.S.… …And Increasing Contribution from SUBLOCADE INVESTOR PRESENTATION | October 2025

Leverage Cost Structure… 1 Based on the midpoint of 2025 financial guidance ranges. 2 Non-GAAP operating expenses and adjusted EBITDA are Non-GAAP financial measures; see appendix for reconciliation. GAAP Net Income/(loss) of ($148m) in FY 2020, $205m in FY 2021, ($42m) in FY 2022, ($126m) in FY 2023 and $7m in FY 2024; GAAP Total Expenses of $706m in FY 2020, $451m in FY 2021, $827m in FY 2022, $1,072m in FY 2023 and $919m in FY 2024. 3 FY2023 adjusted EBITDA excludes $162m in acquired in-process R&D (primarily Opiant Pharmaceuticals acquisition). Clear Path to Generating Meaningful Cash Flows from Operations 5 … To Drive Robust Bottom-line Growth +5% CAGR +29% CAGR Adjusted EBITDA2 Non-GAAP operating expenses2 Non-GAAP operating expenses as % of net revenue2 INVESTOR PRESENTATION | October 2025
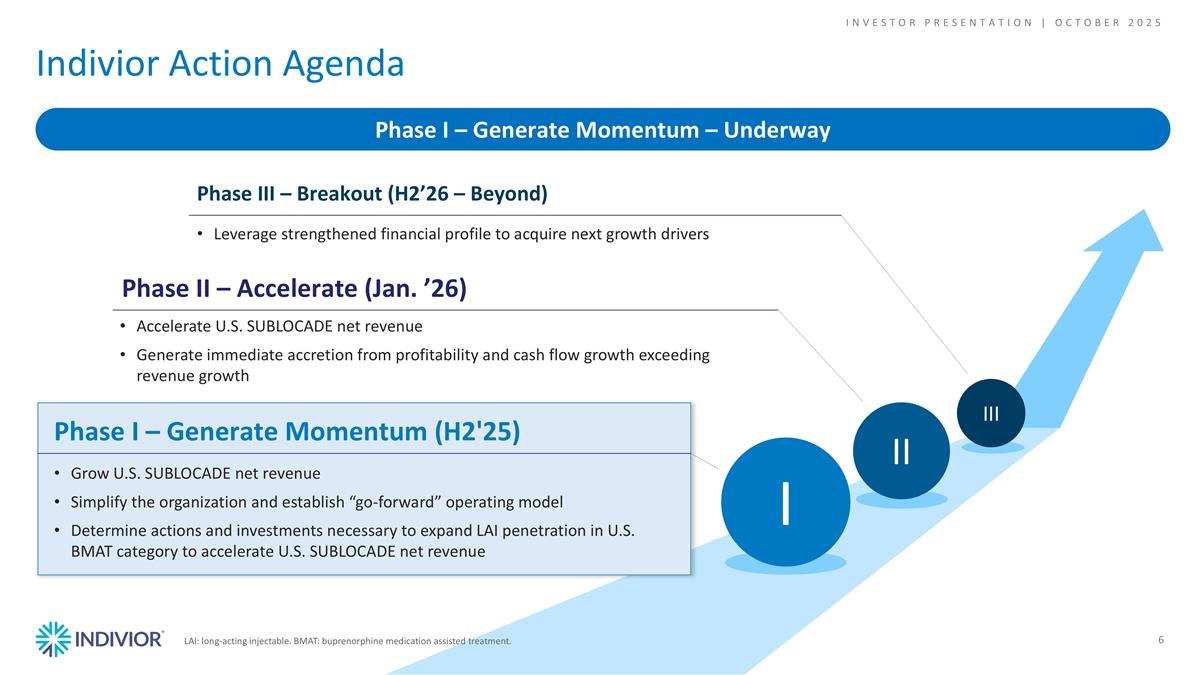
Indivior Action Agenda 6 Phase I – Generate Momentum – Underway I II III Grow U.S. SUBLOCADE net revenue Simplify the organization and establish “go-forward” operating model Determine actions and investments necessary to expand LAI penetration in U.S. BMAT category to accelerate U.S. SUBLOCADE net revenue Accelerate U.S. SUBLOCADE net revenue Generate immediate accretion from profitability and cash flow growth exceeding revenue growth Phase II – Accelerate (Jan. ’26) Leverage strengthened financial profile to acquire next growth drivers Phase III – Breakout (H2’26 – Beyond) Phase I – Generate Momentum (H2'25) INVESTOR PRESENTATION | October 2025 LAI: long-acting injectable. BMAT: buprenorphine medication assisted treatment.

Progress on Phase I of the Indivior Action Agenda 7 Grow SUBLOCADE in the U.S. LSE: London Stock Exchange. DTC: Direct-to-consumer. Simplify the organization and establish “go-forward” operating model Determine actions and investments necessary to expand LAI penetration in U.S. BMAT category to accelerate U.S. SUBLOCADE net revenue +7% U.S. SUBLOCADE YTD Net Revenue Growth Completed LSE delisting Consolidated operating footprint Restructured R&D and Medical Affairs organizations Pursuing U.S. domicile Discontinued sales and marketing support of OPVEE Optimizing the Rest of World business At least $150m in annual expense savings in 2026 Launched new DTC campaign Omnichannel patient activation initiative 1 2 3 INVESTOR PRESENTATION | October 2025

SUBLOCADE®

c c c c Bipartisan Commitment to Addressing Opioid Crisis in the U.S. 9 U.S. Illicit Opioid Use Could Be 20 Times Higher Than Previously Estimated May 12, 2025 The SUPPORT for Patients and Communities Reauthorization Act of 2025 (H.R. 2483) reauthorizes key public health programs focused on prevention, treatment, and recovery for patients with substance use disorder that were established in the Substance Use-Disorder Prevention that Promotes Opioid Recovery and Treatment (SUPPORT) for Patients and Communities Act, which was signed into law in 2018. WTAS: Widespread Industry Support of Bipartisan SUPPORT Act April 8, 2025 Secretary Kennedy Renews Public Health Emergency Declaration to Address National Opioid Crisis The U.S. Department of Health and Human Services (HHS) announced today that Secretary Robert F. Kennedy, Jr. renewed the public health emergency declaration addressing our nation’s opioid crisis, which will allow sustained federal coordination efforts and preserve key flexibilities that enable HHS to continue leveraging expanded authorities to conduct certain activities in response to the opioid overdose crisis. March 18, 2025 Sources: https://www.hhs.gov/press-room/secretary-kennedy-opiod-crisis-emergency-declaration.html and https://energycommerce.house.gov/posts/wtas-widespread-industry-support-of-bipartisan-support-act Opioid Overdoses Remain the Leading Cause of Death AGED 18-44 May 14, 2025 INVESTOR PRESENTATION | October 2025
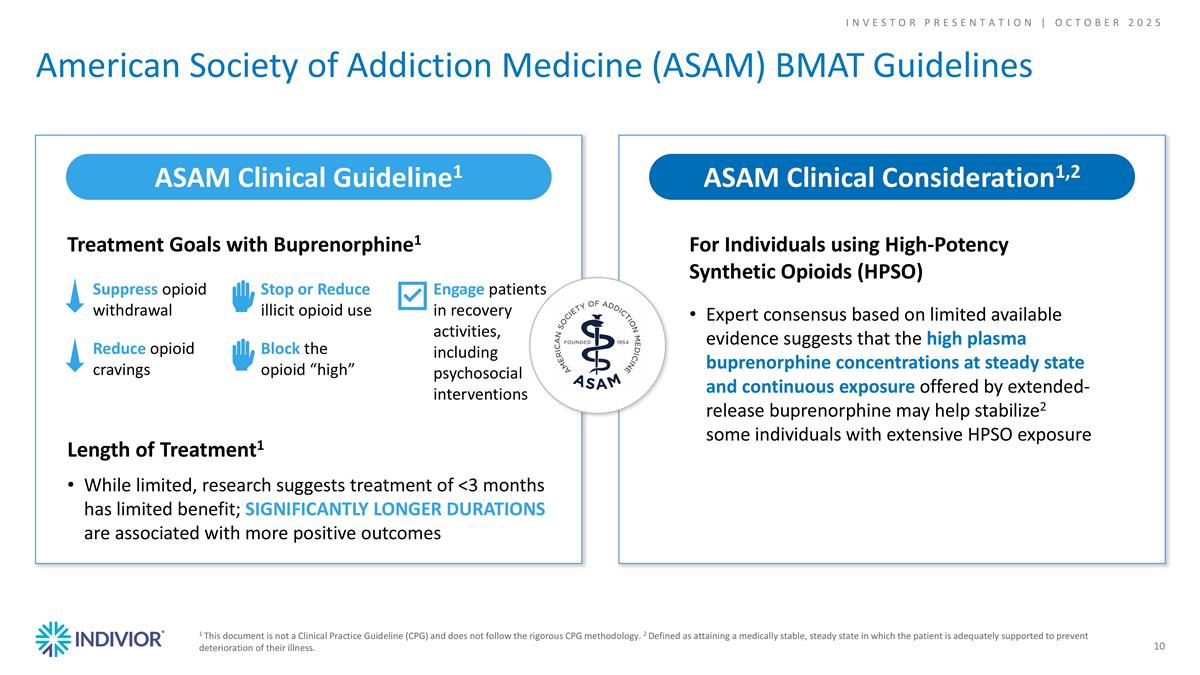
American Society of Addiction Medicine (ASAM) BMAT Guidelines For Individuals using High-Potency Synthetic Opioids (HPSO) Expert consensus based on limited available evidence suggests that the high plasma buprenorphine concentrations at steady state and continuous exposure offered by extended-release buprenorphine may help stabilize2 some individuals with extensive HPSO exposure ASAM Clinical Consideration1,2 1 This document is not a Clinical Practice Guideline (CPG) and does not follow the rigorous CPG methodology. 2 Defined as attaining a medically stable, steady state in which the patient is adequately supported to prevent deterioration of their illness. ASAM Clinical Guideline1 10 Treatment Goals with Buprenorphine1 Suppress opioid withdrawal Reduce opioid cravings Stop or Reduce illicit opioid use Block the opioid “high” Engage patients in recovery activities, including psychosocial interventions Length of Treatment1 While limited, research suggests treatment of <3 months has limited benefit; significantly longer durations are associated with more positive outcomes INVESTOR PRESENTATION | October 2025
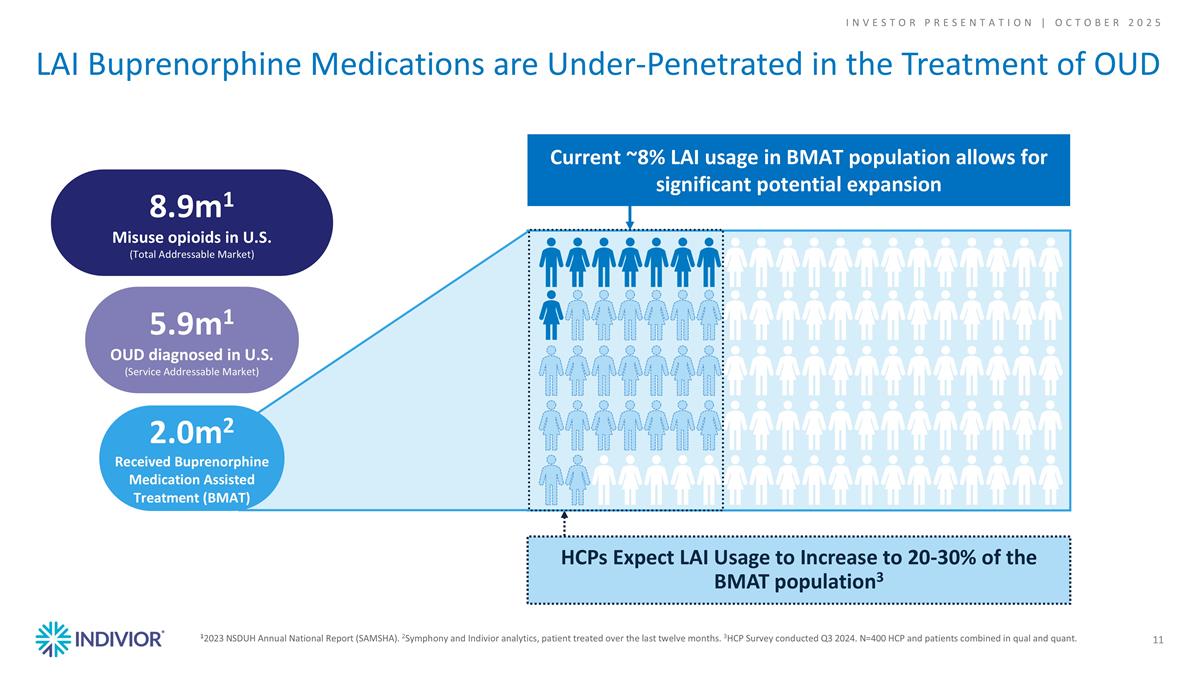
12023 NSDUH Annual National Report (SAMSHA). 2Symphony and Indivior analytics, patient treated over the last twelve months. 3HCP Survey conducted Q3 2024. N=400 HCP and patients combined in qual and quant. LAI Buprenorphine Medications are Under-Penetrated in the Treatment of OUD 11 Current ~8% LAI usage in BMAT population allows for significant potential expansion HCPs Expect LAI Usage to Increase to 20-30% of the BMAT population3 8.9m1 Misuse opioids in U.S. (Total Addressable Market) 5.9m1 OUD diagnosed in U.S. (Service Addressable Market) 2.0m2 Received Buprenorphine Medication Assisted Treatment (BMAT) INVESTOR PRESENTATION | October 2025
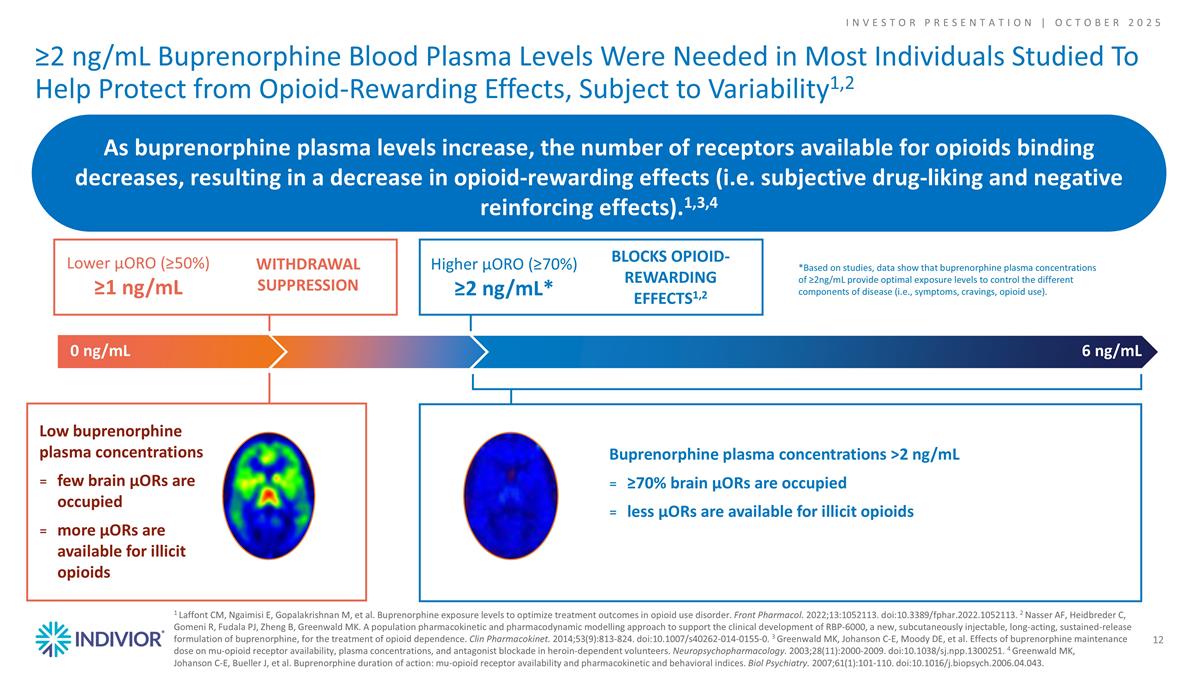
Buprenorphine plasma concentrations >2 ng/mL ≥70% brain μORs are occupied less μORs are available for illicit opioids Low buprenorphine plasma concentrations few brain μORs are occupied more μORs are available for illicit opioids As buprenorphine plasma levels increase, the number of receptors available for opioids binding decreases, resulting in a decrease in opioid-rewarding effects (i.e. subjective drug-liking and negative reinforcing effects).1,3,4 ≥2 ng/mL Buprenorphine Blood Plasma Levels Were Needed in Most Individuals Studied To Help Protect from Opioid-Rewarding Effects, Subject to Variability1,2 12 Lower μORO (≥50%) ≥1 ng/mL 0 ng/mL 6 ng/mL Higher μORO (≥70%) ≥2 ng/mL* BLOCKS OPIOID-REWARDING EFFECTS1,2 1 Laffont CM, Ngaimisi E, Gopalakrishnan M, et al. Buprenorphine exposure levels to optimize treatment outcomes in opioid use disorder. Front Pharmacol. 2022;13:1052113. doi:10.3389/fphar.2022.1052113. 2 Nasser AF, Heidbreder C, Gomeni R, Fudala PJ, Zheng B, Greenwald MK. A population pharmacokinetic and pharmacodynamic modelling approach to support the clinical development of RBP‑6000, a new, subcutaneously injectable, long‑acting, sustained‑release formulation of buprenorphine, for the treatment of opioid dependence. Clin Pharmacokinet. 2014;53(9):813‑824. doi:10.1007/s40262‑014‑0155‑0. 3 Greenwald MK, Johanson C‑E, Moody DE, et al. Effects of buprenorphine maintenance dose on mu-opioid receptor availability, plasma concentrations, and antagonist blockade in heroin-dependent volunteers. Neuropsychopharmacology. 2003;28(11):2000‑2009. doi:10.1038/sj.npp.1300251. 4 Greenwald MK, Johanson C‑E, Bueller J, et al. Buprenorphine duration of action: mu-opioid receptor availability and pharmacokinetic and behavioral indices. Biol Psychiatry. 2007;61(1):101‑110. doi:10.1016/j.biopsych.2006.04.043. *Based on studies, data show that buprenorphine plasma concentrations of ≥2ng/mL provide optimal exposure levels to control the different components of disease (i.e., symptoms, cravings, opioid use). WITHDRAWAL SUPPRESSION INVESTOR PRESENTATION | October 2025
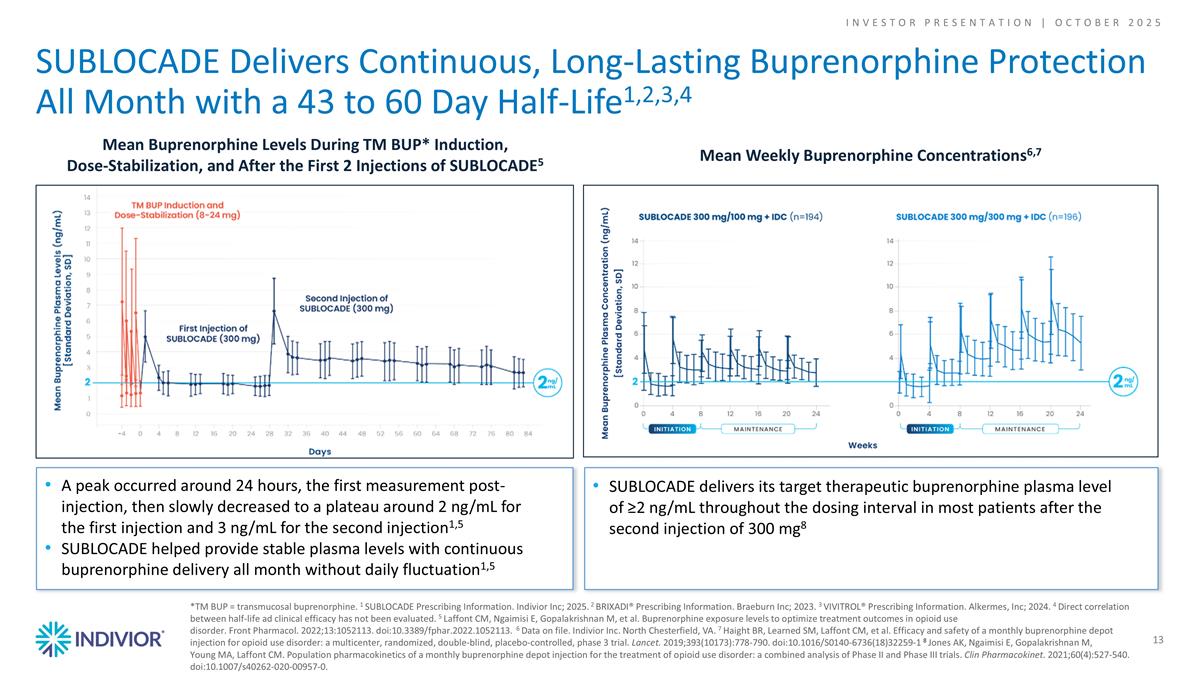
Mean Buprenorphine Levels During TM BUP* Induction, Dose-Stabilization, and After the First 2 Injections of SUBLOCADE5 A peak occurred around 24 hours, the first measurement post-injection, then slowly decreased to a plateau around 2 ng/mL for the first injection and 3 ng/mL for the second injection1,5 SUBLOCADE helped provide stable plasma levels with continuous buprenorphine delivery all month without daily fluctuation1,5 *TM BUP = transmucosal buprenorphine. 1 SUBLOCADE Prescribing Information. Indivior Inc; 2025. 2 BRIXADI® Prescribing Information. Braeburn Inc; 2023. 3 VIVITROL® Prescribing Information. Alkermes, Inc; 2024. 4 Direct correlation between half-life ad clinical efficacy has not been evaluated. 5 Laffont CM, Ngaimisi E, Gopalakrishnan M, et al. Buprenorphine exposure levels to optimize treatment outcomes in opioid use disorder. Front Pharmacol. 2022;13:1052113. doi:10.3389/fphar.2022.1052113. 6 Data on file. Indivior Inc. North Chesterfield, VA. 7 Haight BR, Learned SM, Laffont CM, et al. Efficacy and safety of a monthly buprenorphine depot injection for opioid use disorder: a multicenter, randomized, double-blind, placebo-controlled, phase 3 trial. Lancet. 2019;393(10173):778-790. doi:10.1016/S0140-6736(18)32259-1 8 Jones AK, Ngaimisi E, Gopalakrishnan M, Young MA, Laffont CM. Population pharmacokinetics of a monthly buprenorphine depot injection for the treatment of opioid use disorder: a combined analysis of Phase II and Phase III trials. Clin Pharmacokinet. 2021;60(4):527-540. doi:10.1007/s40262-020-00957-0. Mean Weekly Buprenorphine Concentrations6,7 SUBLOCADE delivers its target therapeutic buprenorphine plasma level of ≥2 ng/mL throughout the dosing interval in most patients after the second injection of 300 mg8 SUBLOCADE Delivers Continuous, Long-Lasting Buprenorphine Protection All Month with a 43 to 60 Day Half-Life1,2,3,4 13 INVESTOR PRESENTATION | October 2025
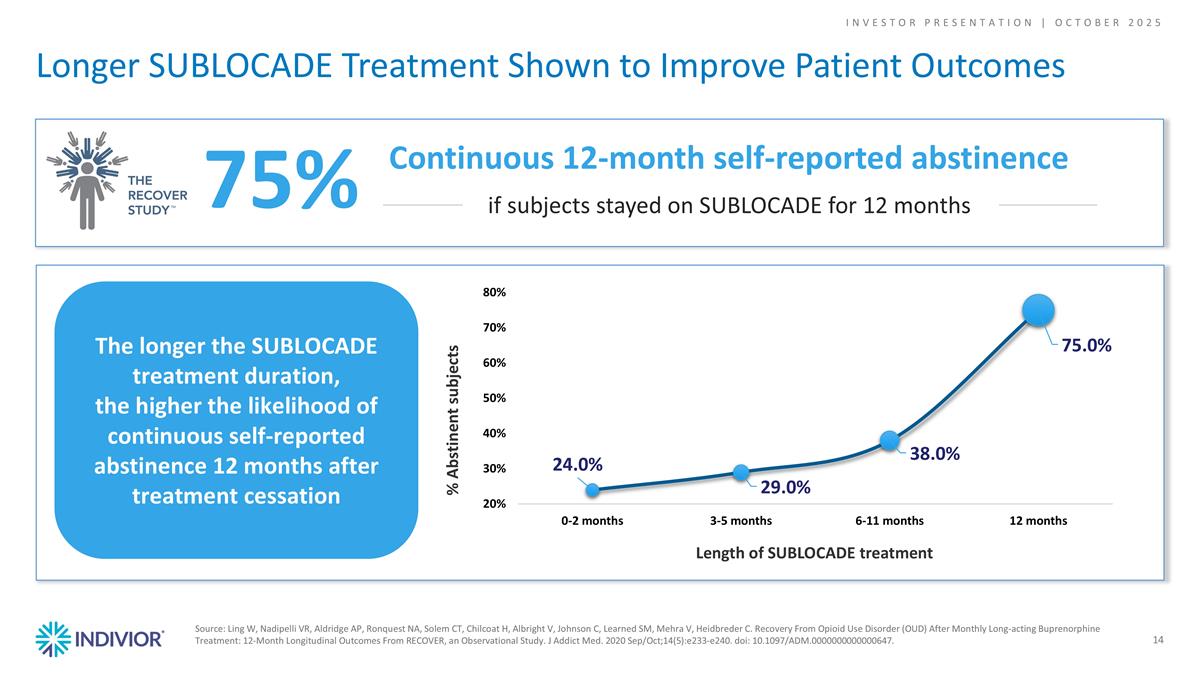
The longer the SUBLOCADE treatment duration, the higher the likelihood of continuous self-reported abstinence 12 months after treatment cessation % Abstinent subjects Length of SUBLOCADE treatment Source: Ling W, Nadipelli VR, Aldridge AP, Ronquest NA, Solem CT, Chilcoat H, Albright V, Johnson C, Learned SM, Mehra V, Heidbreder C. Recovery From Opioid Use Disorder (OUD) After Monthly Long-acting Buprenorphine Treatment: 12-Month Longitudinal Outcomes From RECOVER, an Observational Study. J Addict Med. 2020 Sep/Oct;14(5):e233-e240. doi: 10.1097/ADM.0000000000000647. Longer SUBLOCADE Treatment Shown to Improve Patient Outcomes 14 75% Continuous 12-month self-reported abstinence if subjects stayed on SUBLOCADE for 12 months INVESTOR PRESENTATION | October 2025

New SUBLOCADE Label Benefits1 Label Updates Further Differentiate SUBLOCADE for Today’s Opioid Crisis Driven by the Proliferation of Synthetic Opioids START PATIENTS ON SUBLOCADE SOONER: Only monthly LAI to initiate on Day 1 with buprenorphine naive patients (no 7-day oral induction).1,2 2nd INJECTION: Helps patients reach 2+ ng/mL earlier than previous label – enables continuous protection.1 Abdomen Thigh Back of the Upper Arm Buttock CLINICALLY RELEVANT: Rapid initiation studied in majority fentanyl positive patients & high-risk users.3 ADDITIONAL INJECTION SITES: Choice supports patient preference and buy-in. Includes all four sites from Day 1. 15 1 www.sublocade.com/Content/pdf/prescribing-information.pdf 2 ww.brixadi.com/pdfs/brixadi-prescribing-information.pdf 3 www.indivior.com/en/media/press-releases/indivior-announces-fda-approval-of-label-changes-for-sublocade-injection INVESTOR PRESENTATION | October 2025
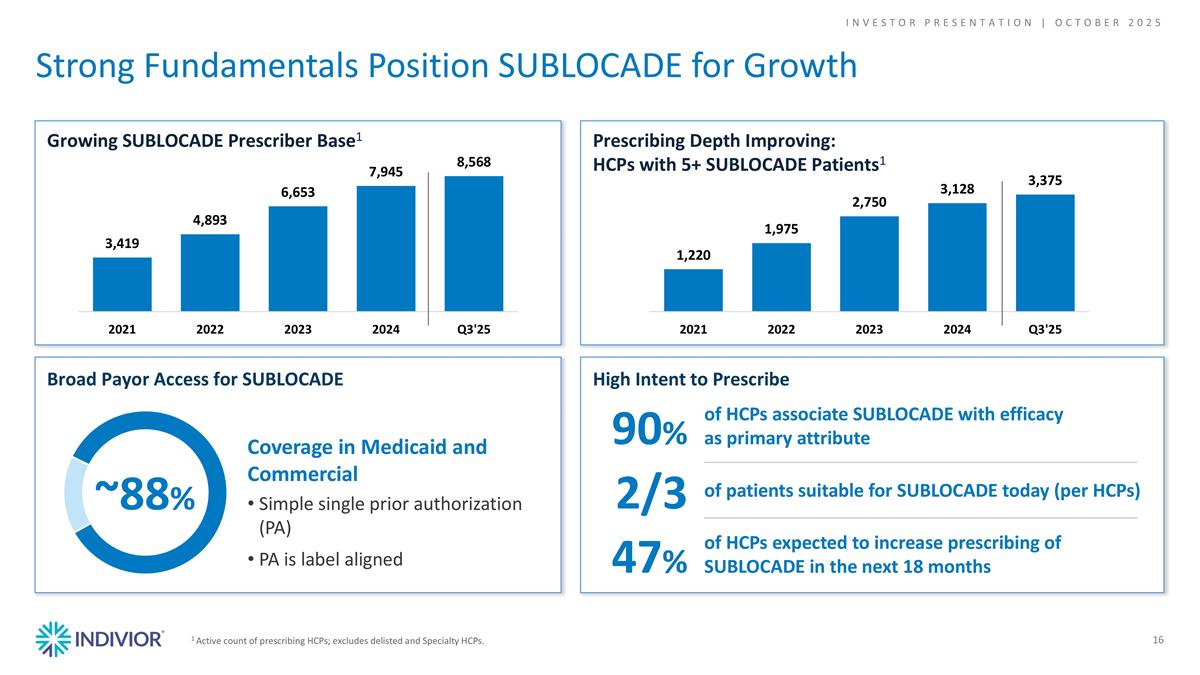
Broad Payor Access for SUBLOCADE High Intent to Prescribe 1 Active count of prescribing HCPs; excludes delisted and Specialty HCPs. 47% of HCPs expected to increase prescribing of SUBLOCADE in the next 18 months 2/3 of patients suitable for SUBLOCADE today (per HCPs) 90% of HCPs associate SUBLOCADE with efficacy as primary attribute Strong Fundamentals Position SUBLOCADE for Growth 16 Growing SUBLOCADE Prescriber Base1 Prescribing Depth Improving: HCPs with 5+ SUBLOCADE Patients1 ~88% Coverage in Medicaid and Commercial Simple single prior authorization (PA) PA is label aligned INVESTOR PRESENTATION | October 2025
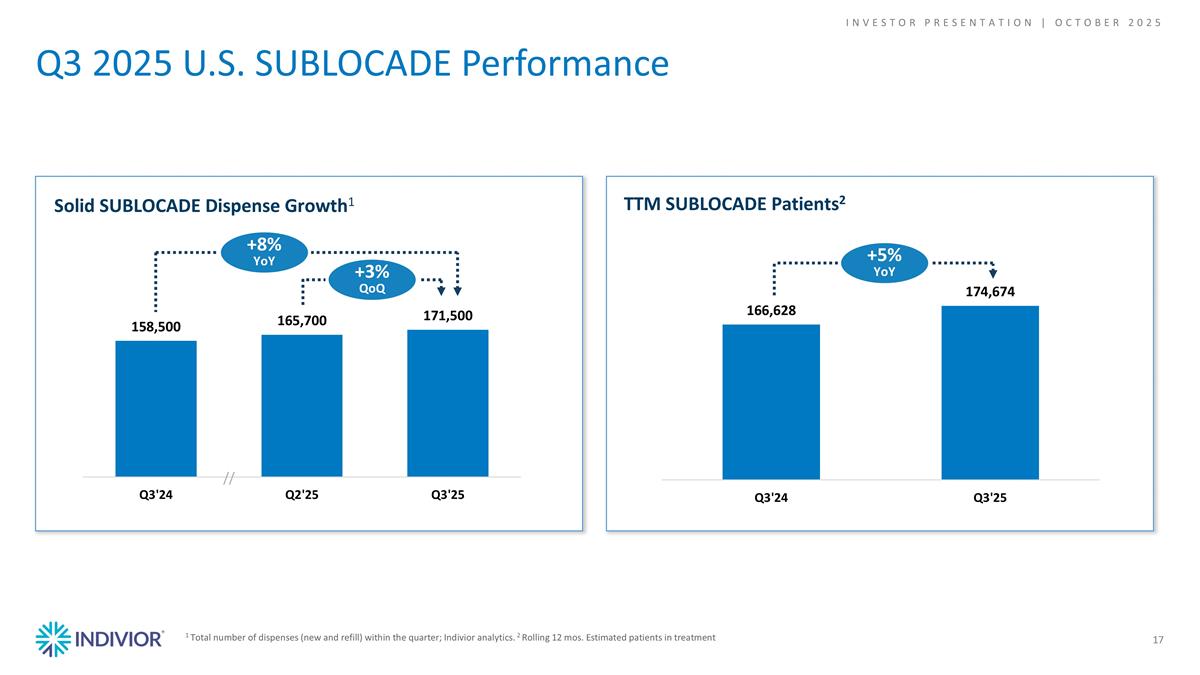
Q3 2025 U.S. SUBLOCADE Performance 17 1 Total number of dispenses (new and refill) within the quarter; Indivior analytics. 2 Rolling 12 mos. Estimated patients in treatment TTM SUBLOCADE Patients2 Solid SUBLOCADE Dispense Growth1 // +8% YoY +3% QoQ +5% YoY INVESTOR PRESENTATION | October 2025
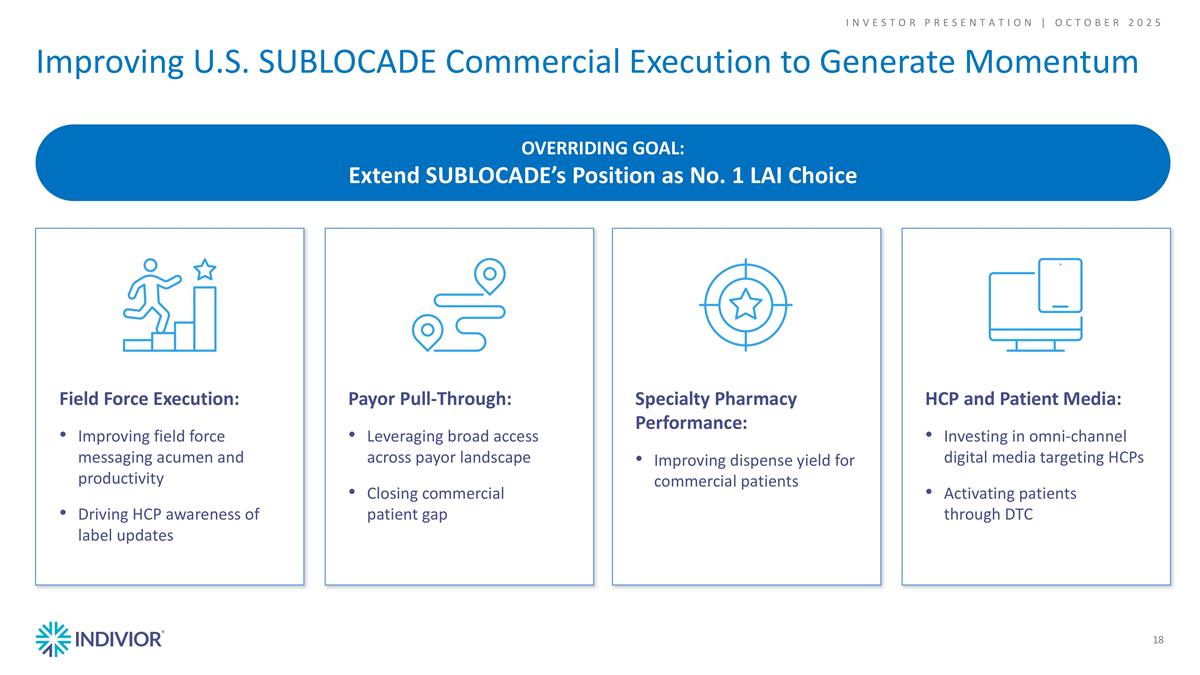
Improving U.S. SUBLOCADE Commercial Execution to Generate Momentum 18 OVERRIDING GOAL: Extend SUBLOCADE’s Position as No. 1 LAI Choice Field Force Execution: Improving field force messaging acumen and productivity Driving HCP awareness of label updates Payor Pull-Through: Leveraging broad access across payor landscape Closing commercial patient gap Specialty Pharmacy Performance: Improving dispense yield for commercial patients HCP and Patient Media: Investing in omni-channel digital media targeting HCPs Activating patients through DTC INVESTOR PRESENTATION | October 2025
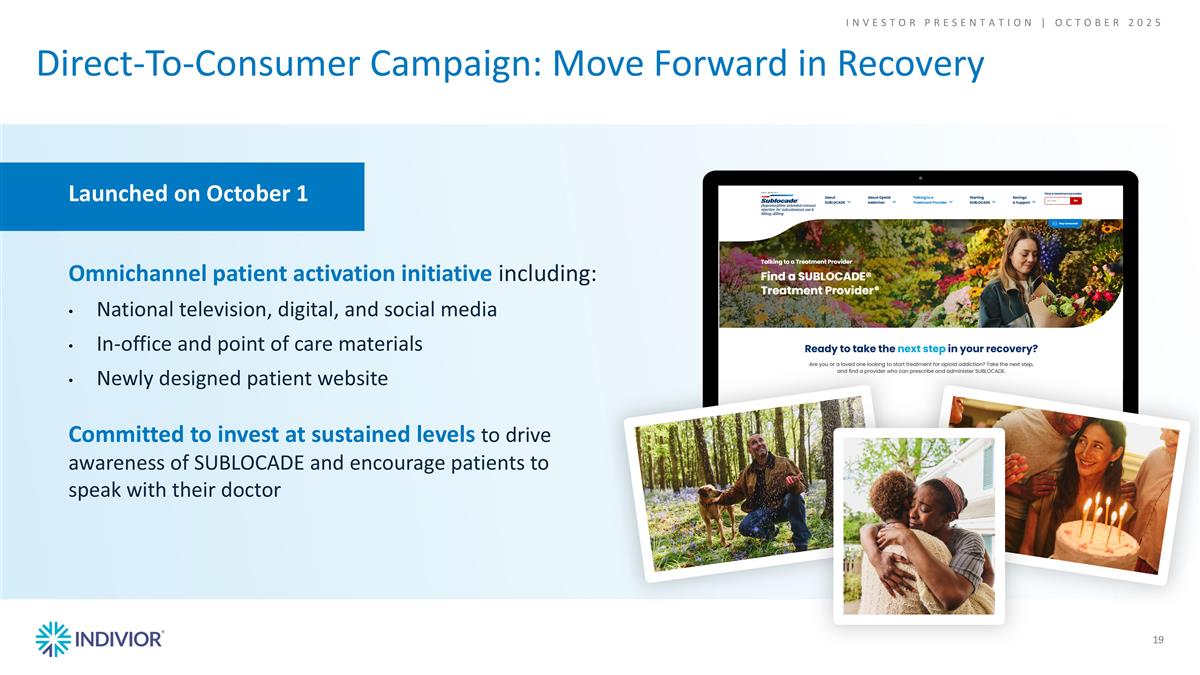
Direct-To-Consumer Campaign: Move Forward in Recovery 19 Omnichannel patient activation initiative including: National television, digital, and social media In-office and point of care materials Newly designed patient website Committed to invest at sustained levels to drive awareness of SUBLOCADE and encourage patients to speak with their doctor Launched on October 1 INVESTOR PRESENTATION | October 2025

Pipeline
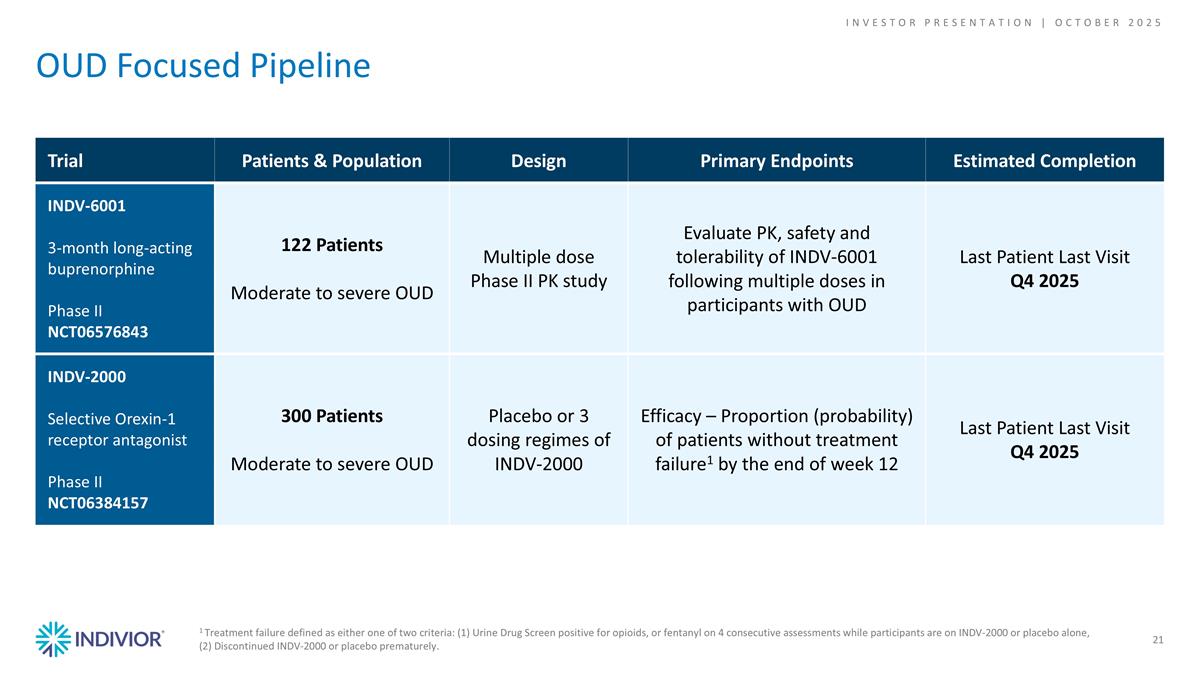
1 Treatment failure defined as either one of two criteria: (1) Urine Drug Screen positive for opioids, or fentanyl on 4 consecutive assessments while participants are on INDV-2000 or placebo alone, (2) Discontinued INDV-2000 or placebo prematurely. Trial Patients & Population Design Primary Endpoints Estimated Completion INDV-6001 3-month long-acting buprenorphine Phase II NCT06576843 122 Patients Moderate to severe OUD Multiple dose Phase II PK study Evaluate PK, safety and tolerability of INDV-6001 following multiple doses in participants with OUD Last Patient Last Visit Q4 2025 INDV-2000 Selective Orexin-1 receptor antagonist Phase II NCT06384157 300 Patients Moderate to severe OUD Placebo or 3 dosing regimes of INDV-2000 Efficacy – Proportion (probability) of patients without treatment failure1 by the end of week 12 Last Patient Last Visit Q4 2025 OUD Focused Pipeline 21 INVESTOR PRESENTATION | October 2025

Financials
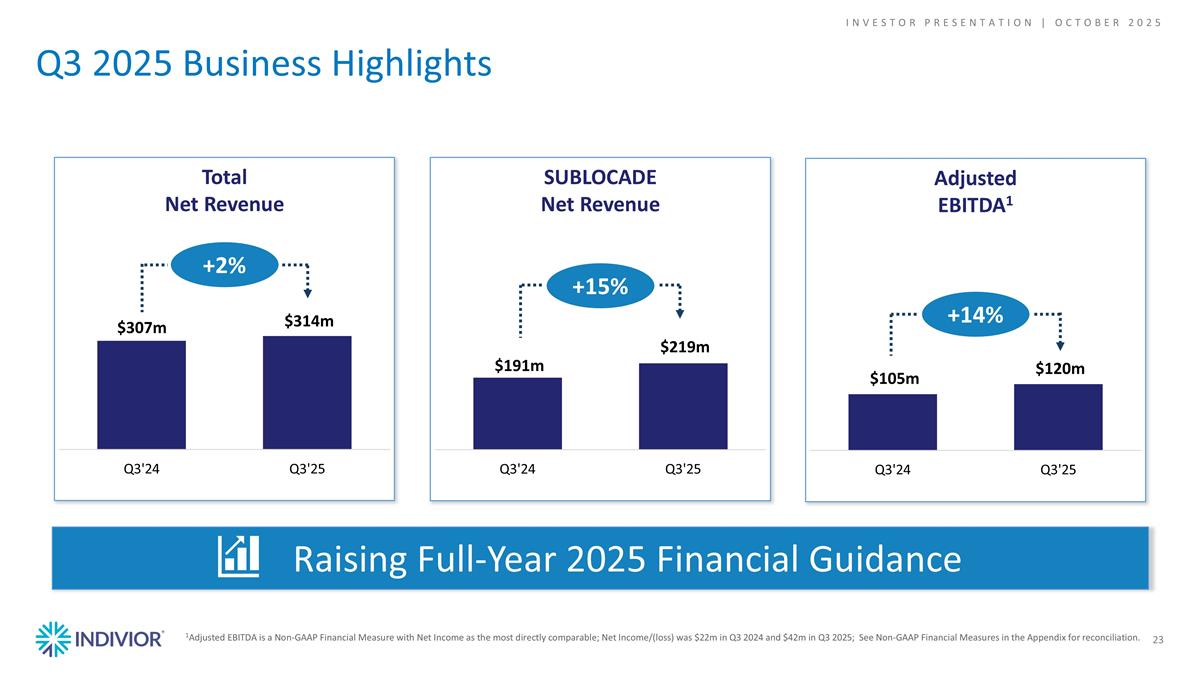
SUBLOCADE Net Revenue Q3 2025 Business Highlights 1Adjusted EBITDA is a Non-GAAP Financial Measure with Net Income as the most directly comparable; Net Income/(loss) was $22m in Q3 2024 and $42m in Q3 2025; See Non-GAAP Financial Measures in the Appendix for reconciliation. Total Net Revenue Adjusted EBITDA1 Raising Full-Year 2025 Financial Guidance +2% +15% +14% 23 INVESTOR PRESENTATION | October 2025
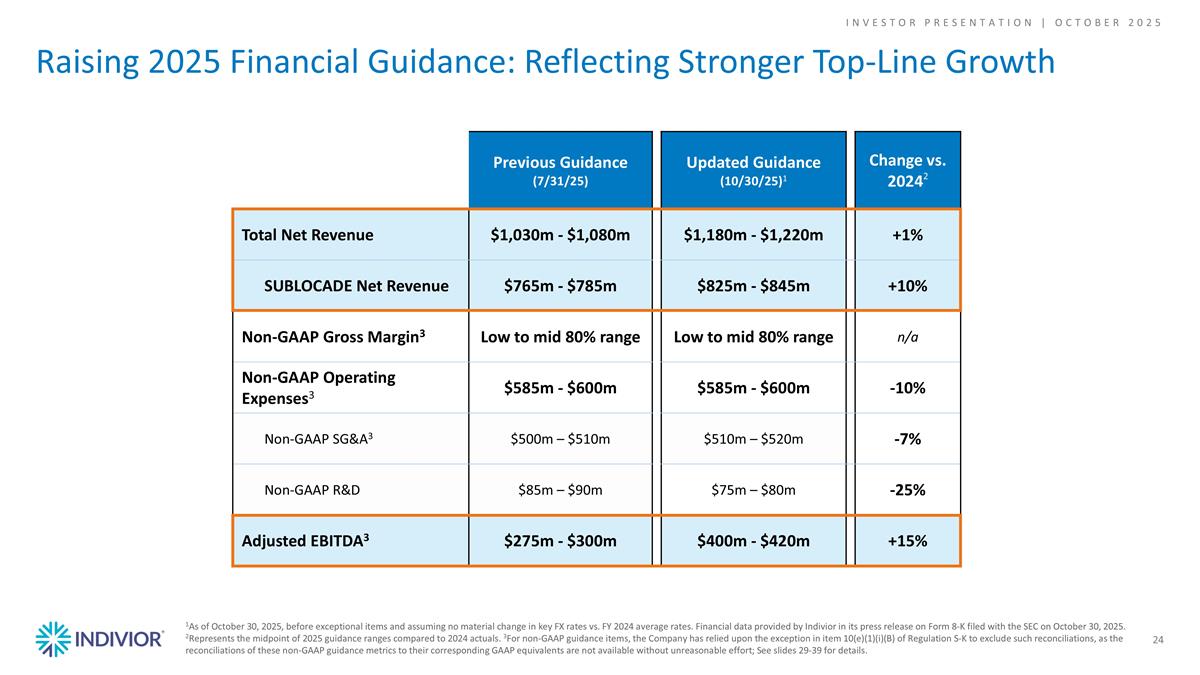
Raising 2025 Financial Guidance: Reflecting Stronger Top-Line Growth 24 1As of October 30, 2025, before exceptional items and assuming no material change in key FX rates vs. FY 2024 average rates. Financial data provided by Indivior in its press release on Form 8-K filed with the SEC on October 30, 2025. 2Represents the midpoint of 2025 guidance ranges compared to 2024 actuals. 3For non-GAAP guidance items, the Company has relied upon the exception in item 10(e)(1)(i)(B) of Regulation S-K to exclude such reconciliations, as the reconciliations of these non-GAAP guidance metrics to their corresponding GAAP equivalents are not available without unreasonable effort; See slides 29-39 for details. Previous Guidance (7/31/25) Updated Guidance (10/30/25)1 Change vs. 20242 Total Net Revenue $1,030m - $1,080m $1,180m - $1,220m +1% SUBLOCADE Net Revenue $765m - $785m $825m - $845m +10% Non-GAAP Gross Margin3 Low to mid 80% range Low to mid 80% range n/a Non-GAAP Operating Expenses3 $585m - $600m $585m - $600m -10% Non-GAAP SG&A3 $500m – $510m $510m – $520m -7% Non-GAAP R&D $85m – $90m $75m – $80m -25% Adjusted EBITDA3 $275m - $300m $400m - $420m +15% INVESTOR PRESENTATION | October 2025
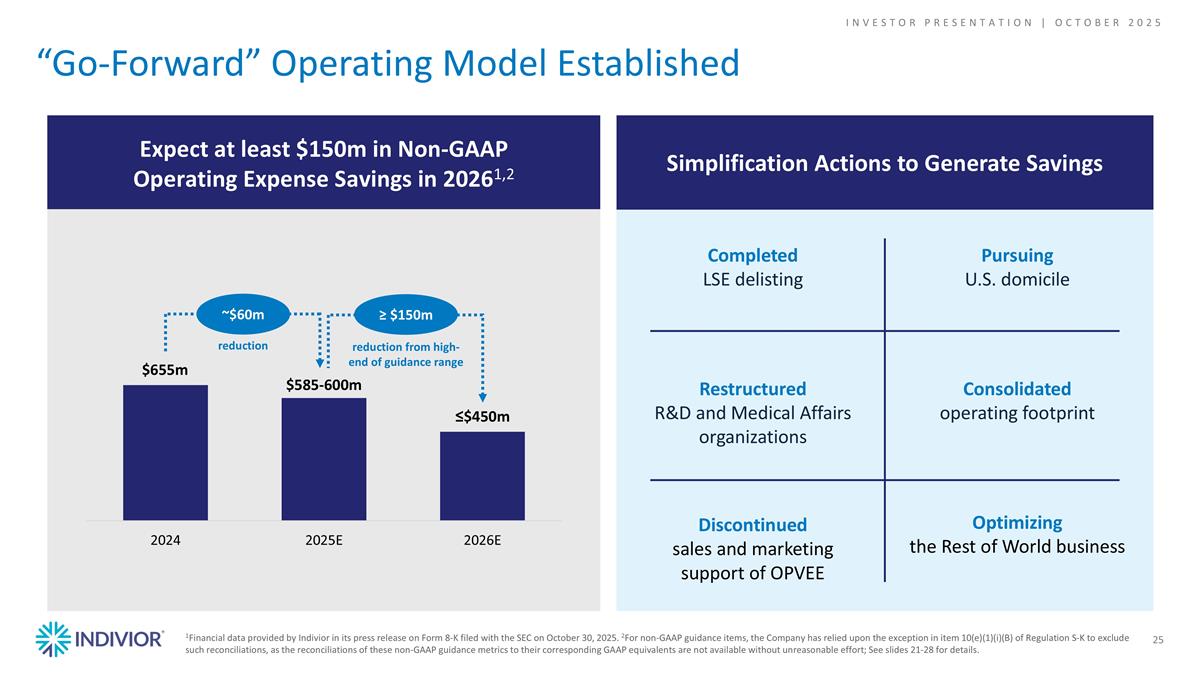
Completed LSE delisting Restructured R&D and Medical Affairs organizations Discontinued sales and marketing support of OPVEE “Go-Forward” Operating Model Established 25 Expect at least $150m in Non-GAAP Operating Expense Savings in 20261,2 ~$60m Simplification Actions to Generate Savings 1Financial data provided by Indivior in its press release on Form 8-K filed with the SEC on October 30, 2025. 2For non-GAAP guidance items, the Company has relied upon the exception in item 10(e)(1)(i)(B) of Regulation S-K to exclude such reconciliations, as the reconciliations of these non-GAAP guidance metrics to their corresponding GAAP equivalents are not available without unreasonable effort; See slides 21-28 for details. Pursuing U.S. domicile Consolidated operating footprint Optimizing the Rest of World business ≥ $150m reduction from high-end of guidance range reduction INVESTOR PRESENTATION | October 2025
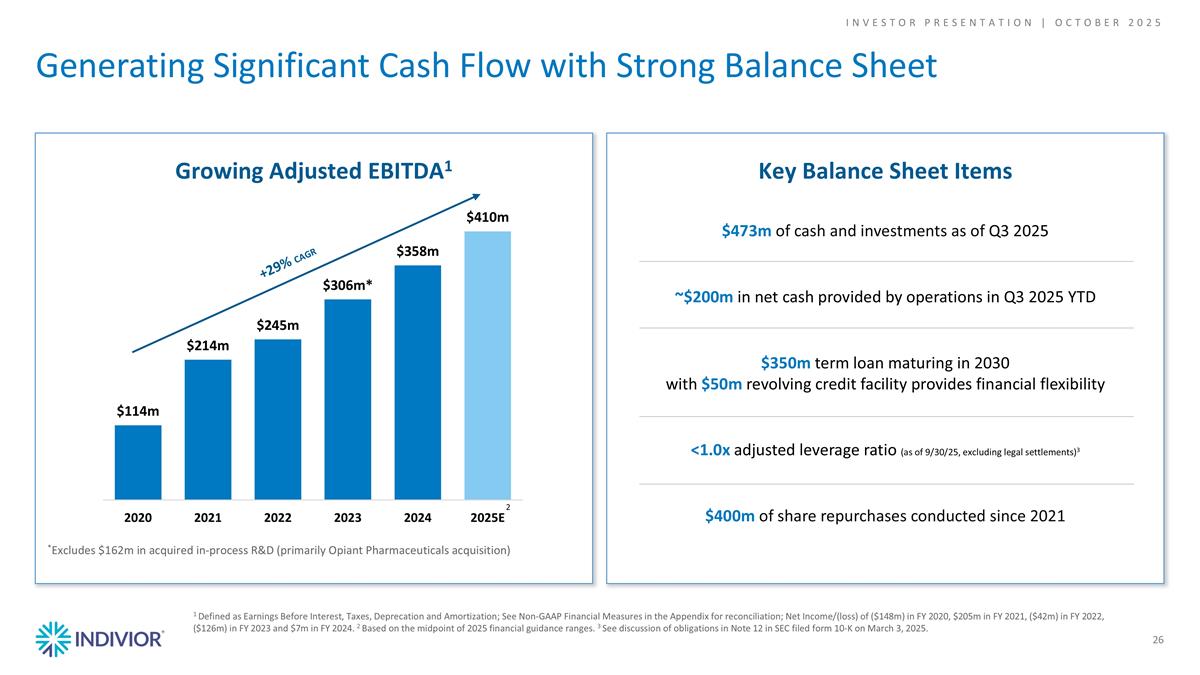
Key Balance Sheet Items 1 Defined as Earnings Before Interest, Taxes, Deprecation and Amortization; See Non-GAAP Financial Measures in the Appendix for reconciliation; Net Income/(loss) of ($148m) in FY 2020, $205m in FY 2021, ($42m) in FY 2022, ($126m) in FY 2023 and $7m in FY 2024. 2 Based on the midpoint of 2025 financial guidance ranges. 3 See discussion of obligations in Note 12 in SEC filed form 10-K on March 3, 2025. *Excludes $162m in acquired in-process R&D (primarily Opiant Pharmaceuticals acquisition) $473m of cash and investments as of Q3 2025 ~$200m in net cash provided by operations in Q3 2025 YTD $350m term loan maturing in 2030 with $50m revolving credit facility provides financial flexibility <1.0x adjusted leverage ratio (as of 9/30/25, excluding legal settlements)3 $400m of share repurchases conducted since 2021 Growing Adjusted EBITDA1 Generating Significant Cash Flow with Strong Balance Sheet 26 2 INVESTOR PRESENTATION | October 2025 +29% CAGR

Goals of Increasing U.S. Presence Transition to U.S. Focused Business 27 INVESTOR PRESENTATION | October 2025 Expand Indivior’s U.S. capital markets presence Align with Indivior’s focus on growing SUBLOCADE in the U.S. Simplify corporate governance and reduce complexity Increase potential U.S. equity indexation Recent Actions Increasing U.S. Capital Markets Presence Completed London Stock Exchange delisting with INDV trading exclusively on Nasdaq Intention to change domicile from U.K. to U.S. and establish new parent company, Indivior Pharmaceuticals, Inc. Announced optimization of ROW business to focus on select countries that represent 77% of forecasted ROW net revenue and 94% of forecasted ROW adjusted EBITDA July 25, 2025 October 1, 2025 October 30, 2025 Included in U.S. equity indexes: U.S. Russell Indexes MSCI U.S. Indexes S&P Total Market Index

Appendix
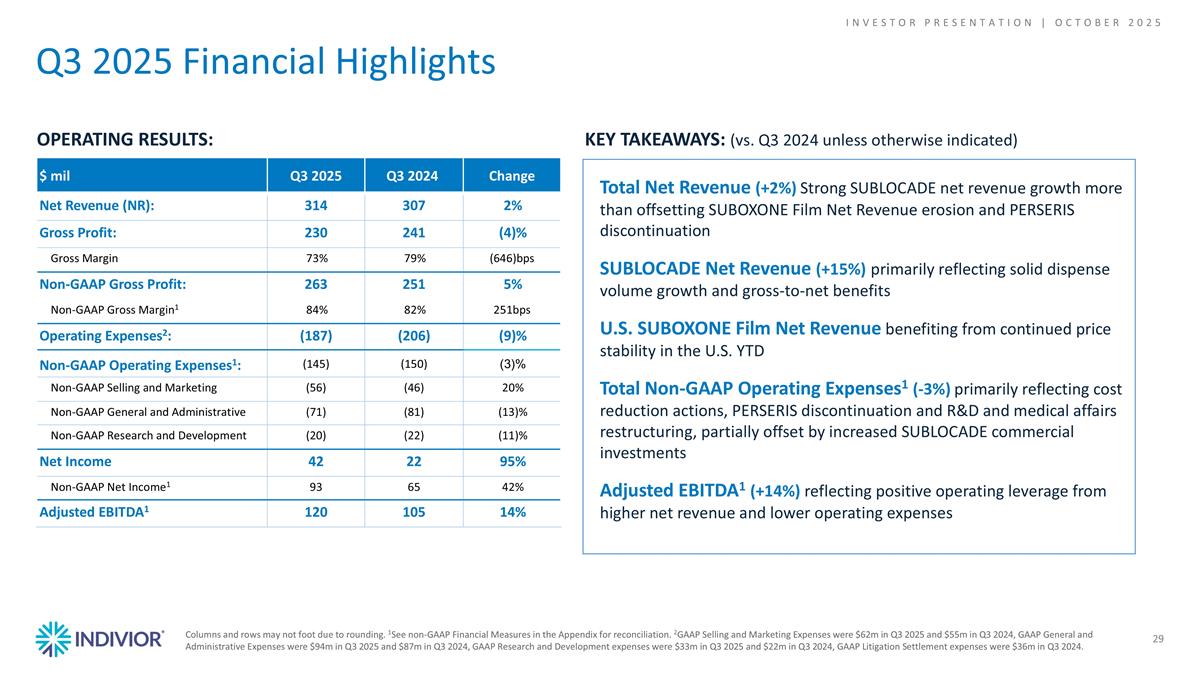
Q3 2025 Financial Highlights 29 Columns and rows may not foot due to rounding. 1See non-GAAP Financial Measures in the Appendix for reconciliation. 2GAAP Selling and Marketing Expenses were $62m in Q3 2025 and $55m in Q3 2024, GAAP General and Administrative Expenses were $94m in Q3 2025 and $87m in Q3 2024, GAAP Research and Development expenses were $33m in Q3 2025 and $22m in Q3 2024, GAAP Litigation Settlement expenses were $36m in Q3 2024. OPERATING RESULTS: KEY TAKEAWAYS: (vs. Q3 2024 unless otherwise indicated) Total Net Revenue (+2%) Strong SUBLOCADE net revenue growth more than offsetting SUBOXONE Film Net Revenue erosion and PERSERIS discontinuation SUBLOCADE Net Revenue (+15%) primarily reflecting solid dispense volume growth and gross-to-net benefits U.S. SUBOXONE Film Net Revenue benefiting from continued price stability in the U.S. YTD Total Non-GAAP Operating Expenses1 (-3%) primarily reflecting cost reduction actions, PERSERIS discontinuation and R&D and medical affairs restructuring, partially offset by increased SUBLOCADE commercial investments Adjusted EBITDA1 (+14%) reflecting positive operating leverage from higher net revenue and lower operating expenses $ mil Q3 2025 Q3 2024 Change Net Revenue (NR): 314 307 2% Gross Profit: 230 241 (4)% Gross Margin 73% 79% (646)bps Non-GAAP Gross Profit: 263 251 5% Non-GAAP Gross Margin1 84% 82% 251bps Operating Expenses2: (187) (206) (9)% Non-GAAP Operating Expenses1: (145) (150) (3)% Non-GAAP Selling and Marketing (56) (46) 20% Non-GAAP General and Administrative (71) (81) (13)% Non-GAAP Research and Development (20) (22) (11)% Net Income 42 22 95% Non-GAAP Net Income1 93 65 42% Adjusted EBITDA1 120 105 14% INVESTOR PRESENTATION | October 2025
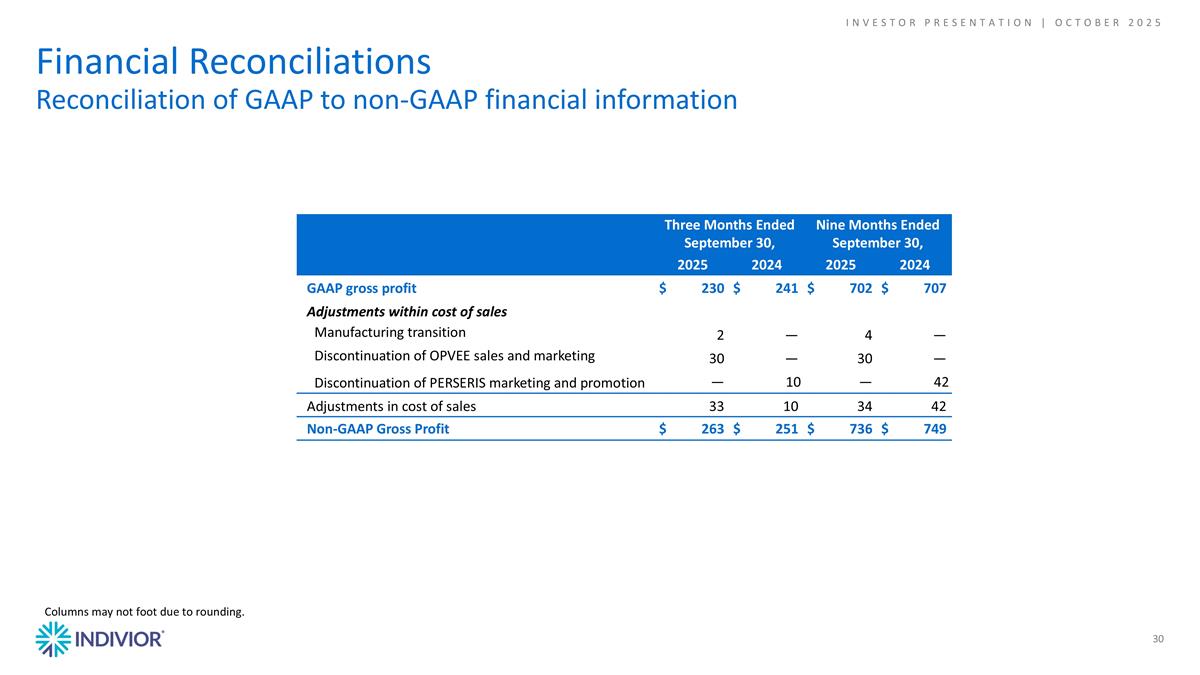
Financial Reconciliations Reconciliation of GAAP to non-GAAP financial information 30 Three Months Ended September 30, Nine Months Ended September 30, 2025 2024 2025 2024 GAAP gross profit $230 $241 $702 $707 Adjustments within cost of sales Manufacturing transition 2 — 4 — Discontinuation of OPVEE sales and marketing 30 — 30 — Discontinuation of PERSERIS marketing and promotion — 10 — 42 Adjustments in cost of sales 33 10 34 42 Non-GAAP Gross Profit $263 $251 $736 $749 Columns may not foot due to rounding. INVESTOR PRESENTATION | October 2025

Financial Reconciliations Reconciliation of GAAP to non-GAAP financial information 31 Three Months Ended September 30, Nine Months Ended September 30, 2025 2024 2025 2024 GAAP operating expenses $187 $206 $521 $715 Share-based compensation 6 6 21 18 Corporate initiative transition1 35 — 41 — Discontinuation of PERSERIS marketing and promotion — 9 — 12 Acquisition-related costs2 — — — 4 U.S. listing costs — — — 4 Litigation settlement expense — 36 1 196 Mark-to-market on equity investments — 5 — 5 Less: Adjustments in operating expenses 42 56 62 239 Non-GAAP operating expenses $145 $150 $459 $476 Columns may not foot due to rounding. 1Includes legal and consulting costs, impairment related to planned facility closures and expenses related to severance. 2Non-recurring costs related to the acquisition and integration of the aseptic manufacturing site acquired in November 2023. INVESTOR PRESENTATION | October 2025

Financial Reconciliations Reconciliation of GAAP to non-GAAP financial information 32 Three Months Ended September 30, Nine Months Ended September 30, 2025 2024 2025 2024 GAAP general and administrative expenses $94 $87 $236 $250 Adjustments within G&A Share-based compensation 6 6 21 18 Corporate initiative transition1 16 — 22 — Acquisition-related costs2 — — — 4 U.S. listing costs — — — 4 Less: Adjustments in general and administrative expenses 23 6 42 26 Non-GAAP general and administrative expenses $71 $81 $194 $224 Columns may not foot due to rounding. 1Includes legal and consulting costs and expenses related to severance. 2Non-recurring costs related to the acquisition and integration of the aseptic manufacturing site acquired in November 2023. INVESTOR PRESENTATION | October 2025
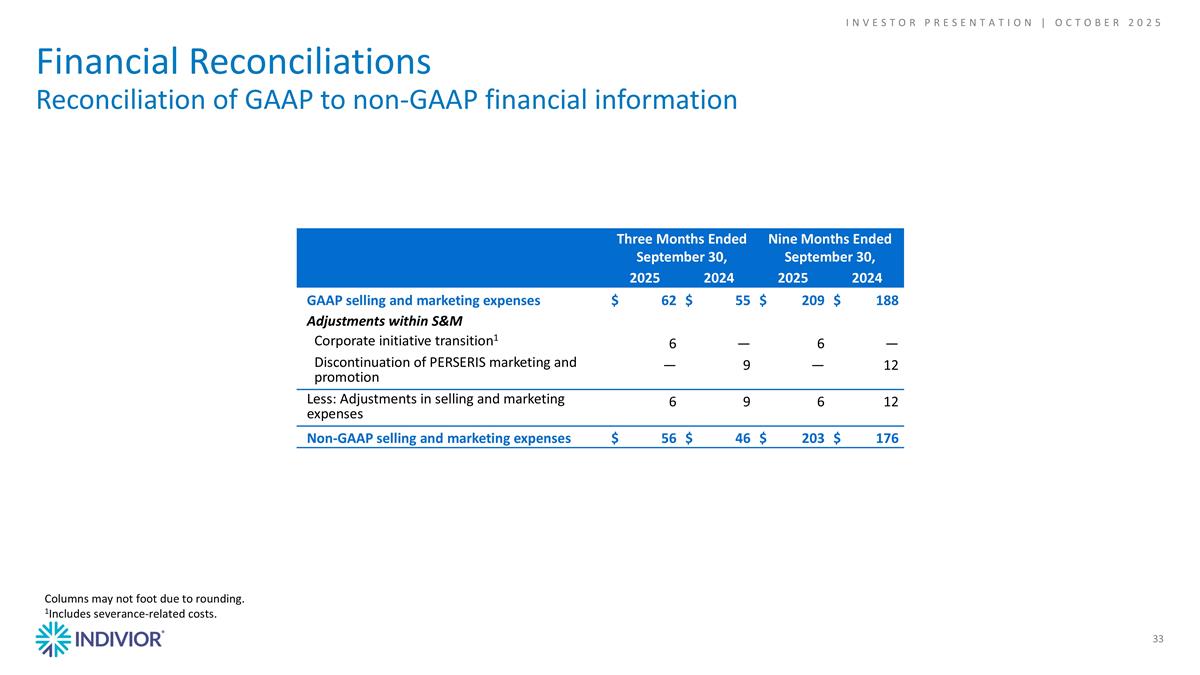
Financial Reconciliations Reconciliation of GAAP to non-GAAP financial information 33 Three Months Ended September 30, Nine Months Ended September 30, 2025 2024 2025 2024 GAAP selling and marketing expenses $62 $55 $209 $188 Adjustments within S&M Corporate initiative transition1 6 — 6 — Discontinuation of PERSERIS marketing and promotion — 9 — 12 Less: Adjustments in selling and marketing expenses 6 9 6 12 Non-GAAP selling and marketing expenses $56 $46 $203 $176 Columns may not foot due to rounding. 1Includes severance-related costs. INVESTOR PRESENTATION | October 2025
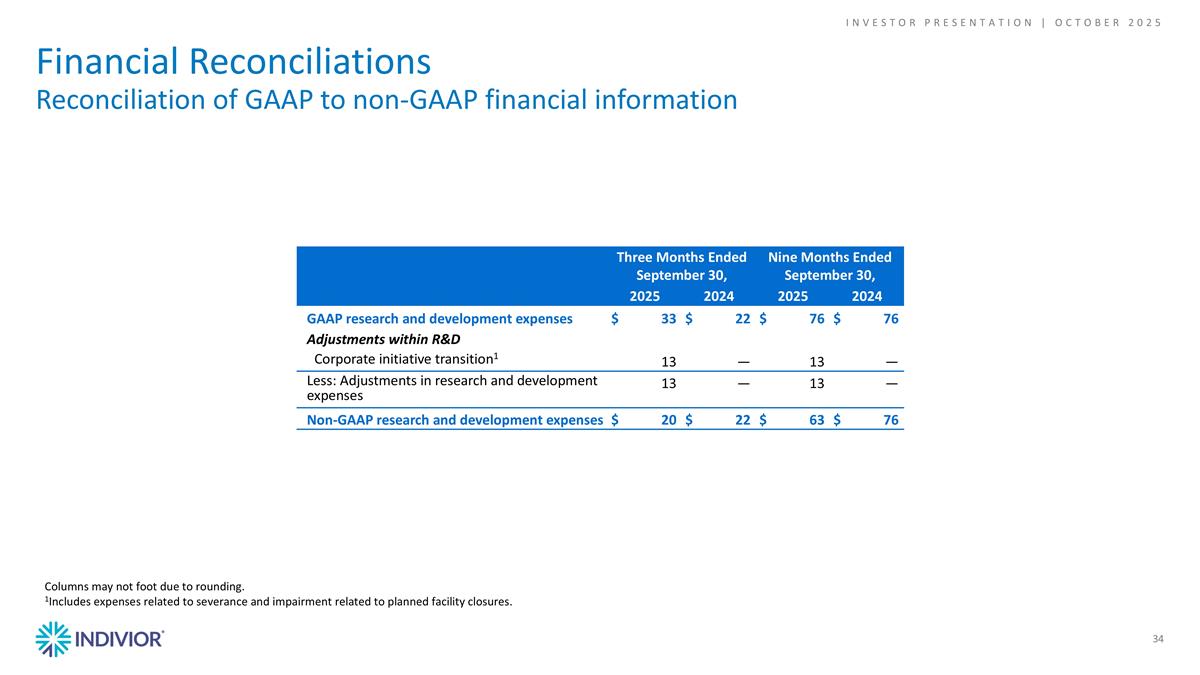
Financial Reconciliations Reconciliation of GAAP to non-GAAP financial information 34 Three Months Ended September 30, Nine Months Ended September 30, 2025 2024 2025 2024 GAAP research and development expenses $33 $22 $76 $76 Adjustments within R&D Corporate initiative transition1 13 — 13 — Less: Adjustments in research and development expenses 13 — 13 — Non-GAAP research and development expenses $20 $22 $63 $76 Columns may not foot due to rounding. 1Includes expenses related to severance and impairment related to planned facility closures. INVESTOR PRESENTATION | October 2025
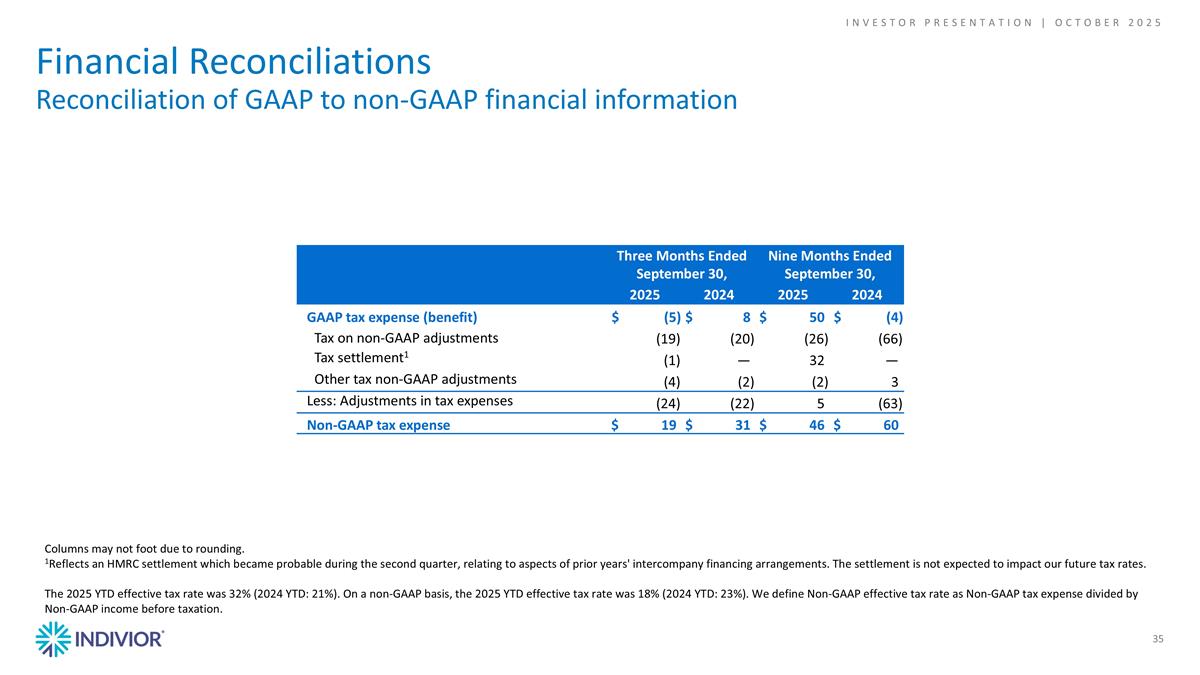
Financial Reconciliations Reconciliation of GAAP to non-GAAP financial information 35 Three Months Ended September 30, Nine Months Ended September 30, 2025 2024 2025 2024 GAAP tax expense (benefit) $(5) $8 $50 $(4) Tax on non-GAAP adjustments (19) (20) (26) (66) Tax settlement1 (1) — 32 — Other tax non-GAAP adjustments (4) (2) (2) 3 Less: Adjustments in tax expenses (24) (22) 5 (63) Non-GAAP tax expense $19 $31 $46 $60 Columns may not foot due to rounding. 1Reflects an HMRC settlement which became probable during the second quarter, relating to aspects of prior years' intercompany financing arrangements. The settlement is not expected to impact our future tax rates. The 2025 YTD effective tax rate was 32% (2024 YTD: 21%). On a non-GAAP basis, the 2025 YTD effective tax rate was 18% (2024 YTD: 23%). We define Non-GAAP effective tax rate as Non-GAAP tax expense divided by Non-GAAP income before taxation. INVESTOR PRESENTATION | October 2025
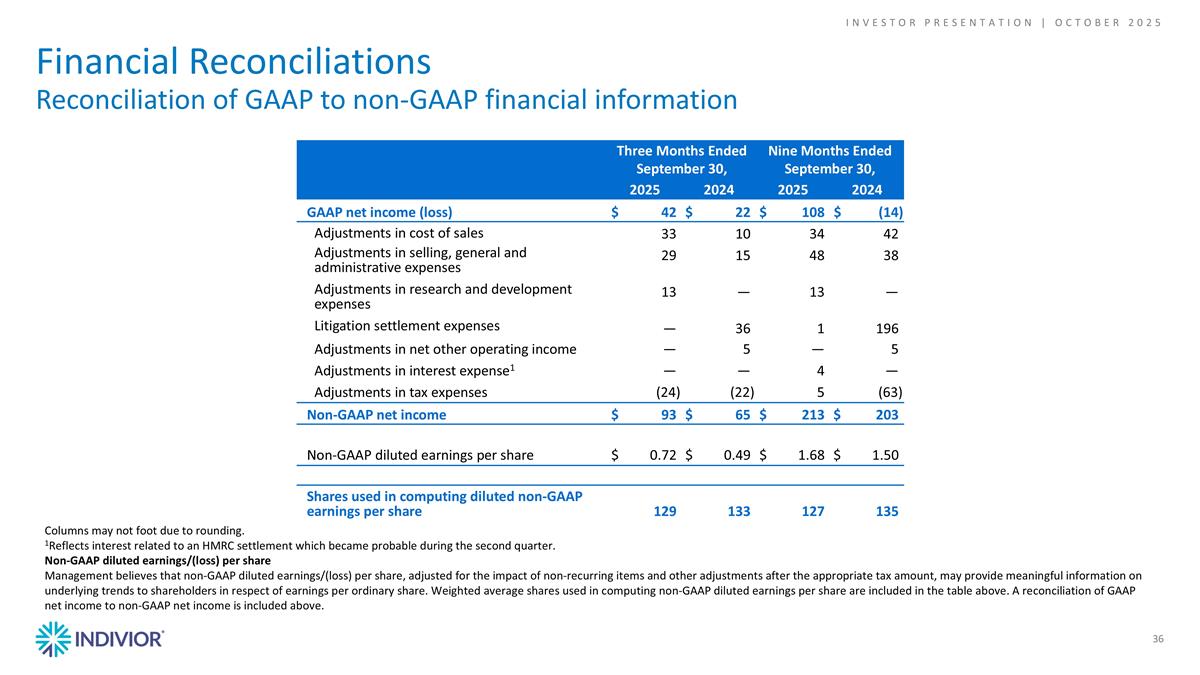
Financial Reconciliations Reconciliation of GAAP to non-GAAP financial information 36 Three Months Ended September 30, Nine Months Ended September 30, 2025 2024 2025 2024 GAAP net income (loss) $42 $22 $108 $(14) Adjustments in cost of sales 33 10 34 42 Adjustments in selling, general and administrative expenses 29 15 48 38 Adjustments in research and development expenses 13 — 13 — Litigation settlement expenses — 36 1 196 Adjustments in net other operating income — 5 — 5 Adjustments in interest expense1 — — 4 — Adjustments in tax expenses (24) (22) 5 (63) Non-GAAP net income $93 $65 $213 $203 Non-GAAP diluted earnings per share $0.72 $0.49 $1.68 $1.50 Shares used in computing diluted non-GAAP earnings per share 129 133 127 135 Columns may not foot due to rounding. 1Reflects interest related to an HMRC settlement which became probable during the second quarter. Non-GAAP diluted earnings/(loss) per share Management believes that non-GAAP diluted earnings/(loss) per share, adjusted for the impact of non-recurring items and other adjustments after the appropriate tax amount, may provide meaningful information on underlying trends to shareholders in respect of earnings per ordinary share. Weighted average shares used in computing non-GAAP diluted earnings per share are included in the table above. A reconciliation of GAAP net income to non-GAAP net income is included above. INVESTOR PRESENTATION | October 2025
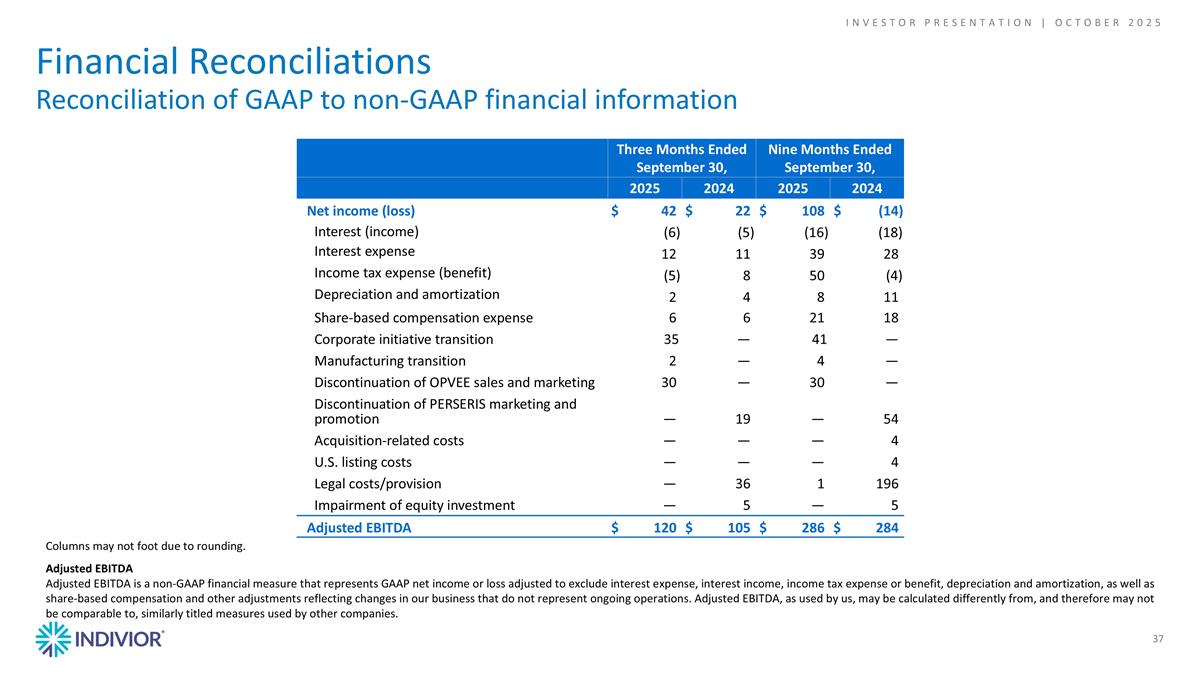
Financial Reconciliations Reconciliation of GAAP to non-GAAP financial information 37 Three Months Ended September 30, Nine Months Ended September 30, 2025 2024 2025 2024 Net income (loss) $42 $22 $108 $(14) Interest (income) (6) (5) (16) (18) Interest expense 12 11 39 28 Income tax expense (benefit) (5) 8 50 (4) Depreciation and amortization 2 4 8 11 Share-based compensation expense 6 6 21 18 Corporate initiative transition 35 — 41 — Manufacturing transition 2 — 4 — Discontinuation of OPVEE sales and marketing 30 — 30 — Discontinuation of PERSERIS marketing and promotion — 19 — 54 Acquisition-related costs — — — 4 U.S. listing costs — — — 4 Legal costs/provision — 36 1 196 Impairment of equity investment — 5 — 5 Adjusted EBITDA $120 $105 $286 $284 Columns may not foot due to rounding. Adjusted EBITDA Adjusted EBITDA is a non-GAAP financial measure that represents GAAP net income or loss adjusted to exclude interest expense, interest income, income tax expense or benefit, depreciation and amortization, as well as share-based compensation and other adjustments reflecting changes in our business that do not represent ongoing operations. Adjusted EBITDA, as used by us, may be calculated differently from, and therefore may not be comparable to, similarly titled measures used by other companies. INVESTOR PRESENTATION | October 2025
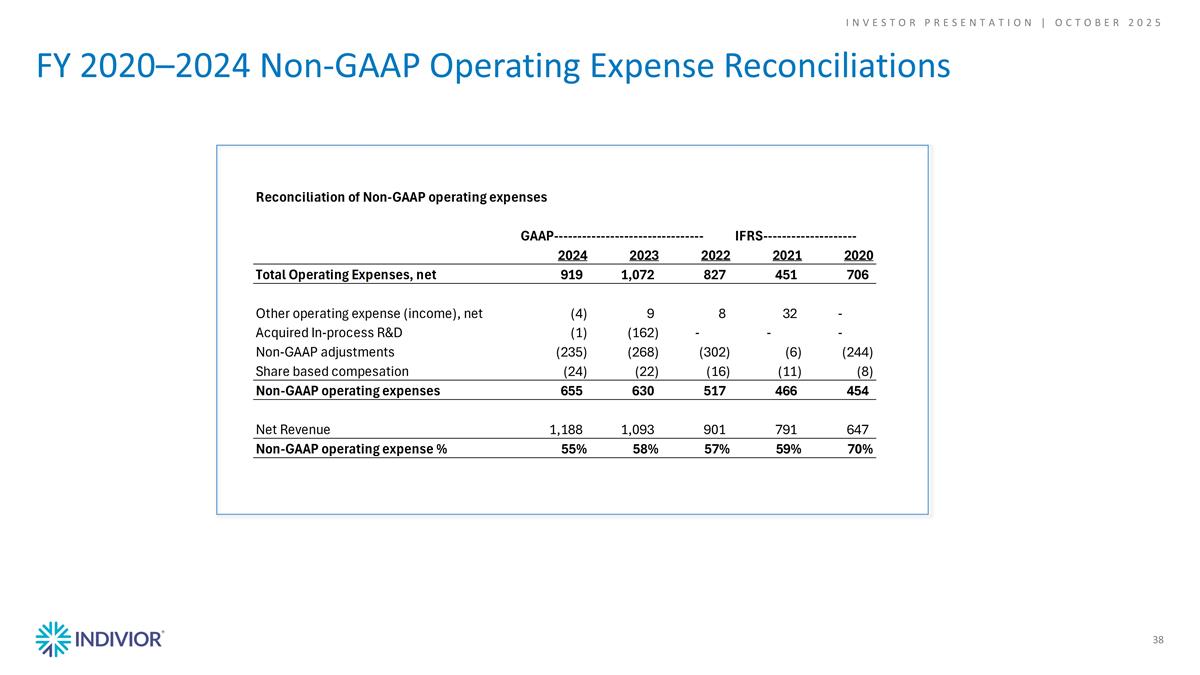
FY 2020–2024 Non-GAAP Operating Expense Reconciliations 38 INVESTOR PRESENTATION | October 2025 Q1 2024 Q2 2024 Q3 2024 Q4 2024 FY 2024 Reconciliation: IFRS to GAAP exceptionals within operating profit Q4 Reclassification US GAAP Operating Profit $73.209536594165002 $-,119.2966617134996 $33.694954031548903 $44.122005667998202 $31.729834580212504 IFRS exceptionals within operating profit 335 -2.8991669999999998 Debt refinance deferred costs write down (reclassified from SG&A exceptionals account back to interest expense) Adjustments within cost of sales Amortisation of acquired intangibles -11 Amortization of acquired intangibles 0 0 0 0 0 Perseris inventory write-ups 0 Discontinuation of sales & promotion of PERSERIS 0 32 10 -2 40 Note 1 Perseris intangible impairment -9 Total adjustments within cost of sales 0 32 10 -2 40 Click intangible impairment -7 Adjustments within SG&A 0 Aelis intangible impairment -28 Discontinuation of sales & promotion of PERSERIS 3 9 0 12 Note 2 Optima filler 1 Impairment of products in development 0 0 0 GAAP exceptionals within operating profit 281 Acquisition-related costs 2 2 0 0 4 check 0 U.S. listing costs 0 4 0 0 4 Restructuring - severance and other 0 0 0 12 12 1 different to IFRS re Optima filler Debt refinancing costs 0 0 0 4 4 Total adjustments within SG&A 2 9 9 16 36 Adjustments within Legal Legal costs/provision 0 160 36 -1 195 Total adjustments within Legal 0 160 36 -1 195 Adjustments within IPR&D Optima filler 1 1 Total adjustments within R&D 0 0 0 1 1 Adjustments within R&D Click contract termination fee 0 0 0 4 4 Total adjustments within R&D 0 0 0 4 4 Adjustments within net other operating income 0 Mark-to-market on equity investments 0 0 5 0 5 Income recognized in relation to a supply agreement 0 0 0 0 0 Insurance reimbursement 0 0 0 0 0 Total adjustments within other net operating income 0 0 5 0 5 Total adjustments within operating profit 2 201 60 18 281 GAAP Adjusted Operating Profit $75.209536594165002 $81.703338286500397 $93.694954031548903 $62.122005667998202 $312.72983458021253 1 Inventory write-ups (gain in IFRS) are not included in US GAAP financials. Difference between IFRS and GAAP COGS exceptionals is inventory write-ups (ie effect is additional exceptionals expense for GAAP Q2 $1m, Q3 $2m, Q4 $2m) 2 $2m severance recorded in Q2 vs Q3 for GAAP, timing difference only. No impact on full year. 42222 COGS exceptionals 8.0715786742299997E-2 32.590125518868099 10.68720459 -2.5122844623255998 40.8457614332848 76202 SG&A exceptionals 1.74639251 166.71154881000001 47.890584429999997 10.272734659629601 226.6212604096296 76203SG&A exceptionals 0 2.0943420000000001 3.2298322599999998 12.1310416278366 17.455215887836601 Total exceptionals 1.8271082967423 201.39601632886811 61.807621279999999 19.891491825140601 284.92223773075102 Reclass debt def costs amortisation -2.8991669999999998 -2.8991669999999998 Adjusted total exceptionals 1.8271082967423 201.39601632886811 61.807621279999999 16.992324825140603 282.02307073075104 check total -0.17289170325769998 0.39601632886811444 1.8076212799999993 -1.0076751748593971 1.0230707307510443 Reconciliation of EBITDA GAAP-------------------------------------------------------------------- IFRS--------------------- Q2 2025 Q1 2025 FY 2024 FY 2023 FY 2022 FY 2021 FY 2020 Net Income 18 47 7 -126 -42 205 -148 Revised 10Q Add Back: Interest Income -6 -4 -23 -43 -19 -4 -9 10K Interest Expense 15 12 41 35 27 27 26 10K Income Tax Expense / (Benefit) 44 11 13 -19 -43 -15 -25 Revised 10Q Non-GAAP adjustments in Operations 6 3 280 265 297 -25 244 IFRS to GAAP file Dep/Amort (excluding ROU Amort) 3 3 16 11 9 15 18 10K; 2021 Press Release - excluding ROU from Priyanka file Share-Based Compensation Expense 8 6 24 21 16 11 8 10K Opiant Transaction 162 Total Adjustments 70 31 351 432 287 9 262 EBITDA 88 78 358 306 245 214 114 Match 310? FY 2023 Income Statement: IFRS to US GAAP Bridge FY 2023 ($ millions, except per share data) US GAAP Adjustments IFRS Caption IFRS Total Change Reclassification US GAAP Caption US GAAP Total Net revenue $1,093 0 0 Net revenue $1,093 Cost of sales -,186 12 0 Cost of sales -,174 Gross profit 907 12 0 Gross profit 919 Selling, general & administrative -,811 3 239 Selling, general & administrative -,569 Research & development -,106 -,171 161.56400000000002 Research & development -,116 0 0 -,161.56400000000002 Acquired in-process research & development -,161.56400000000002 0 0 -,239 Litigation settlement expenses -,239 Other operating income 6 3 0 Other operating income 9 Operating profit -4 -,153 0 Income from operations -,156 Finance income 43 0 0 Interest income 43 Finance expense -38 3 0 Interest expense -35 Net finance expense 5 3 0 Interest expense, net 8 0 0 0 Other income 0 Profit before taxation 1 -,150 0 Income before income taxes -,149 Income tax benefit 1 21 0 Provision for income taxes 22 Net income $2 -,129 0 Net income $-,127 Diluted EPS $0.01 Diluted EPS $-0.95 IFRS Net Income $2 US GAAP Net Income $-,127 Adjustments within cost of sales Adjustments within cost of sales Amortization of acquired intangibles 8 Amortization of acquired intangibles 0 Total adjustments within cost of sales 8 Total adjustments within cost of sales 0 Adjustments within cost of SG&A Adjustments within cost of SG&A Legal costs/provision 240 Legal costs/provision 240 -1 Acquisition-related costs 22 Acquisition-related costs 22 537 U.S. listing costs 6 U.S. listing costs 6 Total adjustments within SG&A 268 Total adjustments within SG&A 268 Adjustments within net other operating income Adjustments within net other operating income Income recognized in relation to a supply agreement -3 Income recognized in relation to a supply agreement -3 Insurance reimbursement 0 Insurance reimbursement 0 Total adjustments within other net operating income -3 Total adjustments within other net operating income -3 Total adjustments before taxes 273 Total adjustments before taxes 265 Adjustments within tax Adjustments within tax Tax on adjustments -63 Tax on adjustments -61 Tax adjustments 11 Tax adjustments 3 Total adjustments within tax -52 Total adjustments within tax -58 Total adjustments 221 Total adjustments 207 IFRS Adjusted Net Income $223 GAAP Adjusted Net Income $80 Adjusted Diluted EPS $1.57 Adjusted Diluted EPS $0.56000000000000005 * - Columns and rows may not add and may change in final reporting due to rounding Q1 2024 Q2 2024 Q3 2024 Q4 2024 FY 2024 Q1 2025 Q2 2025 TTM Total Gross Debt 350 341 Net income (loss) 61.4 -97.293182069999986 21.5 21 7 47 18.101428300000002 107.60142830000001 Adjustments: 0 0 0 0 0 0 0 0 Interest income -7 -5.6497671480000005 -5 -5 -23 -4 -5.7200703859999997 -19.720070386 Interest expense 9 8.5183084099999995 11 13 41 12 15.398883060000001 51.398883060000003 Income tax expense (benefit) 11 -23.352700989999999 8 17 13 11 44.203073189999998 80.203073189999998 Depreciation/amortization (excluding ROU amortization) 3.1248689999999999 4 3.6567029999999998 5.8588120000000004 16.348337000000001 3 2.5500189999999998 15.065534 Non-GAAP adjustments in operating income 2 201 60 17 280 3 5.7477989999999997 85.747799000000001 Share-based compensation expense 6 6 6 6 24 6 7.9809182120000006 25.980918211999999 Total Adjustments 24.124869 190.51584027200002 83.656702999999993 53.858812 351.34833700000001 31 70.16062207600001 238.676137076 0 0 0 0 0 0 0 0 Adjusted EBITDA 85.524868999999995 93.222658202000005 105.15670299999999 74.858812 358.34833700000001 78 88.262050376000005 346.27756537599998 Adjusted Leverage 0.97670329079830498 0.98475914727461644 TTM FY Q2'2024 Q3'2024 Q4'2025 Q1'2025 TTM US 254 261 251 222 988 0.84444444444444444 US 1008 0.84848484848484851 ROW 45 46 47 44 182 0.15555555555555556 ROW 179 0.15067340067340068 299 307 298 266 1170 1188 Total Sublocade 192 191 194 176 753 0.64358974358974363 Total Sublocade 756 0.64615384615384619 PERSERIS 13 8 9 4 34 2.9% PERSERIS 40 3.4% OPVEE 15 15 1.3% OPVEE 15 1.3% ROW - Ex 32 33 33 31 129 0.11025641025641025 ROW - Ex 127 0.10854700854700855 SUBOXONE 62 60 62 55 239 0.20427350427350427 SUBOXONE 250 0.21367521367521367 299 307 298 266 1170 100.0% 1188 1.0153846153846153 FY 2022 Income Statement: IFRS to US GAAP Bridge FY 2022 ($ millions, except per share data) US GAAP Adjustments IFRS Caption IFRS Total Change Reclassification US GAAP Caption US GAAP Total Net revenue $901 0 0 Net revenue $901 Cost of sales -,159 8 0 Cost of sales -,151 Gross profit 742 8 0 Gross profit 749 Selling, general & administrative -,763 -2 296 Selling, general & administrative -,469 Research & development -72 -2 0 Research & development -74 0 0 0 Acquired in-process research & development 0 0 0 -,296 Litigation settlement expenses -,296 Other operating income 8 0 0 Other operating income 8 Operating profit -85 4 0 Income from operations -81 Finance income 19 0 0 Interest income 19 Finance expense -29 2 0 Interest expense -27 Net finance expense -10 2 0 Interest expense, net -8 0 0 0 Other income 0 Profit before taxation -95 6 0 Income before income taxes -89 Income tax benefit 42 3 0 Provision for income taxes 44 Net income $-53 9 0 Net income -44 Diluted EPS $-0.38 Diluted EPS $-0.32 IFRS Net Income $-53 US GAAP Net Income $-44 Adjustments within cost of sales Adjustments within cost of sales Amortization of acquired intangibles 0 Amortization of acquired intangibles $0 Total adjustments within cost of sales 0 Total adjustments within cost of sales 0 Adjustments within SG&A Adjustments within SG&A Legal costs/provision 296 Legal costs/provision 296 Acquisition-related costs 0 Acquisition-related costs 0 U.S. listing costs 6 U.S. listing costs 6 Total adjustments within SG&A 302 Total adjustments within SG&A 302 Adjustments within net other operating income Adjustments within net other operating income Income recognized in relation to a supply agreement 0 Income recognized in relation to a supply agreement 0 Insurance reimbursement -5 Insurance reimbursement -5 Total adjustments within other net operating income -5 Total adjustments within other net operating income -5 Total adjustments before taxes 297 Total adjustments before taxes 297 Adjustments within tax Adjustments within tax Tax on adjustments -57 Tax on adjustments -57 Tax adjustments -18 Tax adjustments -20 Total adjustments within tax -75 Total adjustments within tax -77 Total adjustments 222 Total adjustments 220 IFRS Adjusted Net Income $169 GAAP Adjusted Net Income $176 Adjusted diluted EPS $1.1599999999999999 Adjusted diluted EPS $1.21 * - Columns and rows may not add and may change in final reporting due to rounding Reconciliation of Net Income to Non-GAAP Operating Income ($m) GAAP-------------------------------- IFRS-------------------- 2024 2023 2022 2021 2020 Net Income 7 -126 -42 205 -148 Revised 10Q Net Finance Income -23 -43 -19 -4 -9 10K Net Finance Expense 41 35 27 27 26 10K Income Tax Expense 13 -19 -43 -15 -25 Revised 10Q Total Adjustments 281 265 297 -25 244 2021-2020 from press Q4 2021 press release - total exceptionals Acquired In-process R&D 1 162 - - - Non-GAAP Operating Income 320 274 220 188 88 Net Revenue 1,188 1,093 901 791 647 Non-GAAP Operating Margin 0.26936026936026936 0.25068618481244281 0.24417314095449499 0.23767383059418457 0.13601236476043277 Reconciliation of Non-GAAP operating expenses GAAP-------------------------------- IFRS-------------------- 2024 2023 2022 2021 2020 Total Operating Expenses, net 919 1072 827 451 706 Other operating expense (income), net -4 9 8 32 - Acquired In-process R&D -1 -161.56400000000002 - - - Non-GAAP adjustments -235 -268 -302 -6 -244 Share based compesation -24 -22 -16 -11 -8 Non-GAAP operating expenses 655 630.43599999999992 517 466 454 Net Revenue 1,188 1,093 901 791 647 Non-GAAP operating expense % 0.55134680134680136 0.5767941445562671 0.57380688124306323 0.58912768647281921 0.70170015455950541 Q1 2024 Q2 2024 Q3 2024 Q4 2024 FY 2024 Reconciliation: IFRS to GAAP exceptionals within operating profit Q4 Reclassification US GAAP Operating Profit $73.209536594165002 $-,119.2966617134996 $33.694954031548903 $44.122005667998202 $31.729834580212504 IFRS exceptionals within operating profit 335 -2.8991669999999998 Debt refinance deferred costs write down (reclassified from SG&A exceptionals account back to interest expense) Adjustments within cost of sales Amortisation of acquired intangibles -11 Amortization of acquired intangibles 0 0 0 0 0 Perseris inventory write-ups 0 Discontinuation of sales & promotion of PERSERIS 0 32 10 -2 40 Note 1 Perseris intangible impairment -9 Total adjustments within cost of sales 0 32 10 -2 40 Click intangible impairment -7 Adjustments within SG&A 0 Aelis intangible impairment -28 Discontinuation of sales & promotion of PERSERIS 3 9 0 12 Note 2 Optima filler 1 Impairment of products in development 0 0 0 GAAP exceptionals within operating profit 281 Acquisition-related costs 2 2 0 0 4 check 0 U.S. listing costs 0 4 0 0 4 Restructuring - severance and other 0 0 0 12 12 1 different to IFRS re Optima filler Debt refinancing costs 0 0 0 4 4 Total adjustments within SG&A 2 9 9 16 36 Adjustments within Legal Legal costs/provision 0 160 36 -1 195 Total adjustments within Legal 0 160 36 -1 195 Adjustments within IPR&D Optima filler 1 1 Total adjustments within R&D 0 0 0 1 1 Adjustments within R&D Click contract termination fee 0 0 0 4 4 Total adjustments within R&D 0 0 0 4 4 Adjustments within net other operating income 0 Mark-to-market on equity investments 0 0 5 0 5 Income recognized in relation to a supply agreement 0 0 0 0 0 Insurance reimbursement 0 0 0 0 0 Total adjustments within other net operating income 0 0 5 0 5 Total adjustments within operating profit 2 201 60 18 281 GAAP Adjusted Operating Profit $75.209536594165002 $81.703338286500397 $93.694954031548903 $62.122005667998202 $312.72983458021253 1 Inventory write-ups (gain in IFRS) are not included in US GAAP financials. Difference between IFRS and GAAP COGS exceptionals is inventory write-ups (ie effect is additional exceptionals expense for GAAP Q2 $1m, Q3 $2m, Q4 $2m) 2 $2m severance recorded in Q2 vs Q3 for GAAP, timing difference only. No impact on full year. 42222 COGS exceptionals 8.0715786742299997E-2 32.590125518868099 10.68720459 -2.5122844623255998 40.8457614332848 76202 SG&A exceptionals 1.74639251 166.71154881000001 47.890584429999997 10.272734659629601 226.6212604096296 76203SG&A exceptionals 0 2.0943420000000001 3.2298322599999998 12.1310416278366 17.455215887836601 Total exceptionals 1.8271082967423 201.39601632886811 61.807621279999999 19.891491825140601 284.92223773075102 Reclass debt def costs amortisation -2.8991669999999998 -2.8991669999999998 Adjusted total exceptionals 1.8271082967423 201.39601632886811 61.807621279999999 16.992324825140603 282.02307073075104 check total -0.17289170325769998 0.39601632886811444 1.8076212799999993 -1.0076751748593971 1.0230707307510443 Reconciliation of EBITDA GAAP-------------------------------------------------------------------- IFRS--------------------- Q2 2025 Q1 2025 FY 2024 FY 2023 FY 2022 FY 2021 FY 2020 Net Income 18 47 7 -126 -42 205 -148 Revised 10Q Add Back: Interest Income -6 -4 -23 -43 -19 -4 -9 10K Interest Expense 15 12 41 35 27 27 26 10K Income Tax Expense / (Benefit) 44 11 13 -19 -43 -15 -25 Revised 10Q Non-GAAP adjustments in Operations 6 3 280 265 297 -25 244 IFRS to GAAP file Dep/Amort (excluding ROU Amort) 3 3 16 11 9 15 18 10K; 2021 Press Release - excluding ROU from Priyanka file Share-Based Compensation Expense 8 6 24 21 16 11 8 10K Opiant Transaction 162 Total Adjustments 70 31 351 432 287 9 262 EBITDA 88 78 358 306 245 214 114 Match 310? FY 2023 Income Statement: IFRS to US GAAP Bridge FY 2023 ($ millions, except per share data) US GAAP Adjustments IFRS Caption IFRS Total Change Reclassification US GAAP Caption US GAAP Total Net revenue $1,093 0 0 Net revenue $1,093 Cost of sales -,186 12 0 Cost of sales -,174 Gross profit 907 12 0 Gross profit 919 Selling, general & administrative -,811 3 239 Selling, general & administrative -,569 Research & development -,106 -,171 161.56400000000002 Research & development -,116 0 0 -,161.56400000000002 Acquired in-process research & development -,161.56400000000002 0 0 -,239 Litigation settlement expenses -,239 Other operating income 6 3 0 Other operating income 9 Operating profit -4 -,153 0 Income from operations -,156 Finance income 43 0 0 Interest income 43 Finance expense -38 3 0 Interest expense -35 Net finance expense 5 3 0 Interest expense, net 8 0 0 0 Other income 0 Profit before taxation 1 -,150 0 Income before income taxes -,149 Income tax benefit 1 21 0 Provision for income taxes 22 Net income $2 -,129 0 Net income $-,127 Diluted EPS $0.01 Diluted EPS $-0.95 IFRS Net Income $2 US GAAP Net Income $-,127 Adjustments within cost of sales Adjustments within cost of sales Amortization of acquired intangibles 8 Amortization of acquired intangibles 0 Total adjustments within cost of sales 8 Total adjustments within cost of sales 0 Adjustments within cost of SG&A Adjustments within cost of SG&A Legal costs/provision 240 Legal costs/provision 240 -1 Acquisition-related costs 22 Acquisition-related costs 22 537 U.S. listing costs 6 U.S. listing costs 6 Total adjustments within SG&A 268 Total adjustments within SG&A 268 Adjustments within net other operating income Adjustments within net other operating income Income recognized in relation to a supply agreement -3 Income recognized in relation to a supply agreement -3 Insurance reimbursement 0 Insurance reimbursement 0 Total adjustments within other net operating income -3 Total adjustments within other net operating income -3 Total adjustments before taxes 273 Total adjustments before taxes 265 Adjustments within tax Adjustments within tax Tax on adjustments -63 Tax on adjustments -61 Tax adjustments 11 Tax adjustments 3 Total adjustments within tax -52 Total adjustments within tax -58 Total adjustments 221 Total adjustments 207 IFRS Adjusted Net Income $223 GAAP Adjusted Net Income $80 Adjusted Diluted EPS $1.57 Adjusted Diluted EPS $0.56000000000000005 * - Columns and rows may not add and may change in final reporting due to rounding Q1 2024 Q2 2024 Q3 2024 Q4 2024 FY 2024 Q1 2025 Q2 2025 TTM Total Gross Debt 350 341 Net income (loss) 61.4 -97.293182069999986 21.5 21 7 47 18.101428300000002 107.60142830000001 Adjustments: 0 0 0 0 0 0 0 0 Interest income -7 -5.6497671480000005 -5 -5 -23 -4 -5.7200703859999997 -19.720070386 Interest expense 9 8.5183084099999995 11 13 41 12 15.398883060000001 51.398883060000003 Income tax expense (benefit) 11 -23.352700989999999 8 17 13 11 44.203073189999998 80.203073189999998 Depreciation/amortization (excluding ROU amortization) 3.1248689999999999 4 3.6567029999999998 5.8588120000000004 16.348337000000001 3 2.5500189999999998 15.065534 Non-GAAP adjustments in operating income 2 201 60 17 280 3 5.7477989999999997 85.747799000000001 Share-based compensation expense 6 6 6 6 24 6 7.9809182120000006 25.980918211999999 Total Adjustments 24.124869 190.51584027200002 83.656702999999993 53.858812 351.34833700000001 31 70.16062207600001 238.676137076 0 0 0 0 0 0 0 0 Adjusted EBITDA 85.524868999999995 93.222658202000005 105.15670299999999 74.858812 358.34833700000001 78 88.262050376000005 346.27756537599998 Adjusted Leverage 0.97670329079830498 0.98475914727461644 TTM FY Q2'2024 Q3'2024 Q4'2025 Q1'2025 TTM US 254 261 251 222 988 0.84444444444444444 US 1008 0.84848484848484851 ROW 45 46 47 44 182 0.15555555555555556 ROW 179 0.15067340067340068 299 307 298 266 1170 1188 Total Sublocade 192 191 194 176 753 0.64358974358974363 Total Sublocade 756 0.64615384615384619 PERSERIS 13 8 9 4 34 2.9% PERSERIS 40 3.4% OPVEE 15 15 1.3% OPVEE 15 1.3% ROW - Ex 32 33 33 31 129 0.11025641025641025 ROW - Ex 127 0.10854700854700855 SUBOXONE 62 60 62 55 239 0.20427350427350427 SUBOXONE 250 0.21367521367521367 299 307 298 266 1170 100.0% 1188 1.0153846153846153 FY 2022 Income Statement: IFRS to US GAAP Bridge FY 2022 ($ millions, except per share data) US GAAP Adjustments IFRS Caption IFRS Total Change Reclassification US GAAP Caption US GAAP Total Net revenue $901 0 0 Net revenue $901 Cost of sales -,159 8 0 Cost of sales -,151 Gross profit 742 8 0 Gross profit 749 Selling, general & administrative -,763 -2 296 Selling, general & administrative -,469 Research & development -72 -2 0 Research & development -74 0 0 0 Acquired in-process research & development 0 0 0 -,296 Litigation settlement expenses -,296 Other operating income 8 0 0 Other operating income 8 Operating profit -85 4 0 Income from operations -81 Finance income 19 0 0 Interest income 19 Finance expense -29 2 0 Interest expense -27 Net finance expense -10 2 0 Interest expense, net -8 0 0 0 Other income 0 Profit before taxation -95 6 0 Income before income taxes -89 Income tax benefit 42 3 0 Provision for income taxes 44 Net income $-53 9 0 Net income -44 Diluted EPS $-0.38 Diluted EPS $-0.32 IFRS Net Income $-53 US GAAP Net Income $-44 Adjustments within cost of sales Adjustments within cost of sales Amortization of acquired intangibles 0 Amortization of acquired intangibles $0 Total adjustments within cost of sales 0 Total adjustments within cost of sales 0 Adjustments within SG&A Adjustments within SG&A Legal costs/provision 296 Legal costs/provision 296 Acquisition-related costs 0 Acquisition-related costs 0 U.S. listing costs 6 U.S. listing costs 6 Total adjustments within SG&A 302 Total adjustments within SG&A 302 Adjustments within net other operating income Adjustments within net other operating income Income recognized in relation to a supply agreement 0 Income recognized in relation to a supply agreement 0 Insurance reimbursement -5 Insurance reimbursement -5 Total adjustments within other net operating income -5 Total adjustments within other net operating income -5 Total adjustments before taxes 297 Total adjustments before taxes 297 Adjustments within tax Adjustments within tax Tax on adjustments -57 Tax on adjustments -57 Tax adjustments -18 Tax adjustments -20 Total adjustments within tax -75 Total adjustments within tax -77 Total adjustments 222 Total adjustments 220 IFRS Adjusted Net Income $169 GAAP Adjusted Net Income $176 Adjusted diluted EPS $1.1599999999999999 Adjusted diluted EPS $1.21 * - Columns and rows may not add and may change in final reporting due to rounding Reconciliation of Net Income to Non-GAAP Operating Income ($m) GAAP-------------------------------- IFRS-------------------- 2024 2023 2022 2021 2020 Net Income 7 -126 -42 205 -148 Revised 10Q Net Finance Income -23 -43 -19 -4 -9 10K Net Finance Expense 41 35 27 27 26 10K Income Tax Expense 13 -19 -43 -15 -25 Revised 10Q Total Adjustments 281 265 297 -25 244 2021-2020 from press Q4 2021 press release - total exceptionals Acquired In-process R&D 1 162 - - - Non-GAAP Operating Income 320 274 220 188 88 Net Revenue 1,188 1,093 901 791 647 Non-GAAP Operating Margin 0.26936026936026936 0.25068618481244281 0.24417314095449499 0.23767383059418457 0.13601236476043277 Reconciliation of Non-GAAP operating expenses GAAP-------------------------------- IFRS-------------------- 2024 2023 2022 2021 2020 Total Operating Expenses, net 919 1072 827 451 706 Other operating expense (income), net -4 9 8 32 - Acquired In-process R&D -1 -161.56400000000002 - - - Non-GAAP adjustments -235 -268 -302 -6 -244 Share based compesation -24 -22 -16 -11 -8 Non-GAAP operating expenses 655 630.43599999999992 517 466 454 Net Revenue 1,188 1,093 901 791 647 Non-GAAP operating expense % 0.55134680134680136 0.5767941445562671 0.57380688124306323 0.58912768647281921 0.70170015455950541
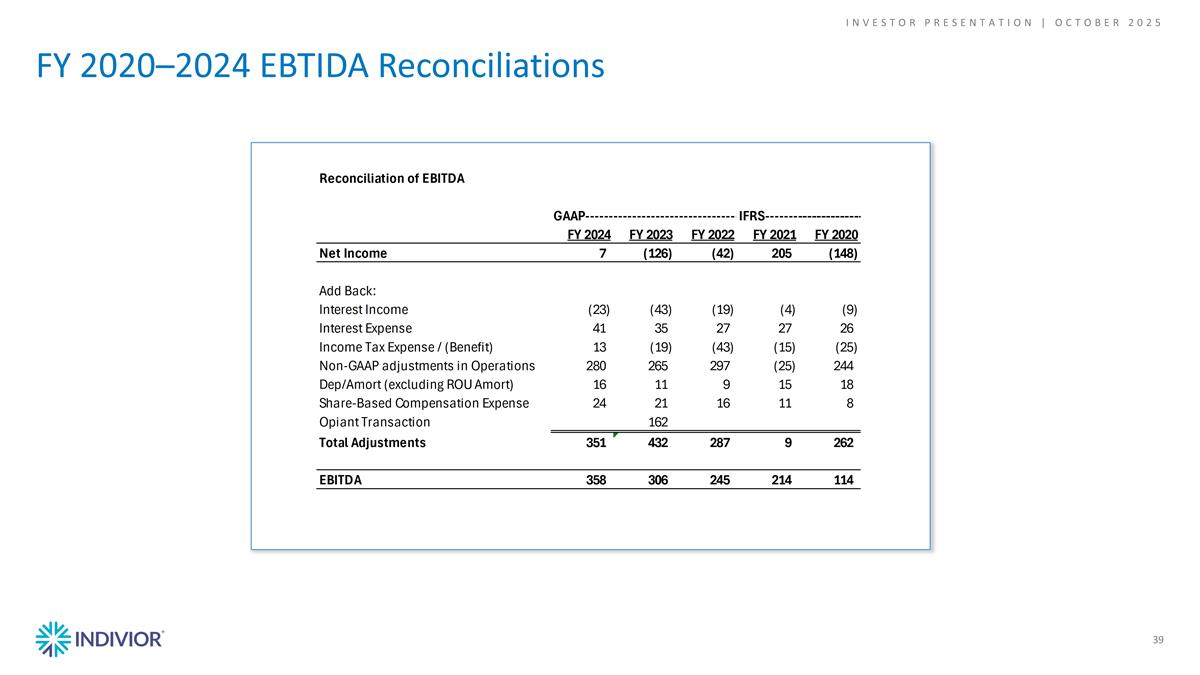
FY 2020–2024 EBTIDA Reconciliations 39 INVESTOR PRESENTATION | October 2025 Q1 2024 Q2 2024 Q3 2024 Q4 2024 FY 2024 Reconciliation: IFRS to GAAP exceptionals within operating profit Q4 Reclassification US GAAP Operating Profit $73.209536594165002 $-,119.2966617134996 $33.694954031548903 $44.122005667998202 $31.729834580212504 IFRS exceptionals within operating profit 335 -2.8991669999999998 Debt refinance deferred costs write down (reclassified from SG&A exceptionals account back to interest expense) Adjustments within cost of sales Amortisation of acquired intangibles -11 Amortization of acquired intangibles 0 0 0 0 0 Perseris inventory write-ups 0 Discontinuation of sales & promotion of PERSERIS 0 32 10 -2 40 Note 1 Perseris intangible impairment -9 Total adjustments within cost of sales 0 32 10 -2 40 Click intangible impairment -7 Adjustments within SG&A 0 Aelis intangible impairment -28 Discontinuation of sales & promotion of PERSERIS 3 9 0 12 Note 2 Optima filler 1 Impairment of products in development 0 0 0 GAAP exceptionals within operating profit 281 Acquisition-related costs 2 2 0 0 4 check 0 U.S. listing costs 0 4 0 0 4 Restructuring - severance and other 0 0 0 12 12 1 different to IFRS re Optima filler Debt refinancing costs 0 0 0 4 4 Total adjustments within SG&A 2 9 9 16 36 Adjustments within Legal Legal costs/provision 0 160 36 -1 195 Total adjustments within Legal 0 160 36 -1 195 Adjustments within IPR&D Optima filler 1 1 Total adjustments within R&D 0 0 0 1 1 Adjustments within R&D Click contract termination fee 0 0 0 4 4 Total adjustments within R&D 0 0 0 4 4 Adjustments within net other operating income 0 Mark-to-market on equity investments 0 0 5 0 5 Income recognized in relation to a supply agreement 0 0 0 0 0 Insurance reimbursement 0 0 0 0 0 Total adjustments within other net operating income 0 0 5 0 5 Total adjustments within operating profit 2 201 60 18 281 GAAP Adjusted Operating Profit $75.209536594165002 $81.703338286500397 $93.694954031548903 $62.122005667998202 $312.72983458021253 1 Inventory write-ups (gain in IFRS) are not included in US GAAP financials. Difference between IFRS and GAAP COGS exceptionals is inventory write-ups (ie effect is additional exceptionals expense for GAAP Q2 $1m, Q3 $2m, Q4 $2m) 2 $2m severance recorded in Q2 vs Q3 for GAAP, timing difference only. No impact on full year. 42222 COGS exceptionals 8.0715786742299997E-2 32.590125518868099 10.68720459 -2.5122844623255998 40.8457614332848 76202 SG&A exceptionals 1.74639251 166.71154881000001 47.890584429999997 10.272734659629601 226.6212604096296 76203SG&A exceptionals 0 2.0943420000000001 3.2298322599999998 12.1310416278366 17.455215887836601 Total exceptionals 1.8271082967423 201.39601632886811 61.807621279999999 19.891491825140601 284.92223773075102 Reclass debt def costs amortisation -2.8991669999999998 -2.8991669999999998 Adjusted total exceptionals 1.8271082967423 201.39601632886811 61.807621279999999 16.992324825140603 282.02307073075104 check total -0.17289170325769998 0.39601632886811444 1.8076212799999993 -1.0076751748593971 1.0230707307510443 Reconciliation of EBITDA GAAP-------------------------------------------------------------------- IFRS--------------------- Q2 2025 Q1 2025 FY 2024 FY 2023 FY 2022 FY 2021 FY 2020 Net Income 18 47 7 -126 -42 205 -148 Revised 10Q Add Back: Interest Income -6 -4 -23 -43 -19 -4 -9 10K Interest Expense 15 12 41 35 27 27 26 10K Income Tax Expense / (Benefit) 44 11 13 -19 -43 -15 -25 Revised 10Q Non-GAAP adjustments in Operations 6 3 280 265 297 -25 244 IFRS to GAAP file Dep/Amort (excluding ROU Amort) 3 3 16 11 9 15 18 10K; 2021 Press Release - excluding ROU from Priyanka file Share-Based Compensation Expense 8 6 24 21 16 11 8 10K Opiant Transaction 162 Total Adjustments 70 31 351 432 287 9 262 EBITDA 88 78 358 306 245 214 114 FY 2023 Income Statement: IFRS to US GAAP Bridge FY 2023 ($ millions, except per share data) US GAAP Adjustments IFRS Caption IFRS Total Change Reclassification US GAAP Caption US GAAP Total Net revenue $1,093 0 0 Net revenue $1,093 Cost of sales -,186 12 0 Cost of sales -,174 Gross profit 907 12 0 Gross profit 919 Selling, general & administrative -,811 3 239 Selling, general & administrative -,569 Research & development -,106 -,171 161.56400000000002 Research & development -,116 0 0 -,161.56400000000002 Acquired in-process research & development -,161.56400000000002 0 0 -,239 Litigation settlement expenses -,239 Other operating income 6 3 0 Other operating income 9 Operating profit -4 -,153 0 Income from operations -,156 Finance income 43 0 0 Interest income 43 Finance expense -38 3 0 Interest expense -35 Net finance expense 5 3 0 Interest expense, net 8 0 0 0 Other income 0 Profit before taxation 1 -,150 0 Income before income taxes -,149 Income tax benefit 1 21 0 Provision for income taxes 22 Net income $2 -,129 0 Net income $-,127 Diluted EPS $0.01 Diluted EPS $-0.95 IFRS Net Income $2 US GAAP Net Income $-,127 Adjustments within cost of sales Adjustments within cost of sales Amortization of acquired intangibles 8 Amortization of acquired intangibles 0 Total adjustments within cost of sales 8 Total adjustments within cost of sales 0 Adjustments within cost of SG&A Adjustments within cost of SG&A Legal costs/provision 240 Legal costs/provision 240 -1 Acquisition-related costs 22 Acquisition-related costs 22 537 U.S. listing costs 6 U.S. listing costs 6 Total adjustments within SG&A 268 Total adjustments within SG&A 268 Adjustments within net other operating income Adjustments within net other operating income Income recognized in relation to a supply agreement -3 Income recognized in relation to a supply agreement -3 Insurance reimbursement 0 Insurance reimbursement 0 Total adjustments within other net operating income -3 Total adjustments within other net operating income -3 Total adjustments before taxes 273 Total adjustments before taxes 265 Adjustments within tax Adjustments within tax Tax on adjustments -63 Tax on adjustments -61 Tax adjustments 11 Tax adjustments 3 Total adjustments within tax -52 Total adjustments within tax -58 Total adjustments 221 Total adjustments 207 IFRS Adjusted Net Income $223 GAAP Adjusted Net Income $80 Adjusted Diluted EPS $1.57 Adjusted Diluted EPS $0.56000000000000005 * - Columns and rows may not add and may change in final reporting due to rounding Q1 2024 Q2 2024 Q3 2024 Q4 2024 FY 2024 Q1 2025 Q2 2025 TTM Total Gross Debt 350 341 Net income (loss) 61.4 -97.293182069999986 21.5 21 7 47 18.101428300000002 107.60142830000001 Adjustments: 0 0 0 0 0 0 0 0 Interest income -7 -5.6497671480000005 -5 -5 -23 -4 -5.7200703859999997 -19.720070386 Interest expense 9 8.5183084099999995 11 13 41 12 15.398883060000001 51.398883060000003 Income tax expense (benefit) 11 -23.352700989999999 8 17 13 11 44.203073189999998 80.203073189999998 Depreciation/amortization (excluding ROU amortization) 3.1248689999999999 4 3.6567029999999998 5.8588120000000004 16.348337000000001 3 2.5500189999999998 15.065534 Non-GAAP adjustments in operating income 2 201 60 17 280 3 5.7477989999999997 85.747799000000001 Share-based compensation expense 6 6 6 6 24 6 7.9809182120000006 25.980918211999999 Total Adjustments 24.124869 190.51584027200002 83.656702999999993 53.858812 351.34833700000001 31 70.16062207600001 238.676137076 0 0 0 0 0 0 0 0 Adjusted EBITDA 85.524868999999995 93.222658202000005 105.15670299999999 74.858812 358.34833700000001 78 88.262050376000005 346.27756537599998 Adjusted Leverage 0.97670329079830498 0.98475914727461644 TTM FY Q2'2024 Q3'2024 Q4'2025 Q1'2025 TTM US 254 261 251 222 988 0.84444444444444444 US 1008 0.84848484848484851 ROW 45 46 47 44 182 0.15555555555555556 ROW 179 0.15067340067340068 299 307 298 266 1170 1188 Total Sublocade 192 191 194 176 753 0.64358974358974363 Total Sublocade 756 0.64615384615384619 PERSERIS 13 8 9 4 34 2.9% PERSERIS 40 3.4% OPVEE 15 15 1.3% OPVEE 15 1.3% ROW - Ex 32 33 33 31 129 0.11025641025641025 ROW - Ex 127 0.10854700854700855 SUBOXONE 62 60 62 55 239 0.20427350427350427 SUBOXONE 250 0.21367521367521367 299 307 298 266 1170 100.0% 1188 1.0153846153846153 FY 2022 Income Statement: IFRS to US GAAP Bridge FY 2022 ($ millions, except per share data) US GAAP Adjustments IFRS Caption IFRS Total Change Reclassification US GAAP Caption US GAAP Total Net revenue $901 0 0 Net revenue $901 Cost of sales -,159 8 0 Cost of sales -,151 Gross profit 742 8 0 Gross profit 749 Selling, general & administrative -,763 -2 296 Selling, general & administrative -,469 Research & development -72 -2 0 Research & development -74 0 0 0 Acquired in-process research & development 0 0 0 -,296 Litigation settlement expenses -,296 Other operating income 8 0 0 Other operating income 8 Operating profit -85 4 0 Income from operations -81 Finance income 19 0 0 Interest income 19 Finance expense -29 2 0 Interest expense -27 Net finance expense -10 2 0 Interest expense, net -8 0 0 0 Other income 0 Profit before taxation -95 6 0 Income before income taxes -89 Income tax benefit 42 3 0 Provision for income taxes 44 Net income $-53 9 0 Net income -44 Diluted EPS $-0.38 Diluted EPS $-0.32 IFRS Net Income $-53 US GAAP Net Income $-44 Adjustments within cost of sales Adjustments within cost of sales Amortization of acquired intangibles 0 Amortization of acquired intangibles $0 Total adjustments within cost of sales 0 Total adjustments within cost of sales 0 Adjustments within SG&A Adjustments within SG&A Legal costs/provision 296 Legal costs/provision 296 Acquisition-related costs 0 Acquisition-related costs 0 U.S. listing costs 6 U.S. listing costs 6 Total adjustments within SG&A 302 Total adjustments within SG&A 302 Adjustments within net other operating income Adjustments within net other operating income Income recognized in relation to a supply agreement 0 Income recognized in relation to a supply agreement 0 Insurance reimbursement -5 Insurance reimbursement -5 Total adjustments within other net operating income -5 Total adjustments within other net operating income -5 Total adjustments before taxes 297 Total adjustments before taxes 297 Adjustments within tax Adjustments within tax Tax on adjustments -57 Tax on adjustments -57 Tax adjustments -18 Tax adjustments -20 Total adjustments within tax -75 Total adjustments within tax -77 Total adjustments 222 Total adjustments 220 IFRS Adjusted Net Income $169 GAAP Adjusted Net Income $176 Adjusted diluted EPS $1.1599999999999999 Adjusted diluted EPS $1.21 * - Columns and rows may not add and may change in final reporting due to rounding Reconciliation of Net Income to Non-GAAP Operating Income ($m) GAAP-------------------------------- IFRS-------------------- 2024 2023 2022 2021 2020 Net Income 7 -126 -42 205 -148 Revised 10Q Net Finance Income -23 -43 -19 -4 -9 10K Net Finance Expense 41 35 27 27 26 10K Income Tax Expense 13 -19 -43 -15 -25 Revised 10Q Total Adjustments 281 265 297 -25 244 2021-2020 from press Q4 2021 press release - total exceptionals Acquired In-process R&D 1 162 - - - Non-GAAP Operating Income 320 274 220 188 88 Net Revenue 1,188 1,093 901 791 647 Non-GAAP Operating Margin 0.26936026936026936 0.25068618481244281 0.24417314095449499 0.23767383059418457 0.13601236476043277 Reconciliation of Non-GAAP operating expenses GAAP-------------------------------- IFRS-------------------- 2024 2023 2022 2021 2020 Total Operating Expenses, net 919 1072 827 451 706 Other operating expense (income), net -4 9 8 32 - Acquired In-process R&D -1 -161.56400000000002 - - - Non-GAAP adjustments -235 -268 -302 -6 -244 Share based compesation -24 -22 -16 -11 -8 Non-GAAP operating expenses 655 630.43599999999992 517 466 454 Net Revenue 1,188 1,093 901 791 647 Non-GAAP operating expense % 0.55134680134680136 0.5767941445562671 0.57380688124306323 0.58912768647281921 0.70170015455950541 Q1 2024 Q2 2024 Q3 2024 Q4 2024 FY 2024 Reconciliation: IFRS to GAAP exceptionals within operating profit Q4 Reclassification US GAAP Operating Profit $73.209536594165002 $-,119.2966617134996 $33.694954031548903 $44.122005667998202 $31.729834580212504 IFRS exceptionals within operating profit 335 -2.8991669999999998 Debt refinance deferred costs write down (reclassified from SG&A exceptionals account back to interest expense) Adjustments within cost of sales Amortisation of acquired intangibles -11 Amortization of acquired intangibles 0 0 0 0 0 Perseris inventory write-ups 0 Discontinuation of sales & promotion of PERSERIS 0 32 10 -2 40 Note 1 Perseris intangible impairment -9 Total adjustments within cost of sales 0 32 10 -2 40 Click intangible impairment -7 Adjustments within SG&A 0 Aelis intangible impairment -28 Discontinuation of sales & promotion of PERSERIS 3 9 0 12 Note 2 Optima filler 1 Impairment of products in development 0 0 0 GAAP exceptionals within operating profit 281 Acquisition-related costs 2 2 0 0 4 check 0 U.S. listing costs 0 4 0 0 4 Restructuring - severance and other 0 0 0 12 12 1 different to IFRS re Optima filler Debt refinancing costs 0 0 0 4 4 Total adjustments within SG&A 2 9 9 16 36 Adjustments within Legal Legal costs/provision 0 160 36 -1 195 Total adjustments within Legal 0 160 36 -1 195 Adjustments within IPR&D Optima filler 1 1 Total adjustments within R&D 0 0 0 1 1 Adjustments within R&D Click contract termination fee 0 0 0 4 4 Total adjustments within R&D 0 0 0 4 4 Adjustments within net other operating income 0 Mark-to-market on equity investments 0 0 5 0 5 Income recognized in relation to a supply agreement 0 0 0 0 0 Insurance reimbursement 0 0 0 0 0 Total adjustments within other net operating income 0 0 5 0 5 Total adjustments within operating profit 2 201 60 18 281 GAAP Adjusted Operating Profit $75.209536594165002 $81.703338286500397 $93.694954031548903 $62.122005667998202 $312.72983458021253 1 Inventory write-ups (gain in IFRS) are not included in US GAAP financials. Difference between IFRS and GAAP COGS exceptionals is inventory write-ups (ie effect is additional exceptionals expense for GAAP Q2 $1m, Q3 $2m, Q4 $2m) 2 $2m severance recorded in Q2 vs Q3 for GAAP, timing difference only. No impact on full year. 42222 COGS exceptionals 8.0715786742299997E-2 32.590125518868099 10.68720459 -2.5122844623255998 40.8457614332848 76202 SG&A exceptionals 1.74639251 166.71154881000001 47.890584429999997 10.272734659629601 226.6212604096296 76203SG&A exceptionals 0 2.0943420000000001 3.2298322599999998 12.1310416278366 17.455215887836601 Total exceptionals 1.8271082967423 201.39601632886811 61.807621279999999 19.891491825140601 284.92223773075102 Reclass debt def costs amortisation -2.8991669999999998 -2.8991669999999998 Adjusted total exceptionals 1.8271082967423 201.39601632886811 61.807621279999999 16.992324825140603 282.02307073075104 check total -0.17289170325769998 0.39601632886811444 1.8076212799999993 -1.0076751748593971 1.0230707307510443 Reconciliation of EBITDA GAAP-------------------------------------------------------------------- IFRS--------------------- Q2 2025 Q1 2025 FY 2024 FY 2023 FY 2022 FY 2021 FY 2020 Net Income 18 47 7 -126 -42 205 -148 Revised 10Q Add Back: Interest Income -6 -4 -23 -43 -19 -4 -9 10K Interest Expense 15 12 41 35 27 27 26 10K Income Tax Expense / (Benefit) 44 11 13 -19 -43 -15 -25 Revised 10Q Non-GAAP adjustments in Operations 6 3 280 265 297 -25 244 IFRS to GAAP file Dep/Amort (excluding ROU Amort) 3 3 16 11 9 15 18 10K; 2021 Press Release - excluding ROU from Priyanka file Share-Based Compensation Expense 8 6 24 21 16 11 8 10K Opiant Transaction 162 Total Adjustments 70 31 351 432 287 9 262 EBITDA 88 78 358 306 245 214 114 FY 2023 Income Statement: IFRS to US GAAP Bridge FY 2023 ($ millions, except per share data) US GAAP Adjustments IFRS Caption IFRS Total Change Reclassification US GAAP Caption US GAAP Total Net revenue $1,093 0 0 Net revenue $1,093 Cost of sales -,186 12 0 Cost of sales -,174 Gross profit 907 12 0 Gross profit 919 Selling, general & administrative -,811 3 239 Selling, general & administrative -,569 Research & development -,106 -,171 161.56400000000002 Research & development -,116 0 0 -,161.56400000000002 Acquired in-process research & development -,161.56400000000002 0 0 -,239 Litigation settlement expenses -,239 Other operating income 6 3 0 Other operating income 9 Operating profit -4 -,153 0 Income from operations -,156 Finance income 43 0 0 Interest income 43 Finance expense -38 3 0 Interest expense -35 Net finance expense 5 3 0 Interest expense, net 8 0 0 0 Other income 0 Profit before taxation 1 -,150 0 Income before income taxes -,149 Income tax benefit 1 21 0 Provision for income taxes 22 Net income $2 -,129 0 Net income $-,127 Diluted EPS $0.01 Diluted EPS $-0.95 IFRS Net Income $2 US GAAP Net Income $-,127 Adjustments within cost of sales Adjustments within cost of sales Amortization of acquired intangibles 8 Amortization of acquired intangibles 0 Total adjustments within cost of sales 8 Total adjustments within cost of sales 0 Adjustments within cost of SG&A Adjustments within cost of SG&A Legal costs/provision 240 Legal costs/provision 240 -1 Acquisition-related costs 22 Acquisition-related costs 22 537 U.S. listing costs 6 U.S. listing costs 6 Total adjustments within SG&A 268 Total adjustments within SG&A 268 Adjustments within net other operating income Adjustments within net other operating income Income recognized in relation to a supply agreement -3 Income recognized in relation to a supply agreement -3 Insurance reimbursement 0 Insurance reimbursement 0 Total adjustments within other net operating income -3 Total adjustments within other net operating income -3 Total adjustments before taxes 273 Total adjustments before taxes 265 Adjustments within tax Adjustments within tax Tax on adjustments -63 Tax on adjustments -61 Tax adjustments 11 Tax adjustments 3 Total adjustments within tax -52 Total adjustments within tax -58 Total adjustments 221 Total adjustments 207 IFRS Adjusted Net Income $223 GAAP Adjusted Net Income $80 Adjusted Diluted EPS $1.57 Adjusted Diluted EPS $0.56000000000000005 * - Columns and rows may not add and may change in final reporting due to rounding Q1 2024 Q2 2024 Q3 2024 Q4 2024 FY 2024 Q1 2025 Q2 2025 TTM Total Gross Debt 350 341 Net income (loss) 61.4 -97.293182069999986 21.5 21 7 47 18.101428300000002 107.60142830000001 Adjustments: 0 0 0 0 0 0 0 0 Interest income -7 -5.6497671480000005 -5 -5 -23 -4 -5.7200703859999997 -19.720070386 Interest expense 9 8.5183084099999995 11 13 41 12 15.398883060000001 51.398883060000003 Income tax expense (benefit) 11 -23.352700989999999 8 17 13 11 44.203073189999998 80.203073189999998 Depreciation/amortization (excluding ROU amortization) 3.1248689999999999 4 3.6567029999999998 5.8588120000000004 16.348337000000001 3 2.5500189999999998 15.065534 Non-GAAP adjustments in operating income 2 201 60 17 280 3 5.7477989999999997 85.747799000000001 Share-based compensation expense 6 6 6 6 24 6 7.9809182120000006 25.980918211999999 Total Adjustments 24.124869 190.51584027200002 83.656702999999993 53.858812 351.34833700000001 31 70.16062207600001 238.676137076 0 0 0 0 0 0 0 0 Adjusted EBITDA 85.524868999999995 93.222658202000005 105.15670299999999 74.858812 358.34833700000001 78 88.262050376000005 346.27756537599998 Adjusted Leverage 0.97670329079830498 0.98475914727461644 TTM FY Q2'2024 Q3'2024 Q4'2025 Q1'2025 TTM US 254 261 251 222 988 0.84444444444444444 US 1008 0.84848484848484851 ROW 45 46 47 44 182 0.15555555555555556 ROW 179 0.15067340067340068 299 307 298 266 1170 1188 Total Sublocade 192 191 194 176 753 0.64358974358974363 Total Sublocade 756 0.64615384615384619 PERSERIS 13 8 9 4 34 2.9% PERSERIS 40 3.4% OPVEE 15 15 1.3% OPVEE 15 1.3% ROW - Ex 32 33 33 31 129 0.11025641025641025 ROW - Ex 127 0.10854700854700855 SUBOXONE 62 60 62 55 239 0.20427350427350427 SUBOXONE 250 0.21367521367521367 299 307 298 266 1170 100.0% 1188 1.0153846153846153 FY 2022 Income Statement: IFRS to US GAAP Bridge FY 2022 ($ millions, except per share data) US GAAP Adjustments IFRS Caption IFRS Total Change Reclassification US GAAP Caption US GAAP Total Net revenue $901 0 0 Net revenue $901 Cost of sales -,159 8 0 Cost of sales -,151 Gross profit 742 8 0 Gross profit 749 Selling, general & administrative -,763 -2 296 Selling, general & administrative -,469 Research & development -72 -2 0 Research & development -74 0 0 0 Acquired in-process research & development 0 0 0 -,296 Litigation settlement expenses -,296 Other operating income 8 0 0 Other operating income 8 Operating profit -85 4 0 Income from operations -81 Finance income 19 0 0 Interest income 19 Finance expense -29 2 0 Interest expense -27 Net finance expense -10 2 0 Interest expense, net -8 0 0 0 Other income 0 Profit before taxation -95 6 0 Income before income taxes -89 Income tax benefit 42 3 0 Provision for income taxes 44 Net income $-53 9 0 Net income -44 Diluted EPS $-0.38 Diluted EPS $-0.32 IFRS Net Income $-53 US GAAP Net Income $-44 Adjustments within cost of sales Adjustments within cost of sales Amortization of acquired intangibles 0 Amortization of acquired intangibles $0 Total adjustments within cost of sales 0 Total adjustments within cost of sales 0 Adjustments within SG&A Adjustments within SG&A Legal costs/provision 296 Legal costs/provision 296 Acquisition-related costs 0 Acquisition-related costs 0 U.S. listing costs 6 U.S. listing costs 6 Total adjustments within SG&A 302 Total adjustments within SG&A 302 Adjustments within net other operating income Adjustments within net other operating income Income recognized in relation to a supply agreement 0 Income recognized in relation to a supply agreement 0 Insurance reimbursement -5 Insurance reimbursement -5 Total adjustments within other net operating income -5 Total adjustments within other net operating income -5 Total adjustments before taxes 297 Total adjustments before taxes 297 Adjustments within tax Adjustments within tax Tax on adjustments -57 Tax on adjustments -57 Tax adjustments -18 Tax adjustments -20 Total adjustments within tax -75 Total adjustments within tax -77 Total adjustments 222 Total adjustments 220 IFRS Adjusted Net Income $169 GAAP Adjusted Net Income $176 Adjusted diluted EPS $1.1599999999999999 Adjusted diluted EPS $1.21 * - Columns and rows may not add and may change in final reporting due to rounding Reconciliation of Net Income to Non-GAAP Operating Income ($m) GAAP-------------------------------- IFRS-------------------- 2024 2023 2022 2021 2020 Net Income 7 -126 -42 205 -148 Revised 10Q Net Finance Income -23 -43 -19 -4 -9 10K Net Finance Expense 41 35 27 27 26 10K Income Tax Expense 13 -19 -43 -15 -25 Revised 10Q Total Adjustments 281 265 297 -25 244 2021-2020 from press Q4 2021 press release - total exceptionals Acquired In-process R&D 1 162 - - - Non-GAAP Operating Income 320 274 220 188 88 Net Revenue 1,188 1,093 901 791 647 Non-GAAP Operating Margin 0.26936026936026936 0.25068618481244281 0.24417314095449499 0.23767383059418457 0.13601236476043277 Reconciliation of Non-GAAP operating expenses GAAP-------------------------------- IFRS-------------------- 2024 2023 2022 2021 2020 Total Operating Expenses, net 919 1072 827 451 706 Other operating expense (income), net -4 9 8 32 - Acquired In-process R&D -1 -161.56400000000002 - - - Non-GAAP adjustments -235 -268 -302 -6 -244 Share based compesation -24 -22 -16 -11 -8 Non-GAAP operating expenses 655 630.43599999999992 517 466 454 Net Revenue 1,188 1,093 901 791 647 Non-GAAP operating expense % 0.55134680134680136 0.5767941445562671 0.57380688124306323 0.58912768647281921 0.70170015455950541
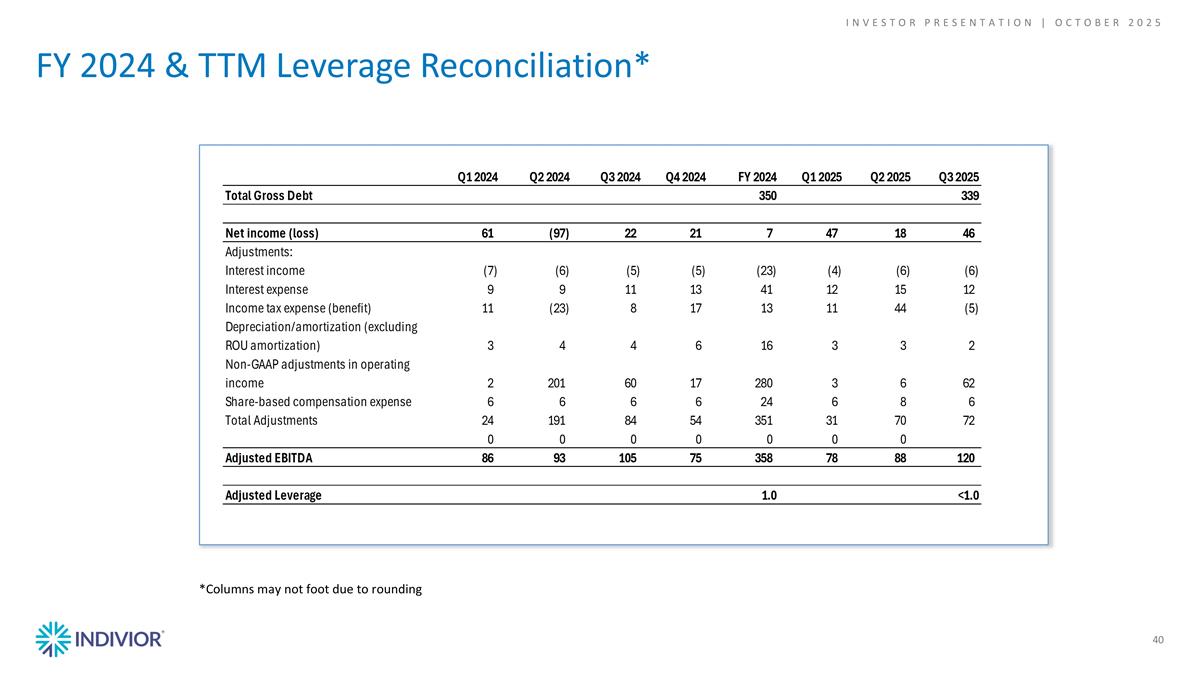
FY 2024 & TTM Leverage Reconciliation* 40 INVESTOR PRESENTATION | October 2025 *Columns may not foot due to rounding Q1 2024 Q2 2024 Q3 2024 Q4 2024 FY 2024 Reconciliation: IFRS to GAAP exceptionals within operating profit Q4 Reclassification US GAAP Operating Profit $73.209536594165002 $-,119.2966617134996 $33.694954031548903 $44.122005667998202 $31.729834580212504 IFRS exceptionals within operating profit 335 -2.8991669999999998 Debt refinance deferred costs write down (reclassified from SG&A exceptionals account back to interest expense) Adjustments within cost of sales Amortisation of acquired intangibles -11 Amortization of acquired intangibles 0 0 0 0 0 Perseris inventory write-ups 0 Discontinuation of sales & promotion of PERSERIS 0 32 10 -2 40 Note 1 Perseris intangible impairment -9 Total adjustments within cost of sales 0 32 10 -2 40 Click intangible impairment -7 Adjustments within SG&A 0 Aelis intangible impairment -28 Discontinuation of sales & promotion of PERSERIS 3 9 0 12 Note 2 Optima filler 1 Impairment of products in development 0 0 0 GAAP exceptionals within operating profit 281 Acquisition-related costs 2 2 0 0 4 check 0 U.S. listing costs 0 4 0 0 4 Restructuring - severance and other 0 0 0 12 12 1 different to IFRS re Optima filler Debt refinancing costs 0 0 0 4 4 Total adjustments within SG&A 2 9 9 16 36 Adjustments within Legal Legal costs/provision 0 160 36 -1 195 Total adjustments within Legal 0 160 36 -1 195 Adjustments within IPR&D Optima filler 1 1 Total adjustments within R&D 0 0 0 1 1 Adjustments within R&D Click contract termination fee 0 0 0 4 4 Total adjustments within R&D 0 0 0 4 4 Adjustments within net other operating income 0 Mark-to-market on equity investments 0 0 5 0 5 Income recognized in relation to a supply agreement 0 0 0 0 0 Insurance reimbursement 0 0 0 0 0 Total adjustments within other net operating income 0 0 5 0 5 Total adjustments within operating profit 2 201 60 18 281 GAAP Adjusted Operating Profit $75.209536594165002 $81.703338286500397 $93.694954031548903 $62.122005667998202 $312.72983458021253 1 Inventory write-ups (gain in IFRS) are not included in US GAAP financials. Difference between IFRS and GAAP COGS exceptionals is inventory write-ups (ie effect is additional exceptionals expense for GAAP Q2 $1m, Q3 $2m, Q4 $2m) 2 $2m severance recorded in Q2 vs Q3 for GAAP, timing difference only. No impact on full year. 42222 COGS exceptionals 8.0715786742299997E-2 32.590125518868099 10.68720459 -2.5122844623255998 40.8457614332848 76202 SG&A exceptionals 1.74639251 166.71154881000001 47.890584429999997 10.272734659629601 226.6212604096296 76203SG&A exceptionals 0 2.0943420000000001 3.2298322599999998 12.1310416278366 17.455215887836601 Total exceptionals 1.8271082967423 201.39601632886811 61.807621279999999 19.891491825140601 284.92223773075102 Reclass debt def costs amortisation -2.8991669999999998 -2.8991669999999998 Adjusted total exceptionals 1.8271082967423 201.39601632886811 61.807621279999999 16.992324825140603 282.02307073075104 check total -0.17289170325769998 0.39601632886811444 1.8076212799999993 -1.0076751748593971 1.0230707307510443 Reconciliation of EBITDA GAAP-------------------------------------------------------------------- IFRS--------------------- Q2 2025 Q1 2025 FY 2024 FY 2023 FY 2022 FY 2021 FY 2020 Net Income 18 47 7 -126 -42 205 -148 Revised 10Q Add Back: Interest Income -6 -4 -23 -43 -19 -4 -9 10K Interest Expense 15 12 41 35 27 27 26 10K Income Tax Expense / (Benefit) 44 11 13 -19 -43 -15 -25 Revised 10Q Non-GAAP adjustments in Operations 6 3 280 265 297 -25 244 IFRS to GAAP file Dep/Amort (excluding ROU Amort) 3 3 16 11 9 15 18 10K; 2021 Press Release - excluding ROU from Priyanka file Share-Based Compensation Expense 8 6 24 21 16 11 8 10K Opiant Transaction 162 Total Adjustments 70 31 351 432 287 9 262 EBITDA 88 78 358 306 245 214 114 Match 310? FY 2023 Income Statement: IFRS to US GAAP Bridge FY 2023 ($ millions, except per share data) US GAAP Adjustments IFRS Caption IFRS Total Change Reclassification US GAAP Caption US GAAP Total Net revenue $1,093 0 0 Net revenue $1,093 Cost of sales -,186 12 0 Cost of sales -,174 Gross profit 907 12 0 Gross profit 919 Selling, general & administrative -,811 3 239 Selling, general & administrative -,569 Research & development -,106 -,171 161.56400000000002 Research & development -,116 0 0 -,161.56400000000002 Acquired in-process research & development -,161.56400000000002 0 0 -,239 Litigation settlement expenses -,239 Other operating income 6 3 0 Other operating income 9 Operating profit -4 -,153 0 Income from operations -,156 Finance income 43 0 0 Interest income 43 Finance expense -38 3 0 Interest expense -35 Net finance expense 5 3 0 Interest expense, net 8 0 0 0 Other income 0 Profit before taxation 1 -,150 0 Income before income taxes -,149 Income tax benefit 1 21 0 Provision for income taxes 22 Net income $2 -,129 0 Net income $-,127 Diluted EPS $0.01 Diluted EPS $-0.95 IFRS Net Income $2 US GAAP Net Income $-,127 Adjustments within cost of sales Adjustments within cost of sales Amortization of acquired intangibles 8 Amortization of acquired intangibles 0 Total adjustments within cost of sales 8 Total adjustments within cost of sales 0 Adjustments within cost of SG&A Adjustments within cost of SG&A Legal costs/provision 240 Legal costs/provision 240 -1 Acquisition-related costs 22 Acquisition-related costs 22 537 U.S. listing costs 6 U.S. listing costs 6 Total adjustments within SG&A 268 Total adjustments within SG&A 268 Adjustments within net other operating income Adjustments within net other operating income Income recognized in relation to a supply agreement -3 Income recognized in relation to a supply agreement -3 Insurance reimbursement 0 Insurance reimbursement 0 Total adjustments within other net operating income -3 Total adjustments within other net operating income -3 Total adjustments before taxes 273 Total adjustments before taxes 265 Adjustments within tax Adjustments within tax Tax on adjustments -63 Tax on adjustments -61 Tax adjustments 11 Tax adjustments 3 Total adjustments within tax -52 Total adjustments within tax -58 Total adjustments 221 Total adjustments 207 IFRS Adjusted Net Income $223 GAAP Adjusted Net Income $80 Adjusted Diluted EPS $1.57 Adjusted Diluted EPS $0.56000000000000005 * - Columns and rows may not add and may change in final reporting due to rounding Q1 2024 Q2 2024 Q3 2024 Q4 2024 FY 2024 Q1 2025 Q2 2025 Q3 2025 TTM Total Gross Debt 350 339 341 Net income (loss) 61.4 -97.293182069999986 21.5 21 7 47 18.101428300000002 46 107.60142830000001 Adjustments: 0 Interest income -7 -5.6497671480000005 -5 -5 -23 -4 -5.7200703859999997 -6 -19.720070386 Interest expense 9 8.5183084099999995 11 13 41 12 15.398883060000001 12 51.398883060000003 Income tax expense (benefit) 11 -23.352700989999999 8 17 13 11 44.203073189999998 -5 80.203073189999998 Depreciation/amortization (excluding ROU amortization) 3.1248689999999999 4 3.6567029999999998 5.8588120000000004 16.348337000000001 3 2.5500189999999998 2 15.065534 Non-GAAP adjustments in operating income 2 201 60 17 280 3 5.7477989999999997 62 85.747799000000001 Share-based compensation expense 6 6 6 6 24 6 7.9809182120000006 6 25.980918211999999 Total Adjustments 24.124869 190.51584027200002 83.656702999999993 53.858812 351.34833700000001 31 70.16062207600001 72 238.676137076 0 0 0 0 0 0 0 0 Adjusted EBITDA 85.524868999999995 93.222658202000005 105.15670299999999 74.858812 358.34833700000001 78 88.262050376000005 120 346.27756537599998 Adjusted Leverage 0.97670329079830498 <1.0 0.98475914727461644 TTM FY Q2'2024 Q3'2024 Q4'2025 Q1'2025 TTM US 254 261 251 222 988 0.84444444444444444 US 1008 0.84848484848484851 ROW 45 46 47 44 182 0.15555555555555556 ROW 179 0.15067340067340068 299 307 298 266 1170 1188 Total Sublocade 192 191 194 176 753 0.64358974358974363 Total Sublocade 756 0.64615384615384619 PERSERIS 13 8 9 4 34 2.9% PERSERIS 40 3.4% OPVEE 15 15 1.3% OPVEE 15 1.3% ROW - Ex 32 33 33 31 129 0.11025641025641025 ROW - Ex 127 0.10854700854700855 SUBOXONE 62 60 62 55 239 0.20427350427350427 SUBOXONE 250 0.21367521367521367 299 307 298 266 1170 100.0% 1188 1.0153846153846153 FY 2022 Income Statement: IFRS to US GAAP Bridge FY 2022 ($ millions, except per share data) US GAAP Adjustments IFRS Caption IFRS Total Change Reclassification US GAAP Caption US GAAP Total Net revenue $901 0 0 Net revenue $901 Cost of sales -,159 8 0 Cost of sales -,151 Gross profit 742 8 0 Gross profit 749 Selling, general & administrative -,763 -2 296 Selling, general & administrative -,469 Research & development -72 -2 0 Research & development -74 0 0 0 Acquired in-process research & development 0 0 0 -,296 Litigation settlement expenses -,296 Other operating income 8 0 0 Other operating income 8 Operating profit -85 4 0 Income from operations -81 Finance income 19 0 0 Interest income 19 Finance expense -29 2 0 Interest expense -27 Net finance expense -10 2 0 Interest expense, net -8 0 0 0 Other income 0 Profit before taxation -95 6 0 Income before income taxes -89 Income tax benefit 42 3 0 Provision for income taxes 44 Net income $-53 9 0 Net income -44 Diluted EPS $-0.38 Diluted EPS $-0.32 IFRS Net Income $-53 US GAAP Net Income $-44 Adjustments within cost of sales Adjustments within cost of sales Amortization of acquired intangibles 0 Amortization of acquired intangibles $0 Total adjustments within cost of sales 0 Total adjustments within cost of sales 0 Adjustments within SG&A Adjustments within SG&A Legal costs/provision 296 Legal costs/provision 296 Acquisition-related costs 0 Acquisition-related costs 0 U.S. listing costs 6 U.S. listing costs 6 Total adjustments within SG&A 302 Total adjustments within SG&A 302 Adjustments within net other operating income Adjustments within net other operating income Income recognized in relation to a supply agreement 0 Income recognized in relation to a supply agreement 0 Insurance reimbursement -5 Insurance reimbursement -5 Total adjustments within other net operating income -5 Total adjustments within other net operating income -5 Total adjustments before taxes 297 Total adjustments before taxes 297 Adjustments within tax Adjustments within tax Tax on adjustments -57 Tax on adjustments -57 Tax adjustments -18 Tax adjustments -20 Total adjustments within tax -75 Total adjustments within tax -77 Total adjustments 222 Total adjustments 220 IFRS Adjusted Net Income $169 GAAP Adjusted Net Income $176 Adjusted diluted EPS $1.1599999999999999 Adjusted diluted EPS $1.21 * - Columns and rows may not add and may change in final reporting due to rounding Reconciliation of Net Income to Non-GAAP Operating Income ($m) GAAP-------------------------------- IFRS-------------------- 2024 2023 2022 2021 2020 Net Income 7 -126 -42 205 -148 Revised 10Q Net Finance Income -23 -43 -19 -4 -9 10K Net Finance Expense 41 35 27 27 26 10K Income Tax Expense 13 -19 -43 -15 -25 Revised 10Q Total Adjustments 281 265 297 -25 244 2021-2020 from press Q4 2021 press release - total exceptionals Acquired In-process R&D 1 162 - - - Non-GAAP Operating Income 320 274 220 188 88 Net Revenue 1,188 1,093 901 791 647 Non-GAAP Operating Margin 0.26936026936026936 0.25068618481244281 0.24417314095449499 0.23767383059418457 0.13601236476043277 Reconciliation of Non-GAAP operating expenses GAAP-------------------------------- IFRS-------------------- 2024 2023 2022 2021 2020 Total Operating Expenses, net 919 1072 827 451 706 Other operating expense (income), net -4 9 8 32 - Acquired In-process R&D -1 -161.56400000000002 - - - Non-GAAP adjustments -235 -268 -302 -6 -244 Share based compesation -24 -22 -16 -11 -8 Non-GAAP operating expenses 655 630.43599999999992 517 466 454 Net Revenue 1,188 1,093 901 791 647 Non-GAAP operating expense % 0.55134680134680136 0.5767941445562671 0.57380688124306323 0.58912768647281921 0.70170015455950541 Q1 2024 Q2 2024 Q3 2024 Q4 2024 FY 2024 Reconciliation: IFRS to GAAP exceptionals within operating profit Q4 Reclassification US GAAP Operating Profit $73.209536594165002 $-,119.2966617134996 $33.694954031548903 $44.122005667998202 $31.729834580212504 IFRS exceptionals within operating profit 335 -2.8991669999999998 Debt refinance deferred costs write down (reclassified from SG&A exceptionals account back to interest expense) Adjustments within cost of sales Amortisation of acquired intangibles -11 Amortization of acquired intangibles 0 0 0 0 0 Perseris inventory write-ups 0 Discontinuation of sales & promotion of PERSERIS 0 32 10 -2 40 Note 1 Perseris intangible impairment -9 Total adjustments within cost of sales 0 32 10 -2 40 Click intangible impairment -7 Adjustments within SG&A 0 Aelis intangible impairment -28 Discontinuation of sales & promotion of PERSERIS 3 9 0 12 Note 2 Optima filler 1 Impairment of products in development 0 0 0 GAAP exceptionals within operating profit 281 Acquisition-related costs 2 2 0 0 4 check 0 U.S. listing costs 0 4 0 0 4 Restructuring - severance and other 0 0 0 12 12 1 different to IFRS re Optima filler Debt refinancing costs 0 0 0 4 4 Total adjustments within SG&A 2 9 9 16 36 Adjustments within Legal Legal costs/provision 0 160 36 -1 195 Total adjustments within Legal 0 160 36 -1 195 Adjustments within IPR&D Optima filler 1 1 Total adjustments within R&D 0 0 0 1 1 Adjustments within R&D Click contract termination fee 0 0 0 4 4 Total adjustments within R&D 0 0 0 4 4 Adjustments within net other operating income 0 Mark-to-market on equity investments 0 0 5 0 5 Income recognized in relation to a supply agreement 0 0 0 0 0 Insurance reimbursement 0 0 0 0 0 Total adjustments within other net operating income 0 0 5 0 5 Total adjustments within operating profit 2 201 60 18 281 GAAP Adjusted Operating Profit $75.209536594165002 $81.703338286500397 $93.694954031548903 $62.122005667998202 $312.72983458021253 1 Inventory write-ups (gain in IFRS) are not included in US GAAP financials. Difference between IFRS and GAAP COGS exceptionals is inventory write-ups (ie effect is additional exceptionals expense for GAAP Q2 $1m, Q3 $2m, Q4 $2m) 2 $2m severance recorded in Q2 vs Q3 for GAAP, timing difference only. No impact on full year. 42222 COGS exceptionals 8.0715786742299997E-2 32.590125518868099 10.68720459 -2.5122844623255998 40.8457614332848 76202 SG&A exceptionals 1.74639251 166.71154881000001 47.890584429999997 10.272734659629601 226.6212604096296 76203SG&A exceptionals 0 2.0943420000000001 3.2298322599999998 12.1310416278366 17.455215887836601 Total exceptionals 1.8271082967423 201.39601632886811 61.807621279999999 19.891491825140601 284.92223773075102 Reclass debt def costs amortisation -2.8991669999999998 -2.8991669999999998 Adjusted total exceptionals 1.8271082967423 201.39601632886811 61.807621279999999 16.992324825140603 282.02307073075104 check total -0.17289170325769998 0.39601632886811444 1.8076212799999993 -1.0076751748593971 1.0230707307510443 Reconciliation of EBITDA GAAP-------------------------------------------------------------------- IFRS--------------------- Q2 2025 Q1 2025 FY 2024 FY 2023 FY 2022 FY 2021 FY 2020 Net Income 18 47 7 -126 -42 205 -148 Revised 10Q Add Back: Interest Income -6 -4 -23 -43 -19 -4 -9 10K Interest Expense 15 12 41 35 27 27 26 10K Income Tax Expense / (Benefit) 44 11 13 -19 -43 -15 -25 Revised 10Q Non-GAAP adjustments in Operations 6 3 280 265 297 -25 244 IFRS to GAAP file Dep/Amort (excluding ROU Amort) 3 3 16 11 9 15 18 10K; 2021 Press Release - excluding ROU from Priyanka file Share-Based Compensation Expense 8 6 24 21 16 11 8 10K Opiant Transaction 162 Total Adjustments 70 31 351 432 287 9 262 EBITDA 88 78 358 306 245 214 114 Match 310? FY 2023 Income Statement: IFRS to US GAAP Bridge FY 2023 ($ millions, except per share data) US GAAP Adjustments IFRS Caption IFRS Total Change Reclassification US GAAP Caption US GAAP Total Net revenue $1,093 0 0 Net revenue $1,093 Cost of sales -,186 12 0 Cost of sales -,174 Gross profit 907 12 0 Gross profit 919 Selling, general & administrative -,811 3 239 Selling, general & administrative -,569 Research & development -,106 -,171 161.56400000000002 Research & development -,116 0 0 -,161.56400000000002 Acquired in-process research & development -,161.56400000000002 0 0 -,239 Litigation settlement expenses -,239 Other operating income 6 3 0 Other operating income 9 Operating profit -4 -,153 0 Income from operations -,156 Finance income 43 0 0 Interest income 43 Finance expense -38 3 0 Interest expense -35 Net finance expense 5 3 0 Interest expense, net 8 0 0 0 Other income 0 Profit before taxation 1 -,150 0 Income before income taxes -,149 Income tax benefit 1 21 0 Provision for income taxes 22 Net income $2 -,129 0 Net income $-,127 Diluted EPS $0.01 Diluted EPS $-0.95 IFRS Net Income $2 US GAAP Net Income $-,127 Adjustments within cost of sales Adjustments within cost of sales Amortization of acquired intangibles 8 Amortization of acquired intangibles 0 Total adjustments within cost of sales 8 Total adjustments within cost of sales 0 Adjustments within cost of SG&A Adjustments within cost of SG&A Legal costs/provision 240 Legal costs/provision 240 -1 Acquisition-related costs 22 Acquisition-related costs 22 537 U.S. listing costs 6 U.S. listing costs 6 Total adjustments within SG&A 268 Total adjustments within SG&A 268 Adjustments within net other operating income Adjustments within net other operating income Income recognized in relation to a supply agreement -3 Income recognized in relation to a supply agreement -3 Insurance reimbursement 0 Insurance reimbursement 0 Total adjustments within other net operating income -3 Total adjustments within other net operating income -3 Total adjustments before taxes 273 Total adjustments before taxes 265 Adjustments within tax Adjustments within tax Tax on adjustments -63 Tax on adjustments -61 Tax adjustments 11 Tax adjustments 3 Total adjustments within tax -52 Total adjustments within tax -58 Total adjustments 221 Total adjustments 207 IFRS Adjusted Net Income $223 GAAP Adjusted Net Income $80 Adjusted Diluted EPS $1.57 Adjusted Diluted EPS $0.56000000000000005 * - Columns and rows may not add and may change in final reporting due to rounding Q1 2024 Q2 2024 Q3 2024 Q4 2024 FY 2024 Q1 2025 Q2 2025 Q3 2025 TTM Total Gross Debt 350 339 341 Net income (loss) 61.4 -97.293182069999986 21.5 21 7 47 18.101428300000002 46 107.60142830000001 Adjustments: 0 Interest income -7 -5.6497671480000005 -5 -5 -23 -4 -5.7200703859999997 -6 -19.720070386 Interest expense 9 8.5183084099999995 11 13 41 12 15.398883060000001 12 51.398883060000003 Income tax expense (benefit) 11 -23.352700989999999 8 17 13 11 44.203073189999998 -5 80.203073189999998 Depreciation/amortization (excluding ROU amortization) 3.1248689999999999 4 3.6567029999999998 5.8588120000000004 16.348337000000001 3 2.5500189999999998 2 15.065534 Non-GAAP adjustments in operating income 2 201 60 17 280 3 5.7477989999999997 62 85.747799000000001 Share-based compensation expense 6 6 6 6 24 6 7.9809182120000006 6 25.980918211999999 Total Adjustments 24.124869 190.51584027200002 83.656702999999993 53.858812 351.34833700000001 31 70.16062207600001 72 238.676137076 0 0 0 0 0 0 0 0 Adjusted EBITDA 85.524868999999995 93.222658202000005 105.15670299999999 74.858812 358.34833700000001 78 88.262050376000005 120 346.27756537599998 Adjusted Leverage 0.97670329079830498 <1.0 0.98475914727461644 TTM FY Q2'2024 Q3'2024 Q4'2025 Q1'2025 TTM US 254 261 251 222 988 0.84444444444444444 US 1008 0.84848484848484851 ROW 45 46 47 44 182 0.15555555555555556 ROW 179 0.15067340067340068 299 307 298 266 1170 1188 Total Sublocade 192 191 194 176 753 0.64358974358974363 Total Sublocade 756 0.64615384615384619 PERSERIS 13 8 9 4 34 2.9% PERSERIS 40 3.4% OPVEE 15 15 1.3% OPVEE 15 1.3% ROW - Ex 32 33 33 31 129 0.11025641025641025 ROW - Ex 127 0.10854700854700855 SUBOXONE 62 60 62 55 239 0.20427350427350427 SUBOXONE 250 0.21367521367521367 299 307 298 266 1170 100.0% 1188 1.0153846153846153 FY 2022 Income Statement: IFRS to US GAAP Bridge FY 2022 ($ millions, except per share data) US GAAP Adjustments IFRS Caption IFRS Total Change Reclassification US GAAP Caption US GAAP Total Net revenue $901 0 0 Net revenue $901 Cost of sales -,159 8 0 Cost of sales -,151 Gross profit 742 8 0 Gross profit 749 Selling, general & administrative -,763 -2 296 Selling, general & administrative -,469 Research & development -72 -2 0 Research & development -74 0 0 0 Acquired in-process research & development 0 0 0 -,296 Litigation settlement expenses -,296 Other operating income 8 0 0 Other operating income 8 Operating profit -85 4 0 Income from operations -81 Finance income 19 0 0 Interest income 19 Finance expense -29 2 0 Interest expense -27 Net finance expense -10 2 0 Interest expense, net -8 0 0 0 Other income 0 Profit before taxation -95 6 0 Income before income taxes -89 Income tax benefit 42 3 0 Provision for income taxes 44 Net income $-53 9 0 Net income -44 Diluted EPS $-0.38 Diluted EPS $-0.32 IFRS Net Income $-53 US GAAP Net Income $-44 Adjustments within cost of sales Adjustments within cost of sales Amortization of acquired intangibles 0 Amortization of acquired intangibles $0 Total adjustments within cost of sales 0 Total adjustments within cost of sales 0 Adjustments within SG&A Adjustments within SG&A Legal costs/provision 296 Legal costs/provision 296 Acquisition-related costs 0 Acquisition-related costs 0 U.S. listing costs 6 U.S. listing costs 6 Total adjustments within SG&A 302 Total adjustments within SG&A 302 Adjustments within net other operating income Adjustments within net other operating income Income recognized in relation to a supply agreement 0 Income recognized in relation to a supply agreement 0 Insurance reimbursement -5 Insurance reimbursement -5 Total adjustments within other net operating income -5 Total adjustments within other net operating income -5 Total adjustments before taxes 297 Total adjustments before taxes 297 Adjustments within tax Adjustments within tax Tax on adjustments -57 Tax on adjustments -57 Tax adjustments -18 Tax adjustments -20 Total adjustments within tax -75 Total adjustments within tax -77 Total adjustments 222 Total adjustments 220 IFRS Adjusted Net Income $169 GAAP Adjusted Net Income $176 Adjusted diluted EPS $1.1599999999999999 Adjusted diluted EPS $1.21 * - Columns and rows may not add and may change in final reporting due to rounding Reconciliation of Net Income to Non-GAAP Operating Income ($m) GAAP-------------------------------- IFRS-------------------- 2024 2023 2022 2021 2020 Net Income 7 -126 -42 205 -148 Revised 10Q Net Finance Income -23 -43 -19 -4 -9 10K Net Finance Expense 41 35 27 27 26 10K Income Tax Expense 13 -19 -43 -15 -25 Revised 10Q Total Adjustments 281 265 297 -25 244 2021-2020 from press Q4 2021 press release - total exceptionals Acquired In-process R&D 1 162 - - - Non-GAAP Operating Income 320 274 220 188 88 Net Revenue 1,188 1,093 901 791 647 Non-GAAP Operating Margin 0.26936026936026936 0.25068618481244281 0.24417314095449499 0.23767383059418457 0.13601236476043277 Reconciliation of Non-GAAP operating expenses GAAP-------------------------------- IFRS-------------------- 2024 2023 2022 2021 2020 Total Operating Expenses, net 919 1072 827 451 706 Other operating expense (income), net -4 9 8 32 - Acquired In-process R&D -1 -161.56400000000002 - - - Non-GAAP adjustments -235 -268 -302 -6 -244 Share based compesation -24 -22 -16 -11 -8 Non-GAAP operating expenses 655 630.43599999999992 517 466 454 Net Revenue 1,188 1,093 901 791 647 Non-GAAP operating expense % 0.55134680134680136 0.5767941445562671 0.57380688124306323 0.58912768647281921 0.70170015455950541
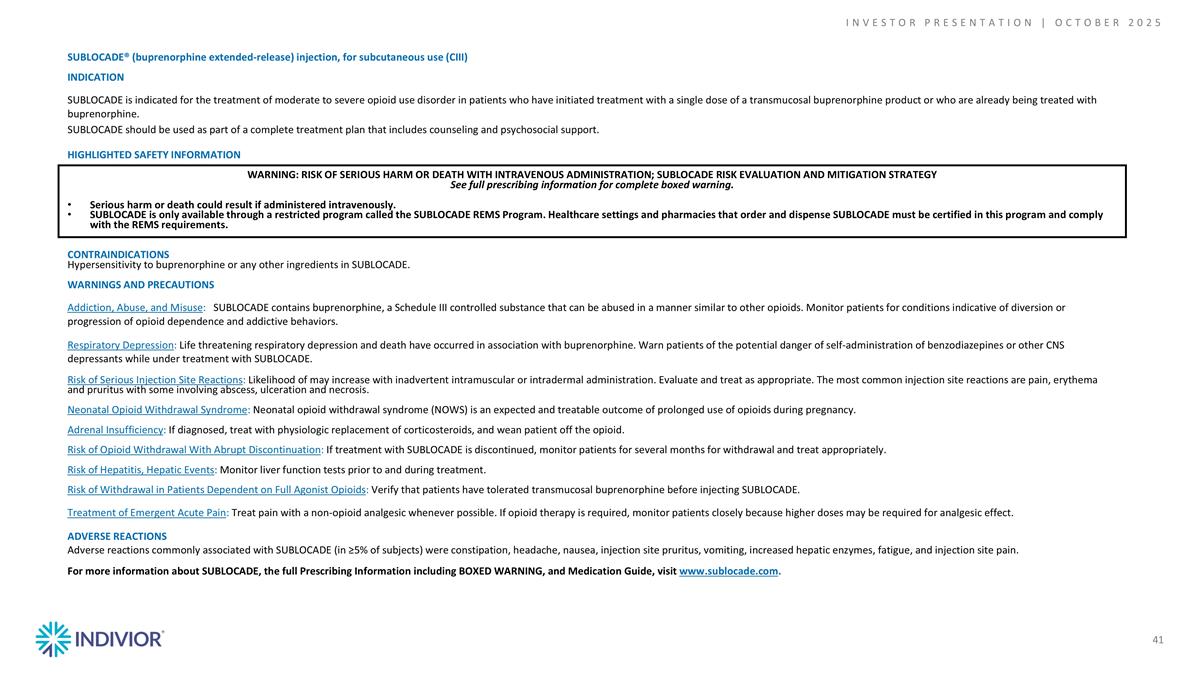
SUBLOCADE® (buprenorphine extended-release) injection, for subcutaneous use (CIII) INDICATION SUBLOCADE is indicated for the treatment of moderate to severe opioid use disorder in patients who have initiated treatment with a single dose of a transmucosal buprenorphine product or who are already being treated with buprenorphine. SUBLOCADE should be used as part of a complete treatment plan that includes counseling and psychosocial support. HIGHLIGHTED SAFETY INFORMATION WARNING: RISK OF SERIOUS HARM OR DEATH WITH INTRAVENOUS ADMINISTRATION; SUBLOCADE RISK EVALUATION AND MITIGATION STRATEGY See full prescribing information for complete boxed warning. Serious harm or death could result if administered intravenously. SUBLOCADE is only available through a restricted program called the SUBLOCADE REMS Program. Healthcare settings and pharmacies that order and dispense SUBLOCADE must be certified in this program and comply with the REMS requirements. CONTRAINDICATIONS Hypersensitivity to buprenorphine or any other ingredients in SUBLOCADE. WARNINGS AND PRECAUTIONS Addiction, Abuse, and Misuse: SUBLOCADE contains buprenorphine, a Schedule III controlled substance that can be abused in a manner similar to other opioids. Monitor patients for conditions indicative of diversion or progression of opioid dependence and addictive behaviors. Respiratory Depression: Life threatening respiratory depression and death have occurred in association with buprenorphine. Warn patients of the potential danger of self-administration of benzodiazepines or other CNS depressants while under treatment with SUBLOCADE. Risk of Serious Injection Site Reactions: Likelihood of may increase with inadvertent intramuscular or intradermal administration. Evaluate and treat as appropriate. The most common injection site reactions are pain, erythema and pruritus with some involving abscess, ulceration and necrosis. Neonatal Opioid Withdrawal Syndrome: Neonatal opioid withdrawal syndrome (NOWS) is an expected and treatable outcome of prolonged use of opioids during pregnancy. Adrenal Insufficiency: If diagnosed, treat with physiologic replacement of corticosteroids, and wean patient off the opioid. Risk of Opioid Withdrawal With Abrupt Discontinuation: If treatment with SUBLOCADE is discontinued, monitor patients for several months for withdrawal and treat appropriately. Risk of Hepatitis, Hepatic Events: Monitor liver function tests prior to and during treatment. Risk of Withdrawal in Patients Dependent on Full Agonist Opioids: Verify that patients have tolerated transmucosal buprenorphine before injecting SUBLOCADE. Treatment of Emergent Acute Pain: Treat pain with a non-opioid analgesic whenever possible. If opioid therapy is required, monitor patients closely because higher doses may be required for analgesic effect. ADVERSE REACTIONS Adverse reactions commonly associated with SUBLOCADE (in ≥5% of subjects) were constipation, headache, nausea, injection site pruritus, vomiting, increased hepatic enzymes, fatigue, and injection site pain. For more information about SUBLOCADE, the full Prescribing Information including BOXED WARNING, and Medication Guide, visit www.sublocade.com. 41 INVESTOR PRESENTATION | October 2025