Shareholder Report
Aug. 31, 2025
USD ($)
$ / shares
This report describes changes
to the Fund that occurred during the reporting period.
WHAT
WERE THE FUND COSTS FOR THE LAST YEAR? (based
on a hypothetical $10,000 investment)
|
Class
Name |
Costs
of a $10,000 investment
|
Costs
paid as a percentage of a $10,000
investment*
|
|
Class
A |
$139
|
1.27%
|
HOW
DID THE FUND PERFORM LAST YEAR AND WHAT AFFECTED ITS PERFORMANCE?
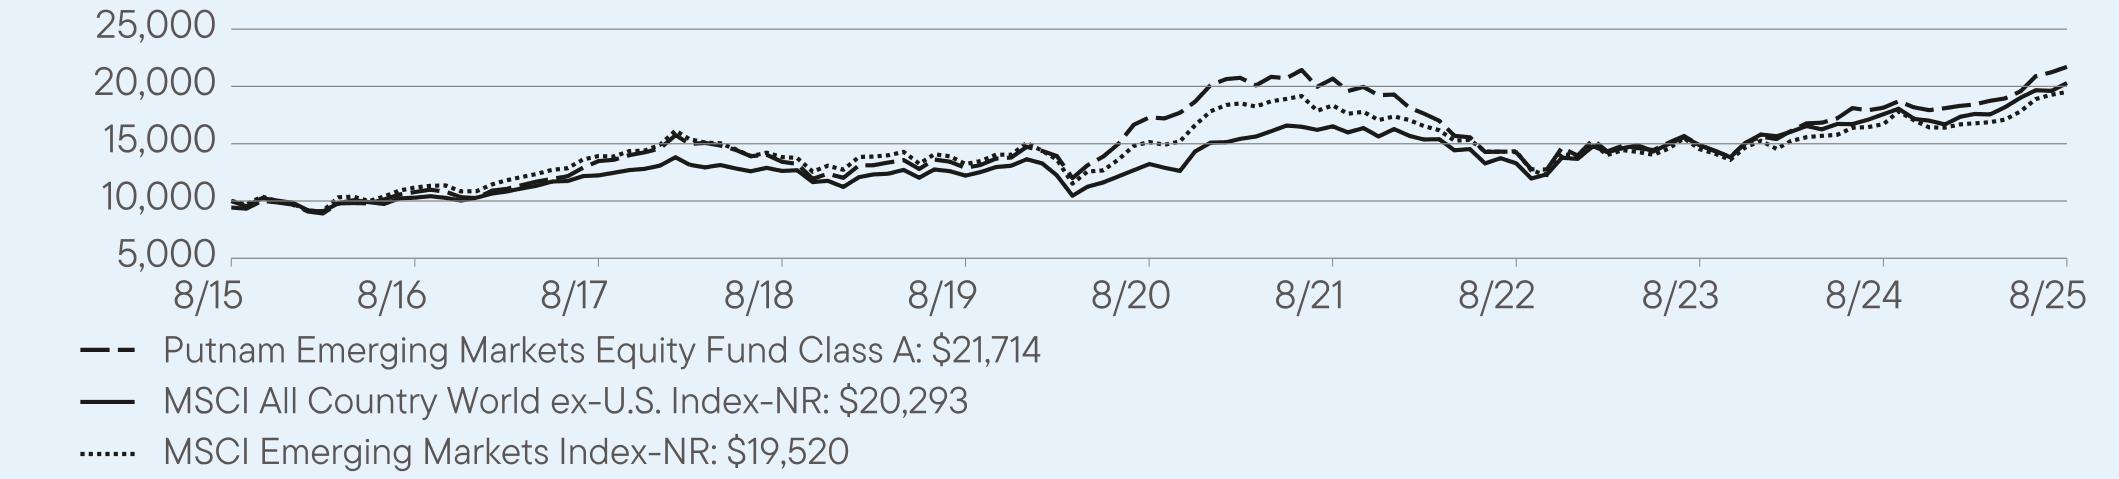
For the twelve months ended August
31, 2025, Class
A shares of Putnam Emerging Markets Equity Fund returned 19.66%.
The Fund compares its performance
to the MSCI Emerging Markets Index-NR, which returned 16.80% for the same period.
PERFORMANCE
HIGHLIGHTS
|
Top
contributors to performance: | |
|
↑
|
Overweight
position in Chinese technology company Xiaomi |
|
↑
|
Overweight
position in Chinese technology company Tencent |
|
↑
|
Overweight
position in Abu Dhabi Islamic Bank |
|
Top
detractors from performance: | |
|
↓
|
Underweight
exposure to Chinese technology company Alibaba Group |
|
↓
|
Overweight
position in Tata Consultancy Services, an India-based provider of information technology services |
|
↓
|
Overweight
position in Bank Central Asia, an Indonesian bank |
AVERAGE
ANNUAL TOTAL RETURNS (%) Period
Ended August 31, 2025
|
|
1
Year |
5
Year |
10
Year |
|
Class
A |
19.66
|
4.65
|
8.70
|
|
Class
A (with sales charge) |
12.78
|
3.41
|
8.06
|
|
MSCI
All Country World ex-U.S. Index-NR |
15.42
|
8.94
|
7.33
|
|
MSCI
Emerging Markets Index-NR |
16.80
|
5.21
|
6.92
|
For current month-end performance,
please call Franklin Templeton at (800)
225-1581 or visit
https://www.franklintempleton.com/investments/options/mutual-funds.
https://www.franklintempleton.com/investments/options/mutual-funds.
Important data provider notices
and terms available at www.franklintempletondatasources.com.
KEY
FUND STATISTICS (as
of August 31, 2025)
|
Total
Net Assets |
$500,029,214
|
|
Total
Number of Portfolio Holdings |
63
|
|
Total
Management Fee Paid |
$2,802,183
|
|
Portfolio
Turnover Rate |
96%
|
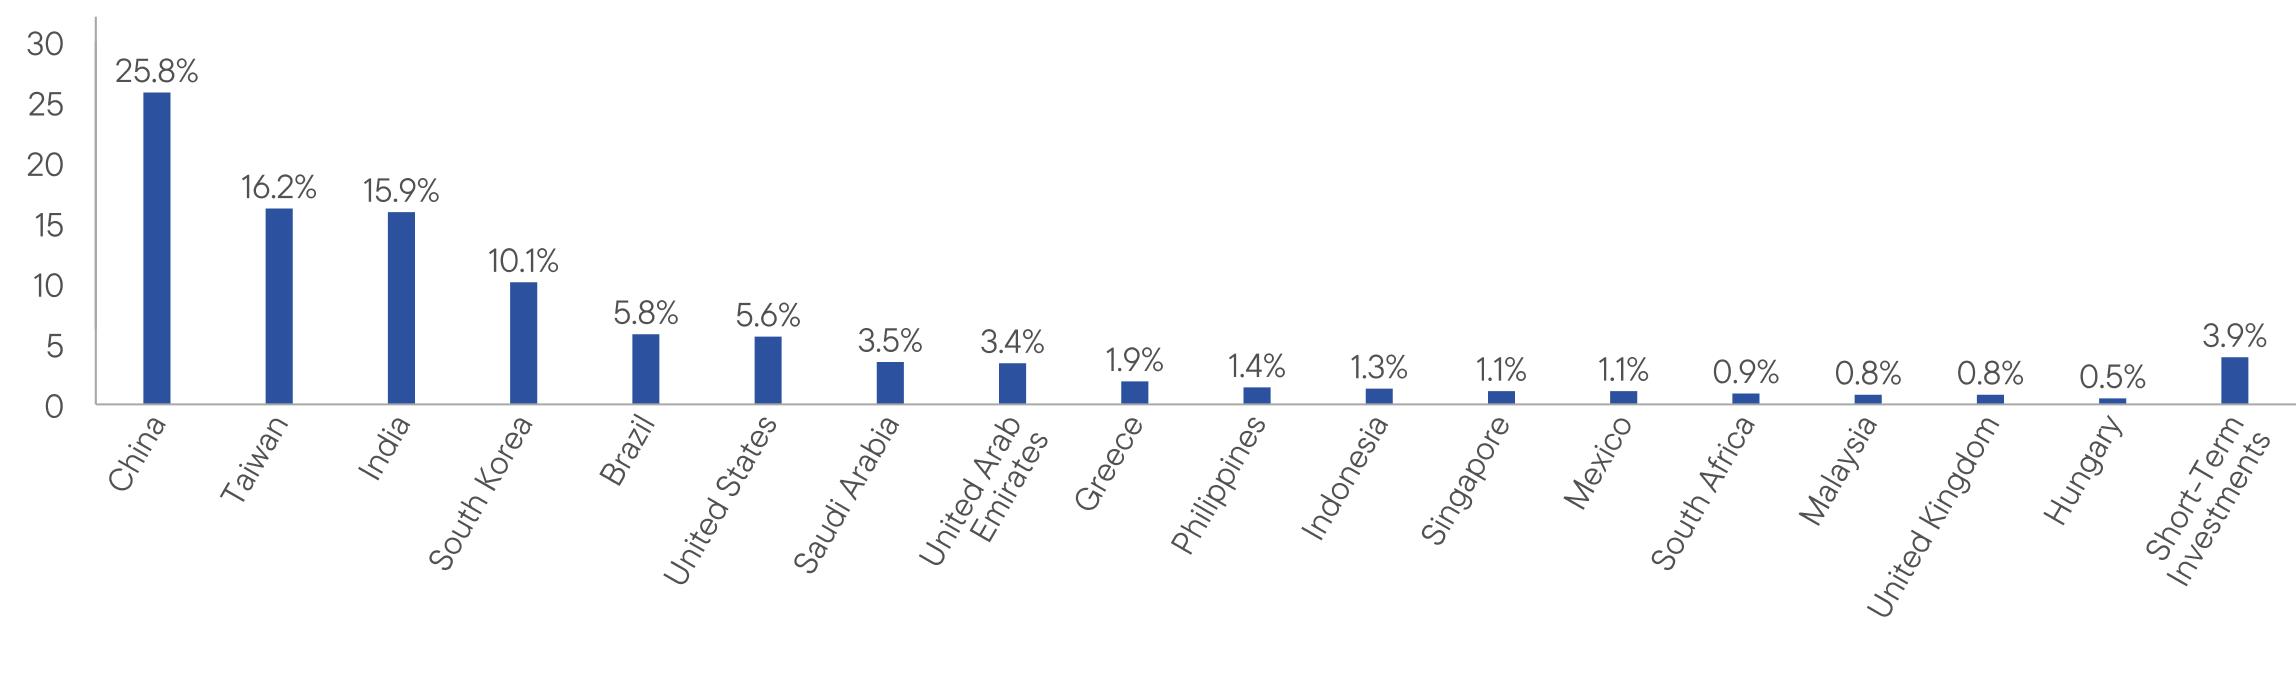
WHAT
DID THE FUND INVEST IN? (as
of August 31, 2025)
Portfolio Composition*
(% of Total Investments)

HOW
HAS THE FUND CHANGED?
Effective November 1, 2024 (the
“Effective Date”), Putnam Investments Limited (“PIL”), a sub-advisor of the Fund prior to the Effective Date,
merged with and into Franklin Templeton Investment Management Limited (“FTIML”), a wholly-owned subsidiary of Franklin Resources,
Inc. (the “Merger”). As of the Effective Date, PIL investment professionals became employees of FTIML, and the sub-advisory
agreement between Putnam Investment Management, LLC (“Putnam Management”) and PIL with respect to the Fund was
terminated. In connection with the Merger, the Fund’s Trustees approved a new sub-advisory agreement between Putnam Management
and FTIML, pursuant to which FTIML became a sub-advisor of the Fund on the Effective Date.
Effective September 5, 2024 (the
“Conversion Date”), class B shares of the Fund acquired prior to the Conversion Date converted automatically
to class A shares.
This is a summary of certain
changes to the Fund since September
1, 2024. For
more complete information, you may review the Fund’s current
prospectus and any applicable supplements and the Fund’s next prospectus, which we expect to be available by January
1, 2026, at https://www.franklintempleton.com/regulatory-fund-documents
or upon request at (800)
225-1581 or
funddocuments@putnam.com.
funddocuments@putnam.com.
This report describes changes
to the Fund that occurred during the reporting period.
WHAT
WERE THE FUND COSTS FOR THE LAST YEAR? (based
on a hypothetical $10,000 investment)
|
Class
Name |
Costs
of a $10,000 investment
|
Costs
paid as a percentage of a $10,000
investment*
|
|
Class
C |
$221
|
2.02%
|
HOW
DID THE FUND PERFORM LAST YEAR AND WHAT AFFECTED ITS PERFORMANCE?
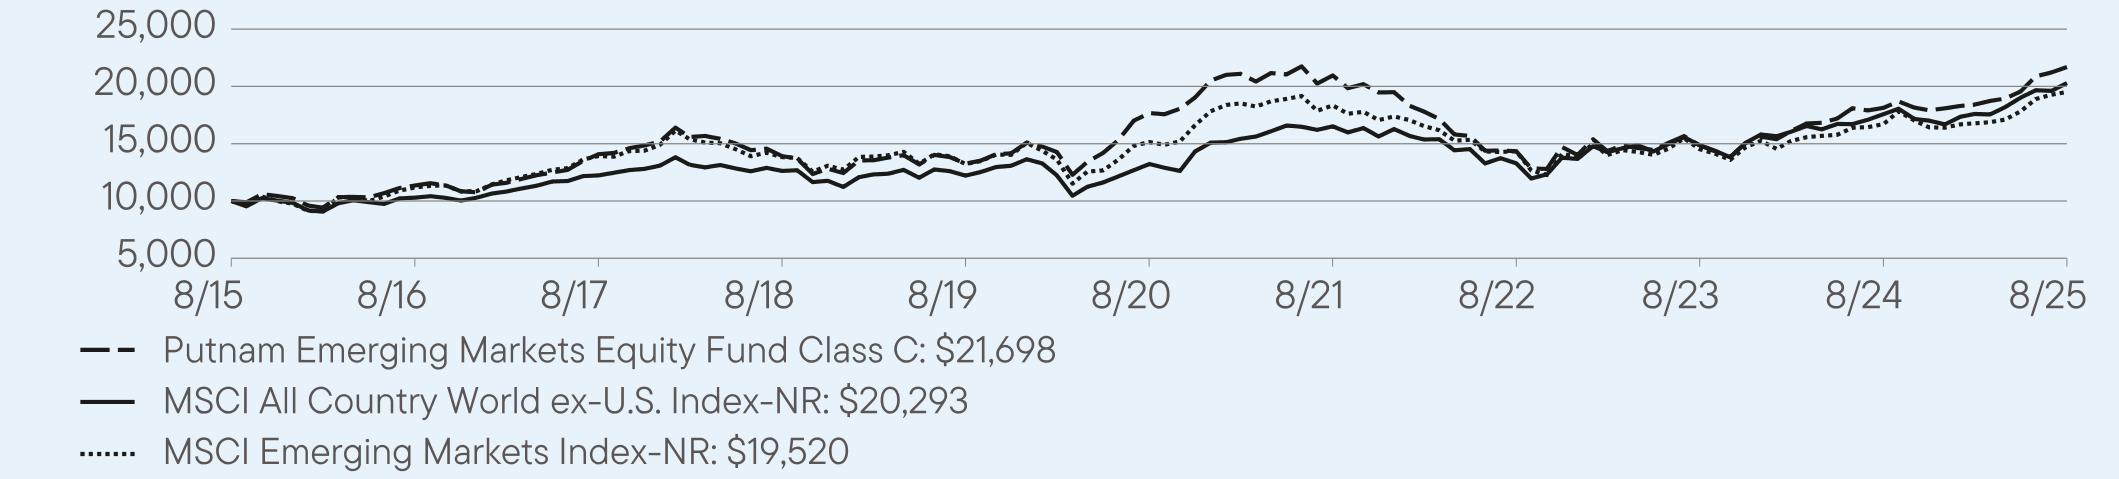
For the twelve months ended August
31, 2025, Class
C shares of Putnam Emerging Markets Equity Fund returned 18.69%.
The Fund compares its performance
to the MSCI Emerging Markets Index-NR, which returned 16.80% for the same period.
PERFORMANCE
HIGHLIGHTS
|
Top
contributors to performance: | |
|
↑
|
Overweight
position in Chinese technology company Xiaomi |
|
↑
|
Overweight
position in Chinese technology company Tencent |
|
↑
|
Overweight
position in Abu Dhabi Islamic Bank |
|
Top
detractors from performance: | |
|
↓
|
Underweight
exposure to Chinese technology company Alibaba Group |
|
↓
|
Overweight
position in Tata Consultancy Services, an India-based provider of information technology services |
|
↓
|
Overweight
position in Bank Central Asia, an Indonesian bank |
AVERAGE
ANNUAL TOTAL RETURNS (%) Period
Ended August 31, 2025
|
|
1
Year |
5
Year |
10
Year |
|
Class
C |
18.69
|
3.85
|
8.05
|
|
Class
C (with sales charge) |
17.69
|
3.85
|
8.05
|
|
MSCI
All Country World ex-U.S. Index-NR |
15.42
|
8.94
|
7.33
|
|
MSCI
Emerging Markets Index-NR |
16.80
|
5.21
|
6.92
|
For current month-end performance,
please call Franklin Templeton at (800)
225-1581 or visit
https://www.franklintempleton.com/investments/options/mutual-funds.
https://www.franklintempleton.com/investments/options/mutual-funds.
Important data provider notices
and terms available at www.franklintempletondatasources.com.
KEY
FUND STATISTICS (as
of August 31, 2025)
|
Total
Net Assets |
$500,029,214
|
|
Total
Number of Portfolio Holdings |
63
|
|
Total
Management Fee Paid |
$2,802,183
|
|
Portfolio
Turnover Rate |
96%
|
WHAT
DID THE FUND INVEST IN? (as
of August 31, 2025)
Portfolio Composition*
(% of Total Investments)
HOW
HAS THE FUND CHANGED?
Effective November 1, 2024 (the
“Effective Date”), Putnam Investments Limited (“PIL”), a sub-advisor of the Fund prior to the Effective Date,
merged with and into Franklin Templeton Investment Management Limited (“FTIML”), a wholly-owned subsidiary of Franklin Resources,
Inc. (the “Merger”). As of the Effective Date, PIL investment professionals became employees of FTIML, and the sub-advisory
agreement between Putnam Investment Management, LLC (“Putnam Management”) and PIL with respect to the Fund was
terminated. In connection with the Merger, the Fund’s Trustees approved a new sub-advisory agreement between Putnam Management
and FTIML, pursuant to which FTIML became a sub-advisor of the Fund on the Effective Date.
This is a summary of certain
changes to the Fund since September
1, 2024. For
more complete information, you may review the Fund’s current
prospectus and any applicable supplements and the Fund’s next prospectus, which we expect to be available by January
1, 2026, at https://www.franklintempleton.com/regulatory-fund-documents
or upon request at (800)
225-1581 or
funddocuments@putnam.com.
funddocuments@putnam.com.
This report describes changes
to the Fund that occurred during the reporting period.
WHAT
WERE THE FUND COSTS FOR THE LAST YEAR? (based
on a hypothetical $10,000 investment)
|
Class
Name |
Costs
of a $10,000 investment
|
Costs
paid as a percentage of a $10,000
investment*
|
|
Class
R |
$167
|
1.52%
|
HOW
DID THE FUND PERFORM LAST YEAR AND WHAT AFFECTED ITS PERFORMANCE?
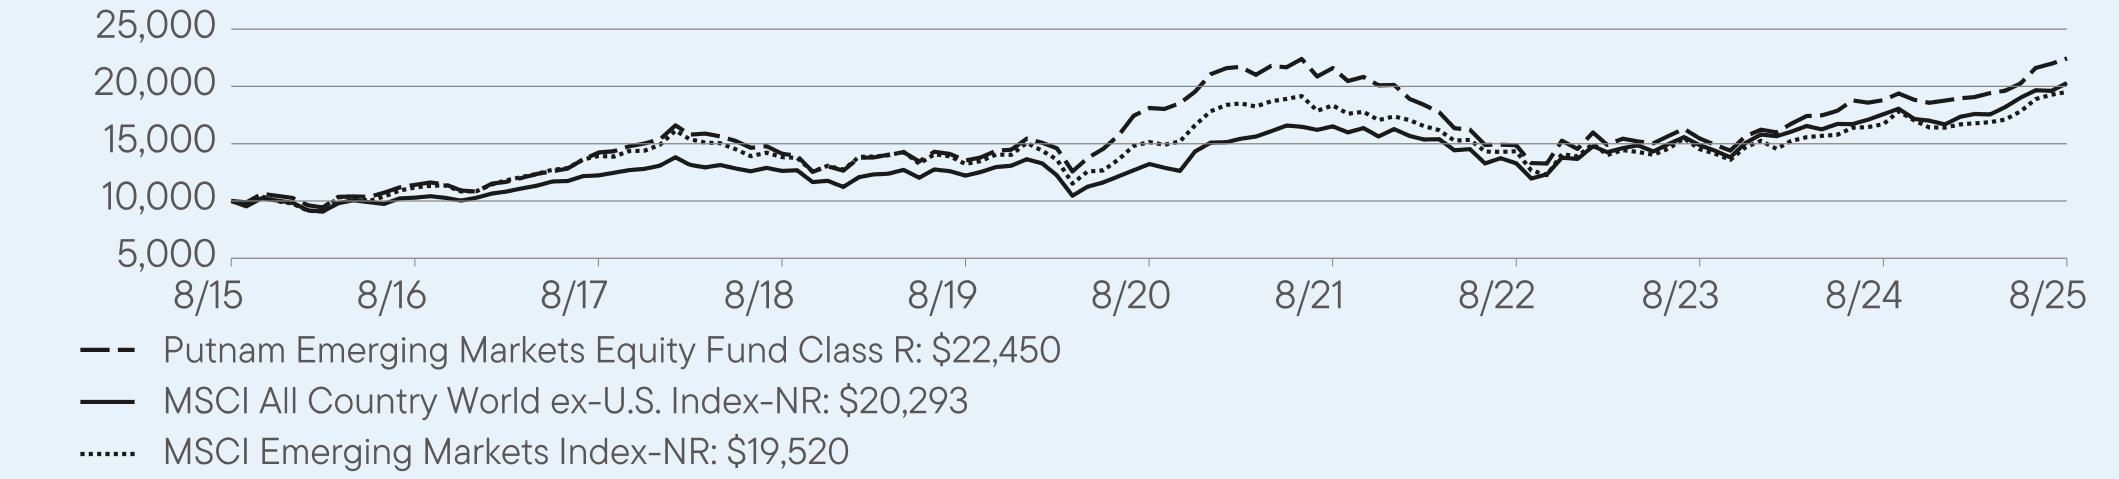
For the twelve months ended August
31, 2025, Class
R shares of Putnam Emerging Markets Equity Fund returned 19.36%.
The Fund compares its performance
to the MSCI Emerging Markets Index-NR, which returned 16.80% for the same period.
PERFORMANCE
HIGHLIGHTS
|
Top
contributors to performance: | |
|
↑
|
Overweight
position in Chinese technology company Xiaomi |
|
↑
|
Overweight
position in Chinese technology company Tencent |
|
↑
|
Overweight
position in Abu Dhabi Islamic Bank |
|
Top
detractors from performance: | |
|
↓
|
Underweight
exposure to Chinese technology company Alibaba Group |
|
↓
|
Overweight
position in Tata Consultancy Services, an India-based provider of information technology services |
|
↓
|
Overweight
position in Bank Central Asia, an Indonesian bank |
AVERAGE
ANNUAL TOTAL RETURNS (%) Period
Ended August 31, 2025
|
|
1
Year |
5
Year |
10
Year |
|
Class
R |
19.36
|
4.38
|
8.42
|
|
MSCI
All Country World ex-U.S. Index-NR |
15.42
|
8.94
|
7.33
|
|
MSCI
Emerging Markets Index-NR |
16.80
|
5.21
|
6.92
|
For current month-end performance,
please call Franklin Templeton at (800)
225-1581 or visit
https://www.franklintempleton.com/investments/options/mutual-funds.
https://www.franklintempleton.com/investments/options/mutual-funds.
Important data provider notices
and terms available at www.franklintempletondatasources.com.
KEY
FUND STATISTICS (as
of August 31, 2025)
|
Total
Net Assets |
$500,029,214
|
|
Total
Number of Portfolio Holdings |
63
|
|
Total
Management Fee Paid |
$2,802,183
|
|
Portfolio
Turnover Rate |
96%
|
WHAT
DID THE FUND INVEST IN? (as
of August 31, 2025)
Portfolio Composition*
(% of Total Investments)

HOW
HAS THE FUND CHANGED?
Effective November 1, 2024 (the
“Effective Date”), Putnam Investments Limited (“PIL”), a sub-advisor of the Fund prior to the Effective Date,
merged with and into Franklin Templeton Investment Management Limited (“FTIML”), a wholly-owned subsidiary of Franklin Resources,
Inc. (the “Merger”). As of the Effective Date, PIL investment professionals became employees of FTIML, and the sub-advisory
agreement between Putnam Investment Management, LLC (“Putnam Management”) and PIL with respect to the Fund was
terminated. In connection with the Merger, the Fund’s Trustees approved a new sub-advisory agreement between Putnam Management
and FTIML, pursuant to which FTIML became a sub-advisor of the Fund on the Effective Date.
This is a summary of certain
changes to the Fund since September
1, 2024. For
more complete information, you may review the Fund’s current
prospectus and any applicable supplements and the Fund’s next prospectus, which we expect to be available by January
1, 2026, at https://www.franklintempleton.com/regulatory-fund-documents
or upon request at (800)
225-1581 or
funddocuments@putnam.com.
funddocuments@putnam.com.
This report describes changes
to the Fund that occurred during the reporting period.
WHAT
WERE THE FUND COSTS FOR THE LAST YEAR? (based
on a hypothetical $10,000 investment)
|
Class
Name |
Costs
of a $10,000 investment
|
Costs
paid as a percentage of a $10,000
investment*
|
|
Class
R6 |
$95
|
0.87%
|
HOW
DID THE FUND PERFORM LAST YEAR AND WHAT AFFECTED ITS PERFORMANCE?
For the twelve months ended August
31, 2025, Class
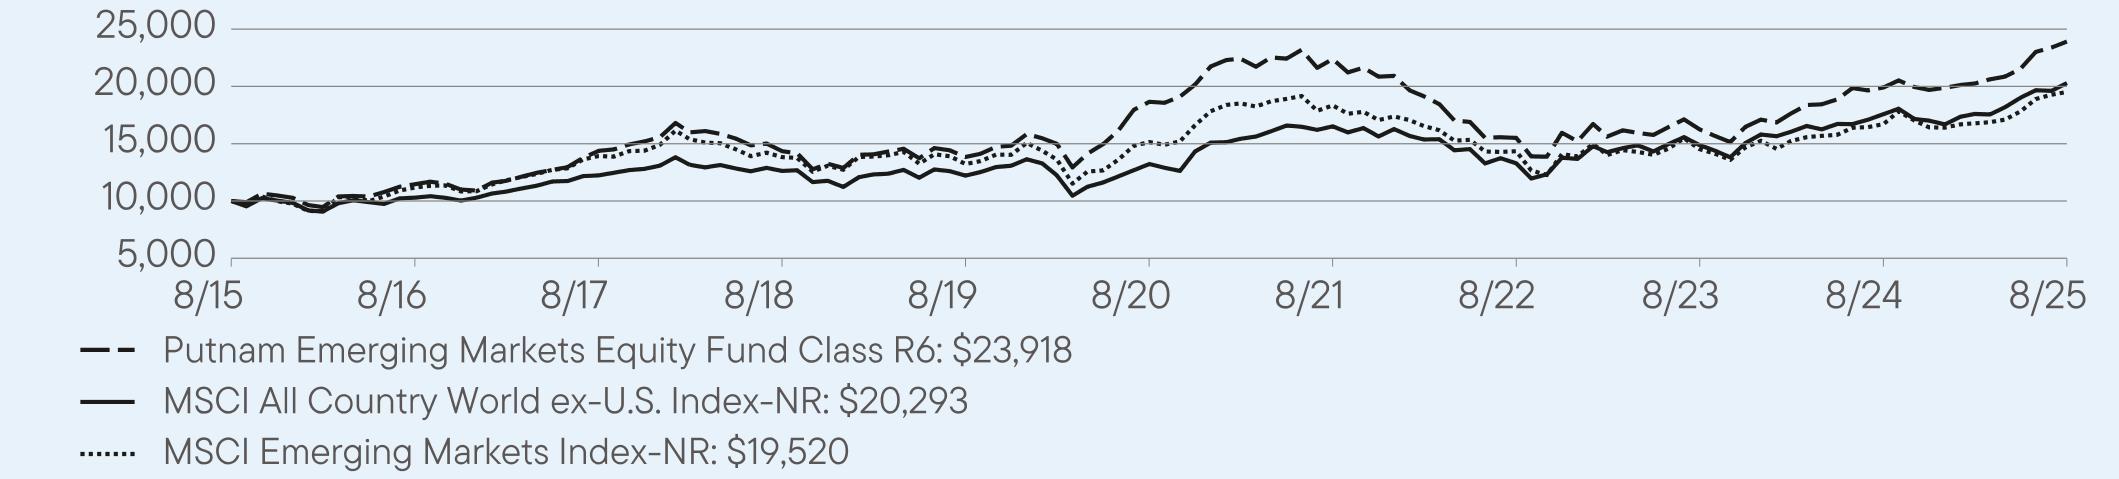
R6 shares of Putnam Emerging Markets Equity Fund returned 20.13%.
The Fund compares its performance
to the MSCI Emerging Markets Index-NR, which returned 16.80% for the same period.
PERFORMANCE
HIGHLIGHTS
|
Top
contributors to performance: | |
|
↑
|
Overweight
position in Chinese technology company Xiaomi |
|
↑
|
Overweight
position in Chinese technology company Tencent |
|
↑
|
Overweight
position in Abu Dhabi Islamic Bank |
|
Top
detractors from performance: | |
|
↓
|
Underweight
exposure to Chinese technology company Alibaba Group |
|
↓
|
Overweight
position in Tata Consultancy Services, an India-based provider of information technology services |
|
↓
|
Overweight
position in Bank Central Asia, an Indonesian bank |
AVERAGE
ANNUAL TOTAL RETURNS (%) Period
Ended August 31, 2025
|
|
1
Year |
5
Year |
10
Year |
|
Class
R6 |
20.13
|
5.09
|
9.11
|
|
MSCI
All Country World ex-U.S. Index-NR |
15.42
|
8.94
|
7.33
|
|
MSCI
Emerging Markets Index-NR |
16.80
|
5.21
|
6.92
|
For current month-end performance,
please call Franklin Templeton at (800)
225-1581 or visit
https://www.franklintempleton.com/investments/options/mutual-funds.
https://www.franklintempleton.com/investments/options/mutual-funds.
Important data provider notices
and terms available at www.franklintempletondatasources.com.
KEY
FUND STATISTICS (as
of August 31, 2025)
|
Total
Net Assets |
$500,029,214
|
|
Total
Number of Portfolio Holdings |
63
|
|
Total
Management Fee Paid |
$2,802,183
|
|
Portfolio
Turnover Rate |
96%
|
WHAT
DID THE FUND INVEST IN? (as
of August 31, 2025)
Portfolio Composition*
(% of Total Investments)

HOW
HAS THE FUND CHANGED?
Effective November 1, 2024 (the
“Effective Date”), Putnam Investments Limited (“PIL”), a sub-advisor of the Fund prior to the Effective Date,
merged with and into Franklin Templeton Investment Management Limited (“FTIML”), a wholly-owned subsidiary of Franklin Resources,
Inc. (the “Merger”). As of the Effective Date, PIL investment professionals became employees of FTIML, and the sub-advisory
agreement between Putnam Investment Management, LLC (“Putnam Management”) and PIL with respect to the Fund was
terminated. In connection with the Merger, the Fund’s Trustees approved a new sub-advisory agreement between Putnam Management
and FTIML, pursuant to which FTIML became a sub-advisor of the Fund on the Effective Date.
This is a summary of certain
changes to the Fund since September
1, 2024. For
more complete information, you may review the Fund’s current
prospectus and any applicable supplements and the Fund’s next prospectus, which we expect to be available by January
1, 2026, at https://www.franklintempleton.com/regulatory-fund-documents
or upon request at (800)
225-1581 or
funddocuments@putnam.com.
funddocuments@putnam.com.
This report describes changes
to the Fund that occurred during the reporting period.
WHAT
WERE THE FUND COSTS FOR THE LAST YEAR? (based
on a hypothetical $10,000 investment)
|
Class
Name |
Costs
of a $10,000 investment
|
Costs
paid as a percentage of a $10,000
investment*
|
|
Class
Y |
$112
|
1.02%
|
HOW
DID THE FUND PERFORM LAST YEAR AND WHAT AFFECTED ITS PERFORMANCE?
For the twelve months ended August
31, 2025, Class
Y shares of Putnam Emerging Markets Equity Fund returned 19.99%.
The Fund compares its performance
to the MSCI Emerging Markets Index-NR, which returned 16.80% for the same period.
PERFORMANCE
HIGHLIGHTS
|
Top
contributors to performance: | |
|
↑
|
Overweight
position in Chinese technology company Xiaomi |
|
↑
|
Overweight
position in Chinese technology company Tencent |
|
↑
|
Overweight
position in Abu Dhabi Islamic Bank |
|
Top
detractors from performance: | |
|
↓
|
Underweight
exposure to Chinese technology company Alibaba Group |
|
↓
|
Overweight
position in Tata Consultancy Services, an India-based provider of information technology services |
|
↓
|
Overweight
position in Bank Central Asia, an Indonesian bank |

AVERAGE
ANNUAL TOTAL RETURNS (%) Period
Ended August 31, 2025
|
|
1
Year |
5
Year |
10
Year |
|
Class
Y |
19.99
|
4.91
|
8.97
|
|
MSCI
All Country World ex-U.S. Index-NR |
15.42
|
8.94
|
7.33
|
|
MSCI
Emerging Markets Index-NR |
16.80
|
5.21
|
6.92
|
For current month-end performance,
please call Franklin Templeton at (800)
225-1581 or visit
https://www.franklintempleton.com/investments/options/mutual-funds.
https://www.franklintempleton.com/investments/options/mutual-funds.
Important data provider notices
and terms available at www.franklintempletondatasources.com.
KEY
FUND STATISTICS (as
of August 31, 2025)
|
Total
Net Assets |
$500,029,214
|
|
Total
Number of Portfolio Holdings |
63
|
|
Total
Management Fee Paid |
$2,802,183
|
|
Portfolio
Turnover Rate |
96%
|
WHAT
DID THE FUND INVEST IN? (as
of August 31, 2025)
Portfolio Composition*
(% of Total Investments)

HOW
HAS THE FUND CHANGED?
Effective November 1, 2024 (the
“Effective Date”), Putnam Investments Limited (“PIL”), a sub-advisor of the Fund prior to the Effective Date,
merged with and into Franklin Templeton Investment Management Limited (“FTIML”), a wholly-owned subsidiary of Franklin Resources,
Inc. (the “Merger”). As of the Effective Date, PIL investment professionals became employees of FTIML, and the sub-advisory
agreement between Putnam Investment Management, LLC (“Putnam Management”) and PIL with respect to the Fund was
terminated. In connection with the Merger, the Fund’s Trustees approved a new sub-advisory agreement between Putnam Management
and FTIML, pursuant to which FTIML became a sub-advisor of the Fund on the Effective Date.
This is a summary of certain
changes to the Fund since September
1, 2024. For
more complete information, you may review the Fund’s current
prospectus and any applicable supplements and the Fund’s next prospectus, which we expect to be available by January
1, 2026, at https://www.franklintempleton.com/regulatory-fund-documents
or upon request at (800)
225-1581 or
funddocuments@putnam.com.
funddocuments@putnam.com.
| [1] |
|
||
| [2] |
|
||
| [3] |
|
||
| [4] |
|
||
| [5] |
|
||
| [6] |
|
||
| [7] |
|
||
| [8] |
|
||
| [9] |
|
||
| [10] |
|