Shareholder Report
Aug. 31, 2025
USD ($)
$ / shares
This report describes changes
to the Fund that occurred during the reporting period.
WHAT
WERE THE FUND COSTS FOR THE LAST YEAR? (based
on a hypothetical $10,000 investment)
|
Class
Name |
Costs
of a $10,000 investment
|
Costs
paid as a percentage of a $10,000
investment*
|
|
Class
A |
$115
|
1.10%
|
HOW
DID THE FUND PERFORM LAST YEAR AND WHAT AFFECTED ITS PERFORMANCE?
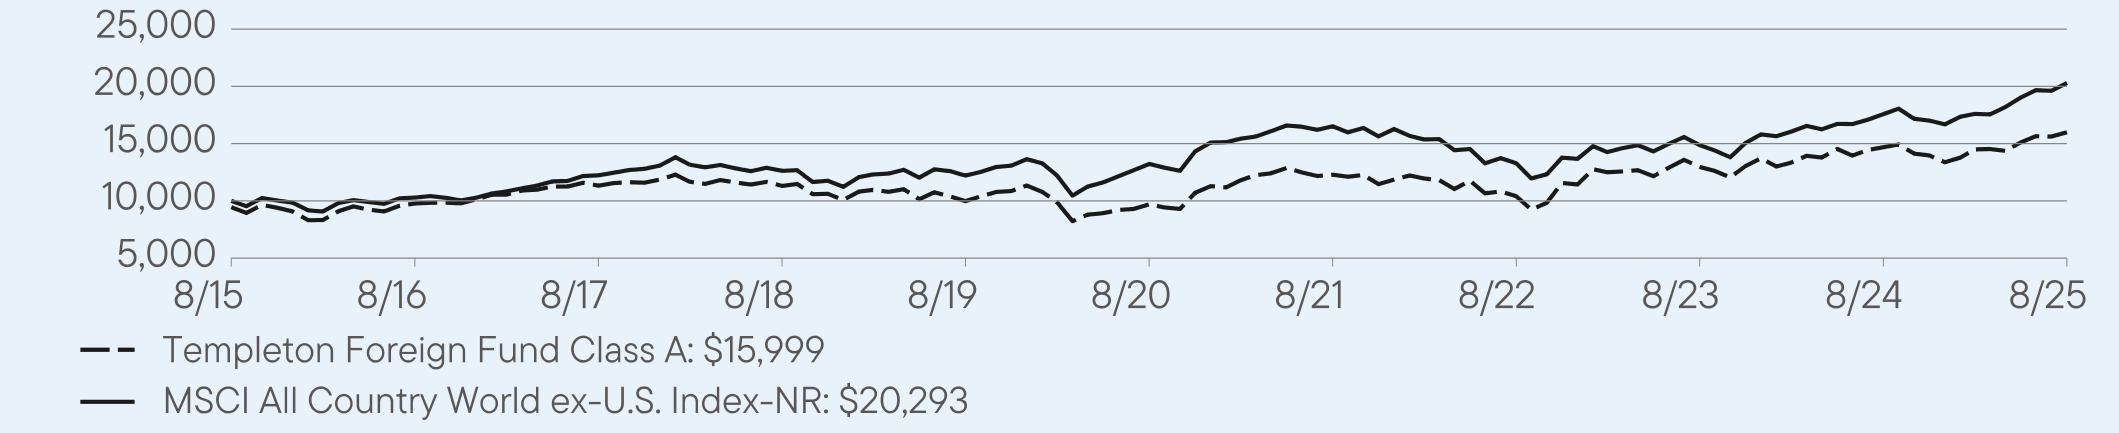
For the twelve months ended August
31, 2025, Class A shares of
Templeton Foreign Fund returned 8.91%.
The Fund compares its performance
to the MSCI All Country World ex U.S. Index-NR, which returned 15.42% for the same period.
PERFORMANCE
HIGHLIGHTS
|
Top
contributors to performance: | |
|
↑
|
Standard
Chartered, an emerging market-focused bank, delivered a strong year overall, with shares supported by robust earnings growth
and capital returns. The bank benefited from higher income in wealth and markets divisions, disciplined cost control, and multiple
share buybacks through mid-2025, which bolstered investor confidence. |
|
↑
|
Alibaba
Group, China’s leading e-commerce and cloud provider, saw shares recover strongly over the year as artificial intelligence
(AI)-driven growth and cloud momentum boosted sentiment. Active buybacks and supportive policy measures added tailwinds,
though volatility persisted amid regulatory uncertainty and competitive pressures. |
|
↑
|
Dassault
Aviation, the French aerospace and defense group behind Rafale jets and Falcon business aircraft, saw strong share gains
over the year. Performance was supported by solid results, a healthy order backlog and a new buyback program, though supply
chain issues and political uncertainty added some volatility. |
|
Top
detractors from performance: | |
|
↓
|
Ørsted
A/S, a Danish multinational energy company was the leading stock detractor. Much of its negative contribution related to developments
late in the period which included an announcement of a rights issue to shore up its balance sheet along with a U.S. ‘stop
work’ order on a major offshore wind project. |
|
↓
|
Persimmon,
one of the UK’s largest housebuilders, saw its shares decline as higher mortgage rates and affordability challenges weighed
on demand. Despite some improvement in its order book, persistent cost pressures and regulatory burdens kept margins under
strain, leaving investor sentiment cautious. |
|
↓
|
Stellantis,
the multinational carmaker, saw its shares fall over the period as profits slumped and restructuring risks grew. Losses were
driven by weaker sales, higher costs and large charges from program cancellations, while tariffs and a negative product mix added
pressure. Investor confidence was further hit by suspended guidance and a credit outlook downgrade |
AVERAGE
ANNUAL TOTAL RETURNS (%) Period
Ended August 31, 2025
|
|
1
Year |
5
Year |
10
Year |
|
Class
A |
8.91
|
10.51
|
5.41
|
|
Class
A (with sales charge) |
2.93
|
9.28
|
4.82
|
|
MSCI
All Country World ex-U.S. Index-NR |
15.42
|
8.94
|
7.33
|
For current month-end performance,
please call Franklin Templeton at (800)
DIAL BEN/342-5236 or visit
https://www.franklintempleton.com/investments/options/mutual-funds.
https://www.franklintempleton.com/investments/options/mutual-funds.
Important data provider notices
and terms available at www.franklintempletondatasources.com.
KEY
FUND STATISTICS (as
of August 31, 2025)
|
Total
Net Assets |
$2,582,933,485
|
|
Total
Number of Portfolio Holdings |
46
|
|
Total
Management Fee Paid |
$16,809,875
|
|
Portfolio
Turnover Rate |
44.39%
|
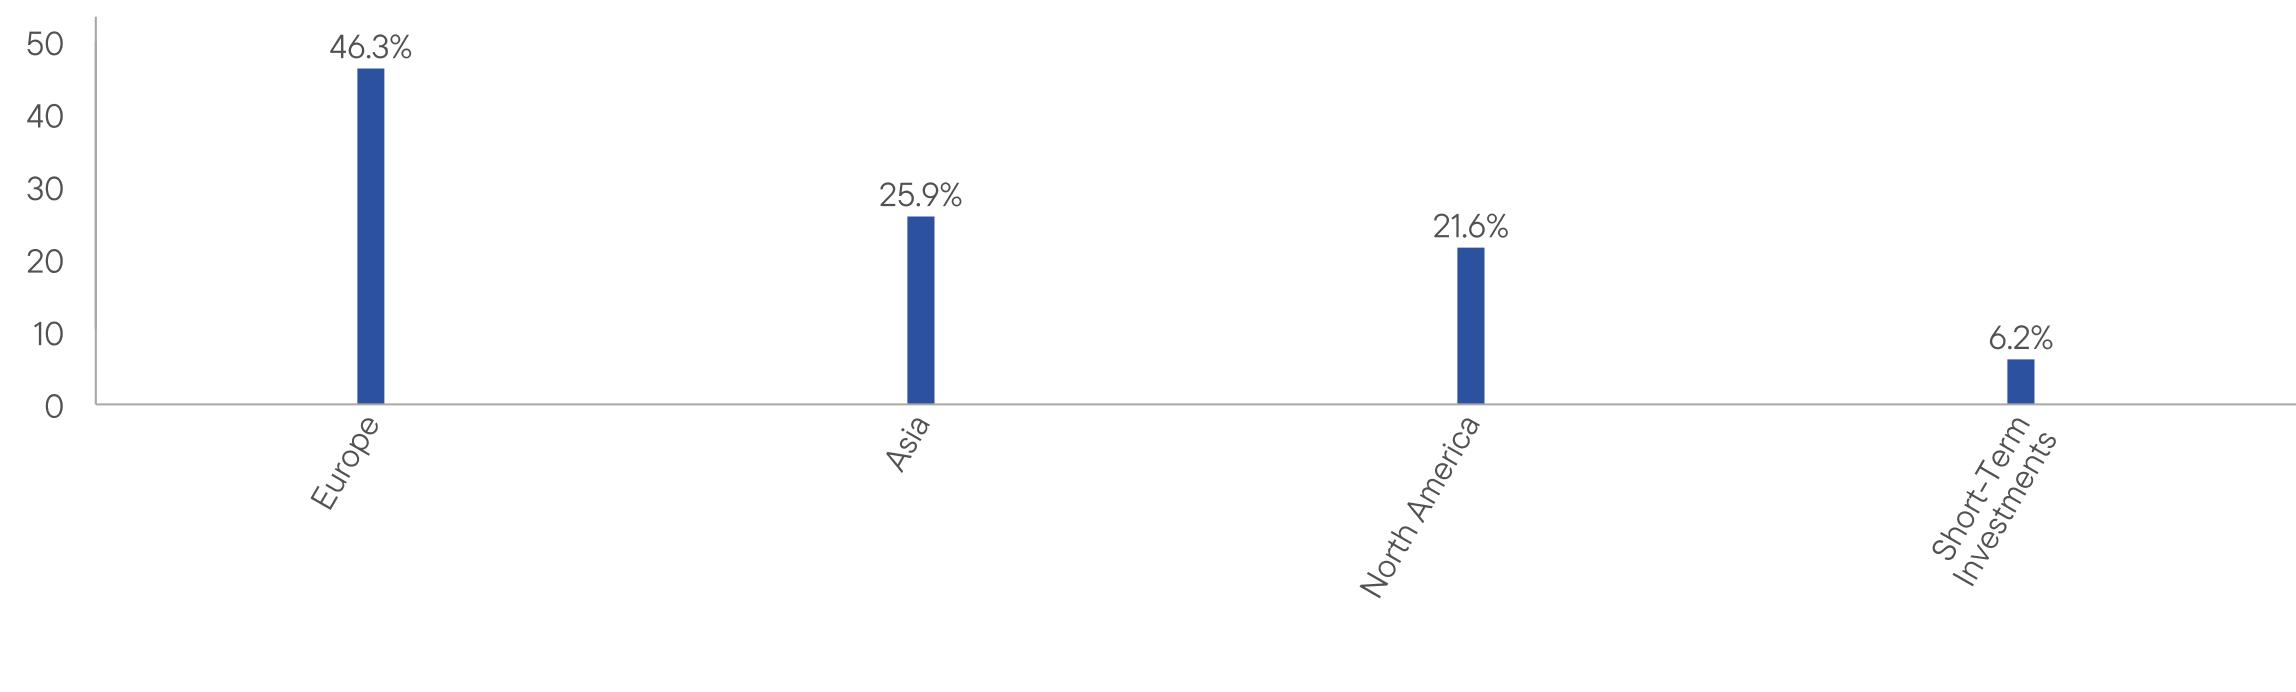
WHAT
DID THE FUND INVEST IN? (as
of August 31, 2025)
Portfolio Composition*
(% of Total Investments)

HOW
HAS THE FUND CHANGED?
Effective December 31, 2024,
Peter M. Moeschter retired and stepped down as a member of the Fund’s portfolio management team.
This is a summary of a change
to the Fund since September
1, 2024. For
more complete information, you may review the Fund’s current prospectus
and any applicable supplements and the Fund’s next prospectus, which we expect to be available by January 1, 2026,
at https://www.franklintempleton.com/regulatory-fund-documents or upon request at (800) DIAL BEN/342-5236 or
prospectus.us.franklintempleton@fisglobal.com.
at https://www.franklintempleton.com/regulatory-fund-documents or upon request at (800) DIAL BEN/342-5236 or
prospectus.us.franklintempleton@fisglobal.com.
This report describes changes
to the Fund that occurred during the reporting period.
WHAT
WERE THE FUND COSTS FOR THE LAST YEAR? (based
on a hypothetical $10,000 investment)
|
Class
Name |
Costs
of a $10,000 investment
|
Costs
paid as a percentage of a $10,000
investment*
|
|
Class
C |
$193
|
1.85%
|
HOW
DID THE FUND PERFORM LAST YEAR AND WHAT AFFECTED ITS PERFORMANCE?
For the twelve months ended August
31, 2025, Class C shares of
Templeton Foreign Fund returned 8.13%.
The Fund compares its performance
to the MSCI All Country World ex U.S. Index-NR, which returned 15.42% for the same period.
PERFORMANCE
HIGHLIGHTS
|
Top
contributors to performance: | |
|
↑
|
Standard
Chartered, an emerging market-focused bank, delivered a strong year overall, with shares supported by robust earnings growth
and capital returns. The bank benefited from higher income in wealth and markets divisions, disciplined cost control, and multiple
share buybacks through mid-2025, which bolstered investor confidence. |
|
↑
|
Alibaba
Group, China’s leading e-commerce and cloud provider, saw shares recover strongly over the year as artificial intelligence
(AI)-driven growth and cloud momentum boosted sentiment. Active buybacks and supportive policy measures added tailwinds,
though volatility persisted amid regulatory uncertainty and competitive pressures. |
|
↑
|
Dassault
Aviation, the French aerospace and defense group behind Rafale jets and Falcon business aircraft, saw strong share gains
over the year. Performance was supported by solid results, a healthy order backlog and a new buyback program, though supply
chain issues and political uncertainty added some volatility. |
|
Top
detractors from performance: | |
|
↓
|
Ørsted
A/S, a Danish multinational energy company was the leading stock detractor. Much of its negative contribution related to developments
late in the period which included an announcement of a rights issue to shore up its balance sheet along with a U.S. ‘stop
work’ order on a major offshore wind project. |
|
↓
|
Persimmon,
one of the UK’s largest housebuilders, saw its shares decline as higher mortgage rates and affordability challenges weighed
on demand. Despite some improvement in its order book, persistent cost pressures and regulatory burdens kept margins under
strain, leaving investor sentiment cautious. |
|
↓
|
Stellantis,
the multinational carmaker, saw its shares fall over the period as profits slumped and restructuring risks grew. Losses were
driven by weaker sales, higher costs and large charges from program cancellations, while tariffs and a negative product mix added
pressure. Investor confidence was further hit by suspended guidance and a credit outlook downgrade |

AVERAGE
ANNUAL TOTAL RETURNS (%) Period
Ended August 31, 2025
|
|
1
Year |
5
Year |
10
Year |
|
Class
C |
8.13
|
9.66
|
4.61
|
|
Class
C (with sales charge) |
7.13
|
9.66
|
4.61
|
|
MSCI
All Country World ex-U.S. Index-NR |
15.42
|
8.94
|
7.33
|
For current month-end performance,
please call Franklin Templeton at (800)
DIAL BEN/342-5236 or visit
https://www.franklintempleton.com/investments/options/mutual-funds.
https://www.franklintempleton.com/investments/options/mutual-funds.
Important data provider notices
and terms available at www.franklintempletondatasources.com.
KEY
FUND STATISTICS (as
of August 31, 2025)
|
Total
Net Assets |
$2,582,933,485
|
|
Total
Number of Portfolio Holdings |
46
|
|
Total
Management Fee Paid |
$16,809,875
|
|
Portfolio
Turnover Rate |
44.39%
|
WHAT
DID THE FUND INVEST IN? (as
of August 31, 2025)
Portfolio Composition*
(% of Total Investments)

HOW
HAS THE FUND CHANGED?
Effective December 31, 2024,
Peter M. Moeschter retired and stepped down as a member of the Fund’s portfolio management team.
This is a summary of a change
to the Fund since September
1, 2024. For
more complete information, you may review the Fund’s current prospectus
and any applicable supplements and the Fund’s next prospectus, which we expect to be available by January 1, 2026,
at https://www.franklintempleton.com/regulatory-fund-documents or upon request at (800) DIAL BEN/342-5236 or
prospectus.us.franklintempleton@fisglobal.com.
at https://www.franklintempleton.com/regulatory-fund-documents or upon request at (800) DIAL BEN/342-5236 or
prospectus.us.franklintempleton@fisglobal.com.
This report describes changes
to the Fund that occurred during the reporting period.
WHAT
WERE THE FUND COSTS FOR THE LAST YEAR? (based
on a hypothetical $10,000 investment)
|
Class
Name |
Costs
of a $10,000 investment
|
Costs
paid as a percentage of a $10,000
investment*
|
|
Class
R |
$141
|
1.35%
|
HOW
DID THE FUND PERFORM LAST YEAR AND WHAT AFFECTED ITS PERFORMANCE?
For the twelve months ended August
31, 2025, Class R shares of
Templeton Foreign Fund returned 8.63%.
The Fund compares its performance
to the MSCI All Country World ex U.S. Index-NR, which returned 15.42% for the same period.
PERFORMANCE
HIGHLIGHTS
|
Top
contributors to performance: | |
|
↑
|
Standard
Chartered, an emerging market-focused bank, delivered a strong year overall, with shares supported by robust earnings growth
and capital returns. The bank benefited from higher income in wealth and markets divisions, disciplined cost control, and multiple
share buybacks through mid-2025, which bolstered investor confidence. |
|
↑
|
Alibaba
Group, China’s leading e-commerce and cloud provider, saw shares recover strongly over the year as artificial intelligence
(AI)-driven growth and cloud momentum boosted sentiment. Active buybacks and supportive policy measures added tailwinds,
though volatility persisted amid regulatory uncertainty and competitive pressures. |
|
↑
|
Dassault
Aviation, the French aerospace and defense group behind Rafale jets and Falcon business aircraft, saw strong share gains
over the year. Performance was supported by solid results, a healthy order backlog and a new buyback program, though supply
chain issues and political uncertainty added some volatility. |
|
Top
detractors from performance: | |
|
↓
|
Ørsted
A/S, a Danish multinational energy company was the leading stock detractor. Much of its negative contribution related to developments
late in the period which included an announcement of a rights issue to shore up its balance sheet along with a U.S. ‘stop
work’ order on a major offshore wind project. |
|
↓
|
Persimmon,
one of the UK’s largest housebuilders, saw its shares decline as higher mortgage rates and affordability challenges weighed
on demand. Despite some improvement in its order book, persistent cost pressures and regulatory burdens kept margins under
strain, leaving investor sentiment cautious. |
|
↓
|
Stellantis,
the multinational carmaker, saw its shares fall over the period as profits slumped and restructuring risks grew. Losses were
driven by weaker sales, higher costs and large charges from program cancellations, while tariffs and a negative product mix added
pressure. Investor confidence was further hit by suspended guidance and a credit outlook downgrade |

AVERAGE
ANNUAL TOTAL RETURNS (%) Period
Ended August 31, 2025
|
|
1
Year |
5
Year |
10
Year |
|
Class
R |
8.63
|
10.24
|
5.14
|
|
MSCI
All Country World ex-U.S. Index-NR |
15.42
|
8.94
|
7.33
|
For current month-end performance,
please call Franklin Templeton at (800)
DIAL BEN/342-5236 or visit
https://www.franklintempleton.com/investments/options/mutual-funds.
https://www.franklintempleton.com/investments/options/mutual-funds.
Important data provider notices
and terms available at www.franklintempletondatasources.com.
KEY
FUND STATISTICS (as
of August 31, 2025)
|
Total
Net Assets |
$2,582,933,485
|
|
Total
Number of Portfolio Holdings |
46
|
|
Total
Management Fee Paid |
$16,809,875
|
|
Portfolio
Turnover Rate |
44.39%
|
WHAT
DID THE FUND INVEST IN? (as
of August 31, 2025)
Portfolio Composition*
(% of Total Investments)

HOW
HAS THE FUND CHANGED?
Effective December 31, 2024,
Peter M. Moeschter retired and stepped down as a member of the Fund’s portfolio management team.
This is a summary of a change
to the Fund since September
1, 2024. For
more complete information, you may review the Fund’s current prospectus
and any applicable supplements and the Fund’s next prospectus, which we expect to be available by January 1, 2026,
at https://www.franklintempleton.com/regulatory-fund-documents or upon request at (800) DIAL BEN/342-5236 or
prospectus.us.franklintempleton@fisglobal.com.
at https://www.franklintempleton.com/regulatory-fund-documents or upon request at (800) DIAL BEN/342-5236 or
prospectus.us.franklintempleton@fisglobal.com.
This report describes changes
to the Fund that occurred during the reporting period.
WHAT
WERE THE FUND COSTS FOR THE LAST YEAR? (based
on a hypothetical $10,000 investment)
|
Class
Name |
Costs
of a $10,000 investment
|
Costs
paid as a percentage of a $10,000
investment*
|
|
Class
R6 |
$77
|
0.74%
|
HOW
DID THE FUND PERFORM LAST YEAR AND WHAT AFFECTED ITS PERFORMANCE?
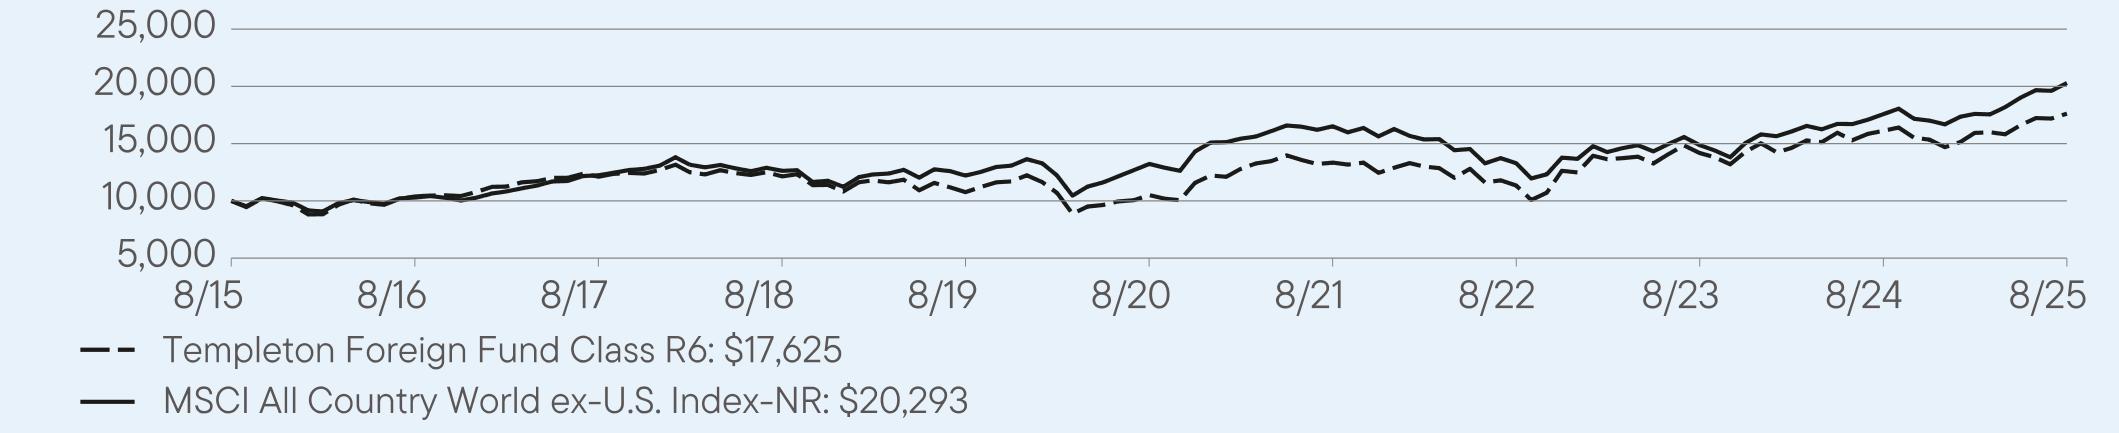
For the twelve months ended August
31, 2025, Class R6 shares of
Templeton Foreign Fund returned 9.31%.
The Fund compares its performance
to the MSCI All Country World ex U.S. Index-NR, which returned 15.42% for the same period.
PERFORMANCE
HIGHLIGHTS
|
Top
contributors to performance: | |
|
↑
|
Standard
Chartered, an emerging market-focused bank, delivered a strong year overall, with shares supported by robust earnings growth
and capital returns. The bank benefited from higher income in wealth and markets divisions, disciplined cost control, and multiple
share buybacks through mid-2025, which bolstered investor confidence. |
|
↑
|
Alibaba
Group, China’s leading e-commerce and cloud provider, saw shares recover strongly over the year as artificial intelligence
(AI)-driven growth and cloud momentum boosted sentiment. Active buybacks and supportive policy measures added tailwinds,
though volatility persisted amid regulatory uncertainty and competitive pressures. |
|
↑
|
Dassault
Aviation, the French aerospace and defense group behind Rafale jets and Falcon business aircraft, saw strong share gains
over the year. Performance was supported by solid results, a healthy order backlog and a new buyback program, though supply
chain issues and political uncertainty added some volatility. |
|
Top
detractors from performance: | |
|
↓
|
Ørsted
A/S, a Danish multinational energy company was the leading stock detractor. Much of its negative contribution related to developments
late in the period which included an announcement of a rights issue to shore up its balance sheet along with a U.S. ‘stop
work’ order on a major offshore wind project. |
|
↓
|
Persimmon,
one of the UK’s largest housebuilders, saw its shares decline as higher mortgage rates and affordability challenges weighed
on demand. Despite some improvement in its order book, persistent cost pressures and regulatory burdens kept margins under
strain, leaving investor sentiment cautious. |
|
↓
|
Stellantis,
the multinational carmaker, saw its shares fall over the period as profits slumped and restructuring risks grew. Losses were
driven by weaker sales, higher costs and large charges from program cancellations, while tariffs and a negative product mix added
pressure. Investor confidence was further hit by suspended guidance and a credit outlook downgrade |
AVERAGE
ANNUAL TOTAL RETURNS (%) Period
Ended August 31, 2025
|
|
1
Year |
5
Year |
10
Year |
|
Class
R6 |
9.31
|
10.90
|
5.83
|
|
MSCI
All Country World ex-U.S. Index-NR |
15.42
|
8.94
|
7.33
|
For current month-end performance,
please call Franklin Templeton at (800)
DIAL BEN/342-5236 or visit
https://www.franklintempleton.com/investments/options/mutual-funds.
https://www.franklintempleton.com/investments/options/mutual-funds.
Important data provider notices
and terms available at www.franklintempletondatasources.com.
KEY
FUND STATISTICS (as
of August 31, 2025)
|
Total
Net Assets |
$2,582,933,485
|
|
Total
Number of Portfolio Holdings |
46
|
|
Total
Management Fee Paid |
$16,809,875
|
|
Portfolio
Turnover Rate |
44.39%
|
WHAT
DID THE FUND INVEST IN? (as
of August 31, 2025)
Portfolio Composition*
(% of Total Investments)

HOW
HAS THE FUND CHANGED?
Effective December 31, 2024,
Peter M. Moeschter retired and stepped down as a member of the Fund’s portfolio management team.
This is a summary of a change
to the Fund since September
1, 2024. For
more complete information, you may review the Fund’s current prospectus
and any applicable supplements and the Fund’s next prospectus, which we expect to be available by January 1, 2026,
at https://www.franklintempleton.com/regulatory-fund-documents or upon request at (800) DIAL BEN/342-5236 or
prospectus.us.franklintempleton@fisglobal.com.
at https://www.franklintempleton.com/regulatory-fund-documents or upon request at (800) DIAL BEN/342-5236 or
prospectus.us.franklintempleton@fisglobal.com.
This report describes changes
to the Fund that occurred during the reporting period.
WHAT
WERE THE FUND COSTS FOR THE LAST YEAR? (based
on a hypothetical $10,000 investment)
|
Class
Name |
Costs
of a $10,000 investment
|
Costs
paid as a percentage of a $10,000
investment*
|
|
Advisor
Class |
$89
|
0.85%
|
HOW
DID THE FUND PERFORM LAST YEAR AND WHAT AFFECTED ITS PERFORMANCE?
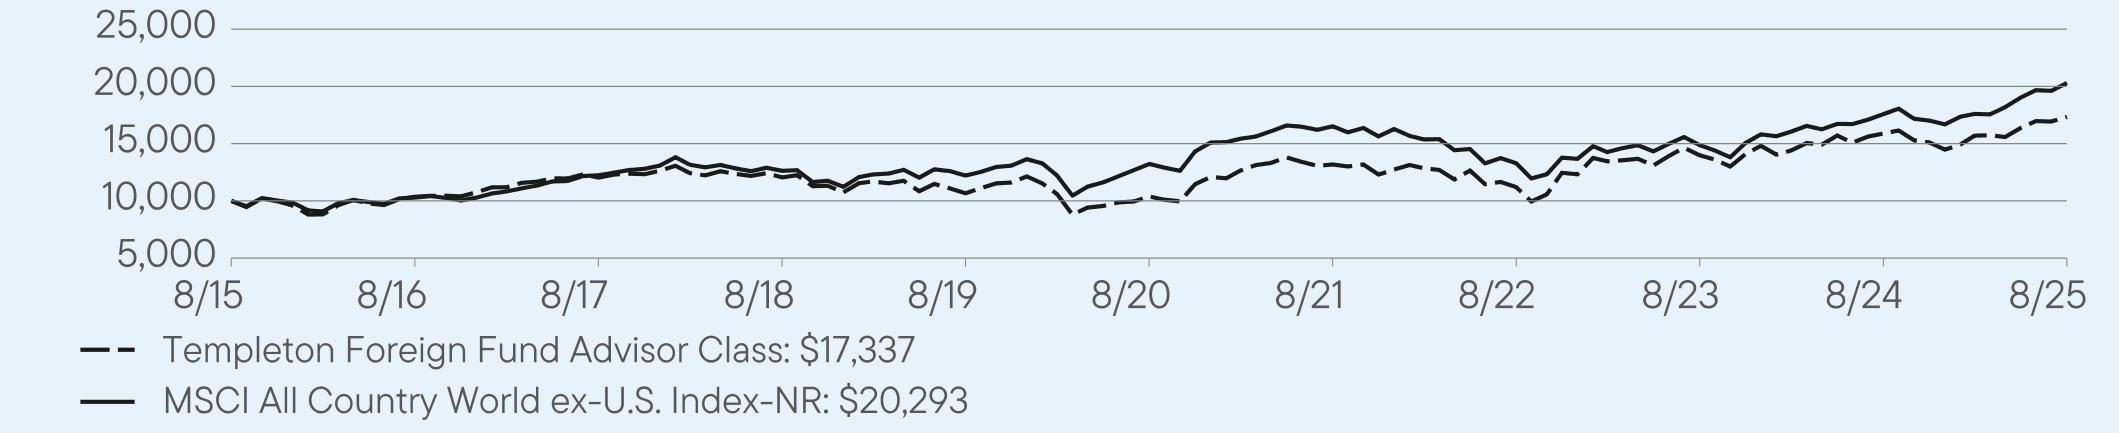
For the twelve months ended August
31, 2025, Advisor Class shares
of Templeton Foreign Fund returned 9.14%.
The Fund compares its performance
to the MSCI All Country World ex U.S. Index-NR, which returned 15.42% for the same period.
PERFORMANCE
HIGHLIGHTS
|
Top
contributors to performance: | |
|
↑
|
Standard
Chartered, an emerging market-focused bank, delivered a strong year overall, with shares supported by robust earnings growth
and capital returns. The bank benefited from higher income in wealth and markets divisions, disciplined cost control, and multiple
share buybacks through mid-2025, which bolstered investor confidence. |
|
↑
|
Alibaba
Group, China’s leading e-commerce and cloud provider, saw shares recover strongly over the year as artificial intelligence
(AI)-driven growth and cloud momentum boosted sentiment. Active buybacks and supportive policy measures added tailwinds,
though volatility persisted amid regulatory uncertainty and competitive pressures. |
|
↑
|
Dassault
Aviation, the French aerospace and defense group behind Rafale jets and Falcon business aircraft, saw strong share gains
over the year. Performance was supported by solid results, a healthy order backlog and a new buyback program, though supply
chain issues and political uncertainty added some volatility. |
|
Top
detractors from performance: | |
|
↓
|
Ørsted
A/S, a Danish multinational energy company was the leading stock detractor. Much of its negative contribution related to developments
late in the period which included an announcement of a rights issue to shore up its balance sheet along with a U.S. ‘stop
work’ order on a major offshore wind project. |
|
↓
|
Persimmon,
one of the UK’s largest housebuilders, saw its shares decline as higher mortgage rates and affordability challenges weighed
on demand. Despite some improvement in its order book, persistent cost pressures and regulatory burdens kept margins under
strain, leaving investor sentiment cautious. |
|
↓
|
Stellantis,
the multinational carmaker, saw its shares fall over the period as profits slumped and restructuring risks grew. Losses were
driven by weaker sales, higher costs and large charges from program cancellations, while tariffs and a negative product mix added
pressure. Investor confidence was further hit by suspended guidance and a credit outlook downgrade |
AVERAGE
ANNUAL TOTAL RETURNS (%) Period
Ended August 31, 2025
|
|
1
Year |
5
Year |
10
Year |
|
Advisor
Class |
9.14
|
10.78
|
5.66
|
|
MSCI
All Country World ex-U.S. Index-NR |
15.42
|
8.94
|
7.33
|
For current month-end performance,
please call Franklin Templeton at (800)
DIAL BEN/342-5236 or visit
https://www.franklintempleton.com/investments/options/mutual-funds.
https://www.franklintempleton.com/investments/options/mutual-funds.
Important data provider notices
and terms available at www.franklintempletondatasources.com.
KEY
FUND STATISTICS (as
of August 31, 2025)
|
Total
Net Assets |
$2,582,933,485
|
|
Total
Number of Portfolio Holdings |
46
|
|
Total
Management Fee Paid |
$16,809,875
|
|
Portfolio
Turnover Rate |
44.39%
|
WHAT
DID THE FUND INVEST IN? (as
of August 31, 2025)
Portfolio Composition*
(% of Total Investments)
HOW
HAS THE FUND CHANGED?
Effective December 31, 2024,
Peter M. Moeschter retired and stepped down as a member of the Fund’s portfolio management team.
This is a summary of a change
to the Fund since September
1, 2024. For
more complete information, you may review the Fund’s current prospectus
and any applicable supplements and the Fund’s next prospectus, which we expect to be available by January 1, 2026,
at https://www.franklintempleton.com/regulatory-fund-documents or upon request at (800) DIAL BEN/342-5236 or
prospectus.us.franklintempleton@fisglobal.com.
at https://www.franklintempleton.com/regulatory-fund-documents or upon request at (800) DIAL BEN/342-5236 or
prospectus.us.franklintempleton@fisglobal.com.
This report describes changes
to the Fund that occurred during the reporting period.
WHAT
WERE THE FUND COSTS FOR THE LAST YEAR? (based
on a hypothetical $10,000 investment)
|
Class
Name |
Costs
of a $10,000 investment
|
Costs
paid as a percentage of a $10,000
investment |
|
Class
A |
$112
|
1.05%
|
HOW
DID THE FUND PERFORM LAST YEAR AND WHAT AFFECTED ITS PERFORMANCE?
For the twelve months ended August
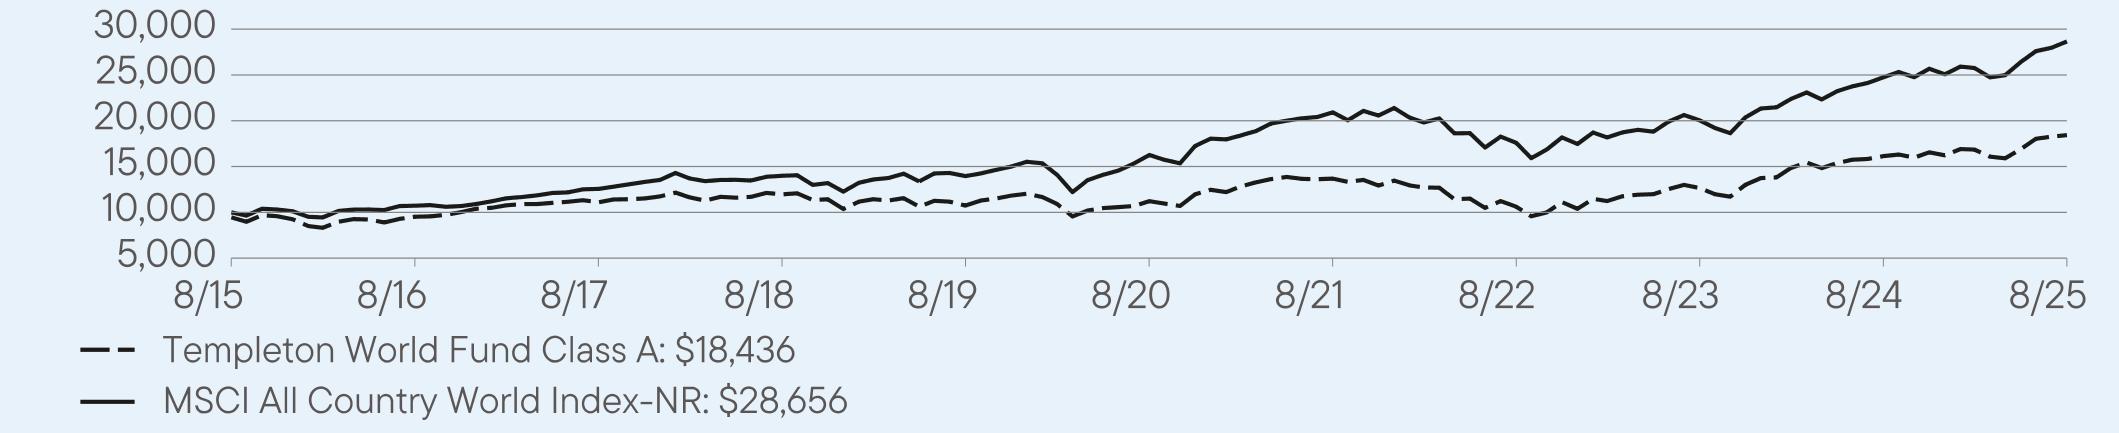
31, 2025, Class A shares of
Templeton World Fund returned 14.23%.
The Fund compares its performance
to the MSCI All Country World Index-NR, which returned 15.79% for the same period.
PERFORMANCE
HIGHLIGHTS
|
Top
contributors to performance: | |
|
↑
|
Rolls-Royce
Holdings saw shares surge over the year as its turnaround project continued to deliver profits and cash flow stepped up,
distributions were reinstated alongside a buyback, and guidance was raised after a strong first half. Sentiment was further supported
by civil-aerospace recovery, steady defense and progress on small modular reactors. |
|
↑
|
A
newly established position in Safran SA added value over the period as the company delivered strong results and maintained a positive
outlook. Growth in its core businesses and steady demand for services supported confidence, while a favorable environment
for aerospace and defense provided an additional boost. |
|
↑
|
GE
Vernova, a U.S.-based electrification and power-equipment provider (wind turbines, gas turbines and grid solutions), benefited
from U.S. generation and grid build-out and rising data-center power demand, but the position was closed during the period
on valuation after a strong run. |
|
Top
detractors from performance: | |
|
↓
|
UnitedHealth
detracted as it shares sold off in the second quarter of 2025 after a first quarter earnings miss, higher-than-expected
Medicare Advantage medical costs, a surprise CEO change, and news of a federal investigation; the Fund exited
the position during the period as these developments undermined the original thesis. |
|
↓
|
Also
from the health care sector, Ireland-based ICON plc underperformed, with its share price declining after it reported weaker-than-expected
first quarter 2025 results and lowered full-year guidance, and after it cited delays and cancellations in clinical
trial activity—particularly among biotech clients—highlighting ongoing softness in the contract research market.
|
|
↓
|
From
the energy sector, BP detracted due to timing rather than thesis. The Fund initiated the position mid-period and held it through
a softer phase for the shares; then exited ahead of the late-August recovery, so the holding window captured the drawdown
but not the subsequent rebound. |
AVERAGE
ANNUAL TOTAL RETURNS (%) Period
Ended August 31, 2025
|
|
1
Year |
5
Year |
10
Year |
|
Class
A |
14.23
|
10.44
|
6.91
|
|
Class
A (with sales charge) |
7.92
|
9.20
|
6.31
|
|
MSCI
All Country World Index-NR |
15.79
|
12.00
|
11.10
|
For current month-end performance,
please call Franklin Templeton at (800)
DIAL BEN/342-5236 or visit
https://www.franklintempleton.com/investments/options/mutual-funds.
https://www.franklintempleton.com/investments/options/mutual-funds.
Important data provider notices
and terms available at www.franklintempletondatasources.com.
KEY
FUND STATISTICS (as
of August 31, 2025)
|
Total
Net Assets |
$2,797,739,781
|
|
Total
Number of Portfolio Holdings |
46
|
|
Total
Management Fee Paid |
$18,583,845
|
|
Portfolio
Turnover Rate |
100.16%
|
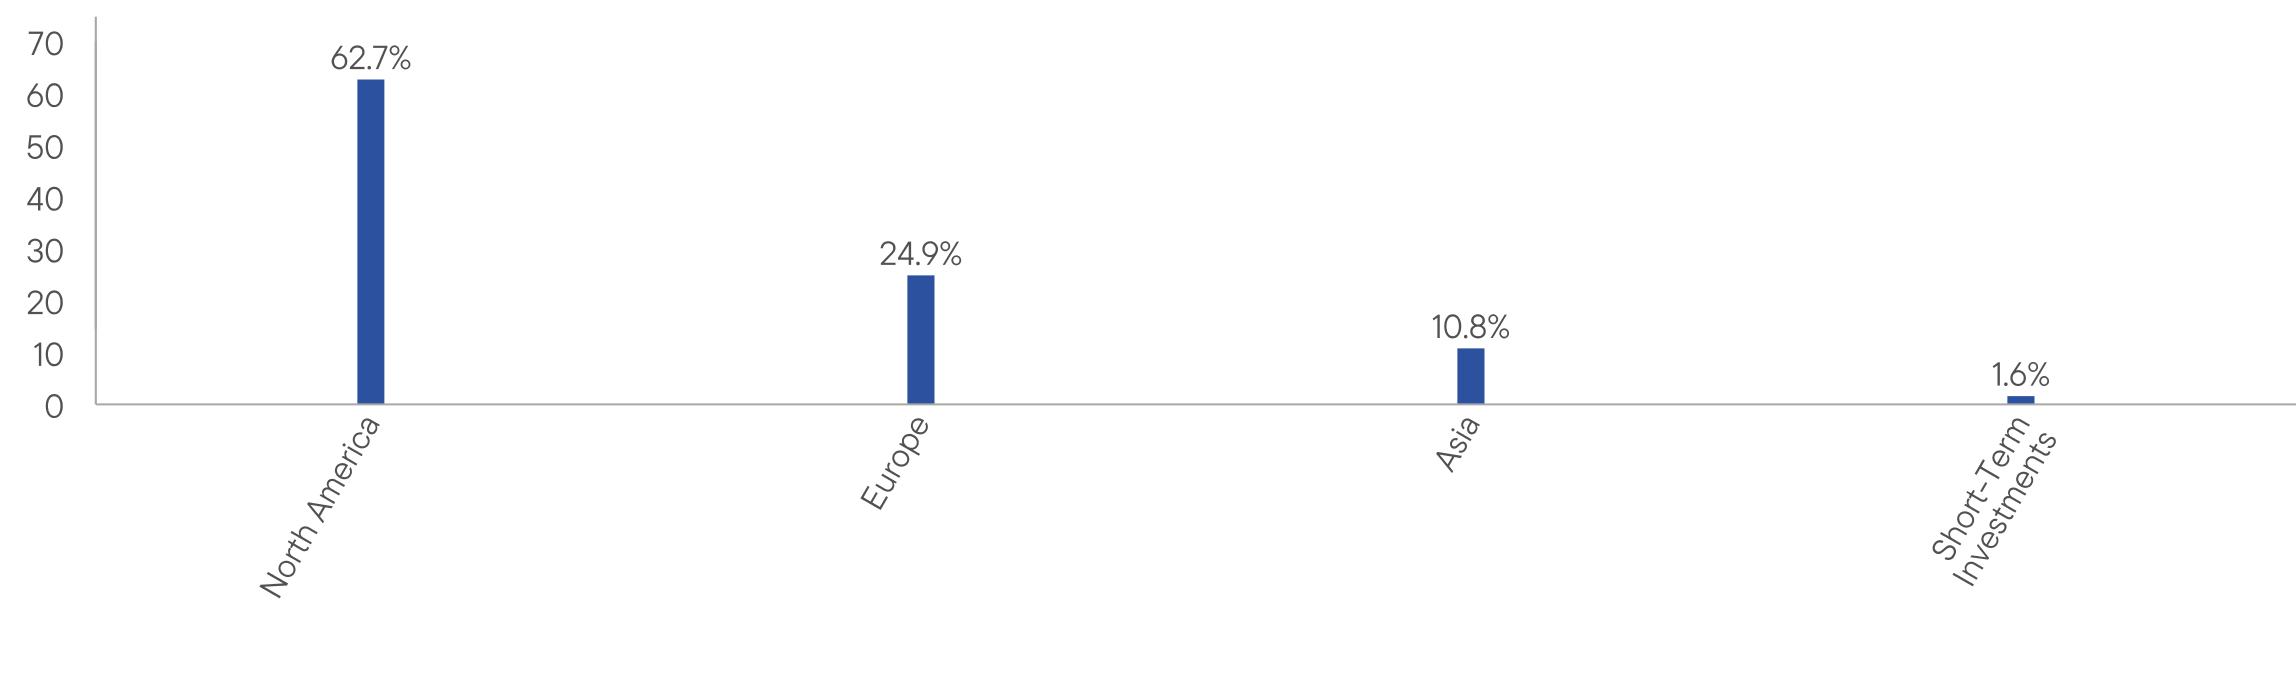
WHAT
DID THE FUND INVEST IN? (as
of August 31, 2025)
Portfolio Composition*
(% of Total Investments)
HOW
HAS THE FUND CHANGED?
Effective August 1, 2025, Templeton
Asset Management Ltd. no longer serves as sub-advisor to the Fund.
In addition, effective December
31, 2024, Peter M. Moeschter stepped down as a member of the Fund’s portfolio management team.
This is a summary of certain
changes to the Fund since September
1, 2024. For
more complete information, you may review the Fund’s current
prospectus and any applicable supplements and the Fund’s next prospectus, which we expect to be available by January
1, 2026, at https://www.franklintempleton.com/regulatory-fund-documents
or upon request at (800)
DIAL BEN/342-5236
or
prospectus.us.franklintempleton@fisglobal.com.
prospectus.us.franklintempleton@fisglobal.com.
This report describes changes
to the Fund that occurred during the reporting period.
WHAT
WERE THE FUND COSTS FOR THE LAST YEAR? (based
on a hypothetical $10,000 investment)
|
Class
Name |
Costs
of a $10,000 investment
|
Costs
paid as a percentage of a $10,000
investment |
|
Class
C |
$192
|
1.80%
|
HOW
DID THE FUND PERFORM LAST YEAR AND WHAT AFFECTED ITS PERFORMANCE?
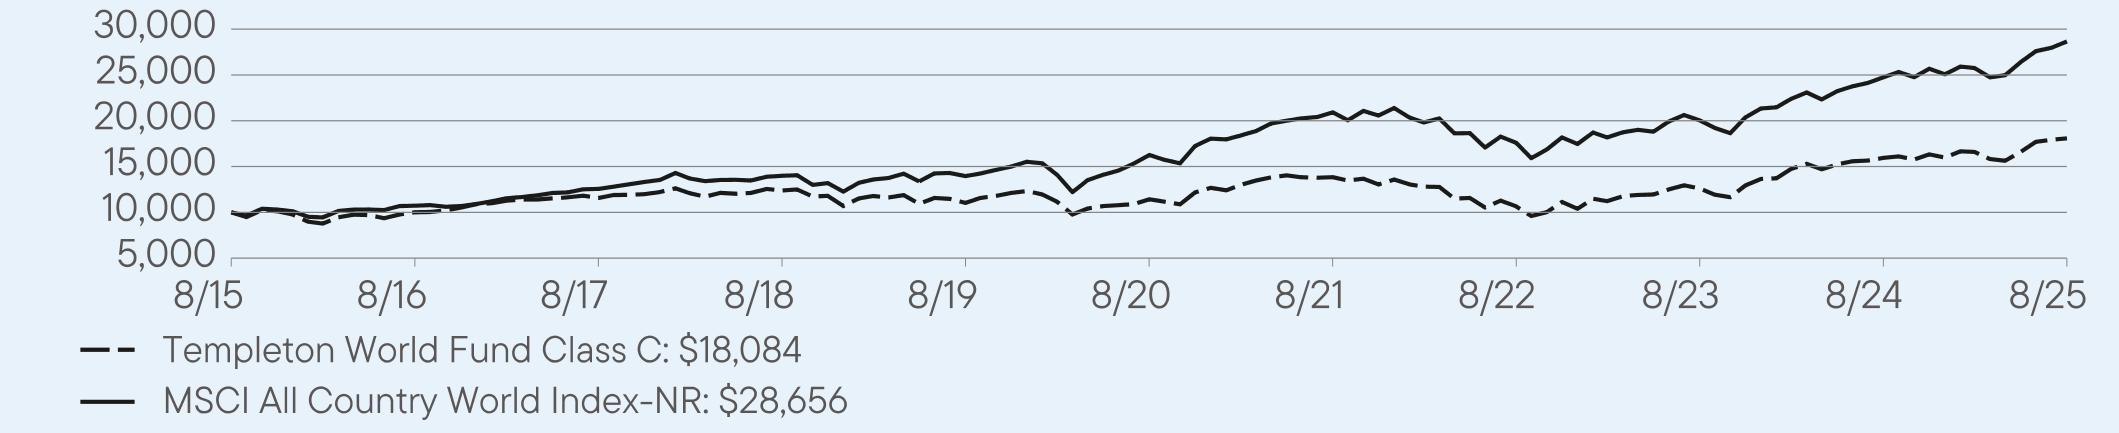
For the twelve months ended August
31, 2025, Class C shares of
Templeton World Fund returned 13.39%.
The Fund compares its performance
to the MSCI All Country World Index-NR, which returned 15.79% for the same period.
PERFORMANCE
HIGHLIGHTS
|
Top
contributors to performance: | |
|
↑
|
Rolls-Royce
Holdings saw shares surge over the year as its turnaround project continued to deliver profits and cash flow stepped up,
distributions were reinstated alongside a buyback, and guidance was raised after a strong first half. Sentiment was further supported
by civil-aerospace recovery, steady defense and progress on small modular reactors. |
|
↑
|
A
newly established position in Safran SA added value over the period as the company delivered strong results and maintained a positive
outlook. Growth in its core businesses and steady demand for services supported confidence, while a favorable environment
for aerospace and defense provided an additional boost. |
|
↑
|
GE
Vernova, a U.S.-based electrification and power-equipment provider (wind turbines, gas turbines and grid solutions), benefited
from U.S. generation and grid build-out and rising data-center power demand, but the position was closed during the period
on valuation after a strong run. |
|
Top
detractors from performance: | |
|
↓
|
UnitedHealth
detracted as it shares sold off in the second quarter of 2025 after a first quarter earnings miss, higher-than-expected
Medicare Advantage medical costs, a surprise CEO change, and news of a federal investigation; the Fund exited
the position during the period as these developments undermined the original thesis. |
|
↓
|
Also
from the health care sector, Ireland-based ICON plc underperformed, with its share price declining after it reported weaker-than-expected
first quarter 2025 results and lowered full-year guidance, and after it cited delays and cancellations in clinical
trial activity—particularly among biotech clients—highlighting ongoing softness in the contract research market.
|
|
↓
|
From
the energy sector, BP detracted due to timing rather than thesis. The Fund initiated the position mid-period and held it through
a softer phase for the shares; then exited ahead of the late-August recovery, so the holding window captured the drawdown
but not the subsequent rebound. |
AVERAGE
ANNUAL TOTAL RETURNS (%) Period
Ended August 31, 2025
|
|
1
Year |
5
Year |
10
Year |
|
Class
C |
13.39
|
9.62
|
6.10
|
|
Class
C (with sales charge) |
12.39
|
9.62
|
6.10
|
|
MSCI
All Country World Index-NR |
15.79
|
12.00
|
11.10
|
For current month-end performance,
please call Franklin Templeton at (800)
DIAL BEN/342-5236 or visit
https://www.franklintempleton.com/investments/options/mutual-funds.
https://www.franklintempleton.com/investments/options/mutual-funds.
Important data provider notices
and terms available at www.franklintempletondatasources.com.
KEY
FUND STATISTICS (as
of August 31, 2025)
|
Total
Net Assets |
$2,797,739,781
|
|
Total
Number of Portfolio Holdings |
46
|
|
Total
Management Fee Paid |
$18,583,845
|
|
Portfolio
Turnover Rate |
100.16%
|
WHAT
DID THE FUND INVEST IN? (as
of August 31, 2025)
Portfolio Composition*
(% of Total Investments)

HOW
HAS THE FUND CHANGED?
Effective August 1, 2025, Templeton
Asset Management Ltd. no longer serves as sub-advisor to the Fund.
In addition, effective December
31, 2024, Peter M. Moeschter stepped down as a member of the Fund’s portfolio management team.
This is a summary of certain
changes to the Fund since September
1, 2024. For
more complete information, you may review the Fund’s current
prospectus and any applicable supplements and the Fund’s next prospectus, which we expect to be available by January
1, 2026, at https://www.franklintempleton.com/regulatory-fund-documents
or upon request at (800)
DIAL BEN/342-5236
or
prospectus.us.franklintempleton@fisglobal.com.
prospectus.us.franklintempleton@fisglobal.com.
This report describes changes
to the Fund that occurred during the reporting period.
WHAT
WERE THE FUND COSTS FOR THE LAST YEAR? (based
on a hypothetical $10,000 investment)
|
Class
Name |
Costs
of a $10,000 investment
|
Costs
paid as a percentage of a $10,000
investment*
|
|
Class
R6 |
$82
|
0.76%
|
HOW
DID THE FUND PERFORM LAST YEAR AND WHAT AFFECTED ITS PERFORMANCE?
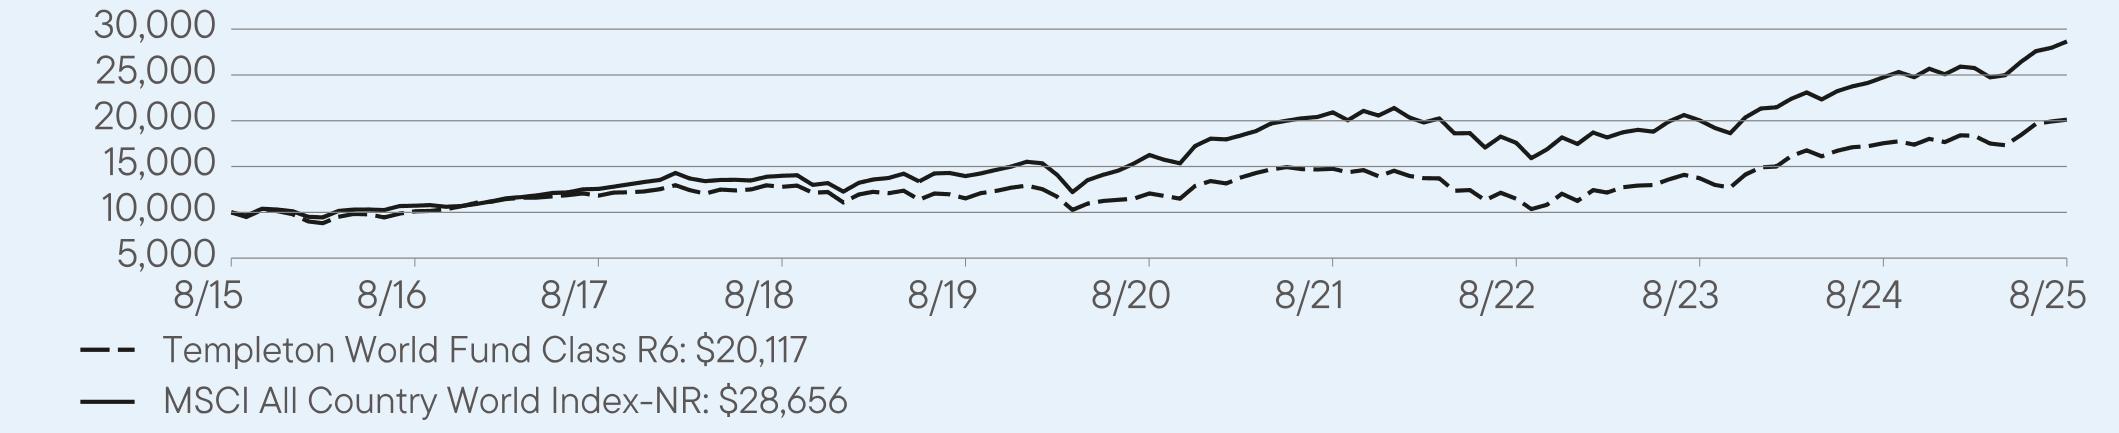
For the twelve months ended August
31, 2025, Class R6 shares of
Templeton World Fund returned 14.61%.
The Fund compares its performance
to the MSCI All Country World Index-NR, which returned 15.79% for the same period.
PERFORMANCE
HIGHLIGHTS
|
Top
contributors to performance: | |
|
↑
|
Rolls-Royce
Holdings saw shares surge over the year as its turnaround project continued to deliver profits and cash flow stepped up,
distributions were reinstated alongside a buyback, and guidance was raised after a strong first half. Sentiment was further supported
by civil-aerospace recovery, steady defense and progress on small modular reactors. |
|
↑
|
A
newly established position in Safran SA added value over the period as the company delivered strong results and maintained a positive
outlook. Growth in its core businesses and steady demand for services supported confidence, while a favorable environment
for aerospace and defense provided an additional boost. |
|
↑
|
GE
Vernova, a U.S.-based electrification and power-equipment provider (wind turbines, gas turbines and grid solutions), benefited
from U.S. generation and grid build-out and rising data-center power demand, but the position was closed during the period
on valuation after a strong run. |
|
Top
detractors from performance: | |
|
↓
|
UnitedHealth
detracted as it shares sold off in the second quarter of 2025 after a first quarter earnings miss, higher-than-expected
Medicare Advantage medical costs, a surprise CEO change, and news of a federal investigation; the Fund exited
the position during the period as these developments undermined the original thesis. |
|
↓
|
Also
from the health care sector, Ireland-based ICON plc underperformed, with its share price declining after it reported weaker-than-expected
first quarter 2025 results and lowered full-year guidance, and after it cited delays and cancellations in clinical
trial activity—particularly among biotech clients—highlighting ongoing softness in the contract research market.
|
|
↓
|
From
the energy sector, BP detracted due to timing rather than thesis. The Fund initiated the position mid-period and held it through
a softer phase for the shares; then exited ahead of the late-August recovery, so the holding window captured the drawdown
but not the subsequent rebound. |
AVERAGE
ANNUAL TOTAL RETURNS (%) Period
Ended August 31, 2025
|
|
1
Year |
5
Year |
10
Year |
|
Class
R6 |
14.61
|
10.77
|
7.24
|
|
MSCI
All Country World Index-NR |
15.79
|
12.00
|
11.10
|
For current month-end performance,
please call Franklin Templeton at (800)
DIAL BEN/342-5236 or visit
https://www.franklintempleton.com/investments/options/mutual-funds.
https://www.franklintempleton.com/investments/options/mutual-funds.
Important data provider notices
and terms available at www.franklintempletondatasources.com.
KEY
FUND STATISTICS (as
of August 31, 2025)
|
Total
Net Assets |
$2,797,739,781
|
|
Total
Number of Portfolio Holdings |
46
|
|
Total
Management Fee Paid |
$18,583,845
|
|
Portfolio
Turnover Rate |
100.16%
|
WHAT
DID THE FUND INVEST IN? (as
of August 31, 2025)
Portfolio Composition*
(% of Total Investments)

HOW
HAS THE FUND CHANGED?
Effective August 1, 2025, Templeton
Asset Management Ltd. no longer serves as sub-advisor to the Fund.
In addition, effective December
31, 2024, Peter M. Moeschter stepped down as a member of the Fund’s portfolio management team.
This is a summary of certain
changes to the Fund since September
1, 2024. For
more complete information, you may review the Fund’s current
prospectus and any applicable supplements and the Fund’s next prospectus, which we expect to be available by January
1, 2026, at https://www.franklintempleton.com/regulatory-fund-documents
or upon request at (800)
DIAL BEN/342-5236
or
prospectus.us.franklintempleton@fisglobal.com.
prospectus.us.franklintempleton@fisglobal.com.
This report describes changes
to the Fund that occurred during the reporting period.
WHAT
WERE THE FUND COSTS FOR THE LAST YEAR? (based
on a hypothetical $10,000 investment)
|
Class
Name |
Costs
of a $10,000 investment
|
Costs
paid as a percentage of a $10,000
investment |
|
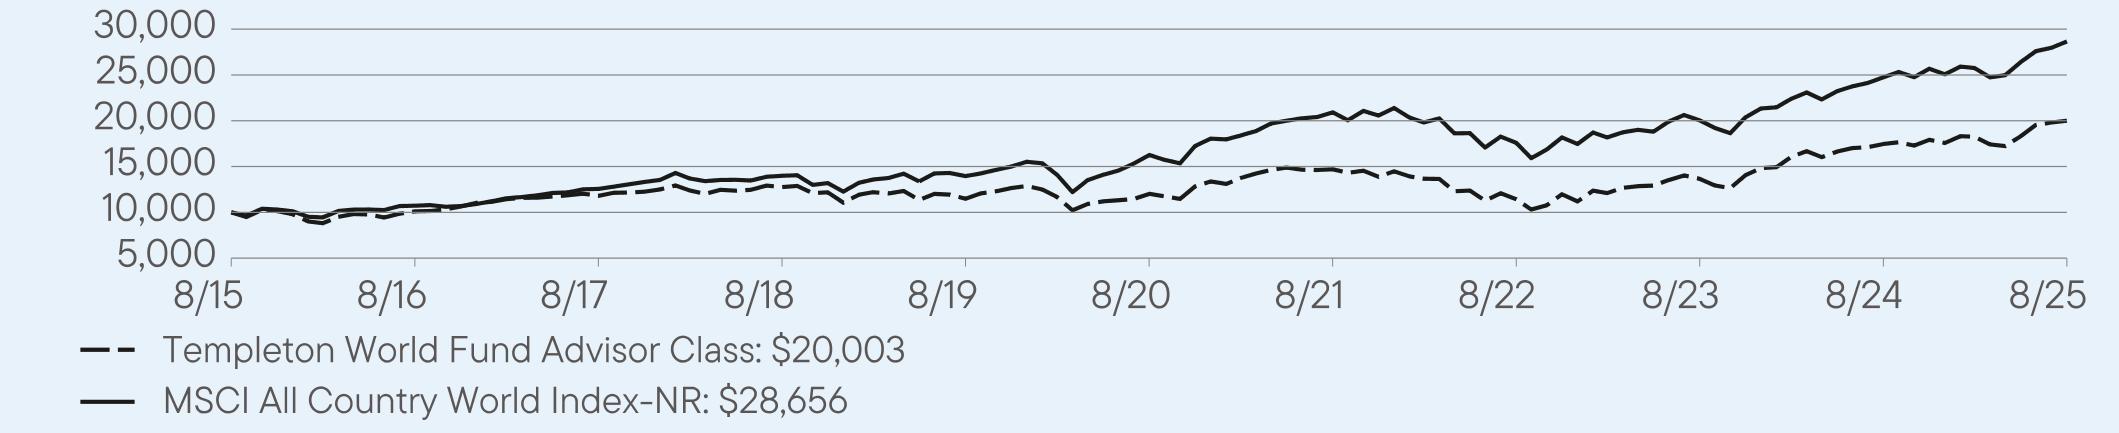
Advisor
Class |
$86
|
0.80%
|
HOW
DID THE FUND PERFORM LAST YEAR AND WHAT AFFECTED ITS PERFORMANCE?
For the twelve months ended August
31, 2025, Advisor Class shares
of Templeton World Fund returned 14.55%.
The Fund compares its performance
to the MSCI All Country World Index-NR, which returned 15.79% for the same period.
PERFORMANCE
HIGHLIGHTS
|
Top
contributors to performance: | |
|
↑
|
Rolls-Royce
Holdings saw shares surge over the year as its turnaround project continued to deliver profits and cash flow stepped up,
distributions were reinstated alongside a buyback, and guidance was raised after a strong first half. Sentiment was further supported
by civil-aerospace recovery, steady defense and progress on small modular reactors. |
|
↑
|
A
newly established position in Safran SA added value over the period as the company delivered strong results and maintained a positive
outlook. Growth in its core businesses and steady demand for services supported confidence, while a favorable environment
for aerospace and defense provided an additional boost. |
|
↑
|
GE
Vernova, a U.S.-based electrification and power-equipment provider (wind turbines, gas turbines and grid solutions), benefited
from U.S. generation and grid build-out and rising data-center power demand, but the position was closed during the period
on valuation after a strong run. |
|
Top
detractors from performance: | |
|
↓
|
UnitedHealth
detracted as it shares sold off in the second quarter of 2025 after a first quarter earnings miss, higher-than-expected
Medicare Advantage medical costs, a surprise CEO change, and news of a federal investigation; the Fund exited
the position during the period as these developments undermined the original thesis. |
|
↓
|
Also
from the health care sector, Ireland-based ICON plc underperformed, with its share price declining after it reported weaker-than-expected
first quarter 2025 results and lowered full-year guidance, and after it cited delays and cancellations in clinical
trial activity—particularly among biotech clients—highlighting ongoing softness in the contract research market.
|
|
↓
|
From
the energy sector, BP detracted due to timing rather than thesis. The Fund initiated the position mid-period and held it through
a softer phase for the shares; then exited ahead of the late-August recovery, so the holding window captured the drawdown
but not the subsequent rebound. |
AVERAGE
ANNUAL TOTAL RETURNS (%) Period
Ended August 31, 2025
|
|
1
Year |
5
Year |
10
Year |
|
Advisor
Class |
14.55
|
10.72
|
7.18
|
|
MSCI
All Country World Index-NR |
15.79
|
12.00
|
11.10
|
For current month-end performance,
please call Franklin Templeton at (800)
DIAL BEN/342-5236 or visit
https://www.franklintempleton.com/investments/options/mutual-funds.
https://www.franklintempleton.com/investments/options/mutual-funds.
Important data provider notices
and terms available at www.franklintempletondatasources.com.
KEY
FUND STATISTICS (as
of August 31, 2025)
|
Total
Net Assets |
$2,797,739,781
|
|
Total
Number of Portfolio Holdings |
46
|
|
Total
Management Fee Paid |
$18,583,845
|
|
Portfolio
Turnover Rate |
100.16%
|
WHAT
DID THE FUND INVEST IN? (as
of August 31, 2025)
Portfolio Composition*
(% of Total Investments)

HOW
HAS THE FUND CHANGED?
Effective August 1, 2025, Templeton
Asset Management Ltd. no longer serves as sub-advisor to the Fund.
In addition, effective December
31, 2024, Peter M. Moeschter stepped down as a member of the Fund’s portfolio management team.
This is a summary of certain
changes to the Fund since September
1, 2024. For
more complete information, you may review the Fund’s current
prospectus and any applicable supplements and the Fund’s next prospectus, which we expect to be available by January
1, 2026, at https://www.franklintempleton.com/regulatory-fund-documents
or upon request at (800)
DIAL BEN/342-5236
or
prospectus.us.franklintempleton@fisglobal.com.
prospectus.us.franklintempleton@fisglobal.com.
| [1] |
|
||
| [2] |
|
||
| [3] |
|
||
| [4] |
|
||
| [5] |
|
||
| [6] |
|
||
| [7] |
|
||
| [8] |
|
||
| [9] |
|
||
| [10] |
|
||
| [11] |
|
||
| [12] |
|
||
| [13] |
|
||
| [14] |
|
||
| [15] |
|