
| THIRD QUARTER 2025 | |||||
| Supplemental Information | |||||
 | |||||
| Investor and Media Contact | |||||
| American Assets Trust, Inc. | |||||
| Robert F. Barton | |||||
| Executive Vice President and Chief Financial Officer | |||||
| 858-350-2607 | |||||
| |||||
 | |||||||||||||||||||||||||||||||||||
| Office | Retail | Multifamily | Mixed-Use | ||||||||||||||||||||||||||||||||
| Market | Square Feet | Square Feet | Units | Square Feet | Suites | ||||||||||||||||||||||||||||||
| San Diego | 1,801,538 | 1,322,200 | 1,645 | (1) | — | — | |||||||||||||||||||||||||||||
| Bellevue | 1,028,470 | — | — | — | — | ||||||||||||||||||||||||||||||
| Portland | 930,903 | 44,236 | 657 | — | — | ||||||||||||||||||||||||||||||
| San Antonio | — | 588,148 | — | — | — | ||||||||||||||||||||||||||||||
| San Francisco | 522,696 | 35,159 | — | — | — | ||||||||||||||||||||||||||||||
| Oahu | — | 430,504 | — | 93,925 | 369 | ||||||||||||||||||||||||||||||
| Total | 4,283,607 | 2,420,247 | 2,302 | 93,925 | 369 | ||||||||||||||||||||||||||||||
| Square Feet | % | NOI % (2) | ||||||||||||||||||||||||
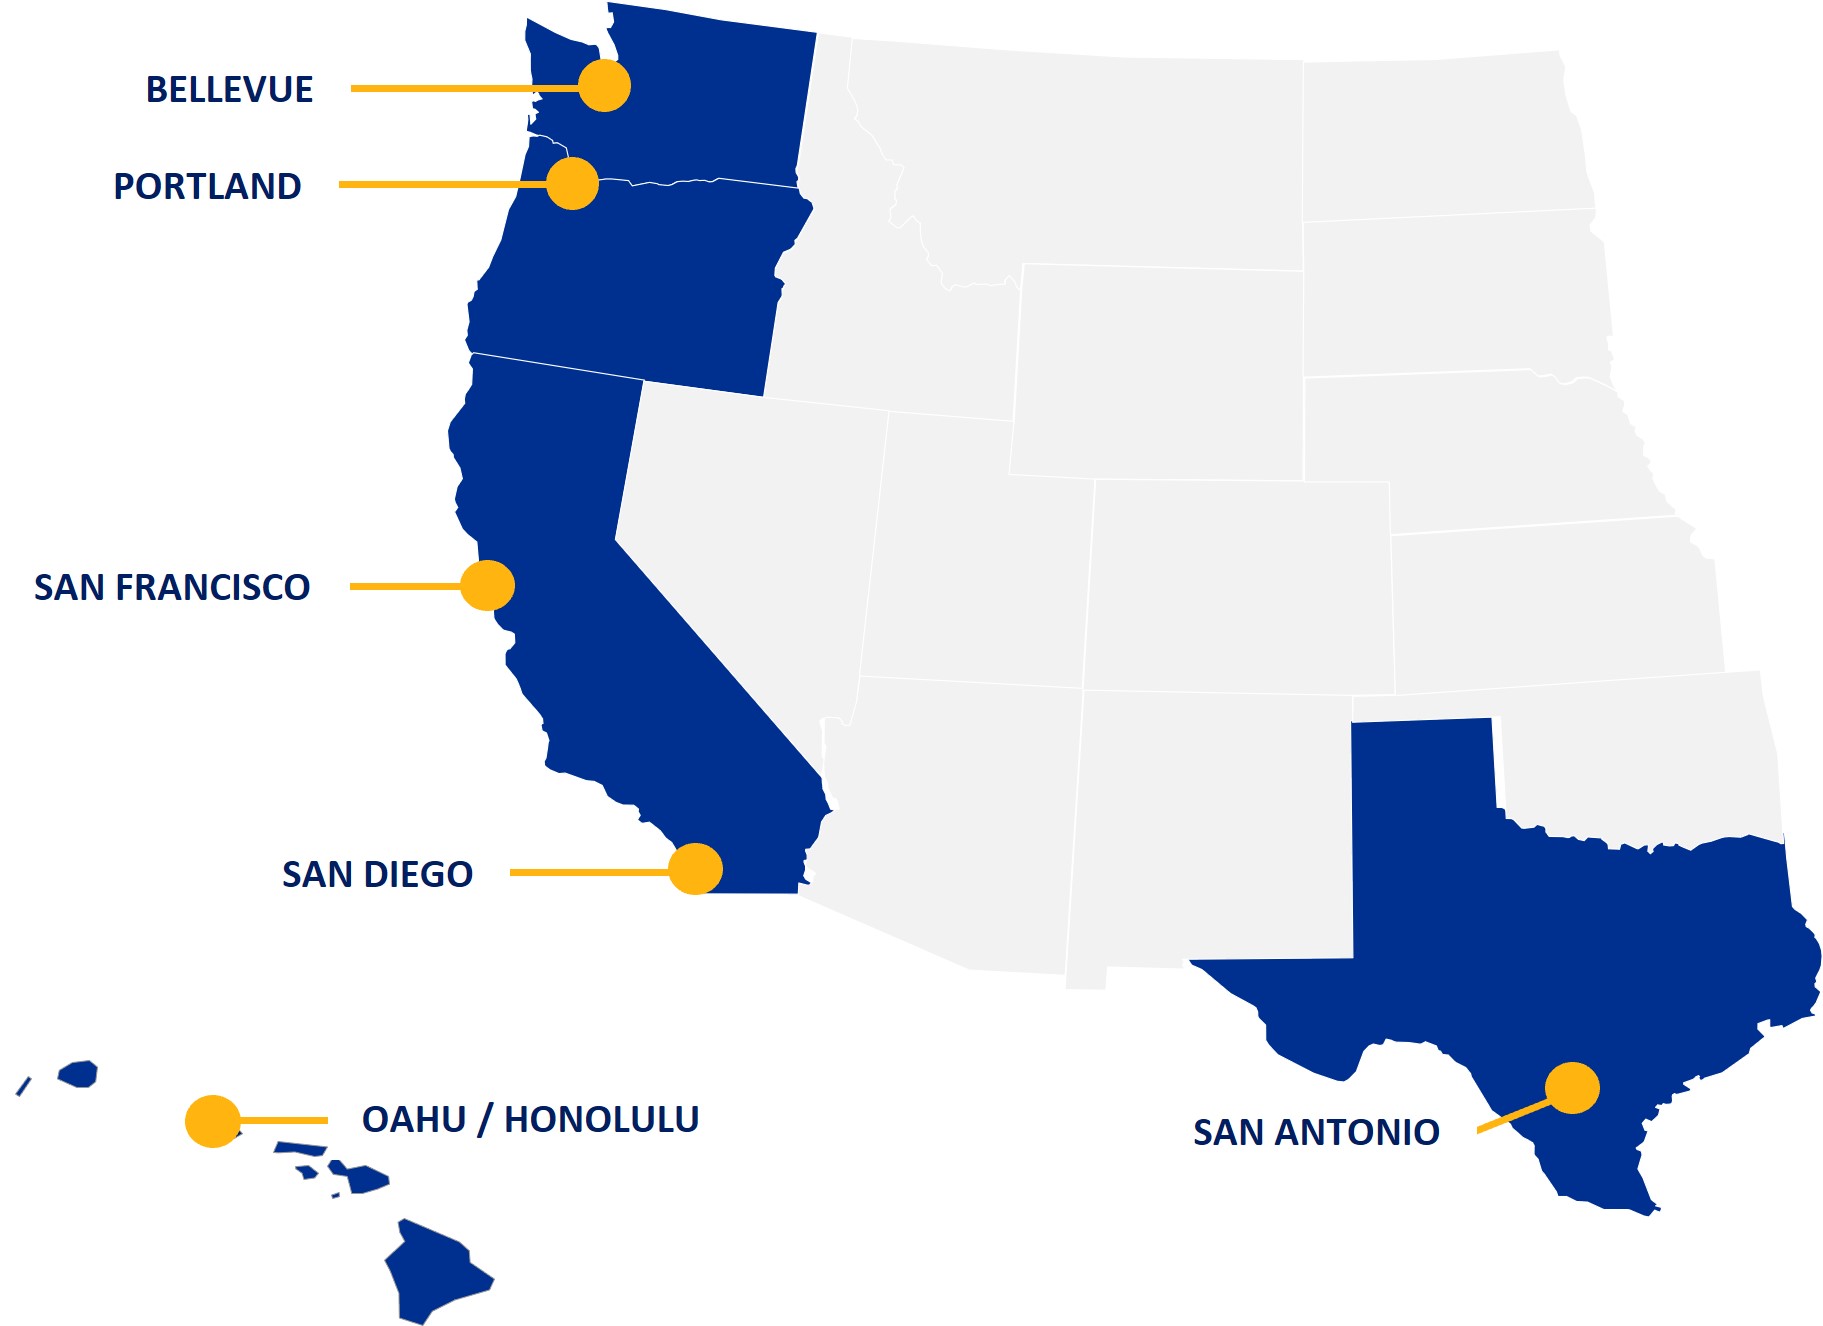
| Note: Circled areas represent all markets in which American Assets Trust, Inc. currently owns and operates its real estate properties. Net rentable square footage may be adjusted from the prior periods to reflect re-measurement of leased space at the properties. | Office | 4.3 | million | 64% | 53% | |||||||||||||||||||||
Retail (3) | 2.4 | million | 36% | 25% | ||||||||||||||||||||||
| Data is as of September 30, 2025. | Totals | 6.7 | million | |||||||||||||||||||||||
| (1) Includes 120 RV spaces. | ||||||||||||||||||||||||||
(2) Percentage of Net Operating Income (NOI) calculated for the three months ended September 30, 2025. NOI is a non-GAAP supplemental earnings measure which we consider meaningful in measuring our operating performance. Reconciliations of NOI to net income are included in the Glossary of Terms. | ||||||||||||||||||||||||||
| (3) Does not include mixed-use retail. | ||||||||||||||||||||||||||
| Third Quarter 2025 Supplemental Information | Page 2 | ||||
| INDEX | | ||||
| THIRD QUARTER 2025 SUPPLEMENTAL INFORMATION | ||||||||
| 1. | FINANCIAL HIGHLIGHTS | |||||||
| Consolidated Balance Sheets | ||||||||
| Consolidated Statements of Operations | ||||||||
| Funds From Operations (FFO), FFO As Adjusted & Funds Available for Distribution | ||||||||
| Corporate Guidance | ||||||||
| Same-Store Net Operating Income (NOI) | ||||||||
| Same-Store Cash NOI Comparison excluding Redevelopment | ||||||||
| Same-Store Cash NOI Comparison with Redevelopment | ||||||||
| Cash NOI By Region | ||||||||
| Cash NOI Breakdown | ||||||||
| Property Revenue and Operating Expenses | ||||||||
| Segment Capital Expenditures | ||||||||
| Summary of Outstanding Debt | ||||||||
| Market Capitalization | ||||||||
| Summary of Development Opportunities | ||||||||
| 2. | PORTFOLIO DATA | |||||||
| Property Report | ||||||||
| Office Leasing Summary | ||||||||
| Retail Leasing Summary | ||||||||
| Multifamily Leasing Summary | ||||||||
| Mixed-Use Leasing Summary | ||||||||
| Lease Expirations | ||||||||
| Portfolio Leased Statistics | ||||||||
| Top Tenants - Office | ||||||||
| Top Tenants - Retail | ||||||||
| 3. | APPENDIX | |||||||
| Glossary of Terms | ||||||||
| Third Quarter 2025 Supplemental Information | Page 3 | ||||
| |||||
| Third Quarter 2025 Supplemental Information | Page 4 | ||||
| CONSOLIDATED BALANCE SHEETS | | ||||
| (Amounts in thousands, except shares and per share data) | September 30, 2025 | December 31, 2024 | |||||||||
| ASSETS | (unaudited) | ||||||||||
| Real estate, at cost | |||||||||||
| Operating real estate | $ | 3,668,738 | $ | 3,449,009 | |||||||
| Construction in progress | 73,727 | 176,868 | |||||||||
| Held for development | 487 | 487 | |||||||||
| 3,742,952 | 3,626,364 | ||||||||||
| Accumulated depreciation | (1,116,022) | (1,038,878) | |||||||||
| Net real estate | 2,626,930 | 2,587,486 | |||||||||
| Cash and cash equivalents | 138,714 | 425,659 | |||||||||
| Accounts receivable, net | 7,819 | 6,905 | |||||||||
| Deferred rent receivable, net | 85,827 | 88,059 | |||||||||
| Other assets, net | 82,765 | 87,737 | |||||||||
| Real estate assets held for sale | — | 77,519 | |||||||||
| TOTAL ASSETS | $ | 2,942,055 | $ | 3,273,365 | |||||||
| LIABILITIES AND EQUITY | |||||||||||
| LIABILITIES: | |||||||||||
| Secured notes payable, net | $ | 74,827 | $ | 74,759 | |||||||
| Unsecured notes payable, net | 1,612,228 | 1,935,756 | |||||||||
| Accounts payable and accrued expenses | 69,581 | 63,693 | |||||||||
| Security deposits payable | 9,323 | 8,896 | |||||||||
| Other liabilities and deferred credits, net | 61,705 | 62,588 | |||||||||
| Liabilities related to real estate assets held for sale | — | 3,352 | |||||||||
| Total liabilities | 1,827,664 | 2,149,044 | |||||||||
| Commitments and contingencies | |||||||||||
| EQUITY: | |||||||||||
| American Assets Trust, Inc. stockholders' equity | |||||||||||
| Common stock, $0.01 par value, 490,000,000 shares authorized, 61,152,542 and 61,138,238 shares issued and outstanding at September 30, 2025 and December 31, 2024, respectively | 612 | 611 | |||||||||
| Additional paid in capital | 1,480,025 | 1,474,869 | |||||||||
| Accumulated dividends in excess of net income | (313,594) | (304,339) | |||||||||
| Accumulated other comprehensive income | 2,111 | 4,760 | |||||||||
| Total American Assets Trust, Inc. stockholders' equity | 1,169,154 | 1,175,901 | |||||||||
| Noncontrolling interests | (54,763) | (51,580) | |||||||||
| Total equity | 1,114,391 | 1,124,321 | |||||||||
| TOTAL LIABILITIES AND EQUITY | $ | 2,942,055 | $ | 3,273,365 | |||||||
| Third Quarter 2025 Supplemental Information | Page 5 | ||||
| CONSOLIDATED STATEMENTS OF OPERATIONS | | ||||
| (Unaudited, amounts in thousands, except shares and per share data) | Three Months Ended | Nine Months Ended | |||||||||||||||||||||
| September 30, | September 30, | ||||||||||||||||||||||
| 2025 | 2024 | 2025 | 2024 | ||||||||||||||||||||
| REVENUE: | |||||||||||||||||||||||
| Rental income | $ | 102,222 | $ | 105,549 | $ | 306,243 | $ | 315,664 | |||||||||||||||
| Other property income | 7,356 | 17,261 | 19,875 | 28,731 | |||||||||||||||||||
| Total revenue | 109,578 | 122,810 | 326,118 | 344,395 | |||||||||||||||||||
| EXPENSES: | |||||||||||||||||||||||
| Rental expenses | 31,768 | 31,361 | 91,746 | 90,707 | |||||||||||||||||||
| Real estate taxes | 11,529 | 11,044 | 33,179 | 33,133 | |||||||||||||||||||
| General and administrative | 9,500 | 9,068 | 27,662 | 26,647 | |||||||||||||||||||
| Depreciation and amortization | 32,014 | 33,529 | 95,290 | 94,757 | |||||||||||||||||||
| Total operating expenses | 84,811 | 85,002 | 247,877 | 245,244 | |||||||||||||||||||
| Gain on sale of real estate | — | — | 44,476 | — | |||||||||||||||||||
| OPERATING INCOME | 24,767 | 37,808 | 122,717 | 99,151 | |||||||||||||||||||
| Interest expense, net | (19,773) | (18,229) | (58,337) | (50,773) | |||||||||||||||||||
| Other income, net | 927 | 1,739 | 2,769 | 12,857 | |||||||||||||||||||
| NET INCOME | 5,921 | 21,318 | 67,149 | 61,235 | |||||||||||||||||||
| Net income attributable to restricted shares | (207) | (194) | (616) | (585) | |||||||||||||||||||
| Net income attributable to unitholders in the Operating Partnership | (1,205) | (4,467) | (14,033) | (12,829) | |||||||||||||||||||
| NET INCOME ATTRIBUTABLE TO AMERICAN ASSETS TRUST, INC. STOCKHOLDERS | $ | 4,509 | $ | 16,657 | $ | 52,500 | $ | 47,821 | |||||||||||||||
| EARNINGS PER COMMON SHARE | |||||||||||||||||||||||
| Basic income from operations attributable to common stockholders per share | $ | 0.07 | $ | 0.28 | $ | 0.87 | $ | 0.79 | |||||||||||||||
| Weighted average shares of common stock outstanding - basic | 60,546,480 | 60,320,269 | 60,541,335 | 60,314,377 | |||||||||||||||||||
| Diluted income from continuing operations attributable to common stockholders per share | $ | 0.07 | $ | 0.28 | $ | 0.87 | $ | 0.79 | |||||||||||||||
| Weighted average shares of common stock outstanding - diluted | 76,728,017 | 76,501,806 | 76,722,872 | 76,495,914 | |||||||||||||||||||
| Third Quarter 2025 Supplemental Information | Page 6 | ||||
| FUNDS FROM OPERATIONS, FFO AS ADJUSTED & FUNDS AVAILABLE FOR DISTRIBUTION | | ||||
| (Unaudited, amounts in thousands, except shares and per share data) | Three Months Ended | Nine Months Ended | |||||||||||||||||||||
| September 30, | September 30, | ||||||||||||||||||||||
| 2025 | 2024 | 2025 | 2024 | ||||||||||||||||||||
Funds from Operations (FFO) (1) | |||||||||||||||||||||||
| Net income | $ | 5,921 | $ | 21,318 | $ | 67,149 | $ | 61,235 | |||||||||||||||
| Depreciation and amortization of real estate assets | 32,014 | 33,529 | 95,290 | 94,757 | |||||||||||||||||||
| Gain on sale of real estate | — | — | (44,476) | — | |||||||||||||||||||
| FFO, as defined by NAREIT | 37,935 | 54,847 | 117,963 | 155,992 | |||||||||||||||||||
| Less: Nonforfeitable dividends on restricted stock awards | (181) | (192) | (541) | (576) | |||||||||||||||||||
| FFO attributable to common stock and common units | $ | 37,754 | $ | 54,655 | $ | 117,422 | $ | 155,416 | |||||||||||||||
| FFO per diluted share/unit | $ | 0.49 | $ | 0.71 | $ | 1.53 | $ | 2.03 | |||||||||||||||
FFO per diluted share/unit, excluding lease termination fees and litigation income (2) | $ | 0.48 | $ | 0.56 | $ | 1.51 | $ | 1.75 | |||||||||||||||
Weighted average number of common shares and common units, diluted (3) | 76,732,590 | 76,505,676 | 76,729,280 | 76,499,208 | |||||||||||||||||||
Funds Available for Distribution (FAD) (1) | $ | 25,960 | $ | 34,576 | $ | 82,618 | $ | 113,543 | |||||||||||||||
| Dividends | |||||||||||||||||||||||
| Dividends declared and paid | $ | 26,294 | $ | 25,822 | $ | 78,876 | $ | 77,466 | |||||||||||||||
| Dividends declared and paid per share/unit | $ | 0.340 | $ | 0.335 | $ | 1.020 | $ | 1.005 | |||||||||||||||
| Third Quarter 2025 Supplemental Information | Page 7 | ||||
| FUNDS FROM OPERATIONS, FFO AS ADJUSTED & FUNDS AVAILABLE FOR DISTRIBUTION (CONTINUED) | | ||||
| (Unaudited, amounts in thousands, except shares and per share data) | Three Months Ended | Nine Months Ended | |||||||||||||||||||||
| September 30, | September 30, | ||||||||||||||||||||||
| 2025 | 2024 | 2025 | 2024 | ||||||||||||||||||||
Funds Available for Distribution (FAD) (1) | |||||||||||||||||||||||
| FFO | $ | 37,935 | $ | 54,847 | $ | 117,963 | $ | 155,992 | |||||||||||||||
| Adjustments: | |||||||||||||||||||||||
| Tenant improvements, leasing commissions and capital expenditures | (14,669) | (21,894) | (41,788) | (44,625) | |||||||||||||||||||
Net effect of straight-line rents (4) | 861 | (509) | 1,351 | (3,172) | |||||||||||||||||||
Amortization of net above (below) market rents (5) | (491) | (648) | (1,732) | (2,079) | |||||||||||||||||||
Net effect of other lease assets (6) | (29) | 99 | 36 | 97 | |||||||||||||||||||
| Amortization of debt issuance costs and debt fair value adjustment | 731 | 888 | 2,173 | 2,558 | |||||||||||||||||||
| Non-cash compensation expense | 1,803 | 1,985 | 5,156 | 5,348 | |||||||||||||||||||
| Nonforfeitable dividends on restricted stock awards | (181) | (192) | (541) | (576) | |||||||||||||||||||
| FAD | $ | 25,960 | $ | 34,576 | $ | 82,618 | $ | 113,543 | |||||||||||||||
| Summary of Capital Expenditures | |||||||||||||||||||||||
| Tenant improvements and leasing commissions | $ | 7,453 | $ | 12,962 | $ | 25,114 | $ | 25,376 | |||||||||||||||
| Capital expenditures | 7,216 | 8,932 | 16,674 | 19,249 | |||||||||||||||||||
| $ | 14,669 | $ | 21,894 | $ | 41,788 | $ | 44,625 | ||||||||||||||||
| Third Quarter 2025 Supplemental Information | Page 8 | ||||
| CORPORATE GUIDANCE | | ||||
| (Amounts in thousands, except share and per share data) | |||||||||||||||||||||||
Prior 2025 Guidance Range (1) (2) | Revised 2025 Guidance Range (2) | ||||||||||||||||||||||
| Funds from Operations (FFO): | |||||||||||||||||||||||
| Net income | $ | 70,977 | $ | 80,186 | $ | 70,227 | $ | 76,367 | |||||||||||||||
| Depreciation and amortization of real estate assets | 119,256 | 119,256 | 123,094 | 123,094 | |||||||||||||||||||
| Gain on sale of real estate | (44,476) | (44,476) | (44,476) | (44,476) | |||||||||||||||||||
| FFO, as defined by NAREIT | 145,757 | 154,966 | 148,845 | 154,985 | |||||||||||||||||||
| Less: Nonforfeitable dividends on restricted stock awards | (721) | (721) | (729) | (729) | |||||||||||||||||||
| FFO attributable to common stock and units | $ | 145,036 | $ | 154,245 | $ | 148,116 | $ | 154,256 | |||||||||||||||
| Weighted average number of common shares and units, diluted | 76,738,815 | 76,738,815 | 76,744,005 | 76,744,005 | |||||||||||||||||||
| FFO per diluted share, updated | $ | 1.89 | $ | 2.01 | $ | 1.93 | $ | 2.01 | |||||||||||||||
| Third Quarter 2025 Supplemental Information | Page 9 | ||||
| SAME-STORE NET OPERATING INCOME (NOI) | | ||||
| (Unaudited, amounts in thousands) | Three Months Ended September 30, 2025 (1) | ||||||||||||||||||||||||||||
| Office | Retail | Multifamily | Mixed-Use | Total | |||||||||||||||||||||||||
| Real estate rental revenue | |||||||||||||||||||||||||||||
| Same-store | $ | 51,944 | $ | 23,123 | $ | 16,191 | $ | 16,750 | $ | 108,008 | |||||||||||||||||||
| Non-same store | 349 | 8 | 1,213 | — | 1,570 | ||||||||||||||||||||||||
| Total | 52,293 | 23,131 | 17,404 | 16,750 | 109,578 | ||||||||||||||||||||||||
| Real estate expenses | |||||||||||||||||||||||||||||
| Same-store | 15,721 | 6,516 | 7,865 | 11,109 | 41,211 | ||||||||||||||||||||||||
| Non-same store | 1,472 | 8 | 606 | — | 2,086 | ||||||||||||||||||||||||
| Total | 17,193 | 6,524 | 8,471 | 11,109 | 43,297 | ||||||||||||||||||||||||
| Net Operating Income (NOI) | |||||||||||||||||||||||||||||
| Same-store | 36,223 | 16,607 | 8,326 | 5,641 | 66,797 | ||||||||||||||||||||||||
| Non-same store | (1,123) | — | 607 | — | (516) | ||||||||||||||||||||||||
| Total | $ | 35,100 | $ | 16,607 | $ | 8,933 | $ | 5,641 | $ | 66,281 | |||||||||||||||||||
| Same-store NOI | $ | 36,223 | $ | 16,607 | $ | 8,326 | $ | 5,641 | $ | 66,797 | |||||||||||||||||||
Net effect of straight-line rents (2) | 1,844 | (149) | (724) | 32 | 1,003 | ||||||||||||||||||||||||
Amortization of net above (below) market rents (3) | (385) | (106) | — | — | (491) | ||||||||||||||||||||||||
Net effect of other lease assets (4) | (58) | 11 | — | — | (47) | ||||||||||||||||||||||||
Lease termination fees and tenant improvement reimbursements (5) | (2,302) | (1) | — | — | (2,303) | ||||||||||||||||||||||||
Same-store cash NOI (5) | $ | 35,322 | $ | 16,362 | $ | 7,602 | $ | 5,673 | $ | 64,959 | |||||||||||||||||||
| Third Quarter 2025 Supplemental Information | Page 10 | ||||
| SAME-STORE NET OPERATING INCOME (NOI) (CONTINUED) | | ||||
| (Unaudited, amounts in thousands) | Nine Months Ended September 30, 2025 (1) | ||||||||||||||||||||||||||||
| Office | Retail | Multifamily | Mixed-Use | Total | |||||||||||||||||||||||||
| Real estate rental revenue | |||||||||||||||||||||||||||||
| Same-store | $ | 153,335 | $ | 69,172 | $ | 48,968 | $ | 49,676 | $ | 321,151 | |||||||||||||||||||
| Non-same store | 657 | 1,615 | 2,695 | — | 4,967 | ||||||||||||||||||||||||
| Total | 153,992 | 70,787 | 51,663 | 49,676 | 326,118 | ||||||||||||||||||||||||
| Real estate expenses | |||||||||||||||||||||||||||||
| Same-store | 44,895 | 19,121 | 21,978 | 33,101 | 119,095 | ||||||||||||||||||||||||
| Non-same store | 3,611 | 742 | 1,477 | — | 5,830 | ||||||||||||||||||||||||
| Total | 48,506 | 19,863 | 23,455 | 33,101 | 124,925 | ||||||||||||||||||||||||
| Net Operating Income (NOI) | |||||||||||||||||||||||||||||
| Same-store | 108,440 | 50,051 | 26,990 | 16,575 | 202,056 | ||||||||||||||||||||||||
| Non-same store | (2,954) | 873 | 1,218 | — | (863) | ||||||||||||||||||||||||
| Total | $ | 105,486 | $ | 50,924 | $ | 28,208 | $ | 16,575 | $ | 201,193 | |||||||||||||||||||
| Same-store NOI | $ | 108,440 | $ | 50,051 | $ | 26,990 | $ | 16,575 | $ | 202,056 | |||||||||||||||||||
Net effect of straight-line rents (2) | 2,290 | 106 | (944) | 143 | 1,595 | ||||||||||||||||||||||||
Amortization of net above (below) market rents (3) | (1,350) | (382) | — | — | (1,732) | ||||||||||||||||||||||||
Net effect of other lease assets (4) | (16) | 34 | — | — | 18 | ||||||||||||||||||||||||
Lease termination fees and tenant improvement reimbursements (5) | (3,223) | (173) | — | — | (3,396) | ||||||||||||||||||||||||
Same-store cash NOI (5) | $ | 106,141 | $ | 49,636 | $ | 26,046 | $ | 16,718 | $ | 198,541 | |||||||||||||||||||
| Third Quarter 2025 Supplemental Information | Page 11 | ||||
| SAME-STORE CASH NOI COMPARISON EXCLUDING REDEVELOPMENT | | ||||
| (Unaudited, amounts in thousands) | Three Months Ended | Nine Months Ended | |||||||||||||||||||||||||||||||||
| September 30, | September 30, | ||||||||||||||||||||||||||||||||||
| 2025 | 2024 | Change | 2025 | 2024 | Change | ||||||||||||||||||||||||||||||
| Cash Basis: | |||||||||||||||||||||||||||||||||||
| Office | $ | 35,322 | $ | 34,109 | 3.6 | % | $ | 106,141 | $ | 103,352 | 2.7 | % | |||||||||||||||||||||||
| Retail | 16,362 | 16,800 | (2.6) | 49,636 | 48,514 | 2.3 | |||||||||||||||||||||||||||||
| Multifamily | 7,602 | 8,292 | (8.3) | 26,046 | 27,045 | (3.7) | |||||||||||||||||||||||||||||
| Mixed-Use | 5,673 | 6,309 | (10.1) | 16,718 | 18,375 | (9.0) | |||||||||||||||||||||||||||||
Same-store Cash NOI (1)(2) | $ | 64,959 | $ | 65,510 | (0.8) | % | $ | 198,541 | $ | 197,286 | 0.6 | % | |||||||||||||||||||||||
| Third Quarter 2025 Supplemental Information | Page 12 | ||||
| SAME-STORE CASH NOI COMPARISON WITH REDEVELOPMENT | | ||||
| (Unaudited, amounts in thousands) | Three Months Ended | Nine Months Ended | |||||||||||||||||||||||||||||||||
| September 30, | September 30, | ||||||||||||||||||||||||||||||||||
| 2025 | 2024 | Change | 2025 | 2024 | Change | ||||||||||||||||||||||||||||||
| Cash Basis: | |||||||||||||||||||||||||||||||||||
Office (1) | $ | 35,024 | $ | 33,876 | 3.4 | % | $ | 105,368 | $ | 102,893 | 2.4 | % | |||||||||||||||||||||||
| Retail | 16,362 | 16,800 | (2.6) | 49,636 | 48,514 | 2.3 | |||||||||||||||||||||||||||||
| Multifamily | 7,602 | 8,292 | (8.3) | 26,046 | 27,045 | (3.7) | |||||||||||||||||||||||||||||
| Mixed-Use | 5,673 | 6,309 | (10.1) | 16,718 | 18,375 | (9.0) | |||||||||||||||||||||||||||||
Same-store Cash NOI with Redevelopment (2)(3) | $ | 64,661 | $ | 65,277 | (0.9) | % | $ | 197,768 | $ | 196,827 | 0.5 | % | |||||||||||||||||||||||
| Third Quarter 2025 Supplemental Information | Page 13 | ||||
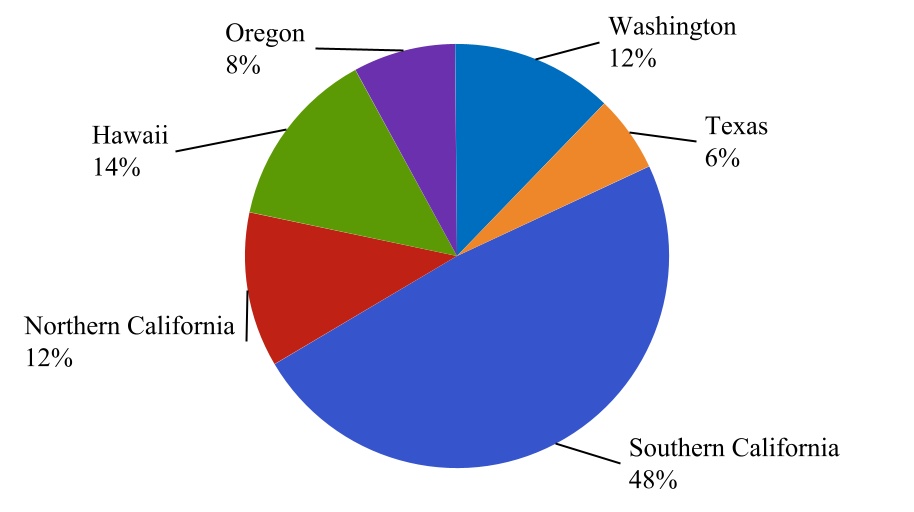
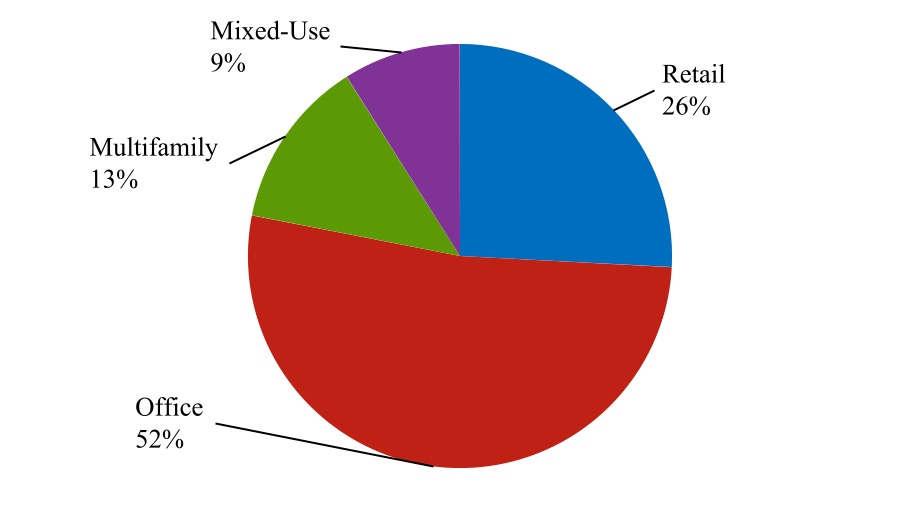
| CASH NOI BY REGION | | ||||
| (Unaudited, amounts in thousands) | Three Months Ended September 30, 2025 | ||||||||||||||||||||||||||||
| Office | Retail | Multifamily | Mixed-Use | Total | |||||||||||||||||||||||||
| Cash Basis: | |||||||||||||||||||||||||||||
| Southern California | $ | 14,545 | $ | 9,052 | $ | 7,059 | $ | — | $ | 30,656 | |||||||||||||||||||
| Northern California | 7,340 | 265 | — | — | 7,605 | ||||||||||||||||||||||||
| Hawaii | — | 3,158 | — | 5,673 | 8,831 | ||||||||||||||||||||||||
| Oregon | 4,233 | 146 | 1,150 | — | 5,529 | ||||||||||||||||||||||||
| Texas | — | 3,741 | — | — | 3,741 | ||||||||||||||||||||||||
| Washington | 7,957 | — | — | — | 7,957 | ||||||||||||||||||||||||
| Total Cash NOI | $ | 34,075 | $ | 16,362 | $ | 8,209 | $ | 5,673 | $ | 64,319 | |||||||||||||||||||
| Third Quarter 2025 Supplemental Information | Page 14 | ||||
| CASH NOI BREAKDOWN | | ||||
| Three Months Ended September 30, 2025 | ||
| Cash NOI Breakdown | ||||||||
| Portfolio Diversification by Geographic Region | Portfolio Diversification by Segment | |||||||
| Third Quarter 2025 Supplemental Information | Page 15 | ||||
| PROPERTY REVENUE AND OPERATING EXPENSES | | ||||
| (Unaudited, amounts in thousands) | Three Months Ended September 30, 2025 | |||||||||||||||||||||||||||||||||||||
| Additional | Property | |||||||||||||||||||||||||||||||||||||
| Property | Billed Expense | Operating | Rental | Cash | ||||||||||||||||||||||||||||||||||
| Property | Base Rent (1) | Income (2) | Reimbursements (3) | Expenses (4) | Adjustments (5) | NOI (6) | ||||||||||||||||||||||||||||||||
| Office Portfolio | ||||||||||||||||||||||||||||||||||||||
| La Jolla Commons | $ | 9,770 | $ | 277 | $ | 2,370 | $ | (4,352) | $ | (460) | $ | 7,605 | ||||||||||||||||||||||||||
Torrey Reserve Campus (7) | 6,243 | 66 | 310 | (1,777) | (135) | 4,707 | ||||||||||||||||||||||||||||||||
| Torrey Point | 1,521 | 95 | 29 | (423) | (338) | 884 | ||||||||||||||||||||||||||||||||
| Solana Crossing | 1,971 | 17 | 144 | (686) | (93) | 1,353 | ||||||||||||||||||||||||||||||||
| The Landmark at One Market | 10,458 | 85 | 1,039 | (3,944) | — | 7,638 | ||||||||||||||||||||||||||||||||
| One Beach Street | 10 | — | — | (308) | — | (298) | ||||||||||||||||||||||||||||||||
| First & Main | 2,208 | 274 | 509 | (1,085) | (334) | 1,572 | ||||||||||||||||||||||||||||||||
Lloyd Portfolio (7) | 3,753 | 430 | 212 | (1,508) | (110) | 2,777 | ||||||||||||||||||||||||||||||||
| City Center Bellevue | 6,870 | 771 | 206 | (1,653) | (197) | 5,997 | ||||||||||||||||||||||||||||||||
14Acres (8) | 937 | 18 | 323 | (645) | (38) | 595 | ||||||||||||||||||||||||||||||||
Timber Ridge (9) | 1,083 | 53 | 417 | (468) | (42) | 1,043 | ||||||||||||||||||||||||||||||||
Timber Springs (10) | 433 | 10 | 158 | (234) | (45) | 322 | ||||||||||||||||||||||||||||||||
| Subtotal Office Portfolio | $ | 45,257 | $ | 2,096 | $ | 5,717 | $ | (17,083) | $ | (1,792) | $ | 34,195 | ||||||||||||||||||||||||||
| Retail Portfolio | ||||||||||||||||||||||||||||||||||||||
| Carmel Country Plaza | $ | 1,010 | $ | 15 | $ | 230 | $ | (251) | $ | (29) | $ | 975 | ||||||||||||||||||||||||||
| Carmel Mountain Plaza | 3,626 | 113 | 1,048 | (1,075) | — | 3,712 | ||||||||||||||||||||||||||||||||
| South Bay Marketplace | 633 | 19 | 231 | (226) | — | 657 | ||||||||||||||||||||||||||||||||
| Gateway Marketplace | 549 | — | 216 | (283) | — | 482 | ||||||||||||||||||||||||||||||||
| Lomas Santa Fe Plaza | 1,643 | 22 | 316 | (471) | (5) | 1,505 | ||||||||||||||||||||||||||||||||
| Solana Beach Towne Centre | 1,797 | 17 | 542 | (620) | (15) | 1,721 | ||||||||||||||||||||||||||||||||
| Geary Marketplace | 272 | 3 | 146 | (156) | — | 265 | ||||||||||||||||||||||||||||||||
| The Shops at Kalakaua | 302 | 17 | 52 | (97) | — | 274 | ||||||||||||||||||||||||||||||||
| Waikele Center | 3,130 | 462 | 917 | (1,625) | — | 2,884 | ||||||||||||||||||||||||||||||||
| Alamo Quarry Market | 4,009 | 135 | 1,192 | (1,595) | — | 3,741 | ||||||||||||||||||||||||||||||||
| Hassalo on Eighth - Retail | 214 | 20 | 37 | (125) | — | 146 | ||||||||||||||||||||||||||||||||
| Subtotal Retail Portfolio | $ | 17,185 | $ | 823 | $ | 4,927 | $ | (6,524) | $ | (49) | $ | 16,362 | ||||||||||||||||||||||||||
| Third Quarter 2025 Supplemental Information | Page 16 | ||||
| PROPERTY REVENUE AND OPERATING EXPENSES (CONTINUED) | | ||||
| (Unaudited, amounts in thousands) | Three Months Ended September 30, 2025 | |||||||||||||||||||||||||||||||||||||
| Additional | Property | |||||||||||||||||||||||||||||||||||||
| Property | Billed Expense | Operating | Rental | Cash | ||||||||||||||||||||||||||||||||||
| Property | Base Rent (1) | Income (2) | Reimbursements (3) | Expenses (4) | Adjustments (5) | NOI (6) | ||||||||||||||||||||||||||||||||
| Multifamily Portfolio | ||||||||||||||||||||||||||||||||||||||
| Loma Palisades | $ | 4,391 | $ | 283 | $ | — | $ | (1,778) | $ | (23) | $ | 2,873 | ||||||||||||||||||||||||||
| Imperial Beach Gardens | 1,126 | 74 | — | (571) | (18) | 611 | ||||||||||||||||||||||||||||||||
| Mariner's Point | 566 | 33 | — | (259) | — | 340 | ||||||||||||||||||||||||||||||||
| Santa Fe Park RV Resort | 497 | 46 | — | (290) | — | 253 | ||||||||||||||||||||||||||||||||
| Pacific Ridge Apartments | 5,904 | 286 | — | (2,906) | (910) | 2,374 | ||||||||||||||||||||||||||||||||
Genesee Park (11) | 1,206 | 11 | — | (606) | (3) | 608 | ||||||||||||||||||||||||||||||||
| Hassalo on Eighth - Multifamily | 2,949 | 427 | — | (2,061) | (165) | 1,150 | ||||||||||||||||||||||||||||||||
| Subtotal Multifamily Portfolio | $ | 16,639 | $ | 1,160 | $ | — | $ | (8,471) | $ | (1,119) | $ | 8,209 | ||||||||||||||||||||||||||
| Mixed-Use Portfolio | ||||||||||||||||||||||||||||||||||||||
| Waikiki Beach Walk - Retail | $ | 2,419 | $ | 1,563 | $ | 999 | $ | (1,902) | $ | (57) | $ | 3,022 | ||||||||||||||||||||||||||
| Waikiki Beach Walk - Embassy Suites™ | 10,107 | 1,751 | — | (9,207) | — | 2,651 | ||||||||||||||||||||||||||||||||
| Subtotal Mixed-Use Portfolio | $ | 12,526 | $ | 3,314 | $ | 999 | $ | (11,109) | $ | (57) | $ | 5,673 | ||||||||||||||||||||||||||
| Subtotal Development Properties | $ | — | $ | 9 | $ | — | $ | (129) | $ | — | $ | (120) | ||||||||||||||||||||||||||
| Total | $ | 91,607 | $ | 7,402 | $ | 11,643 | $ | (43,316) | $ | (3,017) | $ | 64,319 | ||||||||||||||||||||||||||
| Base Rent | $ | 91,607 | |||
| Billed Expense Reimbursement | 11,643 | ||||
| Percentage Rent | 521 | ||||
| Straight-line rent components | (861) | ||||
| Other Rental Income* | (688) | ||||
| Rental Income | $ | 102,222 | |||
| Third Quarter 2025 Supplemental Information | Page 17 | ||||
| PROPERTY REVENUE AND OPERATING EXPENSES (CONTINUED) | | ||||
| Third Quarter 2025 Supplemental Information | Page 18 | ||||
| SEGMENT CAPITAL EXPENDITURES | | ||||
| (Unaudited, amounts in thousands) | Three Months Ended September 30, 2025 | |||||||||||||||||||||||||||||||||||||
| Segment | Tenant Improvements and Leasing Commissions | Capital Expenditures | Total Tenant Improvements, Leasing Commissions and Capital Expenditures | Redevelopment, Expansions and Repositioning (1) | New Development | Total Capital Expenditures | ||||||||||||||||||||||||||||||||
| Office Portfolio | $ | 5,033 | $ | 4,492 | $ | 9,525 | $ | 1,310 | $ | 2,350 | $ | 13,185 | ||||||||||||||||||||||||||
| Retail Portfolio | 2,274 | 1,664 | 3,938 | 562 | — | 4,500 | ||||||||||||||||||||||||||||||||
| Multifamily Portfolio | — | 768 | 768 | 342 | — | 1,110 | ||||||||||||||||||||||||||||||||
| Mixed-Use Portfolio | 146 | 292 | 438 | — | — | 438 | ||||||||||||||||||||||||||||||||
| Total | $ | 7,453 | $ | 7,216 | $ | 14,669 | $ | 2,214 | $ | 2,350 | $ | 19,233 | ||||||||||||||||||||||||||
| Nine Months Ended September 30, 2025 | ||||||||||||||||||||||||||||||||||||||
| Segment | Tenant Improvements and Leasing Commissions | Capital Expenditures | Total Tenant Improvements, Leasing Commissions and Capital Expenditures | Redevelopment, Expansions and Repositioning (1) | New Development | Total Capital Expenditures | ||||||||||||||||||||||||||||||||
| Office Portfolio | $ | 20,870 | $ | 10,287 | $ | 31,157 | $ | 3,639 | $ | 12,558 | $ | 47,354 | ||||||||||||||||||||||||||
| Retail Portfolio | 3,821 | 2,627 | 6,448 | 698 | — | 7,146 | ||||||||||||||||||||||||||||||||
| Multifamily Portfolio | — | 2,236 | 2,236 | 836 | — | 3,072 | ||||||||||||||||||||||||||||||||
| Mixed-Use Portfolio | 423 | 1,524 | 1,947 | — | — | 1,947 | ||||||||||||||||||||||||||||||||
| Total | $ | 25,114 | $ | 16,674 | $ | 41,788 | $ | 5,173 | $ | 12,558 | $ | 59,519 | ||||||||||||||||||||||||||
| Third Quarter 2025 Supplemental Information | Page 19 | ||||
| SUMMARY OF OUTSTANDING DEBT | | ||||
| (Unaudited, amounts in thousands) | Amount | |||||||||||||||||||||||||
| Outstanding at | Annual Debt | |||||||||||||||||||||||||
| Debt | September 30, 2025 | Interest Rate | Service (1) | Maturity Date | ||||||||||||||||||||||
| City Center Bellevue | 75,000 | 5.08 | % | 3,863 | October 1, 2027 | |||||||||||||||||||||
Secured Notes Payable / Weighted Average (2) | $ | 75,000 | 5.08 | % | $ | 3,863 | ||||||||||||||||||||
Term Loan A (3) | $ | 100,000 | 2.70 | % | $ | 2,700 | January 5, 2027 | |||||||||||||||||||
Series D Notes (4) | 250,000 | 3.87 | % | 10,725 | March 1, 2027 | |||||||||||||||||||||
Series E Notes (5) | 100,000 | 4.18 | % | 4,240 | May 23, 2029 | |||||||||||||||||||||
Series G Notes (6) | 150,000 | 3.88 | % | 5,865 | July 30, 2030 | |||||||||||||||||||||
3.375% Senior Notes (7) | 500,000 | 3.50 | % | 16,875 | February 1, 2031 | |||||||||||||||||||||
6.150% Senior Notes (8) | 525,000 | 6.21 | % | $ | 32,288 | October 1, 2034 | ||||||||||||||||||||
Unsecured Notes Payable / Weighted Average (9) | $ | 1,625,000 | 4.46 | % | $ | 72,693 | ||||||||||||||||||||
Unsecured Line of Credit (10) | $ | — | ||||||||||||||||||||||||
| Third Quarter 2025 Supplemental Information | Page 20 | ||||
| MARKET CAPITALIZATION | | ||||
| (Unaudited, amounts in thousands, except per share data) | ||||||||||||||
| Market data | September 30, 2025 | |||||||||||||
| Common shares outstanding | 61,153 | |||||||||||||
| Common units outstanding | 16,182 | |||||||||||||
| Common shares and common units outstanding | 77,335 | |||||||||||||
| Market price per common share | $ | 20.32 | ||||||||||||
| Equity market capitalization | $ | 1,571,447 | ||||||||||||
| Total debt | $ | 1,700,000 | ||||||||||||
| Total market capitalization | $ | 3,271,447 | ||||||||||||
| Less: Cash on hand | $ | (138,714) | ||||||||||||
| Total enterprise value | $ | 3,132,733 | ||||||||||||
| Total unencumbered assets, gross | $ | 3,652,649 | ||||||||||||
| Total debt/Total capitalization | 52.0 | % | ||||||||||||
| Total debt/Total enterprise value | 54.3 | % | ||||||||||||
Net debt/Total enterprise value (1) | 49.8 | % | ||||||||||||
| Total unencumbered assets, gross/Unsecured debt | 224.8 | % | ||||||||||||
| Quarter Annualized | Trailing 12 Months | |||||||||||||
Total debt/Adjusted EBITDA (2)(3) | 7.5 | x | 7.3 | x | ||||||||||
Net debt/Adjusted EBITDA (1)(2)(3) | 6.9 | x | 6.7 | x | ||||||||||
Interest coverage ratio (4) | 3.0 | x | 2.9 | x | ||||||||||
Fixed charge coverage ratio (4) | 3.0 | x | 2.9 | x | ||||||||||
Debt Covenants (3.375% Senior Notes & 6.150% Senior Notes) (5) | Covenant | September 30, 2025 | ||||||||||||
| Aggregate Debt Test | < 60% | 43.8% | ||||||||||||
| Debt Service Test | > 1.5x | 3.0 | ||||||||||||
| Secured Debt Test | < 40% | 1.9% | ||||||||||||
| Maintenance of Total Unencumbered Assets | > 150% | 221.9% | ||||||||||||
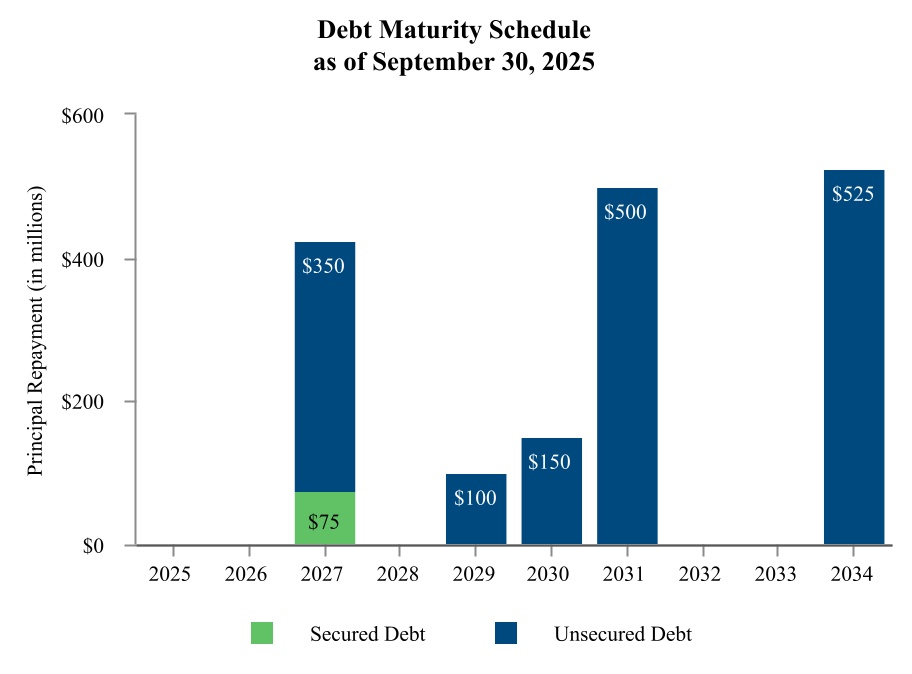
| Weighted Average Fixed Interest Rate | 2025 | 2026 | 2027 | 2028 | 2029 | 2030 | 2031 | 2032 | 2033 | 2034 | ||||||||||||||||||||||
| —% | —% | 3.8% | —% | 4.2% | 3.9% | 3.5% | —% | —% | 6.2% | |||||||||||||||||||||||
| Total Weighted Average Fixed Interest Rate: | 4.5% | ||||
| Weighted Average Term to Maturity (in years): | 5.4 | ||||
| Credit Ratings | ||||||||
| Rating Agency | Rating | Outlook | ||||||
| Fitch | BBB | Stable | ||||||
| Moody's | Baa3 | Stable | ||||||
| Standard & Poors | BBB- | Stable | ||||||
| Third Quarter 2025 Supplemental Information | Page 21 | ||||
| SUMMARY OF DEVELOPMENT OPPORTUNITIES | | ||||
| Our portfolio has numerous potential opportunities to create future shareholder value. These opportunities could be subject to government approvals, lender consents, tenant consents, market conditions, availability of debt and/or equity financing, etc. Many of these opportunities are in their preliminary stages and may not ultimately come to fruition. This schedule will update as we modify various assumptions and markets conditions change. Square footages and units set forth below are estimates only and ultimately may differ materially from actual square footages and units. | |||||||||||||||||||||||||||||
| Development/Redevelopment Pipeline | |||||||||||||||||
| Property | Property Type | Location | Estimated Rentable Square Feet | Multifamily Units | Opportunity | ||||||||||||
| Waikele Center | Retail | Honolulu, HI | 120,000 | N/A | Development of 120,000 square foot retail building (former KMart space) | ||||||||||||
| Lomas Santa Fe Plaza | Retail | Solana Beach, CA | TBD | Development of multifamily units | |||||||||||||
| Genesee Park | Multifamily | San Diego, CA | TBD | Development of multifamily units | |||||||||||||
| Solana Beach Towne Centre | Retail | Solana Beach, CA | TBD | Development of multifamily units | |||||||||||||
| Carmel Mountain Plaza | Retail | San Diego, CA | TBD | Development of multifamily units | |||||||||||||
Lloyd Portfolio - multiple phases (1) | Mixed Use | Portland, OR | |||||||||||||||
Phase 2B - Oregon Square | 385,000 | N/A | Development of high density, transit oriented, mixed-use urban village | ||||||||||||||
| Third Quarter 2025 Supplemental Information | Page 22 | ||||
| |||||
| Third Quarter 2025 Supplemental Information | Page 23 | ||||
| PROPERTY REPORT | | ||||
| As of September 30, 2025 | Office and Retail Portfolios | |||||||||||||||||||||||||||||||||||||||||||||||||
| Net | Annualized | |||||||||||||||||||||||||||||||||||||||||||||||||
| Rentable | Base Rent per | |||||||||||||||||||||||||||||||||||||||||||||||||
| Year Built/ | Square | Percentage | Annualized | Leased | Retail | |||||||||||||||||||||||||||||||||||||||||||||
| Property | Location | Most Recent Renovation | Feet (1) | Leased (2) | Base Rent (3) | Square Foot (4) | Anchor Tenant(s) (5) | Other Principal Retail Tenants (6) | ||||||||||||||||||||||||||||||||||||||||||
| Office Properties | ||||||||||||||||||||||||||||||||||||||||||||||||||
| La Jolla Commons I & II | San Diego, CA | 2008 | 725,439 | 98.0% | $ | 48,451,599 | $68.15 | |||||||||||||||||||||||||||||||||||||||||||
| La Jolla Commons III | San Diego, CA | 2025 | 206,231 | 26.2 | 1,427,194 | 26.41 | ||||||||||||||||||||||||||||||||||||||||||||
| Torrey Reserve Campus | San Diego, CA | 1996/2022 | 551,005 | 83.4 | 25,277,301 | 55.01 | ||||||||||||||||||||||||||||||||||||||||||||
| Torrey Point | San Diego, CA | 2017 | 94,854 | 99.6 | 6,084,139 | 64.40 | ||||||||||||||||||||||||||||||||||||||||||||
| Solana Crossing | Solana Beach, CA | 1982/2022 | 224,009 | 79.3 | 8,656,249 | 48.73 | ||||||||||||||||||||||||||||||||||||||||||||
The Landmark at One Market (7) | San Francisco, CA | 1917/2000 | 422,426 | 98.3 | 41,830,682 | 100.74 | ||||||||||||||||||||||||||||||||||||||||||||
| One Beach Street | San Francisco, CA | 1924/2024 | 100,270 | — | — | — | ||||||||||||||||||||||||||||||||||||||||||||
| First & Main | Portland, OR | 2010 | 362,633 | 74.9 | 8,913,864 | 32.82 | ||||||||||||||||||||||||||||||||||||||||||||
| Lloyd Portfolio | Portland, OR | 1940/2022 | 568,270 | 84.7 | 15,196,259 | 31.57 | ||||||||||||||||||||||||||||||||||||||||||||
| City Center Bellevue | Bellevue, WA | 1987/2023 | 498,606 | 91.4 | 26,854,907 | 58.93 | ||||||||||||||||||||||||||||||||||||||||||||
14Acres (8) | Bellevue, WA | 1985/2024 | 276,060 | 59.3 | 5,626,695 | 34.37 | ||||||||||||||||||||||||||||||||||||||||||||
Timber Ridge (9) | Bellevue, WA | 1986 | 160,509 | 97.5 | 7,560,570 | 48.31 | ||||||||||||||||||||||||||||||||||||||||||||
Timber Springs (10) | Bellevue, WA | 1983 | 93,295 | 70.6 | 2,651,509 | 40.26 | ||||||||||||||||||||||||||||||||||||||||||||
Subtotal/Weighted Average Office Portfolio (11) | 4,283,607 | 81.9% | $ | 198,530,968 | $56.59 | |||||||||||||||||||||||||||||||||||||||||||||
| Retail Properties | ||||||||||||||||||||||||||||||||||||||||||||||||||
| Carmel Country Plaza | San Diego, CA | 1991 | 78,098 | 98.0% | $ | 4,293,530 | $56.10 | Sharp Healthcare, San Diego County Credit Union | ||||||||||||||||||||||||||||||||||||||||||
Carmel Mountain Plaza (12) | San Diego, CA | 1994/2020 | 528,416 | 99.8 | 14,628,396 | 27.74 | At Home Stores | Dick's Sporting Goods, Sprouts Farmers Market, Nordstrom Rack, Total Wine & More | ||||||||||||||||||||||||||||||||||||||||||
South Bay Marketplace (12) | San Diego, CA | 1997/2018 | 132,877 | 97.8 | 2,533,617 | 19.50 | Ross Dress for Less, Grocery Outlet | |||||||||||||||||||||||||||||||||||||||||||
Gateway Marketplace (12) | San Diego, CA | 1997/2016 | 127,861 | 100.0 | 2,553,206 | 19.97 | Hobby Lobby | Smart & Final, Aldi | ||||||||||||||||||||||||||||||||||||||||||
| Lomas Santa Fe Plaza | Solana Beach, CA | 1972/1997 | 208,297 | 96.6 | 6,599,512 | 32.80 | Vons, Home Goods | |||||||||||||||||||||||||||||||||||||||||||
| Solana Beach Towne Centre | Solana Beach, CA | 1973/2004 | 246,651 | 98.1 | 7,367,887 | 30.45 | Dixieline Probuild, Marshalls | |||||||||||||||||||||||||||||||||||||||||||
| Geary Marketplace | Walnut Creek, CA | 2012 | 35,159 | 100.0 | 1,296,151 | 36.87 | Sprouts Farmers Market | |||||||||||||||||||||||||||||||||||||||||||
| The Shops at Kalakaua | Honolulu, HI | 1971/2006 | 11,893 | 100.0 | 1,206,000 | 101.40 | Hawaii Beachware & Fashion, Diesel U.S.A. | |||||||||||||||||||||||||||||||||||||||||||
| Waikele Center | Waipahu, HI | 1993/2008 | 418,611 | 97.1 | 12,462,082 | 30.66 | Lowe's, Safeway | UFC Gym, Office Max, Old Navy | ||||||||||||||||||||||||||||||||||||||||||
Alamo Quarry Market (12) | San Antonio, TX | 1997/1999 | 588,148 | 99.8 | 16,267,685 | 27.71 | Regal Cinemas | Whole Foods Market, Nordstrom Rack, Williams-Sonoma, Sephora, Home Goods | ||||||||||||||||||||||||||||||||||||||||||
| Hassalo on Eighth - Retail | Portland, OR | 2015 | 44,236 | 57.5 | 857,552 | 33.71 | Providence Health & Services, Sola Salon | |||||||||||||||||||||||||||||||||||||||||||
Subtotal/Weighted Average Retail Portfolio (11) | 2,420,247 | 97.9% | $ | 70,065,618 | $29.57 | |||||||||||||||||||||||||||||||||||||||||||||
Total/Weighted Average Office and Retail Portfolio (11) | 6,703,854 | 87.7% | $ | 268,596,586 | $45.69 | |||||||||||||||||||||||||||||||||||||||||||||
| Third Quarter 2025 Supplemental Information | Page 24 | ||||
| PROPERTY REPORT (CONTINUED) | | ||||
| As of September 30, 2025 | ||||||||||||||||||||||||||||||||||||||||||||||||||
| Average Monthly | ||||||||||||||||||||||||||||||||||||||||||||||||||
| Year Built/ | Percentage | Annualized | Base Rent per | |||||||||||||||||||||||||||||||||||||||||||||||
| Property | Location | Most Recent Renovation | Units | Leased (2) | Base Rent (3) | Leased Unit (4) | ||||||||||||||||||||||||||||||||||||||||||||
| Loma Palisades | San Diego, CA | 1958/2022 | 548 | 91.2% | $ | 17,579,544 | $ | 2,931 | ||||||||||||||||||||||||||||||||||||||||||
| Imperial Beach Gardens | Imperial Beach, CA | 1959/2023 | 160 | 89.4 | 4,698,804 | $ | 2,737 | |||||||||||||||||||||||||||||||||||||||||||
| Mariner's Point | Imperial Beach, CA | 1986 | 88 | 92.1 | 2,320,500 | $ | 2,386 | |||||||||||||||||||||||||||||||||||||||||||
Santa Fe Park RV Resort (13) | San Diego, CA | 1971/2008 | 124 | 58.1 | 1,586,304 | $ | 1,835 | |||||||||||||||||||||||||||||||||||||||||||
| Pacific Ridge Apartments | San Diego, CA | 2013 | 533 | 92.1 | 24,734,688 | $ | 4,199 | |||||||||||||||||||||||||||||||||||||||||||
| Genesee Park | San Diego, CA | 1985 | 192 | 97.4 | 4,899,912 | $ | 2,183 | |||||||||||||||||||||||||||||||||||||||||||
Hassalo on Eighth - Multifamily (14) | Portland, OR | 2015 | 657 | 89.8 | 11,823,060 | $ | 1,670 | |||||||||||||||||||||||||||||||||||||||||||
| Total/Weighted Average Multifamily Portfolio | 2,302 | 89.7% | $ | 67,642,812 | $ | 2,730 | ||||||||||||||||||||||||||||||||||||||||||||
| Mixed-Use Portfolio | ||||||||||||||||||||||||||||||||||||||||||||||||||
| Net Rentable | Annualized Base | |||||||||||||||||||||||||||||||||||||||||||||||||
| Year Built/ | Square | Percentage | Annualized | Rent per Leased | Retail | |||||||||||||||||||||||||||||||||||||||||||||
| Retail Portion | Location | Most Recent Renovation | Feet (1) | Leased (2) | Base Rent (3) | Square Foot (4) | Anchor Tenant(s) (5) | Other Principal Retail Tenants (6) | ||||||||||||||||||||||||||||||||||||||||||
| Waikiki Beach Walk - Retail | Honolulu, HI | 2006 | 93,925 | 95.0 | % | $ | 9,882,053 | $ | 110.75 | Yardhouse, Roy's | ||||||||||||||||||||||||||||||||||||||||
| Year Built/ | Average | Average | Revenue per | |||||||||||||||||||||||||||||||||||||||||||||||
| Hotel Portion | Location | Most Recent Renovation | Units | Occupancy (15) | Daily Rate (15) | Available Room (15) | ||||||||||||||||||||||||||||||||||||||||||||
| Waikiki Beach Walk - Embassy Suites™ | Honolulu, HI | 2008/2020 | 369 | 78.3 | % | $ | 381 | $ | 298 | |||||||||||||||||||||||||||||||||||||||||
| Third Quarter 2025 Supplemental Information | Page 25 | ||||
| PROPERTY REPORT (CONTINUED) | | ||||
| Leased Square Feet | Annualized Base | Pro Forma Annualized | |||||||||||||||||||||
| Under Signed But | Annualized | Rent per | Base Rent per | ||||||||||||||||||||
| Not Commenced Leases (a) | Base Rent (b) | Leased Square Foot (b) | Leased Square Foot (c) | ||||||||||||||||||||
| Office Portfolio | 159,446 | $ | 7,391,019 | $ | 46.35 | $ | 58.73 | ||||||||||||||||
| Retail Portfolio | 9,897 | $ | 520,355 | $ | 52.58 | $ | 29.78 | ||||||||||||||||
| Total Retail and Office Portfolio | 169,343 | $ | 7,911,374 | $ | 46.72 | $ | 47.05 | ||||||||||||||||
| Property | Number of Ground Leases | Square Footage Leased Pursuant to Ground Leases | Aggregate Annualized Base Rent | |||||||||||||||||
| Carmel Mountain Plaza | 5 | 17,607 | $ | 1,051,461 | ||||||||||||||||
| South Bay Marketplace | 1 | 2,824 | $ | 114,552 | ||||||||||||||||
| Alamo Quarry Market | 4 | 31,994 | $ | 723,455 | ||||||||||||||||
| Gateway Marketplace | 1 | 18,903 | $ | 226,800 | ||||||||||||||||
| Third Quarter 2025 Supplemental Information | Page 26 | ||||
| OFFICE LEASING SUMMARY | | ||||
| As of September 30, 2025 | ||||||||||||||||||||||||||||||||||||||||||||||||||||||||||||||||||||
Total Lease Summary - Comparable (1) | ||||||||||||||||||||||||||||||||||||||||||||||||||||||||||||||||||||
| Number of Leases Signed | % of Comparable Leases Signed | Net Rentable Square Feet Signed | Contractual Rent Per Sq. Ft. (2) | Prior Rent Per Sq. Ft. (3) | Annual Change in Rent | Cash Basis % Change Over Prior Rent | Straight-Line Basis % Change Over Prior Rent | Weighted Average Lease Term (4) | Tenant Improvements & Incentives | Tenant Improvements & Incentives Per Sq. Ft. | ||||||||||||||||||||||||||||||||||||||||||||||||||||||||||
| Quarter | ||||||||||||||||||||||||||||||||||||||||||||||||||||||||||||||||||||
| 3rd Quarter 2025 | 11 | 100% | 121,810 | $59.09 | $54.05 | $ | 614,455 | 9.3 | % | 18.6 | % | 4.2 | $ | 1,350,521 | $11.09 | |||||||||||||||||||||||||||||||||||||||||||||||||||||
| 2nd Quarter 2025 | 13 | 100% | 69,363 | $40.93 | $41.74 | $ | (56,699) | (2.0) | % | 9.6 | % | 6.8 | $ | 2,661,151 | $38.37 | |||||||||||||||||||||||||||||||||||||||||||||||||||||
| 1st Quarter 2025 | 9 | 100% | 44,422 | $36.83 | $34.16 | $ | 118,407 | 7.8 | % | 15.2 | % | 7.0 | $ | 668,939 | $15.06 | |||||||||||||||||||||||||||||||||||||||||||||||||||||
| 4th Quarter 2024 | 11 | 100% | 56,564 | $52.32 | $51.48 | $ | 47,631 | 1.6 | % | 11.0 | % | 2.6 | $ | 520,590 | $9.20 | |||||||||||||||||||||||||||||||||||||||||||||||||||||
| Total 12 months | 44 | 100% | 292,159 | $50.08 | $47.61 | $ | 723,794 | 5.2 | % | 14.8 | % | 4.9 | $ | 5,201,201 | $17.80 | |||||||||||||||||||||||||||||||||||||||||||||||||||||
New Lease Summary - Comparable (1) | ||||||||||||||||||||||||||||||||||||||||||||||||||||||||||||||||||||
| Number of Leases Signed | % of Comparable Leases Signed | Net Rentable Square Feet Signed | Contractual Rent Per Sq. Ft. (2) | Prior Rent Per Sq. Ft. (3) | Annual Change in Rent | Cash Basis % Change Over Prior Rent | Straight-Line Basis % Change Over Prior Rent | Weighted Average Lease Term (4) | Tenant Improvements & Incentives | Tenant Improvements & Incentives Per Sq. Ft. | ||||||||||||||||||||||||||||||||||||||||||||||||||||||||||
| Quarter | ||||||||||||||||||||||||||||||||||||||||||||||||||||||||||||||||||||
| 3rd Quarter 2025 | 3 | 27% | 62,781 | $67.95 | $63.16 | $ | 300,742 | 7.6 | % | 20.1 | % | 2.7 | $ | 909,502 | $14.49 | |||||||||||||||||||||||||||||||||||||||||||||||||||||
| 2nd Quarter 2025 | 4 | 31% | 50,765 | $38.87 | $41.01 | $ | (108,988) | (5.2) | % | 9.2 | % | 7.9 | $ | 2,444,097 | $48.15 | |||||||||||||||||||||||||||||||||||||||||||||||||||||
| 1st Quarter 2025 | 1 | 11% | 1,913 | $35.50 | $34.01 | $ | 2,843 | 4.4 | % | 0.6 | % | 1.1 | $ | — | — | |||||||||||||||||||||||||||||||||||||||||||||||||||||
| 4th Quarter 2024 | 3 | 27% | 24,128 | $61.41 | $61.86 | $ | (10,753) | (0.7) | % | 16.1 | % | 3.3 | $ | 499,990 | $20.72 | |||||||||||||||||||||||||||||||||||||||||||||||||||||
| Total 12 months | 11 | 25% | 139,587 | $55.80 | $54.48 | $ | 183,844 | 2.4 | % | 16.1 | % | 4.7 | $ | 3,853,589 | $27.61 | |||||||||||||||||||||||||||||||||||||||||||||||||||||
Renewal Lease Summary - Comparable (1)(5) | ||||||||||||||||||||||||||||||||||||||||||||||||||||||||||||||||||||
| Number of Leases Signed | % of Comparable Leases Signed | Net Rentable Square Feet Signed | Contractual Rent Per Sq. Ft. (2) | Prior Rent Per Sq. Ft. (3) | Annual Change in Rent | Cash Basis % Change Over Prior Rent | Straight-Line Basis % Change Over Prior Rent | Weighted Average Lease Term (4) | Tenant Improvements & Incentives | Tenant Improvements & Incentives Per Sq. Ft. | ||||||||||||||||||||||||||||||||||||||||||||||||||||||||||
| Quarter | ||||||||||||||||||||||||||||||||||||||||||||||||||||||||||||||||||||
| 3rd Quarter 2025 | 8 | 73% | 59,029 | $49.68 | $44.36 | $ | 313,713 | 12.0 | % | 16.5 | % | 5.8 | $ | 441,019 | $7.47 | |||||||||||||||||||||||||||||||||||||||||||||||||||||
| 2nd Quarter 2025 | 9 | 69% | 18,598 | $46.55 | $43.74 | $ | 52,289 | 6.4 | % | 10.7 | % | 4.0 | $ | 217,054 | $11.67 | |||||||||||||||||||||||||||||||||||||||||||||||||||||
| 1st Quarter 2025 | 8 | 89% | 42,509 | $36.89 | $34.17 | $ | 115,564 | 8.0 | % | 16.0 | % | 7.2 | $ | 668,939 | $15.74 | |||||||||||||||||||||||||||||||||||||||||||||||||||||
| 4th Quarter 2024 | 8 | 73% | 32,436 | $45.56 | $43.76 | $ | 58,384 | 4.1 | % | 6.2 | % | 2.2 | $ | 20,600 | $0.64 | |||||||||||||||||||||||||||||||||||||||||||||||||||||
| Total 12 months | 33 | 75% | 152,572 | $44.86 | $41.32 | $ | 539,950 | 8.6 | % | 13.2 | % | 5.2 | $ | 1,347,612 | $8.83 | |||||||||||||||||||||||||||||||||||||||||||||||||||||
| Total Lease Summary - Comparable and Non-Comparable | ||||||||||||||||||||||||||||||||||||||||||||||||||||||||||||||||||||
| Number of Leases Signed | Net Rentable Square Feet Signed | Contractual Rent Per Sq. Ft. (2) | Weighted Average Lease Term (4) | Tenant Improvements & Incentives | Tenant Improvements & Incentives Per Sq. Ft. | |||||||||||||||||||||||||||||||||||||||||||||||||||||||||||||||
| Quarter | ||||||||||||||||||||||||||||||||||||||||||||||||||||||||||||||||||||
| 3rd Quarter 2025 | 20 | 181,455 | $56.01 | 4.9 | $ | 5,659,281 | $31.19 | |||||||||||||||||||||||||||||||||||||||||||||||||||||||||||||
| 2nd Quarter 2025 | 20 | 102,290 | $37.39 | 6.7 | $ | 4,057,470 | $39.67 | |||||||||||||||||||||||||||||||||||||||||||||||||||||||||||||
| 1st Quarter 2025 | 19 | 139,616 | $47.79 | 8.2 | $ | 12,173,819 | $87.20 | |||||||||||||||||||||||||||||||||||||||||||||||||||||||||||||
| 4th Quarter 2024 | 17 | 72,113 | $52.76 | 3.4 | $ | 1,499,704 | $20.80 | |||||||||||||||||||||||||||||||||||||||||||||||||||||||||||||
| Total 12 months | 76 | 495,474 | $49.38 | 6.0 | $ | 23,390,274 | $47.21 | |||||||||||||||||||||||||||||||||||||||||||||||||||||||||||||
| Third Quarter 2025 Supplemental Information | Page 27 | ||||
| RETAIL LEASING SUMMARY | | ||||
| As of September 30, 2025 | ||||||||||||||||||||||||||||||||||||||||||||||||||||||||||||||||||||
Total Lease Summary - Comparable (1)(7) | ||||||||||||||||||||||||||||||||||||||||||||||||||||||||||||||||||||
| Number of Leases Signed | % of Comparable Leases Signed | Net Rentable Square Feet Signed | Contractual Rent Per Sq. Ft. (2) | Prior Rent Per Sq. Ft. (3) | Annual Change in Rent | Cash Basis % Change Over Prior Rent | Straight-Line Basis % Change Over Prior Rent | Weighted Average Lease Term (4) | Tenant Improvements & Incentives | Tenant Improvements & Incentives Per Sq. Ft. | ||||||||||||||||||||||||||||||||||||||||||||||||||||||||||
| Quarter | ||||||||||||||||||||||||||||||||||||||||||||||||||||||||||||||||||||
| 3rd Quarter 2025 | 23 | 100% | 111,903 | $38.72 | $37.08 | $ | 183,733 | 4.4 | % | 21.0 | % | 4.9 | $ | 774,250 | $6.92 | |||||||||||||||||||||||||||||||||||||||||||||||||||||
| 2nd Quarter 2025 | 30 | 100% | 213,073 | $31.59 | $29.41 | $ | 465,410 | 7.4 | % | 21.9 | % | 5.8 | $ | 911,860 | $4.28 | |||||||||||||||||||||||||||||||||||||||||||||||||||||
| 1st Quarter 2025 | 15 | 100% | 155,944 | $22.89 | $20.21 | $ | 417,748 | 13.3 | % | 21.0 | % | 4.6 | $ | 2,010,000 | $12.89 | |||||||||||||||||||||||||||||||||||||||||||||||||||||
| 4th Quarter 2024 | 18 | 100% | 99,604 | $35.71 | $33.51 | $ | 218,612 | 6.5 | % | 30.8 | % | 6.5 | $ | 604,031 | $6.06 | |||||||||||||||||||||||||||||||||||||||||||||||||||||
| Total 12 months | 86 | 100% | 580,524 | $31.33 | $29.12 | $ | 1,285,503 | 7.6 | % | 23.5 | % | 5.4 | $ | 4,300,141 | $7.41 | |||||||||||||||||||||||||||||||||||||||||||||||||||||
New Lease Summary - Comparable (1) | ||||||||||||||||||||||||||||||||||||||||||||||||||||||||||||||||||||
| Number of Leases Signed | % of Comparable Leases Signed | Net Rentable Square Feet Signed | Contractual Rent Per Sq. Ft. (2) | Prior Rent Per Sq. Ft. (3) | Annual Change in Rent | Cash Basis % Change Over Prior Rent | Straight-Line Basis % Change Over Prior Rent | Weighted Average Lease Term (4) | Tenant Improvements & Incentives | Tenant Improvements & Incentives Per Sq. Ft. | ||||||||||||||||||||||||||||||||||||||||||||||||||||||||||
| Quarter | ||||||||||||||||||||||||||||||||||||||||||||||||||||||||||||||||||||
| 3rd Quarter 2025 | 1 | 4% | 2,000 | $60.00 | $64.51 | $ | (9,016) | (7.0) | % | — | % | 10.0 | $ | 235,000 | $117.50 | |||||||||||||||||||||||||||||||||||||||||||||||||||||
| 2nd Quarter 2025 | 3 | 10% | 20,654 | $25.83 | $24.17 | $ | 34,392 | 6.9 | % | 263.2 | % | (6) | 10.5 | $ | 691,500 | $33.48 | ||||||||||||||||||||||||||||||||||||||||||||||||||||
| 1st Quarter 2025 | — | —% | — | — | — | — | — | % | — | % | — | — | — | |||||||||||||||||||||||||||||||||||||||||||||||||||||||
| 4th Quarter 2024 | 3 | 17% | 2,942 | $117.65 | $112.20 | $ | 16,007 | 4.8 | % | 307.3 | % | (6) | 5.0 | $ | 84,031 | $28.56 | ||||||||||||||||||||||||||||||||||||||||||||||||||||
| Total 12 months | 7 | 8% | 25,596 | $39.05 | $37.44 | $ | 41,383 | 4.3 | % | 336.4 | % | (6) | 9.8 | $ | 1,010,531 | $39.48 | ||||||||||||||||||||||||||||||||||||||||||||||||||||
Renewal Lease Summary - Comparable (1)(5)(7) | ||||||||||||||||||||||||||||||||||||||||||||||||||||||||||||||||||||
| Number of Leases Signed | % of Comparable Leases Signed | Net Rentable Square Feet Signed | Contractual Rent Per Sq. Ft. (2) | Prior Rent Per Sq. Ft. (3) | Annual Change in Rent | Cash Basis % Change Over Prior Rent | Straight-Line Basis % Change Over Prior Rent | Weighted Average Lease Term (4) | Tenant Improvements & Incentives | Tenant Improvements & Incentives Per Sq. Ft. | ||||||||||||||||||||||||||||||||||||||||||||||||||||||||||
| Quarter | ||||||||||||||||||||||||||||||||||||||||||||||||||||||||||||||||||||
| 3rd Quarter 2025 | 22 | 96% | 109,903 | $38.33 | $36.58 | $ | 192,749 | 4.8 | % | 15.4 | % | 4.8 | $ | 539,250 | $4.91 | |||||||||||||||||||||||||||||||||||||||||||||||||||||
| 2nd Quarter 2025 | 27 | 90% | 192,419 | $32.21 | $29.97 | $ | 431,018 | 7.5 | % | 13.7 | % | 5.3 | $ | 220,360 | $1.15 | |||||||||||||||||||||||||||||||||||||||||||||||||||||
| 1st Quarter 2025 | 15 | 100% | 155,944 | $22.89 | $20.21 | $ | 417,748 | 13.3 | % | 21.0 | % | 4.6 | $ | 2,010,000 | $12.89 | |||||||||||||||||||||||||||||||||||||||||||||||||||||
| 4th Quarter 2024 | 15 | 83% | 96,662 | $33.21 | $31.12 | $ | 202,605 | 6.7 | % | 20.8 | % | 6.5 | $ | 520,000 | $5.38 | |||||||||||||||||||||||||||||||||||||||||||||||||||||
| Total 12 months | 79 | 92% | 554,928 | $30.98 | $28.74 | $ | 1,244,120 | 7.8 | % | 16.9 | % | 5.2 | $ | 3,289,610 | $5.93 | |||||||||||||||||||||||||||||||||||||||||||||||||||||
Total Lease Summary - Comparable and Non-Comparable (1)(7) | ||||||||||||||||||||||||||||||||||||||||||||||||||||||||||||||||||||
| Number of Leases Signed | Net Rentable Square Feet Signed | Contractual Rent Per Sq. Ft. (2) | Weighted Average Lease Term (4) | Tenant Improvements & Incentives | Tenant Improvements & Incentives Per Sq. Ft. | |||||||||||||||||||||||||||||||||||||||||||||||||||||||||||||||
| Quarter | ||||||||||||||||||||||||||||||||||||||||||||||||||||||||||||||||||||
| 3rd Quarter 2025 | 29 | 125,022 | $40.40 | 4.9 | $ | 1,466,951 | $11.73 | |||||||||||||||||||||||||||||||||||||||||||||||||||||||||||||
| 2nd Quarter 2025 | 32 | 220,247 | $32.40 | 5.9 | $ | 1,443,860 | $6.56 | |||||||||||||||||||||||||||||||||||||||||||||||||||||||||||||
| 1st Quarter 2025 | 16 | 157,644 | $23.24 | 4.6 | $ | 2,095,000 | $13.29 | |||||||||||||||||||||||||||||||||||||||||||||||||||||||||||||
| 4th Quarter 2024 | 23 | 117,333 | $35.82 | 6.9 | $ | 2,754,892 | $23.48 | |||||||||||||||||||||||||||||||||||||||||||||||||||||||||||||
| Total 12 months | 100 | 620,246 | $32.33 | 5.6 | $ | 7,760,703 | $12.51 | |||||||||||||||||||||||||||||||||||||||||||||||||||||||||||||
| Third Quarter 2025 Supplemental Information | Page 28 | ||||
| MULTIFAMILY LEASING SUMMARY | | ||||
| As of September 30, 2025 | ||||||||||||||||||||||||||
| Lease Summary - Loma Palisades | ||||||||||||||||||||||||||
Number of Leased Units (1) | Percentage leased (1) | Annualized Base Rent (2) | Average Monthly Base Rent per Leased Unit (3) | |||||||||||||||||||||||
| Quarter | ||||||||||||||||||||||||||
| 3rd Quarter 2025 | 500 | 91.2% | $17,579,544 | $2,931 | ||||||||||||||||||||||
| 2nd Quarter 2025 | 505 | 92.2% | $17,530,764 | $2,891 | ||||||||||||||||||||||
| 1st Quarter 2025 | 505 | 92.2% | $17,809,548 | $2,937 | ||||||||||||||||||||||
| 4th Quarter 2024 | 526 | 96.0% | $17,699,328 | $2,804 | ||||||||||||||||||||||
| Lease Summary - Imperial Beach Gardens | ||||||||||||||||||||||||||
Number of Leased Units (1) | Percentage leased (1) | Annualized Base Rent (2) | Average Monthly Base Rent per Leased Unit (3) | |||||||||||||||||||||||
| Quarter | ||||||||||||||||||||||||||
| 3rd Quarter 2025 | 143 | 89.4% | $4,698,804 | $2,737 | ||||||||||||||||||||||
| 2nd Quarter 2025 | 142 | 88.8% | $4,841,556 | $2,840 | ||||||||||||||||||||||
| 1st Quarter 2025 | 149 | 93.1% | $4,931,352 | $2,759 | ||||||||||||||||||||||
| 4th Quarter 2024 | 149 | 93.1% | $4,926,204 | $2,756 | ||||||||||||||||||||||
| Lease Summary - Mariner's Point | ||||||||||||||||||||||||||
Number of Leased Units (1) | Percentage leased (1) | Annualized Base Rent (2) | Average Monthly Base Rent per Leased Unit (3) | |||||||||||||||||||||||
| Quarter | ||||||||||||||||||||||||||
| 3rd Quarter 2025 | 81 | 92.1% | $2,320,500 | $2,386 | ||||||||||||||||||||||
| 2nd Quarter 2025 | 78 | 88.6% | $2,439,192 | $2,607 | ||||||||||||||||||||||
| 1st Quarter 2025 | 79 | 89.8% | $2,291,508 | $2,416 | ||||||||||||||||||||||
| 4th Quarter 2024 | 83 | 94.3% | $2,393,256 | $2,403 | ||||||||||||||||||||||
| Lease Summary - Santa Fe Park RV Resort | ||||||||||||||||||||||||||
Number of Leased Units (1) | Percentage leased (1) | Annualized Base Rent (2) | Average Monthly Base Rent per Leased Unit (3) | |||||||||||||||||||||||
| Quarter | ||||||||||||||||||||||||||
| 3rd Quarter 2025 | 72 | 58.1% | $1,586,304 | $1,835 | ||||||||||||||||||||||
| 2nd Quarter 2025 | 95 | 76.6% | $2,229,156 | $1,956 | ||||||||||||||||||||||
| 1st Quarter 2025 | 80 | 64.5% | $1,507,464 | $1,571 | ||||||||||||||||||||||
| 4th Quarter 2024 | 87 | 70.2% | $1,646,532 | $1,576 | ||||||||||||||||||||||
| Lease Summary - Pacific Ridge Apartments | ||||||||||||||||||||||||||
Number of Leased Units (1) | Percentage leased (1) | Annualized Base Rent (2) | Average Monthly Base Rent per Leased Unit (3) | |||||||||||||||||||||||
| Quarter | ||||||||||||||||||||||||||
| 3rd Quarter 2025 | 491 | 92.1% | $24,734,688 | $4,199 | ||||||||||||||||||||||
| 2nd Quarter 2025 | 443 | 83.1% | $22,982,460 | $4,324 | ||||||||||||||||||||||
| 1st Quarter 2025 | 505 | 94.7% | $24,984,036 | $4,125 | ||||||||||||||||||||||
| 4th Quarter 2024 | 517 | 97.0% | $24,201,228 | $3,901 | ||||||||||||||||||||||
| Lease Summary - Genesee Park | ||||||||||||||||||||||||||
Number of Leased Units (1) | Percentage leased (1) | Annualized Base Rent (2) | Average Monthly Base Rent per Leased Unit (3) | |||||||||||||||||||||||
| Quarter | ||||||||||||||||||||||||||
| 3rd Quarter 2025 | 187 | 97.4% | $4,899,912 | $2,183 | ||||||||||||||||||||||
| 2nd Quarter 2025 | 183 | 95.3% | $4,753,440 | $2,165 | ||||||||||||||||||||||
| 1st Quarter 2025 | 178 | 92.7% | $4,132,356 | $1,935 | ||||||||||||||||||||||
| Third Quarter 2025 Supplemental Information | Page 29 | ||||
| MULTIFAMILY LEASING SUMMARY (CONTINUED) | | ||||
| As of September 30, 2025 | ||||||||||||||||||||||||||
Lease Summary - Hassalo on Eighth - Multifamily (4) | ||||||||||||||||||||||||||
Number of Leased Units (1) | Percentage leased (1) | Annualized Base Rent (2) | Average Monthly Base Rent per Leased Unit (3) | |||||||||||||||||||||||
| Quarter | ||||||||||||||||||||||||||
| 3rd Quarter 2025 | 590 | 89.8% | $11,823,060 | $1,670 | ||||||||||||||||||||||
| 2nd Quarter 2025 | 582 | 88.6% | $11,706,456 | $1,676 | ||||||||||||||||||||||
| 1st Quarter 2025 | 575 | 87.5% | $11,444,760 | $1,659 | ||||||||||||||||||||||
| 4th Quarter 2024 | 574 | 87.4% | $11,496,168 | $1,668 | ||||||||||||||||||||||
| Total Multifamily Lease Summary | ||||||||||||||||||||||||||
Number of Leased Units (1) | Percentage leased (1) | Annualized Base Rent (2) | Average Monthly Base Rent per Leased Unit (3) | |||||||||||||||||||||||
| Quarter | ||||||||||||||||||||||||||
| 3rd Quarter 2025 | 2,064 | 89.7% | $67,642,812 | $2,730 | ||||||||||||||||||||||
| 2nd Quarter 2025 | 2,028 | 88.1% | $66,483,024 | $2,732 | ||||||||||||||||||||||
| 1st Quarter 2025 | 2,071 | 90.0% | $67,101,024 | $2,699 | ||||||||||||||||||||||
| 4th Quarter 2024 | 1,936 | 91.8% | $62,362,716 | $2,683 | ||||||||||||||||||||||
| Third Quarter 2025 Supplemental Information | Page 30 | ||||
| MIXED-USE LEASING SUMMARY | | ||||
| As of September 30, 2025 | ||||||||||||||||||||||||||
| Lease Summary - Retail Portion | ||||||||||||||||||||||||||
| Number of Leased Square Feet | Percentage leased (1) | Annualized Base Rent (2) | Annualized Base Rent per Leased Square Foot (3) | |||||||||||||||||||||||
| Quarter | ||||||||||||||||||||||||||
| 3rd Quarter 2025 | 89,204 | 95.0% | $9,882,053 | $111 | ||||||||||||||||||||||
| 2nd Quarter 2025 | 89,204 | 95.0% | $9,807,163 | $110 | ||||||||||||||||||||||
| 1st Quarter 2025 | 83,911 | 89.3% | $9,771,216 | $116 | ||||||||||||||||||||||
| 4th Quarter 2024 | 85,024 | 90.5% | $10,004,777 | $118 | ||||||||||||||||||||||
| Lease Summary - Hotel Portion | ||||||||||||||||||||||||||
| Number of Leased Units | Average Occupancy (4) | Average Daily Rate (4) | Annualized Revenue per Available Room (4) | |||||||||||||||||||||||
| Quarter | ||||||||||||||||||||||||||
| 3rd Quarter 2025 | 289 | 78.3% | $381 | $298 | ||||||||||||||||||||||
| 2nd Quarter 2025 | 317 | 86.0% | $355 | $305 | ||||||||||||||||||||||
| 1st Quarter 2025 | 312 | 84.6% | $353 | $298 | ||||||||||||||||||||||
| 4th Quarter 2024 | 308 | 83.6% | $360 | $301 | ||||||||||||||||||||||
| Third Quarter 2025 Supplemental Information | Page 31 | ||||
| LEASE EXPIRATIONS | | ||||
| As of September 30, 2025 | ||||||||||||||||||||||||||||||||||||||||||||||||||||||||||||||||||||||||||||||||||||||||||||
| Assumes no exercise of lease options | ||||||||||||||||||||||||||||||||||||||||||||||||||||||||||||||||||||||||||||||||||||||||||||
| Office | Retail | Mixed-Use (Retail Portion Only) | Total | |||||||||||||||||||||||||||||||||||||||||||||||||||||||||||||||||||||||||||||||||||||||||
| % of | % of | Annualized | % of | % of | Annualized | % of | % of | Annualized | % of | Annualized | ||||||||||||||||||||||||||||||||||||||||||||||||||||||||||||||||||||||||||||||||||
| Expiring | Office | Total | Base Rent | Expiring | Retail | Total | Base Rent | Expiring | Mixed-Use | Total | Base Rent | Expiring | Total | Base Rent | ||||||||||||||||||||||||||||||||||||||||||||||||||||||||||||||||||||||||||||||
| Year | Sq. Ft. | Sq. Ft. | Sq. Ft. | Per Sq. Ft.(1) | Sq. Ft. | Sq. Ft. | Sq. Ft. | Per Sq. Ft.(1) | Sq. Ft. | Sq. Ft. | Sq. Ft. | Per Sq. Ft.(1) | Sq. Ft. | Sq. Ft. | Per Sq. Ft.(1) | |||||||||||||||||||||||||||||||||||||||||||||||||||||||||||||||||||||||||||||
| Month to Month | 80,420 | 1.9 | % | 1.2 | % | $0.69 | 12,150 | 0.5 | % | 0.2 | % | $49.01 | 2,770 | 2.9 | % | — | % | $10.05 | 95,340 | 1.4 | % | $7.12 | ||||||||||||||||||||||||||||||||||||||||||||||||||||||||||||||||||||||
| 2025 | 87,546 | 2.0 | 1.3 | 44.06 | 21,228 | 0.9 | 0.3 | 36.76 | 1,538 | 1.6 | — | 207.34 | 110,312 | 1.6 | 44.93 | |||||||||||||||||||||||||||||||||||||||||||||||||||||||||||||||||||||||||||||
| 2026 | 344,008 | 8.0 | 5.1 | 46.11 | 118,146 | 4.9 | 1.7 | 43.82 | 6,808 | 7.2 | 0.1 | 170.51 | 468,962 | 6.9 | 47.34 | |||||||||||||||||||||||||||||||||||||||||||||||||||||||||||||||||||||||||||||
| 2027 | 412,884 | 9.6 | 6.1 | 57.39 | 320,768 | 13.3 | 4.7 | 33.00 | 5,528 | 5.9 | 0.1 | 176.26 | 739,180 | 10.9 | 47.69 | |||||||||||||||||||||||||||||||||||||||||||||||||||||||||||||||||||||||||||||
| 2028 | 565,721 | 13.2 | 8.3 | 58.49 | 519,129 | 21.4 | 7.6 | 24.64 | 20,401 | 21.7 | 0.3 | 108.21 | 1,105,251 | 16.3 | 43.51 | |||||||||||||||||||||||||||||||||||||||||||||||||||||||||||||||||||||||||||||
| 2029 | 879,995 | 20.5 | 12.9 | 67.02 | 326,150 | 13.5 | 4.8 | 31.67 | 12,746 | 13.6 | 0.2 | 139.54 | 1,218,891 | 17.9 | 58.32 | |||||||||||||||||||||||||||||||||||||||||||||||||||||||||||||||||||||||||||||
| 2030 | 323,294 | 7.5 | 4.8 | 43.28 | 178,362 | 7.4 | 2.6 | 37.04 | 17,384 | 18.5 | 0.3 | 82.19 | 519,040 | 7.6 | 42.44 | |||||||||||||||||||||||||||||||||||||||||||||||||||||||||||||||||||||||||||||
| 2031 | 195,221 | 4.6 | 2.9 | 47.77 | 207,112 | 8.6 | 3.0 | 30.28 | 14,965 | 15.9 | 0.2 | 118.98 | 417,298 | 6.1 | 41.64 | |||||||||||||||||||||||||||||||||||||||||||||||||||||||||||||||||||||||||||||
| 2032 | 77,695 | 1.8 | 1.1 | 54.58 | 130,509 | 5.4 | 1.9 | 29.75 | — | — | — | — | 208,204 | 3.1 | 39.02 | |||||||||||||||||||||||||||||||||||||||||||||||||||||||||||||||||||||||||||||
| 2033 | 80,916 | 1.9 | 1.2 | 55.91 | 159,643 | 6.6 | 2.3 | 24.19 | — | — | — | — | 240,559 | 3.5 | 34.86 | |||||||||||||||||||||||||||||||||||||||||||||||||||||||||||||||||||||||||||||
| 2034 | 130,897 | 3.1 | 1.9 | 62.22 | 119,699 | 4.9 | 1.8 | 27.12 | 973 | 1.0 | — | 210.12 | 251,569 | 3.7 | 46.09 | |||||||||||||||||||||||||||||||||||||||||||||||||||||||||||||||||||||||||||||
| Thereafter | 168,376 | 3.9 | 2.5 | 40.79 | 247,708 | 10.2 | 3.6 | 23.97 | — | — | — | — | 416,084 | 6.1 | 30.78 | |||||||||||||||||||||||||||||||||||||||||||||||||||||||||||||||||||||||||||||
| Signed Leases Not Commenced | 159,446 | 3.7 | 2.3 | — | 9,897 | 0.4 | 0.1 | — | 6,091 | 6.5 | 0.1 | — | 175,434 | 2.6 | — | |||||||||||||||||||||||||||||||||||||||||||||||||||||||||||||||||||||||||||||
| Available | 777,188 | 18.1 | 11.4 | — | 49,746 | 2.1 | 0.7 | — | 4,721 | 5.0 | 0.1 | — | 831,655 | 12.2 | — | |||||||||||||||||||||||||||||||||||||||||||||||||||||||||||||||||||||||||||||
Total (2) | 4,283,607 | 100.0 | % | 63.0 | % | $42.63 | 2,420,247 | 100.0 | % | 35.6 | % | $28.95 | 93,925 | 100.0 | % | 1.4 | % | $105.21 | 6,797,779 | 100.0 | % | $38.62 | ||||||||||||||||||||||||||||||||||||||||||||||||||||||||||||||||||||||
| Assumes all lease options are exercised | ||||||||||||||||||||||||||||||||||||||||||||||||||||||||||||||||||||||||||||||||||||||||||||
| Office | Retail | Mixed-Use (Retail Portion Only) | Total | |||||||||||||||||||||||||||||||||||||||||||||||||||||||||||||||||||||||||||||||||||||||||
| % of | % of | Annualized | % of | % of | Annualized | % of | % of | Annualized | % of | Annualized | ||||||||||||||||||||||||||||||||||||||||||||||||||||||||||||||||||||||||||||||||||
| Expiring | Office | Total | Base Rent | Expiring | Retail | Total | Base Rent | Expiring | Mixed-Use | Total | Base Rent | Expiring | Total | Base Rent | ||||||||||||||||||||||||||||||||||||||||||||||||||||||||||||||||||||||||||||||
| Year | Sq. Ft. | Sq. Ft. | Sq. Ft. | Per Sq. Ft.(1) | Sq. Ft. | Sq. Ft. | Sq. Ft. | Per Sq. Ft.(1) | Sq. Ft. | Sq. Ft. | Sq. Ft. | Per Sq. Ft.(1) | Sq. Ft. | Sq. Ft. | Per Sq. Ft.(1) | |||||||||||||||||||||||||||||||||||||||||||||||||||||||||||||||||||||||||||||
| Month to Month | 80,420 | 1.9 | % | 1.2 | % | $0.69 | 12,150 | 0.5 | % | 0.2 | % | $49.01 | 2,770 | 2.9 | % | — | % | $10.05 | 95,340 | 1.4 | % | $7.12 | ||||||||||||||||||||||||||||||||||||||||||||||||||||||||||||||||||||||
| 2025 | 66,572 | 1.6 | 1.0 | 43.40 | 18,400 | 0.8 | 0.3 | 32.63 | 1,538 | 1.6 | — | 207.34 | 86,510 | 1.3 | 44.02 | |||||||||||||||||||||||||||||||||||||||||||||||||||||||||||||||||||||||||||||
| 2026 | 96,448 | 2.3 | 1.4 | 42.47 | 50,195 | 2.1 | 0.7 | 43.62 | 3,767 | 4.0 | 0.1 | 166.92 | 150,410 | 2.2 | 45.97 | |||||||||||||||||||||||||||||||||||||||||||||||||||||||||||||||||||||||||||||
| 2027 | 112,804 | 2.6 | 1.7 | 50.91 | 77,399 | 3.2 | 1.1 | 41.33 | 3,203 | 3.4 | — | 184.36 | 193,406 | 2.8 | 49.29 | |||||||||||||||||||||||||||||||||||||||||||||||||||||||||||||||||||||||||||||
| 2028 | 119,440 | 2.8 | 1.8 | 51.70 | 136,158 | 5.6 | 2.0 | 27.55 | 13,487 | 14.4 | 0.2 | 81.62 | 269,085 | 4.0 | 40.98 | |||||||||||||||||||||||||||||||||||||||||||||||||||||||||||||||||||||||||||||
| 2029 | 82,943 | 1.9 | 1.2 | 54.71 | 119,819 | 5.0 | 1.8 | 33.17 | 7,344 | 7.8 | 0.1 | 172.71 | 210,106 | 3.1 | 46.55 | |||||||||||||||||||||||||||||||||||||||||||||||||||||||||||||||||||||||||||||
| 2030 | 227,031 | 5.3 | 3.3 | 36.28 | 128,992 | 5.3 | 1.9 | 34.18 | 4,710 | 5.0 | 0.1 | 127.11 | 360,733 | 5.3 | 36.72 | |||||||||||||||||||||||||||||||||||||||||||||||||||||||||||||||||||||||||||||
| 2031 | 219,329 | 5.1 | 3.2 | 53.16 | 59,145 | 2.4 | 0.9 | 52.54 | 18,006 | 19.2 | 0.3 | 128.44 | 296,480 | 4.4 | 57.61 | |||||||||||||||||||||||||||||||||||||||||||||||||||||||||||||||||||||||||||||
| 2032 | 308,149 | 7.2 | 4.5 | 54.04 | 161,960 | 6.7 | 2.4 | 31.11 | 911 | 1.0 | — | 96.00 | 471,020 | 6.9 | 46.24 | |||||||||||||||||||||||||||||||||||||||||||||||||||||||||||||||||||||||||||||
| 2033 | 324,609 | 7.6 | 4.8 | 63.44 | 82,190 | 3.4 | 1.2 | 34.82 | 6,914 | 7.4 | 0.1 | 160.09 | 413,713 | 6.1 | 59.37 | |||||||||||||||||||||||||||||||||||||||||||||||||||||||||||||||||||||||||||||
| 2034 | 114,766 | 2.7 | 1.7 | 52.66 | 226,708 | 9.4 | 3.3 | 30.30 | 5,402 | 5.8 | 0.1 | 94.45 | 346,876 | 5.1 | 38.70 | |||||||||||||||||||||||||||||||||||||||||||||||||||||||||||||||||||||||||||||
| Thereafter | 1,594,462 | 37.2 | 23.5 | 60.17 | 1,287,488 | 53.2 | 18.9 | 26.00 | 15,061 | 16.0 | 0.2 | 88.37 | 2,897,011 | 42.6 | 45.13 | |||||||||||||||||||||||||||||||||||||||||||||||||||||||||||||||||||||||||||||
| Signed Leases Not Commenced | 159,446 | 3.7 | 2.3 | — | 9,897 | 0.4 | 0.1 | — | 6,091 | 6.5 | 0.1 | — | 175,434 | 2.6 | — | |||||||||||||||||||||||||||||||||||||||||||||||||||||||||||||||||||||||||||||
| Available | 777,188 | 18.1 | 11.4 | — | 49,746 | 2.1 | 0.7 | — | 4,721 | 5.0 | 0.1 | — | 831,655 | 12.2 | — | |||||||||||||||||||||||||||||||||||||||||||||||||||||||||||||||||||||||||||||
Total (2) | 4,283,607 | 100.0 | % | 63.0 | % | $42.63 | 2,420,247 | 100.0 | % | 35.6 | % | $28.95 | 93,925 | 100.0 | % | 1.4 | % | $105.21 | 6,797,779 | 100.0 | % | $38.62 | ||||||||||||||||||||||||||||||||||||||||||||||||||||||||||||||||||||||
| Third Quarter 2025 Supplemental Information | Page 32 | ||||
| LEASE EXPIRATIONS (CONTINUED) | | ||||
| As of September 30, 2025 | |||||||||||
| Third Quarter 2025 Supplemental Information | Page 33 | ||||
| PORTFOLIO LEASED STATISTICS | | ||||
| At September 30, 2025 | At September 30, 2024 | |||||||||||||||||||||||||||||||||||||
| Type | Size | Leased (1) | Leased % | Size | Leased (1) | Leased % | ||||||||||||||||||||||||||||||||
Overall Portfolio(2) Statistics | ||||||||||||||||||||||||||||||||||||||
Office Properties (square feet) | 4,283,607 | 3,506,419 | 81.9 | % | 4,058,523 | 3,531,399 | 87.0 | % | ||||||||||||||||||||||||||||||
| Retail Properties (square feet) | 2,420,247 | (4) | 2,370,501 | 97.9 | % | 3,092,616 | 2,921,259 | 94.5 | % | |||||||||||||||||||||||||||||
| Multifamily Properties (units) | 2,302 | 2,064 | 89.7 | % | 2,110 | 1,906 | 90.3 | % | ||||||||||||||||||||||||||||||
| Mixed-Use Properties (square feet) | 93,925 | 89,204 | 95.0 | % | 93,925 | 90,406 | 96.3 | % | ||||||||||||||||||||||||||||||
Mixed-Use Properties (units) (3) | 369 | 306 | 82.9 | % | 369 | 320 | 86.7 | % | ||||||||||||||||||||||||||||||
Same-Store(2) (5) Statistics | ||||||||||||||||||||||||||||||||||||||
| Office Properties (square feet) | 3,977,106 | 3,452,420 | 86.8 | % | 3,958,253 | 3,531,399 | 89.2 | % | ||||||||||||||||||||||||||||||
| Retail Properties (square feet) | 2,420,247 | 2,370,501 | 97.9 | % | 2,419,461 | 2,366,017 | 97.8 | % | ||||||||||||||||||||||||||||||
| Multifamily Properties (units) | 2,110 | 1,877 | 89.0 | % | 2,110 | 1,906 | 90.3 | % | ||||||||||||||||||||||||||||||
| Mixed-Use Properties (square feet) | 93,925 | 89,204 | 95.0 | % | 93,925 | 90,406 | 96.3 | % | ||||||||||||||||||||||||||||||
Mixed-Use Properties (units) (3) | 369 | 306 | 82.9 | % | 369 | 320 | 86.7 | % | ||||||||||||||||||||||||||||||
| Third Quarter 2025 Supplemental Information | Page 34 | ||||
| TOP TENANTS - OFFICE | | ||||
| As of September 30, 2025 | |||||||||||||||||||||||||||||||||||||||||||||||||||||
| Tenant | Property | Lease Expiration | Total Leased Square Feet | Rentable Square Feet as a Percentage of Total Office | Rentable Square Feet as a Percentage of Total | Annualized Base Rent | Annualized Base Rent as a Percentage of Total Office | Annualized Base Rent as a Percentage of Total | |||||||||||||||||||||||||||||||||||||||||||||
| 1 | Google LLC | The Landmark at One Market | 12/31/2029 | 253,198 | 5.9 | % | 3.7 | % | $ | 27,659,898 | 13.9 | % | 9.9 | % | |||||||||||||||||||||||||||||||||||||||
| 2 | LPL Holdings, Inc. | La Jolla Commons | 4/30/2029 | 421,001 | 9.8 | 6.2 | 21,048,719 | 10.6 | 7.6 | ||||||||||||||||||||||||||||||||||||||||||||
| 3 | Autodesk, Inc. (1) | The Landmark at One Market | 12/31/2027 12/31/2028 | 138,615 | 3.2 | 2.0 | 13,730,889 | 6.9 | 4.9 | ||||||||||||||||||||||||||||||||||||||||||||
| 4 | Smartsheet, Inc. (2) | City Center Bellevue | 12/31/2026 4/30/2029 | 123,041 | 2.9 | 1.8 | 7,247,973 | 3.7 | 2.6 | ||||||||||||||||||||||||||||||||||||||||||||
| 5 | Illumina, Inc. | La Jolla Commons | 10/31/2027 | 73,176 | 1.7 | 1.1 | 5,110,316 | 2.6 | 1.8 | ||||||||||||||||||||||||||||||||||||||||||||
| 6 | Databricks, Inc. (3) | City Center Bellevue | 11/30/2027 1/31/2028 3/31/2028 10/31/2028 | 69,104 | 1.6 | 1.0 | 4,132,308 | 2.1 | 1.5 | ||||||||||||||||||||||||||||||||||||||||||||
| 7 | Industrious (4) | City Center Bellevue La Jolla Commons | 4/30/2033 3/31/2034 7/31/2035 | 75,749 | 1.8 | 1.1 | 3,916,237 | 2.0 | 1.4 | ||||||||||||||||||||||||||||||||||||||||||||
| 8 | VMware, Inc. (5) | City Center Bellevue | 1/31/2026 3/31/2028 | 55,683 | 1.3 | 0.8 | 3,635,757 | 1.8 | 1.3 | ||||||||||||||||||||||||||||||||||||||||||||
| 9 | State of Oregon: Department of Environmental Quality | Lloyd Portfolio | 10/31/2031 | 87,787 | 2.0 | 1.3 | 3,113,766 | 1.6 | 1.1 | ||||||||||||||||||||||||||||||||||||||||||||
| 10 | Top technology tenant (6) | La Jolla Commons | 8/31/2030 | 40,800 | 1.0 | 0.6 | 2,674,996 | 1.3 | 1.0 | ||||||||||||||||||||||||||||||||||||||||||||
| Top 10 Office Tenants Total | 1,338,154 | 31.2 | % | 19.6 | % | $ | 92,270,859 | 46.5 | % | 33.1 | % | ||||||||||||||||||||||||||||||||||||||||||
| Third Quarter 2025 Supplemental Information | Page 35 | ||||
| TOP TENANTS - RETAIL | | ||||
| As of September 30, 2025 | |||||||||||||||||||||||||||||||||||||||||||||||||||||
| Tenant | Property(ies) | Lease Expiration | Total Leased Square Feet | Rentable Square Feet as a Percentage of Total Retail | Rentable Square Feet as a Percentage of Total | Annualized Base Rent | Annualized Base Rent as a Percentage of Total Retail | Annualized Base Rent as a Percentage of Total | |||||||||||||||||||||||||||||||||||||||||||||
| 1 | Lowe's | Waikele Center | 5/31/2028 | 155,000 | 6.4 | % | 2.3 | % | $ | 4,092,000 | 5.8 | % | 1.5 | % | |||||||||||||||||||||||||||||||||||||||
| 2 | Sprouts Farmers Market (1) | Solana Beach Towne Centre Geary Marketplace Carmel Mountain Plaza | 6/30/2029 9/30/2032 3/31/2035 | 71,431 | 3.0 | 1.1 | 2,248,554 | 3.2 | 0.8 | ||||||||||||||||||||||||||||||||||||||||||||
| 3 | Marshalls (2) | Carmel Mountain Plaza Solana Beach Towne Centre | 1/31/2029 1/31/2035 | 68,055 | 2.8 | 1.0 | 1,901,151 | 2.7 | 0.7 | ||||||||||||||||||||||||||||||||||||||||||||
| 4 | Nordstrom Rack (3) | Carmel Mountain Plaza Alamo Quarry Market | 9/30/2027 10/31/2027 | 69,047 | 2.9 | 1.0 | 1,804,269 | 2.6 | 0.6 | ||||||||||||||||||||||||||||||||||||||||||||
| 5 | Vons | Lomas Santa Fe Plaza | 12/31/2027 | 49,895 | 2.1 | 0.7 | 1,609,086 | 2.3 | 0.6 | ||||||||||||||||||||||||||||||||||||||||||||
| 6 | Old Navy (4) | Alamo Quarry Market Southbay Marketplace Waikele Center | 9/30/2027 4/30/2028 7/31/2030 | 52,936 | 2.2 | 0.8 | 1,308,258 | 1.9 | 0.5 | ||||||||||||||||||||||||||||||||||||||||||||
| 7 | Sola Salons (5) | Solana Beach Towne Centre Hassalo on Eighth - Retail South Bay Marketplace Carmel Mountain Plaza Carmel Country Plaza | 11/30/2029 3/31/2031 6/30/2032 8/31/2034 3/31/2036 | 42,576 | 1.8 | 0.6 | 1,206,927 | 1.7 | 0.4 | ||||||||||||||||||||||||||||||||||||||||||||
| 8 | Safeway | Waikele Center | 1/31/2040 | 50,050 | 2.1 | 0.7 | 1,201,200 | 1.7 | 0.4 | ||||||||||||||||||||||||||||||||||||||||||||
| 9 | HomeGoods (6) | Lomas Santa Fe Plaza Alamo Quarry Market | 2/28/2030 8/31/2034 | 55,837 | 2.3 | 0.8 | 1,200,000 | 1.7 | 0.4 | ||||||||||||||||||||||||||||||||||||||||||||
| 10 | Hobby Lobby | Gateway Marketplace | 9/30/2036 | 64,900 | 2.7 | 1.0 | 1,172,885 | 1.7 | 0.4 | ||||||||||||||||||||||||||||||||||||||||||||
| Top 10 Retail Tenants Total | 679,727 | 28.3 | % | 10.0 | % | $ | 17,744,330 | 25.3 | % | 6.3 | % | ||||||||||||||||||||||||||||||||||||||||||
| Third Quarter 2025 Supplemental Information | Page 36 | ||||
| |||||
| Third Quarter 2025 Supplemental Information | Page 37 | ||||
| GLOSSARY OF TERMS | | ||||
| Three Months Ended | Nine Months Ended | ||||||||||||||||||||||
| September 30, | September 30, | ||||||||||||||||||||||
| 2025 | 2024 | 2025 | 2024 | ||||||||||||||||||||
| Net income | $ | 5,921 | $ | 21,318 | $ | 67,149 | $ | 61,235 | |||||||||||||||
| Depreciation and amortization | 32,014 | 33,529 | 95,290 | 94,757 | |||||||||||||||||||
| Interest expense, net | 19,773 | 18,229 | 58,337 | 50,773 | |||||||||||||||||||
| Interest income | (1,083) | (1,972) | (3,460) | (3,551) | |||||||||||||||||||
| Income tax expense | 156 | 235 | 691 | 696 | |||||||||||||||||||
| Gain on sale of real estate | — | — | (44,476) | — | |||||||||||||||||||
| EBITDA | $ | 56,781 | $ | 71,339 | $ | 173,531 | $ | 203,910 | |||||||||||||||
| Three Months Ended | Nine Months Ended | ||||||||||||||||||||||
| September 30, | September 30, | ||||||||||||||||||||||
| 2025 | 2024 | 2025 | 2024 | ||||||||||||||||||||
| EBITDA | $ | 56,781 | $ | 71,339 | $ | 173,531 | $ | 203,910 | |||||||||||||||
| Pro forma adjustments | — | — | — | — | |||||||||||||||||||
| Adjusted EBITDA | $ | 56,781 | $ | 71,339 | $ | 173,531 | $ | 203,910 | |||||||||||||||
| Three Months Ended | Nine Months Ended | ||||||||||||||||||||||
| September 30, | September 30, | ||||||||||||||||||||||
| 2025 | 2024 | 2025 | 2024 | ||||||||||||||||||||
| Net income | $ | 5,921 | $ | 21,318 | $ | 67,149 | $ | 61,235 | |||||||||||||||
| Depreciation and amortization | 32,014 | 33,529 | 95,290 | 94,757 | |||||||||||||||||||
| Interest expense, net | 19,773 | 18,229 | 58,337 | 50,773 | |||||||||||||||||||
| Interest income | (1,083) | (1,972) | (3,460) | (3,551) | |||||||||||||||||||
| Income tax expense | 156 | 235 | 691 | 696 | |||||||||||||||||||
| Gain on sale of real estate | — | — | (44,476) | — | |||||||||||||||||||
EBITDAre | $ | 56,781 | $ | 71,339 | $ | 173,531 | 203,910 | ||||||||||||||||
| Third Quarter 2025 Supplemental Information | Page 38 | ||||
| GLOSSARY OF TERMS (CONTINUED) | | ||||
| Three Months Ended | Nine Months Ended | ||||||||||||||||||||||
| September 30, | September 30, | ||||||||||||||||||||||
| Reconciliation of NOI to net income | 2025 | 2024 | 2025 | 2024 | |||||||||||||||||||
| Total NOI | $ | 66,281 | $ | 80,405 | $ | 201,193 | $ | 220,555 | |||||||||||||||
| General and administrative | (9,500) | (9,068) | (27,662) | (26,647) | |||||||||||||||||||
| Depreciation and amortization | (32,014) | (33,529) | (95,290) | (94,757) | |||||||||||||||||||
| Gain on sale of real estate | — | — | 44,476 | — | |||||||||||||||||||
| Operating Income | $ | 24,767 | $ | 37,808 | $ | 122,717 | $ | 99,151 | |||||||||||||||
| Interest expense, net | (19,773) | (18,229) | (58,337) | (50,773) | |||||||||||||||||||
| Other income, net | 927 | 1,739 | 2,769 | 12,857 | |||||||||||||||||||
| Net income | $ | 5,921 | $ | 21,318 | $ | 67,149 | $ | 61,235 | |||||||||||||||
| Net income attributable to restricted shares | (207) | (194) | (616) | (585) | |||||||||||||||||||
| Net income attributable to unitholders in the Operating Partnership | (1,205) | (4,467) | (14,033) | (12,829) | |||||||||||||||||||
| Net income attributable to American Assets Trust, Inc. stockholders | $ | 4,509 | $ | 16,657 | $ | 52,500 | $ | 47,821 | |||||||||||||||
| Third Quarter 2025 Supplemental Information | Page 39 | ||||
| GLOSSARY OF TERMS (CONTINUED) | | ||||
| Three Months Ended | Nine Months Ended | ||||||||||||||||||||||
| September 30, | September 30, | ||||||||||||||||||||||
| Reconciliation of Total Cash NOI to Net Income | 2025 | 2024 | 2025 | 2024 | |||||||||||||||||||
| Total Cash NOI | $ | 64,319 | $ | 67,423 | $ | 197,452 | $ | 203,129 | |||||||||||||||
| Lease termination fees and tenant improvement reimbursements | 2,303 | 11,924 | 3,396 | 12,272 | |||||||||||||||||||
Non-cash revenue and other operating expenses (1) | (341) | 1,058 | 345 | 5,154 | |||||||||||||||||||
| General and administrative | (9,500) | (9,068) | (27,662) | (26,647) | |||||||||||||||||||
| Depreciation and amortization | (32,014) | (33,529) | (95,290) | (94,757) | |||||||||||||||||||
| Gain on sale of real estate | — | — | 44,476 | — | |||||||||||||||||||
| Operating income | $ | 24,767 | $ | 37,808 | $ | 122,717 | $ | 99,151 | |||||||||||||||
| Interest expense, net | (19,773) | (18,229) | (58,337) | (50,773) | |||||||||||||||||||
| Other income, net | 927 | 1,739 | 2,769 | 12,857 | |||||||||||||||||||
| Net income | $ | 5,921 | $ | 21,318 | $ | 67,149 | $ | 61,235 | |||||||||||||||
| Third Quarter 2025 Supplemental Information | Page 40 | ||||
| GLOSSARY OF TERMS (CONTINUED) | | ||||
| Three Months Ended | Nine Months Ended | ||||||||||||||||||||||
| September 30, | September 30, | ||||||||||||||||||||||
| Reconciliation of Same-Store Cash NOI Comparison with Redevelopment to Operating Income | 2025 | 2024 | 2025 | 2024 | |||||||||||||||||||
Same-Store Cash NOI (1) | $ | 64,959 | $ | 65,510 | $ | 198,541 | $ | 197,286 | |||||||||||||||
Redevelopment Cash NOI (2) | (298) | (233) | (773) | (459) | |||||||||||||||||||
| Total Same-Store Cash NOI with Redevelopment | $ | 64,661 | $ | 65,277 | $ | 197,768 | $ | 196,827 | |||||||||||||||
| Non-Same Store Cash NOI | (342) | 2,146 | (316) | 6,302 | |||||||||||||||||||
| Total Cash NOI | $ | 64,319 | $ | 67,423 | $ | 197,452 | $ | 203,129 | |||||||||||||||
Lease termination fees and tenant improvement reimbursements (3) | 2,303 | 11,924 | 3,396 | 12,272 | |||||||||||||||||||
Non-cash revenue and other operating expenses (4) | (341) | 1,058 | 345 | 5,154 | |||||||||||||||||||
| General and administrative | (9,500) | (9,068) | (27,662) | (26,647) | |||||||||||||||||||
| Depreciation and amortization | (32,014) | (33,529) | (95,290) | (94,757) | |||||||||||||||||||
| Gain on sale of real estate | — | — | 44,476 | — | |||||||||||||||||||
| Operating income | $ | 24,767 | $ | 37,808 | $ | 122,717 | $ | 99,151 | |||||||||||||||
| Interest expense, net | (19,773) | (18,229) | (58,337) | (50,773) | |||||||||||||||||||
| Other income, net | 927 | 1,739 | 2,769 | 12,857 | |||||||||||||||||||
| Net income | $ | 5,921 | $ | 21,318 | $ | 67,149 | $ | 61,235 | |||||||||||||||
| Third Quarter 2025 Supplemental Information | Page 41 | ||||
| GLOSSARY OF TERMS (CONTINUED) | | ||||
| Comparison of Three Months Ended | Comparison of Nine Months Ended | ||||||||||||||||||||||||||||||||||
| September 30, 2025 to 2024 | September 30, 2025 to 2024 | ||||||||||||||||||||||||||||||||||
| Same-Store | Non Same-Store | Redevelopment Same-Store | Same-Store | Non Same-Store | Redevelopment Same-Store | ||||||||||||||||||||||||||||||
| Office Properties | |||||||||||||||||||||||||||||||||||
La Jolla Commons (1) | X | X | X | X | X | X | |||||||||||||||||||||||||||||
| Torrey Reserve Campus | X | X | X | X | |||||||||||||||||||||||||||||||
| Torrey Point | X | X | X | X | |||||||||||||||||||||||||||||||
| Solana Crossing (formerly Solana Beach Corporate Centre) | X | X | X | X | |||||||||||||||||||||||||||||||
| The Landmark at One Market | X | X | X | X | |||||||||||||||||||||||||||||||
| One Beach Street | X | X | X | X | |||||||||||||||||||||||||||||||
| First & Main | X | X | X | X | |||||||||||||||||||||||||||||||
| Lloyd Portfolio | X | X | X | X | |||||||||||||||||||||||||||||||
| City Center Bellevue | X | X | X | X | |||||||||||||||||||||||||||||||
| 14Acres (formerly known as Eastgate Office Park) | X | X | X | X | |||||||||||||||||||||||||||||||
| Timber Ridge (formerly known as Corporate Campus East III) | X | X | X | X | |||||||||||||||||||||||||||||||
| Timber Springs (formerly known as Bel-Spring 520) | X | X | X | X | |||||||||||||||||||||||||||||||
| Retail Properties | |||||||||||||||||||||||||||||||||||
| Carmel Country Plaza | X | X | X | X | |||||||||||||||||||||||||||||||
| Carmel Mountain Plaza | X | X | X | X | |||||||||||||||||||||||||||||||
| South Bay Marketplace | X | X | X | X | |||||||||||||||||||||||||||||||
| Gateway Marketplace | X | X | X | X | |||||||||||||||||||||||||||||||
| Lomas Santa Fe Plaza | X | X | X | X | |||||||||||||||||||||||||||||||
| Solana Beach Towne Centre | X | X | X | X | |||||||||||||||||||||||||||||||
| Geary Marketplace | X | X | X | X | |||||||||||||||||||||||||||||||
| The Shops at Kalakaua | X | X | X | X | |||||||||||||||||||||||||||||||
| Waikele Center | X | X | X | X | |||||||||||||||||||||||||||||||
| Alamo Quarry Market | X | X | X | X | |||||||||||||||||||||||||||||||
| Hassalo on Eighth - Retail | X | X | X | X | |||||||||||||||||||||||||||||||
| Multifamily Properties | |||||||||||||||||||||||||||||||||||
| Loma Palisades | X | X | X | X | |||||||||||||||||||||||||||||||
| Imperial Beach Gardens | X | X | X | X | |||||||||||||||||||||||||||||||
| Mariner's Point | X | X | X | X | |||||||||||||||||||||||||||||||
| Santa Fe Park RV Resort | X | X | X | X | |||||||||||||||||||||||||||||||
| Pacific Ridge Apartments | X | X | X | X | |||||||||||||||||||||||||||||||
| Genesee Park | X | X | |||||||||||||||||||||||||||||||||
| Hassalo on Eighth | X | X | X | X | |||||||||||||||||||||||||||||||
| Mixed-Use Properties | |||||||||||||||||||||||||||||||||||
| Waikiki Beach Walk - Retail | X | X | X | X | |||||||||||||||||||||||||||||||
| Waikiki Beach Walk - Embassy Suites™ | X | X | X | X | |||||||||||||||||||||||||||||||
| Development Properties | |||||||||||||||||||||||||||||||||||
| Solana Crossing - Land | X | X | |||||||||||||||||||||||||||||||||
| Lloyd Portfolio - Land | X | X | X | X | |||||||||||||||||||||||||||||||
| Third Quarter 2025 Supplemental Information | Page 42 | ||||
| GLOSSARY OF TERMS (CONTINUED) | | ||||
| Third Quarter 2025 Supplemental Information | Page 43 | ||||